1. Introduction
The decarbonisation of energy-intensive industries, such as extractive industries, plays an integral role towards reaching the European milestone of climate neutrality by 2050. In 2019, the extraction and primary processing of metals and minerals accounted for 26% of all global Greenhouse Gas (GHG) emissions, as well as 20% of all health impacts [
1,
2]. In 2021, the metals and mining sector was responsible for 4.5 Gt of CO
2 equivalent per year [
3]. These emissions are guaranteed to significantly increase as the demand and needs of the industry see a constant rise. The extraction of raw materials reached 92 billion tonnes in 2017, in comparison to 27 billion in 1970 [
4]. By 2060, annual global demand is expected to climb as high as 190 billion tonnes. Specifically, for steel and aluminium (Al), global demand is expected to increase by 30% and 75%, respectively, in comparison to 2017 [
5]. In 2020, Al production reached 65.3 million tonnes, while global demand, with recycling, reached 98 million tonnes. This rise inevitably exacerbates the environmental impact of such industries.
The Al industry is one of the most energy-intensive and CO
2-emissive industries. In 2021, the industry was solely responsible for 275 Mt of CO
2, 3% of the global direct CO
2 emissions [
6]. Considering indirect emissions from electricity consumption, this figure climbs as high as 1.1 Gt. To reach the milestone of zero emissions by 2050, an annual reduction of 3% is needed. The high CO
2 emissions are almost exclusively produced by the combustion of fossil fuels supplying the energy required for the various industrial processes. To this end, the industry should seek the extensive decarbonisation of Al production, coupling recycling processes such as secondary Al smelting with green energy production. Aluminium production is energy intensive, especially during the smelting process, which relies on electricity and fuel burning. Compared to primary production, which involves making aluminium products from raw material or ingots, secondary production is a significantly less energy-intensive process that involves recycling aluminium scrap to form new products. In the U.S., it is estimated that secondary aluminium consumes about 8% of the onsite energy required to produce primary aluminium [
7].
The final quality of the Al affects the selection of the melting process. Rotary and reverberatory furnaces are the main melting technologies in Europe as they allow high productive rates, while crucible and electric furnaces are most suitable for lower productive volumes. Various fossil fuels currently used include natural gas (NG), liquified petroleum gas (LPG) and light fuel oil (LFO) [
8]. The type of fuel used depends on the type of furnace comprising the smelter. Rotary furnaces, such as rotary drum, titling rotary and reverberatory furnaces, are very commonly used in smelters. These furnaces can operate with NG and LPG, the main difference between them being the fuel oil, with rotary drum furnaces using medium/heavy oil, while titling rotary and reverberatory furnaces use LFO. The use of such fossil fuels accounts for significant emissions. The combustion of NG, LPG and heavy fuel oil accounts for 0.18, 0.22 and 0.27 kg CO
2/kWh, respectively [
9].
To tackle this issue, various applications opt for the use of electric induction (EI) furnaces, exclusively relying on electricity for the smelting process. Induction heating is a non-contact heating process, which uses 50 to 400 kHz or higher operating frequency to heat conductive material. In the induction furnace, a coil carrying alternating electric current surrounds the container or chamber of metal. Eddy currents are induced in the metal (charge) and the circulation of these currents produces extremely high temperatures for melting the metals and for making alloys of exact composition. The majority of EI furnace emissions are connected to the production of the necessary electricity. Compared to a gas furnace, an induction furnace is regarded as a clean melting operation with low emissions. When electricity is produced by renewable energy sources (RES), the GHG can range from 0.011 to 0.048 kg CO
2 eq./kWh [
10]. Such applications account for significantly lower GHG emissions as they replace fossil fuel usage with RES electricity.
Alternative fuels with low or zero CO
2 emissions are also a viable and promising solution for combined heat and power (CHP) generation in secondary Al smelting. Of the various alternative fuels, hydrogen (H
2) has seen a considerable rise in popularity in recent years. H
2 combustion accounts for zero CO
2 emissions, due to the lack of carbon in the burning process [
11]. When combusted with pure oxygen (O
2), it also accounts for zero NO
x formation and near-zero emissions overall. H
2 can be exploited in internal combustion engines (ICE) as well as fuel cells (FC) to produce medium/high-grade heat and electricity.
Due to its wide flammability range, H
2 can be used in ICEs over a wide range of fuel-air ratios, which allows for leaner fuel-air mixtures. It can be used on its own in mono-fuel ICEs, or mixed with other fuels in dual-fuel ICEs, accounting for reductions in emissions of 98% and 65%, respectively, in comparison to NG [
12]. In H
2 mono-fuel (HMF) engines, lean combustion allows for zero or near-zero emissions, depending on the mixture ratio and load. When operating at ultra-lean conditions, with an air-to-fuel (A/F) ratio bigger than 68:1, NO
x emissions of less than 100 ppm can be achieved without after-treatment. The lean operation also accounts for reduced heat losses [
13]. When used in diesel dual fuel (DDF) engines, a higher H
2 fraction allows for a significant decrease in CO
2, CO, SO
2 and particulate matter (PM) emissions [
14]. Despite this, higher H
2 fractions result in increased unburnt hydrocarbons and NO
x formation. The NO
x increase is specifically the result of the high flame temperatures, facilitating its formation. To minimize NO
x formation, applications commonly opt for flame temperatures below the NO
x formation critical, 1350 °C. This approach allows for the use of existing facilities without the need for a modification of power production under electrical energy surplus occurrences [
15]. Increasing the H
2 content at a fixed operative point allows for decreased combustion duration, leading to lower unburned hydrocarbons and CO emissions, but increased NO
x emissions [
16].
In FCs, H
2 is a very efficient option due to its high electrochemical activity, while also accounting for nearly a 100% reduction of emissions. The unique features of solid oxide fuel cells (SOFCs) have facilitated their development for a wide variety of applications that range from micro-CHP (500 W to 20 kW) to larger-scale stationary power at both distributed generation (~100 kW–5 MW) and central utility scales (>100 MW). The high temperature of SOFCs enables the production of several grades of waste heat to be then recovered for process heating, power augmentation or for polygeneration of exportable products (e.g., heat, cooling, power or fuels) [
17]. The high operational temperature of SOFCs also allows for the internal reform of hydrocarbon fuel to H
2 [
18]. On an industrial scale, SOFCs using mixtures of H
2 and CO reacting with O
2 from air have reached electrical efficiencies as high as 60%, combined heat efficiencies of 65% or 73% for recovered steam or hot water, respectively, and CO
2 emissions reductions of 47% [
19,
20].
The scope of this study is to contextualize the environmental impacts and evaluate the environmental feasibility of large-scale H2 penetration in secondary Al industries. The energy-intensive nature of aluminium production results in the industry having to contend with factors and limitations affecting the cost of raw materials, energy and environmental control. With the above information in mind, the present work aims to comprehensively compare the lifecycle energy consumption and GHG emission performance of a secondary Al smelter employing alternative thermal and electricity sources. A cradle-to-gate model was developed with two distinct control parameters: the thermal and electricity demands of a secondary Al smelter in the EU. A partial lifecycle impact assessment (LCIA) was completed using the models, and the following midpoint environmental impact categories were reported: acidification potential, eutrophication potential, global warming potential and photochemical ozone formation. The results of this study contribute to the need to provide robust data for increasing employment of Life Cycle Assessment (LCA) as a well-established tool for sustainable development, making material and design choices for the industrial sector.
This study presents the assessment of the environmental impact of a secondary Al smelting process and the potential of exploiting green H2 CHP technologies for the extensive decarbonisation of production. To this end, an LCA is performed, comparing different energy sources to produce the necessary thermal energy in a cradle-to-gate analysis, investigating the process from electricity and fuel production up to the final end-product of secondary Al ingot.
2. Materials and Methods
2.1. LCA Methodology
To access and compare the environmental impact of secondary Al smelters using different energy sources, an LCA was performed, following the standardized procedures described by ISO 14040:2006 and 14044:2006/A1:2018 [
21,
22], and the International Life Cycle Data (ILCD) Handbook [
23]. The LCA framework consists of: (1) the goal and scope definition; (2) the Life Cycle Inventory (LCI) preparation; (3) the Life Cycle Impact Assessment (LCIA); and (4) the interpretation of the results. The LCA for the different smelters was performed with the commercial software package GaBi 8.5, Sphera
TM of Blackstone company, Chicago, United States [
24].
2.2. Goal, Scope and Functional Unit
A cradle-to-gate LCA was conducted to assess and compare the environmental impact of secondary Al smelting using different thermal energy sources, i.e., NG, LFO, LPG, H2 and electricity. H2 produced using electricity from the grid (brown H2) and electricity from RES (green H2) were examined for water electrolysis to assess the impact of the two H2 production methods. Thermal energy provided by electricity from the grid, electricity from solar thermal energy and a mix of the two were also investigated, to evaluate the impact of the two electricity production methods. The scope of the LCA was the examination of the energy and material flows for the different approaches to validate the environmental benefits of using alternative fuels in the process. The functional unit (FU) chosen was 1 tonne of secondary Al produced.
2.3. Scenarios Description and System Boundaries
The analysis focused on the comparison of the different energy sources only in terms of thermal energy supply, as to ensure the accurate comparison between the alternative energy sources and fossil fuels, which were directly used to provide the required heat. For fossil fuels, three different scenarios were built for NG, LPG and LFO furnaces. For H
2 CHP technologies, two different scenarios were constructed, examining the use of grid and RES electricity in the H
2 production process. For EI furnaces, three different scenarios were built for different RES mixes. The system boundaries included all processes in the techno-sphere of the FU. The different scenarios are summarized in
Table 1.
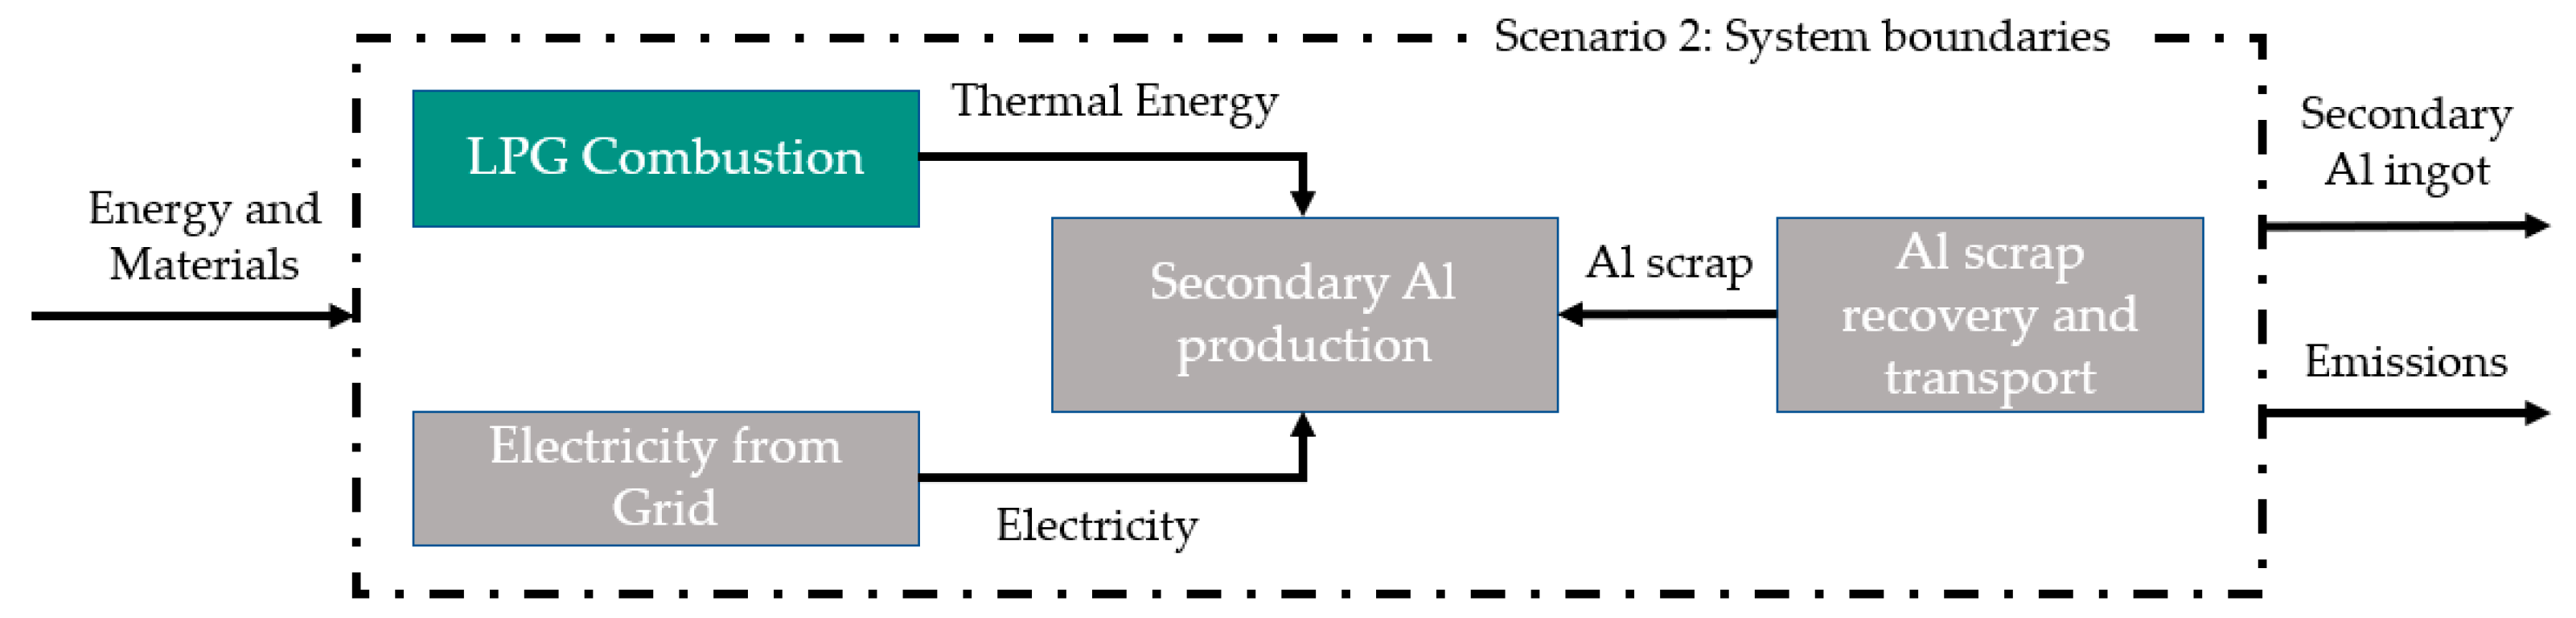
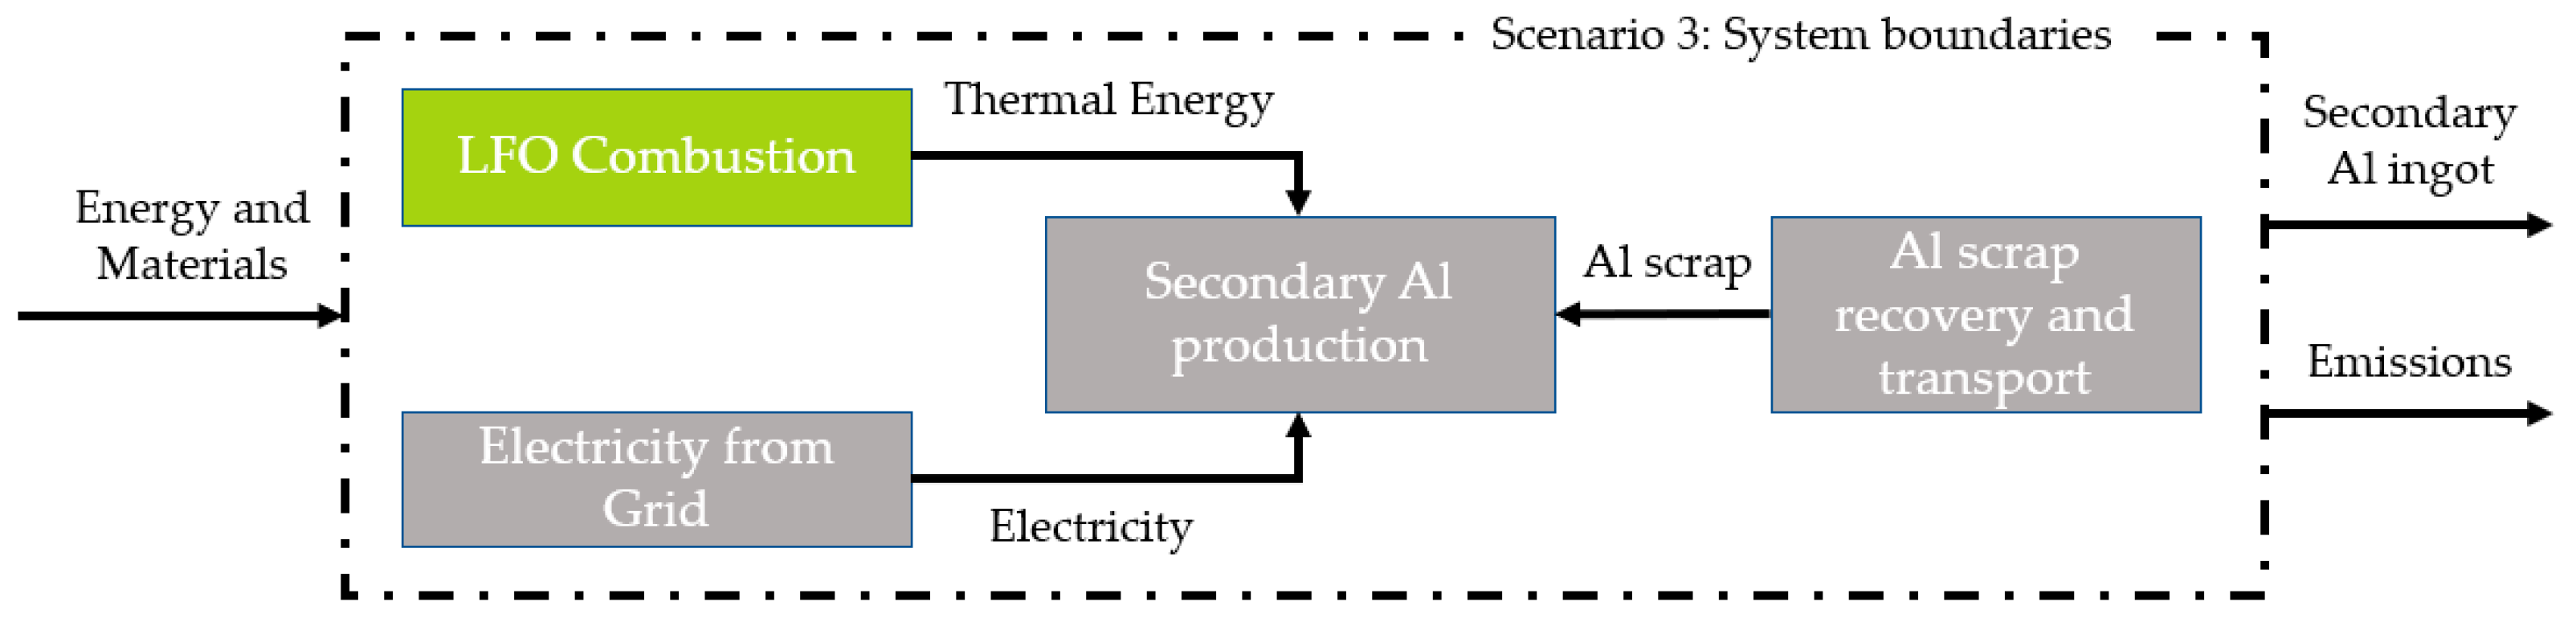
2.3.1. Scenarios 1–3
In scenarios 1–3, the thermal energy was supplied to the secondary Al smelter by the combustion of NG, LPG and LFO, respectively. The required electricity for these scenarios was provided by the grid. An Al recovery and transportation process supplied the smelter with Al scrap. Overall, the scenarios were constructed to simulate a conventional secondary Al production process using a fossil fuel burning furnace. The system boundaries for scenarios 1 to 3 are shown in
Figure 1,
Figure 2 and
Figure 3.
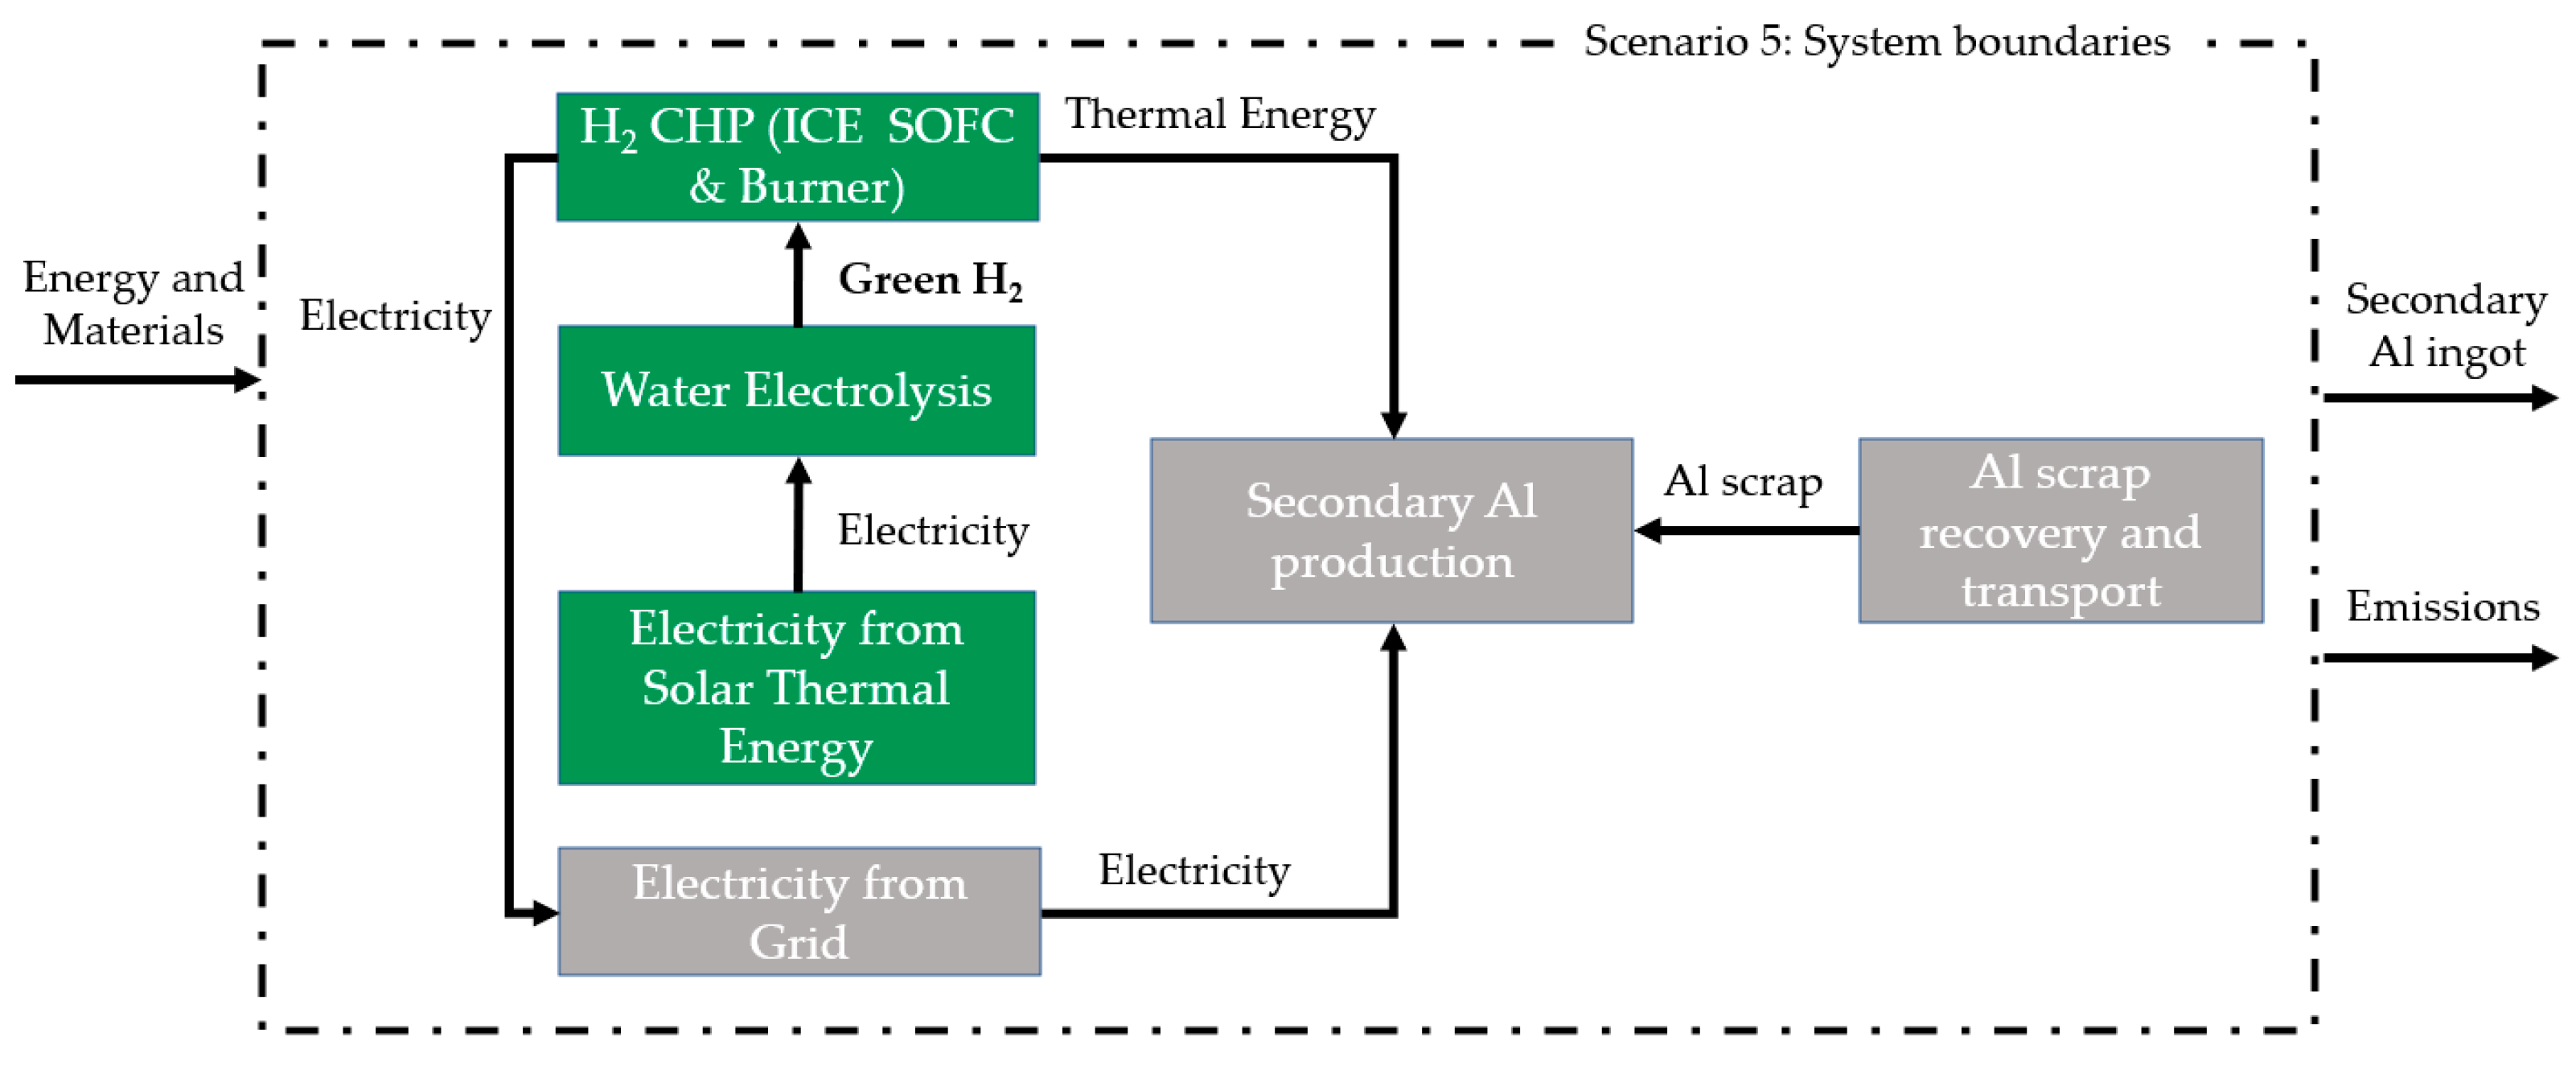
2.3.2. Scenarios 4–5
Scenarios 4–5 utilised H2 to produce both the required thermal energy for the smelter, as well as electricity. A H2 SOFC was used to produce the high-grade heat for the smelter and electricity, which was returned to the grid, thus reducing the net electricity consumption of the system. A H2 burner was also implemented, supplying the rest of the high-grade heat required. A H2 ICE was used to compliment the SOFC, providing it with the necessary electricity for its operation, while also producing the required medium-grade heat for the preheating of the Al scrap. The electricity required by the smelter was supplied by the grid. Lastly, identical to scenarios 1–3, an Al recovery and transportation process was incorporated to supply the Al scrap. The H2 required was produced by water electrolysis, using electricity from the grid (brown H2) in scenario 4 and electricity from solar thermal energy (green H2) in scenario 5.
The systems were designed for the beneficial utilisation of the H
2 technologies. Most of the impact of these technologies derives from the production of H
2, specifically the electricity required for water electrolysis. Therefore, the use of ICE and SOFC is a promising approach as it can provide the smelter with heat while also producing electricity that can be returned to the grid to reduce net electricity consumption. The SOFC acts as the necessary high-grade heat source, as well as reducing electricity consumption. The ICE acts as the necessary medium-grade heat source, which can also cover the SOFC’s electricity demand, further reducing net electricity consumption. The burner’s role is to provide the required high-grade heat that the SOFC cannot cover. The system boundaries for scenarios 4 and 5 are shown in
Figure 4 and
Figure 5.
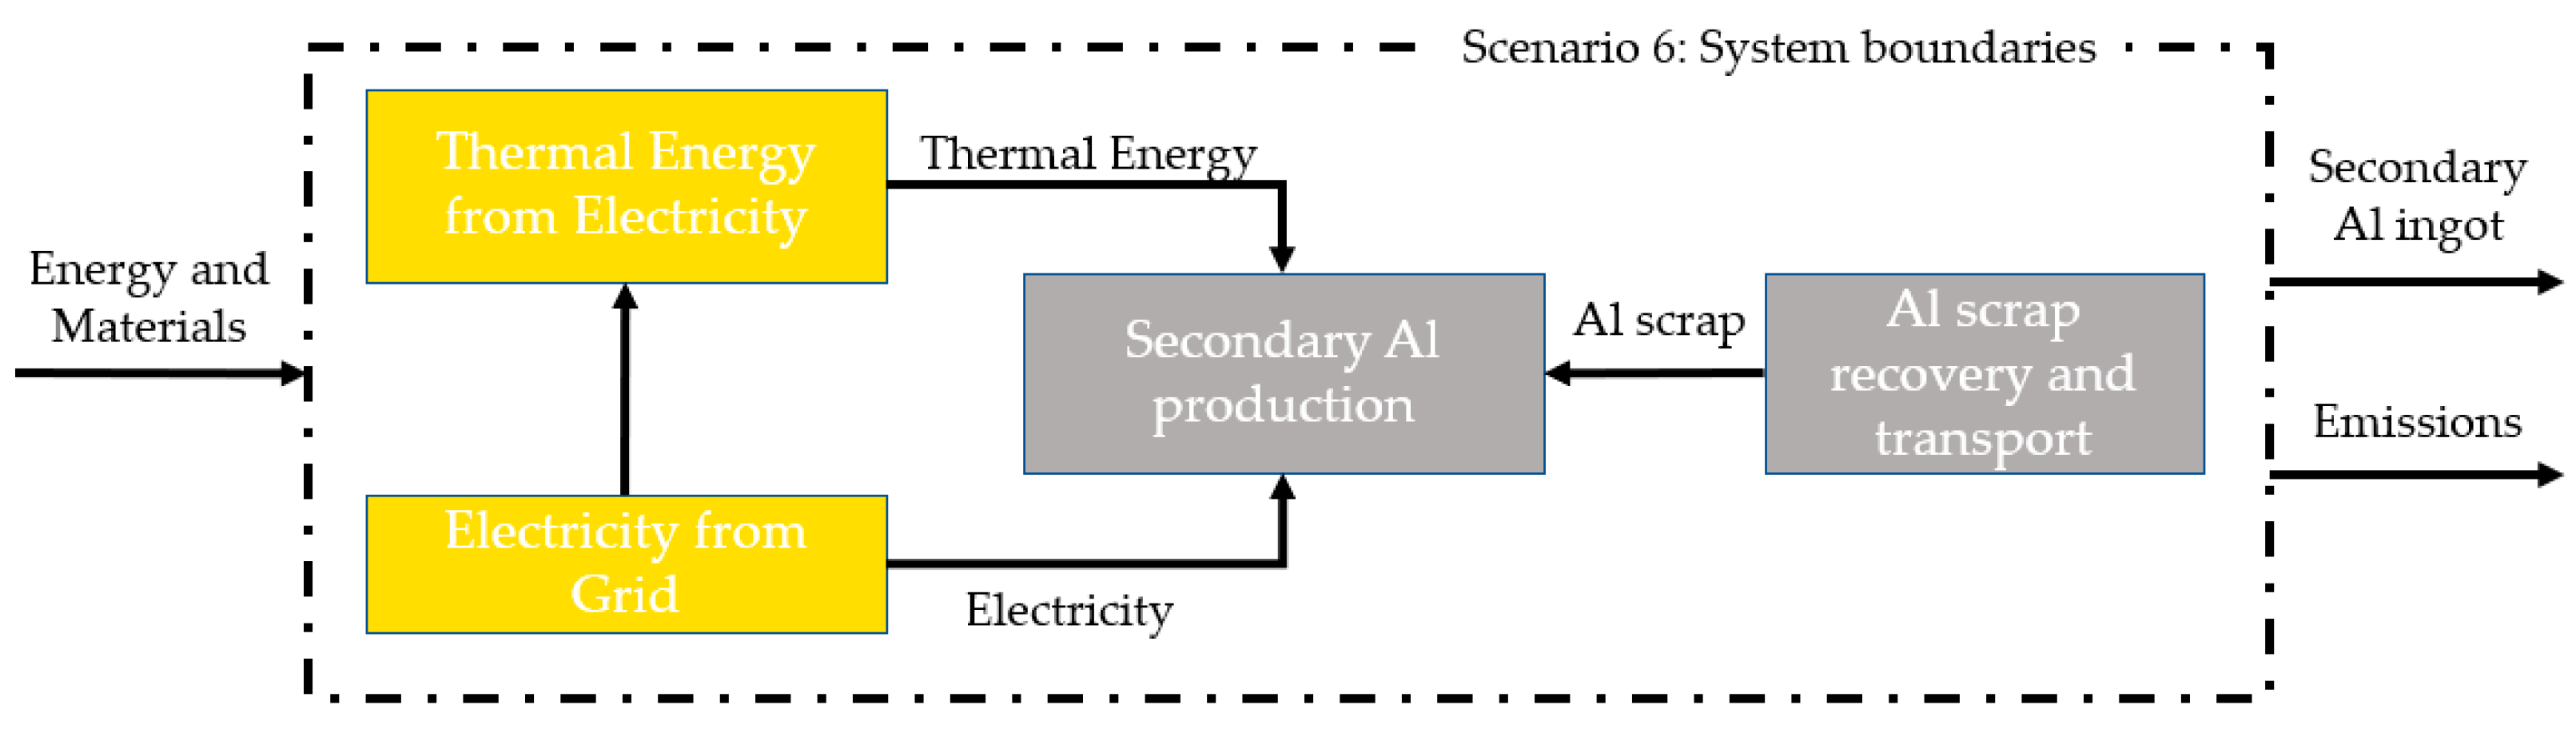
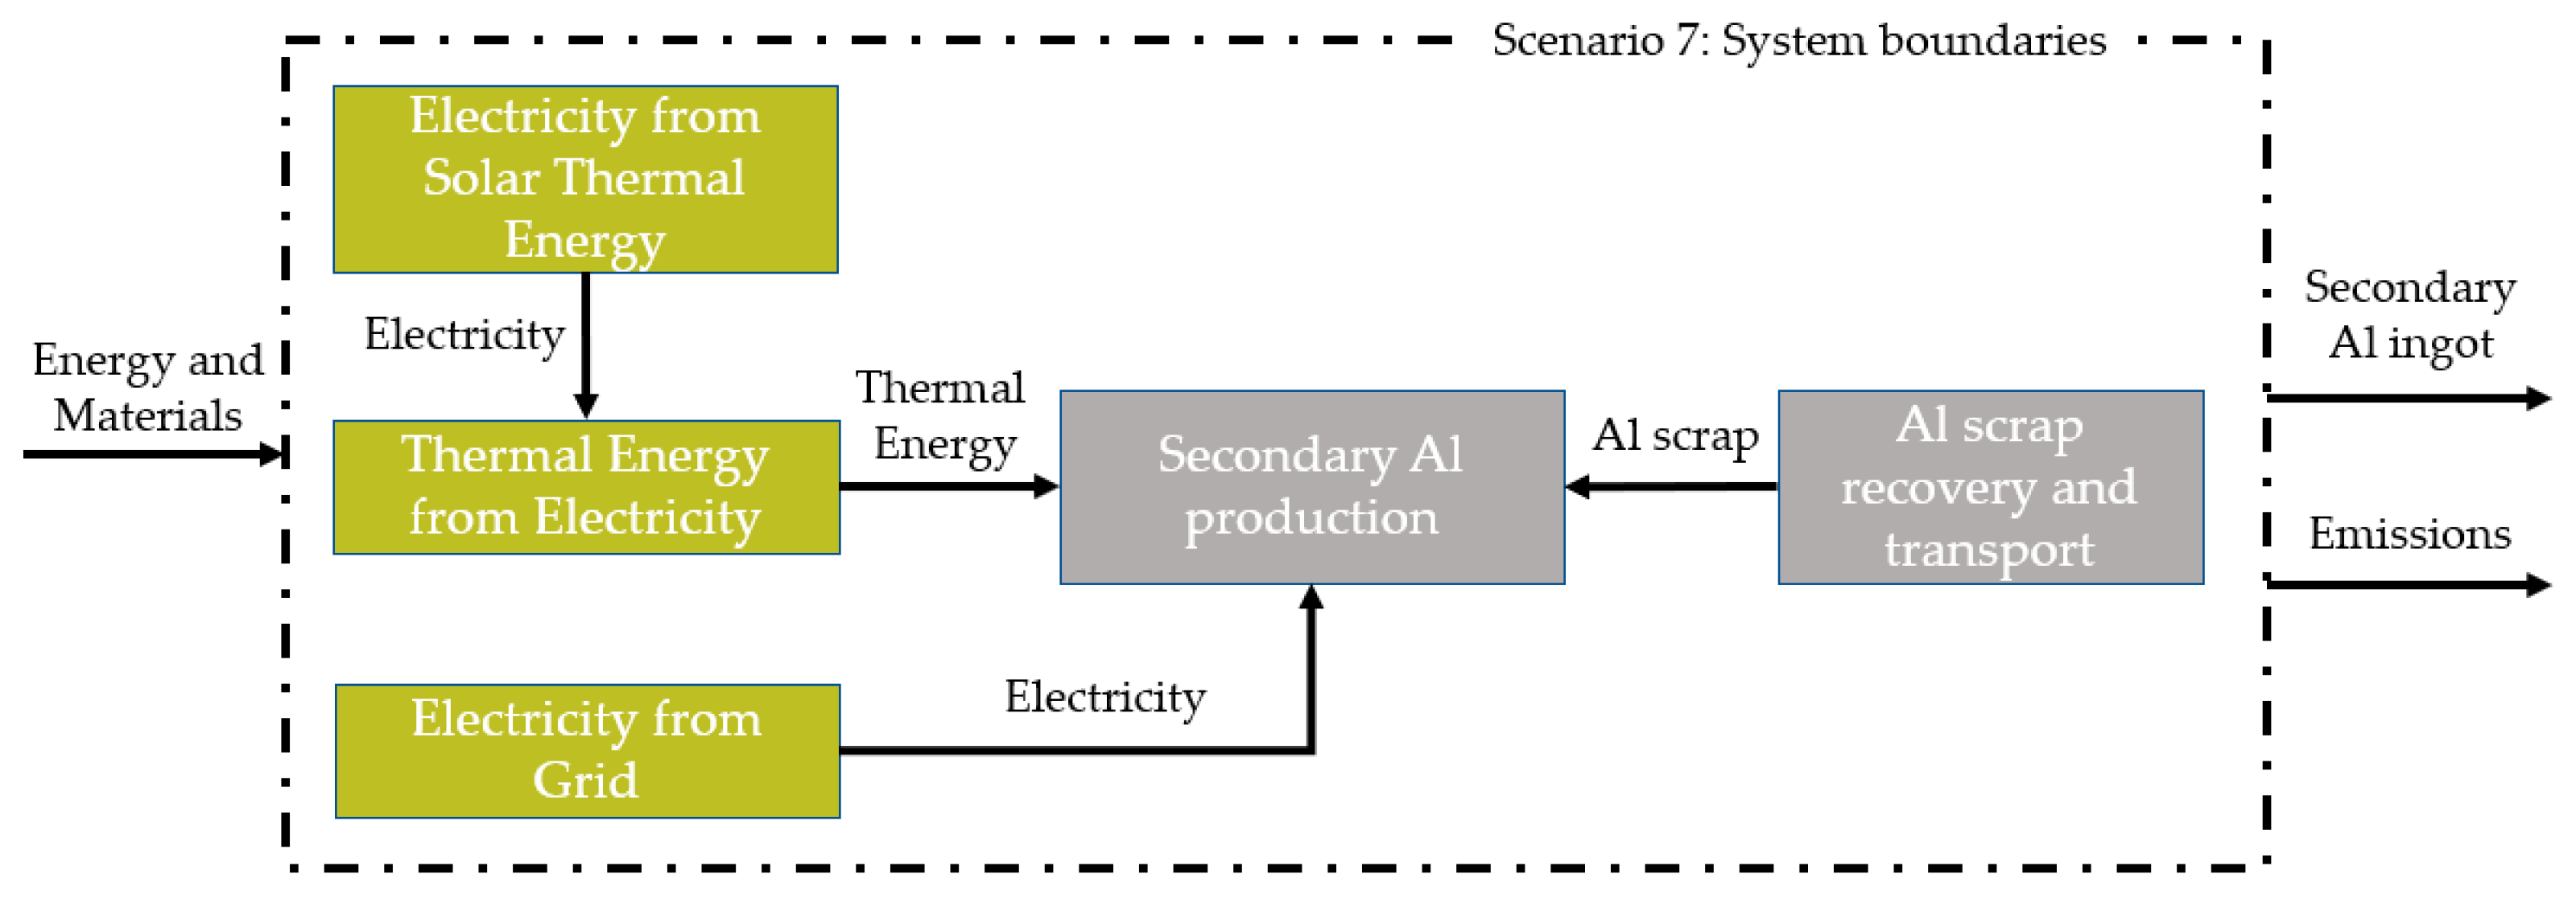
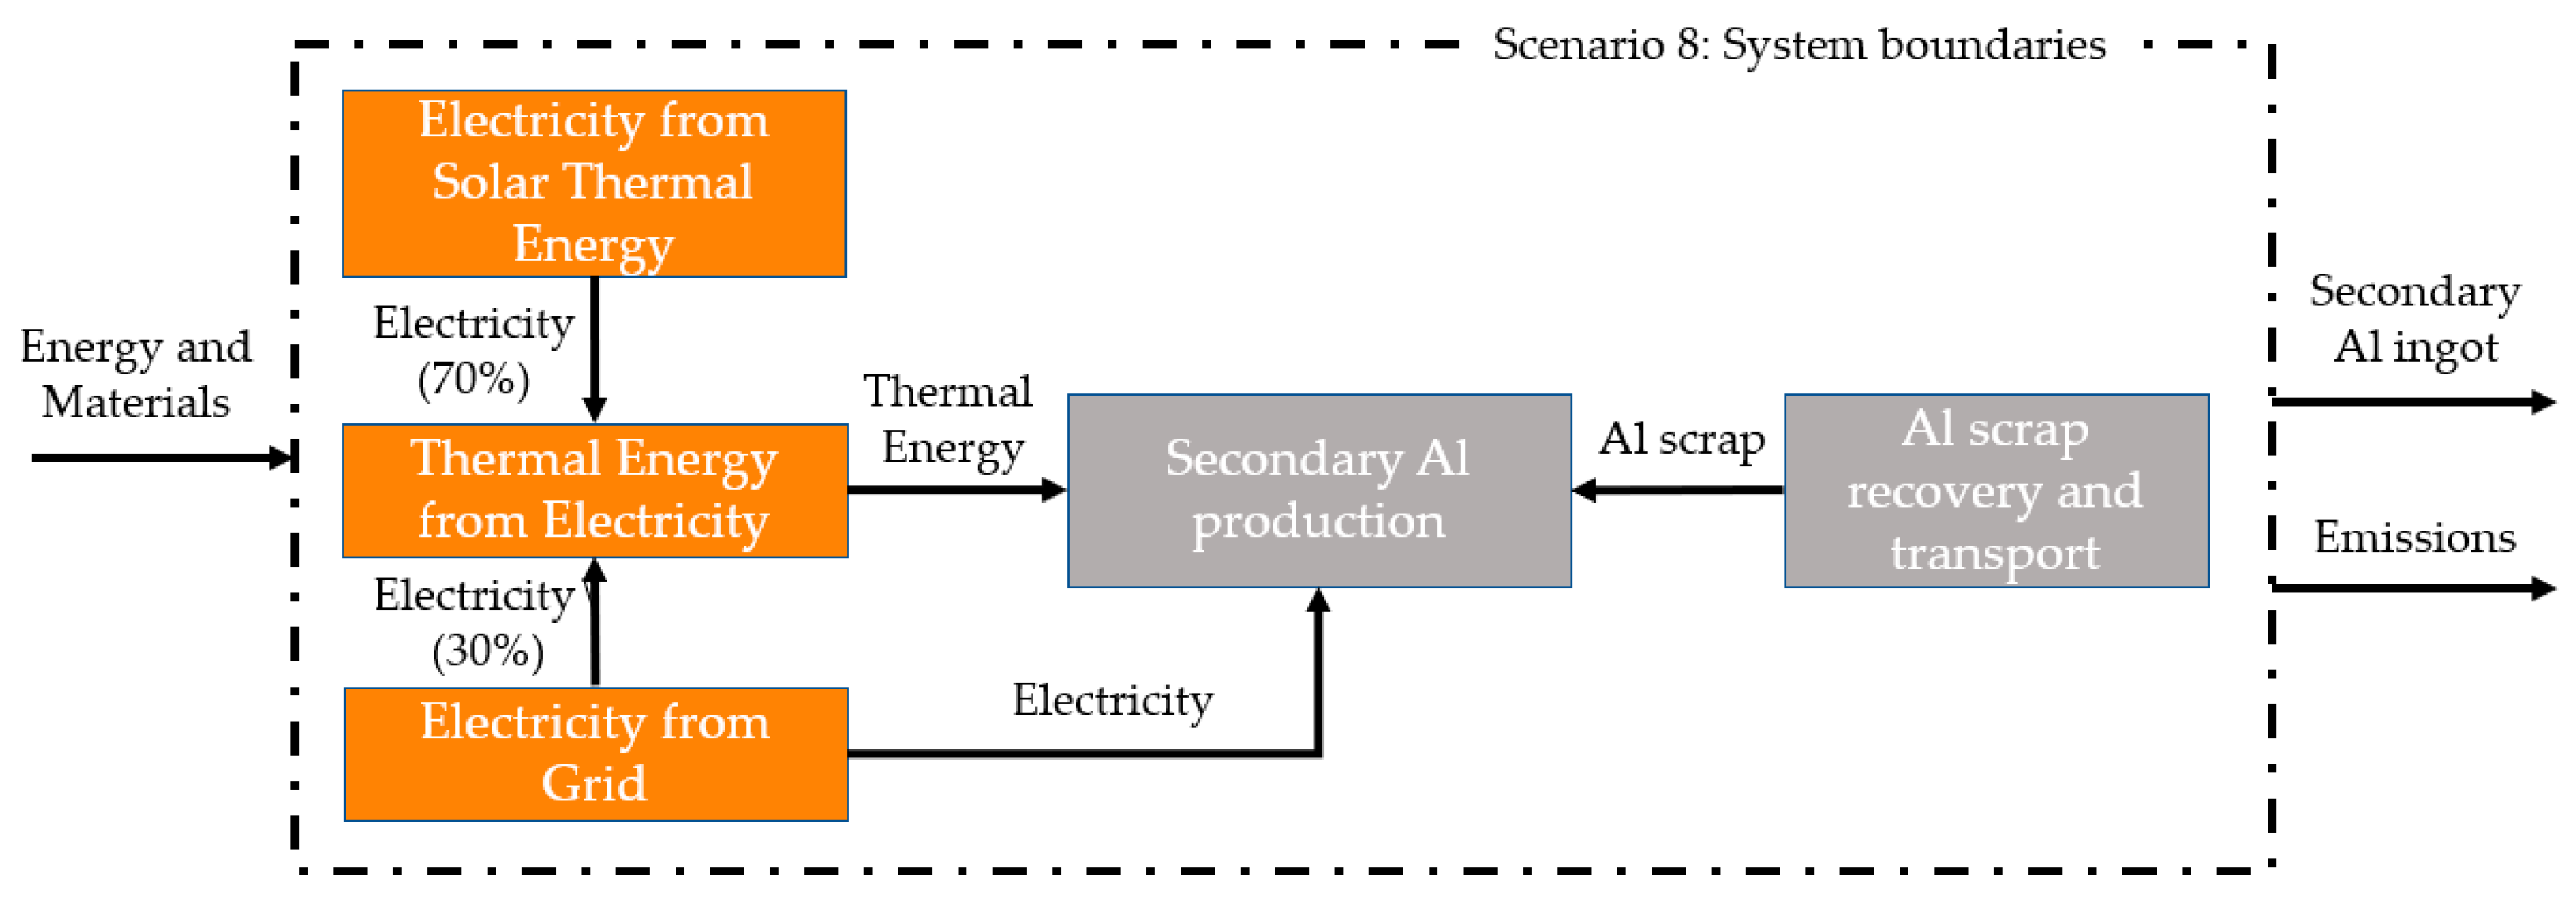
2.3.3. Scenarios 6–8
In scenarios 6–8, electricity is supplied to the EI furnace to be converted into the necessary thermal energy. The electricity required for the operation of the smelter, in addition to thermal energy production, is supplied by the grid. Identically to the previous scenarios, an Al scrap recovery and transportation process supplied the necessary Al scrap to the smelter. The electricity to be converted to thermal energy was supplied by the grid in scenario 6, by solar thermal energy in scenario 7 and by a mix of the two, 30% and 70%, respectively, in scenario 8. Overall, the scenarios were constructed to simulate a conventional secondary Al production process using an EI furnace. The system boundaries of scenarios 6–8, are shown in
Figure 6,
Figure 7 and
Figure 8.
2.4. Lifecycle Impact Analysis
In this LCA study, four impact categories at the midpoint level (problem-oriented approach, such as acidification and climate change) were applied to perform the LCIA. The impact categories were selected according to the recommendations of the FC Hy-Guidance and the scope of the study, as well as to comply with ISO 14040 and 14044 standards containing the broadest set of midpoint categories [
25,
26]. The impact categories are summarized in
Table 2. The evaluation of the midpoint system in this work allows for a more realistic assessment of energy environmental impact.
3. Lifecycle Inventory
LCI refers to all the inputs and outputs data of the system, consisting of materials, energy, emissions, etc. To ensure the credibility of the data, the processes provided by the GaBi database were used. The data concerning processes not available in this database were drawn from the literature. In order to achieve valid LCA results, the literature data were only drawn for unit processes, meaning that energy consumptions, emissions, etc., only refer to individual processes of the ICE, SOFC, burner and secondary Al production. The processes are not connected to specific energy grids or material flows.
For scenarios 1–3, data for the combustion of NG, LPG and LFO were drawn by the GaBi database. The inventory was based on primary and secondary industry data, covering all processes of the supply chain. The detailed power plant model used combined measurements, e.g., NO
x, as well as emission values calculation, e.g., heavy metals. For the production of the thermal energy, the European (EU-28) energy carrier mix was examined for its fuel. For all fossil fuels, thermal energy efficiency was considered 100%. The LCI data for the combustion of the different fuels is summarized in
Table 3.
For these scenarios, 5000 MJ of thermal energy from the combustion NG, LPG and LFO, respectively, were supplied to the smelter for the production of 1 tonne of secondary Al ingot. The grid supplied the 786 MJ electricity demand of the smelter.
In all scenarios, the grid was simulated as the average EU-28 country grid mix, as drawn from the GaBi database, including electricity consumption, transmission/distribution losses of electricity supply and electricity imports from neighbouring countries. The national energy carrier mixes used for electricity production, the power plant efficiency data, shares between direct and combined heat and power generation, as well as transmission/distribution losses and own consumption values were calculated considering various information sources. The LCI data for grid electricity are summarized in
Table 4.
For scenarios 4–5, as the exploitation of H2 is a relatively new approach, data from industrial applications is limited in the GaBi database. Thus, data for H2 combustion and use in SOFC were drawn from the literature. For H2 combustion, a 600-kW burner was used, designed to achieve complete combustion, while also achieving the optimal flame temperature to minimize the NOx formation, combustion rate, flame shape and pattern, as well as optimal radiant heat flux rates for efficient heat transfer. A 45 kVA H2 ICE was used to supply the necessary medium-grade heat to the smelter, as well as the required electricity for the operation of the SOFC. The CHP efficiency of the ICE was 70%.
According to the literature, there are SOFCs able to operate between 750 °C and 850 °C, which is considered a promising range for gasifier-SOFC coupling [
29,
30,
31]. A 64 kWe SOFC was selected to produce the required high-grade heat, as well as electricity. The SOFC allows for >80% fuel utilization and operation between 700–800 °C, achieving high power densities. The SOFC operates with an electrical efficiency of at least 60% and a CHP efficiency higher than 90%.
The H
2 required for the operation of these technologies was produced by a water electrolysis process available in the GaBi database. In scenario 4, the required electricity for the electrolysis was provided by the grid. In scenario 5, this electricity was provided by a power plant using Compact Linear Fresnel Reflector (CLFR) technology for transforming solar thermal energy into electricity, data for which were drawn from the GaBi database. The LCI for the H
2-related technologies is summarized in
Table 5 and
Table 6.
In scenario 4, the 5000 MJ of thermal energy was supplied by the H2 CHP technologies to the smelter. The grid supplied 16,600 MJ to the electrolyser for the production of the 86.2 kg of H2 required by the CHP technologies. The 3930 MJ of electricity produced by these technologies was returned to the grid. Combined with the 786 MJ of electricity supplied to the smelter, net electricity consumption from the grid was 13,400 MJ.
In scenario 5, the 16,600 MJ required by the electrolyser was supplied by electricity from solar thermal energy. The LCI data for electricity from solar thermal energy are summarized in
Table 7. The grid only provided the 786 MJ required for the smelter’s operation. Coupled with the 3930 MJ returned to it, net electricity consumption by the grid was −3140 MJ, meaning that the system produced electricity for it, rather than drawing from it. All other inputs and outputs of the system were identical to scenario 4.
In scenarios 6–8, the electricity used from the EI was supplied by either the grid, solar thermal energy, or a mixture of the two. The two processes were identical to those described in the previous scenarios. A 60% electricity to thermal energy conversion efficiency was considered. The LCI data for electricity to thermal energy conversion are summarized in
Table 8.
In scenario 6, 7980 MJ of electricity from solar thermal energy was supplied to the smelter, to be converted to the required 5000 MJ of thermal energy, with an efficiency of approximately 60%. The 786 MJ of electricity required was supplied by the grid.
In scenario 7, the 7980 MJ required to produce the necessary thermal energy, as well as the 786 MJ required for the smelter’s operation, were supplied by the grid, for a total of 8770 MJ of electricity.
In scenario 8, a mix of solar to thermal electricity and grid electricity was used to supply the necessary thermal energy to the smelter. Of the required 7980 MJ, 5570 MJ were supplied by solar thermal energy, while the remaining 2410 MJ were supplied by the grid. The 786 MJ electricity required by the smelter was supplied by the grid, for a total grid electricity consumption of 3180 MJ.
For scenarios 1–5, using fuel combustion, the smelter was simulated as a reverberatory furnace, operating at temperatures of 700–800 °C, followed by a casting process to produce the Al ingot. For scenarios 6–8, the smelter was simulated as an EI furnace, with data drawn from the literature [
40]. While the energy source was different for the two furnace types, the inputs and outputs of the two were identical when expressed as electricity demand and thermal energy demand. The LCI data for the secondary Al production by the two furnace types are summarized in
Table 9.
In all of the scenarios, a uniform Al scrap recovery and transportation process was implemented. The scrap collected was a mix of automotive and used beverages scrap, transported to the secondary Al production unit by diesel fuelled trucks and trains. The LCI for this process is summarized in
Table 10.
4. Results
The LCIA results for the different scenarios are shown in
Figure 9,
Figure 10,
Figure 11 and
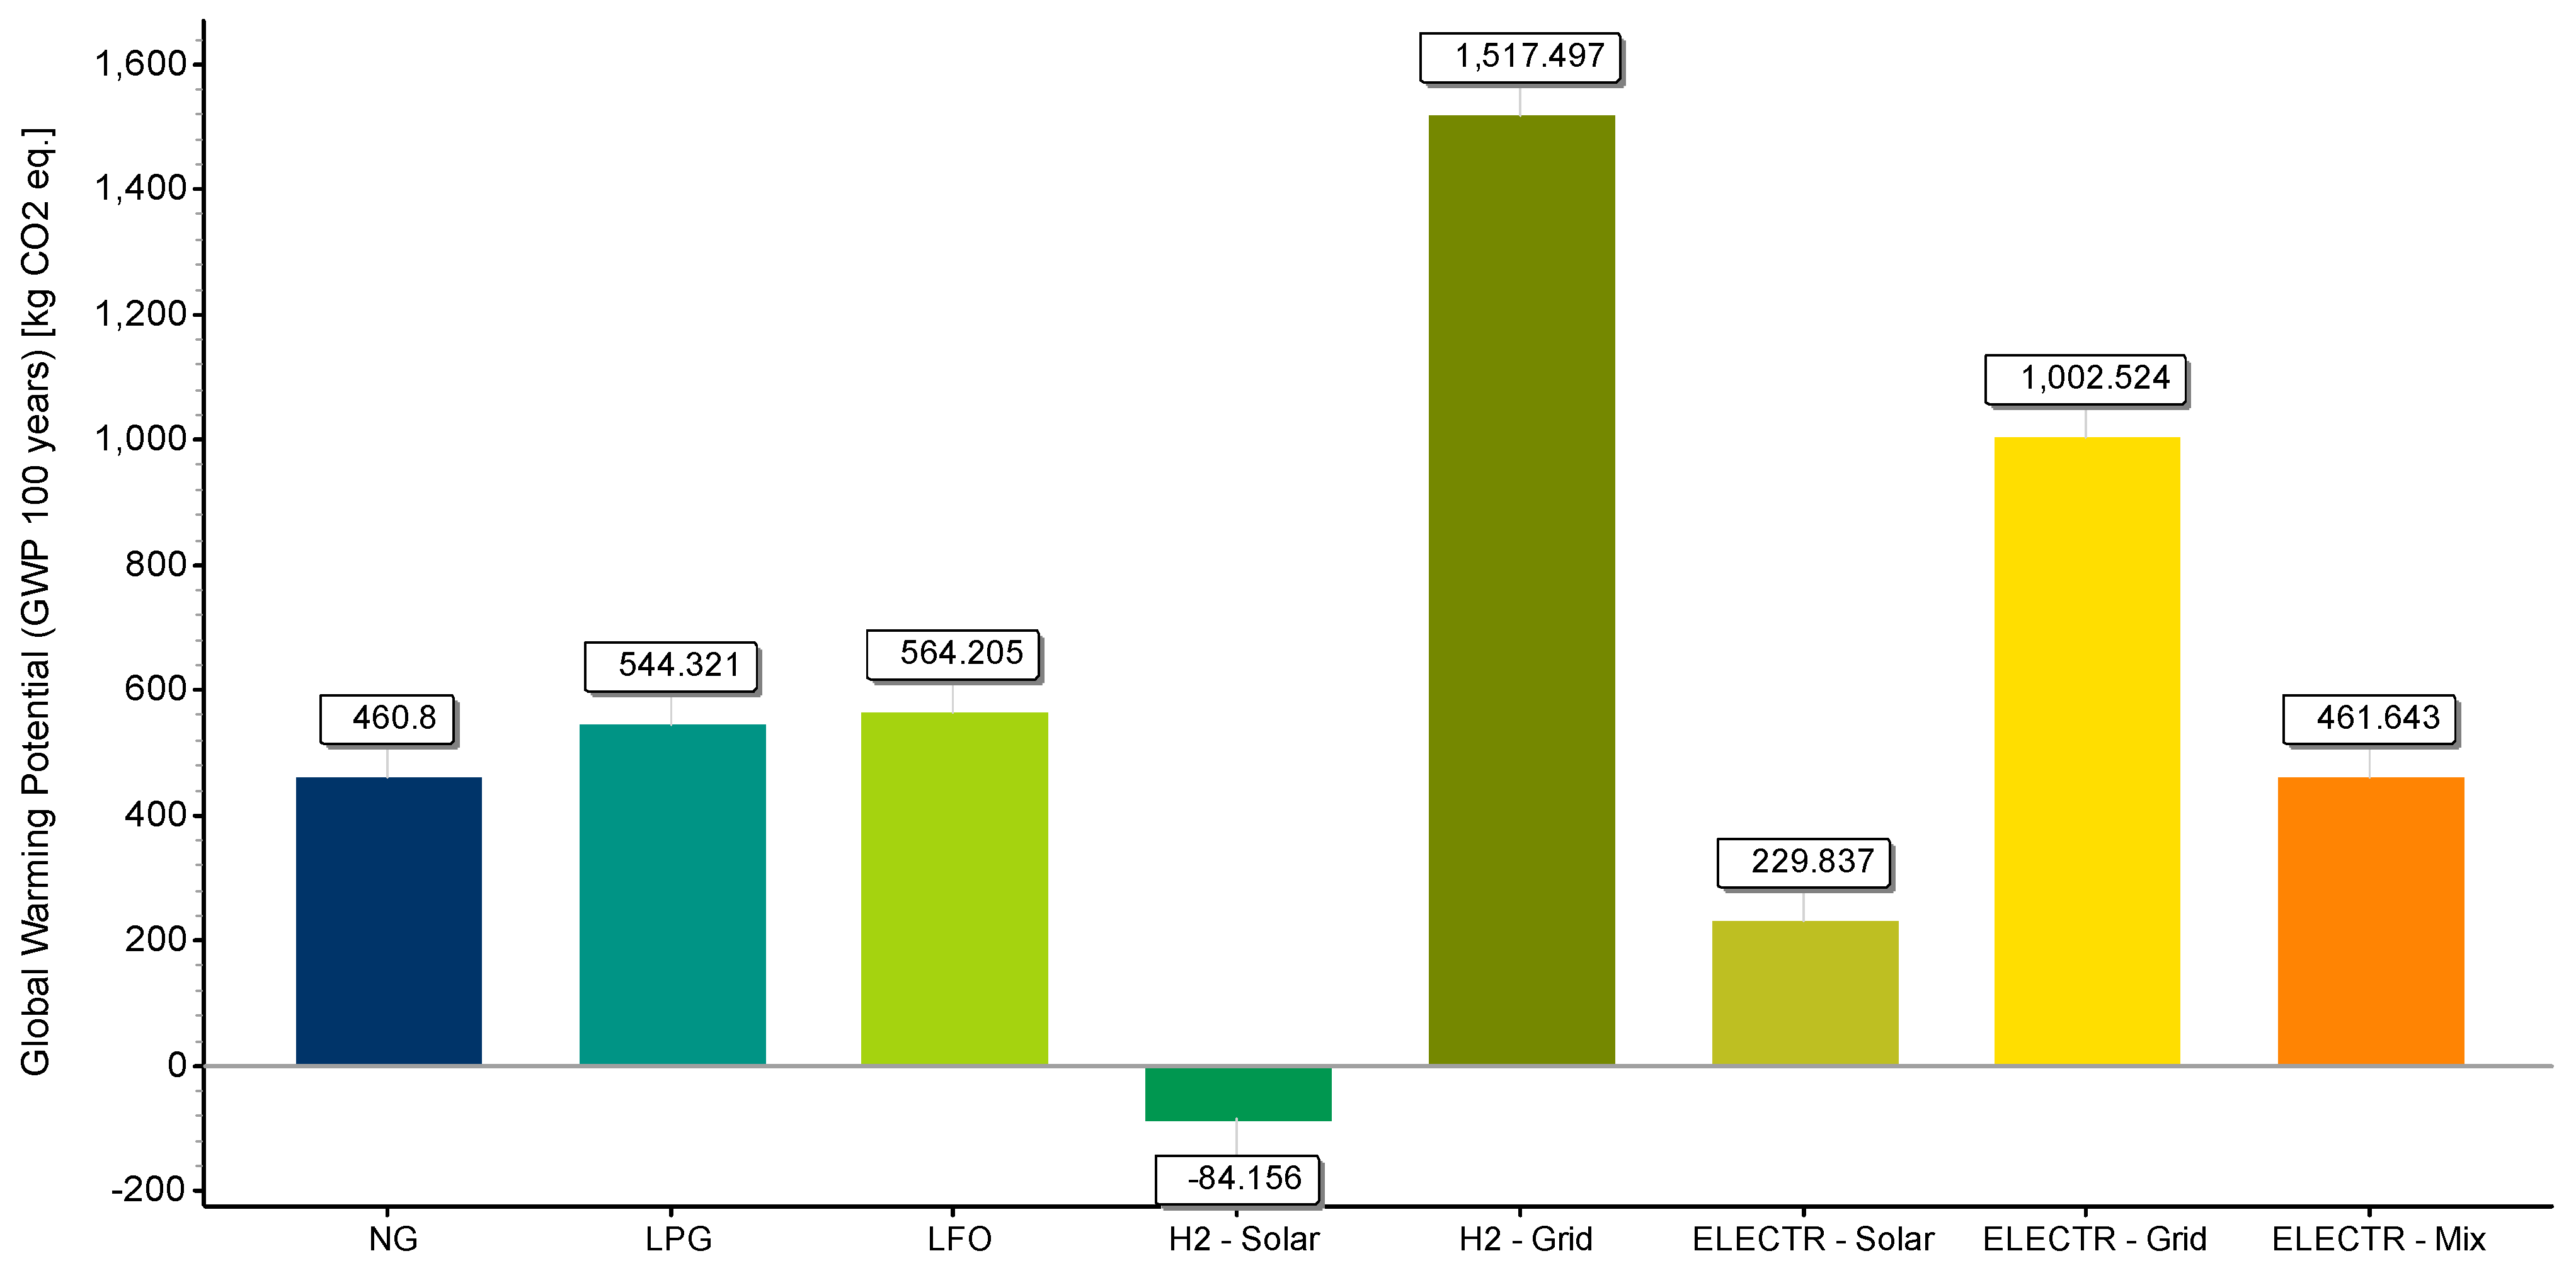
Figure 12. The results showed that NG is the most environmentally beneficial option among the different fossil fuels, and it is proposed to serve as the baseline for energy sources comparison.
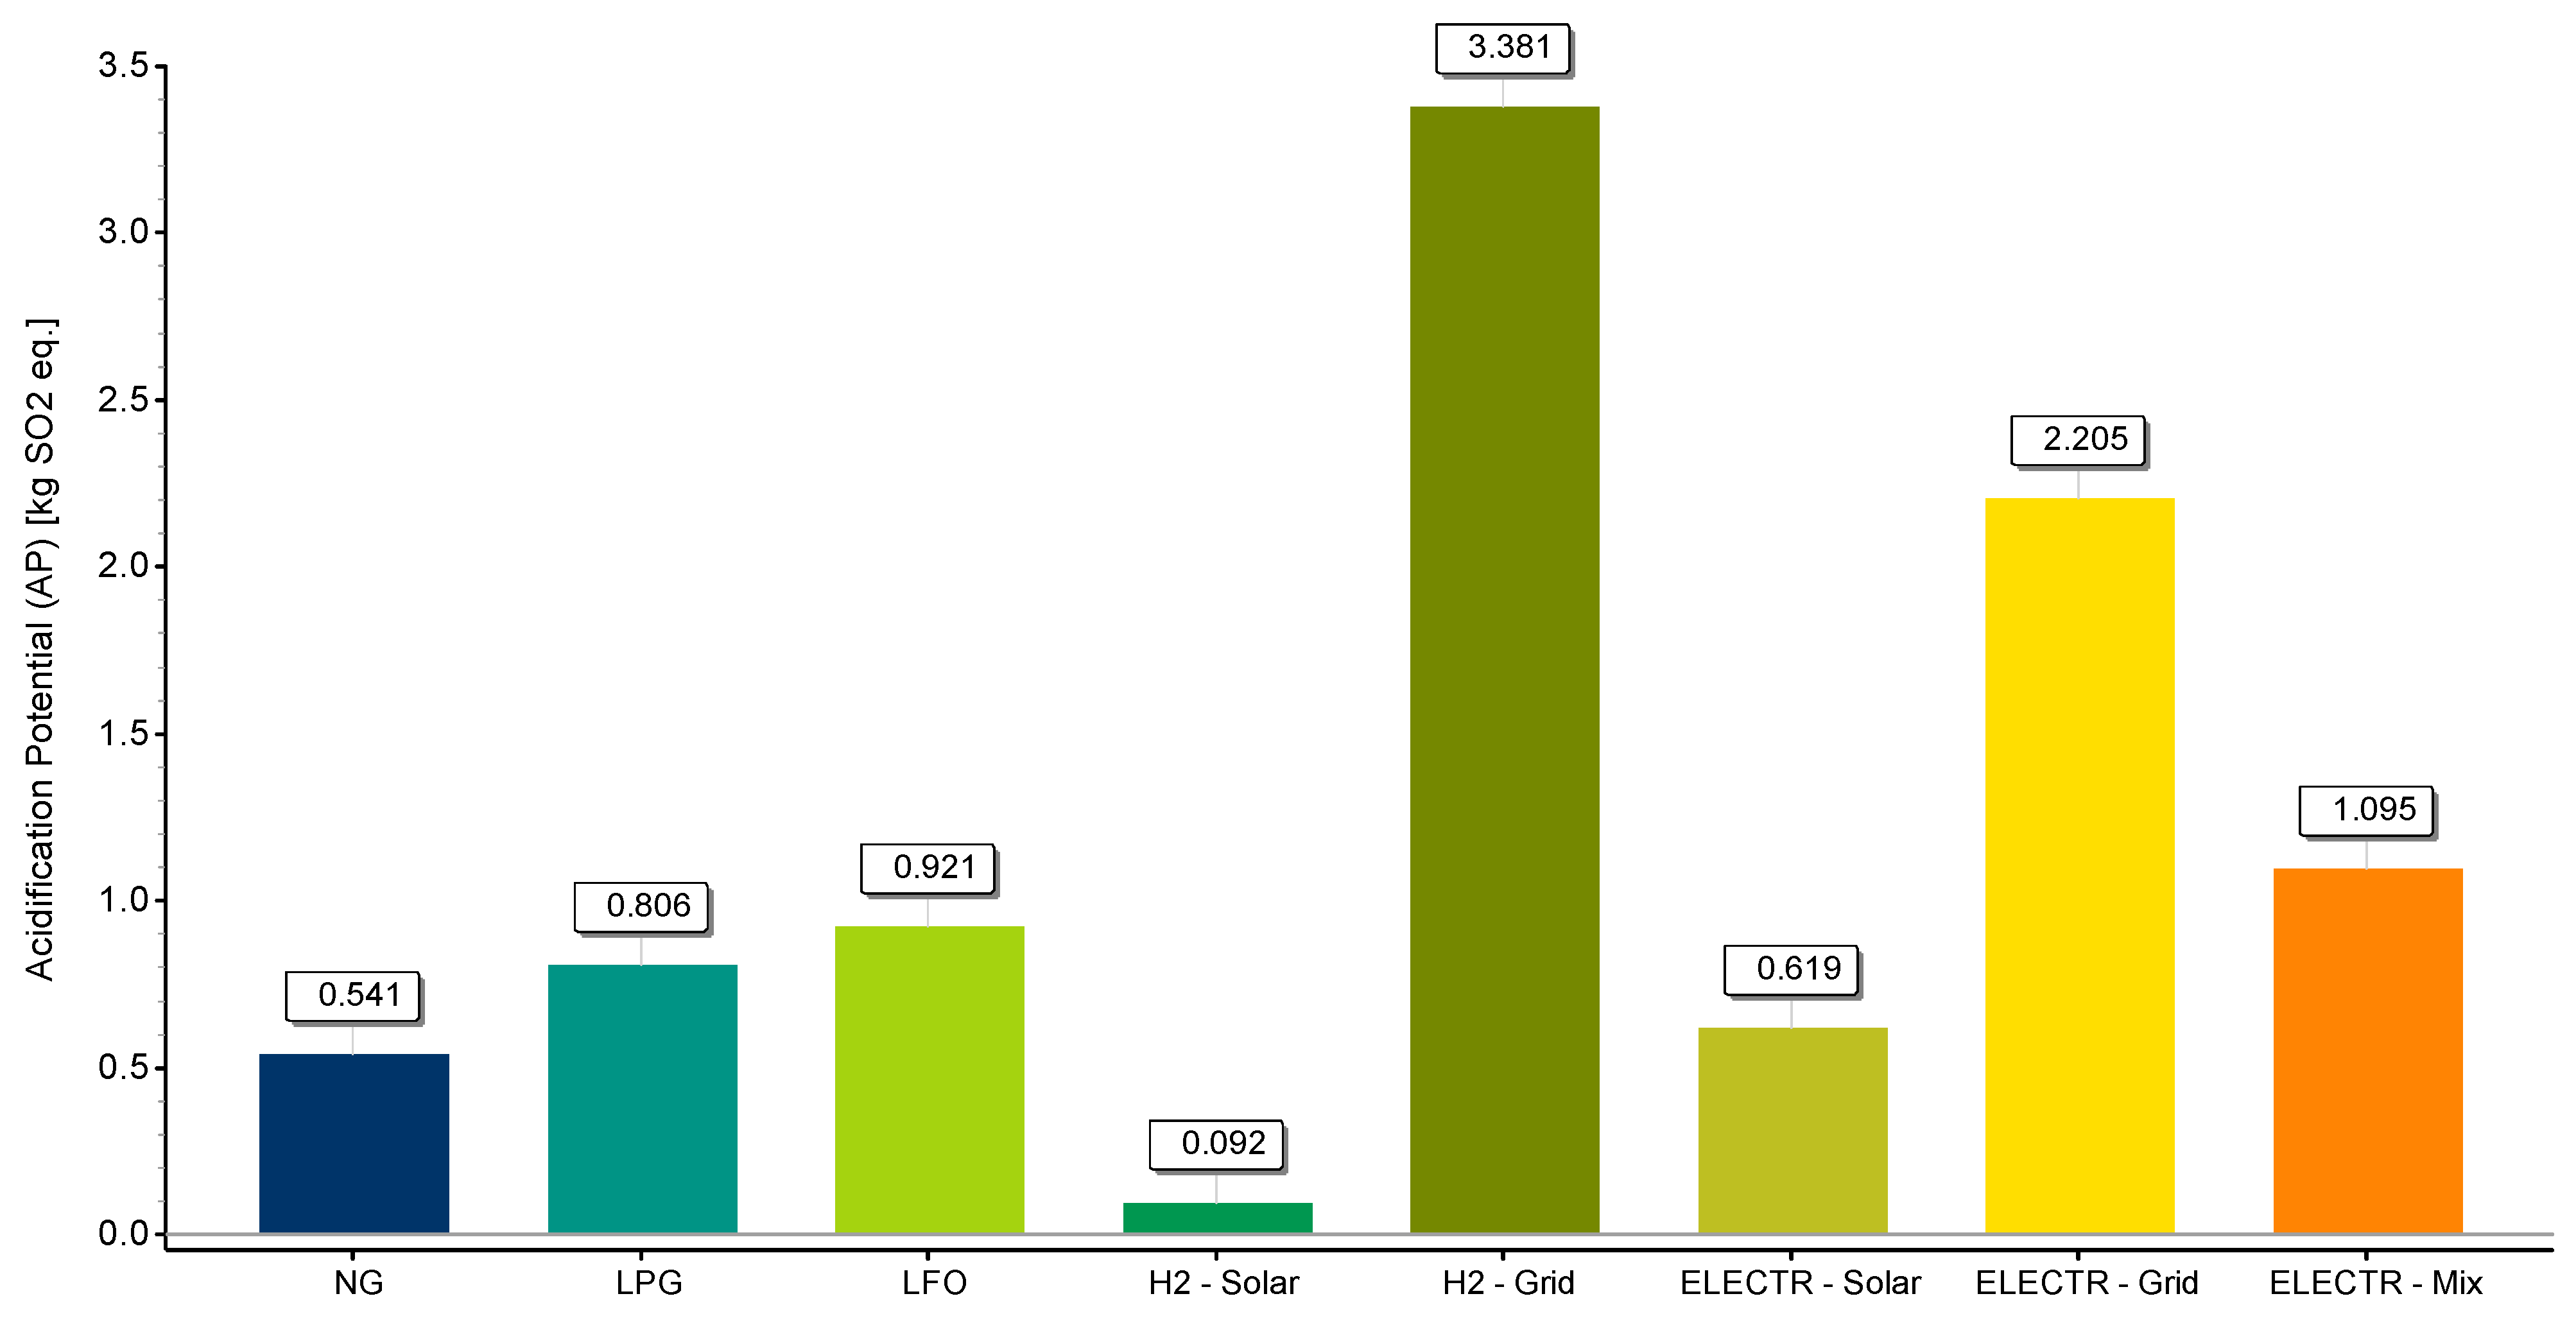
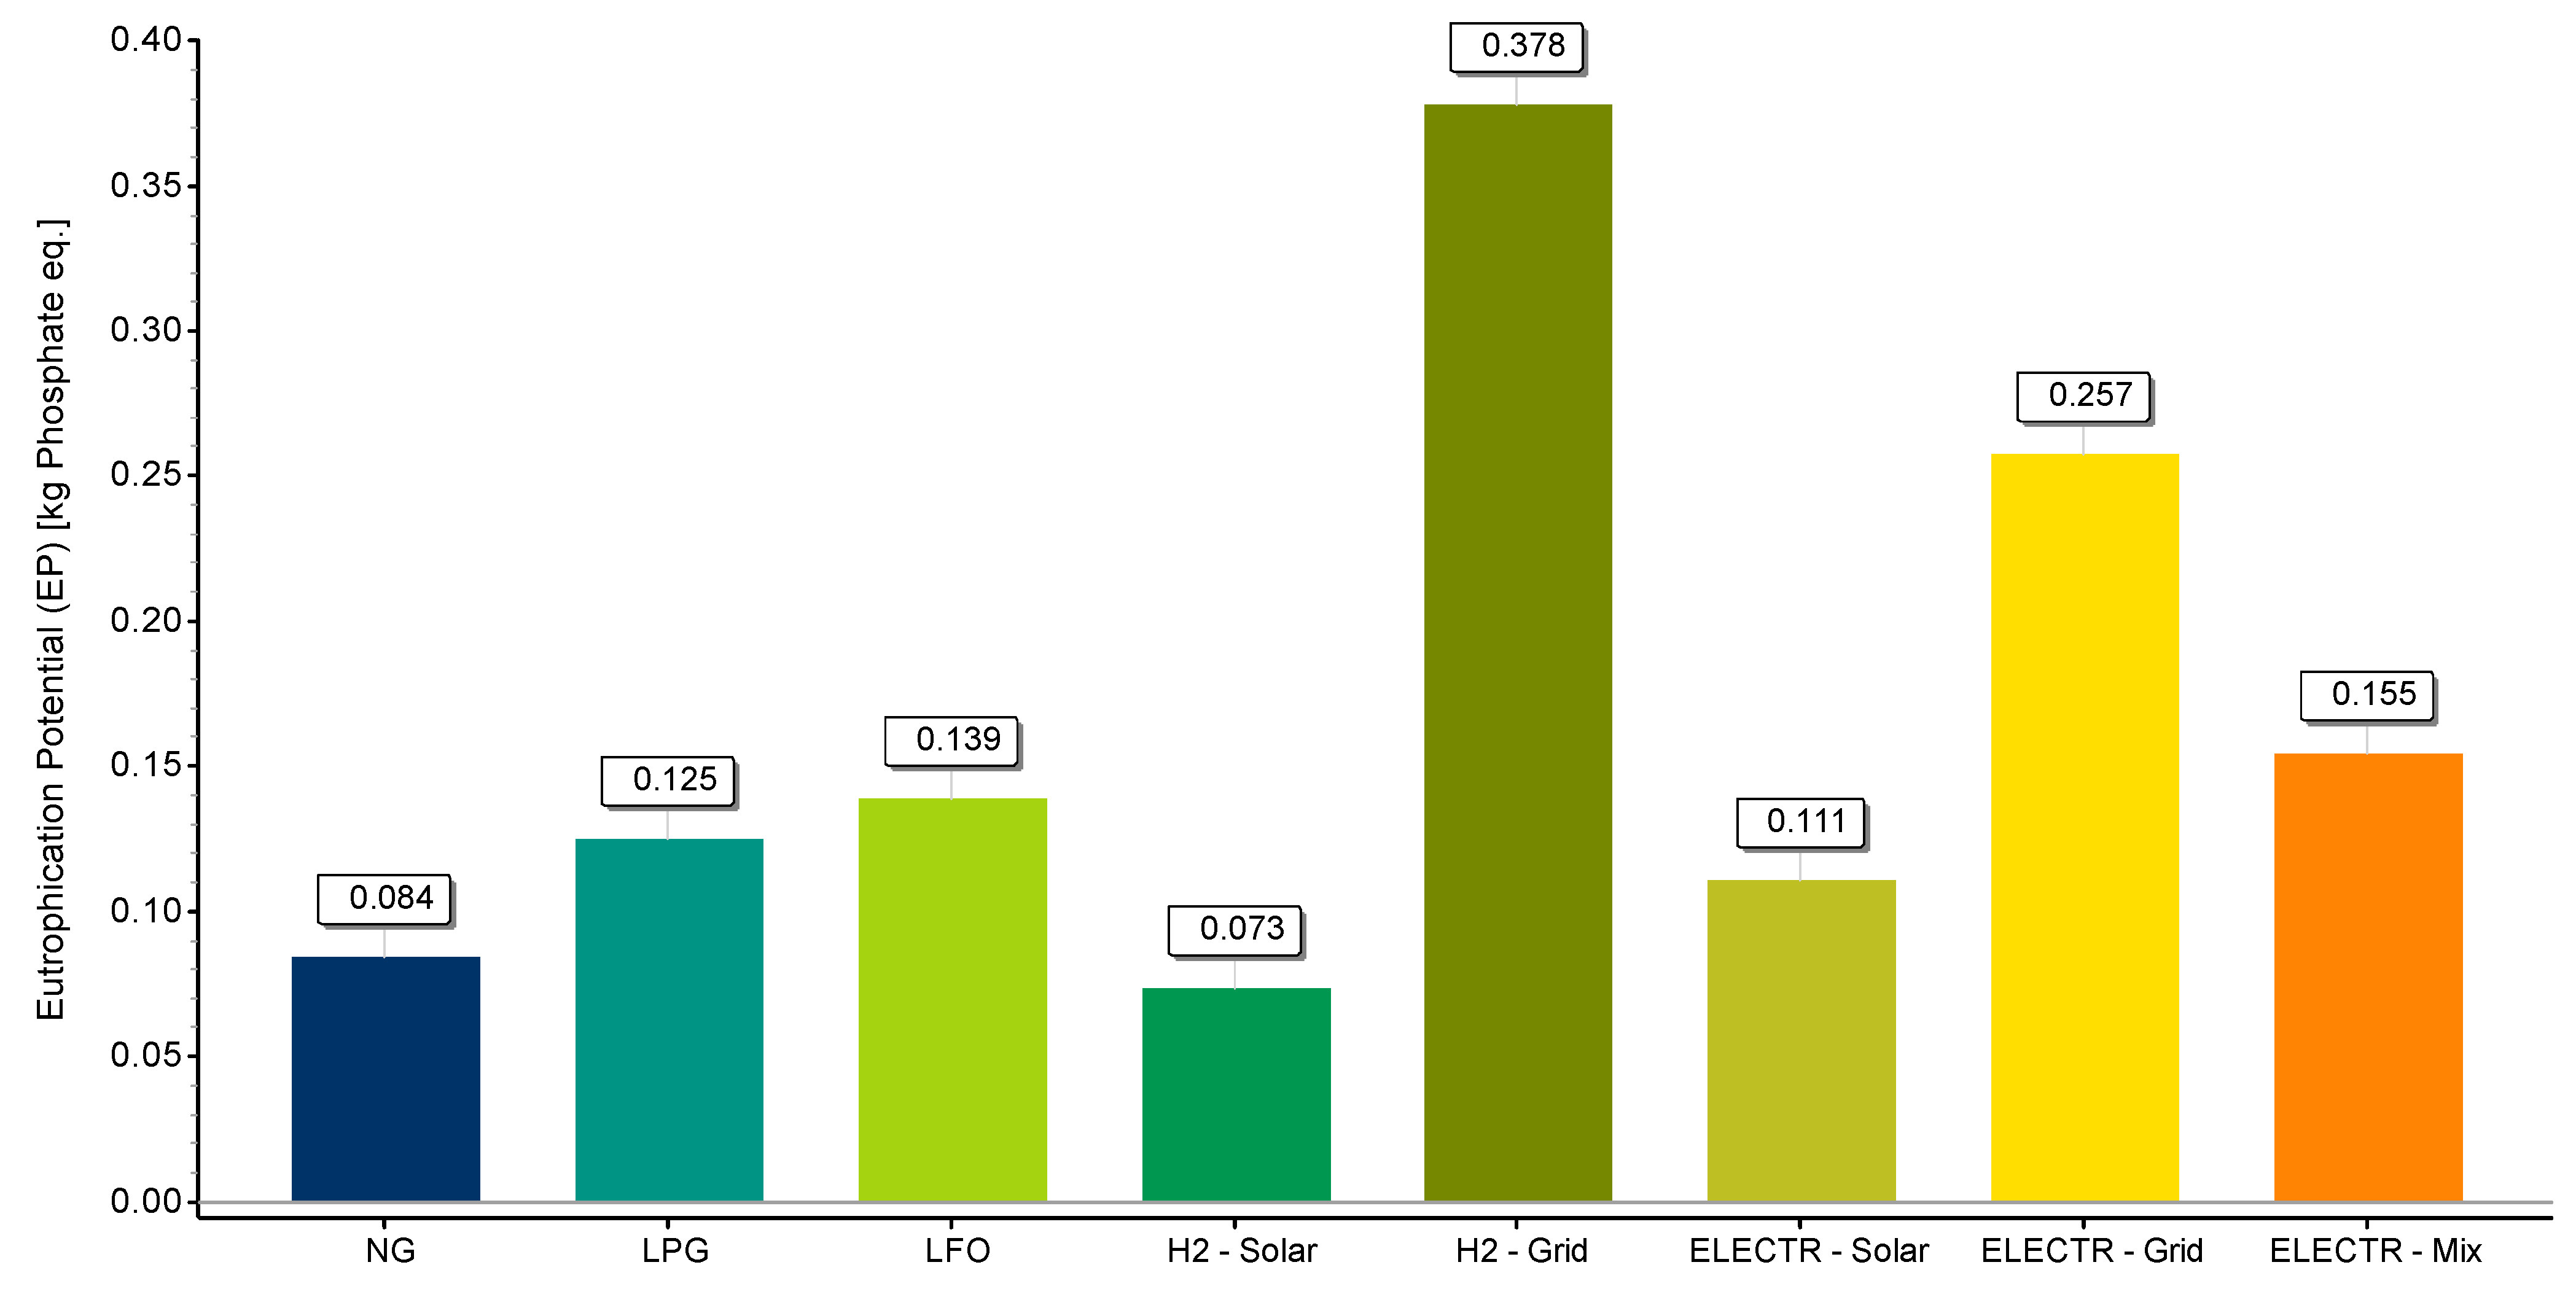
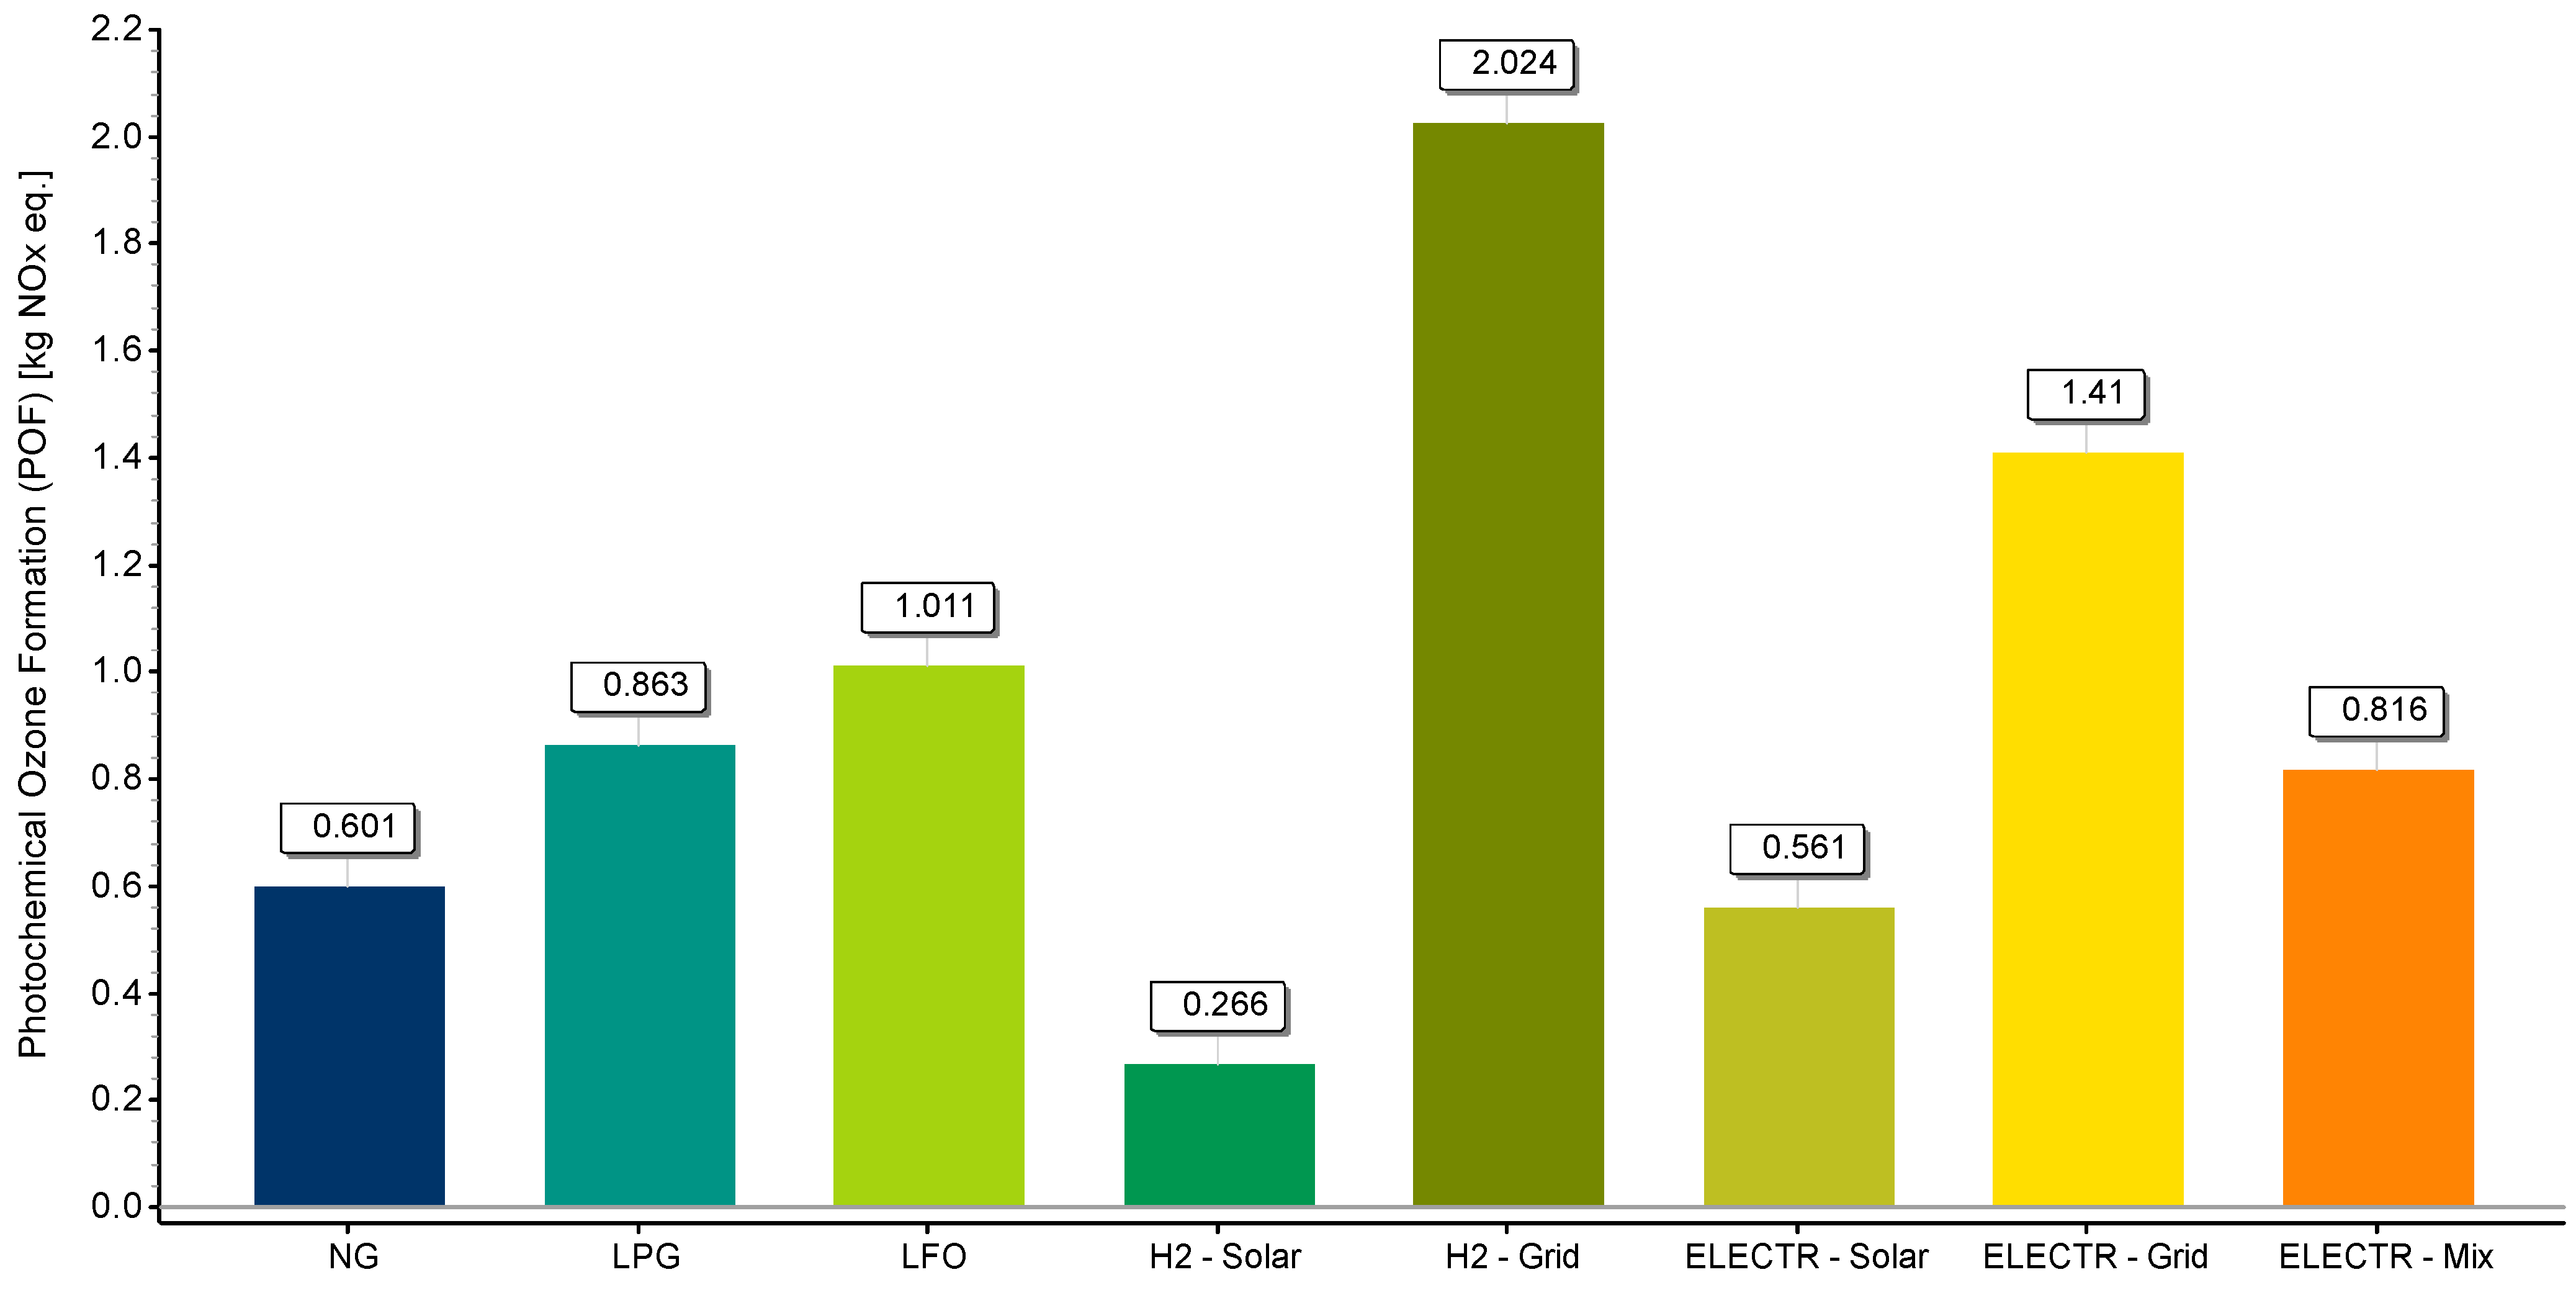
Exploitation of green H2 has been shown to be one of the most promising approaches to decrease the various emissions of the process. In terms of GWP, exploitation of green H2 technologies accounts for −84.156 kg CO2 eq., a reduction of 118% compared to NG. When it comes to AP, the use of green H2 accounted for 0.092 kg SO2 eq., a reduction of 83%. Considering EP, these technologies accounted for 0.073 kg Phosphate eq., a 13% reduction. In terms of POF, these technologies accounted for 0.266 kg NOx eq., reducing it by 56%.
The results also highlight the importance of the electricity source and production method in the overall environmental impact of the different scenarios. While exploitation of green H2 significantly reduces the emissions of the process, the use of brown H2 is a very highly emissive approach, accounting for 1517.497 kg CO2 eq., 3.381 kg SO2 eq., 0.378 kg Phosphate eq. and 2.024 kg NOx eq., increases of 230%, 525%, 350% and 237%, respectively. These high emissions are the result of the large electricity amounts required for the production of H2. To produce 1 tonne of secondary Al, 86.2 kg of H2 is required. The production of 86.2 kg of H2 requires 16,550 MJ of electricity, corresponding to 1319, 6068, 5146 and 7491 MJ by crude oil, hard coal, lignite and NG combustion, respectively.
In the same manner, the electricity production method has a significant role in the case of EI furnaces using electricity to produce the necessary thermal energy. When provided by the grid, electricity accounted for 1002.524 kg CO2 eq., 2.205 kg SO2 eq., 0.257 kg Phosphate eq. and 1.41 kg NOx eq., increases of 118%, 308%, 302% and 135%, respectively. When produced by solar thermal energy, electricity accounts for 229.637 kg CO2 eq., 0.619 kg SO2 eq., 0.111 kg Phosphate and 0.561 kg NOx eq., accounting for 50% and 7% decreases in GWP and POF, and 14% and 32% increases in AP and EP. The rise in AP and EP is the result of increased electricity demand, due to the relatively low electricity to thermal energy conversion efficiency of 60%.
Particularly interesting is the fact that green H2 appears to be significantly more environmentally beneficial than electricity from thermal energy, despite the fact that H2 is produced by the same energy source, while also accounting for the emissions of the H2 technologies operation, manufacturing, etc. This difference lies in the efficiency of electrolysis and H2 technologies. High electrolysis efficiencies, combined with an average 80% CHP efficiency for the H2 technologies, and the electricity returned to the grid, result in significantly lower electricity demand, both from the grid and RES.
5. Discussion
As shown from the results of this study, the energy-intensive nature of the Al industry leads to a direct correlation between the energy supply and the overall environmental impact of the different scenarios. During the commissioning and operational phases of smelting, emissions released into the atmosphere present a dominant impact. As mentioned in the introduction, the EU has committed to be climate-neutral by 2050. To achieve this goal, the decarbonisation of various industrial processes is targeted with a main focus on the minimisation of high CO2 emissions almost exclusively produced by the combustion of fossil fuels.
In this view, the main achievement of this study derives from mainly two aspects. Firstly, lifecycle boundaries address both common, well-established and available, novel practices providing a wide spectrum of pathways towards industry decarbonisation. Secondly, the proposed strategies have been based on state-of-the-art technological solutions, especially in the field of hydrogen exploitation (i.e., industrial H2 burners, SOFC). Nevertheless, the data quality and the representativeness of the processes always have to be assessed to ensure the robustness of LCA results. In this way, future studies could focus on elements of improvement by the level of detail for machinery and components, as well as including the end-of-life phase.
The development of new production routes and their direct use for medium-high grade heat and electrification will be fundamental for the transition of the Al industry towards neutrality of the European Green Deal and EU’s clean energy transition. The replacement of fossil fuels with clean H
2 in the smelting process will reduce emissions in the energy and emissions-intensive recycling stage of the Al supply chain. From a purely technical perspective, H
2 technologies are viable to be used in all energy applications and sectors, including electricity, heating, industry or transport. Indicatively, a 12 MW hydrogen-fuelled power plant in Italy has operated since 2009 using a combined-cycle gas turbine and reformed H
2, with an estimated production of 60 million kWh a year [
41]. Yet, to advance from technically viable solutions to feasible solutions, they need to be thoroughly evaluated using a systemic approach and be economically sustainable, socially accepted and environmentally friendly.
Across all scenarios, green H2 utilisation is determined as a more environmentally friendly option, providing full decarbonisation compared to the alternatives in this study. However, industrial scale demands for green H2 result in extensive electricity demands that are solely needed for this purpose, which omits the idea of producing green H2 at a low cost. Nevertheless, this statement could be amended given the expected growth in RES that will arise by 2030, reaching 187 TWh of generation from RES. The increased penetration of renewable electrical energy production, mainly photovoltaics and wind will not only cover 55.0% of the final gross electric consumptions with RES, but also facilitate the penetration of green H2 in the energy intensive industries.
6. Conclusions
Discarding fossil fuels from energy-intensive processes is a key aspect towards the decarbonisation of extractive industries. Different energy sources, including electrification and H2 adaptation are considered as an alternative to low emissions. While identifying the environmentally friendly energy sources can be instinctively achieved, selecting the most beneficial energy source overall is more complex. Factors such as electricity production methods for direct use or H2 production must be taken into account. To this end, LCA is a powerful tool by which to assess the overall environmental impact of the different energy sources and reach the most accurate conclusions.
The LCA conducted in this study compared different energy sources over the entire production cycle of fossil fuels, H2 and electricity. Results showed that green H2 accounted for reductions of 118%, 83%, 13% and 56% in GWP, AP, EP and POF, respectively, compared to conventional NG. Brown H2, on the other hand, appears to be the most impactful option, accounting for increases of 230%, 525%, 350% and 237% in GWP, AP, EP and POF, respectively. In terms of EI furnaces exclusively using electricity, results showed that electricity produced by solar thermal energy is less impactful in terms of GWP than NG, but it is significantly less beneficial than green H2. Meanwhile, electricity from the grid appears to be the second most emissive option, only behind brown H2. In both cases, this is the result of the relatively low electricity to thermal conversion efficiency, significantly increasing net energy demand.
It is evident that green H2 offers a decarbonisation solution for the extractive industries, being a major contributor towards the European milestone of zero emissions by 2050. To this end, promoting H2 penetration as the energy carrier for not only extractive but energy-intensive industries in general, is key. The development of new production routes and direct uses for medium-high grade heat and electrification will be fundamental for the decarbonisation of the industry across a number of sectors. Promoting research and development in H2 production and utilisation technologies will also be key to further increase its environmental benefits. The optimization of electrolysis processes using RES electricity, as well as H2 combustion design and operative conditions, will allow for the minimization of electricity consumption and NOx formation, which account for the majority of these technologies’ emissions.
The examined green H2 scheme can serve as a basis for further investigation of self-sustained green energy systems to support the main processes of extractive industries. Further investigation and detailed techno-economic analysis is recommended as the next step for implementing these technologies in extractive industries, not only for the direct decarbonisation of their processes, but also for the additional role as decentralised green power stations, for a two-fold contribution to the 2050 climate neutrality goals.


 ,
, 


