1. Introduction
The oxidation of carbon nanomaterials changes their electron properties considerably [
1,
2]. Thus, graphene oxide shows limited conduction of electricity, while its thermal reduction results in an enhancement of the conductivity, similar to the reference value for graphite at an annealing temperature of approximately 800 °C [
3,
4,
5]. The most informative source of data on the electronic characteristics of a material is X-ray photoelectron spectroscopy (XPS), which does not inflict damages on the material [
6]. Particularly, the results of XPS spectra evolution on the thermal reduction of graphene oxide permitted the determination of interconnection between the oxidation degree of the material and the intensity of plasmon oscillations, which in its turn relates to the free electron concentration [
4,
5,
7,
8].
The electron characteristics of carbon nanotubes (CNTs) also depend on the oxidation degree of samples. This relationship is studied in the present work on the basis of the treatment of XPS spectra of samples obtained on CNT oxidation. These spectra are compared with those for reduced graphene oxide with various oxidation degrees. The comparison indicates a considerable difference in the electronic characteristics of these two nanocarbon modifications.
The main information on the electronic characteristics of the sample under investigation are the position and intensity of peaks formed by photoelectrons escaping in vacuum without energy loss (peak shape analysis—PSA) [
6]. In addition, an approach based on the XPS spectra in the characteristic-energy-loss region adjacent to the peaks (photoelectron spectra analysis—PES analysis) was used.
Samples of thermally reduced graphene oxide and oxidized CNTs were studied by processing XPS spectra of multiple inelastic electron energy losses. Various approaches have been developed to derive the differential inverse inelastic mean free path (DIIMFP–ωin(∆)) from the energy spectrum of photoelectrons; ∆—energy loss. A comparison of the ωin(∆) of graphene oxide and CNTs indicates a considerable difference in the behavior of their π bonds. Thus, the oxidation of CNTs does not break the π bonds. The ωin(∆) for graphene oxide annealed at a temperature of 600–900 °C corresponds to that of pyrolytic graphite.
The electrons escaping in vacuum without energy loss do not interact with the electrons of the sample and do not carry information on the electron structure of the sample. This information is contained in the
ωin(∆), which determine the energy spectrum of characteristic electron excitations and permit determination uniquely the type of carbon allotrope modification.
Figure 1 presents the
ωin(∆) for various allotrope carbon modifications [
9].
As has been shown by Tougaard [
10], PSA approach provides rather ambiguous results for the analysis of non-homogeneous materials. However, it is convenience as there are a great quantity of textbooks [
6] and program codes permitting one to quickly obtain information on the sample under study. The code Casa XPS [
11] is but one example. One should note that the abbreviation XPS is presently used for labeling PSA, while the exploration of samples on the basis of the
ωin(∆) derived from XPS spectra taking into account multiple electron energy losses is called PES analysis.
3. Analysis
This chapter describes methods for the deconvolution of the single-scattering cross section, which univocally determines allotrope carbon modification, as demonstrated by
Figure 1.
The differential density of photoelectron flow
Q(
τ, ∆,
μ0,
μ,
φ) is expressed using the representation of partial intensities [
16,
17]:
where
τ = z/
ltot is the ratio of the free path of a photoelectron in the target
z to the total path
ltot;
ltot−1 =
lin−1 +
lel−1;
lin and
lel—inelastic and elastic mean free path, correspondingly;
μ0 and
μ are the cosine of the angle of incidence and the angle of scattering, correspondingly;
θ0 = arccos(
μ0) and
θ = arccos(
μ) are polar angles for electron take in and take off from the normal to the surface;
φ is the azimuthal angle;
Qk(
τ,
μ0,
μ,
φ)—partial coefficients or the probability of a photoelectron to lose energy ∆ as a result of
k sequential acts of inelastic scattering [
16];
is the probability to lose energy ∆ as a result of
k successive inelastic scattering.
The representation of the partial intensities (1) permit one to describe both photoelectron (PES) and reflected electron spectra in a common form. This approach is called as reflected electron energy loss spectrometry (REELS). In the first approximation, assume that the normalized differential inverse inelastic mean free path (nDIIMFP)–
xin(∆) =
ωin(∆)/
σin is homogeneous over the target (
σin—inelastic cross section). Deconvolution of
xin(∆) from REELS data is performed using a modification of the known Tougaard method [
18]. The representation (1) makes it possible to use the the deconvolution method for both REELS and PES spectra. The partial coefficients
Qk (
τ,
μ0,
μ,
φ) are calculated by the method described in [
19,
20,
21]. The PES is normalized, dividing it by
Q0 (the first term in Equation (1)). The term describing the peak of photoelectrons in vacuum without a loss in energy is removed from Equation (1). This peak differs in its shape from the
δ function due to the influence of the hardware function of the energy analyzer, the Doppler effect and a complicated function describing the spectrum of the formed photoelectrons. The combined effect of the above-listed factors results in the formula by Doniach and Sunjic [
22].
The energy loss axis ∆ is broken into intervals with step
h:
In the low-energy-loss region, the contribution of multiple electron scattering is negligible. Further, it is assumed that:
Hereafter, for the sake of simplification, the term x(∆) will be used instead of xin(∆).
Taking into account approximations (3) and (4),
k = 1 in Equation (1), one obtaines:
where
C1 =
Q1(
τ,
μ0,
μ,
φ)/
Q0(
τ,
μ0,
μ,
φ).
Supposing further that
, one obtains the following relation for
:
For calculation of
, two terms in Equation (1) should be taken into consideration:
where
C2 =
Q2(
τ,
μ0,
μ,
φ)/
Q0(
τ,
μ0,
μ,
φ).
For calculation of
, the expression
is used. Integration by the rectangle method results in:
Substituting (8) into (7), one obtains:
Equation (9) permits the determination of
:
The step-by-step movement to the high-energy-loss region results in the following equation for
:
where
Ck =
Qk(
τ,
μ0,
μ,
φ)/
Q0(
τ,
μ0,
μ,
φ).
Equation (10) determines the analytic procedure for deconvolution of xin(∆) in accordance with Equation (1).
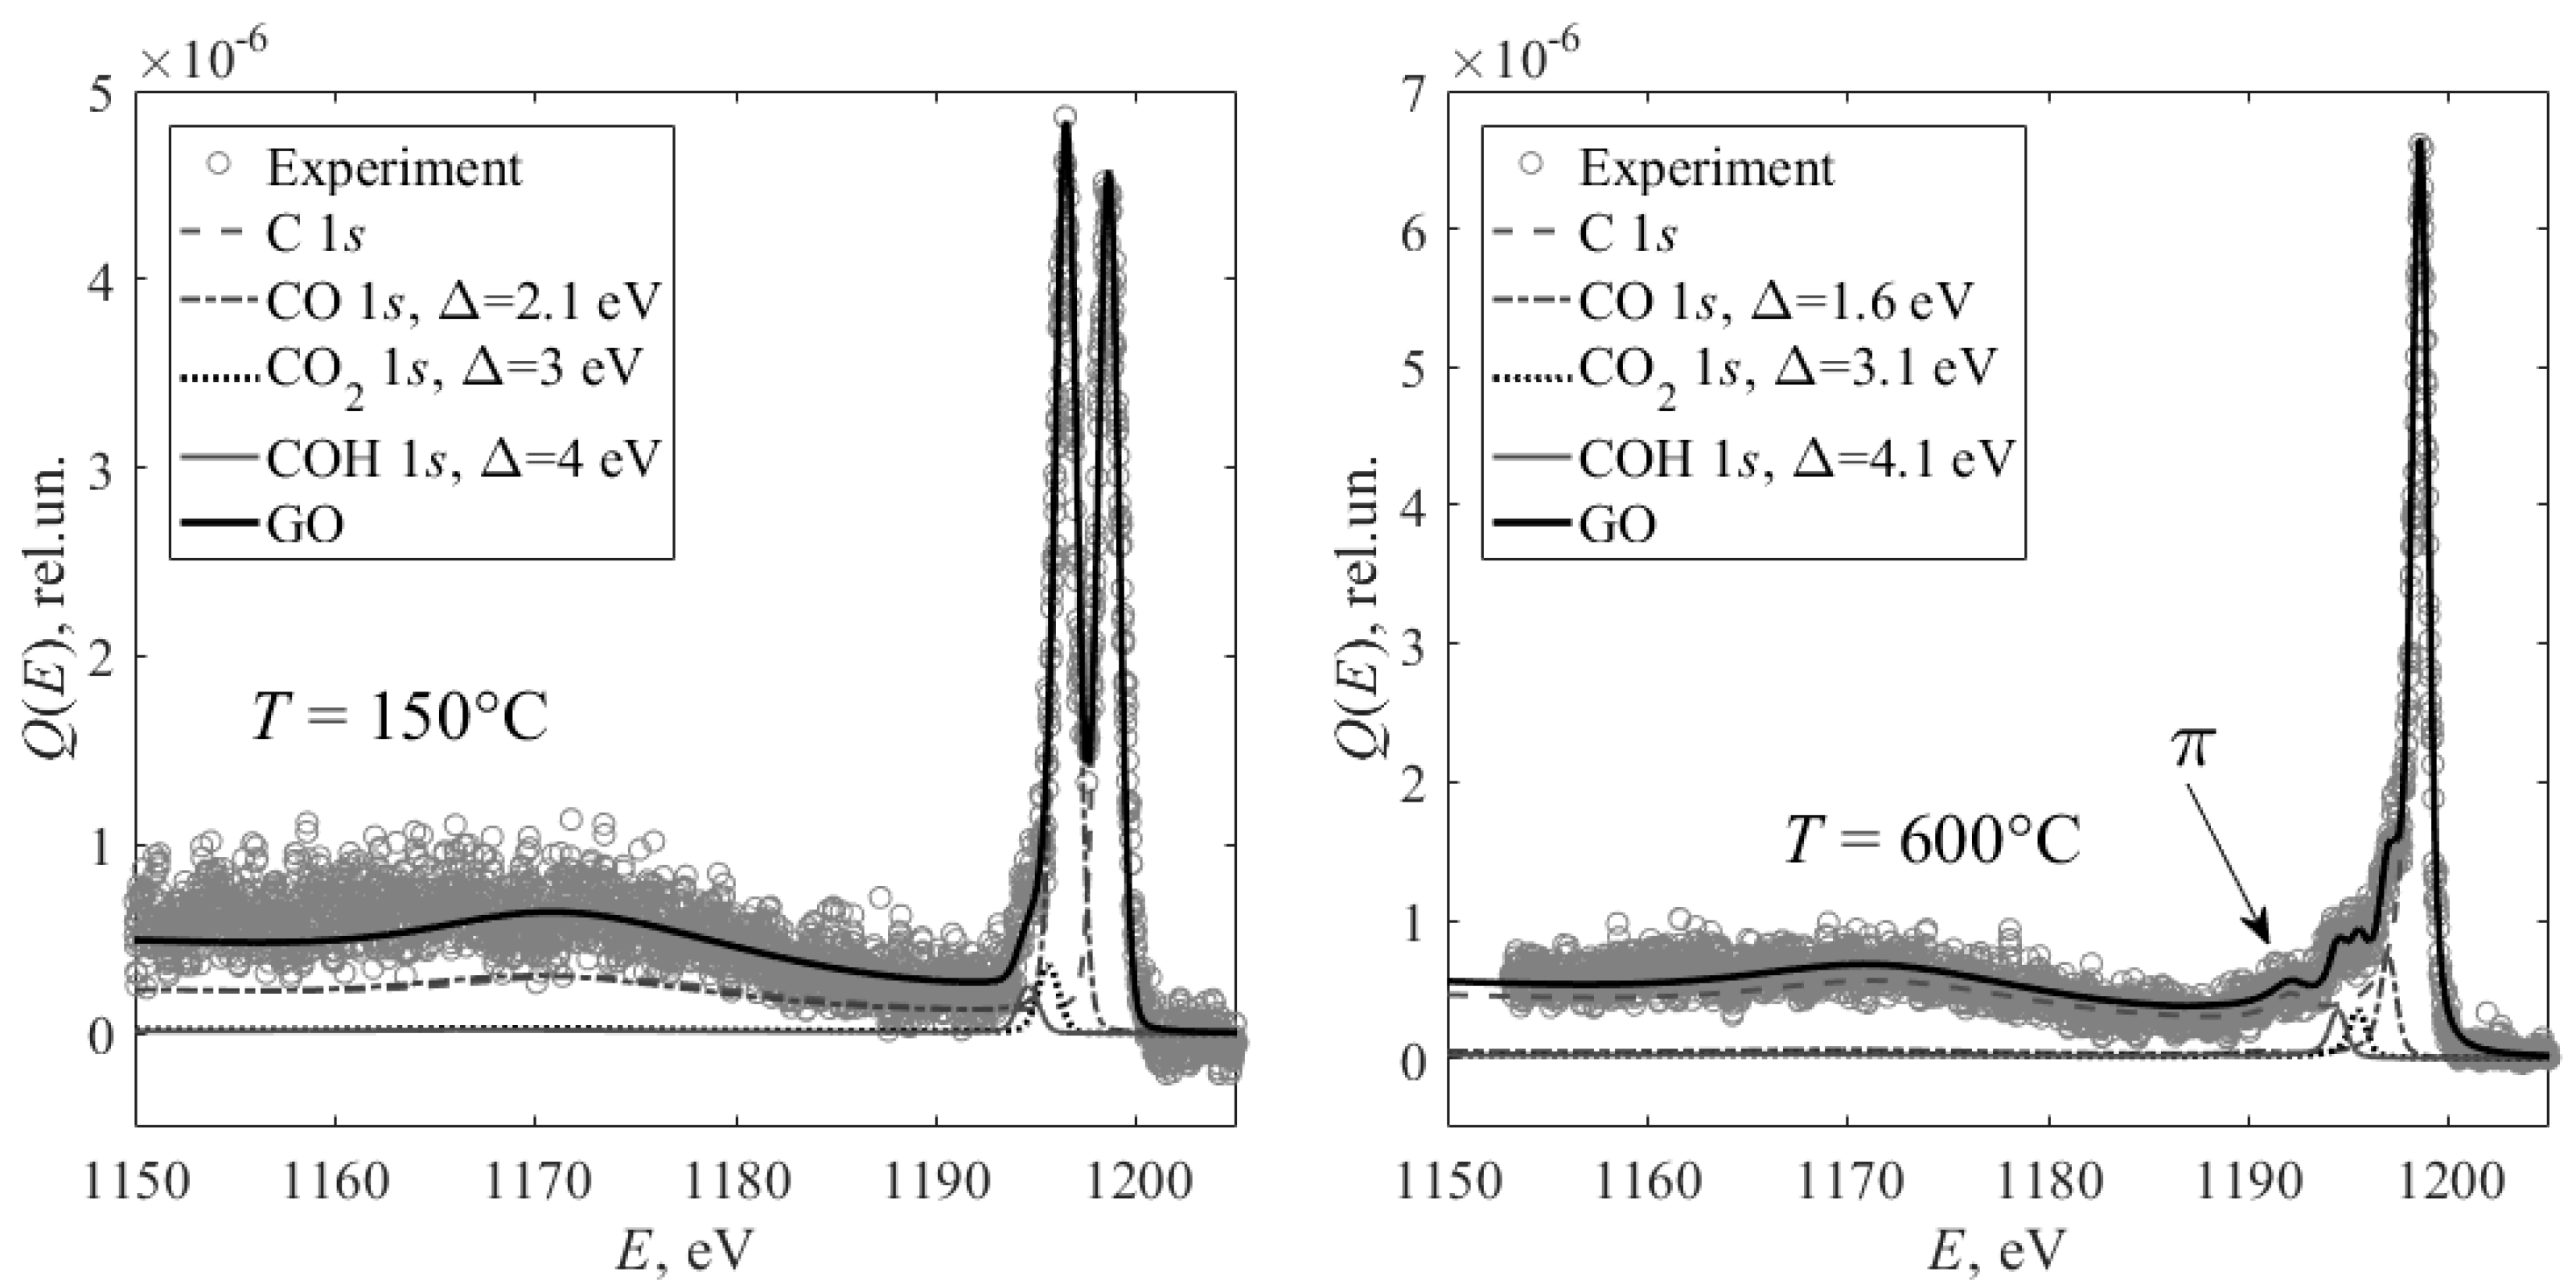
Figure 4 presents a set of multiple scattering signals describing electron energy loss in GO samples annealed at various temperatures.
One can see the characteristic peaks related to two groups: 1—the peaks found in the electron-energy-loss region ∆ < 5 eV correspond to the electrons escaping from the C1 level. These electrons were not subjected to inelastic scattering but were emitted by atoms chemically bonded with oxygen. 2—the peaks found in the electron-energy-loss region ∆ > 5 eV correspond to the photoelectrons losing energy for excitation of plasmon oscillations. Note that even thermal processing at 1000 °C did not result in total removal of oxygen, and the peak of the relevant C-O bond is shown. The peak O-C-OH disappears at annealing at a temperature of 600 °C and higher. Chemically shifted C1 peaks should be subtracted from the experimental spectra presented in
Figure 4. After that, the spectra obtained are treated using the above-described procedure (Equations (2)–(11)). The results of the treatment are shown in
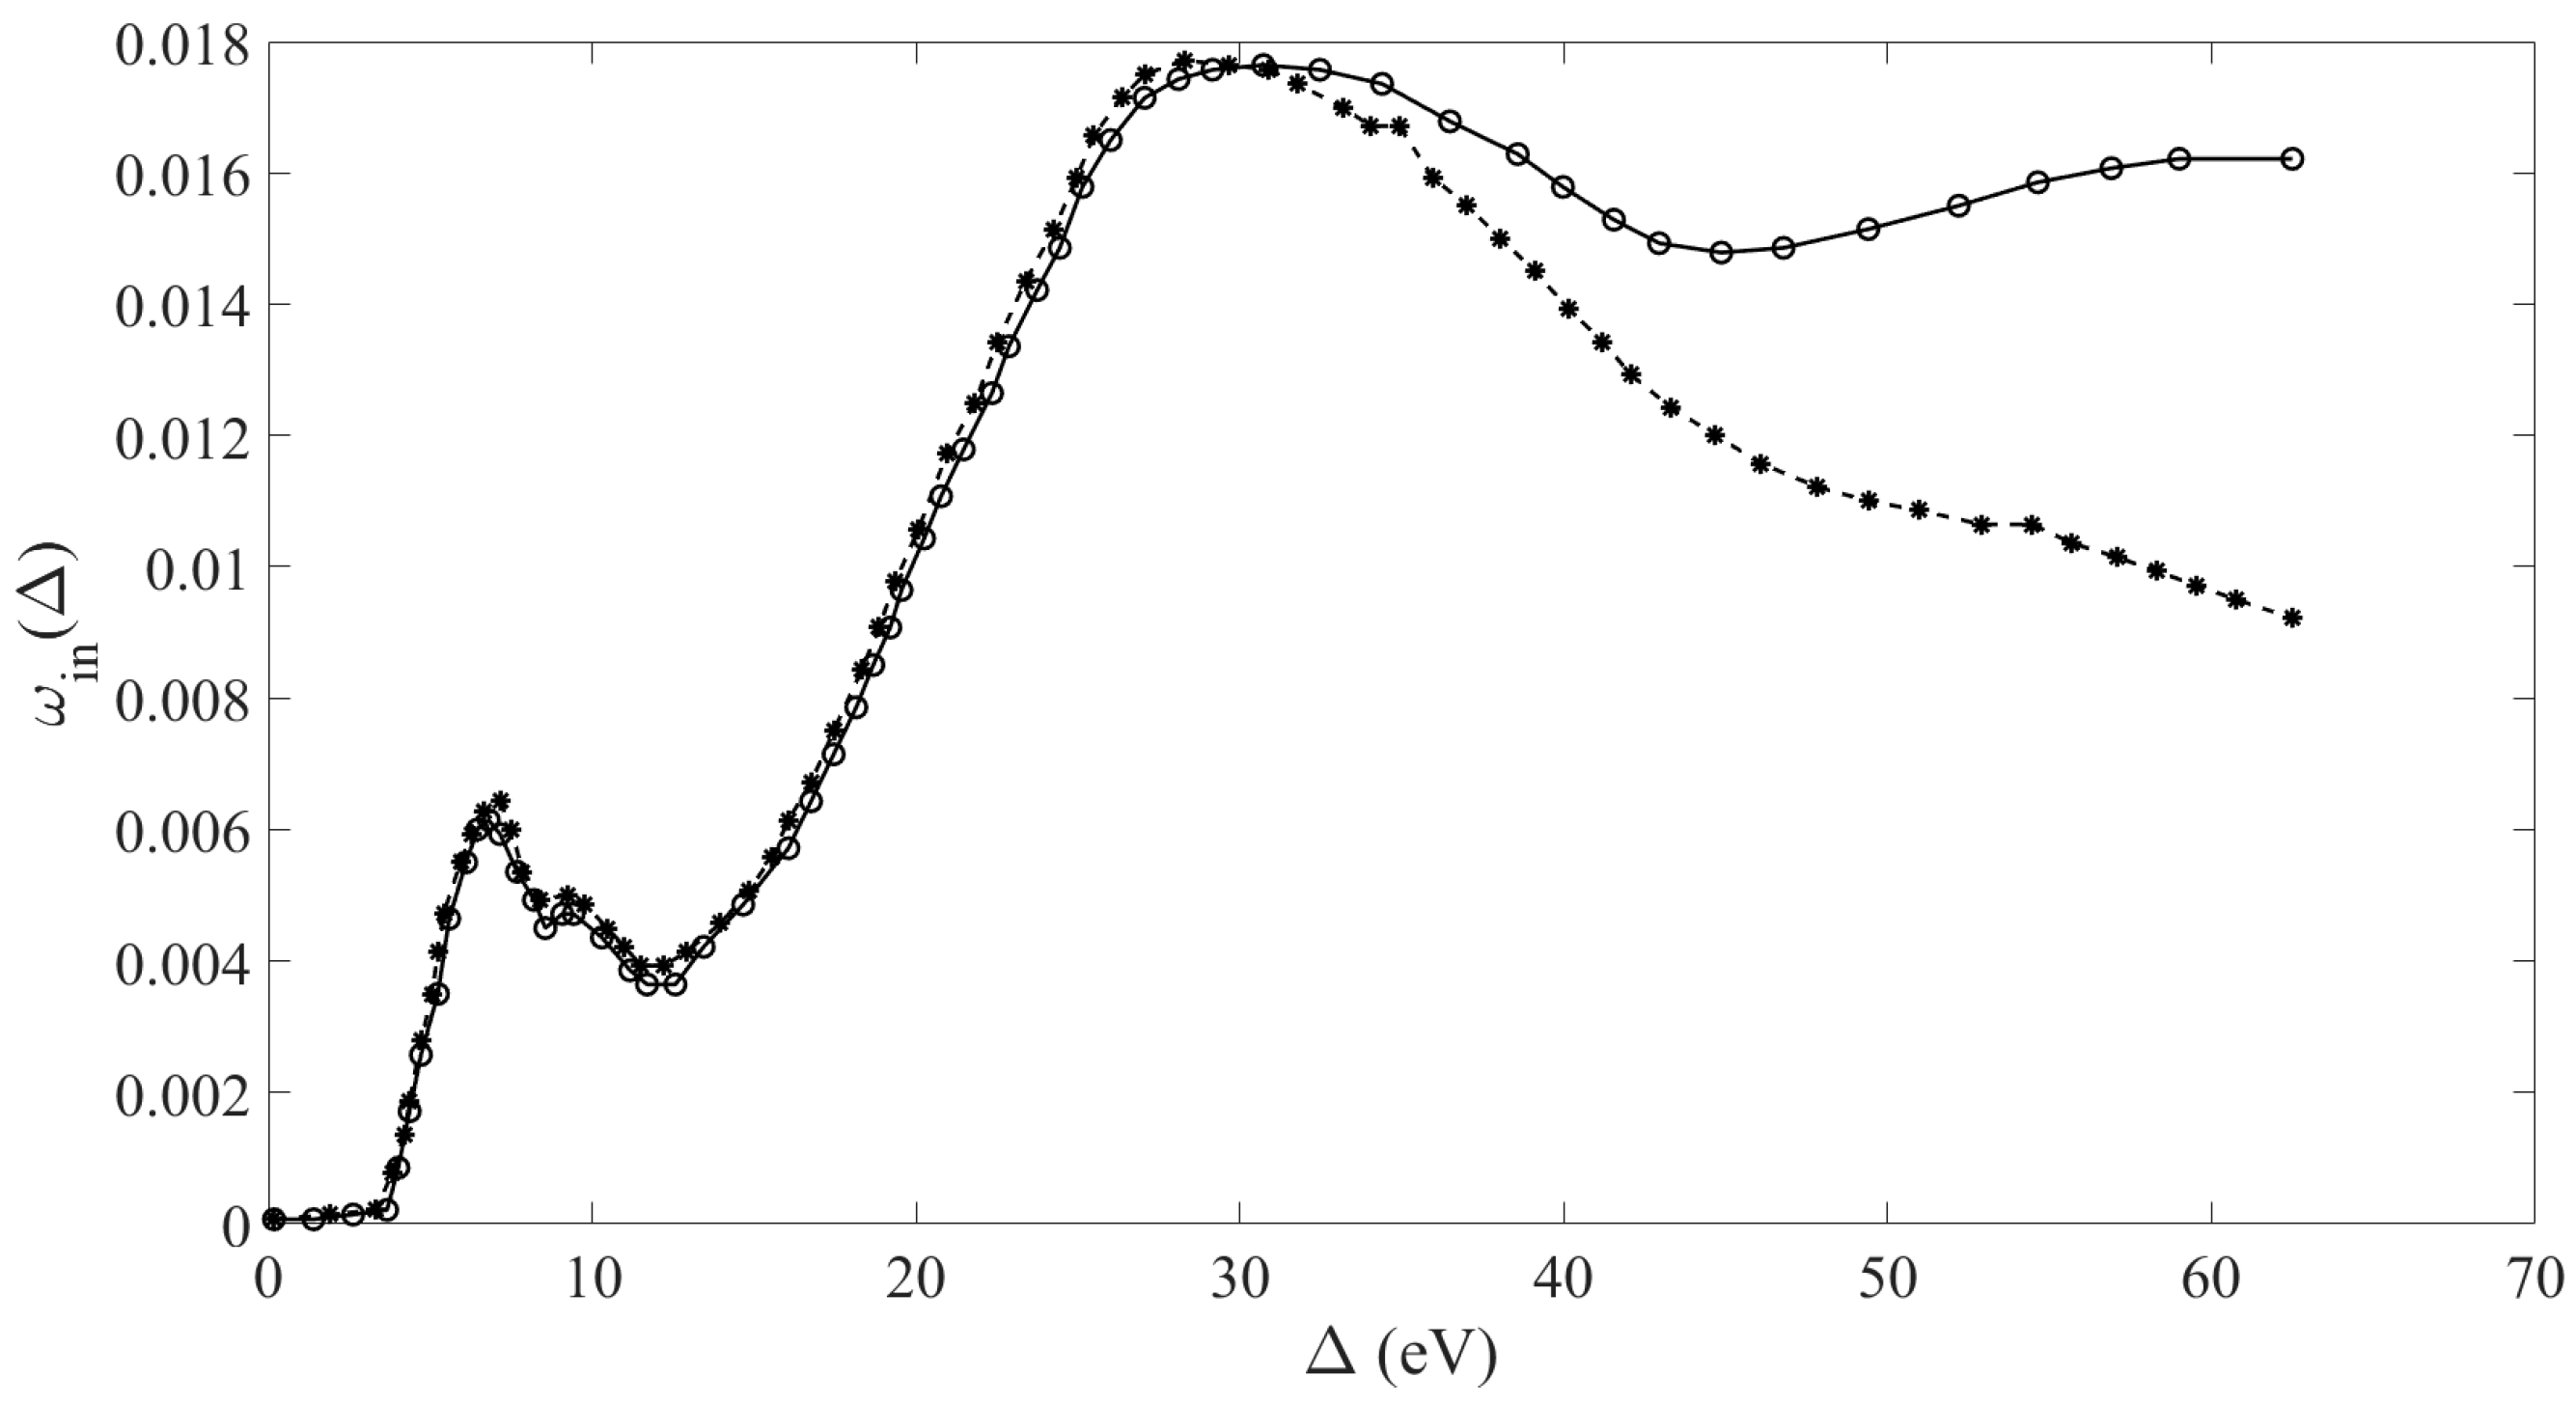
Figure 5.
Figure 5 presents the
ωin(∆), describing the contribution of one-time energy loss processes into the spectrum. Three peaks are seen on these curves: the first one, at a resonant energy of approximately 7 eV, corresponds to π plasmon oscillations; the second one, at an energy of approximately 10 eV, is hardly distinguishable; and the third one, at an energy of approximately 28 eV, corresponds to the π + σ plasmon oscillations. The presented relationships are also inherent to pyrolytic graphite [
9] (see also
Figure 1).
The procedure for the reconvolution of the
ωin(∆) from PES spectra is a non-correct task of mathematical physics (ILL-POSED Problem). The best method for the solution of such tasks is trial and error [
23].
For the solution of this task, it is necessary to subtract the elastic peak. This task consists of the calculation of spectra
Qfit(∆,
μ0,
μ,
φ) with
xin(Δ), which contains a set of fitting parameters determined as a result of the trial-and-error procedure. This procedure is performed through the minimization of the function for the experimental spectra PES and REELS:
where
Qexp(∆,
μ0,
μ,
φ) is the experimental spectrum and
Qfit(∆,
μ0,
μ,
φ) is the calculated spectrum, which is evaluated taking into account the hardware function of the energy analyzer, Doppler broadening
D(∆), the energy broadening of the probing electron beam and the energy spread of photoelectrons. The influence of between these features on the experimental conditions is given by the following relation:
For analytical calculation of functions
Qk(
τ,
μ0,
μ,
φ), the reflection function partial coefficients
Rk(
τ,
μ0,
μ,
φ) are necessary. The set of matrix equations for the functions
Qk(
τ,
μ0,
μ,
φ) and
Rk(
τ,
μ0,
μ,
φ) obtained on the basis of the invariant imbedding method are presented in [
24]. The functions
Qk(
τ,
μ0,
μ,
φ) are determined by the following equation:
where
;
ωel(
μ′,
μ,
φ′) and
σel are the differential and total elastic scattering cross sections, correspondingly;
is the normalized differential inverse inelastic mean free path, which does not result in the transition of descending photoelectron flow to ascending flow and vice versa;
is the normalized differential inverse inelastic mean free path, which results in the transition of descending photoelectron flow to ascending flow and vice versa;
;
;
σγ is the total photoionization cross section;
;
Pi is the Legendre polynome;
;
is the scattering angle;
is the function of the photoelectron source or the photoionization cross section. The detailed description of the functions
f,
B and
F can be found in [
25,
26].
The following designations are convenient to use: ; is a part of the elastic scattering cross section which does not result in transformation of descending flow to ascending flow and vice versa (this part corresponds to a minor correction of the movement direction); , is a part of the elastic cross section corresponding to the reflection.
The following designation is used in Equation (14):
The reflection of electrons is described by the function
Rk(
τ,
μ0,
μ,
φ), which is determined by the equation:
The numerical calculations were performed with the use of the electron elastic cross sections given in [
27]. The IMFP was determined with the use of the TPP-2M formula [
28,
29]. The numerical matrix methods utilized for the solution of Equations (14) and (16) are described in detail in [
24,
30].
The main mechanisms of the electron energy loss in a solid are local energy loss for ionization and inter-band transitions, as well as non-local energy loss for excitation of plasmon oscillations. The corresponding
xin(Δ) is expressed in the following form:
where
is the normalized differential inverse inelastic mean free path for excitation of plasmon oscillation;
is the normalized differential inverse inelastic mean free path for ionization of the target atoms;
is the ionization threshold;
is the Heaviside function; fitting parameters
,
,
,
,
and
should be determined in the course of the trial-and-error procedure;
and
are evaluated using the normalization conditions:
The following relation should be obeyed for fulfilling the normalization conditions (18) and (19):
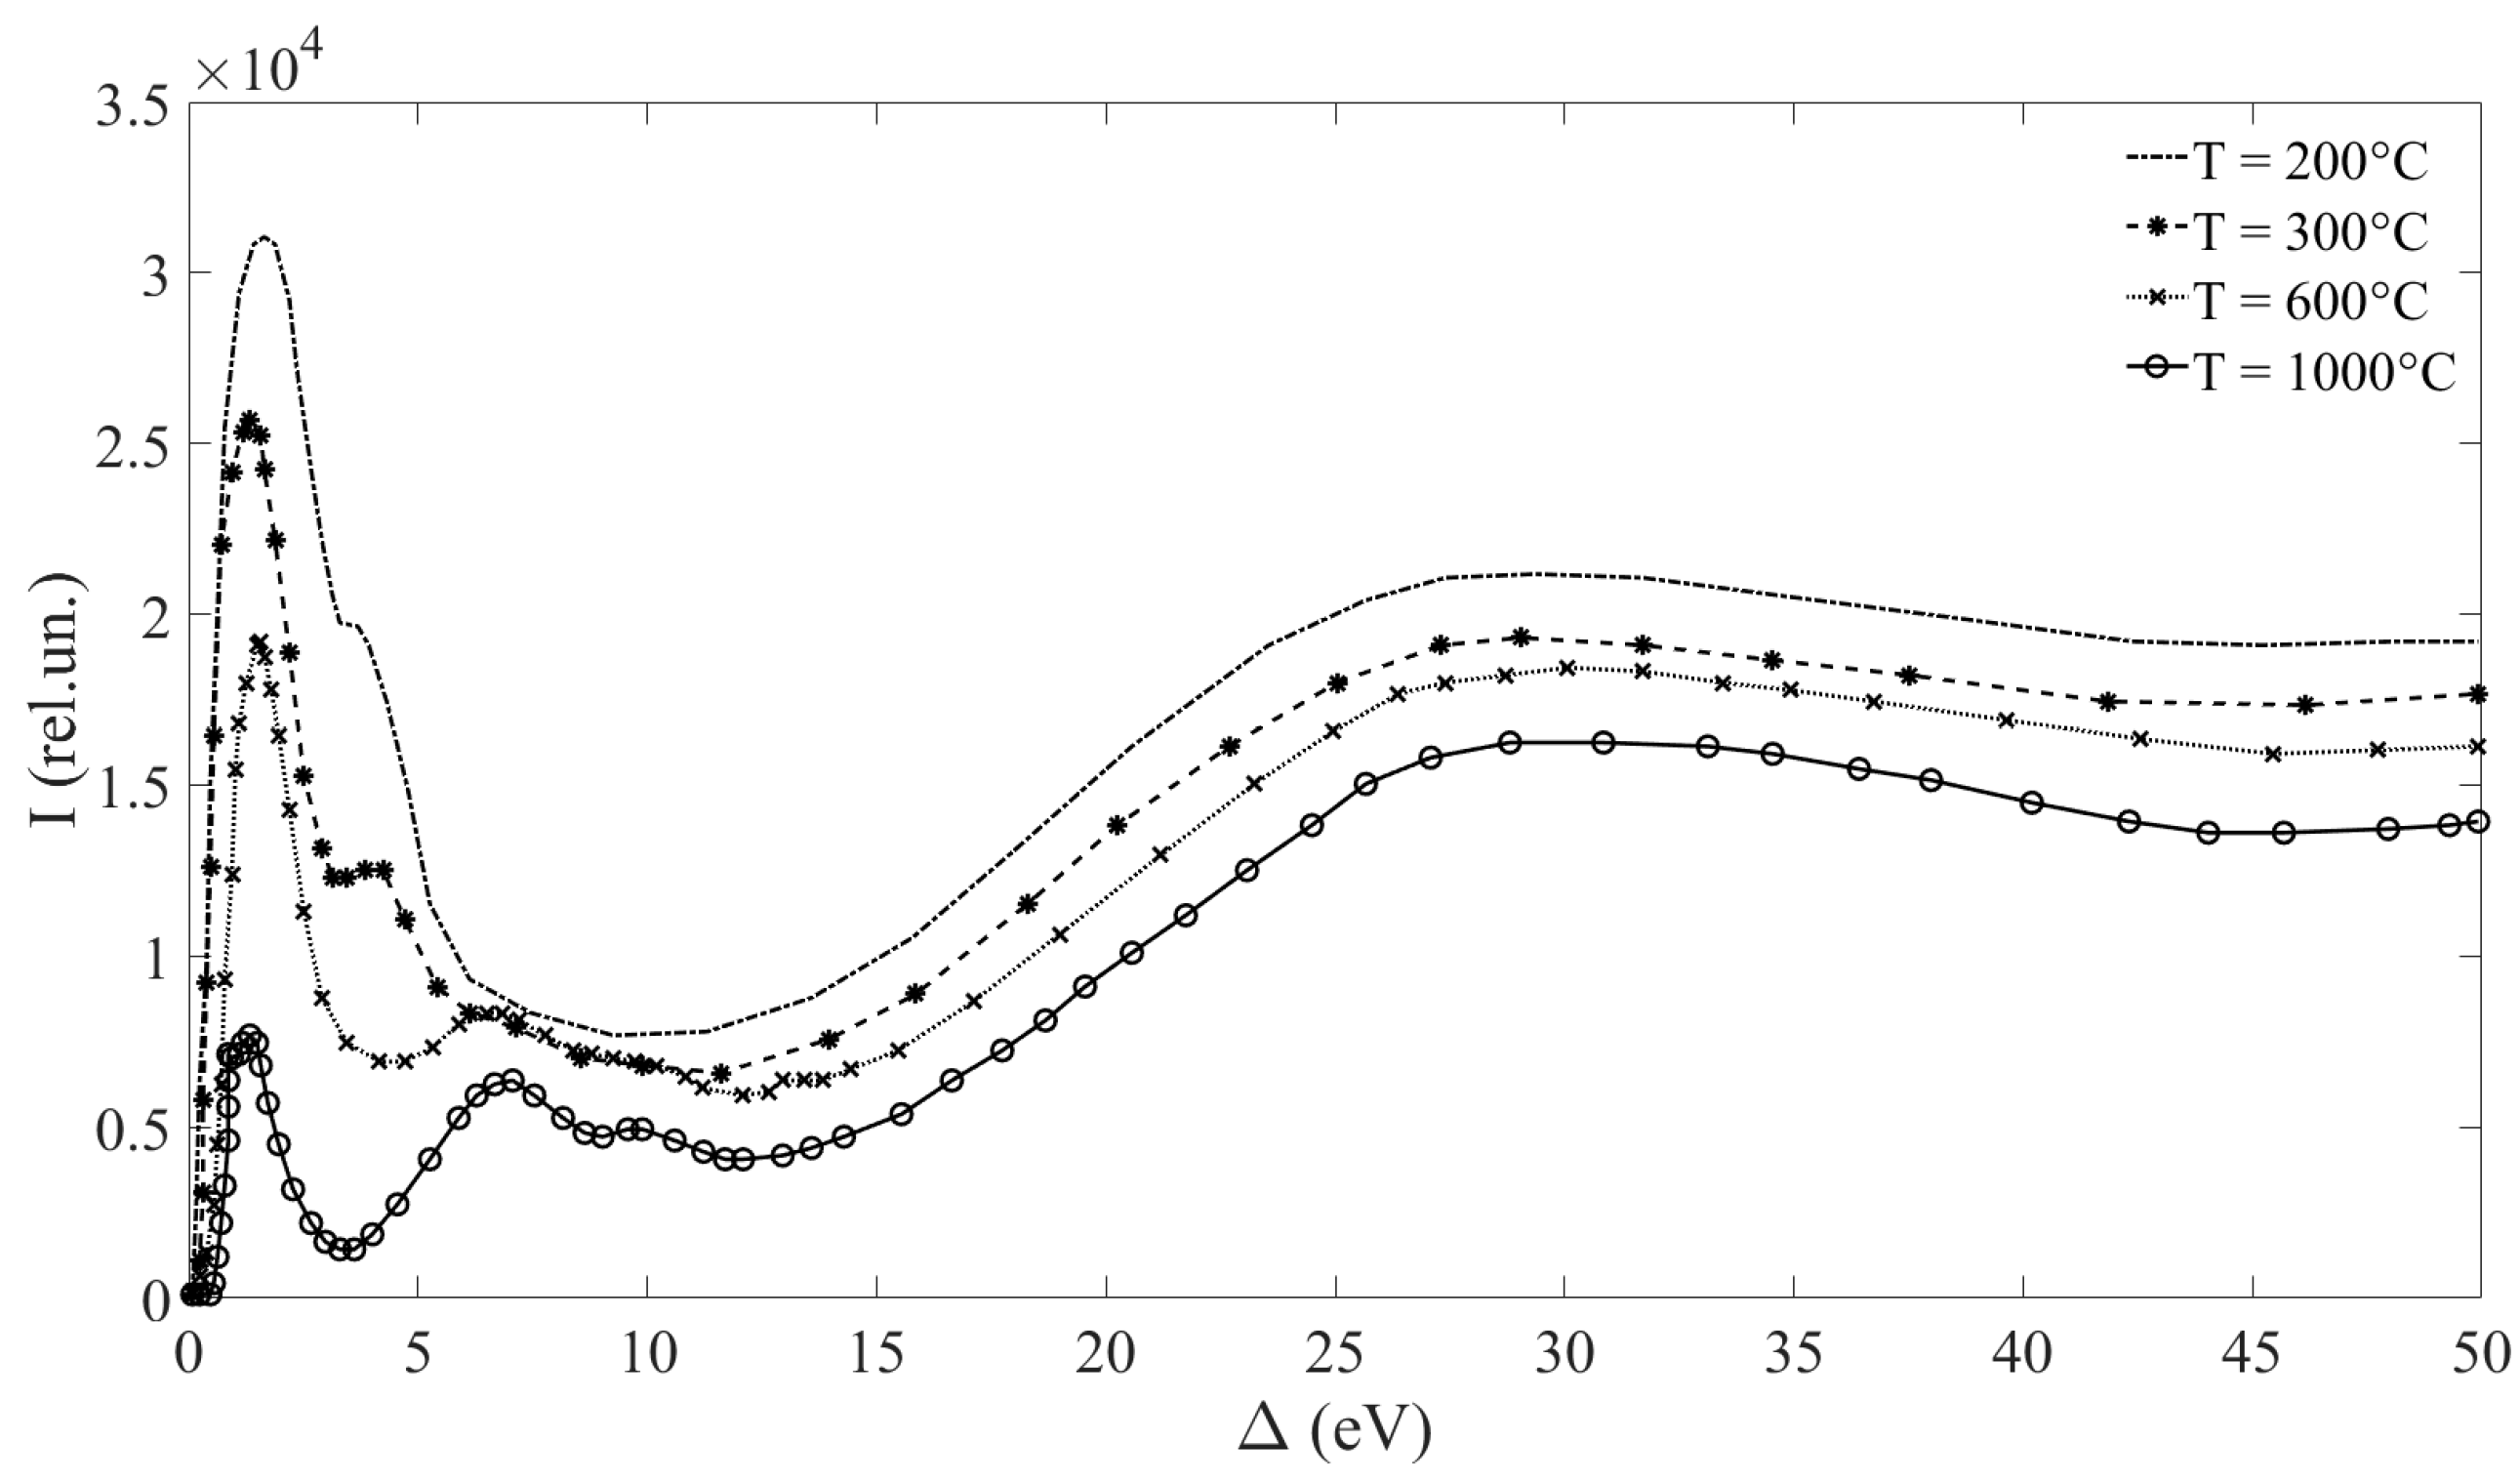
Figure 6 presents
xin(∆), obtained on the basis of a repeated solution of the direct task in the case of a homogeneous target without taking into account differences in the mechanisms of energy loss in surface layers and in bulk remote from the surface.
One should note that the cross sections presented in
Figure 6, in contrast to
Figure 5, were calculated without taking into account the broadening mechanisms related to the Doppler effect and the instrument function of the energy analyzer. This causes a distinction between the corresponding influences. The experimental data shown in
Figure 6 are notably deformed because of the above-mentioned processes of signal broadening. The most comprehensive description of energy loss processes and the relevant information on the electron structure of reduced GO samples will be obtained as a result of the trial-and-error procedure taking into account differences in the energy loss processes in surface layers and homogeneous bulk structure remote from the surface. The detailed description of the
xinS(∆) and
xinB(∆) reconvolution procedure is given in [
31] (
xinS(∆) is the function of the energy loss in surface target layers;
xinB(∆) is the function of the energy loss in target layers which are far from surface).
4. Discussion
The work describes the deconvolution of the differential inelastic scattering cross section
xin(Δ) from XPS spectra. The function
xin(Δ) or
ωin(∆) permits one to uniquely establish allotrope modification of the carbon lattice, where photoelectron movement occurs with electron energy loss for excitation of plasmon oscillations (
Figure 1).
Figure 5 and
Figure 6 present the function
xin(Δ), determined from the XPS signal related to multiple inelastic scattering. The data presented in
Figure 5 have been obtained using a using a modification of the known Tougaard deconvolution method. This approach presents the solution of an inverse task, namely, the evaluation of the cross section from the electron energy loss spectrum.
Figure 6 shows the function
xin(Δ) deconvoluted by means of calculating the direct scattering signal. Thereafter, the fitting parameters determining the function
xin(Δ) and matching the calculated and experimental spectra are selected. Notable differences in the deconvoluted
ωin(∆) on the basis of various approaches relate to the influence of Doppler line broadening, the energy analyzer and the energy spread of the X-ray probe. One should note that while the functions presented in
Figure 5 and
Figure 6 differ in their shape, the energy positions of π and π + σ plasmon peaks correspond to those inherent in pyrolytic graphite. This indicates that annealing promotes the transition of the system into a minimum potential energy state, which is a pyrolytic graphite. All the characteristics of carbon samples presented in
Figure 6 show greater differences; however, the data treatment reflected in
Figure 5 and described by Equations (3)–(12) is much less laborious than the realization of the fitting process resulting in
Figure 6.
Note that, in some cases, a simultaneous analysis of samples by means of REELS and XPS spectroscopy is possible. It has been demonstrated that the cross sections deconvoluted from XPS by the usage of the approach described in the present work correspond qualitatively to REELS spectra and vice versa [
32].
The main goal of the present work is the demonstration of the possibilities of the approach including the analysis of the electron-energy-loss region adjacent to the peak formed by the electrons escaping in vacuum without energy loss. Now the most known method is peak shape analysis, as described in [
6]. The present work demonstrates the possibilities of the analysis. For its realization, it is necessary to cover the electron-energy-loss region 50–100 eV at a high resolution. The experimental spectra shown in the present article cover the electron-energy-loss region 50–60 eV. One exception is
Figure 3, where the electron-energy-loss region slightly exceeding 10 eV is covered. This spectrum contains only the π plasmon peak, which is kept constant; however, the π + σ plasmon peak that would permit one to obtain more detailed information on electronic excitations of the sample has not recorded.
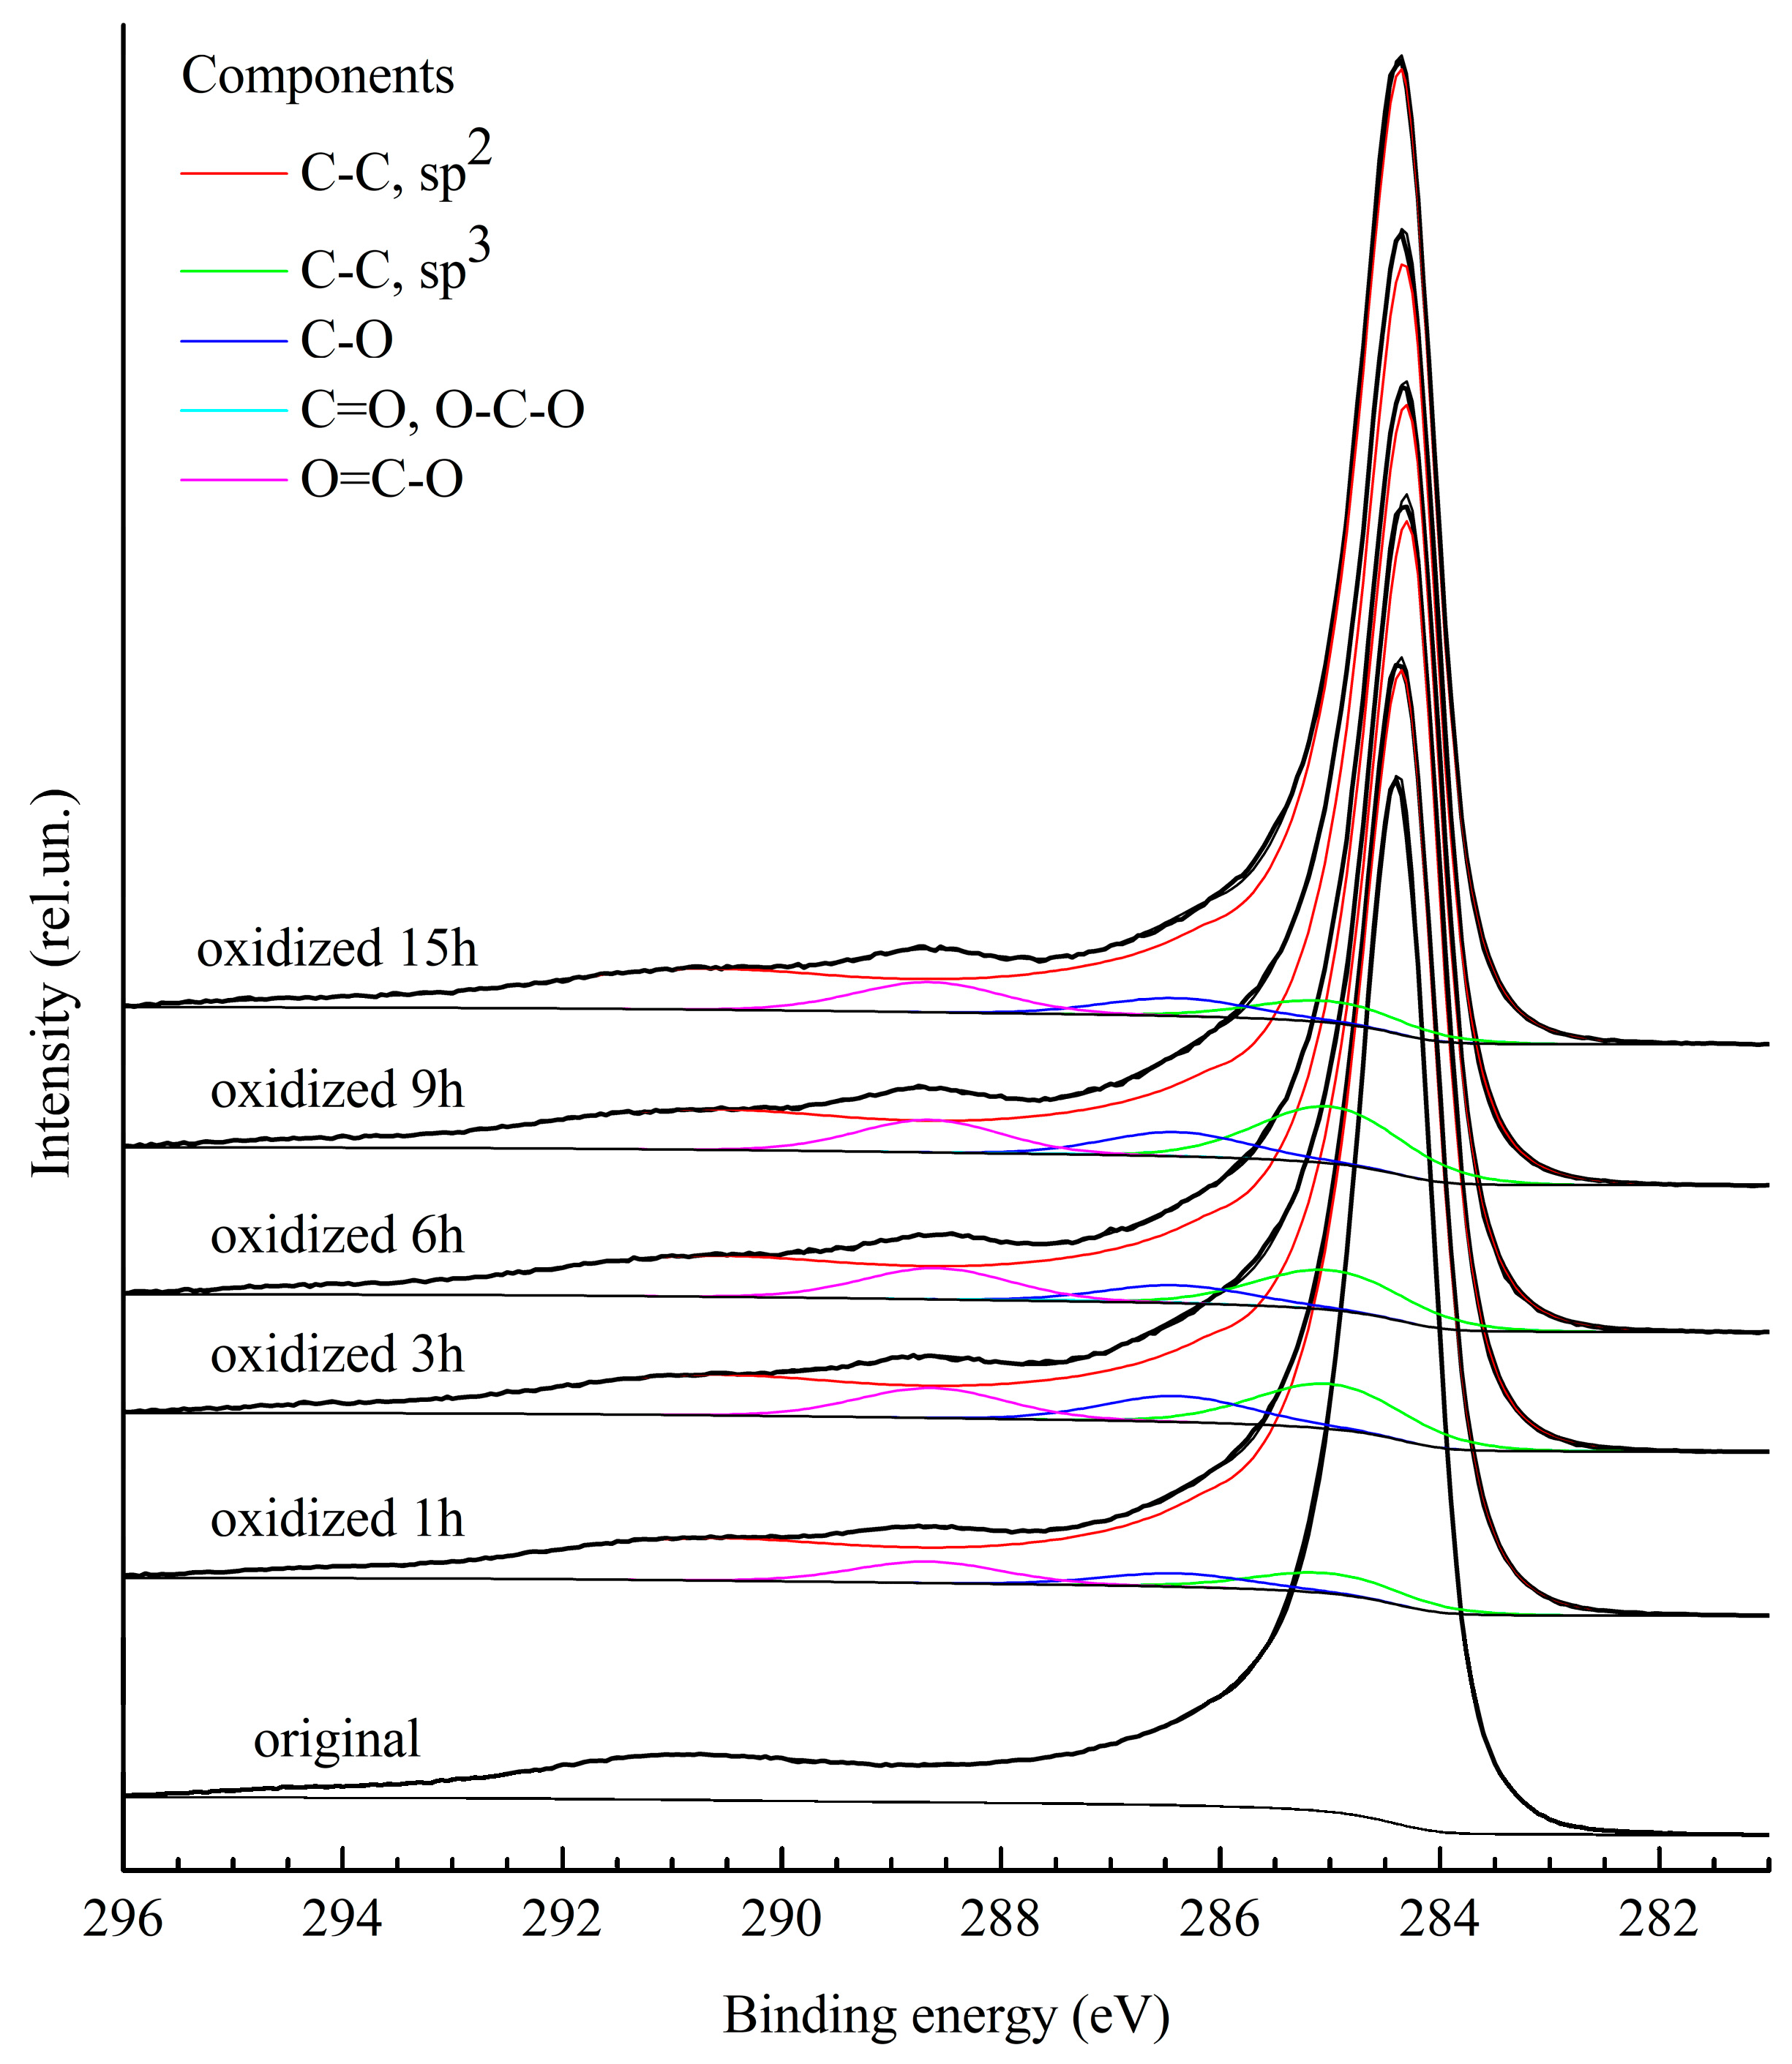
The study of GO samples reduced at different temperatures indicated the presence of C–O bonds at an annealing temperature of 1000 °C (see
Figure 3). The deciding influence of oxidation on the electronic properties of samples is manifested at annealing temperatures below 200 °C. In this case, the π plasmon peak is absent in spectra. At higher annealing temperatures, π plasmon effect on the
ωin(∆) is observable. This contribution increases as the annealing temperature is increased to approximately 600 °C. A further increase in the annealing temperature to 1000 °C does not significantly change the
ωin(∆) (see
Figure 4). At annealing temperatures exceeding 600 °C, the
ωin(∆) is close to that for pyrolytic graphite, for which XPS spectra are presented in [
33]. Note that the characteristics determined here on the basis of XPS spectra relate to the surface layer of a sample at approximately the nanometer scale, which corresponds to the mean free path for inelastic scattering.
In contrast to GO, the oxidation of CNT does not influence the electron structure of samples and does not change the characteristic energy loss. In other words, the honeycomb structure of CNTs is not affected by additional chemical bonds. Only chemical shifts in the peaks formed by the electrons escaping in vacuum without inelastic energy losses are observable.
Three approaches have been presented for PES analysis of XPS spectra for the determination of the properties of a sample from the ωin(∆). The first two methods are the most useful for technological applications due to the ease of realization and enabling the determination of the real xin(∆), respectively.
One should note that from the PES spectrum in
Figure 2 shows that both the position and the shape of π plasmon peak do not change in the course of the oxidation of nanotubes. In this case, the
ωin(∆) deconvolution procedure is not required.


 ,
, 


