

A Brief Review of FT-IR Spectroscopy Studies of Sphingolipids in Human Cells

1
Dipartimento di Matematica e Fisica, Università della Campania “Luigi Vanvitelli”, 81100 Caserta, Italy
2
Dipartimento di Medicina Sperimentale, Università della Campania “Luigi Vanvitelli”, 80138 Napoli, Italy
*
Author to whom correspondence should be addressed.
Biophysica 2023, 3(1), 158-180; https://doi.org/10.3390/biophysica3010011
Submission received: 12 December 2022
/
Revised: 21 February 2023
/
Accepted: 23 February 2023
/
Published: 2 March 2023
(This article belongs to the Special Issue State-of-the-Art Biophysics in Italy)
Abstract
:In recent years, sphingolipids have attracted significant attention due to their pivotal role in cellular functions and physiological diseases. A valuable tool for investigating the characteristics of sphingolipids can be represented via FT-IR spectroscopy, generally recognized as a very powerful technique that provides detailed biochemical information on the examined sample with the unique properties of sensitivity and accuracy. In the present paper, some fundamental aspects of sphingolipid components of human cells are summarized, and the most relevant articles devoted to the FT-IR spectroscopic studies of sphingolipids are revised. A short description of different FT-IR experimental approaches adopted for investigating sphingolipids is also given, with details about the most commonly used data analysis procedures. The present overview of FT-IR investigations, although not exhaustive, attests to the relevant role this vibrational technique has played in giving significant insight into many aspects of this fascinating class of lipids.
1. Introduction
Lipids are a heterogeneous organic group of biomolecules that are insoluble in water due to the hydrocarbon nature of a large part of their structure. Lipids have several essential biological functions: they represent structural components of membranes, they serve as storage and transport for energy-rich molecules, they act as a protective coating on the surface of many organisms, and they also participate in recognition of specific characters. Some of them have significant biological activity, usually typified by vitamins and hormones. Although lipids are a distinct class of biomolecules, they are often bound with components of other biomolecules to form hybrid molecules, such as glycolipids containing carbohydrates, lipids, and lipoproteins, which contain lipids and proteins. In these biomolecules, their components’ characteristic chemical and physical properties mix to perform specialized biological functions [1,2,3].
Recently, sphingolipids (SLs) received significant attention due to their multiple roles in cellular functions, such as cell migration and adhesion, formation of membrane domain, DNA damage response, senescence, aging autophagy, and apoptosis. SLs also have fundamental functions in cancer cell biology, diabetes, cardiovascular diseases, neurodevelopment, neurodegeneration, and in biological processes related to tissue and bones [4,5,6,7,8,9,10,11,12,13,14,15,16,17,18,19,20,21]. Given the relevance of this class of lipids, many different experimental techniques have been exploited for their characterization. Thin-layer chromatography (TLC), high-pressure liquid chromatography (HPLC), gas chromatography (GC), and capillary electrophoresis (CE) are the most primarily used techniques used to characterize the structural diversity of SLs [5,22,23]. These techniques have allowed for the development of a sphingolipidomics approach in which quantitative structural analysis of all SLs, or at least all members of a substantial subgroup, can be pursued in large samples [5,24,25,26].
Several studies about SLs used methodologies based on NMR and vibrational techniques, such as Raman and Fourier-transform infrared (FT-IR) spectroscopies [22]. This last technique represents a unique tool thanks to its sensitivity in acquiring information on biological samples [27,28,29,30,31,32,33] and the effects of their interactions with external agents [34,35,36,37]. In addition, FT-IR spectroscopy has been also adopted for differentiating between benign and malignant tumors in the colon [38,39], breast tissues [40,41], and prostate [42,43]. The analysis of biofluids (saliva, serum, urine, and blood) represent another interesting field of application of this technique [44,45], even though particular attention should be paid to the contribution of water content that can interfere with the signal coming from the examined samples [46,47].
As far as concerns lipids, great attention has been devoted to the acquisition of infrared spectra of lipids. as is evident from [22,48,49,50,51,52] and the references therein. The huge amount of work performed in this field has made available a certain number of databases dedicated to the FT-IR spectroscopy of lipids and similar compounds. In Table 1, the most cited ones are reported.
Given the potentialities of FT-IR spectroscopy in lipid characterization and quantification, many researchers have adopted FT-IR for investigating particular aspects of SLs and their role in different biological frameworks.
In the present paper, we aim to revise the general characteristics of SLs in human cells and present the main findings of FT-IR spectroscopic studies obtained on these compounds. A short description of different FT-IR experimental approaches adopted for investigated sphingolipids is given, together with some information about the data analysis procedures commonly used in SL studies.
2. General Characteristics of Sphingolipids in Human Cells
SLs are a group of lipids that present a sphingosine (SP) backbone to which a fatty acid and a polar group are bonded. The SP (2-amino-4-trans-octadecene-1,3-diol) is an unsaturated amino alcohol made of three parts: a three-carbon chain containing two alcohol groups and one amino group linked to a long hydrocarbon chain (Table 1). The SP is synthesized from serine and a long-chain fatty acyl CoA and then transformed into ceramides (Cers), phosphosphingolipids, glycosphingolipids, and other species [11]. Cers are the most basic form of SL and are in high concentrations in cell membranes. They are made up of fatty acid chain lengths ranging from 14 to 26 carbon atoms connected to SP via an amide linkage. When the Cers is esterified at the terminal OH group with a monosaccharide or an oligosaccharide, it is a glycolipid, respectively known as cerebroside or ganglioside. If the Cer is instead linked to phosphorylcholine (choline linked to a phosphate group), we have sphingomyelin (SM), the only membrane phospholipid free of glycerol. SM is the most abundant class of SLs in human cells; it is an essential component of the cell membranes, especially in the myelin sheath surrounding neuronal axons.
SLs are common in neural tissue and have an essential role in signal transmission and cell recognition; they also are known as bioactive signaling molecules in physiological reactions and stresses [4]. Some of them, such as Cer, SP, and S1P, in addition to their structural role in cell membranes, play a crucial role in regulating cell growth, differentiation, aging, and apoptosis [12,13,14]. Cers have been proposed to function as pro-apoptotic messengers because they increase the permeability of the mitochondrial outer membrane and contribute to release cytochrome c, which acts as a mediator of caspase activation downstream. SP functions as an extracellular ligand for G protein receptors and a second intracellular messenger to facilitate cell survival [17,18]. A phosphorylated version of SP, sphingosine 1-phosphate (S1P), is a modulator of calcium homeostasis and a regulator of cellular survival, proliferation, and differentiation.
Many investigations have also been carried out on investigating the role of SLs, particularly Cer, S1P, and SM, in regulating tumor growth and response to chemotherapy, radiotherapy, and immunotherapy [53,54,55,56,57]. Recent research has revealed that cancer alters the lipid metabolism in cells, including endogenous lipid synthesis, storage, exogenous biogenesis uptake, and cell membrane function, involving changes in SL structure and properties such as fluidity, stiffness, and membrane dynamics [58]. The increased rate of lipid synthesis in cancer tissues, their role in cancer cell migration and invasion, and their influence in tumor angiogenesis for tumor cell proliferation and metastasis have been considered in [59].
In the presence of many apoptotic stimuli, the SM pathway is activated, causing the accumulation of Cer and SP. Cer has been considered an apoptotic second messenger, while SP has been neglected as a mediator of apoptosis. However, recent investigations report significant hints about the role of the second messenger for sphingosine and the identification of potential factors influencing the mechanism of sphingosine-mediated cell death [60]. Lipid metabolism significantly affects primary tumors and shapes the tumor microenvironment to boost malignancy and dissemination [61]. Cer accumulation dysregulation is a common resistance mechanism to standard cancer treatments [62]. Because they cause cell death via Cer production, Cer synthase and sphingomyelinase are essential targets for γ-radiation and chemotherapy drugs [63,64,65,66]. One example of the oxidative stress induced by ionizing radiation is the transfer of the enzyme acid sphingomyelinase from lysosomes to the outer layer of the cell membrane, which causes SM hydrolysis and Cer formation. Ceramide–cholesterol fusion forms lipid microspheres in the plasma membrane and increases signal receptor clustering (death receptors such as FAS, TNF, CD40, TRAIL, or G protein-coupled receptors) [67,68].
3. Basic Principles of FT-IR Spectroscopy
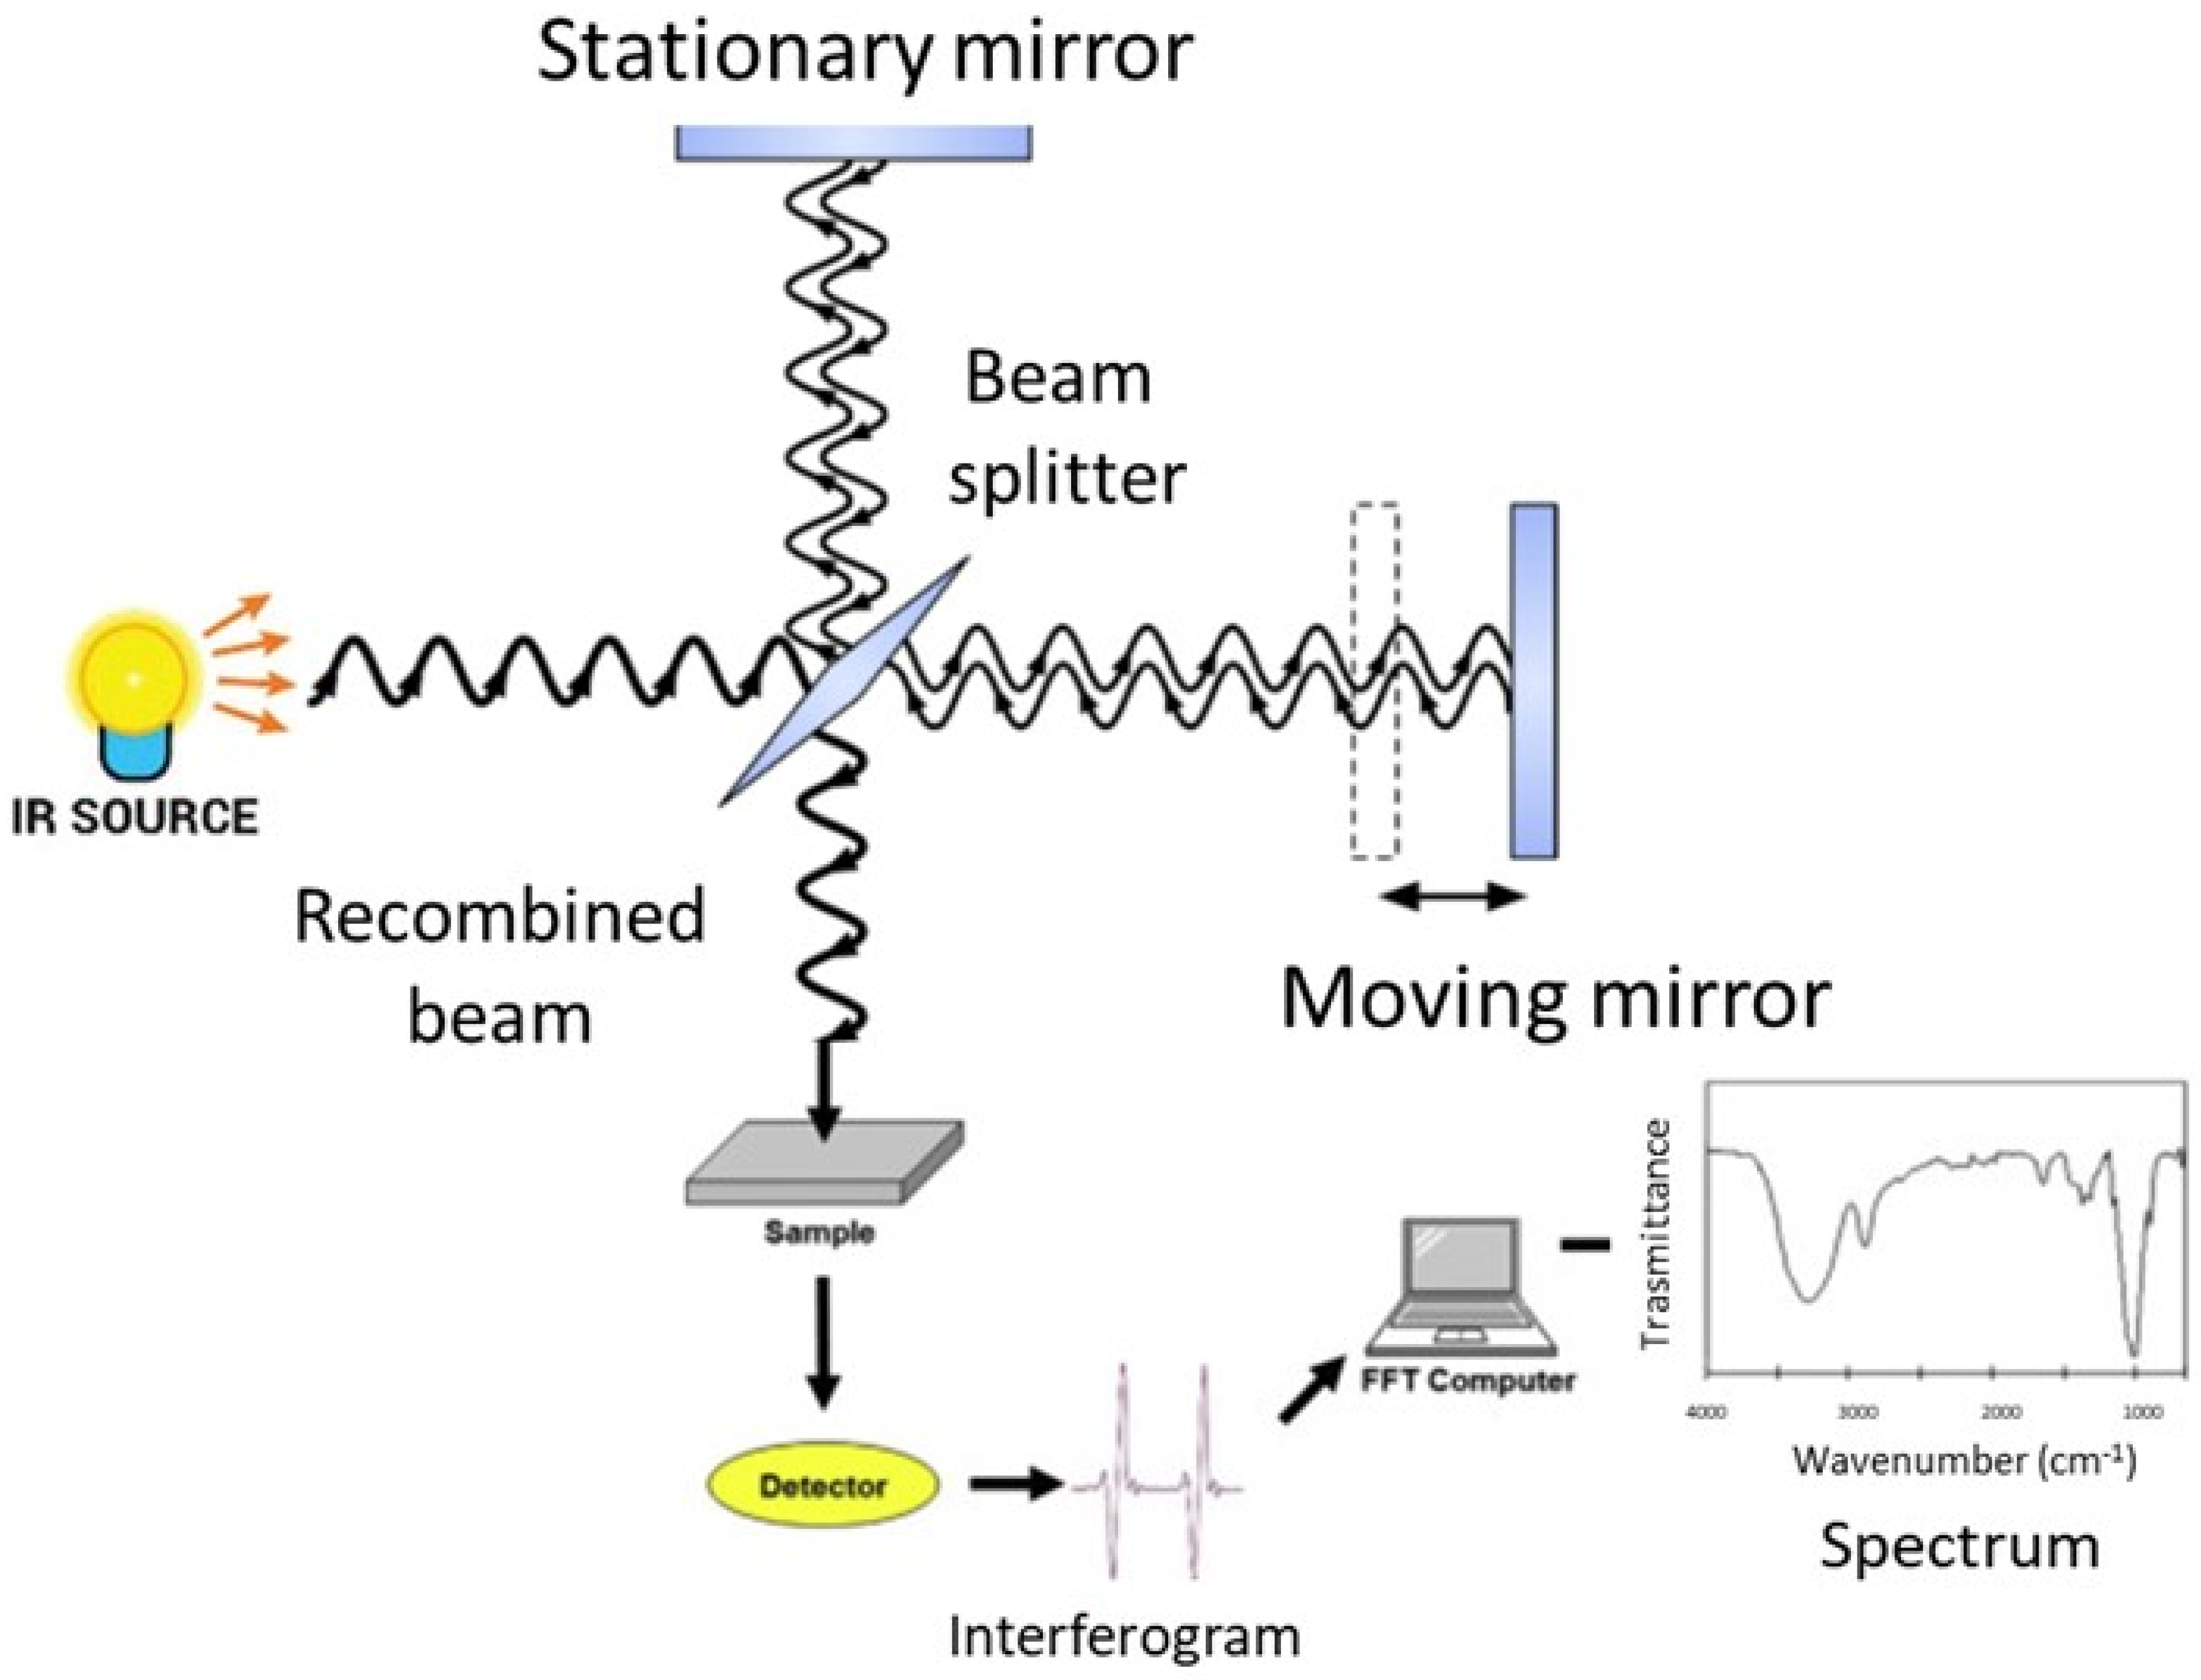
FT-IR spectroscopy analyzes the spectral infrared radiation absorbed by a sample. The energy of the absorbed infrared radiation equates the energy needed to transition between the vibrational states of functional groups. The radiation intensity absorbed by a sample produces the infrared absorption spectrum, in which there are peaks or bands related to a particular mode of the vibrations that is characteristic of functional groups in the sample [27,37]. The main component of a modern FT-IR spectroscopic apparatus is a Michelson interferometer (see Figure 1 and [37] for further details), which substitutes the monochromator that was present in the old infrared spectrometers. FT-IR spectrometers enable the collection of absorption spectra quickly and precisely by obtaining qualitative and quantitative information on the structure of the compounds analyzed using modern software algorithms.
The sample under investigation is positioned in one of the two arms of the interferometer, the frequencies that are related to the excitation of vibrational states of the functional groups of the molecules of the sample are attenuated, and the obtained interferogram is Fourier transformed into an absorption spectrum in terms of the wavenumber, usually given in cm−1.
FT-IR spectrometers offer many advantages compared to traditional infrared ones [28,29,30]. As previously said, the most relevant benefit is the ability to collect spectra in a short time. In fact, the detector can simultaneously analyze and record all frequencies and wavelengths. FT-IR spectroscopy also offers high precision and accuracy in the determination of wavenumbers thanks to the use of the monochromatic radiation of a laser source as an internal standard. Unwanted sample heating effects are excluded since the infrared source is sufficiently far from the sample. Then FT-IR spectra can be obtained from samples at controlled temperatures using proper accessories [69]. The use of suitable cells also allows the acquisition of spectra from samples under different pressures [70]. Moreover, an FT-IR spectrometer can be equipped with a microscope to allow the analysis of samples or parts of samples at the microscopic level [71].
4. Experimental Aspects of FT-IR Spectroscopy
There are three main infrared spectroscopy sampling modes: transmission, reflectance, and attenuated total reflection (ATR), each with advantages and disadvantages [31,72]. For lipid analysis, the most largely used approaches are transmission and ATR modes. For transmission measurements, the samples are placed between two IR transparent windows. Generally, CaF2, BaF2, and KBr windows are used together with a proper sample holder in which the Teflon spacer can obtain the appropriate thickness, typically around 6–10 µm [73]. As an alternative, the samples can be included within a KBr matrix and pressed to form a pellet that can be subsequently analyzed after being dried [74].
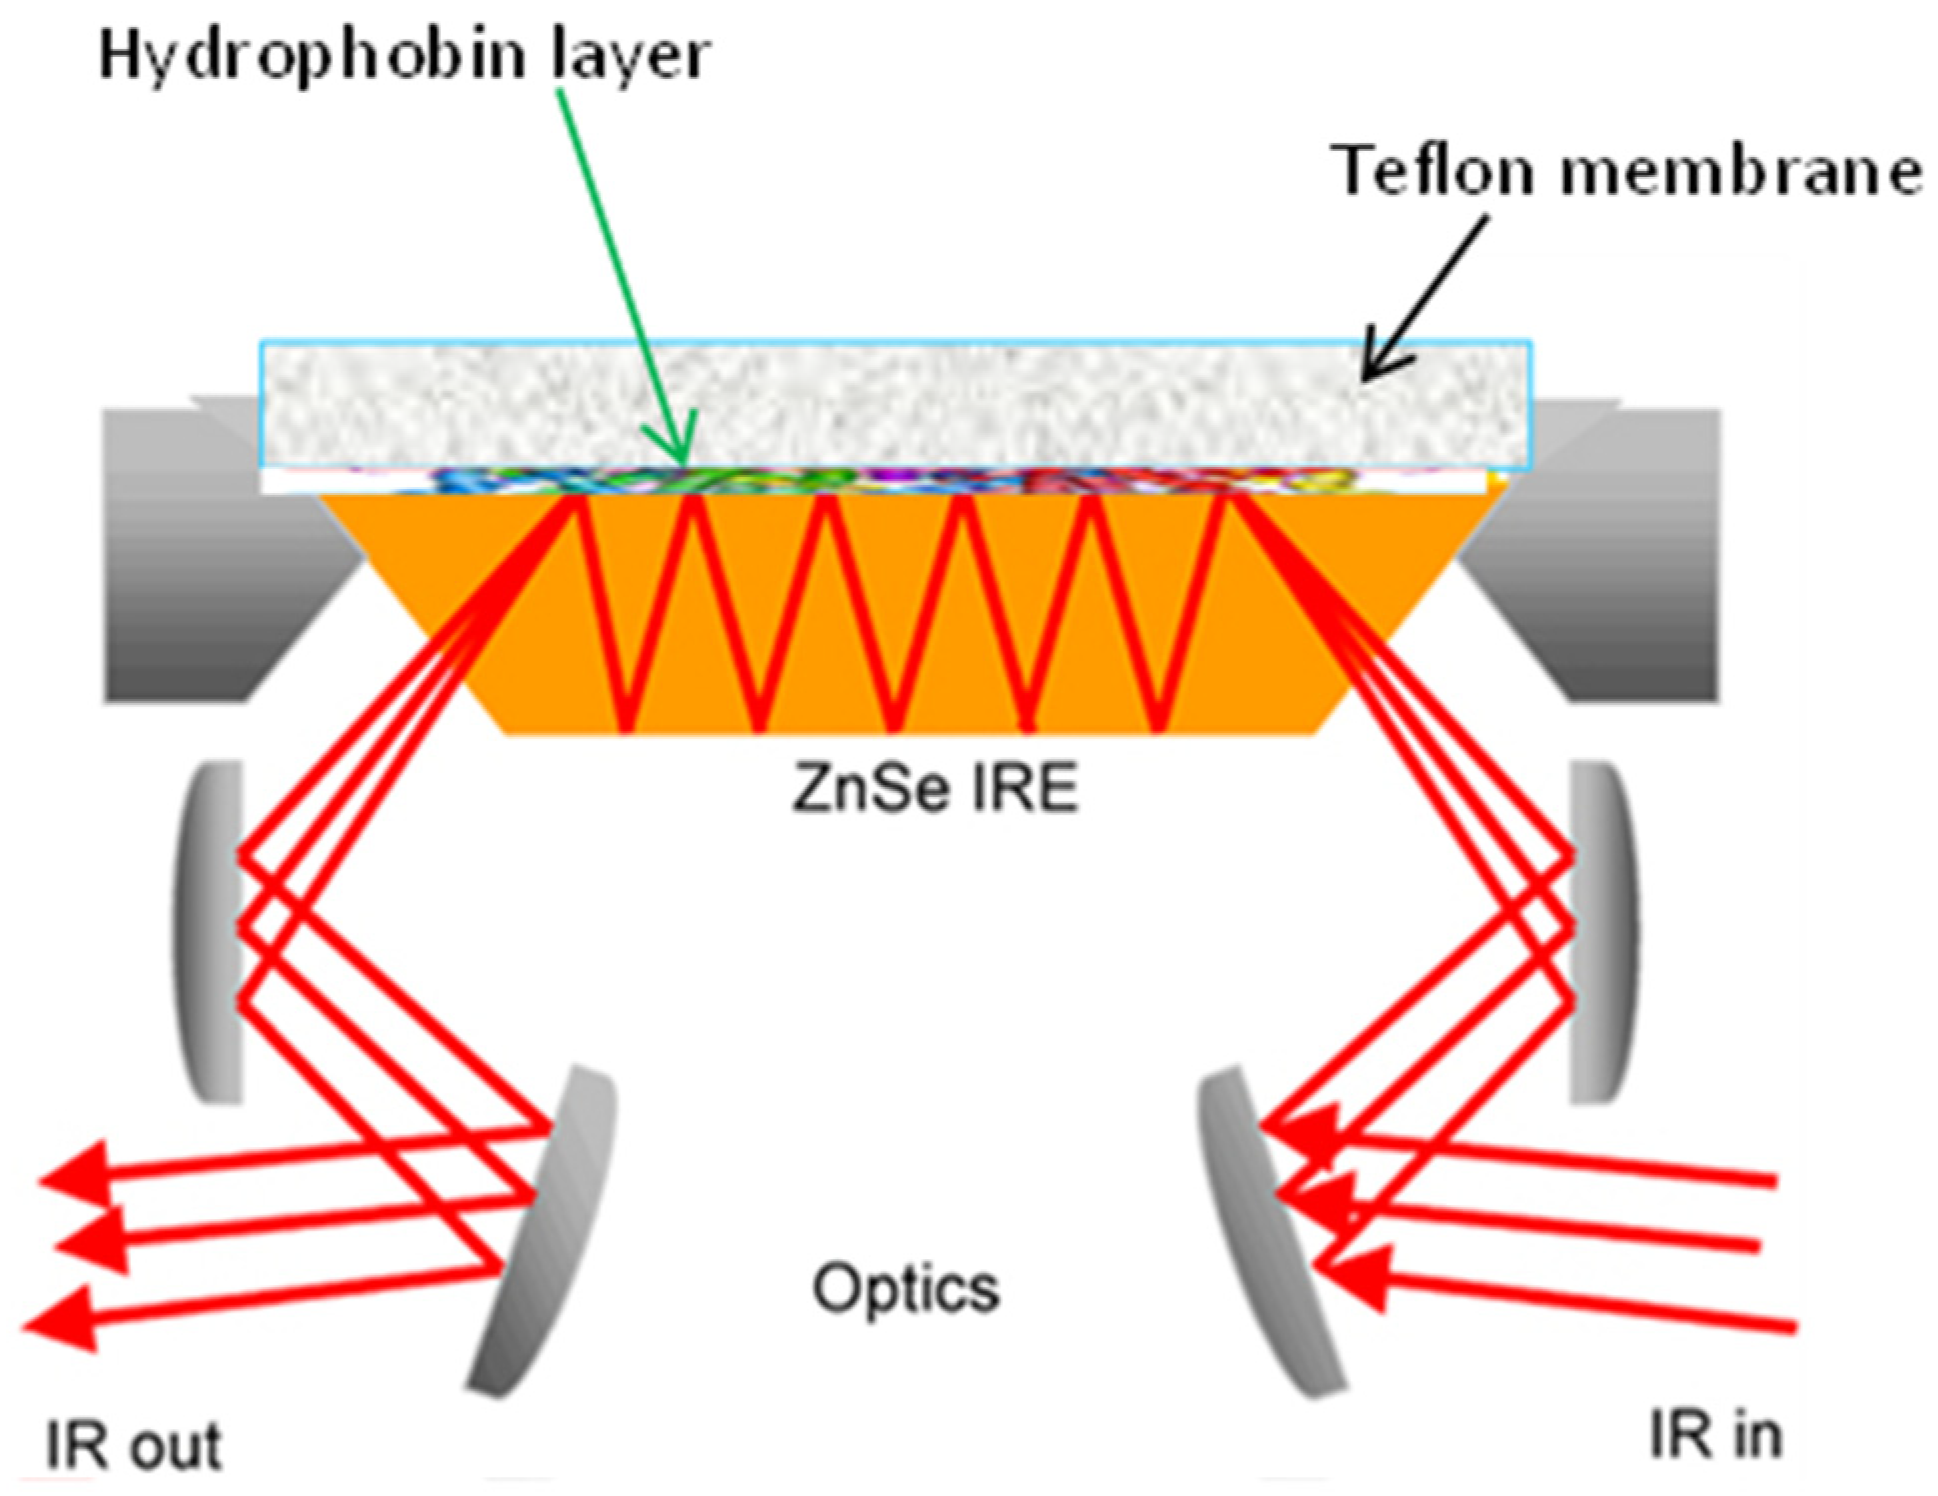
The ATR approach is based on the presence of an evanescent wave at the reflecting interface between the sample and the crystal [75]. When a radiation beam penetrates inside a crystal, and the angle of incidence at the interface between the sample and crystal is greater than the critical angle, which is given by the refractive indices of the two surfaces, the beam penetrates a fraction of a wavelength beyond the reflecting surface, and when it comes into close contact with a material that selectively absorbs radiation, the beam loses energy at the wavelength where the material absorbs. The spectrometer measures and plots the attenuated radiation as a function of the wavelength, yielding the sample’s absorption spectral characteristics. ATR employs crystal materials, such as diamond, ZnSe, and ZnS, in contact with the sample under investigation. A typical configuration for ATR equipment is reported in Figure 2. A pressure plate is needed to ensure the connection between the samples and the crystal. Except for diamond objectives, excessive pressure can harm some crystals [76,77].
Fringeli and Gunthard, in their pivotal paper about infrared spectroscopy, demonstrated that the ATR approach offers many advantages in studying lipids [79]. For this acquisition geometry, a drop of a few microliters of lipid extract is deposited on the crystal and evaporated under a gaseous N2 flow to form a thin film. This way to acquire measurements is fast and able to give a strong signal with a small sample quantity. In addition, it enables for obtaining information about the orientation of various parts of the molecule under investigation in an oriented system [75,80].
5. Data Analysis Procedures
Data preprocessing has been identified as essential in biomedical spectroscopy’s effective data analysis workflow. It includes background subtraction, scattering effect removal, and normalization procedures. Regarding background subtraction, a background spectrum must be acquired without a sample to consider the effects due to the instrument and the environment. As said before, particular attention should be given to water vapor, which is responsible for the characteristic bands around 3500 cm−1 and 1630 cm−1, and carbon dioxide, which is responsible for the bands at 2350 cm−1 and 667 cm−1 [46,47,81]. Another critical step in the preprocessing procedures of FT-IR spectra is removing scattering effects that can occur during the interaction between infrared radiation and samples. When the scattering causes the loss of a significant portion of the light, data interpretation does become problematic because it is arduous to determine whether the signal at a given wavelength decreases due to scattering or chemical absorption. When the wavelength of the electromagnetic wave has a value similar to the size of the scatterer, the amount of radiation power lost due to scattering is very large. The scattering is known as Mie-type scattering when the scatterer has spherical symmetry. An intense Mie scattering alters the spectra of single cells and tissues in infrared spectroscopy. These artifacts can be removed using good algorithms, such as the ones proposed in [82,83]. Normalization procedures represent a class of data treatments for scaling spectra in a similar range. This method is commonly used to reduce the effects of different optical paths on data or compensate for source intensity changes while indicating one of the possible causes [84]. After data preprocessing, different approaches can be used to analyze the FT-IR spectra in detail. Procedures for spectra deconvolution are primarily used and allow for the individuation of the main vibrational modes that are present in the spectrum. Typically, Gaussian and mixed Gaussian–Lorentzian functions are adopted in the case of FT-IR spectra. The components’ spectral positions, intensities, and widths are evaluated via a fitting procedure [34,35,36].
In some cases, the second derivative of the spectrum is also performed to preliminarily evaluate the local minima corresponding to the vibrational modes [85]. In addition, univariate and multivariate data analysis procedures are primarily used for FT-IR spectra analysis [35,86,87]. In the investigation of FT-IR lipids, the evaluation of the ratios between the intensity or the band area values of chosen spectral components has been largely used for investigating the effects of interactions with external agents [36,88,89,90,91].
6. FT-IR Characterization of SLs
Before discussing the principal results reported in the literature about FT-IR studies on SLs, it is worthwhile to mention the fundamental paper of Fringeli and Gunthard [79] that provides the basis for all subsequent studies about lipids components in biological samples. Some other authors give relevant contributions in this field [75,80,92,93,94]. In Table 2, an almost exhaustive list of the peaks present in lipid samples is reported together with their assignments.
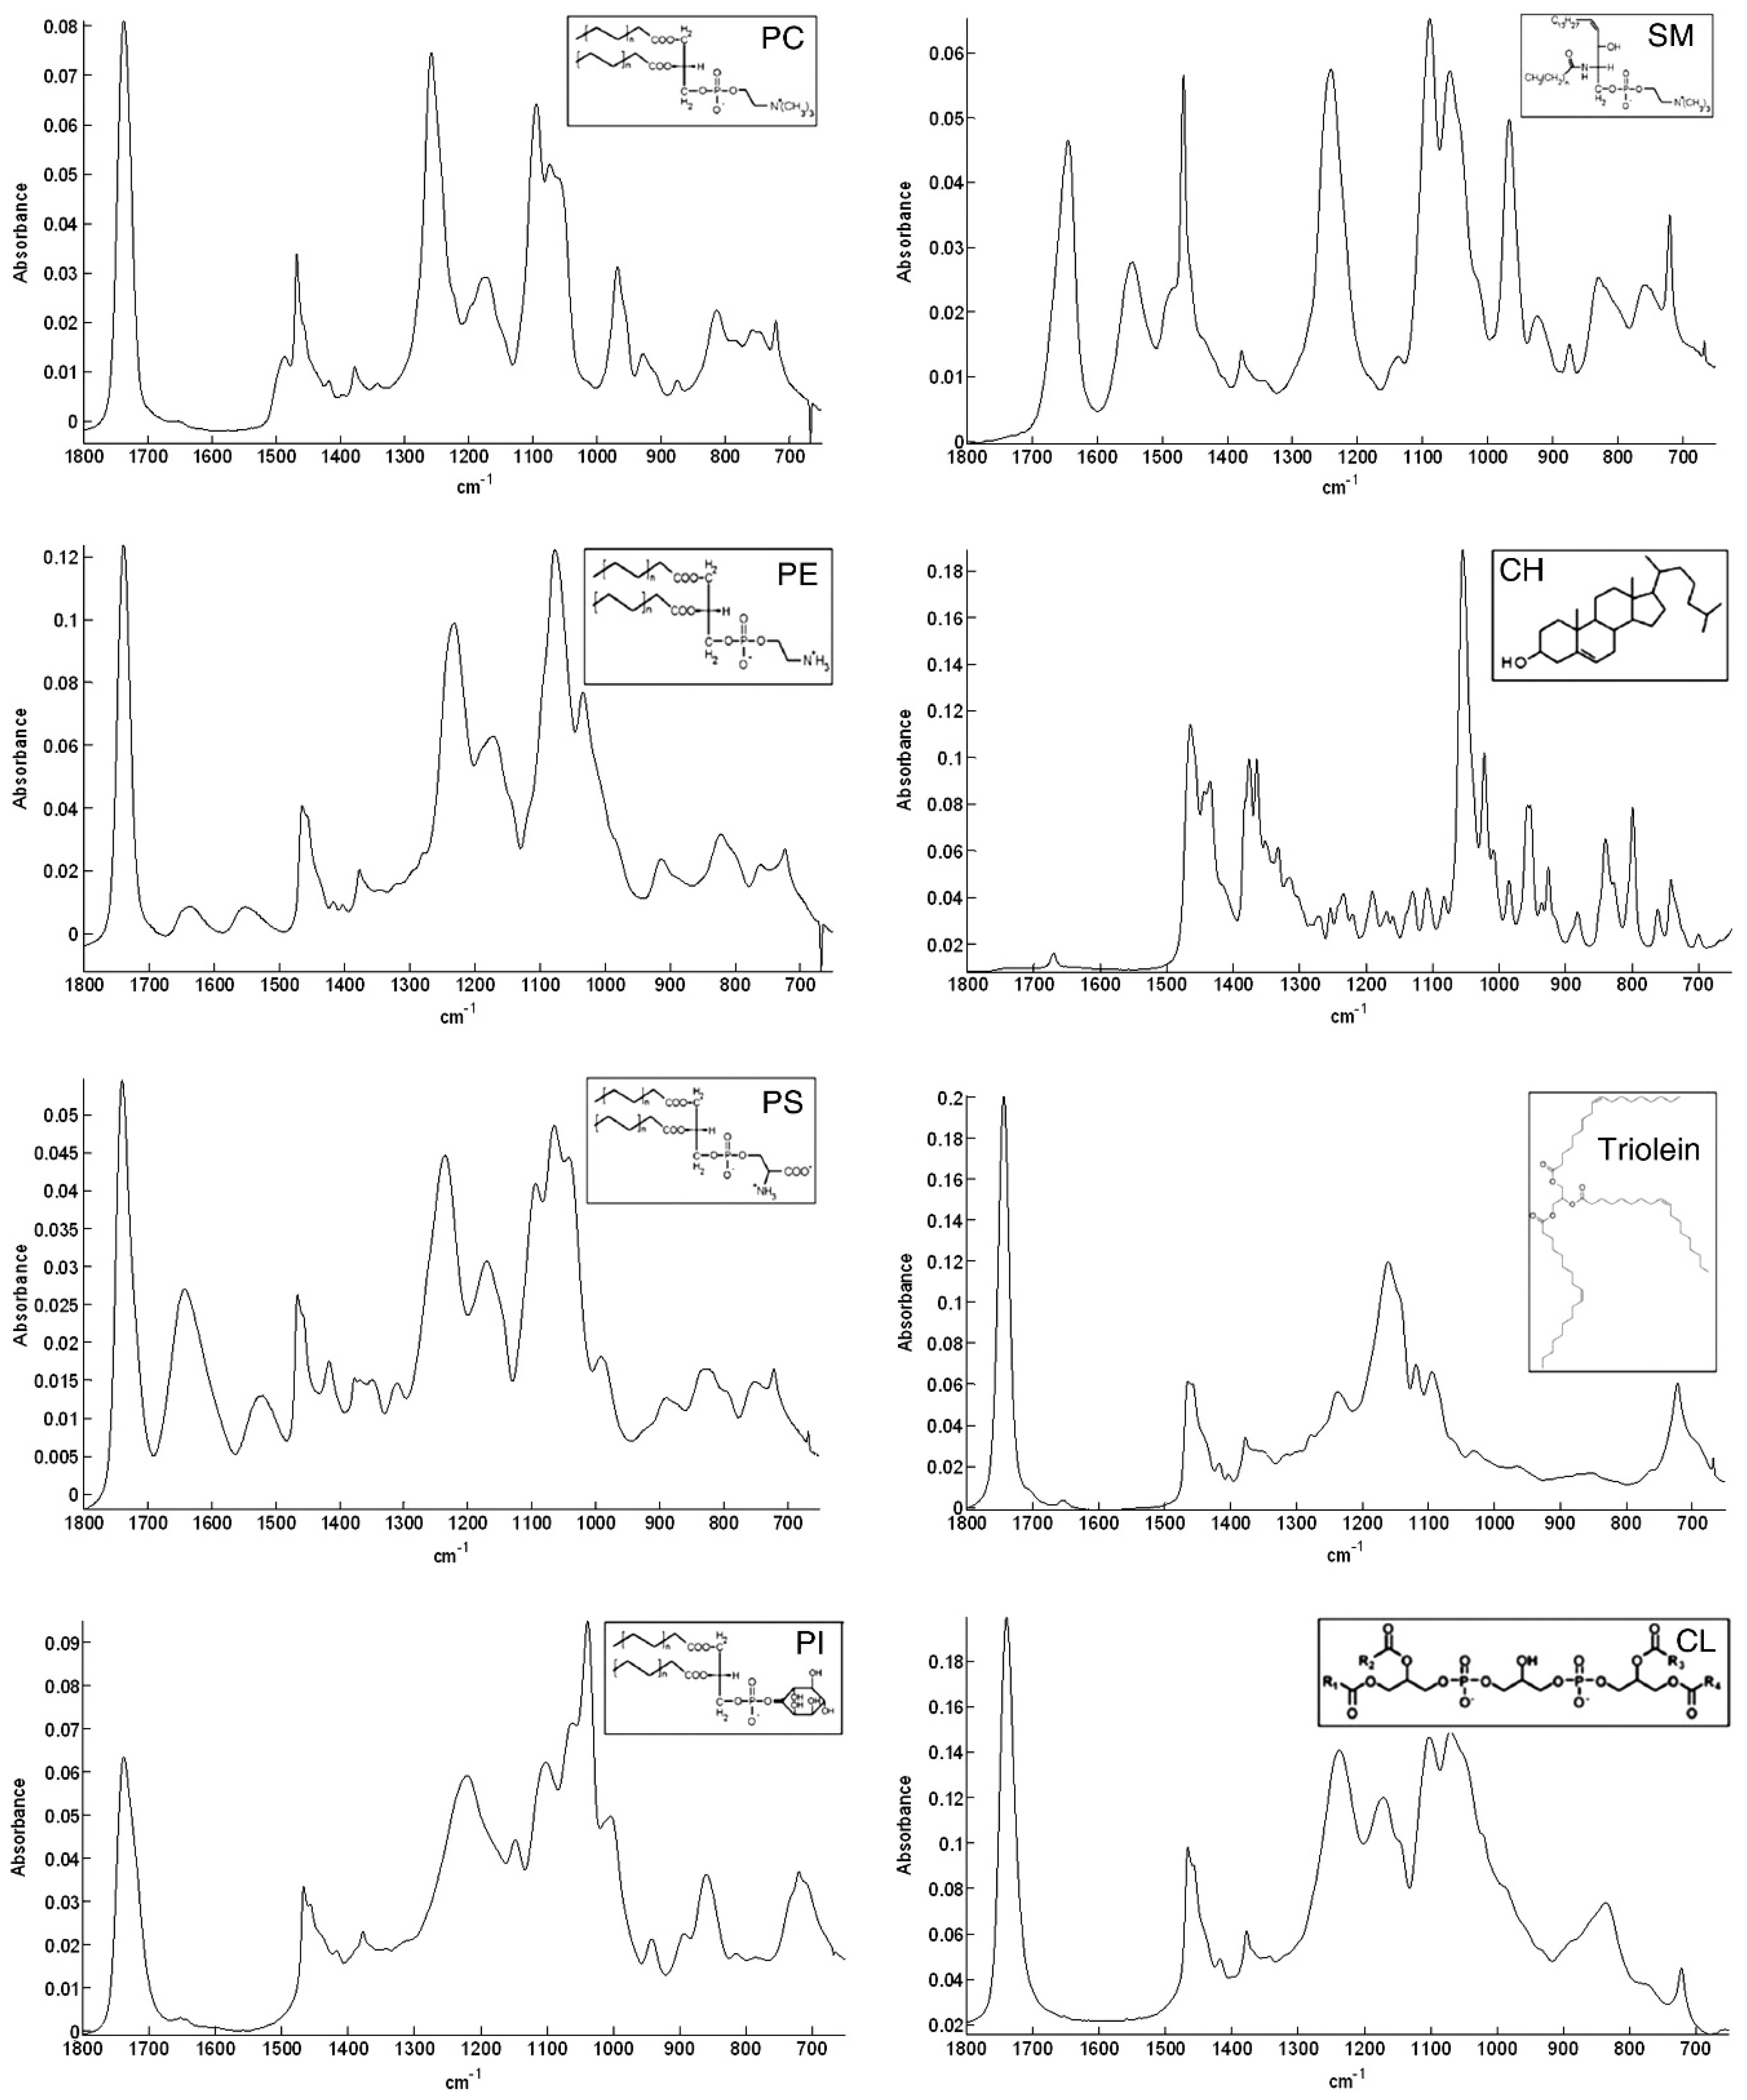
The spectra of different membrane lipids include two different regions; the high wavenumber part of the spectrum (3100–2800 cm−1) that only contains C-H stretching vibrations and originates mainly from hydrocarbon chains and the low wavenumber region of the spectrum (below 1800 cm−1) that is mainly associated to the polar headgroups of lipids. In Figure 3 this region is reported for different membrane lipids.
The C-H stretching bands in the lipid carbon chain region are related to different vibrational modes (see Table 3 for details). This region is interesting to study because there is no overlap with other vibrational modes; even in complex systems such as the biological samples, it is independent of the polar headgroups, and can give information about the structure of the hydrocarbon chain. In fact, lipid phase transition can be investigated by monitoring the features (position, intensity, and width) of the bands present in this region [95]. The range associated to the lipid polar headgroup allows for the identification of the different lipids, as evident in Figure 3, in which FT-IR spectra of commercial samples of different cell membrane lipids are reported. Among these lipid spectra, there is the one of SM. The most relevant contributions in this region are related to the C=O stretching mode positioned around 1740 cm−1 and the phosphate group near 1240 and 1080 cm−1 for the antisymmetric and symmetric modes, respectively. It is worth noting that below 1800 cm−1 each lipid molecule has a distinctive FT-IR spectrum. This characteristic has been exploited to identify the various components in lipid mixtures [96].
Figure 3.
ATR spectra of different membrane lipids (phosphatidylcholine (PC), 1,2-dioleoyl-sn-glycero-3-phosphoethanolamine (PE), phosphatidylserine (PS), phosphatidylinositol (PI), sphingomyelin (SM), cholesterol (CH), triolein, and cardiolipin (CL)) between 1800 and 800 cm−1 [reproduced with permission from [96]].

FT-IR spectroscopy has been largely used for investigating several aspects of SL characteristics and functions; it would be very hard work to try to summarize all the number of contributions that can be found in the literature. For this reason, we prefer to present a brief synopsis of some papers concerning SM, Cer, SP, and S1P that can contribute to evidence of the pivotal role of FT-IR spectroscopy in this field.
- (a)
- Sphingomyelin (SM)
In Table 4, some significant papers on sphingomyelin are briefly summarized in chronological order. As far as concerns the class of investigated samples, commercial ones have been used in many cases. For some studies, lipids extracted from cells and tissues have been adopted. In these cases, Bligh and Dyer as well as Folch methods have been used [97,98]. Further details on the lipid extraction methods are reported in Appendix A. Regarding the FT-IR geometry adopted for spectra collection, it is possible to notice that both transmission and ATR approaches have been used. For transmission measurements, in a large number of cases, CaF2 windows have been used even though KBr pellets have shown also to be useful.
The paper of Villalain et al., cited in Table 4, is particularly interesting due to the joint use of differential scanning calorimetry and FT-IR spectroscopy to investigate the molecular interactions between PC and SM. The authors observed that no significant change in the wavenumber position for the antisymmetric and symmetric CH2 stretching is present when SM is added to PC at temperatures above or below the phase transition and then they demonstrated that the gauche ratio to all-trans is not affected by SM and PC interaction. The authors also examined the characteristics of the C=O stretching band of PC located at 1735 cm−1, evidencing that the phosphate group of SM takes part in hydrogen bonding between the molecules of SM and possibly PC. Particular attention was also given to the Amide I contribution at 1635 cm−1 and to bands related to the phosphate group and located at 1220 and 1080 cm−1 [99].
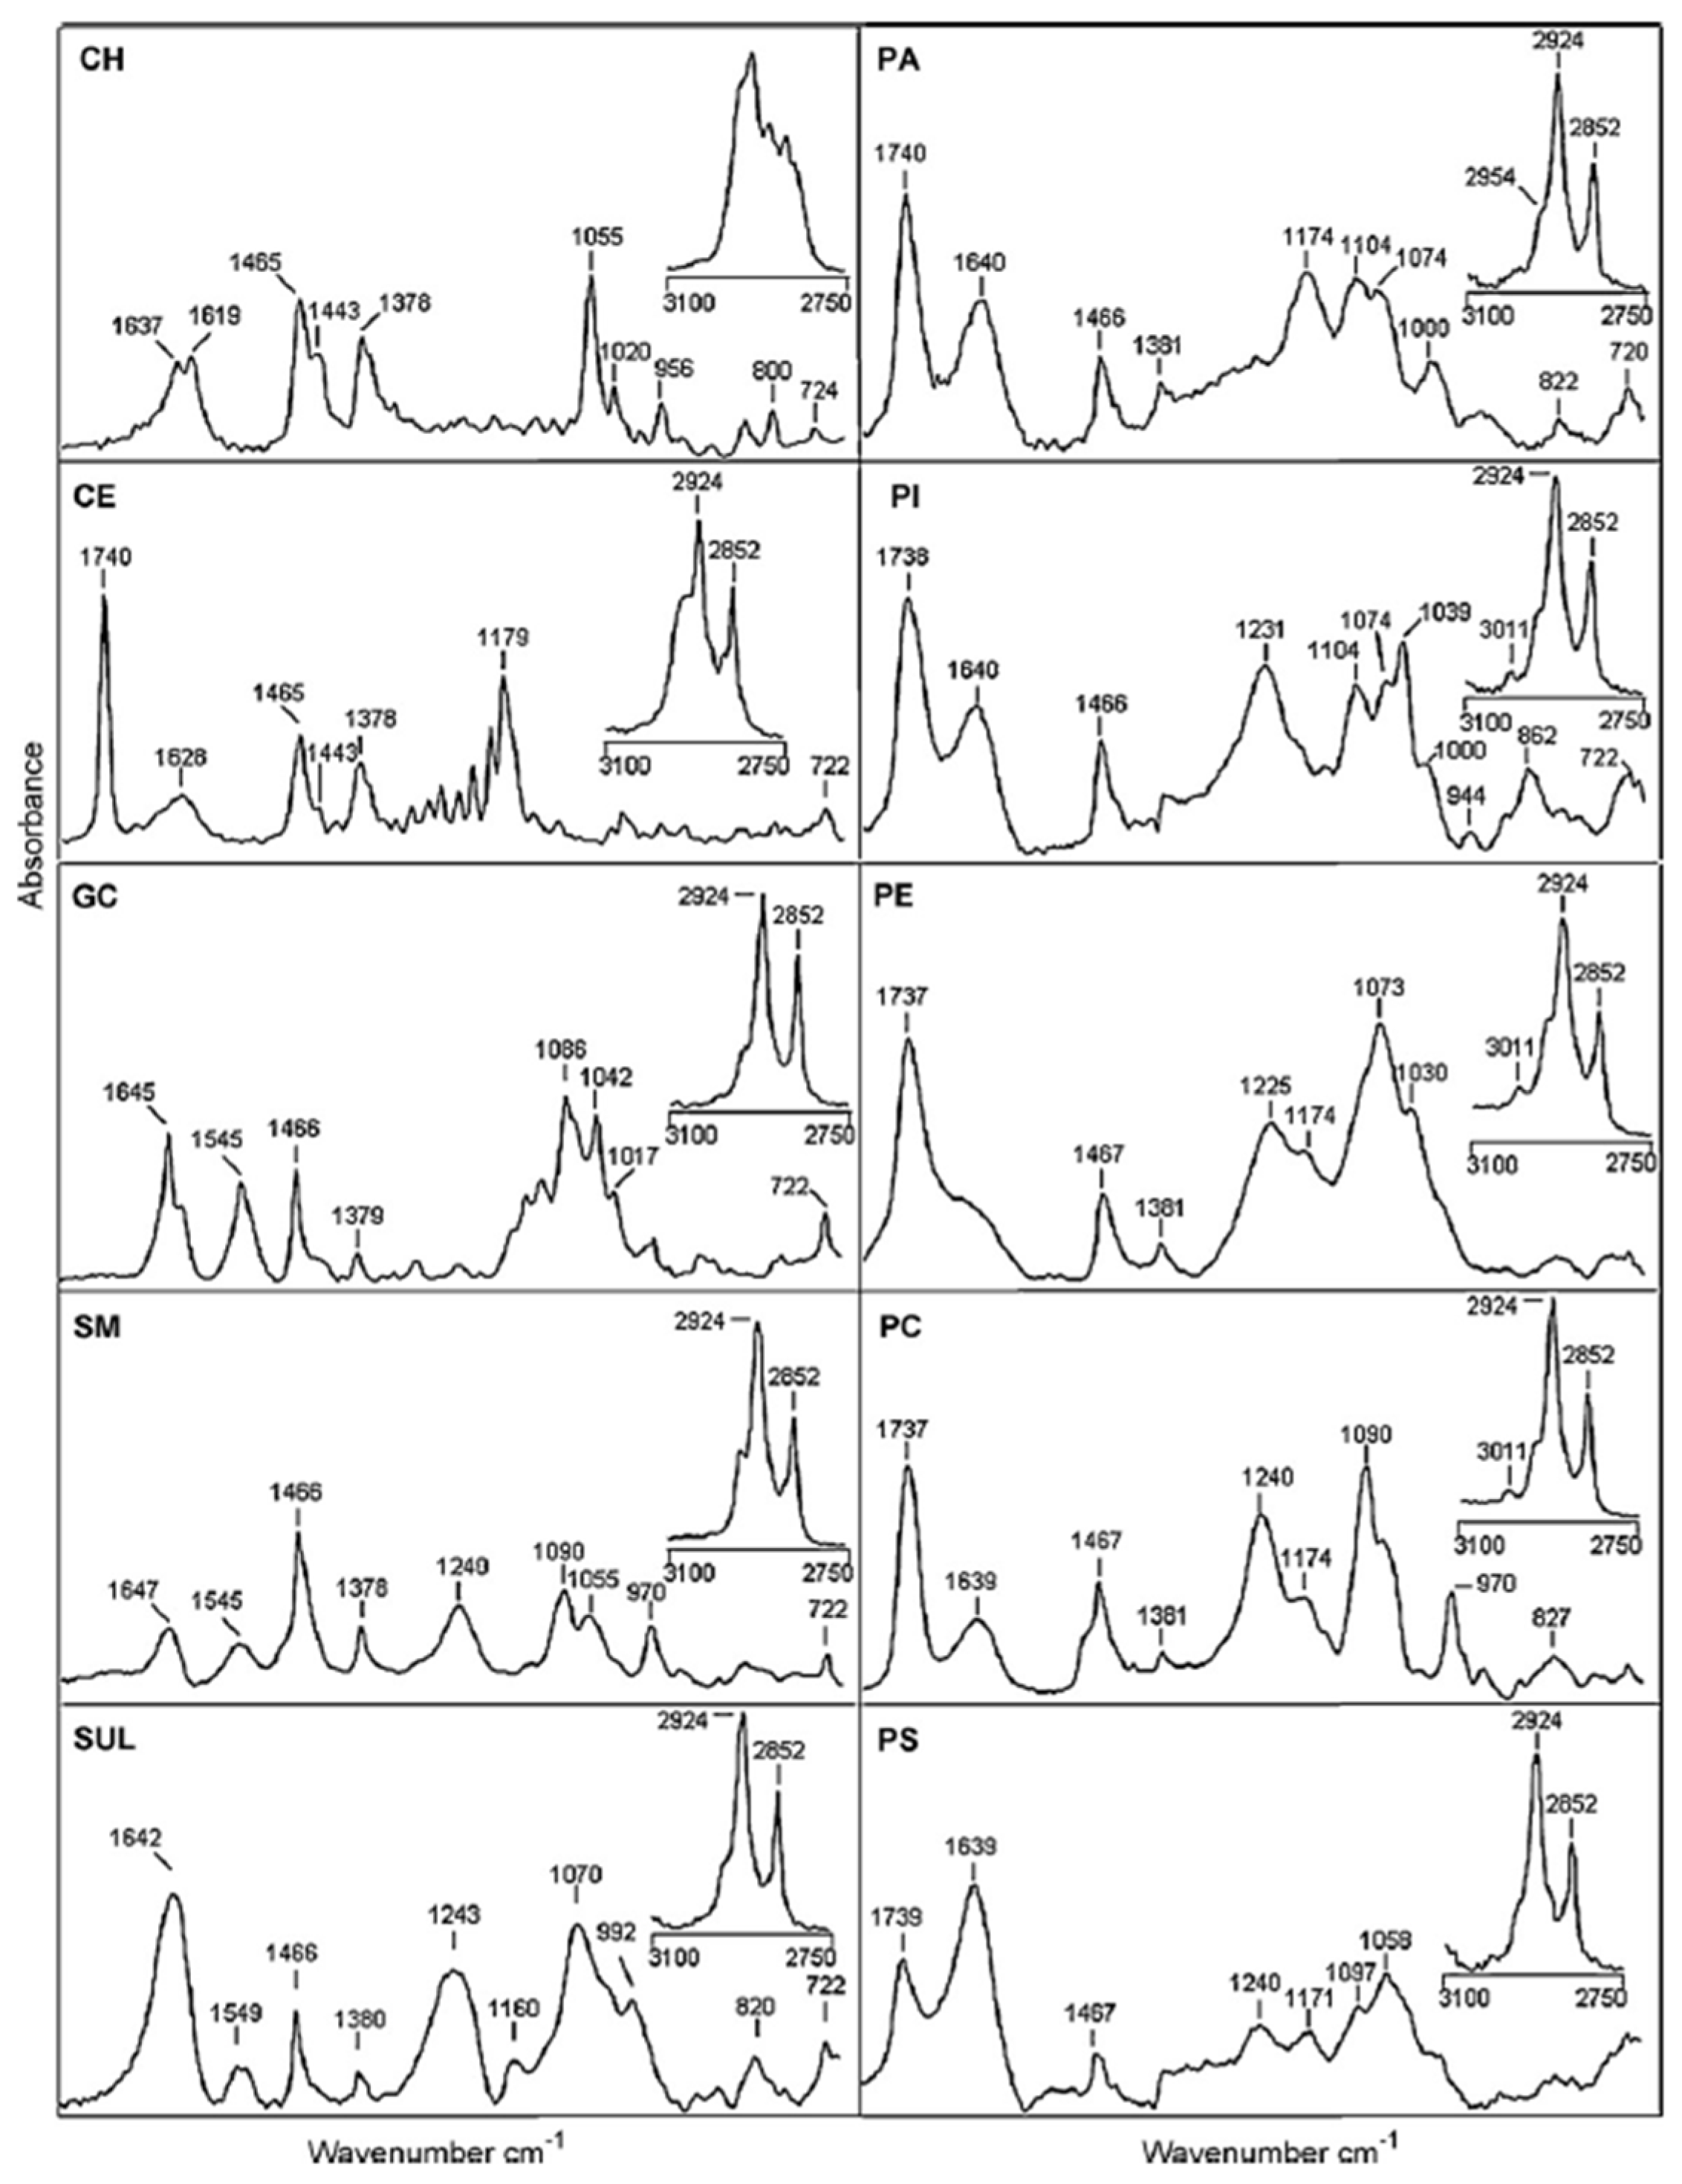
Dreissig et al. investigated the different SLs and phospholipids that are present in lipids extracted from the porcine brain. They presented the FT-IR spectra of some SLs, phospholipids, and neutral lipids (see Figure 4). If SM spectrum is considered in detail, it is possible to recognize the contribution of different vibration modes reported in Table 3 and in Table 2 of [103]. In the high wavenumber region related to hydrocarbon chains, peaks related to CH2 asymmetric and symmetric stretching are positioned at 2924 and 2852 cm−1, respectively. In the spectral region related to the lipid polar headgroup, contributions attributed to C=O stretching (1647 cm−1), N-H bending (1545 cm−1), CH2 bending (1466 cm−1), CH3 symmetric bending (1378 cm−1), PO-2 asymmetric stretching (1240 cm−1), PO-2 symmetric stretching (1090 cm−1), and C-O-C stretching (1055 cm−1) can be noticed. In [103], the authors examined the difference in band position and intensities in the spectra of the different commercial samples. They also prepared lipid mixtures to train and validate a quantification model for determining the composition of brain lipid extracts. The results of the PLS regression of FT-IR spectra were successfully related to the lipid quantification obtained by using TLC. Even though the FT-IR spectroscopic approach presented in this paper cannot be generally used for the quantitative analysis of all lipids, it might contribute to the diagnosis of brain tumors by evaluating the changes occurring in the lipid composition of tumor cells [103].
The papers of Gasper et al. [104,105] represent a typical example of the use of FT-IR spectroscopy for studying the effects of drugs on SLs, a topic largely investigated by using this vibrational technique. In the present case, the authors aim to examine the number of changes in lipids in PC-3 cells exposed to sub-lethal levels of ouabain, a well-known cardiotonic steroid that demonstrates an anti-cancer activity in vitro and in vivo that indicates the possibility of adopting these compounds as chemotherapeutic agents in oncology. The authors examined the difference spectra obtained between the average spectra for lipid extracts related to different experimental conditions. In Figure 4 of [104], three curves are reported: the first is related to the changes occurring in the first 6 h after the treatment, the second is related to the changes between 24 and 6 h of treatment and the last one concerns the changes between 36 and 24 h of treatment. The most relevant changes for lipids are present between 6 and 24 h. Principal component analysis (PCA) was also performed for evaluating the differences among the FT-IR spectra related to different experimental conditions. According to the findings of [104,105], FT-IR spectroscopy not only detects cellular changes caused by ouabain but also qualitatively assesses the evolution of these alterations during therapy. Ouabain’s overall biological effect on PC-3 cell lipids increased SM and decreased PC [104,105].
A particularly interesting aspect of FT-IR spectroscopy is related to the possibility of its use for the quantitative determination of a single component in a mixture. This possibility has been evidenced by the paper of Derenne et al. [96], which developed PLS algorithms for quantifying lipids in complex mixtures of lipids. The lipid composition obtained via FT-IR spectroscopy was first validated by using HPLC and used for determining the lipid composition of lipids extracted from cells exposed to four different drugs. These treatments did not cause significant changes in the polar headgroups’ spectral region. However, the authors suggested that their PLS models appear to be reliable and can be helpful for routine analysis [96].
- (b) Ceramide (Cer)
In Table 5, some papers related to the study of the properties and functions of ceramide (Cer) have been reported. Additionally, for Cer, commercial samples have been used in the largest number of cases, and measurements have been performed using both ATR and transmission geometries.
Moore et al. [108] investigated the conformational order and phase behavior of hydrated Cers to provide the first complete investigation of the intermolecular and intramolecular chain and headgroup interactions in hydrated non-hydroxy fatty acid (NFA) and hydroxy fatty acid (HFA) Cers. In particular, the authors examined the temperature dependence of the methylene stretching, scissoring, and rocking mode frequencies. This study indicates the occurrence of two relevant phase transitions, one around 60 °C and the other around 80 °C. The behavior of the Amide I and II modes shows different contributions from NFA and HFA Cers. The results reported in this paper were also of relevance to the domain mosaic model of the stratum corneum lipid barrier that was proposed in the seventies of the last century.
Another paper addressing the analysis of the conformational order of Cer by using FT-IR spectroscopy is reported in [114]. In addition, these authors investigated the dependence on temperature of the conformational stability of Cers. They studied different Cers and mixtures and polar–nonpolar lipid interactions. Their study evidenced the impact of the polar headgroup on the conformation of the hydrocarbon chains when the temperature increases, with the role of the endogenous molecules also being more prominent.
More recently, de Arada et al. [118] used FT-IR spectroscopy to examine the interactions of polar headgroups from Cers and SM. These authors studied four regions of the FT-IR spectra of these compounds: C-H stretching and CH2 scissoring vibrations, the Amide I region, and the phosphate vibration range. The study of the two latter areas was the novelty of the de Arata et al. paper. The temperature dependence of hydrated samples of pure SM and SM–Cer mixtures was examined and compared with the results of differential scanning calorimetry measurements. The data from the hydrocarbon chain region show a transition in agreement with previous observations. The results related to the Amide I region are more interesting since they evidence that SM and Cer carbonyl groups strongly interact, probably through H bonds. Furthermore, the results pertaining to the phosphate group suggest a relevant role of H bonds in the interaction between SM and Cer. The results of [118] evidence that SM and Cer can have an interaction through their polar headgroups that is differently from what occurs to other lipids.
- (c) Sphingosine (SP) and sphingosine 1-phosphate (S1P)
In Table 6, we summarized the main aspects of some papers devoted to applying FT-IR spectroscopy for studying SP and S1P. Commercial samples and lipids extracted from human cells, biofluids, and natural substances are examined in this case. The FT-IR investigations have been made using different acquisition geometries (transmission with CaF2 windows and KBr pellets and ATR). A certain number of selected papers can be evidenced by the joint use of FT-IR spectroscopy with mass spectrometry for precisely identifying the SL involved in the examined process.
The contribution reported in [119] is related to the joint use of differential scanning thermometry and FT-IR spectroscopy for investigating the effect of SP and stearylamine on the interaction of SP with calcium. Additionally, in this case, spectroscopic observations confirm the phase transition observed by using differential scanning thermometry. The inspection of the ester C=O stretching mode appearing as a broad band at 1734 cm−1 suggests that the amino bases do not introduce hydrogen bonding with the C=O group and do not modify its hydration state. The same evidence is obtained by considering the band related to the phosphate group located at 1220 cm−1. The degree of dehydration of the phosphate group can also be quantitatively determined by using a partial least-squares multivariate statistical analysis. A further study from the same research group [120] is devoted to the use of FT-IR for a quantitative analysis of the dehydration process of the phosphatidylserine phosphate group in the presence of Ca2+ caused by various molecules, such as diacylglycerol, SP, and stearylarnine, by adopting a partial least-squares statistical method. FT-IR can also be used for estimating the apparent pKa of lipid carboxyl groups. The absorbance signals given by the protonated and the unprotonated forms of the specific group under investigation can be determined. In so doing, it is possible to evidence that diacylglycerol increases the dehydration of the phosphate group due to Ca2+ while the amino-bases SP and stearylamine avoid the dehydration of the phosphate group. The paper of Derenne et al. [96] that has been cited in the previous table also gives interesting results for SP and S1P.
- (d) FT-IR Lipidomic studies involving sphingolipids
It is worth noting that, recently, great attention has been devoted to two aspects of FT-IR spectroscopy technology to broaden its field of application further. The former of these aspects is related to the development of experimental approaches allowing the characterization of a considerable number of samples by developing a high-throughput approach [127,128,129]. The second concerns the “omics” aspect. Usually, this term is used for indicating the analysis of genes (genomics), proteins (proteomics), and metabolites (metabolomics), but also the analysis of all lipids and the molecules with which they interact, and their function within biological systems assumes a particular relevance since lipidomics represent one of the most critical aspects of modern analytical biochemistry. The most general techniques used in lipidomics are the techniques of TLC, HPLC, GC, and CE mentioned in the Introduction of the present paper; however, also in this framework, FT-IR spectroscopy is increasingly appreciated [22,130,131]. Considering sphingolipids, Ramos-Garcia et al. [25] showed that FT-IR analysis could provide a qualitative and quantitative biochemical characterization of isolated exosomes, allowing for a fast and direct quantification of the total lipid content and evidencing sphingolipid contribution. Another contribution in this field has been given by Guleken et al. that individuated changes in sphingolipid metabolism in the blood serum of endometriosis-affected patients [24,26].
7. Conclusions
The relevance of SLs in an extremely large number of physiological processes and pathologies is nowadays clearly recognized, and all the experimental techniques that can contribute to shedding light on the mechanisms in which SLs are involved are under intense investigation. The large number of papers that are now present in the literature and the representative results discussed here evidence that FTI-R spectroscopy represents an excellent tool for investigating SLs simply and directly. In fact, the selected articles testify to the variety of contributions offered by FT-IR spectroscopy, from studies on the conformational order of different ceramides in stratum corneum to SL quantification in cancer cells, drug effects, and new biomarkers for tumor diagnosis. This review does not present an exhaustive collection of all the results made available via FT-IR spectroscopy. Still, it proves that it can be an essential research tool for studying SL roles in very different experimental conditions.
Author Contributions
Conceptualization, B.F. and M.L.; data curation, B.F., M.M., N.D. and M.P.; writing—original draft preparation, B.F., N.D. and M.L.; writing—review and editing, B.F., M.M., N.D., M.P. and M.L. All authors have read and agreed to the published version of the manuscript.
Funding
This research received no external funding.
Data Availability Statement
Not applicable.
Conflicts of Interest
The authors declare no conflict of interest.
Appendix A. Sample Preparation
The extraction of lipids from biological matrices is a crucial step for preparing samples for FT-IR spectroscopy. In particular, it is necessary to reach two goals: to have a high extraction efficiency and to completely remove potentially interfering substances such as proteins, carbohydrates, and other metabolites. Depending on the nature and physical state of the sample (vegetable or animal, tissue or fluid), optimizing the procedure begins with the choosing of the appropriate solvent. Non-polar organic solvents solubilize neutral lipids, while polar ones are better for polar lipids, such as phospholipids and membrane lipoproteins. Therefore, the best choice may be to use solvents of different polarity [132,133]. To facilitate separation after extraction, other factors, such as volatility and the ability to form a two-phase aqueous system, must be considered, while the absence of toxic or reactive impurities prevents unwanted reactions with the lipids to be extracted [134]. Finally, the effects of solvents on health and the impact on the environment are also worthy of attention.
As regards the protocols for lipid extraction, the papers cited in the present review essentially adopted two liquid–liquid extraction (LLE) protocols based on a ternary mixture of chloroform, methanol, and water at different ratios by using the Folch method [135] and the Bligh and Dyer method [97].
Developed in the 1950s to extract fat from animal tissue, they are still used as reference extraction processes for different biological matrices, such as plasma, urine, seminal plasma, liver, saliva, and human milk (Saini et al., 2021). The Folch method is usually used to extract lipids from solid tissue, while for biological fluids, the Bligh and Dyer method is preferred [134].
The Folch and Bligh and Dyer protocols differ in the chloroform/methanol/water ratio: in the Folch method it is 2:1:0.75, while in the Bligh and Dyer method it is 1:1:0.9%. In addition, in the Folch method the added aqueous fraction contains salts. When comparing the total volume of solvents, it is twenty times the sample in Folch and only four times in the Bligh and Dyer method [136].
In any case, these protocols are equally efficient in extracting the total lipids. The efficiency relies on the amphipathic properties of lipids to obtain a differential partition between an aqueous phase and an immiscible organic phase at a given temperature, pH, and ionic strength. Hence, the lipids are collected in the lower organic chloroform/methanol phase while the upper aqueous phase contains more hydrophilic compounds and salts. The negative aspects of these protocols are essentially two: the toxicity of chloroform, a known carcinogen, and the extract contamination during the sampling of the lower organic phase. A pipette must cross the upper and middle aqueous phases, containing precipitate and insoluble material, and an inevitable contamination of lipid extract occurs.
In recent years, research activities have focused on the development of new extraction protocols characterized by simplicity, economy, automation, and the use of non-toxic solvents. Alternative methods, based on a two-phase mixture, such as tert-butyl methyl ether (MTBE)/methanol [137], or a single phase, such as 1-butanol/methanol [138], have gained popularity. In both methods the lipids are extracted in the upper phase, avoiding unwanted contamination, and saving time compared to the Folch and Bligh and Dyer methods. In addition, they are safer and more environmentally friendly as they do not use toxic chloroform. A single-phase method may even be more cost-effective since, by not involving solvent separation into a two-phase form, it potentially yields better lipid recoveries and automation opportunities.
References
- Muro, E.; Atilla-Gokcumen, G.E.; Eggert, U.S. Lipids in cell biology: How can we understand them better? Mol. Biol. Cell 2014, 25, 1819–1823. [Google Scholar] [CrossRef] [PubMed]
- van Meer, G. Cellular lipidomics. EMBO J. 2005, 24, 3159–3165. [Google Scholar] [CrossRef] [PubMed]
- Zalba, S.; Ten Hagen, T.L. Cell membrane modulation as adjuvant in cancer therapy. Cancer Treat. Rev. 2017, 52, 48–57. [Google Scholar] [CrossRef] [PubMed] [Green Version]
- Breslow, D.K.; Weissman, J.S. Membranes in balance: Mechanisms of sphingolipid homeostasis. Mol. Cell 2010, 40, 267–279. [Google Scholar] [CrossRef] [PubMed] [Green Version]
- Haynes, C.A.; Allegood, J.C.; Park, H.; Sullards, M.C. Sphingolipidomics: Methods for the comprehensive analysis of sphingolipids. J. Chromatogr. B Analyt. Technol. Biomed. Life Sci. 2009, 877, 2696–2708. [Google Scholar] [CrossRef] [PubMed] [Green Version]
- Gennis, R.B. Biomembranes: Molecular Structure and Function; Springer Science & Business Media: Berlin/Heidelberg, Germany, 2013. [Google Scholar]
- Chapman, D. (Ed.) Biomembrane Structure and Function; Springer: Berlin/Heidelberg, Germany, 1983. [Google Scholar]
- Cullis, P.R.; Hope, M.J. Chapter 1 Physical properties and functional roles of lipids in membranes. In New Comprehensive Biochemistry; Vance, D.E., Vance, J.E., Eds.; Elsevier: Amsterdam, The Netherlands, 1991; Volume 20, pp. 1–41. [Google Scholar]
- Lizardo, D.Y.; Parisi, L.R.; Li, N.; Atilla-Gokcumen, G.E. Noncanonical roles of lipids in different cellular fates. Biochemistry 2018, 57, 22–29. [Google Scholar] [CrossRef]
- Merrill, A.H., Jr.; Sandhoff, K. Sphingolipids: Metabolism and cell signaling. New Compr. Biochem. 2002, 36, 373–407. [Google Scholar]
- Holm, L.J.; Krogvold, L.; Hasselby, J.P.; Kaur, S.; Claessens, L.A.; Russell, M.A.; Mathews, C.E.; Hanssen, K.F.; Morgan, N.G.; Koeleman, B.P. Abnormal islet sphingolipid metabolism in type 1 diabetes. Diabetologia 2018, 61, 1650–1661. [Google Scholar] [CrossRef] [Green Version]
- Bartke, N.; Hannun, Y.A. Bioactive sphingolipids: Metabolism and function. J. Lipid Res. 2009, 50, S91–S96. [Google Scholar] [CrossRef] [Green Version]
- Duan, R.-D.; Nilsson, Å. Metabolism of sphingolipids in the gut and its relation to inflammation and cancer development. Prog. Lipid Res. 2009, 48, 62–72. [Google Scholar] [CrossRef] [Green Version]
- Iessi, E.; Marconi, M.; Manganelli, V.; Sorice, M.; Malorni, W.; Garofalo, T.; Matarrese, P. On the role of sphingolipids in cell survival and death. Int. Rev. Cell Mol. Biol. 2020, 351, 149–195. [Google Scholar] [PubMed]
- Nagahashi, M.; Takabe, K.; Terracina, K.P.; Soma, D.; Hirose, Y.; Kobayashi, T.; Matsuda, Y.; Wakai, T. Sphingosine-1-phosphate transporters as targets for cancer therapy. Biomed. Res. Int. 2014, 2014, 651727. [Google Scholar] [CrossRef] [PubMed] [Green Version]
- Ohanian, J.; Ohanian, V. Sphingolipids in mammalian cell signalling. Cell. Mol. Life Sci. 2001, 58, 2053–2068. [Google Scholar] [CrossRef] [PubMed]
- Sassa, T.; Suto, S.; Okayasu, Y.; Kihara, A. A shift in sphingolipid composition from C24 to C16 increases susceptibility to apoptosis in HeLa cells. Biochim. Biophys. Acta 2012, 1821, 1031–1037. [Google Scholar] [CrossRef] [Green Version]
- Mashhadi Akbar Boojar, M.; Mashhadi Akbar Boojar, M.; Golmohammad, S. Ceramide pathway: A novel approach to cancer chemotherapy. Egypt. J. Basic Appl. Sci. 2018, 5, 237–244. [Google Scholar] [CrossRef]
- Carpinteiro, A.; Dumitru, C.; Schenck, M.; Gulbins, E. Ceramide-induced cell death in malignant cells. Cancer Lett. 2008, 264, 1–10. [Google Scholar] [CrossRef]
- Hannun, Y.A.; Obeid, L.M. Principles of bioactive lipid signalling: Lessons from sphingolipids. Nat. Rev. Mol. Cell Biol. 2008, 9, 139–150. [Google Scholar] [CrossRef]
- Hannun, Y.A.; Obeid, L.M. Sphingolipids and their metabolism in physiology and disease. Nat. Rev. Mol. Cell Biol. 2018, 19, 175–191. [Google Scholar] [CrossRef]
- Jurowski, K.; Kochan, K.; Walczak, J.; Barańska, M.; Piekoszewski, W.; Buszewski, B. Analytical techniques in lipidomics: State of the art. Crit. Rev. Anal. Chem. 2017, 47, 418–437. [Google Scholar] [CrossRef]
- Serdyuk, I.N.; Zaccai, N.R.; Zaccai, J.; Zaccai, G. Methods in Molecular Biophysics, 2nd ed.; Cambridge University Press: Cambridge, UK, 2017. [Google Scholar]
- Lee, Y.H.; Tan, C.W.; Venkatratnam, A.; Tan, C.S.; Cui, L.; Loh, S.F.; Griffith, L.; Tannenbaum, S.R.; Chan, J.K.Y. Dysregulated sphingolipid metabolism in endometriosis. J. Clin. Endocrinol. Metab. 2014, 99, E1913–E1921. [Google Scholar] [CrossRef] [Green Version]
- Ramos-Garcia, V.; Ten-Doménech, I.; Moreno-Giménez, A.; Gormaz, M.; Parra-Llorca, A.; Shephard, A.P.; Sepúlveda, P.; Pérez-Guaita, D.; Vento, M.; Lendl, B. ATR-FTIR spectroscopy for the routine quality control of exosome isolations. Chemom. Intell. Lab. Syst. 2021, 217, 104401. [Google Scholar] [CrossRef]
- Guleken, Z.; Bulut, H.; Depciuch, J.; Tarhan, N. Diagnosis of endometriosis using endometrioma volume and vibrational spectroscopy with multivariate methods as a noninvasive method. Spectrochim. Acta A Mol. Biomol. Spectrosc. 2022, 264, 120246. [Google Scholar] [CrossRef] [PubMed]
- Stuart, B.H. Infrared Spectroscopy: Fundamentals and Applications; John Wiley & Sons: Hoboken, NJ, USA, 2004. [Google Scholar]
- Raghavachari, R. Near-Infrared Applications in Biotechnology; CRC Press: Boca Raton, FL, USA, 2020. [Google Scholar]
- Barth, A.; Haris, P.I. Biological and Biomedical Infrared Spectroscopy; IOS Press: Amsterdam, The Netherlands, 2009. [Google Scholar]
- Abidi, N. FTIR Microspectroscopy: Selected Emerging Applications; Springer: Berlin/Heidelberg, Germany, 2021. [Google Scholar]
- Baker, M.J.; Trevisan, J.; Bassan, P.; Bhargava, R.; Butler, H.J.; Dorling, K.M.; Fielden, P.R.; Fogarty, S.W.; Fullwood, N.J.; Heys, K.A.; et al. Using Fourier transform IR spectroscopy to analyze biological materials. Nat. Protoc. 2014, 9, 1771–1791. [Google Scholar] [CrossRef] [PubMed] [Green Version]
- Sabbatini, S.; Conti, C.; Orilisi, G.; Giorgini, E. Infrared spectroscopy as a new tool for studying single living cells: Is there a niche? Biomed. Spectrosc. Imaging 2017, 6, 85–99. [Google Scholar] [CrossRef] [Green Version]
- Magalhães, S.; Goodfellow, B.J.; Nunes, A. FTIR spectroscopy in biomedical research: How to get the most out of its potential. Appl. Spectrosc. Rev. 2021, 56, 869–907. [Google Scholar] [CrossRef]
- Delfino, I.; Portaccio, M.; Della Ventura, B.; Mita, D.; Lepore, M. Enzyme distribution and secondary structure of sol–gel immobilized glucose oxidase by micro-attenuated total reflection FT-IR spectroscopy. Mater. Sci. Eng. C Mater. Biol. Appl. 2013, 33, 304–310. [Google Scholar] [CrossRef]
- Ricciardi, V.; Portaccio, M.; Piccolella, S.; Manti, L.; Pacifico, S.; Lepore, M. Study of SH-SY5Y cancer cell response to treatment with polyphenol extracts using FT-IR spectroscopy. Biosensors 2017, 7, 57. [Google Scholar] [CrossRef] [Green Version]
- Ricciardi, V.; Portaccio, M.; Manti, L.; Lepore, M. An FTIR Microspectroscopy Ratiometric Approach for Monitoring X-ray Irradiation Effects on SH-SY5Y Human Neuroblastoma Cells. Appl. Sci. 2020, 10, 2974. [Google Scholar] [CrossRef]
- d’Apuzzo, F.; Nucci, L.; Delfino, I.; Portaccio, M.; Minervini, G.; Isola, G.; Serino, I.; Camerlingo, C.; Lepore, M. Application of vibrational spectroscopies in the qualitative analysis of gingival crevicular fluid and periodontal ligament during orthodontic tooth movement. J. Clin. Med. 2021, 10, 1405. [Google Scholar] [CrossRef]
- Kallenbach-Thieltges, A.; Großerüschkamp, F.; Mosig, A.; Diem, M.; Tannapfel, A.; Gerwert, K. Immunohistochemistry, histopathology and infrared spectral histopathology of colon cancer tissue sections. J. Biophotonics 2013, 6, 88–100. [Google Scholar] [CrossRef]
- Lasch, P.; Haensch, W.; Naumann, D.; Diem, M. Imaging of colorectal adenocarcinoma using FT-IRmicrospectroscopy and cluster analysis. Biochim. Biophys. Acta 2004, 1688, 176–186. [Google Scholar] [CrossRef] [PubMed] [Green Version]
- Bird, B.; Bedrossian, K.; Laver, N.; Miljković, M.; Romeo, M.J.; Diem, M. Detection of breast micro-metastases in axillary lymph nodes by infrared micro-spectral imaging. Analyst 2009, 134, 1067–1076. [Google Scholar] [CrossRef] [PubMed] [Green Version]
- Ooi, G.J.; Fox, J.; Siu, K.; Lewis, R.; Bambery, K.R.; Mcnaughton, D.; Wood, B.R. Fourier transform infrared imaging and small angle x-ray scattering as a combined biomolecular approach to diagnosis of breast cancer. Med. Phys. 2008, 35, 2151–2161. [Google Scholar] [CrossRef] [PubMed]
- Baker, M.J.; Gazi, E.; Brown, M.D.; Shanks, J.H.; Gardner, P.; Clarke, N.W. FTIR-based spectroscopic analysis in the identification of clinically aggressive prostate cancer. Br. J. Cancer 2008, 99, 1859–1866. [Google Scholar] [CrossRef] [PubMed] [Green Version]
- Baker, M.J.; Gazi, E.; Brown, M.D.; Shanks, J.H.; Clarke, N.W.; Gardner, P. Investigating FTIR based histopathology for the diagnosis of prostate cancer. J. Biophotonics 2009, 2, 104–113. [Google Scholar] [CrossRef]
- Lovergne, L.; Lovergne, J.; Bouzy, P.; Untereiner, V.; Offroy, M.; Garnotel, R.; Thiéfin, G.; Baker, M.J.; Sockalingum, G.D. Investigating pre-analytical requirements for serum and plasma based infrared spectro-diagnostic. J. Biophotonics 2019, 12, e201900177. [Google Scholar] [CrossRef] [PubMed]
- Theakstone, A.G.; Rinaldi, C.; Butler, H.J.; Cameron, J.M.; Confield, L.R.; Rutherford, S.H.; Sala, A.; Sangamnerkar, S.; Baker, M.J. Fourier-transform infrared spectroscopy of biofluids: A practical approach. Transl. Biophotonics 2021, 3, e202000025. [Google Scholar] [CrossRef]
- Bruun, S.W.; Kohler, A.; Adt, I.; Sockalingum, G.D.; Manfait, M.; Martens, H. Correcting attenuated total reflection-Fourier transform infrared spectra for water vapor and carbon dioxide. Appl. Spectrosc. 2006, 60, 1029–1039. [Google Scholar] [CrossRef]
- Vaccari, L.; Birarda, G.; Grenci, G.; Pacor, S.; Businaro, L. Synchrotron radiation infrared microspectroscopy of single living cells in microfluidic devices: Advantages, disadvantages and future perspectives. J. Phys. Conf. Ser. 2012, 359, 012007. [Google Scholar] [CrossRef]
- Carrasco-Pancorbo, A.; Navas-Iglesias, N.; Cuadros-Rodrıguez, L. From lipid analysis towards lipidomics, a new challenge for the analytical chemistry of the 21st century. Part I: Modern lipid analysis. Trends Anal. Chem. 2009, 28, 263–278. [Google Scholar] [CrossRef]
- Carrasco-Pancorbo, A.; Navas-Iglesias, N.; Cuadros-Rodrıguez, L. From lipids analysis towards lipidomics, a new challenge for the analytical chemistry of the 21st century. Part II: Analytical lipidomics. Trends Anal. Chem. 2009, 28, 393–403. [Google Scholar] [CrossRef]
- Abdelrazzak, A.B.; Hezma, A.M.; El-Bahy, G.S. ATR-FTIR spectroscopy probing of structural alterations in the cellular membrane of abscopal liver cells. Biochim. Biophys. Acta Biomembr. 2021, 1863, 183726. [Google Scholar] [CrossRef]
- Di Santo, R.; Vaccaro, M.; Romanò, S.; Di Giacinto, F.; Papi, M.; Rapaccini, G.L.; De Spirito, M.; Miele, L.; Basile, U.; Ciasca, G. Machine Learning-Assisted FTIR Analysis of Circulating Extracellular Vesicles for Cancer Liquid Biopsy. J. Pers. Med. 2022, 12, 949. [Google Scholar] [CrossRef] [PubMed]
- Robinson, H.; Molendijk, J.; Shah, A.K.; Rahman, T.; Anderson, G.J.; Hill, M.M. Rapid Assessment of Lipidomics Sample Purity and Quantity Using Fourier-Transform Infrared Spectroscopy. Biomolecules 2022, 12, 1265. [Google Scholar] [CrossRef] [PubMed]
- Murdica, V.; Mancini, G.; Loberto, N.; Bassi, R.; Giussani, P.; Di Muzio, N.; Deantoni, C.; Prinetti, A.; Aureli, M.; Sonnino, S. Abiraterone and ionizing radiation alter the sphingolipid homeostasis in prostate cancer cells. Adv. Exp. Med. Biol. 2018, 1112, 293–307. [Google Scholar] [PubMed]
- Mathew, B.; Jacobson, J.R.; Berdyshev, E.; Huang, Y.; Sun, X.; Zhao, Y.; Gerhold, L.M.; Siegler, J.; Evenoski, C.; Wang, T. Role of sphingolipids in murine radiation-induced lung injury: Protection by sphingosine 1-phosphate analogs. FASEB J. 2011, 25, 3388–3400. [Google Scholar] [CrossRef] [PubMed] [Green Version]
- Rodriguez-Lafrasse, C.; Alphonse, G.; Aloy, M.T.; Ardail, D.; Gérard, J.P.; Louisot, P.; Rousson, R. Increasing endogenous ceramide using inhibitors of sphingolipid metabolism maximizes ionizing radiation-induced mitochondrial injury and apoptotic cell killing. Int. J. Cancer 2002, 101, 589–598. [Google Scholar] [CrossRef] [PubMed]
- Kumar, S.; Srinivasan, A.; Nikolajeff, F. Role of infrared spectroscopy and imaging in cancer diagnosis. Curr. Med. Chem. 2018, 25, 1055–1072. [Google Scholar] [CrossRef] [PubMed]
- Bonnaud, S.; Niaudet, C.; Legoux, F.; Corre, I.; Delpon, G.; Saulquin, X.; Fuks, Z.; Gaugler, M.-H.; Kolesnick, R.; Paris, F. Sphingosine-1-Phosphate Activates the AKT Pathway to Protect Small Intestines from Radiation-Induced Endothelial ApoptosisS1P Protects from Radiation-Induced GI Syndrome. Cancer Res. 2010, 70, 9905–9915. [Google Scholar] [CrossRef] [Green Version]
- Agarwala, P.K.; Aneja, R.; Kapoor, S. Lipidomic landscape in cancer: Actionable insights for membrane-based therapy and diagnoses. Med. Res. Rev. 2022, 42, 983–1018. [Google Scholar] [CrossRef]
- Baenke, F.; Peck, B.; Miess, H.; Schulze, A. Hooked on fat: The role of lipid synthesis in cancer metabolism and tumour development. Dis. Model. Mech. 2013, 6, 1353–1363. [Google Scholar] [CrossRef] [PubMed] [Green Version]
- Woodcock, J. Sphingosine and ceramide signalling in apoptosis. IUBMB Life 2006, 58, 462–466. [Google Scholar] [CrossRef] [PubMed]
- Fernández, L.P.; Gomez de Cedron, M.; Ramírez de Molina, A. Alterations of lipid metabolism in cancer: Implications in prognosis and treatment. Front. Oncol. 2020, 10, 577420. [Google Scholar] [CrossRef] [PubMed]
- Beckham, T.H.; Lu, P.; Jones, E.E.; Marrison, T.; Lewis, C.S.; Cheng, J.C.; Ramshesh, V.K.; Beeson, G.; Beeson, C.C.; Drake, R.R. LCL124, a cationic analog of ceramide, selectively induces pancreatic cancer cell death by accumulating in mitochondria. J. Pharmacol. Exp. Ther. 2013, 344, 167–178. [Google Scholar] [CrossRef] [Green Version]
- Henry, B.; Möller, C.; Dimanche-Boitrel, M.-T.; Gulbins, E.; Becker, K.A. Targeting the ceramide system in cancer. Cancer Lett. 2013, 332, 286–294. [Google Scholar] [CrossRef]
- Aureli, M.; Murdica, V.; Loberto, N.; Samarani, M.; Prinetti, A.; Bassi, R.; Sonnino, S. Exploring the link between ceramide and ionizing radiation. Glycoconj J. 2014, 31, 449–459. [Google Scholar] [CrossRef]
- Modrak, D.E.; Gold, D.V.; Goldenberg, D.M. Sphingolipid targets in cancer therapy. Mol. Cancer Ther. 2006, 5, 200–208. [Google Scholar] [CrossRef] [Green Version]
- Ogretmen, B. Sphingolipid metabolism in cancer signalling and therapy. Nat. Rev. Cancer 2018, 18, 33–50. [Google Scholar] [CrossRef] [Green Version]
- Corre, I.; Niaudet, C.; Paris, F. Plasma membrane signaling induced by ionizing radiation. Mutat. Res. 2010, 704, 61–67. [Google Scholar] [CrossRef]
- Vit, J.P.; Rosselli, F. Role of the ceramide-signaling pathways in ionizing radiation-induced apoptosis. Oncogene 2003, 22, 8645–8652. [Google Scholar] [CrossRef] [Green Version]
- Schramm, C. High temperature ATR-FTIR characterization of the interaction of polycarboxylic acids and organotrialkoxysilanes with cellulosic material. Biochim. Biophys. Acta 2020, 43, 118815. [Google Scholar] [CrossRef]
- Whyman, R.; Hunt, K.; Page, R.; Rigby, S. A high-pressure spectroscopic cell for FTIR measurements. J. Phys. E Sci. Instr. 2000, 17, 559. [Google Scholar] [CrossRef]
- Reffner, J.A. Advances in Infrared Microspectroscopy and Mapping Molecular Chemical Composition at Submicrometer Spatial Resolution. Spectroscopy 2018, 33, 12–17. [Google Scholar]
- Beasley, M.M.; Bartelink, E.J.; Taylor, L.; Miller, R.M. Comparison of transmission FTIR, ATR, and DRIFT spectra: Implications for assessment of bone bioapatite diagenesis. J. Archaeol. Sci. 2014, 46, 16–22. [Google Scholar] [CrossRef]
- Horgnies, M.; Chen, J.; Bouillon, C. Overview about the use of Fourier transform infrared spectroscopy to study cementitious materials. WIT Trans. Eng. Sci 2013, 77, 251–262. [Google Scholar]
- Gendreau, R.M.; Burton, R. The KBr Pellet: A Useful Technique for Obtaining Infrared Spectra of Inorganic Species. Appl. Spectrosc. 1979, 33, 581–584. [Google Scholar] [CrossRef]
- Goormaghtigh, E.; Raussens, V.; Ruysschaert, J.-M. Attenuated total reflection infrared spectroscopy of proteins and lipids in biological membranes. Biochim. Biophys. Acta 1999, 1422, 105–185. [Google Scholar] [CrossRef]
- Grdadolnik, J. ATR-FTIR spectroscopy: Its advantage and limitations. Acta Chim. Slov. 2002, 49, 631–642. [Google Scholar]
- Kazarian, S.; Chan, K. Applications of ATR-FTIR spectroscopic imaging to biomedical samples. Biochim. Biophys. Acta 2006, 1758, 858–867. [Google Scholar] [CrossRef] [Green Version]
- Portaccio, M.; Gravagnuolo, A.; Longobardi, S.; Giardina, P.; Rea, I.; De Stefano, L.; Cammarota, M.; Lepore, M. ATR FT-IR spectroscopy on Vmh2 hydrophobin self-assembled layers for Teflon membrane bio-functionalization. Appl. Surf. Sci. 2015, 351, 673–680. [Google Scholar] [CrossRef]
- Fringeli, U.P.; Günthard, H.H. Infrared membrane spectroscopy. Mol. Biol. Biochem. Biophys. 1981, 31, 270–332. [Google Scholar] [PubMed]
- Tamm, L.K.; Tatulian, S.A. Infrared spectroscopy of proteins and peptides in lipid bilayers. Q. Rev. Biophys. 1997, 30, 365–429. [Google Scholar] [CrossRef] [PubMed] [Green Version]
- McIvor, A.M. Background subtraction techniques. Proc. Image Vis. Comput. 2000, 4, 3099–3104. [Google Scholar]
- Bassan, P.; Byrne, H.J.; Bonnier, F.; Lee, J.; Dumas, P.; Gardner, P. Resonant Mie scattering in infrared spectroscopy of biological materials–understanding the ‘dispersion artefact’. Analyst 2009, 134, 1586–1593. [Google Scholar] [CrossRef] [PubMed]
- Bassan, P.; Kohler, A.; Martens, H.; Lee, J.; Byrne, H.J.; Dumas, P.; Gazi, E.; Brown, M.; Clarke, N.; Gardner, P. Resonant Mie scattering (RMieS) correction of infrared spectra from highly scattering biological samples. Analyst 2010, 135, 268–277. [Google Scholar] [CrossRef] [PubMed]
- Vafaei, N.; Ribeiro, R.A.; Camarinha-Matos, L.M. Normalization techniques for multi-criteria decision making: Analytical hierarchy process case study. In Proceedings of the 7th Doctoral Conference on Computing, Electrical and Industrial Systems (DoCEIS), Costa de Caparica, Portugal, 11–13 April 2016; pp. 261–269. [Google Scholar] [CrossRef] [Green Version]
- Byler, D.M.; Wilson, R.M.; Randall, C.S.; Sokoloski, T.D. Second derivative infrared spectroscopy as a non-destructive tool to assess the purity and structural integrity of proteins. Pharm. Res. 1995, 12, 446–450. [Google Scholar] [CrossRef]
- Suresh, S.; Karthikeyan, S.; Jayamoorthy, K. FTIR and multivariate analysis to study the effect of bulk and nano copper oxide on peanut plant leaves. J. Sci. Adv. Mater. Devices 2016, 1, 343–350. [Google Scholar] [CrossRef] [Green Version]
- Elmasry, G.; Kamruzzaman, M.; Sun, D.-W.; Allen, P. Principles and applications of hyperspectral imaging in quality evaluation of agro-food products: A review. Crit. Rev. Food Sci. Nutr. 2012, 52, 999–1023. [Google Scholar] [CrossRef]
- Kumar, S.; Verma, T.; Mukherjee, R.; Ariese, F.; Somasundaram, K.; Umapathy, S. Raman and infra-red microspectroscopy: Towards quantitative evaluation for clinical research by ratiometric analysis. Chem. Soc. Rev. 2016, 45, 1879–1900. [Google Scholar] [CrossRef]
- Cakmak, G.; Miller, L.M.; Zorlu, F.; Severcan, F. Amifostine, a radioprotectant agent, protects rat brain tissue lipids against ionizing radiation induced damage: An FTIR microspectroscopic imaging study. Arch. Biochem. Biophys. 2012, 520, 67–73. [Google Scholar] [CrossRef]
- Severcan, F.; Gorgulu, G.; Gorgulu, S.T.; Guray, T. Rapid monitoring of diabetes-induced lipid peroxidation by Fourier transform infrared spectroscopy: Evidence from rat liver microsomal membranes. Anal. Biochem. 2005, 339, 36–40. [Google Scholar] [CrossRef] [PubMed]
- Garip, S.; Yapici, E.; Ozek, N.S.; Severcan, M.; Severcan, F. Evaluation and discrimination of simvastatin-induced structural alterations in proteins of different rat tissues by FTIR spectroscopy and neural network analysis. Analyst 2010, 135, 3233–3241. [Google Scholar] [CrossRef]
- Yoshida, S.; Koike, K. Lipid and membrane dynamics in biological tissues in nfrared spectroscopic studies. Adv. Planar Lipid Bilayers Liposomes 2011, 13, 1–32. [Google Scholar]
- Movasaghi, Z.; Rehman, S.; ur Rehman, D.I. Fourier transform infrared (FTIR) spectroscopy of biological tissues. Appl. Spectrosc. Rev. 2008, 43, 134–179. [Google Scholar] [CrossRef]
- Talari, A.C.S.; Martinez, M.A.G.; Movasaghi, Z.; Rehman, S.; Rehman, I.U. Advances in Fourier transform infrared (FTIR) spectroscopy of biological tissues. Appl. Spectrosc. Rev. 2017, 52, 456–506. [Google Scholar] [CrossRef]
- Derenne, A.; Claessens, T.; Conus, C.; Goormaghtigh, E. Infrared spectroscopy of membrane lipids. In Encyclopedia of Biophysics; Roberts, G.C.K., Ed.; Springer: Berlin/Heidelberg, Germany, 2013; pp. 1074–1081. [Google Scholar]
- Derenne, A.; Vandersleyen, O.; Goormaghtigh, E. Lipid quantification method using FTIR spectroscopy applied on cancer cell extracts. Biochim. Biophys. Acta 2014, 1841, 1200–1209. [Google Scholar] [CrossRef]
- Bligh, E.; Dyer, W.J. A rapid method of total lipid extraction and purification. Can. J. Biochem. Physiol. 1959, 37, 911–917. [Google Scholar] [CrossRef]
- Saini, R.K.; Prasad, P.; Shang, X.; Keum, Y.S. Advances in Lipid Extraction Methods—A Review. Int. J. Mol. Sci. 2021, 22, 13643. [Google Scholar] [CrossRef]
- Villalaín, J.; Ortiz, A.; Gómez-Fernández, J.C. Molecular interactions between sphingomyelin and phosphatidylcholine in phospholipid vesicles. Biochim. Biophys. Acta 1988, 941, 55–62. [Google Scholar] [CrossRef]
- Nicolini, C.; Kraineva, J.; Khurana, M.; Periasamy, N.; Funari, S.S.; Winter, R. Temperature and pressure effects on structural and conformational properties of POPC/SM/cholesterol model raft mixtures—A FT-IR, SAXS, DSC, PPC and Laurdan fluorescence spectroscopy study. Biochim. Biophys. Acta 2006, 1758, 248–258. [Google Scholar] [CrossRef]
- Beljebbar, A.; Amharref, N.; Lévèques, A.; Dukic, S.; Venteo, L.; Schneider, L.; Pluot, M.; Manfait, M. Modeling and quantifying biochemical changes in C6 tumor gliomas by Fourier transform infrared imaging. Anal. Chem. 2008, 80, 8406–8415. [Google Scholar] [CrossRef] [PubMed]
- Beljebbar, A.; Dukic, S.; Amharref, N.; Bellefqih, S.; Manfait, M. Monitoring of biochemical changes through the C6 gliomas progression and invasion by Fourier transform infrared (FTIR) imaging. Anal. Chem. 2009, 81, 9247–9256. [Google Scholar] [CrossRef] [PubMed]
- Dreissig, I.; Machill, S.; Salzer, R.; Krafft, C. Quantification of brain lipids by FTIR spectroscopy and partial least squares regression. Spectrochim. Acta A Mol. Biomol. Spectrosc. 2009, 71, 2069–2075. [Google Scholar] [CrossRef]
- Gasper, R.; Dewelle, J.; Kiss, R.; Mijatovic, T.; Goormaghtigh, E. IR spectroscopy as a new tool for evidencing antitumor drug signatures. Biochim. Biophys. Acta 2009, 1788, 1263–1270. [Google Scholar] [CrossRef] [PubMed]
- Gasper, R.; Vandenbussche, G.; Goormaghtigh, E. Ouabain-induced modifications of prostate cancer cell lipidome investigated with mass spectrometry and FTIR spectroscopy. Biochim. Biophys. Acta 2011, 1808, 597–605. [Google Scholar] [CrossRef] [PubMed]
- Mereghetti, P.; Corsetto, P.A.; Cremona, A.; Rizzo, A.M.; Doglia, S.M.; Ami, D. A Fourier transform infrared spectroscopy study of cell membrane domain modifications induced by docosahexaenoic acid. Biochim. Biophys. Acta 2014, 1840, 3115–3122. [Google Scholar] [CrossRef]
- Türker-Kaya, S.; Kına, A. Calorimetric and spectroscopic investigation of the interaction of chemotherapeutic agent carboplatin with sphingomyelin lipids. J. Therm. Anal. Calorim. 2021, 146, 2515–2522. [Google Scholar] [CrossRef]
- Moore, D.J.; Rerek, M.E.; Mendelsohn, R. FTIR spectroscopy studies of the conformational order and phase behavior of ceramides. J. Phys. Chem. B 1997, 101, 8933–8940. [Google Scholar] [CrossRef]
- Chen, H.-C.; Mendelsohn, R.; Rerek, M.E.; Moore, D.J. Fourier transform infrared spectroscopy and differential scanning calorimetry studies of fatty acid homogeneous ceramide 2. Biochim. Biophys. Acta 2000, 1468, 293–303. [Google Scholar] [CrossRef] [Green Version]
- Raudenkolb, S.; Hübner, W.; Rettig, W.; Wartewig, S.; Neubert, R.H. Polymorphism of ceramide 3. Part 1: An investigation focused on the head group of N-octadecanoylphytosphingosine. Chem. Phys. Lipids 2003, 123, 9–17. [Google Scholar] [CrossRef]
- Raudenkolb, S.; Wartewig, S.; Neubert, R.H. Polymorphism of ceramide 3. Part 2: A vibrational spectroscopic and X-ray powder diffraction investigation of N-octadecanoyl phytosphingosine and the analogous specifically deuterated d35 derivative. Chem. Phys. Lipids 2003, 124, 89–101. [Google Scholar] [CrossRef] [PubMed]
- Raudenkolb, S.; Wartewig, S.; Neubert, R. Polymorphism of ceramide 6: A vibrational spectroscopic and X-ray powder diffraction investigation of the diastereomers of N-(α-hydroxyoctadecanoyl)-phytosphingosine. Chem. Phys. Lipids 2005, 133, 89–102. [Google Scholar] [CrossRef] [PubMed]
- Raith, K.; Farwanah, H.; Wartewig, S.; Neubert, R.H. Progress in the analysis of stratum corneum ceramides. Eur. J. Lipid Sci. Technol. 2004, 106, 561–571. [Google Scholar] [CrossRef]
- Corbe, E.; Laugel, C.; Yagoubi, N.; Baillet, A. Role of ceramide structure and its microenvironment on the conformational order of model stratum corneum lipids mixtures: An approach by FTIR spectroscopy. Chem. Phys. Lipids 2007, 146, 67–75. [Google Scholar] [CrossRef] [PubMed]
- Chen, X.; Kwak, S.; Lafleur, M.; Bloom, M.; Kitson, N.; Thewalt, J. Fatty acids influence “solid” phase formation in models of stratum corneum intercellular membranes. Langmuir 2007, 23, 5548–5556. [Google Scholar] [CrossRef] [PubMed]
- Kim, D.-H.; An, E.J.; Kim, J.; Han, S.-H.; Kim, J.-W.; Oh, S.-G.; Suh, K.-D.; Cho, E.C. Fabrication and characterization of pseudo-ceramide-based liposomal membranes. Colloids Surf. B Biointerfaces 2009, 73, 207–211. [Google Scholar] [CrossRef]
- Park, J.-H.; Lee, J.-Y.; Termsarasab, U.; Yoon, I.-S.; Ko, S.-H.; Shim, J.-S.; Cho, H.-J.; Kim, D.-D. Development of poly (lactic-co-glycolic) acid nanoparticles-embedded hyaluronic acid–ceramide-based nanostructure for tumor-targeted drug delivery. Int. J. Pharm. 2014, 473, 426–433. [Google Scholar] [CrossRef]
- De la Arada, I.; González-Ramírez, E.J.; Alonso, A.; Goñi, F.M.; Arrondo, J.-L.R. Exploring polar headgroup interactions between sphingomyelin and ceramide with infrared spectroscopy. Sci. Rep. 2020, 10, 17606. [Google Scholar] [CrossRef]
- López-García, F.; Villaín, J.; Gómez-Fernández, J.C. Effect of sphingosine and stearylamine on the interaction of phosphatidylserine with calcium. A study using DSC, FT-IR and 45Ca2+-binding. Biochim. Biophys. Acta 1995, 1236, 279–288. [Google Scholar] [CrossRef] [Green Version]
- Gómez-Fernández, J.C.; Villalaín, J. The use of FT-IR for quantitative studies of the apparent pKa of lipid carboxyl groups and the dehydration degree of the phosphate group of phospholipids. Chem. Phys. Lipids 1998, 96, 41–52. [Google Scholar] [CrossRef]
- Ahmeda, A.; Zangeneh, M.M.; Zangeneh, A. Green formulation and chemical characterization of Lens culinaris seed aqueous extract conjugated gold nanoparticles for the treatment of acute myeloid leukemia in comparison to mitoxantrone in a leukemic mouse model. Appl. Organomet. Chem. 2020, 34, e5369. [Google Scholar] [CrossRef]
- Hemmati, S.; Joshani, Z.; Zangeneh, A.; Zangeneh, M.M. Biosynthesis and chemical characterization of polydopamine-capped silver nanoparticles for the treatment of acute myeloid leukemia in comparison to doxorubicin in a leukemic mouse model. Appl. Organomet. Chem. 2020, 34, e5277. [Google Scholar] [CrossRef]
- Zangeneh, M.M.; Zangeneh, A. Novel green synthesis of Hibiscus sabdariffa flower extract conjugated gold nanoparticles with excellent anti-acute myeloid leukemia effect in comparison to daunorubicin in a leukemic rodent model. Appl. Organomet. Chem. 2020, 34, e5271. [Google Scholar] [CrossRef]
- Hemmati, S.; Joshani, Z.; Zangeneh, A.; Zangeneh, M.M. Green synthesis and chemical characterization of Thymus vulgaris leaf aqueous extract conjugated gold nanoparticles for the treatment of acute myeloid leukemia in comparison to doxorubicin in a leukemic mouse model. Appl. Organomet. Chem. 2020, 34, e5267. [Google Scholar] [CrossRef]
- Banerjee, A.; Halder, A.; Jadhav, P.; Bankar, R.; Pattarkine, J.; Hole, A.; Shah, A.; Goel, A.; Murali Krishna, C.; Srivastava, S. Metabolomics Profiling of Pituitary Adenomas by Raman Spectroscopy, Attenuated Total Reflection-Fourier Transform Infrared Spectroscopy, and Mass Spectrometry of Serum Samples. Anal. Chem. 2022, 94, 11898–11907. [Google Scholar] [CrossRef] [PubMed]
- Dash, M.K.; Joshi, N.; Dubey, V.S.; Dwivedi, K.N.; Gautam, D.N.S. Screening of anti-cancerous potential of classical Raudra rasa and modified Raudra rasa modified with hiraka bhasma (nanodiamond) through FTIR & LC-MS analysis. J. Complement Integr. Med. 2022, 19, 669–682. [Google Scholar]
- Butler, H.J.; Brennan, P.M.; Cameron, J.M.; Finlayson, D.; Hegarty, M.G.; Jenkinson, M.D.; Palmer, D.S.; Smith, B.R.; Baker, M.J. Development of high-throughput ATR-FTIR technology for rapid triage of brain cancer. Nat. Commun. 2019, 10, 4501. [Google Scholar] [CrossRef] [Green Version]
- De Meutter, J.L.; Goormaghtigh, E. FTIR imaging of protein microarrays for high throughput secondary structure determination. Anal. Chem. 2021, 93, 3733–3741. [Google Scholar] [CrossRef]
- Harrigan, G.G.; LaPlante, R.H.; Cosma, G.N.; Cockerell, G.; Goodacre, R.; Maddox, J.F.; Luyendyk, J.P.; Ganey, P.E.; Roth, R.A. Application of high-throughput Fourier-transform infrared spectroscopy in toxicology studies: Contribution to a study on the development of an animal model for idiosyncratic toxicity. Toxicol. Lett. 2004, 146, 197–205. [Google Scholar] [CrossRef]
- Ellis, D.I.; Dunn, W.B.; Griffin, J.L.; Allwood, J.W.; Goodacre, R. Metabolic fingerprinting as a diagnostic tool. Pharmacogenomics 2007, 8, 1243–1266. [Google Scholar] [CrossRef] [Green Version]
- Pachetti, M.; Zupin, L.; Venturin, I.; Mitri, E.; Boscolo, R.; D’amico, F.; Vaccari, L.; Crovella, S.; Ricci, G.; Pascolo, L. FTIR Spectroscopy to Reveal Lipid and Protein Changes Induced on Sperm by Capacitation: Bases for an Improvement of Sample Selection in ART. Int. J. Mol. Sci. 2020, 21, 8659. [Google Scholar] [CrossRef]
- González-Fernández, M.J.; Manzano-Agugliaro, F.; Zapata-Sierra, A.; Belarbi, E.H.; Guil-Guerrero, J.L. Green argan oil extraction from roasted and unroasted seeds by using various polarity solvents allowed by the EU legislation. J. Clean. Prod. 2020, 276, 123081. [Google Scholar] [CrossRef]
- Lin, J.H.; Liu, L.Y.; Yang, M.H.; Lee, M.H. Ethyl acetate/ethyl alcohol mixtures as an alternative to Folch reagent for extracting animal lipids. J. Agric. Food Chem. 2004, 52, 4984–4986. [Google Scholar] [CrossRef]
- Pati, S.; Nie, B.; Arnold, R.D.; Cummings, B.S. Extraction, chromatographic and mass spectrometric methods for lipid analysis. Biomed. Chromatogr. 2016, 30, 695–709. [Google Scholar] [CrossRef] [PubMed]
- Folch, J.; Lees, M.; Sloane Stanley, G.H. A simple method for the isolation and purification of total lipides from animal tissues. J. Biol. Chem. 1957, 226, 497–509. [Google Scholar] [CrossRef]
- Iverson, S.J.; Lang, S.L.C.; Cooper, M.H. Comparison of the Bligh and Dyer and Folch methods for total lipid determination in a broad range of marine tissue. Lipids 2001, 36, 1283–1287. [Google Scholar] [CrossRef] [PubMed]
- Matyash, V.; Liebisch, G.; Kurzchalia, T.V.; Shevchenko, A.; Schwudke, D. Lipid extraction by methyl-tert-butyl ether for high-throughput lipidomics. J. Lipid Res. 2008, 49, 1137–1146. [Google Scholar] [CrossRef] [Green Version]
- Alshehry, Z.H.; Barlow, C.K.; Weir, J.M.; Zhou, Y.; McConville, M.J.; Meikle, P.J. An efficient single-phase method for the extraction of plasma lipids. Metabolites 2015, 5, 389–403. [Google Scholar] [CrossRef]
Figure 1.
Schematic representation of a FT-IR spectrometer.

Figure 2.
Schematic drawing of the macro ATR-FTIR experimental setup (reprinted with permission from [78]).
Figure 2.
Schematic drawing of the macro ATR-FTIR experimental setup (reprinted with permission from [78]).

Figure 4.
IR spectra of neutral lipids, sphingolipids, and phospholipids from 1800 to 700 cm−1 and 3100 to 2750 cm−1 (insets): cholesterol (CH), cholesterol ester (CE), galactocerobrosides (GC), sphingomyelin (SM), sulfatides (SUL), phosphatidic acid (PA), phosphatidylinositol (PI), phosphatidylethanolamine (PE), phosphatidylcholine (PC), and phosphatidylserine (PS) [reprinted with permission from [103]].


Table 1.
Online databases with information on lipids and lipidomics.
| Source | Url | Notes |
|---|---|---|
| Lipid Bank—Japanese Conference on the Biochemistry of Lipids (JCBL) | https://lipidbank.jp (accessed on 1 February 2023) | LipidBank is a free database of natural lipids including fatty acids, glycerolipids, SLs, steroids, and various vitamins.The database contains more than 6000 unique molecular structures, their lipid names, and spectral and literature information. |
| NIST Chemistry WebBook | https://webbook.nist.gov (accessed on 1 February 2023) | The NIST Chemistry WebBook provides access to: thermochemical data; IR spectra, mass spectra, UV/Vis spectra, and gas chromatography data. It is possible to search for data on specific compounds based on name, chemical formula, CAS registry number, molecular weight, chemical structure, or selected ion energetics and spectral properties. |
| Spectral Database for Organic Compounds (SDBS) | https://sdbs.db.aist.go.jp (accessed on 1 February 2023) | SDBS is an integrated spectral database system for organic compounds, which includes 6 different types of spectra: an electron impact mass spectrum (EI-MS), a Fourier-transform infrared spectrum (FT-IR), a 1H nuclear magnetic resonance (NMR) spectrum, a 13C NMR spectrum, a laser Raman spectrum, and an electron spin resonance (ESR) spectrum. |
Table 2.
Main sphingolipids present in human cells and their structures [21].
Table 2.
Main sphingolipids present in human cells and their structures [21].
| Sphingolipid Compound | Structure |
|---|---|
| Ceramide (Cer) |  |
| Sphingosine 1-phosphate (S1P) |  |
| Sphingosine (SP) |  |
| Ceramide-1-phosphate (C1P) |  |
| Dihydroceramide |  |
| Sphingomyelin (SM) |  |
| Galactosylceramide |  |
| Lactosylceramide |  |
| Glucosylceramide |  |
| Peaks Position (cm−1) | Assignments |
|---|---|
| 892 | C=C bending (fatty acid) |
| 1050–1070 | C-O-C stretching (nucleic acids and phospholipids) |
| 1085–1090 | PO-2 symmetric stretching (nucleic acids and phospholipid) |
| 1224–1240 | PO-2 asymmetric stretching (nucleic acids and phospholipid) |
| 1343 | CH2 wagging bending (phospholipid, fatty acid, and triglyceride) |
| 1367 | CH3 symmetric bending (lipids) |
| 1392–1400 | CH2 asymmetric bending, COO- stretching (proteins and fatty acids) |
| 1445–1470 | CH2 bending (mainly lipids and phospholipids, with little contribution from proteins) |
| 1456–1467 | CH3 bending (lipids, cholesterol, and proteins) |
| 1545–1549 | N-H bending (lipids) |
| 1660–1670 | C=C stretching (lipids, fatty acids) |
| 1730–1750 | C=O stretching (fatty acid ester, triglycerides, and cholesterol esters) |
| 2850–2865 | CH2 symmetric stretching (lipids, fatty acids) |
| 2870–2874 | CH3 symmetric stretching (protein side chains, lipids, with some contribution from carbohydrates and nucleic acids) |
| 2916–2925 | CH2 asymmetric stretching (mainly lipids, with little contribution from proteins, carbohydrates, and nucleic acids) |
| 2956–2970 | CH3 asymmetric stretching (lipids, fatty acids, protein side chains, with some contribution from carbohydrates and nucleic acids) |
| 3007–3015 | C-H stretching (lipids, unsaturated fatty acids) |
Table 4.
Summary of some relevant results obtained on SM by using different FT-IR spectroscopy approaches.
Table 4.
Summary of some relevant results obtained on SM by using different FT-IR spectroscopy approaches.
| References | Lipid Extraction Method/Sample Details | Spectra Collection Geometry | Aim | Main Findings |
|---|---|---|---|---|
| [99] | Commercial samples | Transmission geometry using CaF2 windows | To investigate the molecular interactions between SM and PC in phospholipid vesicles. | The changes in the acyl chains and SM, conformation induced by PC are observed. |
| [100] | Commercial samples | Transmission geometry using CaF2 windows | To study the effects of temperature and pressure on structural and conformational properties of PC/SM/cholesterol model raft mixtures. | The conformational properties of the lipid systems are monitored by examining the positions and intensities of infrared absorption bands. |
| [101,102] | Rat brain tissue samples | Transmission geometry using CaF2 windows | To examine the spatial distribution of molecular changes associated with C6 glioma progression. | The concentrations of SM, nucleic acids, PS, and glucocerebroside are significantly affected during C6 glioma development. |
| [103] | Lipids extracted from brain tissues using Folch and Bligh and Dyer methods. | Transmission KBr pellets | To analyze the lipid extracts from the brain to identify their composition. | Lipid content can be evaluated via FT-IR spectroscopy, which may improve the differential diagnosis of brain cancers. |
| [104,105] | Commercial samples and lipids extracted from PC-3 cells using Bligh and Dyer method. | ATR | To analyze the changes in the lipidome of prostate cancer PC-3 cells after exposure to sub-lethal ouabain levels. | Lipid alterations induced by ouabain can be identified by variations in the ester/choline/phosphate ratios in FT-IR spectra. |
| [96] | Commercial samples and lipids extracted from PC-3 cells using Bligh and Dyer method. | Micro-ATR | To develop PLS models based on FT-IR spectra to determine the changes in the amounts of different lipids in extracts from PC-3 cells treated with four antitumor drugs. | After treatments with anticancer drugs, the spectral region of the polar headgroups of samples did not show any noticeable alterations. However, the developed PLS models can be used for high-throughput measurements. |
| [106] | Commercial samples | ATR | To investigate the changes occurring in detergent-resistant membranes (DRM) extracted from human breast cancer cells when treated with the omega 3 fatty acid docosahexaenoic acid. | FT-IR spectroscopy and multivariate analysis enables to monitor the changes in the composition of DRMs. This approach can be useful for label-free characterization of lipid component in cells. |
| [107] | Commercial samples | Transmission geometry using CaF2 windows | To examine the interaction profile of carboplatin at varying concentrations with SM multilamellar vesicles. | Carboplatin affects the phase transition, enthalpy, the cooperativity parameter, the phase transition temperature, the lipid order, the lipid fluidity, and the hydrogen state of specific groups in hydrophilic parts of the examined samples. |
Table 5.
Summary of some relevant results obtained on Cer, Cer-SP, and Cer-SM by using different FT-IR spectroscopy approaches.
Table 5.
Summary of some relevant results obtained on Cer, Cer-SP, and Cer-SM by using different FT-IR spectroscopy approaches.
| References | Sphingolipids | Lipid Extraction Method/Sample Details | Spectra Collection Geometry | Aim | Main Findings |
|---|---|---|---|---|---|
| [108] | Cer | Commercial samples | ATR | To investigate the conformational order and phase behavior of Cers. | A thorough investigation of headgroup and intermolecular chain interactions in hydrated non-hydroxy fatty acid (NFA) and hydroxy fatty acid (HFA). Cers is obtained via FT-IR spectroscopy. In addition, information regarding the structure and conformational order of the NFA and HFA Cer chain subcells is derived from the temperature dependency of the methylene stretching, scissoring, and rocking mode frequencies. |
| [109] | Cer | Commercial samples | ATR | To understand the function of the skin barrier organization by means of a detailed characterization of Cer functions and molecular interactions. | FT-IR spectroscopy provides a useful tool for studying domain formation, chain packing, and hydration sites of orthorhombic and hexagonal phases. |
| [110,111,112] | Cer | Commercial samples | Transmission geometry using CaF2 windows | To use FT-IR spectroscopy to investigate the thermotropic phase behavior of the Cers. | FT-IR results show that there are strong intramolecular hydrogen interactions between the hydroxy groups in the Cer headgroup. The amide I and amide II bands are affected by the phase transitions of Cer. |
| [113] | Cer SP | In vivo lipids extraction from tissues by using cyanoacrylate strips | n.a. | To review some methods for analyzing skin lipids and SL structures. | FT-IR spectroscopy is used: to evaluate the state of the order of hydrocarbon chains in terms of population of trans and gauche conformers, the packing behavior, and phase transitions; to elucidate the polymorphism and the hydrogen-bonding network of the headgroups; to characterize the hydration properties of phytosphingosine and SP-Cer. |
| [114] | Cer | Commercial samples | ATR | To study the influence of the Cer headgroup architecture on the lamellar organization of Cers with FT-IR spectroscopy. | The findings revealed that Cer polar structural variations influence their lamellar organization, which may have an impact on the biological evolution of Cers in the stratum corneum. |
| [115] | Cer | Commercial samples | Transmission geometry using CaF2 windows | To determine the influence of free fatty acid (FFA) chain length on the phase behavior of stratum corneum intercellular membranes. | FFA chain length influences the phase behavior, the properties of lipid mixing, and the transition temperatures. FFA chain lengths are present in the stratum corneum and could be necessary for the coexistence of a proportion of solid lipids with some more fluid domains. |
| [116] | Cer | Commercial samples | Transmission geometry using CaF2 windows | To look into the role of pseudo-ceramide in regulating the phase property of lipid membranes. | The results show that the hydrogen bonding interaction between the carboxyl group of stearic acid and the amide group of pseudo-ceramide helps to stabilize the membrane lamellar structure. |
| [102] | Cer SM | Commercial samples | Transmission geometry using CaF2 windows | To identify spectroscopic indicators for early tumor growth diagnosis and examine the spatial distribution of molecular alterations linked to C6 glioma progression. | Cer, DNA, and SM levels are found to be increased in the tumor region and decreased in the invasive and normal brain structures. These compounds can be used as spectroscopic markers to detect tissue abnormalities early and distinguish between normal, invasion, tumor, and necrosis. |
| [117] | Cer | Commercial samples | Transmission geometry using CaF2 windows | To design a hyaluronic acid–ceramide (HACE) nanostructure for tumor-targeted drug delivery that was embedded with docetaxel (DCT)-loaded poly (D,L- lactide-co-glycolide) nanoparticles (NPs). | The appearance of the distinctive HACE peaks in the spectrum of the DCT/PLGA/HACE NPs demonstrated that the DCT/PLGA NPs were successfully embedded into the HACE nanostructure. |
| [118] | Cer SM | Commercial samples | Transmission geometry using CaF2 windows | To investigate polar headgroup interactions between SM and Cer. | The study describes the peculiar properties of the SM and Cer sphingosine-based headgroups that are not found in glycerolipids. |
Table 6.
Summary of some relevant results obtained on SP and S1P using different FT-IR spectroscopy approaches.
Table 6.
Summary of some relevant results obtained on SP and S1P using different FT-IR spectroscopy approaches.
| References | Sphingolipids | Lipid Extraction Method/Sample Details | Spectra Collection Geometry | Aim | Main Findings |
|---|---|---|---|---|---|
| [119] | SP S1P | Commercial samples | Transmission using CaF2 windows | To study the effects of SP and stearylamine on the interaction of PS with calcium. | Using different experimental techniques information on SP and its interaction with other lipids are obtained. |
| [120] | SP S1P | n.a. | n.a. | To quantitatively determine the apparent pKa of lipid carboxyl groups and the dehydration degree of the phosphate group of phospholipids. | The results indicate the presence of a very strong interaction. |
| [96] | SP | Commercial samples and lipids extracted from PC-3 cells using Bligh and Dyer method | ATR | To develop PLS models based on FT-IR spectra to determine the changes in the amounts of different lipids in extracts from PC-3 cells treated with four antitumor drugs. | A quantitative determination of SP content is obtained. |
| [121,122,123,124] | S1P | Plant extract | KBr pellets | To evaluate the effects of nanoparticles drug delivery. | S1P receptors are identified by quantitative real-time polymerase chain reaction. |
| [125] | SP S1P | Serum samples from pituitary adenomas | ATR-FTIR | To diagnose pituitary adenomas using ATR-FTIR, Raman, and mass spectrometry. | Nucleic acids, lipids, amides, phosphate, and polysaccharides/C-residue helixes can all be identified as being regulated differently via ATR-FTIR; various sphingosine derivatives are also discovered to be expressed differently via mass spectrometry-based analysis. |
| [126] | SP S1P | Ayurvedic medicines | Liquid precursor/gel/solid coatings on KBr pellets | To characterize functional group of different medicines. | SP is identified via LC-MS. |
Disclaimer/Publisher’s Note: The statements, opinions and data contained in all publications are solely those of the individual author(s) and contributor(s) and not of MDPI and/or the editor(s). MDPI and/or the editor(s) disclaim responsibility for any injury to people or property resulting from any ideas, methods, instructions or products referred to in the content. |
© 2023 by the authors. Licensee MDPI, Basel, Switzerland. This article is an open access article distributed under the terms and conditions of the Creative Commons Attribution (CC BY) license (https://creativecommons.org/licenses/by/4.0/).
Share and Cite
MDPI and ACS Style
Faramarzi, B.; Moggio, M.; Diano, N.; Portaccio, M.; Lepore, M. A Brief Review of FT-IR Spectroscopy Studies of Sphingolipids in Human Cells. Biophysica 2023, 3, 158-180. https://doi.org/10.3390/biophysica3010011
AMA Style
Faramarzi B, Moggio M, Diano N, Portaccio M, Lepore M. A Brief Review of FT-IR Spectroscopy Studies of Sphingolipids in Human Cells. Biophysica. 2023; 3(1):158-180. https://doi.org/10.3390/biophysica3010011
Chicago/Turabian StyleFaramarzi, Bahar, Martina Moggio, Nadia Diano, Marianna Portaccio, and Maria Lepore. 2023. "A Brief Review of FT-IR Spectroscopy Studies of Sphingolipids in Human Cells" Biophysica 3, no. 1: 158-180. https://doi.org/10.3390/biophysica3010011