
Skid Resistance of Asphalt Pavements
1
Multidisciplinary Technical Scientific Doctoral School, Széchenyi István University, 9026 Győr, Hungary
2
Duna Group, 1138 Budapest, Hungary
3
KTI Institute for Hungarian Transport Sciences and Logistics Non-Profit Ltd., 1119 Budapest, Hungary
4
Department of Transport Construction and Water Management, Széchenyi István University, 9026 Győr, Hungary
*
Author to whom correspondence should be addressed.
Eng 2023, 4(2), 1597-1615; https://doi.org/10.3390/eng4020091
Submission received: 25 April 2023
/
Revised: 24 May 2023
/
Accepted: 1 June 2023
/
Published: 6 June 2023
(This article belongs to the Special Issue Feature Papers in Eng 2023)
Abstract
:Skid resistance of a road pavement surface is the force developed when a tyre is prevented from rotating and slides along the pavement surface. This property comes from the combination of the macro- and micro-texture of pavement. The skid resistance of an asphalt pavement is an important parameter influencing driving safety on a road since there is a proven relationship between skid resistance and accident parameters. This paper deals with the measurement principle of pavement skid resistance (surface friction) including longitudinal and transverse friction. A high number of measuring devices of skid resistance are also introduced, highlighting their advantages and limitations. Moreover, the measurement policies in the European Union and in Hungary are outlined. Pavement surface texture is investigated, dealing with the levels of surface texture, the most common measuring techniques, the macro-texture features of asphalt types, as well as the Hungarian regulation in the field. As a related topic, the aggregate properties and their implication in the relevant Hungarian specification are introduced briefly as well. Some outcomes of the EU’s COST Action 354 on the development of unified European macro-roughness and skid resistance performance indicators and indices are also presented.
1. Introduction
Skid resistance of a road pavement surface is the force developed when a tyre is prevented from rotating and slides along the pavement surface. This is a property that characterises the macro- and micro-texture of pavement, and shows the effect on frictional forces when the surface receives wheel loading. One of the main reasons for the spread of asphalt is that it provides favourable resistance to sliding and driving conditions for each road vehicle type. However, safety need to be considered under different environmental and construction conditions. The skid resistance of an asphalt pavement is an important parameter influencing driving safety on a road.
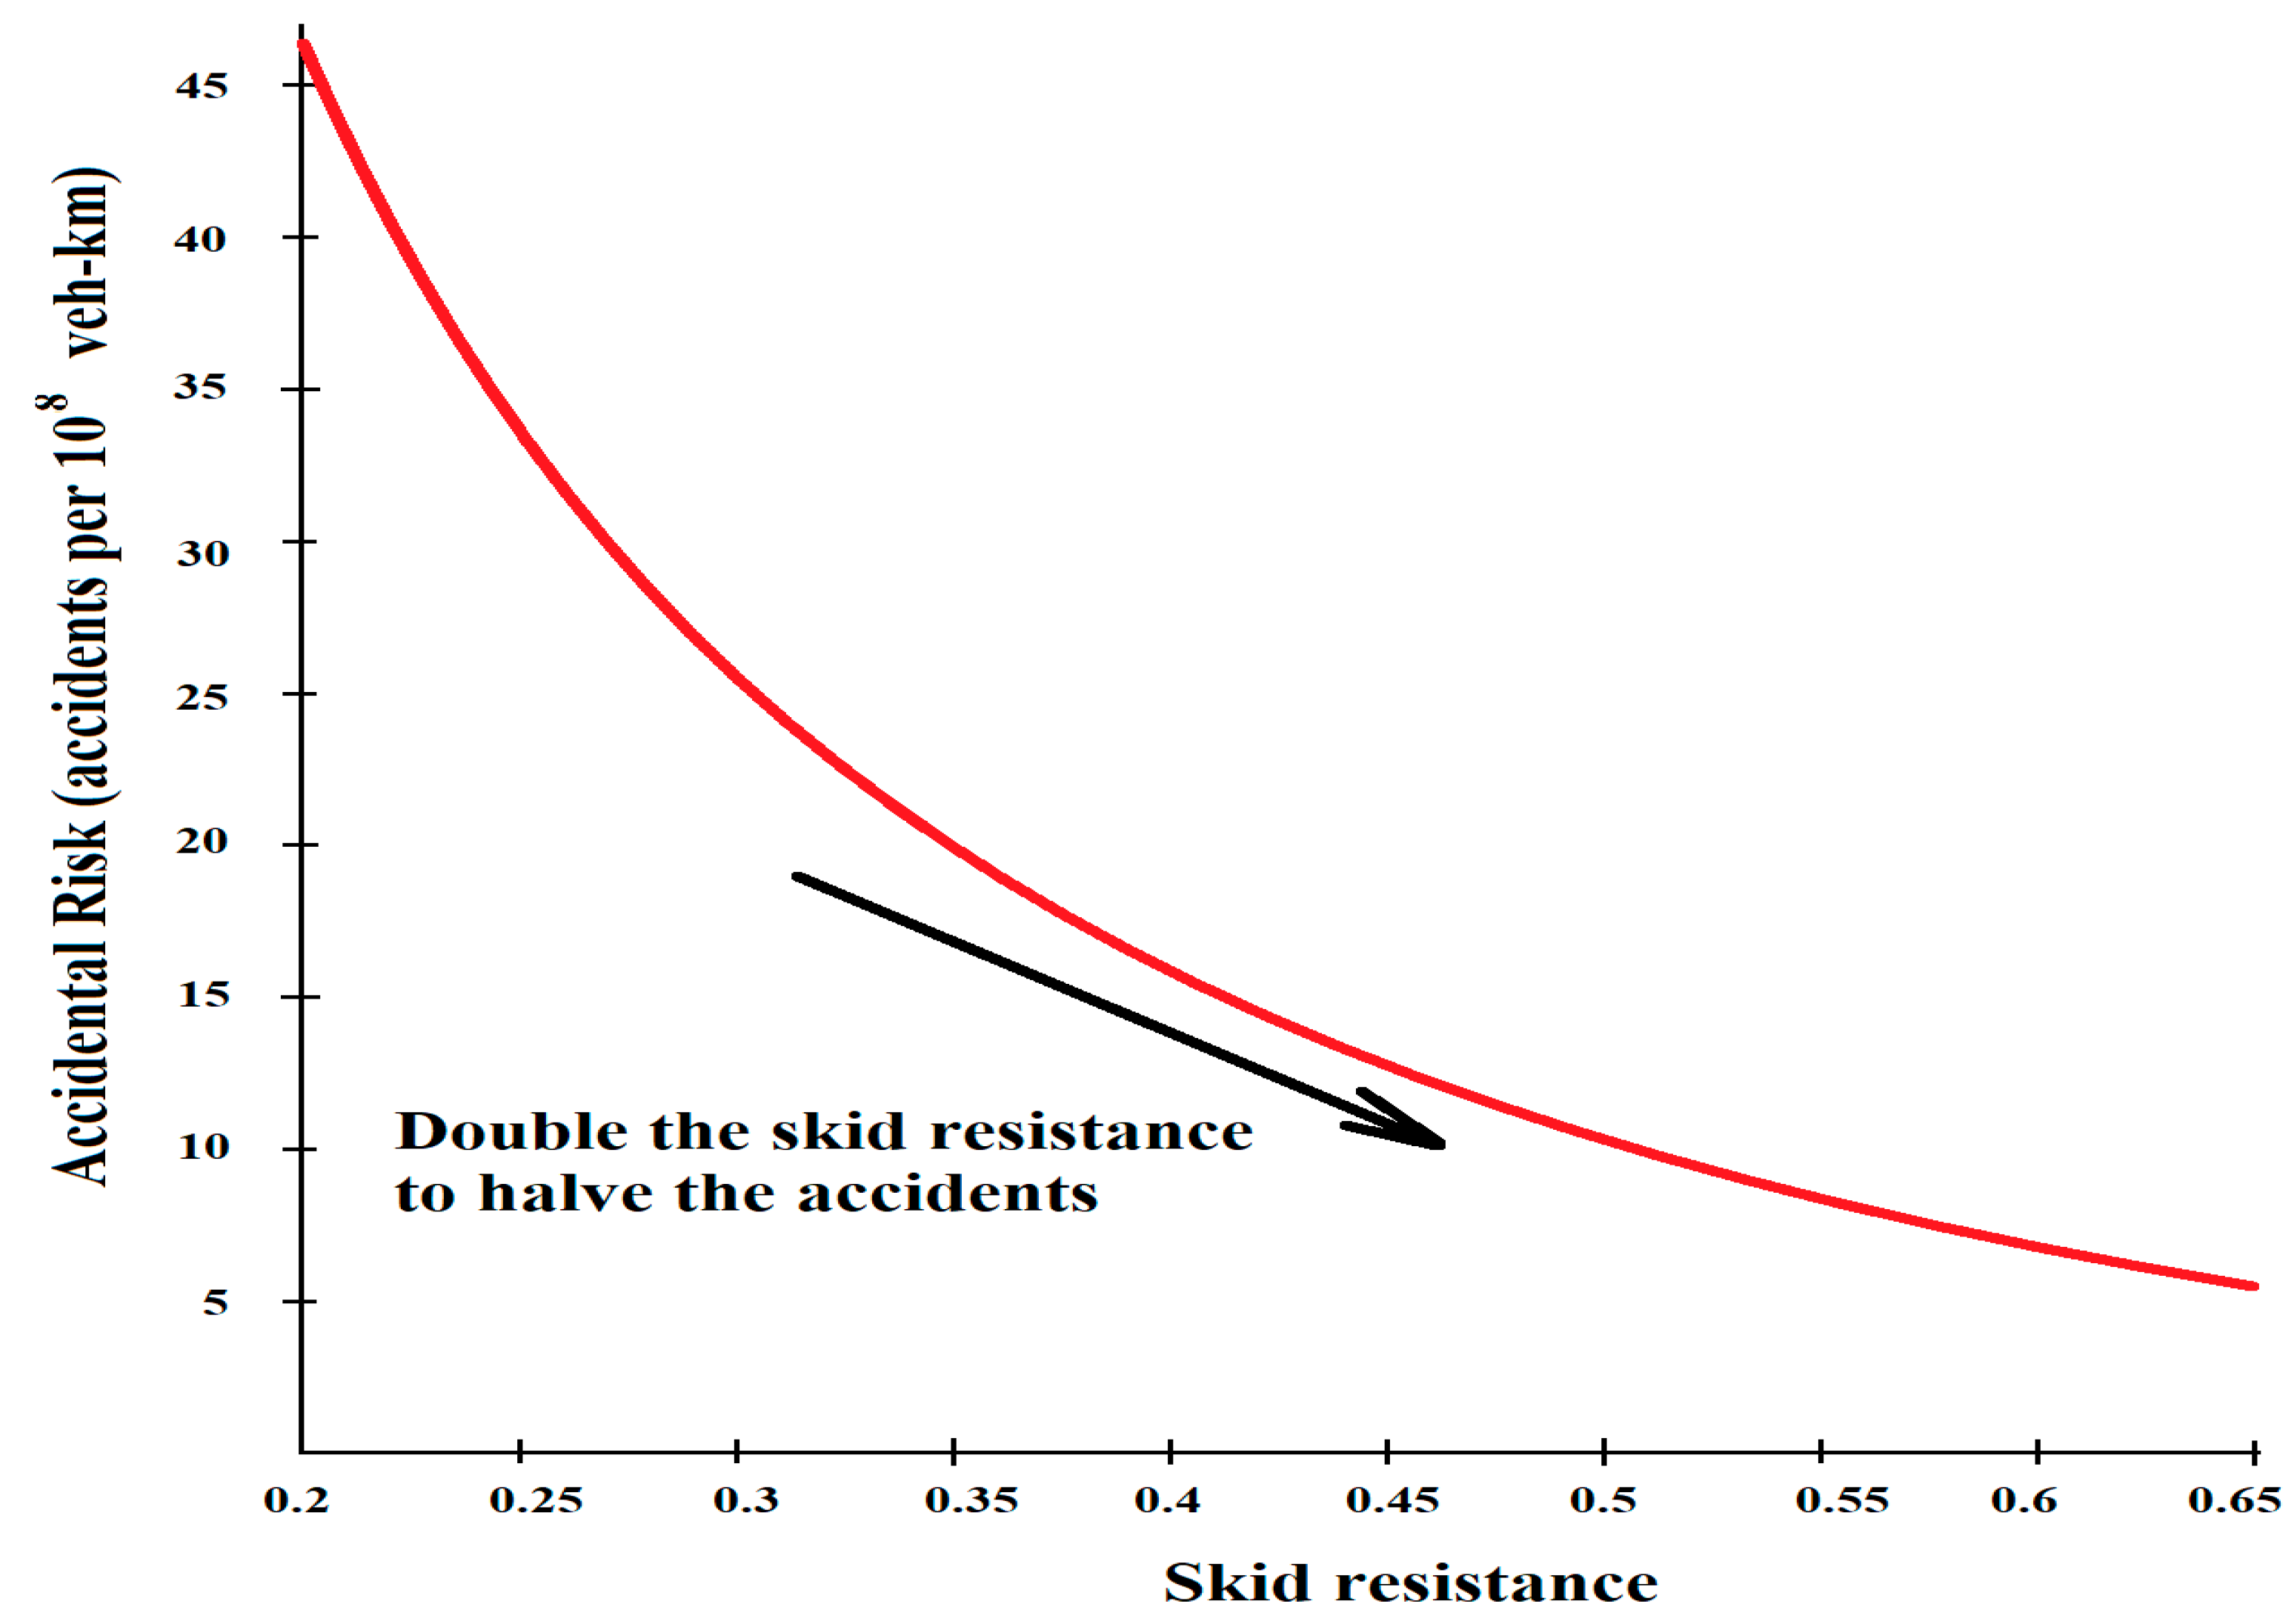
The fact that the slip resistance of pavement surfaces and the frequency of crashes are closely related is worldwide and accepted. However, several studies concluded that when the friction of the surfaces falls below a site-specific threshold, the number and severity of collision accidents on wet pavement surfaces increase significantly [1,2]. An example of such a relationship developed for single carriageways by English researchers shows that crash (road accident) risk approximately halves as pavement friction doubles over normal ranges (Figure 1) [3].
Asphalt pavements usually provide good driving conditions for all road vehicles, and are therefore widespread worldwide. Nevertheless, there are safety problems that need to be investigated and possibly solved. There is a good relationship between the skid resistance of pavement surfaces and accidents (crashes). The exact nature of the relationship between pavement friction and wet crashes is site-specific, as it is influenced by not only pavement friction but other factors as well. Therefore, the relationship between pavement friction and wet crashes should be determined for a given pavement network.
Skid resistance/friction have two components, namely, adhesion and hysteresis. These components largely depend on two properties of the pavement surface: macro-texture and micro-texture. The macro-texture and micro-texture of a pavement surface largely depends on the type, size, shape, and quality of coarse aggregates used in the asphalt mixture. The widely applied hot mix asphalt (HMA) types generally have similar (or at least comparable) micro-texture values. Their frictional performance follows the same order as their macro-textures. The skid resistance of an asphalt pavement changes (typically worsens) over time, and is affected by various environmental factors. At the same time, differences in the pavement surface temperatures can significantly influence the reliability of skid resistance measurements [4].
2. Pavement Friction
2.1. Pavement Friction Generalities
Pavement friction is the force that resists the relative motion between a road vehicle tyre and a pavement surface. The resistive force, characterized by the non-dimensional friction coefficient, μ, is the ratio of the tangential friction force (F) between the tyre tread rubber and the horizontal travelled pavement surface to the perpendicular force or vertical load (Fw) and is calculated as:
μ = F/Fw,
Pavement friction plays a vital role in keeping vehicles on the road, as it provides drivers the ability to control/manoeuvre their vehicles in a safe manner, in both the longitudinal and the lateral directions. It is a key input for highway geometric design, as it is used in determining the adequacy of the minimum stopping sight distance, minimum horizontal radius, minimum radius of crest vertical curves, and maximum super-elevation in horizontal curves. So, it can be concluded that the higher the friction available at the pavement–tyre interface, the more control the driver has over the road vehicle [5].
2.2. Longitudinal Frictional Forces
Longitudinal frictional forces occur between a rolling pneumatic tyre of a road vehicle (in the longitudinal direction) and the road surface when operating in the free rolling or constant-braked mode. In the free rolling mode (no braking), the relative speed between the tyre circumference and the pavement, referred to as the slip speed, is zero. In the constant-braked mode, the slip speed increases from zero to the potential maximum of the speed of the vehicle. The following mathematical relationship explains slip speed [6]:
where
S = V − Vp = V − 0.68 ωr,
- S is the slip speed, mi/h;
- V is the vehicle speed, mi/h;
- Vp is the average peripheral speed of the tyre, mi/h;
- ω is the angular velocity of the tyre, rad/s;
- r is the average radius of the tyre, ft.
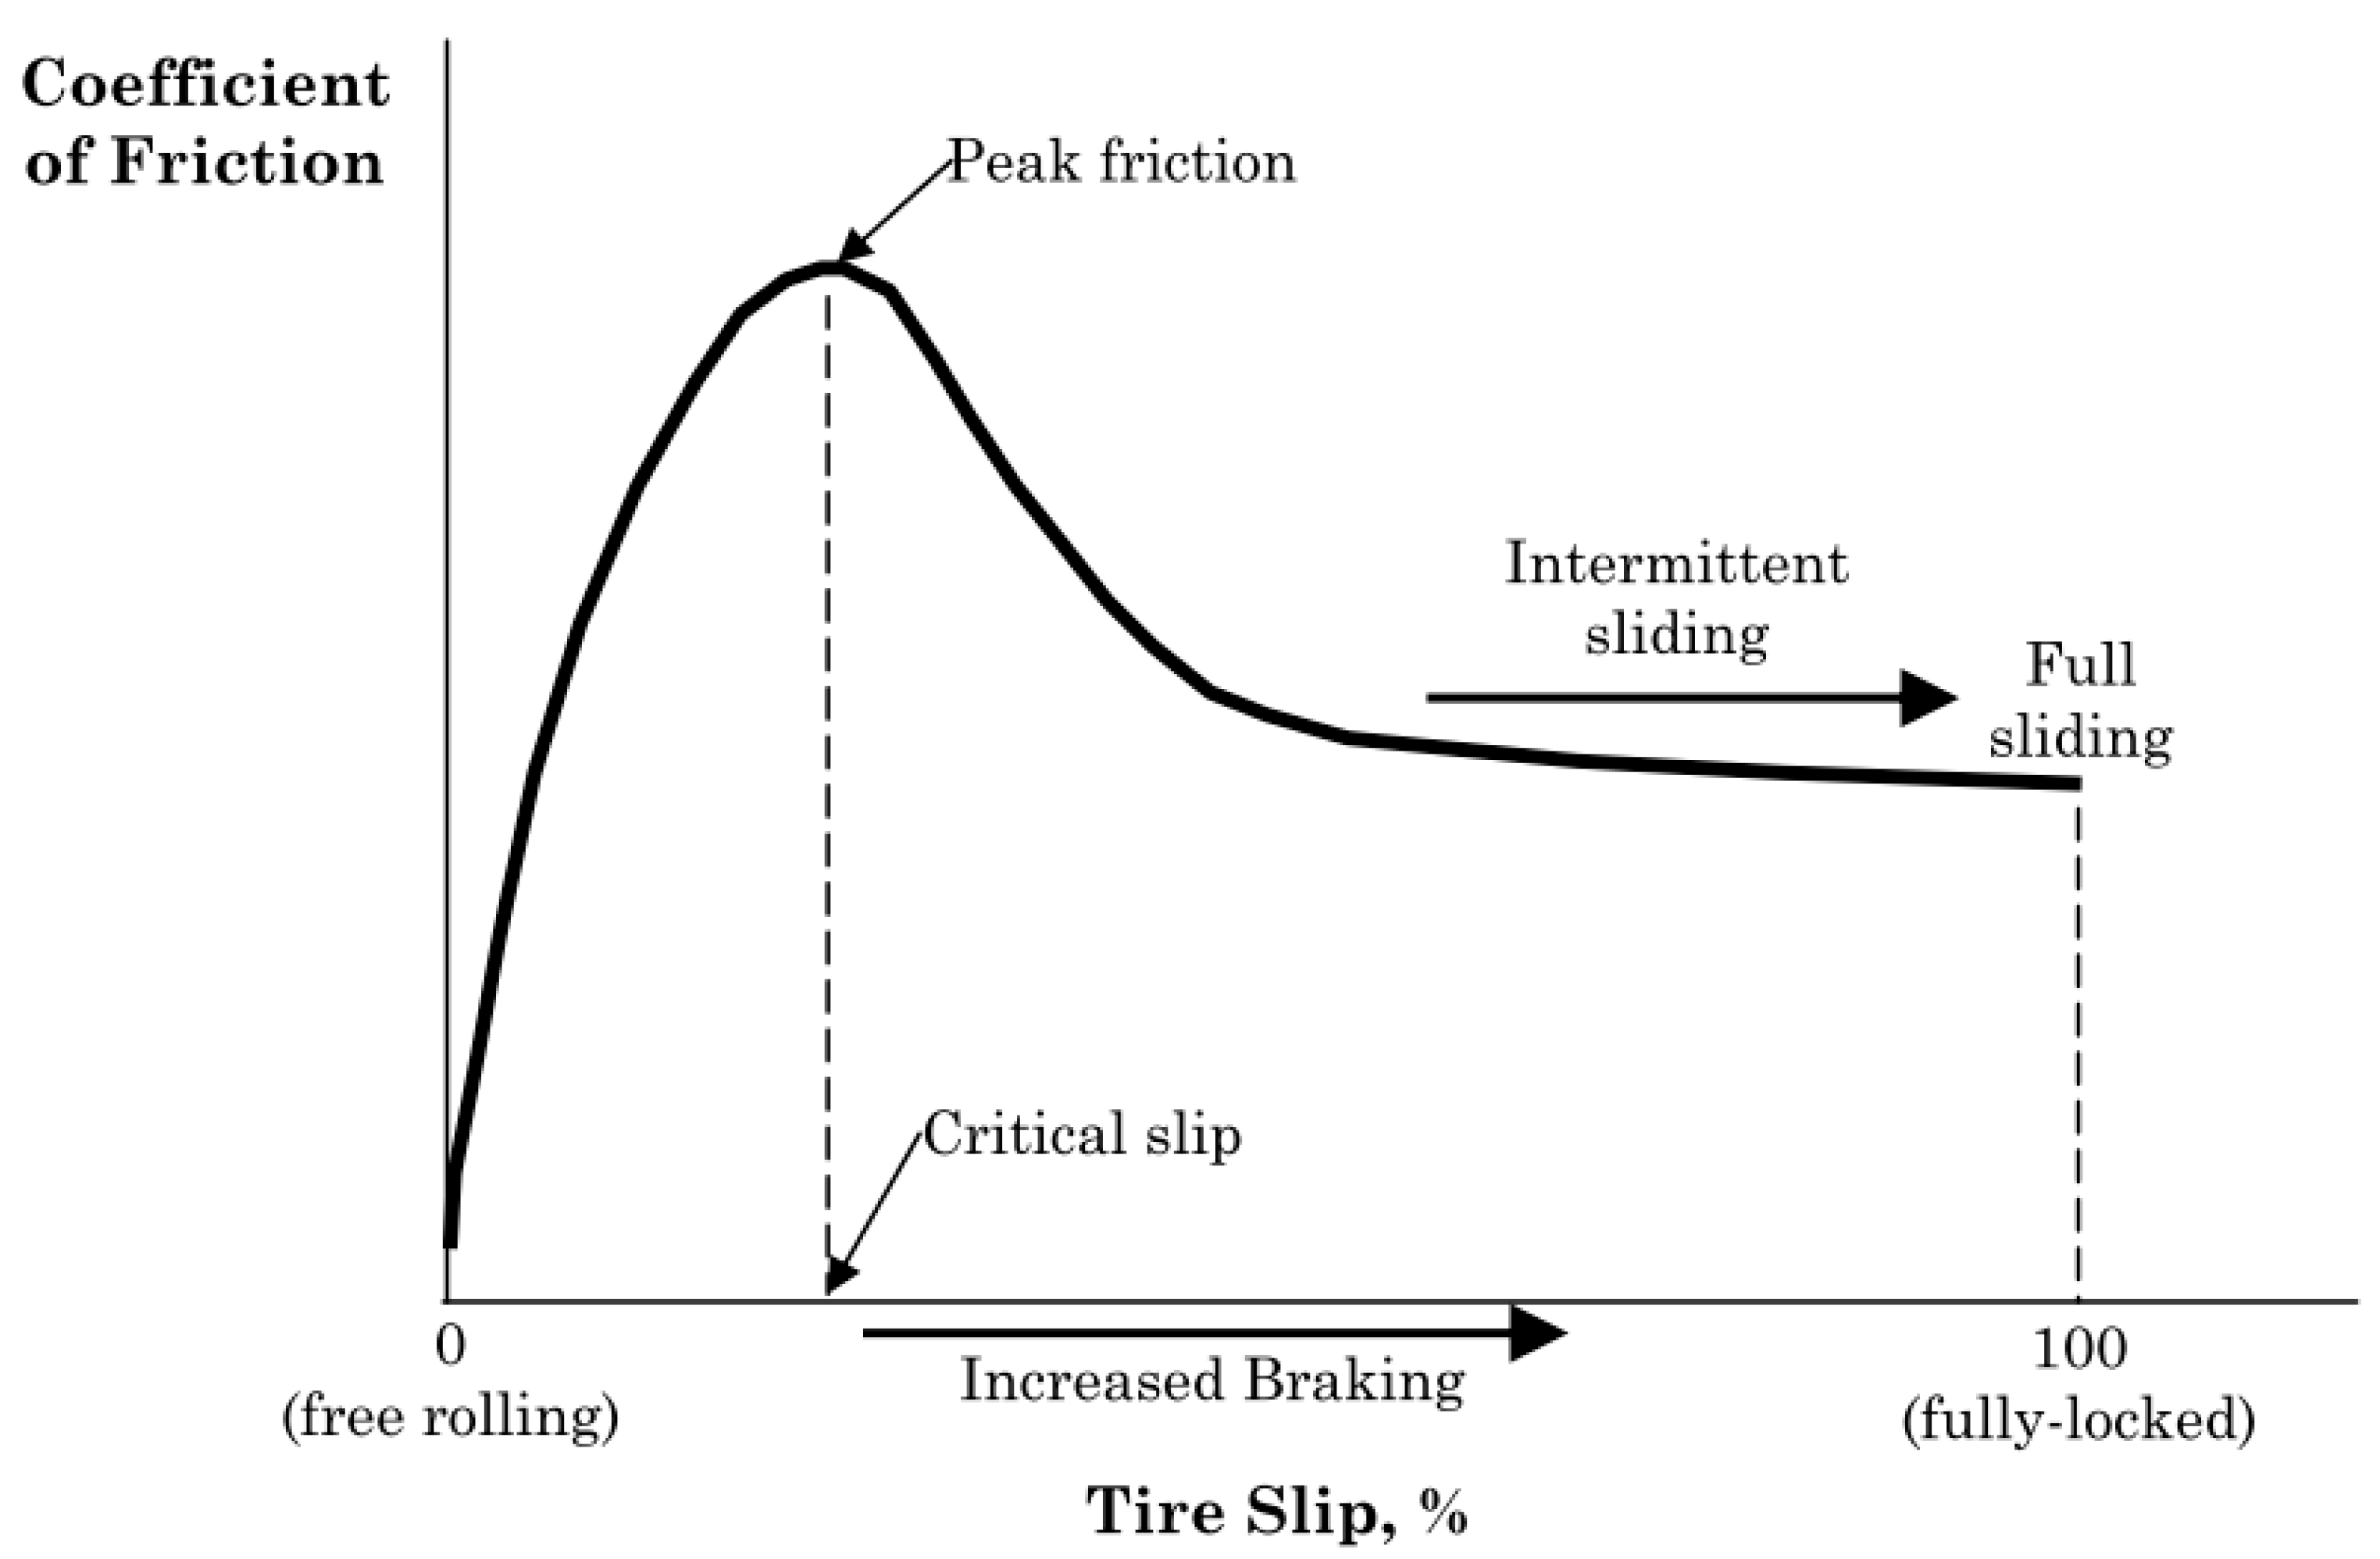
The coefficient of friction between a tyre and the pavement surface changes with varying slip, as shown in Figure 2 [7]. The coefficient of friction increases rapidly with increasing slip to a peak value that usually occurs between 10 and 20% slip (critical slip). The friction then decreases to a value (coefficient of sliding friction), which occurs at 100% slip. The difference between the peak and sliding coefficients of friction may equal up to 50% of the sliding value, and is much greater on wet pavement surfaces than on dry ones.
The relationship shown in Figure 2 is the basis for the anti-locking brake system (ABS), which takes advantage of the front side of peak friction, and minimizes the loss of side/steering friction due to sliding action. Road vehicles with ABS are designed to apply the brakes on and off (i.e., pump the brakes) repeatedly, such that the slip is held near the peak. The braking is turned off before the peak is reached, and turned on at a set time or slip % below the peak. The actual timing is a proprietary design of the manufacturer [6].
2.3. Lateral Frictional Forces
Another important aspect of friction is the lateral (side-force) friction, which occurs as a vehicle changes direction or compensates for pavement cross-slope and/or cross-wind effects. The relationship between the forces acting on the vehicle tyre and the pavement surface as the vehicle steers around a curve, changes lanes, or compensates for lateral forces is as follows:
where
Fs = V2/15R − e,
- Fs is the slide friction;
- V is the vehicle speed, mi/h;
- R is the radius of the path of the vehicle’s centre of gravity (also, the radius of curvature in curve), ft;
- e is the pavement super-elevation, ft/ft.
2.4. Combined Braking and Cornering
In the case of combined braking and cornering, the driver of the vehicle either risks not stopping as rapidly or losing control due to reduced lateral/side forces. When operating at the limits of tyre grip, the interaction of the longitudinal and lateral forces is such that as one force increases, the other must decrease by a proportional amount. The application of longitudinal braking decreases the lateral force significantly. Similarly, the application of high lateral force leads to less effective longitudinal braking [8].
Many researchers call it friction circle or friction ellipse (Figure 3) [9], the vector sum of the two combined forces remains constant (circle) or near constant (ellipse). When operating within the limits of tyre grip, the amount of braking and turning friction components can change independently as long as the vector sum of these components does not exceed the limits of tyre grip (coming from friction circle or friction ellipse). The degree of ellipse depends on several features of tyre and road pavement.
3. Measuring Surface Friction (Skid Resistance)
3.1. Measurement Principles
The three major operating principles of frictional measuring equipment are: longitudinal friction coefficient (LFC), sideway force coefficient (SFC), and sliders that can be stationary or slow-moving (slow speed) devices.
The longitudinal friction coefficient (LFC) measurement principle is applied when the vehicle is travelling in a straight line, and the brake pedal is pressed; braking forces with the help of the braking system are transmitted to the wheels of road vehicle; the angular speed of the wheel decreases, kinetic vehicle rolling energy converts to thermal energy, and the vehicle slows down. However, in the case of too high braking forces, the vehicle wheels block and the vehicle starts to slide on the pavement surface, friction forces are generated in the tyre, and road contact surface slowing down the vehicle. Longitudinal friction coefficient measurement devices create this wheel blocking process by producing a controlled sliding process. Slip ratio is also applied to assess and compare wheel and vehicle speeds. Slip ratio varies from 0 to 1:
- 0: wheel speed is the same as vehicle speed, wheel rolls freely;
- 1: wheel is fully blocked, and slides on the pavement surface.
The optimal slip ratio value varies from 0.15 to 0.20. In this interval is ensured the highest LFC and shortest vehicle stopping distance. When the slip ratio is higher, the vehicle wheel starts to block and slide. The majority of longitudinal friction measurement devices apply fixed slip ratio, which is determined automatically. However, some of the devices utilize variable slip ratio, increasing friction force until the wheel starts to block. Devices with fixed slip ratio are more appropriate for monitoring purposes because they measure continuously, while variable slip ratio devices can measure short lengths of road, which is why they are more suitable for various research purposes [10,11].
Transverse friction measurement principle is applied when the vehicle is travelling in a horizontal curve, and the wheels of the road vehicle are turned. The angle between vehicle and turned wheel direction is called slip angle (δ). Slip angle induces friction between tyre and road, which in turn generates a centripetal force opposing the centrifugal force exerted on the vehicle in the bend, allowing the vehicle to follow the curve. When the braking force grows, the wheel starts to slip over the surface of the road pavement. The sideways friction coefficient (SFC) varies with the slip angle of the vehicle tyre. Normally, the maximum SFC value occurs at a slip angle between 4° and 7° for cars, and between 6° and 10° for trucks. Skid resistance measurement devices commonly use fixed slip angle; they are more appropriate for pavement monitoring purposes since they measure continuously while variable slip ratio devices can measure just short road sections, and consequently, are more appropriate for research tasks [10,11].
The stationary or slow-moving equipment measurement principle is used by devices, which are light, simple, portable, and mostly used for laboratory or stationary testing. Static devices utilise rubber sliders to make contact with the road surface with a mechanism that initiates relative motion between the slider and the road. Two devices are used: the pendulum arm, which swings and with a rubber slider contacts the surface until friction forces slow down the slider; and the rotating head with sliders, which is lowered on to the road so that friction between the sliders and the road causes the head to slow down. Slow-moving devices are used to measure friction at a very low speed or when stationary, but these devices are good for measuring friction for special purposes (e.g., road marking) [12].
3.2. Measurement Devices
The measurement of pavement friction is rather hard, because the frictional forces being measured are sensitive to a number of factors, which are difficult to control. Such factors include texture, temperature, chemistry of materials, etc., of the road pavement. Others are connected with the tyre (its tread design, rubber composition, sliding velocity temperature, etc.) and fluid/contaminant (viscosity, density, thickness of film, etc.). However, during friction measurement, all other factors except the road surface are kept constant. The pavement surface is then wetted with a specified amount of water and a standardized measuring tyre is used on friction measuring equipment to characterise the pavement friction. Therefore, a high number of skid measurement devices was developed and currently are used in various countries [13]. This equipment utilises different measurement speeds, tyres, wheel loads, and water film thickness. Some measurement devices are similar due to the measurement principle, but the measurement method is not the same. Table 1 introduces the skid resistance measuring devices that are being used in in the EU. It can be seen that more devices use the LFC method than the SFC method.
Devices based on the LFC principle can measure LFC at different speeds (typically between 40 and 140 km/h), are relatively small, and have better mobility. They are commonly completed as trailers. However, it is always required to have an additional water metering system, which is mounted in an accompanying vehicle. At the same time, transverse friction measurement devices perform measurement at a medium speed, the devices are bigger, and their operation costs are significantly higher. However, these devices are supplemented with large water tanks allowing them relatively long-distance measurements [12]. Measurement devices with installed pavement macro-texture measurement equipment allow also measuring mean profile depth (MPD) for further comparisons and analysis of pavement surface condition and identifying the interrelationship between skid resistance and the MPD of the road surface to be characterized. Stationary and slow-moving devices are slow and unproductive since these measurements are carried out mechanically. However, these devices are useful when performing measurements in specific locations. However, stationary and slow-moving devices are cheap, and can be easily transported and operated.
3.3. Measurement Policy in EU
In the European Union, most countries have national skid resistance measurement policies, such as methodologies, purposes, devices, thresholds, and frequency measurements for road categories during the monitoring system such as a condition index. In many EU countries, measurements for routine monitoring are made between spring and autumn.
An important factor in skid resistance measurement policy is the threshold levels, which are the values that are compared with the skid resistance characteristic values and can initiate some kind of action when the skid resistance falls to the threshold level. The threshold can be a fixed or “warning” type. A fixed threshold is the value of skid resistance, and when it falls below this value, action to improve the surface must be taken. Warning thresholds are a good option because if skid resistance falls below this level it provides a warning that accident risk may be increasing, and therefore an investigation should be made to assess whether treatment is necessary or appropriate. In some EU practice, threshold levels are mostly based on statistics, accident analysis, and theoretical calculations (accident risk calculations). For countries that are introducing skid resistance policy, a good option is to set thresholds utilizing another country’s regulation, which has networks with similar characteristics and comparable traffic “culture”.
Many EU countries mostly apply measurements for secondary roads, primary roads, and motorways. Measurement frequency also varies due to the use of different devices, different size of road networks, and different allocated funds. Some countries measure twice a year while other countries measure annually, every 2nd, 3rd, or 5th year. Regarding measurement frequency due to the significance of roads, it is observed that in most of EU countries, skid resistance measurements in motorways are performed annually, in primary roads annually or every 2nd year, and in secondary roads every 2nd year [12].
3.4. Measurement Policy in Hungary
In Hungary, tyre and pavement surface friction measurements need to be measured on newly built motorways and main roads after building new roads or reconstruction works during the quality control (acceptance test). However, skid resistance is currently not a qualification but a data collection feature. In the case of the construction of asphalt pavements, this kind of measurement of the surface layers (wearing courses) must be performed 3 months after road opening. The skid resistance must be measured on the pavement surface using the Sideway-force Coefficient Routine Investigation Machine (SCRIM) road survey vehicle in accordance with e-UT 09.02.23:1999 [14] or using ASFT equipment based on e-UT 09.02.27:2009 Hungarian Road Regulation (UME) [15]. Measurements shall be made at a speed of 50 km/h per road traffic lane, at a distance of 0.8 to 1.2 m from the right lane edge, in the same direction as traffic. ASFT value should be converted to SCRIM value using the following empirical formula:
where
αSFC = 0.65x2 – 0.35x + 0.42,
- x is the measured ASFT value;
- αSFC is the coefficient of skid resistance determined by SCRIM surface friction tester.
The skid resistance of a surface layer can also be determined by the SRT (pendulum) test in accordance with EN 13036-4:2012 [16] measured every 500 m per traffic lane.
The e-UT 09.02.23:1999 UME [14] specifies surface course skid resistance (SFC) thresholds measured by the SCRIM apparatus for various asphalt concrete types (Table 2) based on Hungarian measurement results.
The upper limit values of Table 2 (e.g., 0.80) characterize the skid resistance at the new pavements (in 3 months after road opening), while the lower ones (e.g., 0.50) are related to heavily worn road surfaces. The e-UT 09.02.27:2009 UME [15] recommended skid resistance limits for SFT values measured by ASFT method based on Hungarian and international experience, and measurement results (Table 3).
There are differences in principle between the two regulations currently in Hungarian practice [14,15]. The specification for SCRIM measurement defines ranges for different types of pavement. The Road Technical Directives for ASFT apparatus differentiates only the road category regardless of the actual type of pavement. Here, however, it is possible to determine the thresholds that can be defined in accordance with the actual European practice. When choosing limit values, there is always more favourable and less favourable specified values due to empirical formulas. It is also obvious that measurements based on two different principles are rather difficult to apply at the same time because the comparison of measuring results of different measuring techniques creates an almost unsolvable problem. Using the empirical formula, it can be concluded that the interventional threshold values are in fairly close agreement in the proposed categories of both procedures.
4. Pavement Surface Texture
4.1. Measurement Principles
As described in the previous chapter, there are several factors influencing pavement friction forces. An NCHRP report [17] summarised these factors, dividing them into four categories (pavement surface characteristics, vehicle operational parameters, tyre properties, and environmental factors) (Table 4). Friction should be viewed as a process instead of an inherent property of the pavement. It is only when all these factors are fully specified that friction takes on a definite value.
Among these factors, micro-texture and macro-texture, as well as pavement materials properties (and slip speed), can be managed in a pavement management system, and can be controlled by regulations.
4.2. Measurement Principles
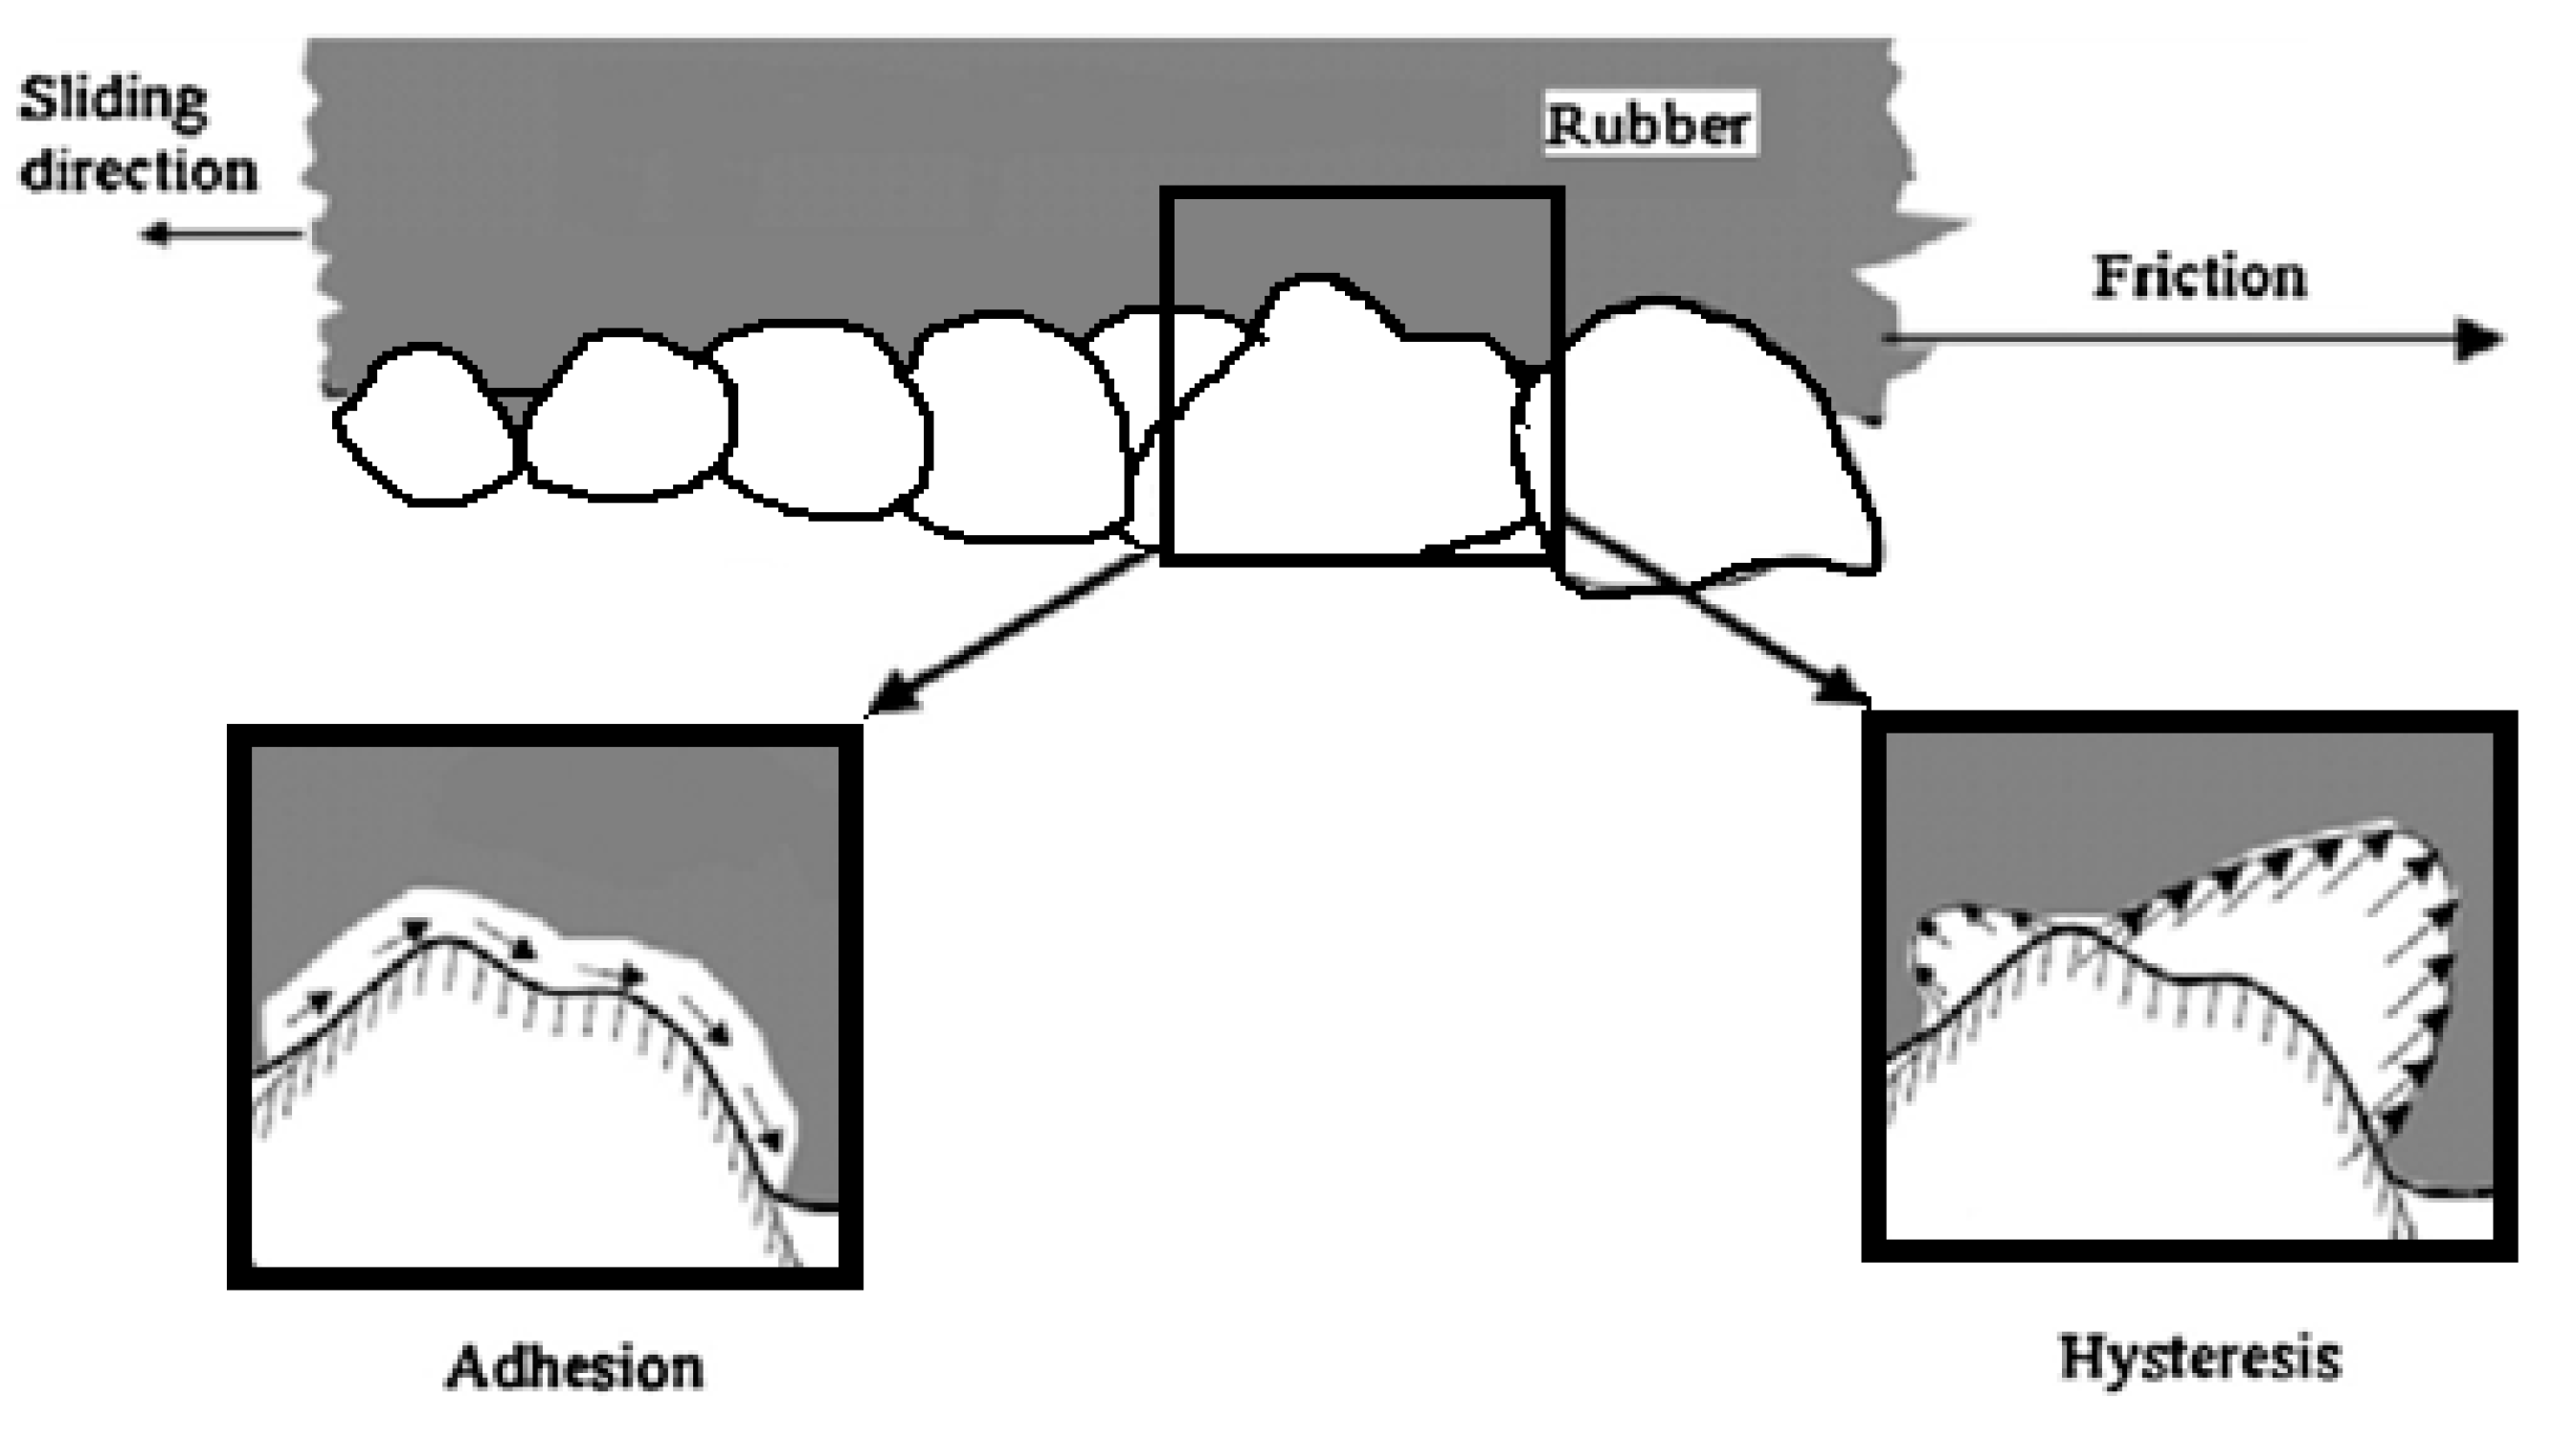
Pavement friction is occasioned by the combination of two mechanisms: adhesion and hysteresis (Figure 4). Adhesion comes from molecular bonds in areas of high local pressure resulting from pavement unevenness. Hysteresis is the consequence of energy loss resulting from the deformation of the tyre rubber around the protuberances and depressions in the road surface. However, there are also two other less important components of tyre friction: frictional contributions from rubber wear, and surface (or micro) hysteresis as opposed to bulk hysteresis. The cohesion loss component of friction from rubber wear was verified through testing recently [18].
4.3. Measurement Principles
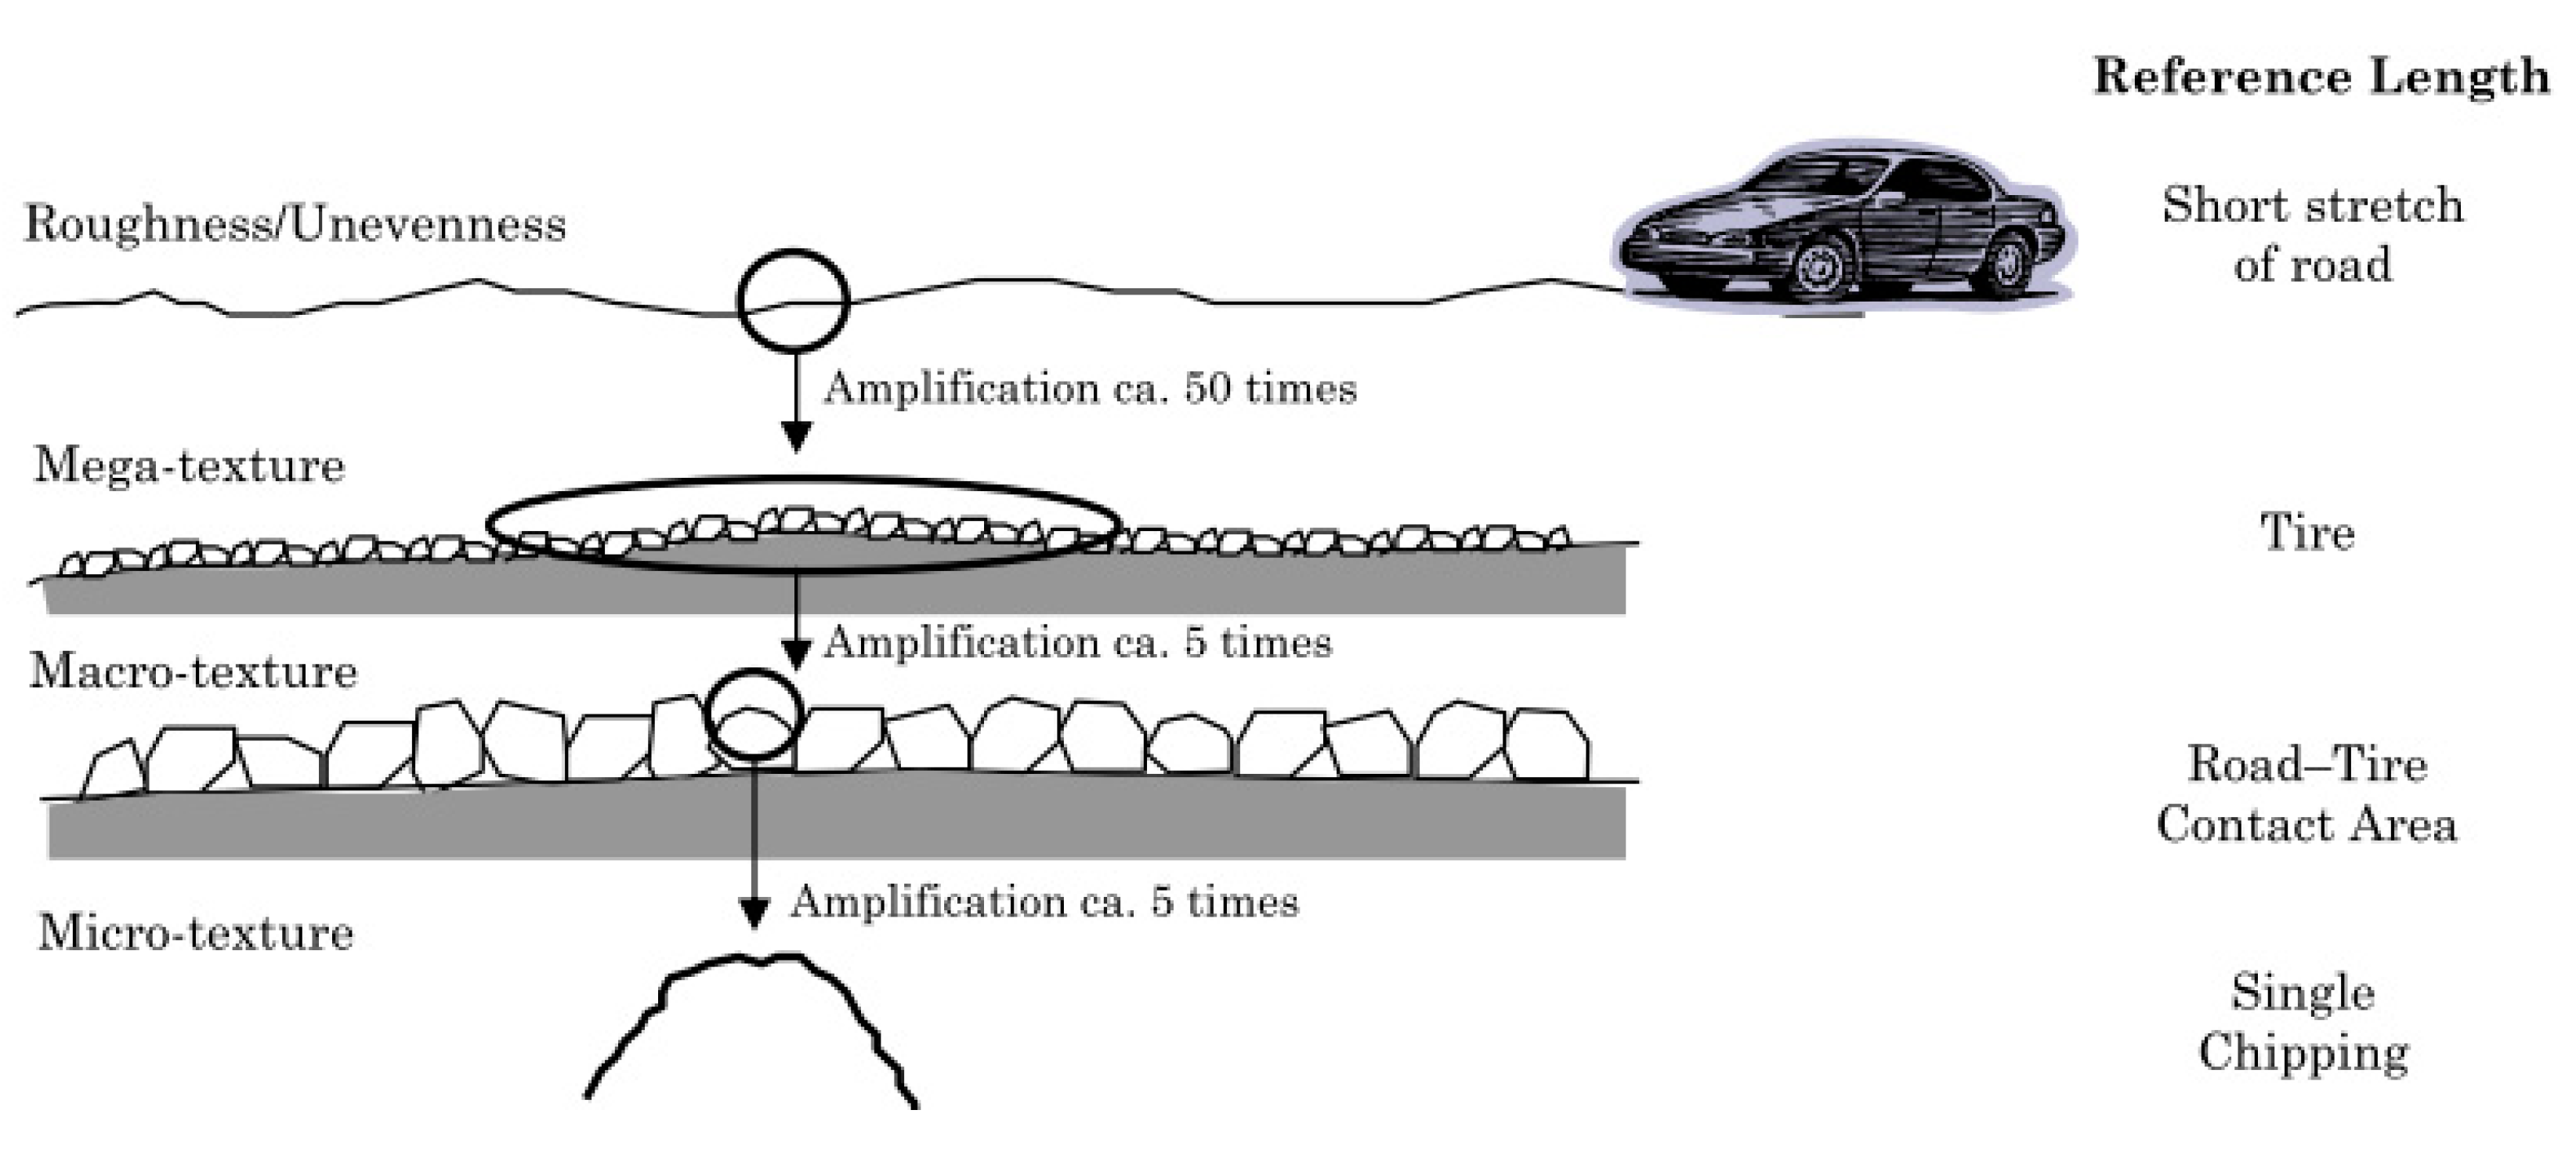
Pavement surface texture is defined as the deviations of the road surface from a true flat one. These deviations occur at three distinct levels of scale, each defined by the wavelength (λ) and peak-to-peak amplitude (A) of its components. The three levels of texture are as follows [5,19]:
- Micro-texture (λ < 0.5 mm, A = 1 to 500 µm): Surface roughness quality at the sub-visible or microscopic level. It depends on the surface properties of the aggregate grains in the asphalt or concrete paving material;
- Macro-texture (λ = 0.5 to 50 mm, A = 0.1 to 20 mm): Surface roughness quality de-fined by the mixture properties (shape, size, and gradation of aggregate) of asphalt paving mixtures and the method of finishing/texturing used on a concrete surface;
- Mega-texture (λ = 50 to 500 mm, A = 0.1 to 50 mm): Texture with wavelengths in the same order of size as the pavement–tyre interface. It is mainly affected by the distress, defects, or “waviness” on the surface of road pavement;
- Wavelengths above 500 mm are defined as roughness (USA) or unevenness (UK).
Figure 5 illustrates the three texture ranges, as well as a fourth level, rough-ness/unevenness, representing wavelengths with more than 500 mm of mega-texture.
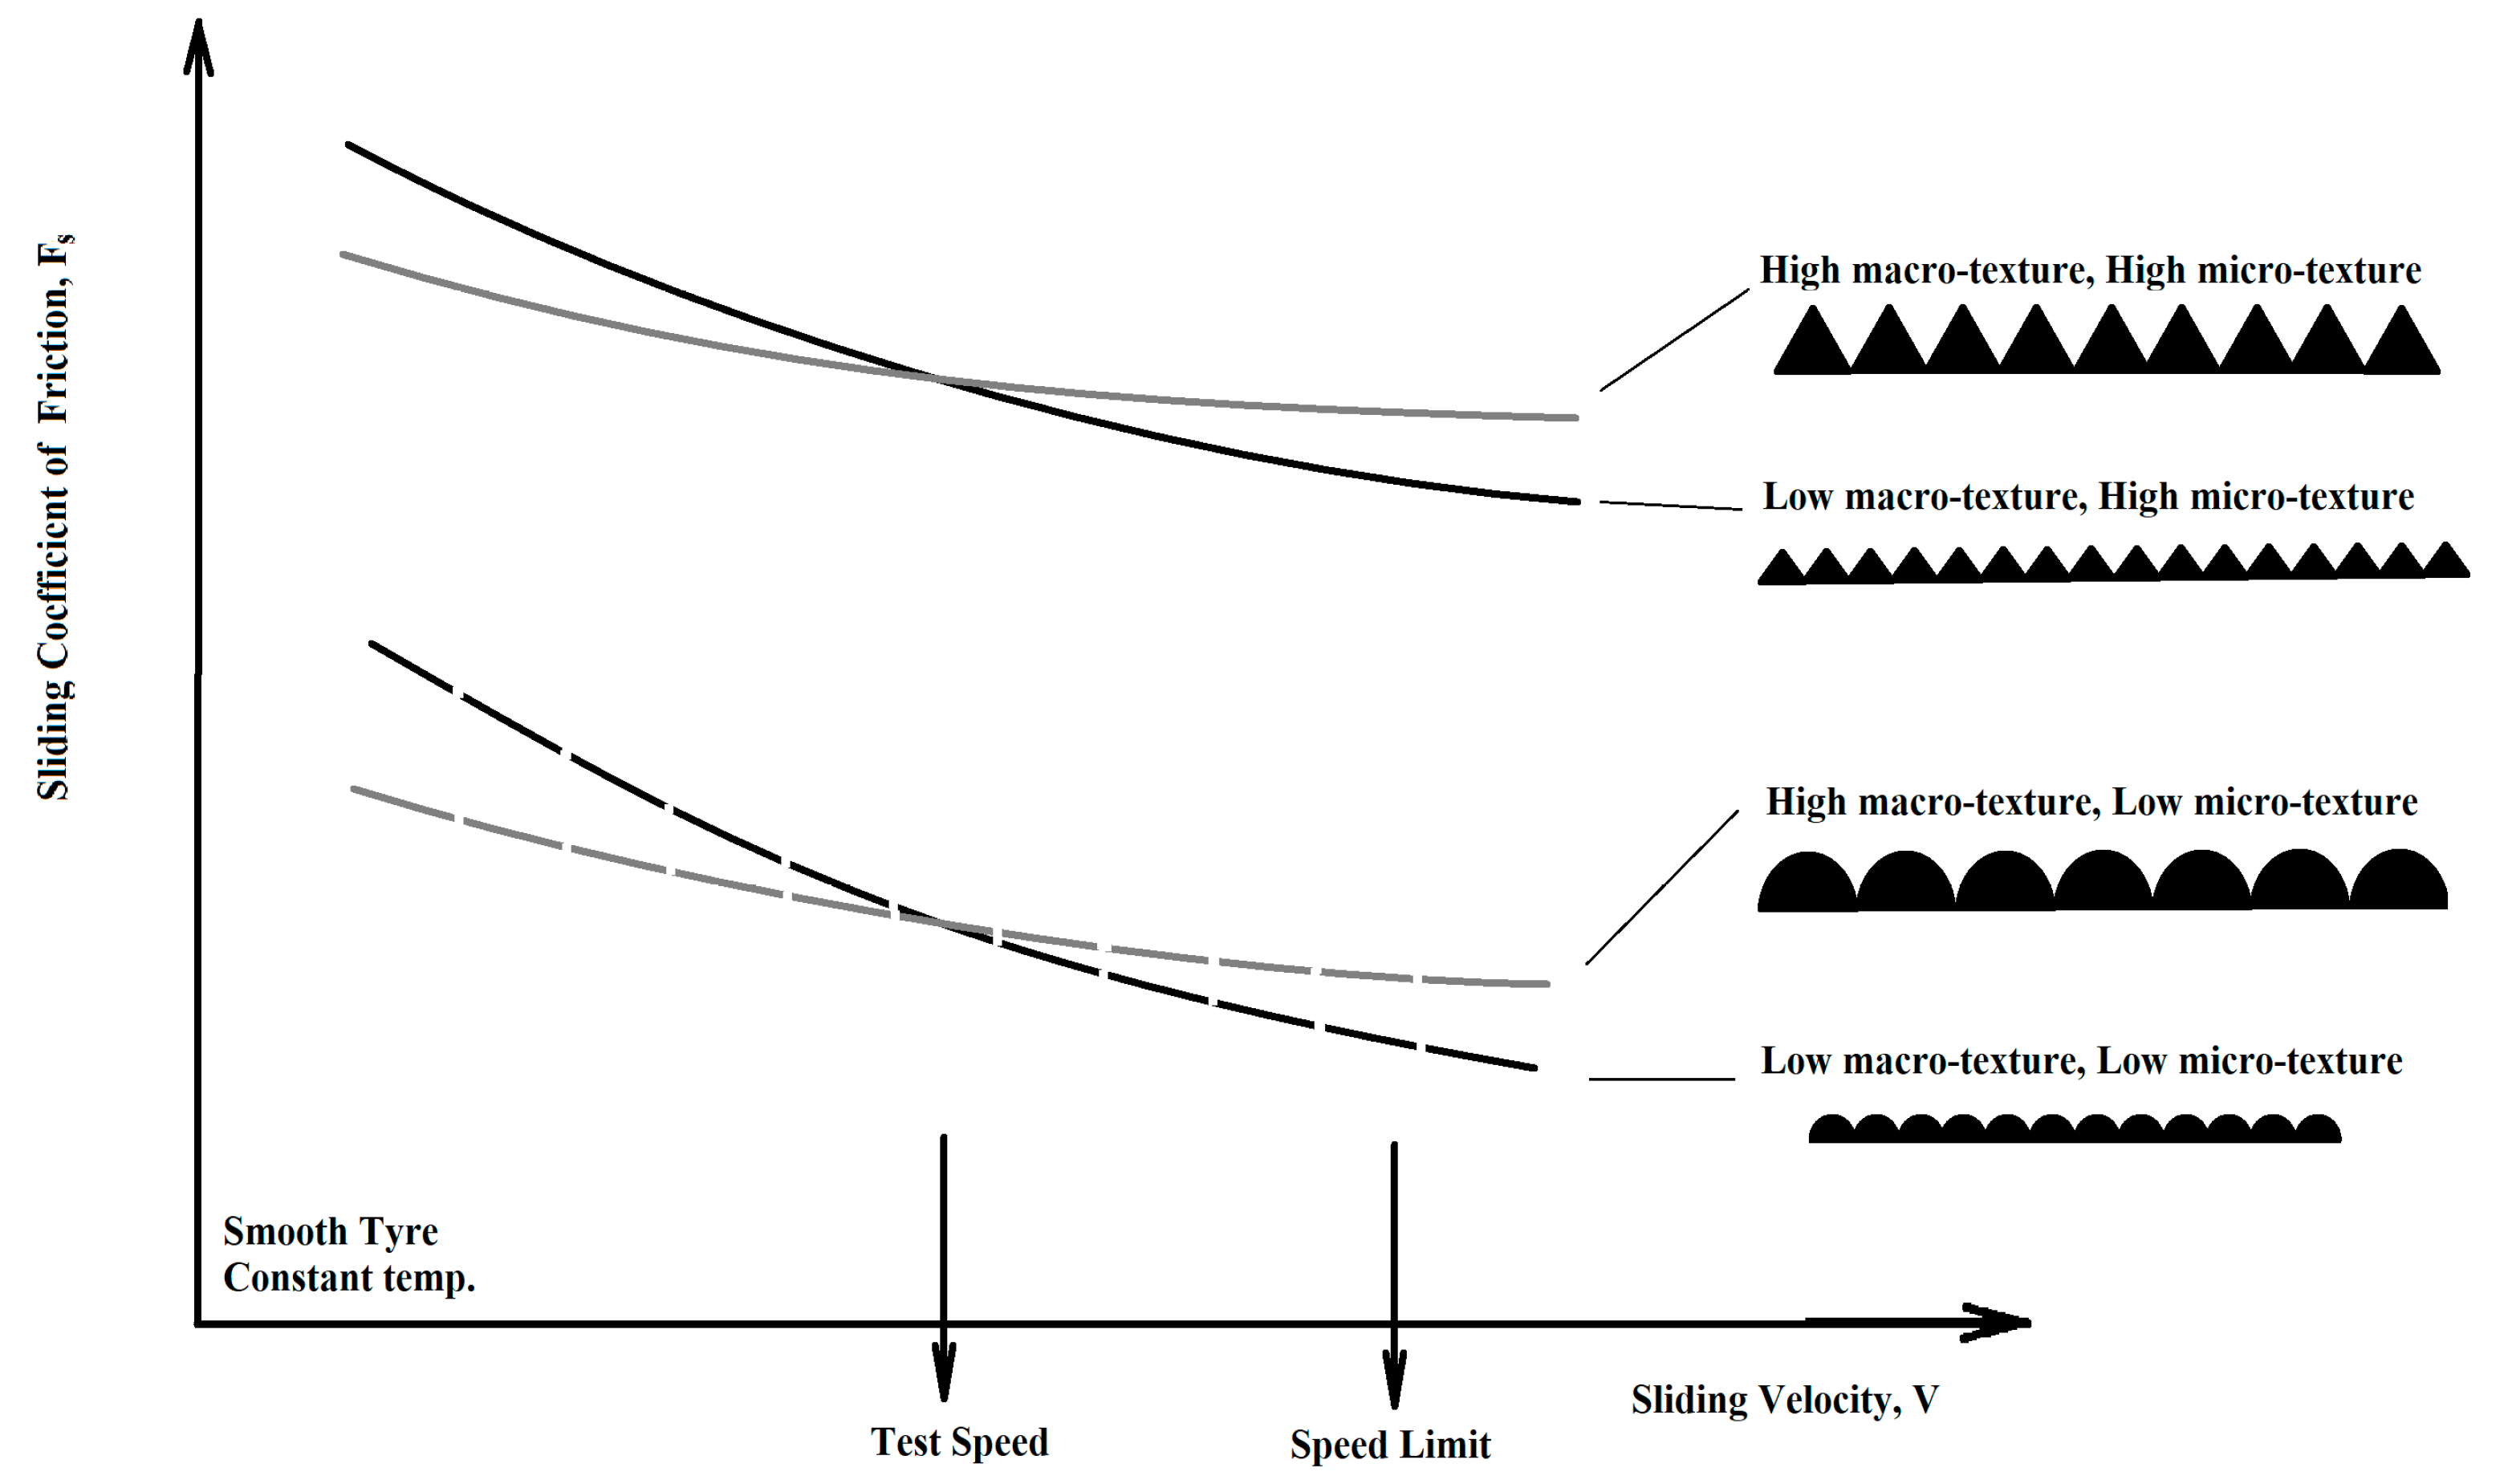
Figure 6 shows the relative effects of micro-texture, macro-texture, and measuring speed on pavement friction. It is obvious, that the micro-texture of pavement surface affects the magnitude of tyre friction, while macro-texture has an impact on the friction–speed gradient. At low speeds, micro-texture dominates the wet and dry friction level. At higher speeds, the presence of high macro-texture facilitates the drainage of water so that the adhesive component of friction afforded by micro-texture is re-established by being above the water. Hysteresis grows with speed exponentially, and at speeds above 65 mi/h (105 km/h) accounts for more than 95% of the pavement friction [17].
4.4. Pavement Texture Measurement
The majority of the generally used methods for pavement texture measurement are related to macro-texture. These are mostly rubber-on-road techniques. More recent developments in non-contact measurements are geared towards micro-texture measurements. The most common macro-texture measuring equipment are volumetric sand patch method, circular texture meter and the outflow meter.
The sand patch method (SPM) [20,21] is a volumetric-based spot test method that assesses pavement surface macro-texture through the spreading of a known volume of glass beads or sand of controlled grain size in a circle onto a cleaned pavement surface area, and through the measurement of the average diameter of the resulting circle. The volume of sand or glass bead spread divided by the area of the circle is reported as the mean texture depth (MTD):
MTD = 4V/(πD2)
The outflow meter method (OFM) [22] is a volumetric test method measuring the water drainage rate through surface texture and interior voids. It provides information about the hydroplaning potential of a pavement surface by relating to the escape time of water under a moving vehicle tyre. The equipment consists of a cylinder with a rubber ring on the bottom and an open top. Sensors measure the time required for a known volume of water to pass under the seal or into the pavement. The measurement parameter, outflow time (OFT), defines the macro-texture; high time indicates smooth macro-texture, while low time rough one.
The circular texture meter (CTM) [23] is a non-contact laser device measuring the profile of pavement surface along a circular path of 11.25 in (286 mm) diameter at intervals of 0.034 in (0.868 mm). The texture meter device rotates at 20 ft/min (6 m/min) and generates profile traces of the pavement surface. These data are transmitted, and stored on a portable computer. Two kinds of macro-texture indices can be computed from these profiles: mean profile depth (MPD) and root mean square (RMS). MPD is actually a two-dimensional estimate of the three-dimensional MTD [17].
High-speed methods for characterizing pavement surface texture are typically based on non-contact surface profiling techniques, such as the Road Surface Analyzer (ROSAN V) developed by the FHWA [24]. It is a portable, vehicle-mounted, automated system for the measurement of pavement texture at highway speeds along a linear path. The device incorporates a laser sensor mounted on the vehicle’s front bumper and the device can be operated at speeds of up to 70 mi/h (113 km/h). The system calculates both MPD and estimated mean texture depth (EMTD) using a transformation equation [5].
The portable Model 9300 laser texture scanner (LTS) [25] is a laser-based equipment. It is capable of determining a range of texture parameters also. It precisely characterises surface elevations at intervals <0.25 mm. Its more recent version is capable of measuring texture profiles with wavelengths down to 0.05 mm. The system can compute MPD, estimated texture depth (ETD), texture profile index (TPI), RMS, and band-passed filtered elevation.
4.5. Macro-Texture Properties of Various Asphalt Mixture Types
Based on the asphalt binder manufacturing process and temperatures used, there are two types of asphalt mixes: hot mix asphalt (HMA) or warm mix asphalt (WMA). HMA is heated and laid at temperatures between 150 °C and 190 °C, while WMA is manufactured and laid under the HMA’s temperature by 15–40 °C. HMA is the conventionally used mix and predates the WMA. Production of WMA is cheaper, and can remain workable for longer period than HMA. No significant difference can be detected between the early slip resistance of the two mixture types. HMA can be classified further into three categories, based mainly on different aggregate grading, which has an important effect on surface macro-texture [26].
Dense graded HMA: well- or continuously graded mixture of coarse and fine aggregates, mineral filler, and 5–6% bituminous binder are categorized by nominal maximum aggregate sizes (ranging from 9.5 mm to 19.0 mm) into fine-graded and coarse-graded. The former has a higher % of sand and small stones than the latter one. Proper design and placement leads to relatively impermeable mixes. Mixes are suitable for all pavement layers and traffic conditions. Gap- and open-graded mixes have similar micro-texture values showing lower texture depths (typically 0.4–0.6 mm for fine-graded and 0.6–1.2 mm for coarse-graded) than gap- and open-graded mixture types.
Gap-graded HMA or Stone mastix asphalt (SMA): aimed at creating stone-on-stone contact within mixture to improve tyre grip and rutting (deformation) resistance. It contains more durable aggregates, higher (polymer-modified) bitumen content (6–9%), fillers, and fibres. Hence, it is more expensive than the other options. Their wet weather friction and lower tyre noise due to its coarser surface texture are among favourable features. It also shows less severe cracking. Their macro-texture depths typically exceed 0.8 mm, usually higher than those of dense graded mixes.
Open-graded HMA or porous asphalt (PA): designed to be water permeable. Hence, it uses mostly coarse aggregates, small percentage of sand/mineral filler, and 3–6% bituminous binder. The layer must contain >15% air voids. It shows similar micro-texture values to other mixture types but larger macro-texture (typically of 1.0–3.0 mm depth). Importantly, this version shows higher friction values than gap- and dense-graded mixes [5,19,27].
4.6. Hungarian Regulation for Measuring the Macro-Texture
In accordance with the relevant Hungarian road technical directives [28], asphalt surface course layers must meet certain macro-texture requirements during quality assurance. On the surface of the wearing courses, the macro-texture shall be measured in all traffic lanes, in the outer and inner wheel tracks, in every 6000 m2. The measured values of the macro-texture of the wearing course in accordance with relevant EN standard [20] shall meet the requirements presented in Table 5.
In the case of cement concrete pavement surfaces, according to the Hungarian directives [28], the requirements for macro-textures for different texture levels are provided in Table 6. The primary role of macro-texture, characterized by measuring sand depth, is to prevent the formation of a coherent water film, in the case of intense rain, its achievable value depends on the method of surface formation [29]. It must be measured during the quality assurance every 500 m in the outer and inner wheel tracks per lane.
In Hungary, Road Survey Tester (RST) [30] is used for quality assurance measurement, and for systematic road condition monitoring by determining several pavement condition parameters. Thanks to its Laser Scanning technique and software background, this method also allows the vehicle to determine MTD value, derived from MPD using a transformation equation. The surface texture shall be measured in the following wave length ranges: 1 to 10 mm (fine macro-texture), 10–100 mm (coarse macro-texture), and 100–500 mm (mega-texture). The measured values are the root mean square of the pavement surface wave heights.
5. Aggregates Characteristics
5.1. Aggregates Characteristics Generalities
The coefficient of friction is significantly affected by the grading of aggregates used for the manufacturing of bituminous mixtures. The extent to which the pavement surface provides adequate skid resistance depends largely on the aggregate, especially as the micro-texture plays a key role in the development of tyre–pavement friction, and it is mainly governed by aggregate properties [13]. Asphalt binder may have some measure of influence on micro-texture soon after the laying of asphalt. Nevertheless, aggregates make up the bulk of asphalt mixtures and serve as the primary contact medium with vehicle tyres. Hence, for adequate frictional performance of the pavement surface, the coarse aggregates for asphalt mixtures should be carefully chosen [5].
5.2. Mechanical and Physical Properties of Aggregates (Hungarian Specifications)
Of the numerous worldwide spread aggregate tests, several investigate the physical properties of the coarse aggregate in terms of slip resistance, which can mainly affect the micro-texture. In Hungary, the coarse aggregate can be used in wearing coarse asphalt mixture if it can meet certain physical limit values, among others, those influencing long-term skid resistance.
In accordance with the relevant specification used in Hungary [31], depending on the expected traffic load of the asphalt layer in question, there is an increasingly strict regulation on the PSV values of coarse aggregates (>4.0 mm) used for surface layers (wearing courses).
The categorization is based on the Design Traffic (DT) and Equivalent Standard Axle repetition number (F100) of the road section. Below 105 F100 during the expected life, there is no PSV value requirement. Between 0.1 × 10⁶ and 0.3 × 10⁶ F100 expected heavy traffic load, min. PSV44 polished stone value category is needed for the coarse aggregate used. While above 0.3 × 10⁶ F100, the coarse aggregate selected must comply with the requirements of the PSV50 category. In general, the PSV 50 category can usually be fulfilled by rocks of volcanic origin. In Hungary, basalt and andesite type crushed rocks can primarily by taken into account.
The other two physical properties are the fragmentation resistance in accordance with the standard Los Angeles measurement [32] and the wear resistance in accordance with the Micro Deval measurement [33]. These parameters (LA and MDE) indicate the resistance of aggregate to mechanical degradation. In the Hungarian specification, in the case of normal traffic load (below 0.3 × 10⁶ F100), the coarse aggregate of asphalt mixtures must meet LA25 criterion of Los Angeles fragmentation, while in the increased and intensive traffic category (above 0.3 × 10⁶ F100) LA 20 is the compliance limit. In terms of Micro Deval wear resistance, there is a requirement for coarse aggregate in BBTM asphalt mixtures (which are typically used for increased category 0.3 × 10⁶–3.0 × 10⁶ F100) and for SMA (usually used in intensive traffic category above 3.0 × 10⁶ F100). In these cases, the prescribed limit amounts to 18 MDE.
5.3. Geometric Properties in Hungarian Specification
Another rather important aggregate property that can affect skid resistance of the pavement surface is the grain structure. Sharp and angular coarse aggregate particles interlock and provide higher texture depth. While flat and elongated particles tend to be horizontally oriented, resulting in lower texture depth.
According to Hungarian practice, the most commonly used aggregate material for asphalt mixtures of surface layers is crushed stone. Crushed gravel is only permitted in the case of normal traffic load (below 0.3 × 10⁶ F100). In these cases, the share of crushed and broken aggregate grain surfaces should be at least 90% in accordance with the relevant standard [34].
Determination of the particle shape-flakiness index determines the incidence of flat and elongated aggregates relative to cubic aggregates. This can be provided by a reference number called the flakiness index (FI) in accordance with the relevant standard [35]. As for the Hungarian national specification on flakiness index [36], the specified value is FI20 for the coarse aggregates (KZ 4/8 and KZ 8/11) of SMA-type asphalt mixtures that can be used in the intensive traffic category (above 3.0 × 10⁶ F100). In the case of lower travel category, the specified value for crushed rock aggregates amounts to be FI35. In the case of crushed gravel, the requirement of the category of FI25 must be met.
6. COST Action 354
6.1. COST Action 354 Generalities
The main objective of COST Action 354 is the development of unified European performance indicators and indices for road users and managers [37,38,39]. The numerical evaluation of performance indicators is of major importance since it provides information for national and European road pavement design and maintenance. The actual intervention limit values of indicators supply the minimally achievable quality requirements for planned and existing road pavement surfaces. In the case of various pavement structure and road types, different performance indicator values prove as appropriate. These performance indicators can also be inputs of pavement management system (PMSs) inputs [40] when the maintenance needs of relevant road sections or networks are calculated (forecasted).
Based on the replies of the comprehensive COST 354 questionnaire [38], the development of the following performance indices at a unitless scale was aimed at:
- Longitudinal unevenness;
- Transverse unevenness
- Macro-texture (macro-roughness in the USA);
- Skid resistance;
- Rolling noise;
- Air pollution;
- Pavement structure;
- Load bearing capacity.
6.2. Macro-Texture Performance Indicators
Pavement macro-texture is directly related to traffic safety and road user comfort. It influences indirectly pavement skid resistance by the actual connection between (wet) pavement surface and vehicle tyre. Based on the questionnaire survey of COST 354, it was revealed that two texture measurement principles are used in Europe: the Volumetric and the Laser method.
- The volumetric method (sand patch test) is actually the spreading of a given amount of sand or glass bead on the pavement surface with help of a standard flat disk, then measuring the diameter of sand by a steel scale, taking five readings. The mean diameter can be used for the calculation of the mean texture depth;
- The laser method is where the result of the texture measurement performed with a laser is independent of the measuring speed. Although numerous apparatus types (ARAN, Rav, Roadstar, Roar, RST, Rugolaser, and SCRIM) are available, the measurement is performed almost exactly the same way in each. The devices apply one or more laser beams aimed at various points of pavement surface, often in both wheel paths. The measurement is carried out always on a given line longitudinally, and each profile contains numerous, defined periodically performed level equalizations.
Depending on the device and software used, the measurement results can be provided in the form of the following performance indices: “mean profile depth (MPD)” [39], “mean texture depth (MTD)” [20,40] or “sensor measured texture depth (SMTD)”. This latter one does not have any international specification. Eight European countries use the MPD, there are three that prefer MTD, while two countries prefer SMTD. None of these indicators can be measured by a single device type.
The laser-based method is reliable and fully automated, the differences among its results in the case of calibrated lasers are negligible. The quite simple sand patch test is a proven method, which makes it sufficiently reliable.
The traffic speed measuring MPD and SMTD is safe at a network level, while the sand patch method is slow in a closed area of the pavement surface causing some traffic hazard.
Transformation functions were determined in the Czech Republic in order to convert MPD into indices (PIT) at a unitless scale (Table 7).
The conversion algorithm developed between the texture indicator MPD and the index PIT [21]:
- Motorways and main roads:
PIT = 5.3MPD − 1.6;
- Local roads:
PIT = 6.9MPD − 2.0.
6.3. Macro-Texture Performance Indicators
The questionnaire answers of COST 354 prove that the measurement of pavement skid resistance is usually (in 66%) carried out based on national specifications. The reason is that the measuring results are basically affected by the measuring principle and other factors (measuring speed, load of measuring wheel, water film thickness, etc.). The harmonization efforts at the European level have so far been unsuccessful [42,43]; thus, no valid international standard is available.
The distribution of the skid resistance measuring principles among the 26 questionnaire responses was as follows: 10 longitudinal force on measuring wheel, 10 lateral force on measuring wheel, 3 laser-based, 1 SRT-pendulum, 2 no answer.
Thirteen of 26 questionnaires returned have some information on skid resistance indicators, and just 4 of them contain conversion algorithms (Table 8).
For the sideways force coefficient, the following limit values were recommended by COST 354 WP2 [38]:
where
TV = −0.31OS + 59,
WV = −0.31OS + 64
TAV = −0.31OS + 75,
- TV is the threshold value;
- WV is the warning value;
- TAV is the target value;
- OS is the operating speed (km/h).
In case of longitudinal frictional force, the defined limit values can be found in Table 9.
7. Summary
Safe and reliable pavements are of paramount importance for both human losses and economic growth, especially with the intensive growth of traffic systems. Traffic safety is basically influenced by the skidding parameters of a road pavement surface. Key parameters influencing measurements of skid resistance of asphalt pavements were identified and reviewed. A brief overview of some of the most common approaches to modelling the major aspects of tyre–pavement friction was also provided. Skid resistance is one of the substantial factors which ensure safe travelling on automobile roads, there is a need to improve the safety situation. Road pavements with high and long-lasting skid resistance can be a solution. It is important to develop a Hungarian skid resistance policy covering skid resistance measurements not only for acceptance tests but also for skid resistance routine monitoring of the whole Hungarian road network, and include skid resistance measurement data into pavement management systems. Designing hot mix asphalt (AC) pavements meeting frictional “demand” requires selecting mix designs and aggregate types, as well as properties that can adequately provide long-term friction. In Hungary, slightly simplified, the regulations for aggregates include these elements for micro-texture. Aggregate types are differentiated and selected by Polish Value (PSV), Los Angeles Fragmentation Value (LA), Micro Deval Wear Resistance Value (MDE), Crushed Particle Ratio (C), and Flakiness Index [31,32,33,34,35]. Some results of a COST Action are also presented, highlighting the typical European practice on macro-texture and skid resistance measurement and pavement surface evaluation as an important input of Pavement Management Systems.
Funding
The research was carried out as part of the project numbered 2020-1.1.2-PIACI-KFI-2020-00060, with the support of the National Research, Development and Innovation Office of the Ministry of Innovation and Technology, and was funded by the 2020-1.1.2-PIACI KFI tender program.
Institutional Review Board Statement
Informed consent was obtained from all subjects involved in the study. Ethical review and approval were waived for this study due to the fact that its topic was concentrating on road pavements.
Informed Consent Statement
No informed consent was needed since no subjects had been involved in the study.
Data Availability Statement
Being a review paper, no new data were created by the authors.
Conflicts of Interest
Authors have no conflict of interest to declare.
References
- Wallman, C.-G.; Åström, H. Friction Measurement Methods and the Correlation Between Road Friction and Traffic Safety—A Literature Review; Swedish National Road and Traffic Institute: Linköping, Sweden, 2001.
- Kuttesch, J.S. Quantifying the Relationship between Skid Resistance and Wet Weather Accidents for Virginia Data. Master’s Thesis, Department of Civil Engineering, Virginia Polytechnic Institute and State University, Blacksburg, VA, USA, 2004; 147p. [Google Scholar]
- Viner, H.; Sinhal, R.; Parry, T. Review of UK Skid Resistance Policy. In Proceedings of the 5th International Symposium on Pavement Surface Characteristics—Road and Airports, Toronto, ON, Canada, 6–10 June 2004. 12p. [Google Scholar]
- Anupam, K.; Srirangam, S.; Scarpas, A.; Kasbergen, C. Influence of Temperature on Tire-Pavement Friction: Analyses, Transportation Research Record. J. Transp. Res. Board 2013, 2369, 114–124. [Google Scholar] [CrossRef]
- Hall, J.W.; Smith, K.L.; Titus-Glover, L.; Evans, L.D.; Wambold, J.C.; Yager, T.J.; Rado, Z. Guide for Pavement Friction. Contractor’s Final Report for National Cooperative Highway Research Program (NCHRP) Project 01-43; Transportation Research Board of the National Academies: Washington, DC, USA, 2009; 257p, Available online: http://onlinepubs.trb.org/onlinepubs/nchrp/nchrp_w108.pdf (accessed on 21 June 2015).
- Meyer, W.E. Synthesis of Frictional Requirements Research; Report, No. FHWA/RD-81/159; Federal Highway Administration (FHWA): Washington, DC, USA, 1982.
- Henry, J.J. Evaluation of Pavement Friction Characteristics; NCHRP Synthesis 291; National Cooperative Highway Research Program (NCHRP): Washington, DC, USA, 2000; 72p. [Google Scholar]
- Gillespie, T.D. Fundamentals of Vehicle Dynamics; Society of Automotive Engineers (SAE): Warrendale, PA, USA, 1992; 519p. [Google Scholar]
- Radt, H.S.; Milliken, W.F. Motions of Skidding Automobiles; Paper No. 600133 (205A); Society of Automotive Engineers (SAE): Warrendale, PA, USA, 1960. [Google Scholar]
- Do, M.-T.; Roe, P. Report on State-of-the-Art of Test Methods. In TYROSAFE Project Deliverable D04; FEHRL: Brussels, Belgium, 2008; 89p. [Google Scholar]
- Descornet, G.; Schmidt, B.; Boulet, M.; Gothie, M.; Do, M.-T.; Fafie, J.; Alonso, M.; Roe, P.; Forest, R.; Viner, H. Harmonization of European Routine and Research Measuring Equipment for Skid Resistance. In HERMES Final Report; Institut Francais des Sciences et Technologies des Transports, de l’Aménagement et des Réseaux (IFSTTAR): Champs-sur-Marne, France, 2006; 161p. [Google Scholar]
- Andriejauskas, T.; Vorobjovas, V.; Mielonas, V. Evaluation of Skid Resistance Characteristics and Measurement Methods. In Proceedings of the 9th International Conference Environmental Engineering, Vilnius, Lithuania, 22–23 May 2014; Cygas, D., Tollazzi, T., Eds.; VGTU Press: Vilnius, Lithuania, 2014. 9p. [Google Scholar] [CrossRef] [Green Version]
- Kogbara, R.B.; Masad, E.A.; Kassem, E.; Scarpas, A.T.; Anupam, K. A State-of-the-Art Review of Parameters Influencing Measurement and Modeling of Skid Resistance of Asphalt Pavements. Constr. Build. Mater. 2016, 114, 602–617. [Google Scholar] [CrossRef]
- e-UT 09.02.23:1999; Az Útburkolat-Felület Csúszásellenállásának Vizsgálata. Mérés SCRIM-Mérőkocsival (Skid Resistance Testing of Road Surfaces. Measurement with SCRIM Testing Vehicles). Útügyi Műszaki Előírás (Road Technical Directives). Ministry for Economy and Transport: Budapest, Hungary, 1999; 15p.
- e-UT 09.02.27:2009; Az Útburkolat-Felület Csúszásellenállásának Vizsgálata. Mérés ASF-Berendezéssel (Skid Resistance Testing of Road Surfaces. Measurement by ASFT Equipment). Útügyi Műszaki Előírás (Road Technical Directives). Ministry for Economy and Transport: Budapest, Hungary, 2009; 15p.
- EN 13036-4: 2011; Road and Airfield Surface Characteristics—Test Methods—Part 4: Method for Measurement of Slip/Skid Re-sistance of a Surface: The Pendulum Test. SIST—Slovenian Institute for Standardization: Ljubljana, Slovenia, 2011; 32p.
- Hall, J.W.; Smith, K.L.; Titus-Glover, L.; Wambold, J.C.; Yager, T.J.; Rado, Z. NCHRP Web-Only Document 108: Guide for Pavement Friction; Final Report for NCHRP Project 01-43; National Cooperative Highway Research Program: Washington, DC, USA, 2009. [Google Scholar]
- Flintsch, G.W.; De Leon, E.; McGhee, K.K.; Al-Qadi, I.L. Pavement Surface Macrotexture Measurement and Application. Transp. Res. Rec. J. Transp. Res. Board 2003, 1860, 168–177. [Google Scholar] [CrossRef]
- Permanent International Association of Road Congresses (PIARC). Report of the Committee on Surface Characteristics. In Proceedings of the 18th World Road Congress, Brussels, Belgium, 13–19 September 1987. 108p.
- EN 13036-1; Road and Airfield Surface Characteristics—Test Methods—Part 1: Measurement of Pavement Surface Macrotexture Depth Using a Volumetric Patch Technique. SIST—Slovenian Institute for Standardization: Ljubljana, Slovenia, 2010; 11p.
- ASTM E 965; Standard Test Method for Measuring Pavement Macrotexture Depth Using a Volumetric Technique. ASTM International: West Conshohocken, PA, USA, 2015; 4p.
- ASTM E 2380; Standard Test Method for Measuring Pavement Texture Drainage Using an Outflow Meter. ASTM International: West Conshohocken, PA, USA, 2010; 4p.
- ASTM E 2157-5; Standard Test Method for Measuring Pavement Macrotexture Properties Using the Circular Track Meter. ASTM International: West Conshohocken, PA, USA, 2019; 5p.
- U.S. Department of Transportation. ROSAN V—Technical Notes; Federal Highway Administration: Washington, DC, USA, 1997; 6p.
- Bittelli, G.; Simone, A.; Girardi, F.; Lantieri, C. Laser Scanning on Road Pavements: A New Approach for Characterizing Surface Texture. Sensors 2012, 12, 9110–9128. [Google Scholar] [CrossRef] [PubMed]
- Flintsch, G.W.; Al-Qadi, I.L.; Davis, R.; McGhee, K.K. Effect of HMA Properties on Pavement Surface Characteristics. In Proceedings of the Pavement Evaluation Conference, Roanoke, VA, USA, 21–25 October 2002. 16p. [Google Scholar]
- Sandburg, U. Influence of Road Surface Texture on Traffic Characteristics Related to Environment, Economy, and Safety: A State-of-the-Art Study Regarding Measures and Measuring Methods; VTI Report 53A-1997; Swedish National Road Administration: Borlange, Sweden, 1998; 94p. Available online: https://trid.trb.org/view/1149891 (accessed on 28 February 2022).
- e-UT 06.03.21:2018; Útpályaszerkezetek Aszfaltburkolati Rétegeinek Követelményei (Requirements of the Asphalt Layers of Road Pavement Structures). Ministry for Economy and Transport: Budapest, Hungary, 2018; 57p. (In Hungarian)
- Ongel, A.; Lu, Q.; Harvey, J. Frictional Properties of Asphalt Concrete Mixes. In Proceedings of the Institution of Civil Engineers-Transport; Thomas Telford Ltd: London, UK, 2009; Volume 162, pp. 19–26. [Google Scholar] [CrossRef]
- Ramboll RST. RST—Road Survey Technology; Ramboll RST: Malmö, Sweden, 2019; 5p. [Google Scholar]
- EN 1097-8:2020; Tests for Mechanical and Physical Properties of Aggregates—Part 8: Determination of the Polished Stone Value. SIST—Slovenian Institute for Standardization: Ljubljana, Slovenia, 2020; 35p.
- EN 1097-2:2020; Tests for Mechanical and Physical Properties of Aggregates—Part 2: Methods for the Determination of Resistance to Fragmentation. SIST—Slovenian Institute for Standardization: Ljubljana, Slovenia, 2020; 43p.
- EN 1097-1:2011; Tests for Mechanical and Physical Properties of Aggregates—Part 1: Determination of the Resistance to Wear (Micro-Deval). SIST—Slovenian Institute for Standardization: Ljubljana, Slovenia, 2011; 14p.
- EN 933-5:2022; Tests for Geometrical Properties of Aggregates—Part 5: Determination of Percentage of Crushed Particles in Coarse and All-In Natural Aggregates. SIST—Slovenian Institute for Standardization: Ljubljana, Slovenia, 2022; 20p.
- EN 933-3:2012; Tests for Geometrical Properties of Aggregates—Part 3: Determination of Particle Shape—Flakiness Index. SIST—Slovenian Institute for Standardization: Ljubljana, Slovenia, 2012; 11p.
- e-UT 05.01.15:2018; Útépítési Kőanyaghalmazok (Road Building Stone Masses). Ministry for Economy and Transport: Budapest, Hungary, 2018; 74p. (In Hungarian)
- COST 354. Performance Indicators for Road Pavements; Memorandum of Understanding; COST 354; European Union: Brussels, Belgium, 2004. [Google Scholar]
- COST 354. Performance Indicators for Road Pavements. WP2 Selection and Assessment of Individual Performance Indicators; Final Report; COST 354; European Union: Brussels, Belgium, 2007; 170p. [Google Scholar]
- Gáspár, L.; Károly, R. Útpályaszerkezetek Makroérdességi és Csúszásellenállási Mutatói (Macro Roughness and Skid Resistance Indicators of Road Pavements). Közlekedéstudományi Szle. 2007, 12, 442–449. (In Hungarian) [Google Scholar]
- Gáspár, L. Útgazdálkodás (Road Management); Akadémiai Kiadó: Budapest, Hungary, 2003; 361p. (In Hungarian) [Google Scholar]
- EN ISO 13473-1:2019; Characterization of Pavement Texture by Use of Surface Profiles—Part 1: Determination of Mean Profile Depth. ISO: Geneva, Switzerland, 2019; 43p.
- Wambold, J.C.; Antle, C.E.; Henry, J.; Rado, Z.; Descornet, G.; Sandburg, U.; Gothié, M.; Huschek, S. International Experiment to Compare and Harmonize Skid Resistance and Texture Measurements; PIARC Technical Committee 1 Surface Characteristics; PIARC: Paris, France, 1995; 430p, ISBN 84-87825-96-6. [Google Scholar]
- Descornet, G.; Schmidt, B.; Boulet, M.; Gothie, M.; Do, M.T.; Fafie, J.; Alonso, M.; Roe, P.; Viner, H. HERMES Project (Harmonization of European Routine and Research Measuring Equipment for Skid Resistance); FEHRL Report 2006/01; FEHRL: Brussels, Belgium, 2006; 24p. [Google Scholar]
Figure 1.
Relationship between pavement friction and crash risk, after [3].
Figure 1.
Relationship between pavement friction and crash risk, after [3].

Figure 2.
Pavement friction versus tyre slip, after [7].
Figure 2.
Pavement friction versus tyre slip, after [7].

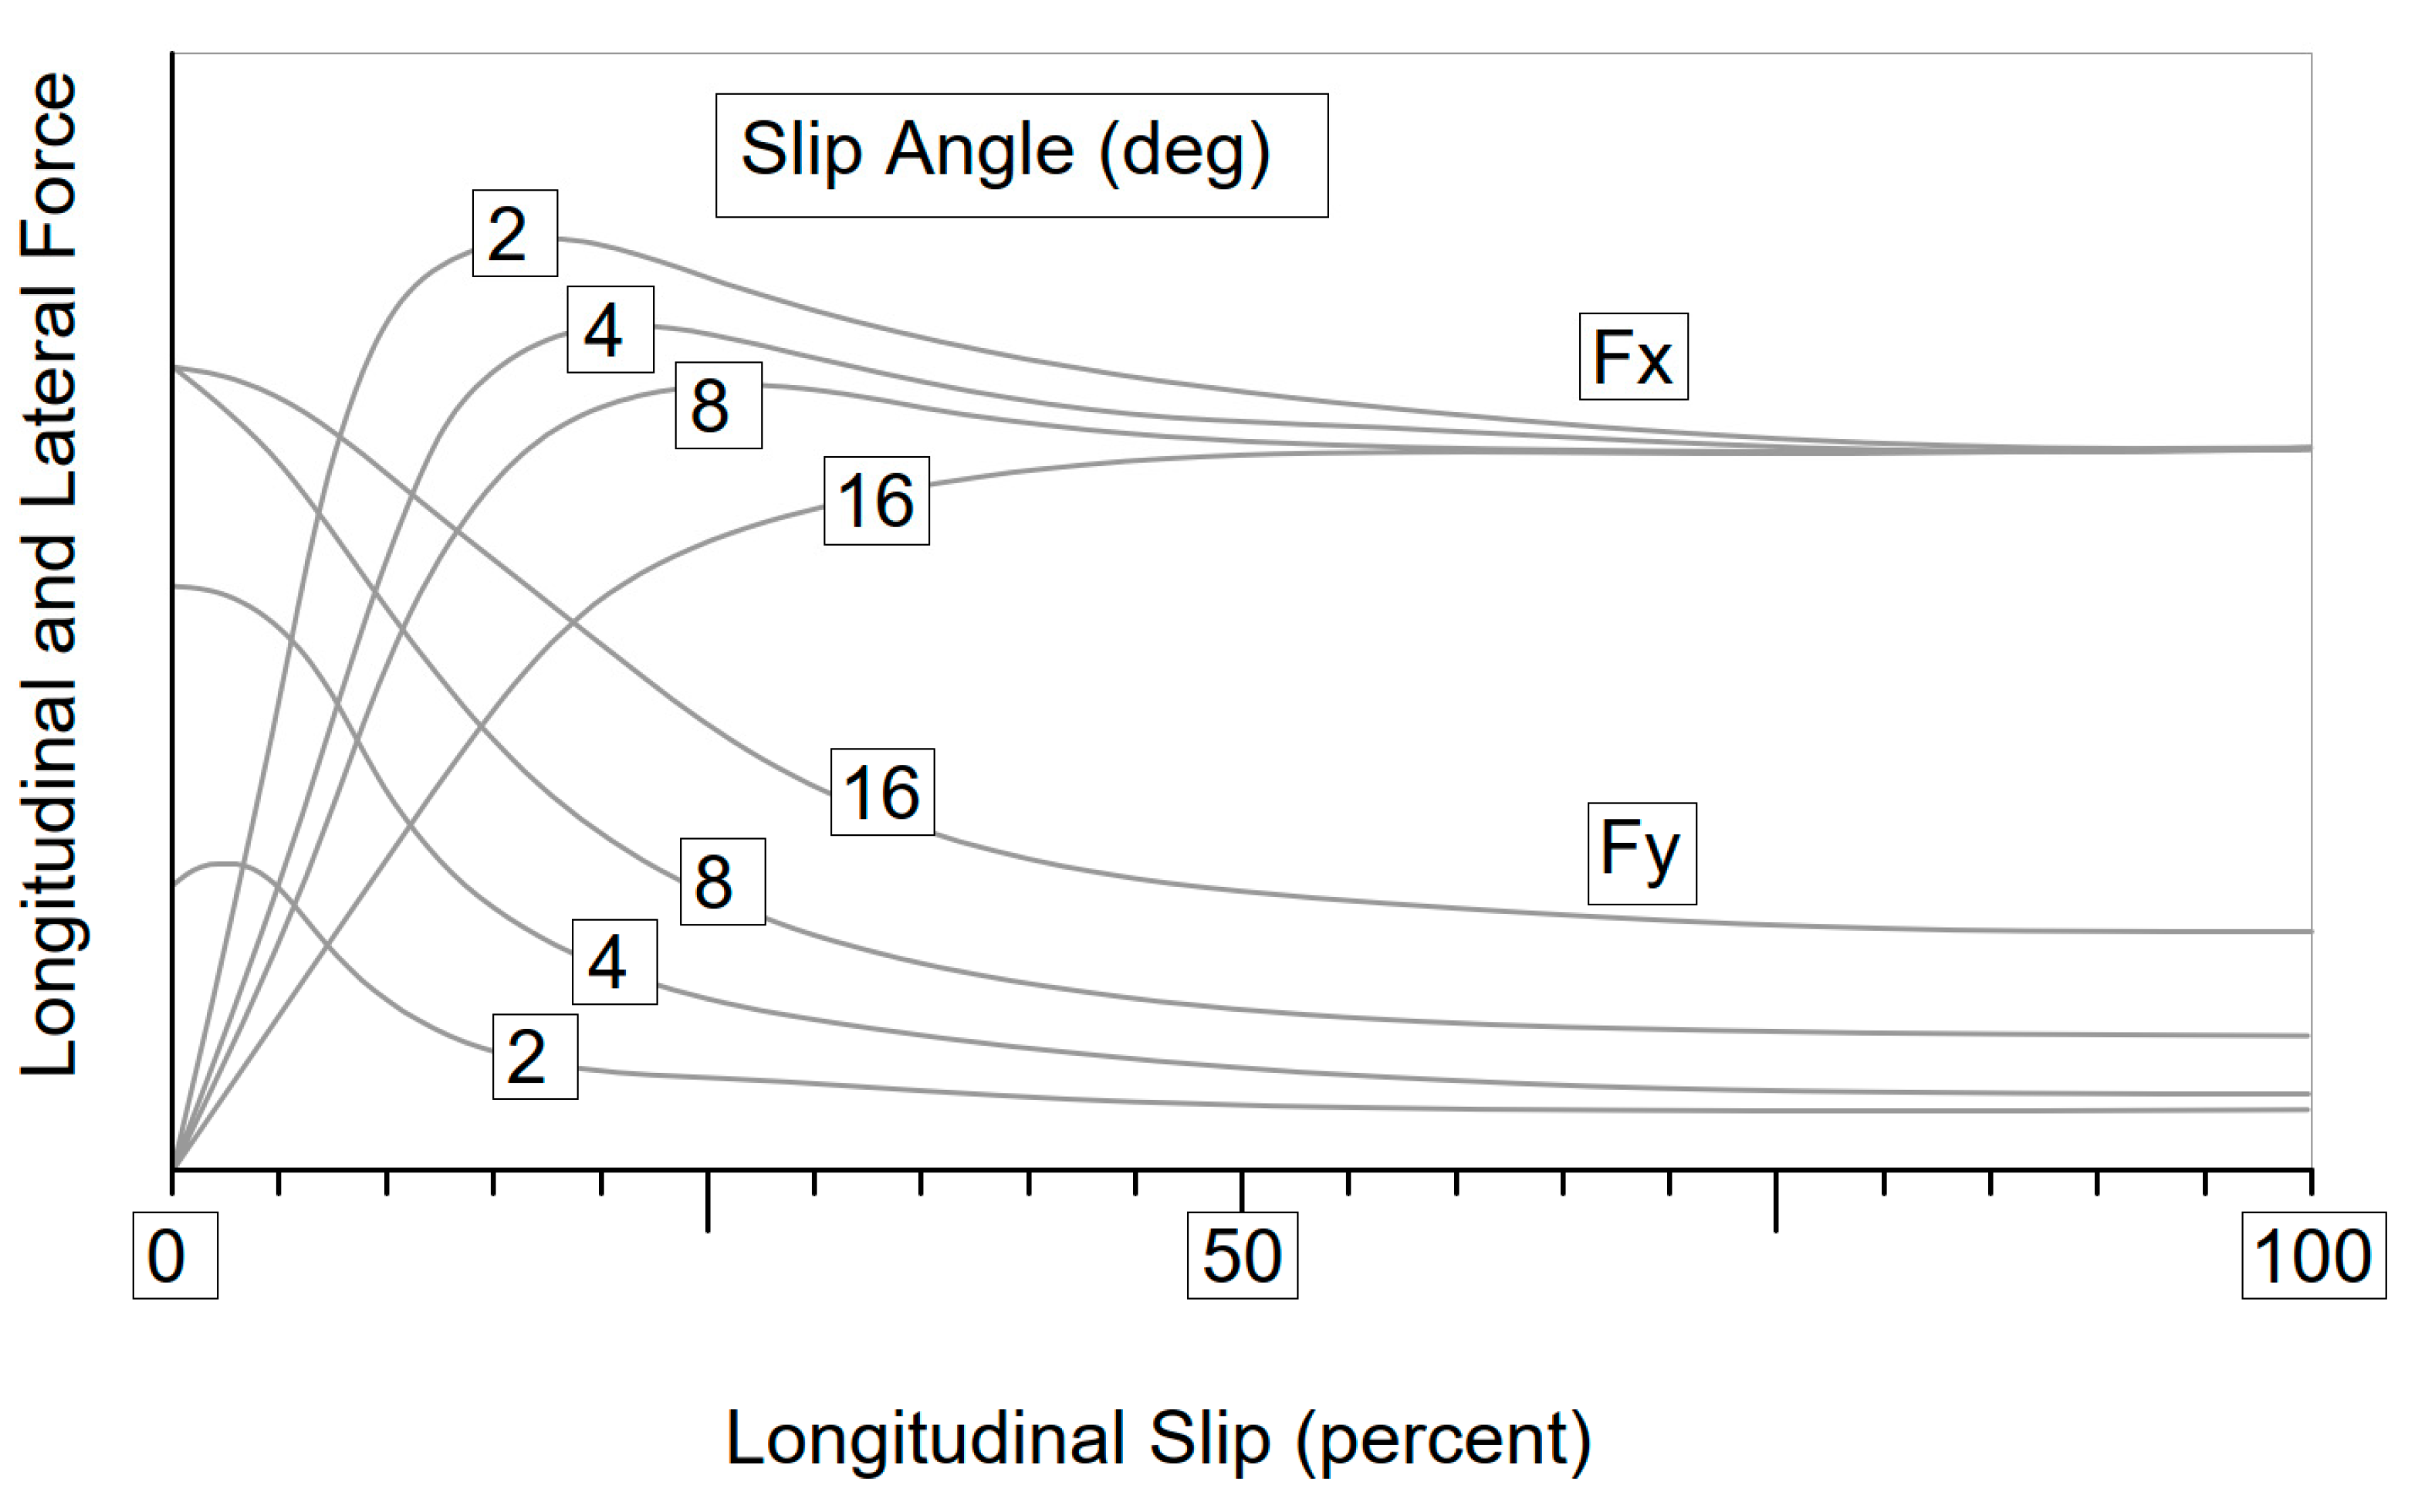
Figure 3.
Brake (Fx) and lateral (Fy) forces as a function of longitudinal slip, after [9]. Numbers in figure mean the Slip Angles in degrees.
Figure 3.
Brake (Fx) and lateral (Fy) forces as a function of longitudinal slip, after [9]. Numbers in figure mean the Slip Angles in degrees.

Figure 4.
Key mechanisms of tyre–pavement friction, after [5].
Figure 4.
Key mechanisms of tyre–pavement friction, after [5].

Figure 5.
Various texture ranges for a pavement surface [19].
Figure 5.
Various texture ranges for a pavement surface [19].

Figure 6.
Various texture ranges for a pavement surface, after [19].
Figure 6.
Various texture ranges for a pavement surface, after [19].


| Title | Measuring Principle | Main Parameter | Tyre and Wheel Load |
|---|---|---|---|
| ADHERA | Longitudinal friction coefficient (LFC) | Slip ratio: 1.0; Water film thickness: 1.0 mm; Measures macro-texture; Measurement speed: 40, 60, 90, 120 km/h; Measurement interval: 20 m. | PIARC smooth profile tyre 165R15 (180 kPa); Wheel load: 2500 N. |
| ASFT | Longitudinal friction coefficient (LFC) | Slip ratio: 0.12; Water film thickness:0–1.5 mm (ideally 0.9 mm) Measurement speed: 50, 70, 90 km/h Measurement interval: 10 m | Trelleborg type 4.00-8” tyre (700 ± 5 kPa); Wheel load: 2500 N. |
| BV-11 | Longitudinal friction coefficient (LFC) | Slip ratio: 0.17; Water film thickness: 0.5–1.0 mm; Measurement speed: 70 km/h; Measurement interval: 20 m. | Trelleborg type T49 tyre (140 kPa); Wheel load: 1000 N. |
| GripTester | Longitudinal friction coefficient (LFC) | Slip ratio: 0.15; Water film thickness: 0.5 mm; Measurement speed: 5–100 km/h; Measurement interval: 10–20 m or other. | 254 mm diameter smooth profile ASTM-tyre (140 kPa); Wheel load: 250 N. |
| RoadSTAR | Longitudinal friction coefficient (LFC) | Slip ratio: 0.18; Water film thickness: 0.5 mm; Measures macro-texture; Measurement speed: 30, 60 km/h; Measurement interval: 50 m. | PIARC tyre with tread; Wheel load: 3500 N. |
| ROAR DK | Longitudinal friction coefficient (LFC) | Slip ratio: 0.2; Water film thickness: 0.5 mm; Measures macro-texture; Measurement speed: 60, 80 km/h; Measurement interval: >5 m. | ASTM 1551 tyre (207 kPa); Wheel load: 1200 N. |
| ROAR NL | Longitudinal friction coefficient (LFC) | Slip ratio: 0.86; Water film thickness: 0.5 mm; Measures macro-texture; Measurement speed: 50, 70 km/h; Measurement interval: 5–100 m. | ASTM 1551 tyre (200 kPa); Wheel load: 1200 N. |
| RWS NL Skid Resistance Trailer | Longitudinal friction coefficient (LFC) | Slip ratio: 0.86; Water film thickness: 0.5 mm; Measurement speed: 50, 70 km/h; Measurement interval: 5–100 m. | PIARC smooth profile tyre 165R15 (200 kPa); Wheel load: 1962 N. |
| Skiddometer BV-8 | Longitudinal friction coefficient (LFC) | Slip ratio: 1.0 or 0.14; Water film thickness: 0.5 mm; Measurement speed: 40, 60, 80 km/h; Measurement interval: 30–50 m. | AIPCR tyre with longitudinal tread 165R15; Wheel load: 3500 N. |
| SRM | Longitudinal friction coefficient (LFC) | Slip ratio: 0.15; Water film thickness: 0.5 mm; Measurement speed: 40, 60, 80 km/h; Measurement interval: 20 m or other. | AIPCR tyre with longitudinal tread 165R15; Wheel load: 3500 N. |
| TRT | Longitudinal friction coefficient (LFC) | Slip ratio: 0.15; Water film thickness: 0.5 mm; Measurement speed: 40–140 km/h; Measurement interval: 20 m or other. | Smooth profile ASTM- tyre; Wheel load: 1000 N. |
| SRT-3 | Longitudinal friction coefficient (LFC) | Slip ratio: 1.0; Water film thickness: 0.5 mm; Measurement speed: 60 km/h. | Tyre with tread (200 kPa). |
| IMAG | Longitudinal friction coefficient (LFC) | Slip ratio: 1.0; Water film thickness: 1.0 mm; Measurement speed: 65 km/h; | PIARC smooth profile tyre; Wheel load: 1500 N. |
| SCRIM | Sideway friction coefficient (SFC) | Slip angle: 20°; Water film thickness: 0.5 mm; Measures macro-texture; Measurement speed: 50 km/h; Measurement interval: >10 m. | Avon SCRIM smooth profile tyre 76/508 (350 kPa); Wheel load: 1960 N. |
| SKM | Sideway friction coefficient (SFC) | Slip angle: 20°; Water film thickness: 0.5 mm; Measurement speed: 50 km/h; Measurement interval: 100 m or other. | Smooth profile tyre; Wheel load: 1960 N. |
| DFT Dynamic Friction Tester | Rotating friction | For stationary measurements | |
| SRT Pendulum | Pendulum test | For stationary measurements | |
| T2GO | Slow-moving measurement; Longitudinal friction coefficient (LFC) | Slip ratio: 0.2; Used for pedestrian/bicycle paths, road marking | Two 75 mm width tyres. |
| VTI Portable Friction Tester (PFT) | Slow-moving measurement; Longitudinal friction coefficient (LFC) | Used for pedestrian/bicycle paths |
Table 2.
SCRIM- sideways force coefficient (SFC) limits for the surface of pavement type course.
| Pavement Category | Hot Rolled Asphalt | Asphalt Concrete | Cement Concrete | Surface Dressing |
|---|---|---|---|---|
| I. | 0.80–0.50 | 0.75–0.50 | 0.75–0.50 | 0.90–0.50 |
| II. | 0.80–0.45 | 0.70–0.45 | 0.65–0.45 | 0.80–0.45 |
| III. | 0.70–0.40 | 0.64–0.40 | 0.64–0.40 | 0.80–0.40 |
| IV. | 0.64–0.33 | 0.64–0.33 | 0.64–0.33 |
I. Motorways and main roads with a traffic above 3000 unit vehicle/day, as well as on urban main roads at the approach of signs, pedestrian crossings and similar dangerous points, in curves with a radius of less than 100 m. II. Excluding motorway, approach to major junctions on roads with a traffic above 3000 unit vehicle/day, on slopes, slopes above 5%, curves with a radius below 150 m, transition curves, before railway light barriers, bridges. III. Main roads with a traffic above 3000 unit vehicle/day on straight sections, urban main roads in curves with a radius above 100 m, slopes below 5%. IV. Local roads with a traffic below 3000 unit vehicle/day.
Table 3.
Informative limits ASFT-SFT skid resistance values for all pavement types.
| Pavement Category | New Pavement Threshold | Warning Threshold | Intervention Level |
|---|---|---|---|
| I. | 0.84 | 0.75 | 0.70 |
| II. | 0.80 | 0.65 | 0.60 |
| III. | 0.70 | 0.55 | 0.45 |
| IV. | 0.65 | 0.45 | 0.35 |
I. Motorways and main roads with a traffic above 3000 unit vehicle/day, as well as on urban main roads at the approach of signs, pedestrian crossings and similar dangerous points, in curves with a radius of less than 100 m. II. Excluding motorway, approach to major junctions on roads with a traffic above 3000 unit vehicle/day, on slopes, slopes above 5%, curves with a radius below 150 m, transition curves, before railway light barriers, bridges. III. Main roads with a traffic above 3000 unit vehicle/day on straight sections, urban main roads in curves with a radius above 100 m, slopes below 5%. IV. Local roads with a traffic below 3000 unit vehicle/day.
Table 4.
Factors affecting actual pavement friction [5].
Table 4.
Factors affecting actual pavement friction [5].
| Pavement Surface Characteristics | Vehicle Operating Parameters | Tire Properties | Environment |
|---|---|---|---|
| Micro-texture Macro-texture Mega-texture/unevenness Material properties Temperature | Slip speed (vehicle speed, braking action) Driving manoeuvre (turning, overtaking) | Footprint Tread design and condition Rubber composition and hardness Inflation pressure Load Temperature | Climate (wind temperature; rainfall/condensation; snow and ice) Contaminants (Anti-skid material; dirt, mud, debris) |
Note: Critical (most important) factors are shown in bold.
Table 5.
Macro-texture compliance limit values for all pavement types.
| Asphalt Mixture Types | AC 8 top (F), AC 8 top (mF), AC 11 top (F), AC 11 top (mF), BBTM 4 A (mF), BBTM 8 A (mF), BBTM 8 B (mF), SMA 8 (mF), SMA 8 (mI), MA 11 (F), MA 11 (mF) | AC 16 top (F), AC 16 top (mF), BBTM 11 A (mF), BBTM 11 B (mF), SMA 11 (mF), SMA 11 (mI) |
|---|---|---|
| Macro-texture compliance limit, mm, min. | 0.40 | 0.50 |
Table 6.
Requirements for the macro-texture levels of concrete pavement surfaces.
| Road Type | Texture Depth, mm |
|---|---|
| Motorways | >0.5 |
| Main road | >0.4 |
| Local roads | >0.3 |
| Urban roads, parking areas | none |
Table 7.
Macro-texture limit values in the Czech Republic [41].
Table 7.
Macro-texture limit values in the Czech Republic [41].
| Index (Note) | Verbal Classification | MPD (mm) in the Road Class of | |
|---|---|---|---|
| Motorway, Primary Road | Secondary Road | ||
| 1 | very good | min. 0.89 | min. 0.79 |
| 2 | good | 0.74–0.88 | 0.64–0.78 |
| 3 | appropriate | 0.64–0.73 | 0.54–0.63 |
| 4 | poor | 0.54–0.63 | 0.44–0.53 |
| 5 | very poor | max. 0.53 | max. 0.43 |
Table 8.
Conversion algorithms for pavement skid resistance indicators.
| Country | Index | Conversion Function | Remarks |
|---|---|---|---|
| Austria | Skid resistance index | 9.9286–14.236 TP * | network level |
| Belgium | Skid resistance index | 4(SFC **-0.1)/3 | |
| Poland | Skid parameter | 100–180 TP |
Legend: * TP: technical parameter; ** SFC: sideways force coefficient.
Table 9.
Limit values for longitudinal frictional force [38].
Table 9.
Limit values for longitudinal frictional force [38].
| Limits | Main Roads | Local Roads |
|---|---|---|
| Threshold values | TV = −0.23OS + 48 | TV = −0.23OS + 45 |
| Warning values | WV = −0.23OS + 56 | WV = −0.23OS + 54 |
Disclaimer/Publisher’s Note: The statements, opinions and data contained in all publications are solely those of the individual author(s) and contributor(s) and not of MDPI and/or the editor(s). MDPI and/or the editor(s) disclaim responsibility for any injury to people or property resulting from any ideas, methods, instructions or products referred to in the content. |
© 2023 by the authors. Licensee MDPI, Basel, Switzerland. This article is an open access article distributed under the terms and conditions of the Creative Commons Attribution (CC BY) license (https://creativecommons.org/licenses/by/4.0/).
Share and Cite
MDPI and ACS Style
Rosta, S.; Gáspár, L. Skid Resistance of Asphalt Pavements. Eng 2023, 4, 1597-1615. https://doi.org/10.3390/eng4020091
AMA Style
Rosta S, Gáspár L. Skid Resistance of Asphalt Pavements. Eng. 2023; 4(2):1597-1615. https://doi.org/10.3390/eng4020091
Chicago/Turabian StyleRosta, Szabolcs, and László Gáspár. 2023. "Skid Resistance of Asphalt Pavements" Eng 4, no. 2: 1597-1615. https://doi.org/10.3390/eng4020091