
Rapid Prediction of Leaf Water Content in Eucalypt Leaves Using a Handheld NIRS Instrument


School of Health, Medical and Applied Sciences, Central Queensland University, North Rockhampton, QLD 4701, Australia
Eng 2023, 4(2), 1198-1209; https://doi.org/10.3390/eng4020070
Submission received: 23 March 2023
/
Revised: 18 April 2023
/
Accepted: 18 April 2023
/
Published: 19 April 2023
(This article belongs to the Special Issue Feature Papers in Eng 2023)
Abstract
:Leaf water content (LWC) is a crucial physiological parameter that plays a limiting role in the efficiency of photosynthesis and biomass production in many plants. This study investigated the use of diffuse reflectance near-infrared spectroscopy (NIRS) for the rapid prediction of the gravimetric LWC in eucalypt leaves from Eucalyptus and Corymbia genera. The best-performing model for LWC gave a R2pred of 0.85 and RMSEP of 2.32% for an independent test set, indicating that the handheld NIR instrument could predict the LWC with a high level of accuracy. The use of support vector regression gave slightly more accurate results compared with partial least squares regression. Prediction models were also developed for leaf thickness, although these were somewhat less accurate (R2pred of 0.58; RMSEP of 2.7 µm). Nevertheless, the results suggest that handheld NIR instruments may be useful for in-field screening of LWC and leaf thickness in Australian eucalypt species. As an example of its use, the NIR method was applied for rapid analysis of the LWC and leaf thickness of every leaf found on an E. populnea sapling.
1. Introduction
The leaf water content (LWC) is an important physiological parameter in the discipline of plant science [1]. The water content of leaves and their transpiration rates control the extent of stomata opening [2], thus influencing the rate of photosynthesis [3]. In turn, this limits the growth rates and biomass productivity of the plant [4]. Furthermore, LWC also plays a role in determining salinity tolerance [5] and even affects oviposition preferences of herbivorous insects [6,7].
Consequently, measuring LWC may provide information on various physiological aspects of plants such as their current levels of water stress [8,9,10], drought tolerance [11,12], salinity tolerance [5], flammability [13,14], and photosynthetic rates [15]. Survey studies have indicated that genetics (particularly classification at a family or order level) have the largest impact on LWC, while precipitation and climate have smaller effects [16]. Nevertheless, there is significant spatial variation in LWC between different habitat types. Researchers have also highlighted that LWC will be an important variable to measure in future studies of large-scale trait variations [16].
The most common method of measuring LWC is by oven-drying the leaves to a constant mass and determining the loss of mass. However, this method is destructive and can be time consuming, particularly when large numbers of leaves must be analysed. Consequently, in order to better understand the distribution of LWC within plants and ecosystems, rapid methods of measuring this parameter are required. This is particularly significant for the eucalypts (tribe Eucalypteae; principally comprising the Eucalyptus, Corymbia, and Angophora genera), as these species are a crucial part of many Australian ecosystems [17].
Rapid, non-invasive analytical techniques have been reported for measuring LWC [1,10,18], principally using near-infrared spectroscopy (NIRS) [19,20]. This analytical technique uses light with a longer wavelength than visible light to investigate the presence of key functional groups (e.g., OH, CH, NH) in a sample matrix. The benefits of NIRS include its speed (no sample preparation), low cost (no ongoing expenses), portability, and broad applicability to a range of sample types [8,21]. Recent technological advances in reducing the size and cost of NIR instruments have made them highly suited to use in field surveys investigating various analytes [20,22,23,24].
However, there are limited studies applying NIRS for the prediction of LWC in eucalypt species. This tribe of plants is somewhat unique in possessing a thick waxy cuticle layer on their leaves [25], which acts to reduce water loss [26]. This physiological feature may potentially complicate the development of NIRS models for the prediction of LWC. Yang, et al. [27] used NIRS to predict the leaf water potential (Ψleaf) in E. camaldulensis, but not the absolute LWC. Similarly, Datt [28] was able to predict the equivalent water thickness in several eucalypt species using NIRS, but not the gravimetric water content (i.e., the absolute LWC). In contrast, Kumar [29] was able to predict LWC in six Eucalyptus species by using a laboratory NIR instrument. This appears to be the only study to date reporting NIRS calibration for LWC that can be utilised across different eucalypt species. Furthermore, there are no comparable studies incorporating the Corymbia genus. Consequently, the aim of this study was to apply portable NIRS instrumentation for the rapid prediction of gravimetric LWC in eucalypt leaves from several species across two genera (Eucalyptus and Corymbia).
As a secondary aim, NIRS was also trialled for the prediction of leaf thickness in these species. Although this parameter is not usually measured with NIRS, it was thought that the leaf thickness could be indirectly predicted from the magnitude of absorbance produced from all of the compounds (e.g., structural carbohydrates, proteins, and water) present in the leaves. Leaves with a smaller thickness would consequently be expected to show less absorbance overall, and vice versa for thicker leaves. This is supported by previous work demonstrating that leaf thickness was the best predictor of NIR reflectance and internal light scattering [30]. Therefore, NIRS might be able to rapidly screen for leaf thickness at the same time as measuring leaf water content.
2. Materials and Methods
2.1. Eucalyptus Leaf Samples
This study was conducted in May 2022 on a grazing property in Central Queensland, comprising an open woodland of mixed eucalypt species. Leaves of varying maturity stages were collected from six different Eucalyptus and Corymbia species (E. populnea, C. citriodora, E. platyphylla, E. tereticornis, E. melanophloia, and C. tessellaris). Between 2 and 4 trees were sampled for each species; 20 leaves were collected for each species (only 19 for E. tereticornis). Effort was made to collect leaves from multiple canopy levels in each species. The leaves sampled were from the ‘intermediate’ and ‘adult’ maturity stages [31].
The NIR spectra were collected from the fresh leaf samples as soon as practicable after collection (approx. 10–20 min).
2.2. Collection of NIR Spectra
Spectra between 908–1676 nm were collected directly from the eucalypt leaves using a MicroNIR OnSite handheld spectrometer (Viavi, Santa Rosa, CA, USA). This instrument has a diffuse reflectance geometry. The instrument was calibrated using dark and light reference measurements every 10 min. The following parameters were used: 6 nm resolution; 100 ms integration time; 1 scan per spectra. Spectra were collected in triplicate, from different locations on each leaf. No tile was placed behind the leaves during measurement, to simulate the situation that would take place during in-field measurements. The adaxial and abaxial sides of each leaf were both randomly sampled, again to simulate a simplified method for potential in-field use. Previous work indicated some variation in the spectral absorbance from the adaxial and abaxial sides, albeit relatively minor [32].
In addition to collecting spectra from all of the fresh leaves, NIR spectra were also collected from 20 E. populnea leaves half-way through the drying process, and another 5 E. populnea leaves when they were completely oven-dried (0% moisture). Furthermore, spectra were collected from 30 E. populnea leaves that had naturally dried (to varying extents) after falling off the trees. Inclusion of these samples provided a wider range of moisture contents for the creation of a robust prediction model.
In total, 174 leaf samples were scanned, each in triplicate (n = 522 spectra). One leaf sample (n = 3 spectra) was excluded due to outlier values. The spectra were not averaged prior to data analysis.
2.3. Measurement of LWC and Leaf Thickness
The leaf water content was measured by oven drying the leaves at 65 °C until they reached a constant mass. The loss in mass was recorded for each leaf and the moisture content was calculated and expressed as a percent of the fresh weight as per the following formula:
LWC (%) = (massfresh − massdried)/massfresh × 100
Leaf thickness (recorded to ±0.1 µm) was measured near the centre of each leaf, using an engineer’s micrometer (RS PRO External Micrometer; item code 705–1213; range 0–25 mm; accuracy ±0.004 mm). Care was taken to ensure that the thickness was not measured through the central vein, which could have influenced the results.
2.4. Model Development
The NIR spectra were exported in ASCII (*.csv) format and subsequently imported into Unscrambler X software (version 10; Camo Analytics; Oslo, Norway) for chemometric analysis.
The spectra were split into 2 sets: the calibration set (comprising all 5 eucalypt species, but excluding all E. platyphylla spectra), and the independent test set (comprising all of the E. platyphylla spectra). Each model was built and cross-validated using the entire calibration set, then applied to the independent test set to assess its performance. Full cross-validation was performed on each calibration model using the leave-one-out (LOO) approach. All models were limited to a maximum of 7 factors to avoid the potential of over-fitting.
Partial least squares regression (PLS-R) was performed in Unscrambler X, using leave-one-out (LOO) cross-validation. Various spectral pre-processing treatments were trialled, including standard normal variate (SNV) normalisation, multiplicative scatter correction (MSC), and first and second derivative treatments using differing numbers of smoothing points for the Savitzky–Golay algorithm. Abbreviations for these pre-processing methods indicate the derivative and number of Savitzky–Golay smoothing points used. For example, 1d5 indicates 1st derivative with 5 smoothing points. Each pre-processing method was trialled on the entire calibration set.
Support vector regression (SVR) was also trialled as an alternative algorithm method to PLS-R. An Epsilon SVR model was used, with a radial basis function, gamma value of 0.008, and 2 classes.
Graphs were drawn in R Studio, running R version 4.0.5 [33].
2.5. In-Field Application
Finally, the NIR method was applied in-field to measure the LWC and leaf thickness of every leaf found on a small E. populnea sapling (~2.5 m height; 67 leaves) in central Queensland. The process of NIR spectra collection was quite rapid, with up to 7 leaves scanned per minute.
In addition to collecting the NIR spectra, the height of each leaf above the ground was measured using a laser distance measurer (Ozito LMR-025), to determine whether there were any correlations between leaf height and LWC/thickness.
3. Results and Discussion
3.1. Descriptive Statistics
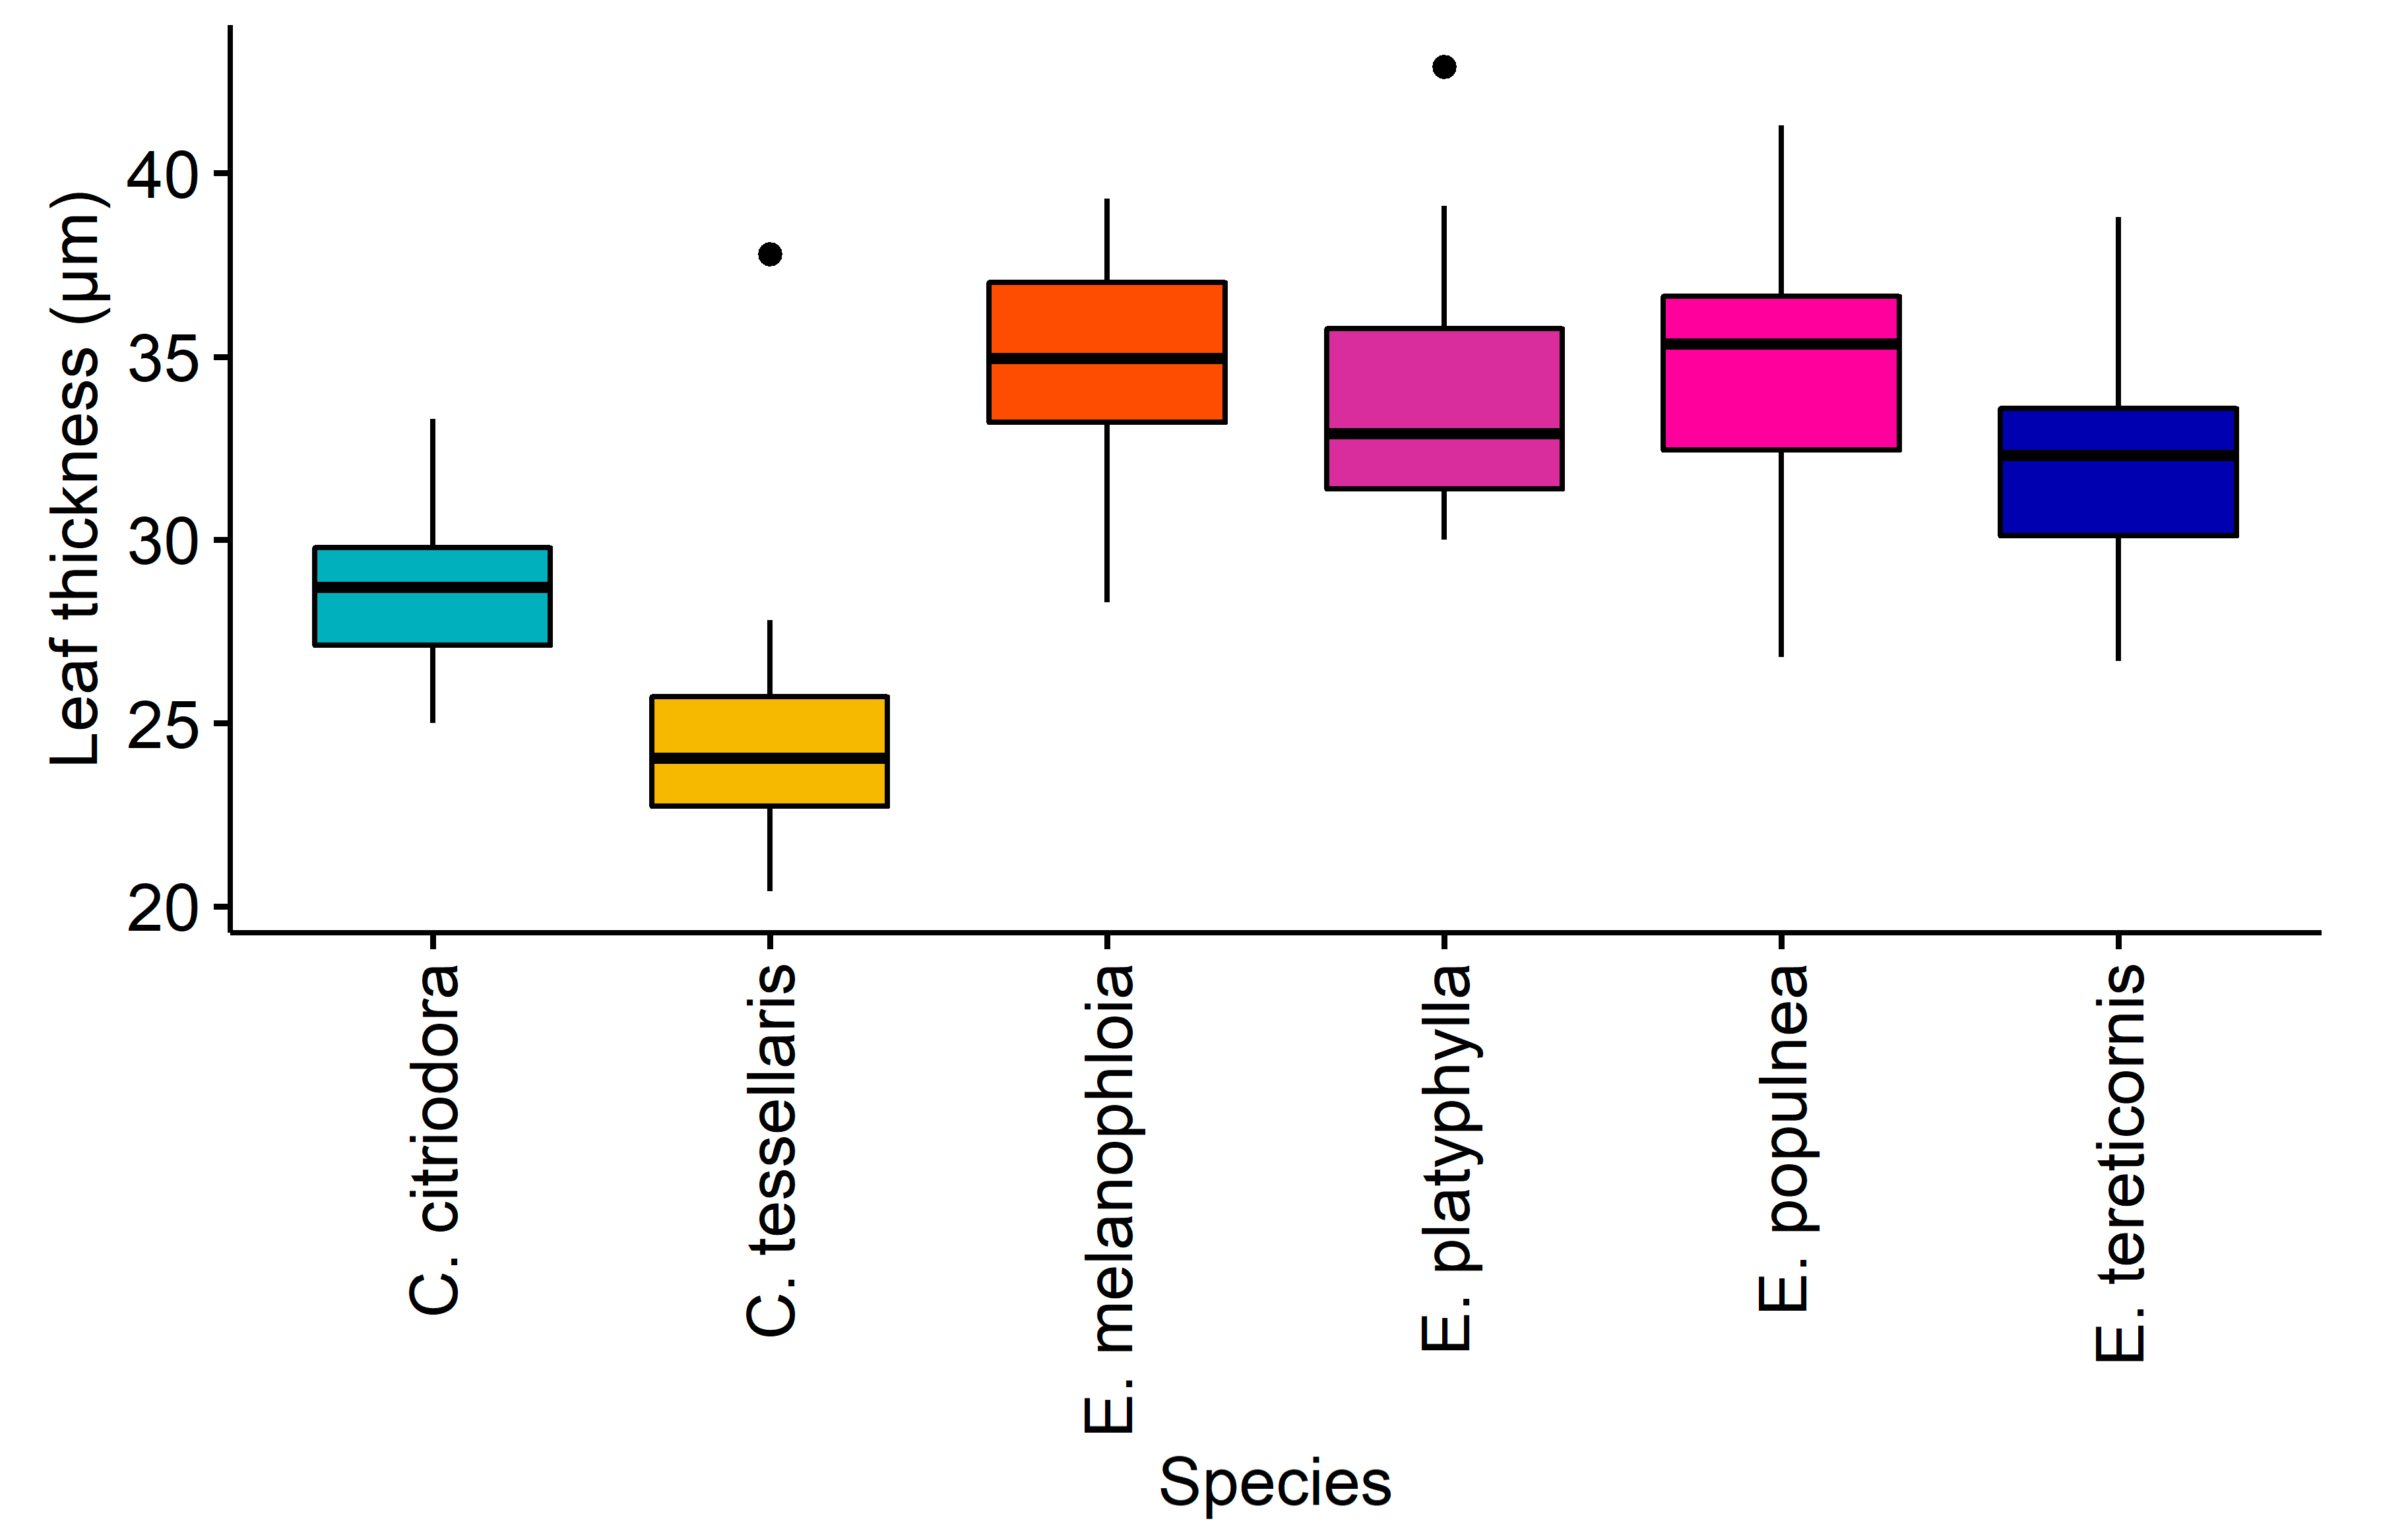
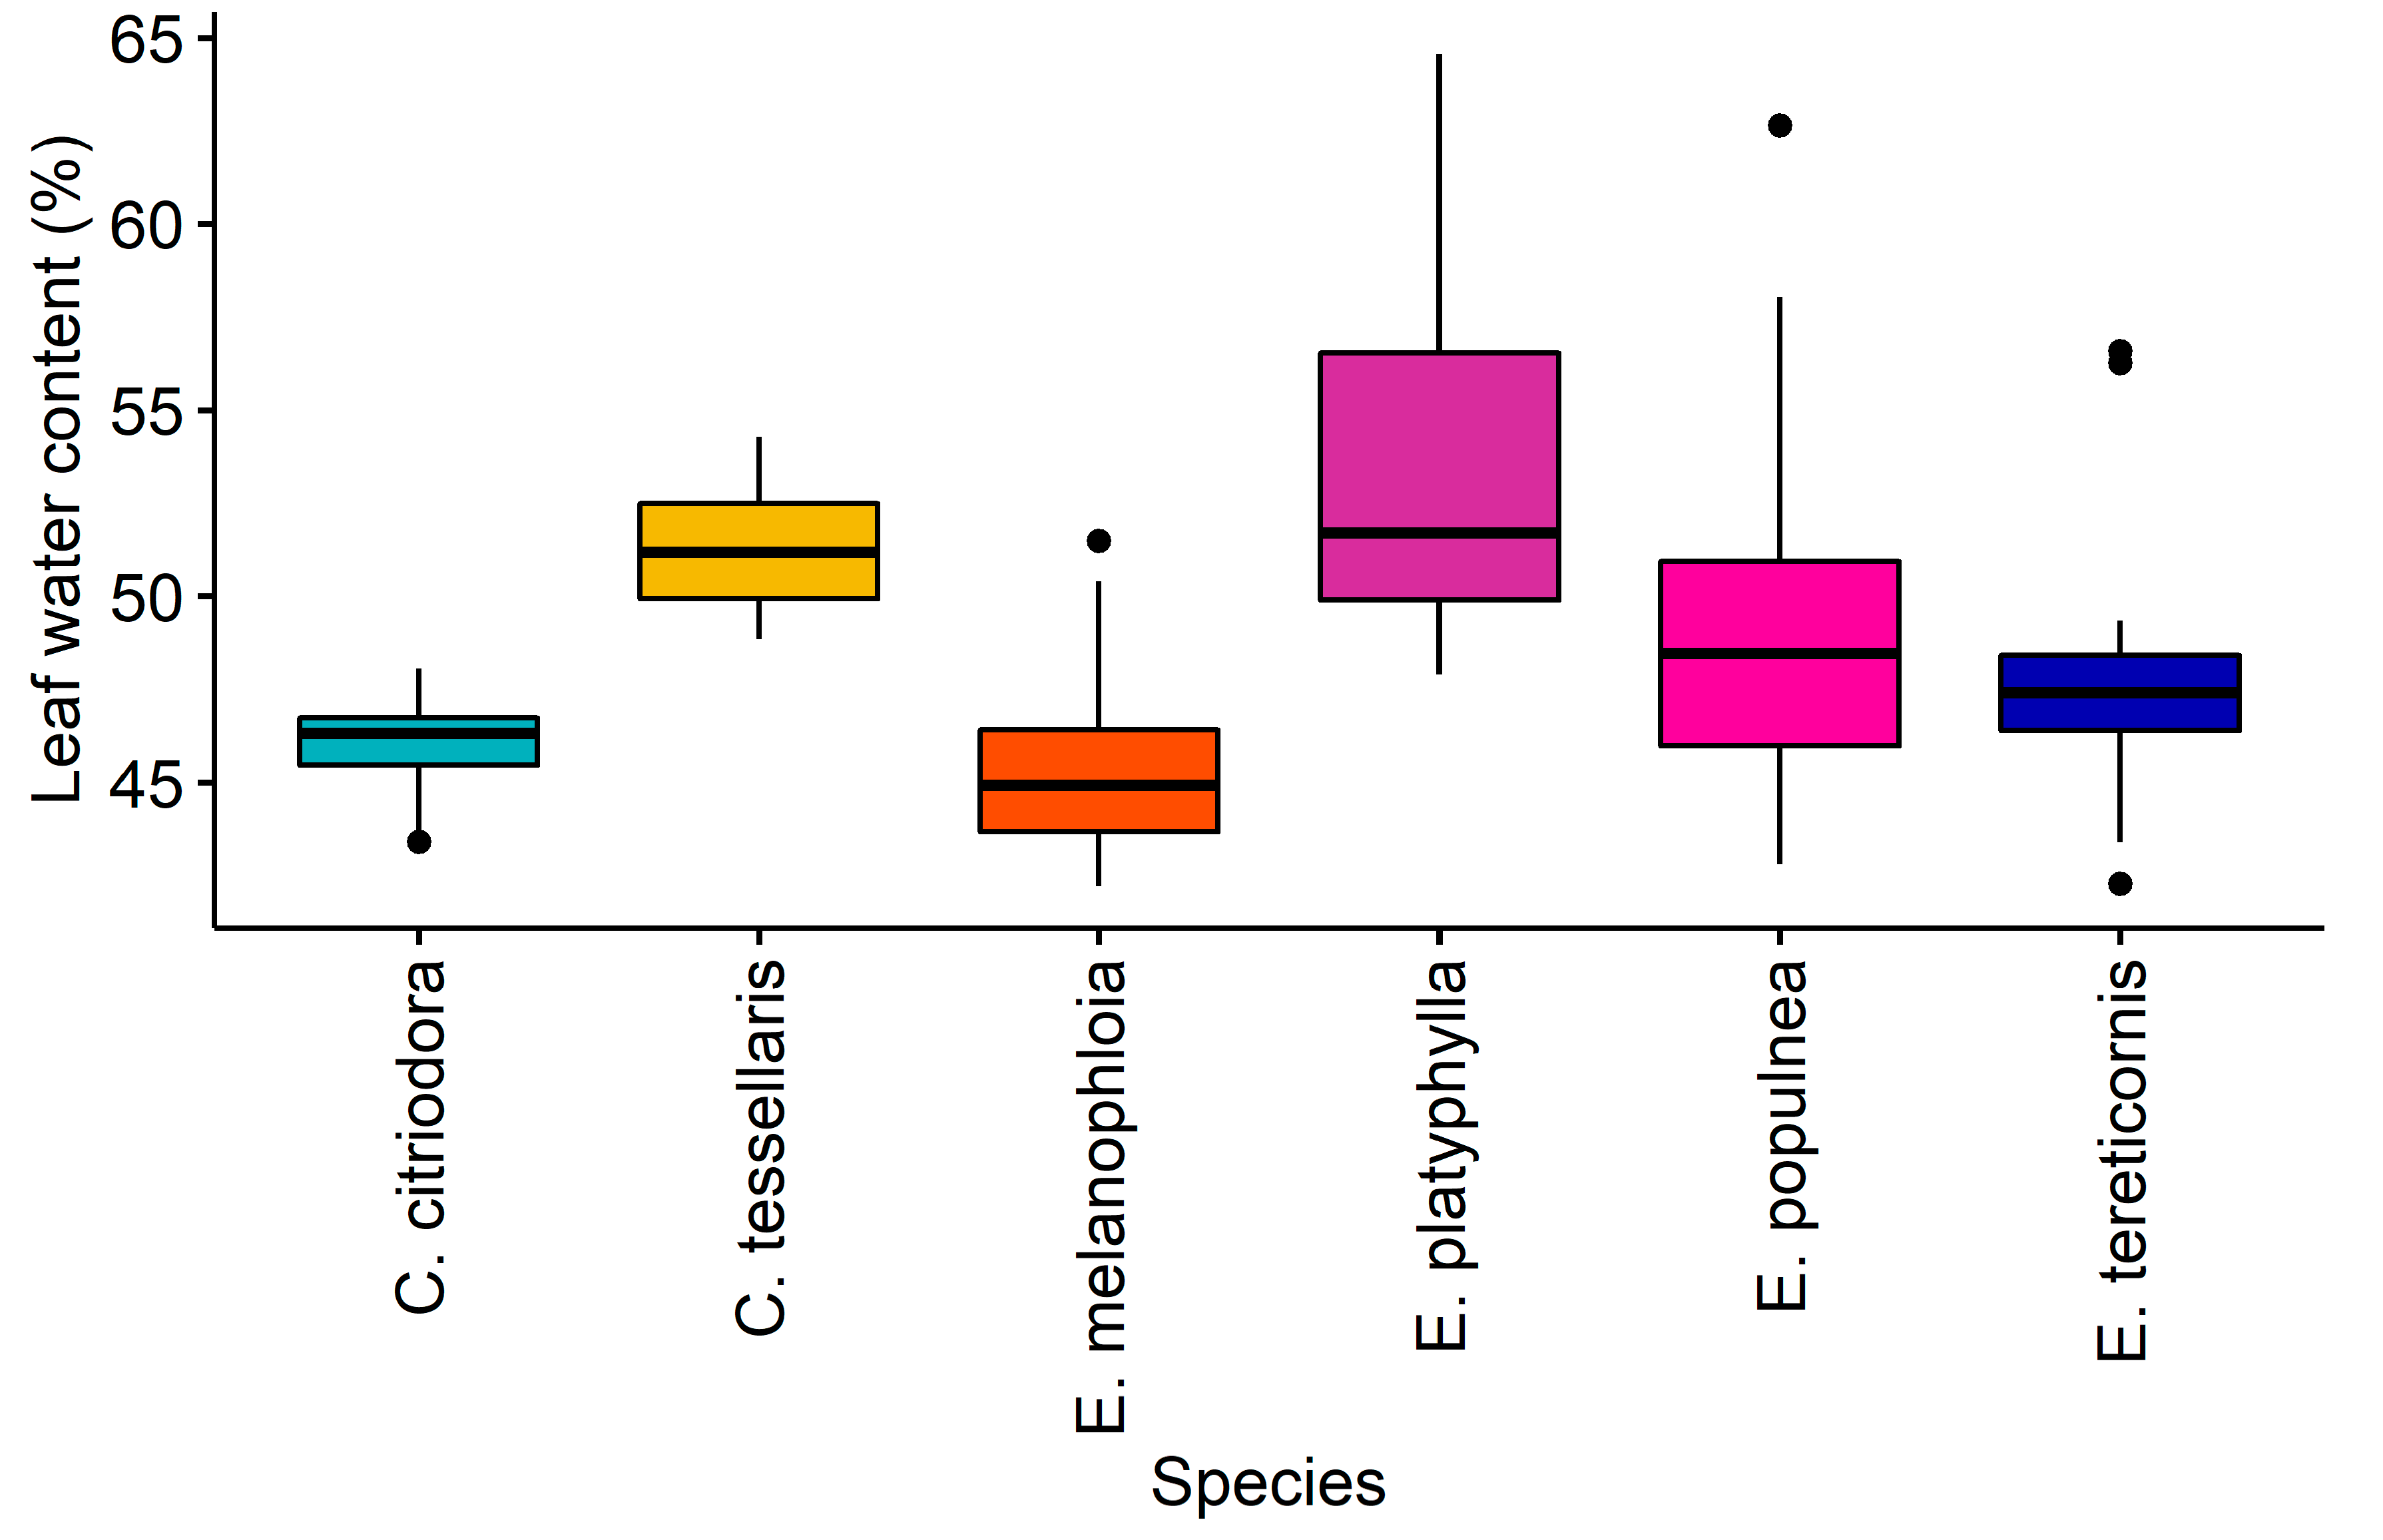
As shown in Table 1, the size (as measured by fresh mass), thickness, and water content of the leaves varied significantly between the six eucalypt species. The leaf thickness did not vary significantly between the four Eucalyptus species; however, it was significantly lower for the two Corymbia species (Figure 1). There was no clear difference in LWC between Corymbia and Eucalyptus (Figure 2), with E. melanophloia and C. citriodora showing the lowest LWC, and E. platyphylla and C. tessellaris the highest. This agreed with observations by Wang et al. [16] that genetic factors had the largest impact on leaf moisture content, rather than environmental or climatic factors.
There was a positive correlation between the fresh leaf mass and the leaf thickness (r117 = 0.58, p < 0.001), but not with the LWC (Table 2). There was also a moderate negative relationship between the leaf thickness and the LWC (r117 = −0.25, p < 0.01).
3.2. NIR Spectra
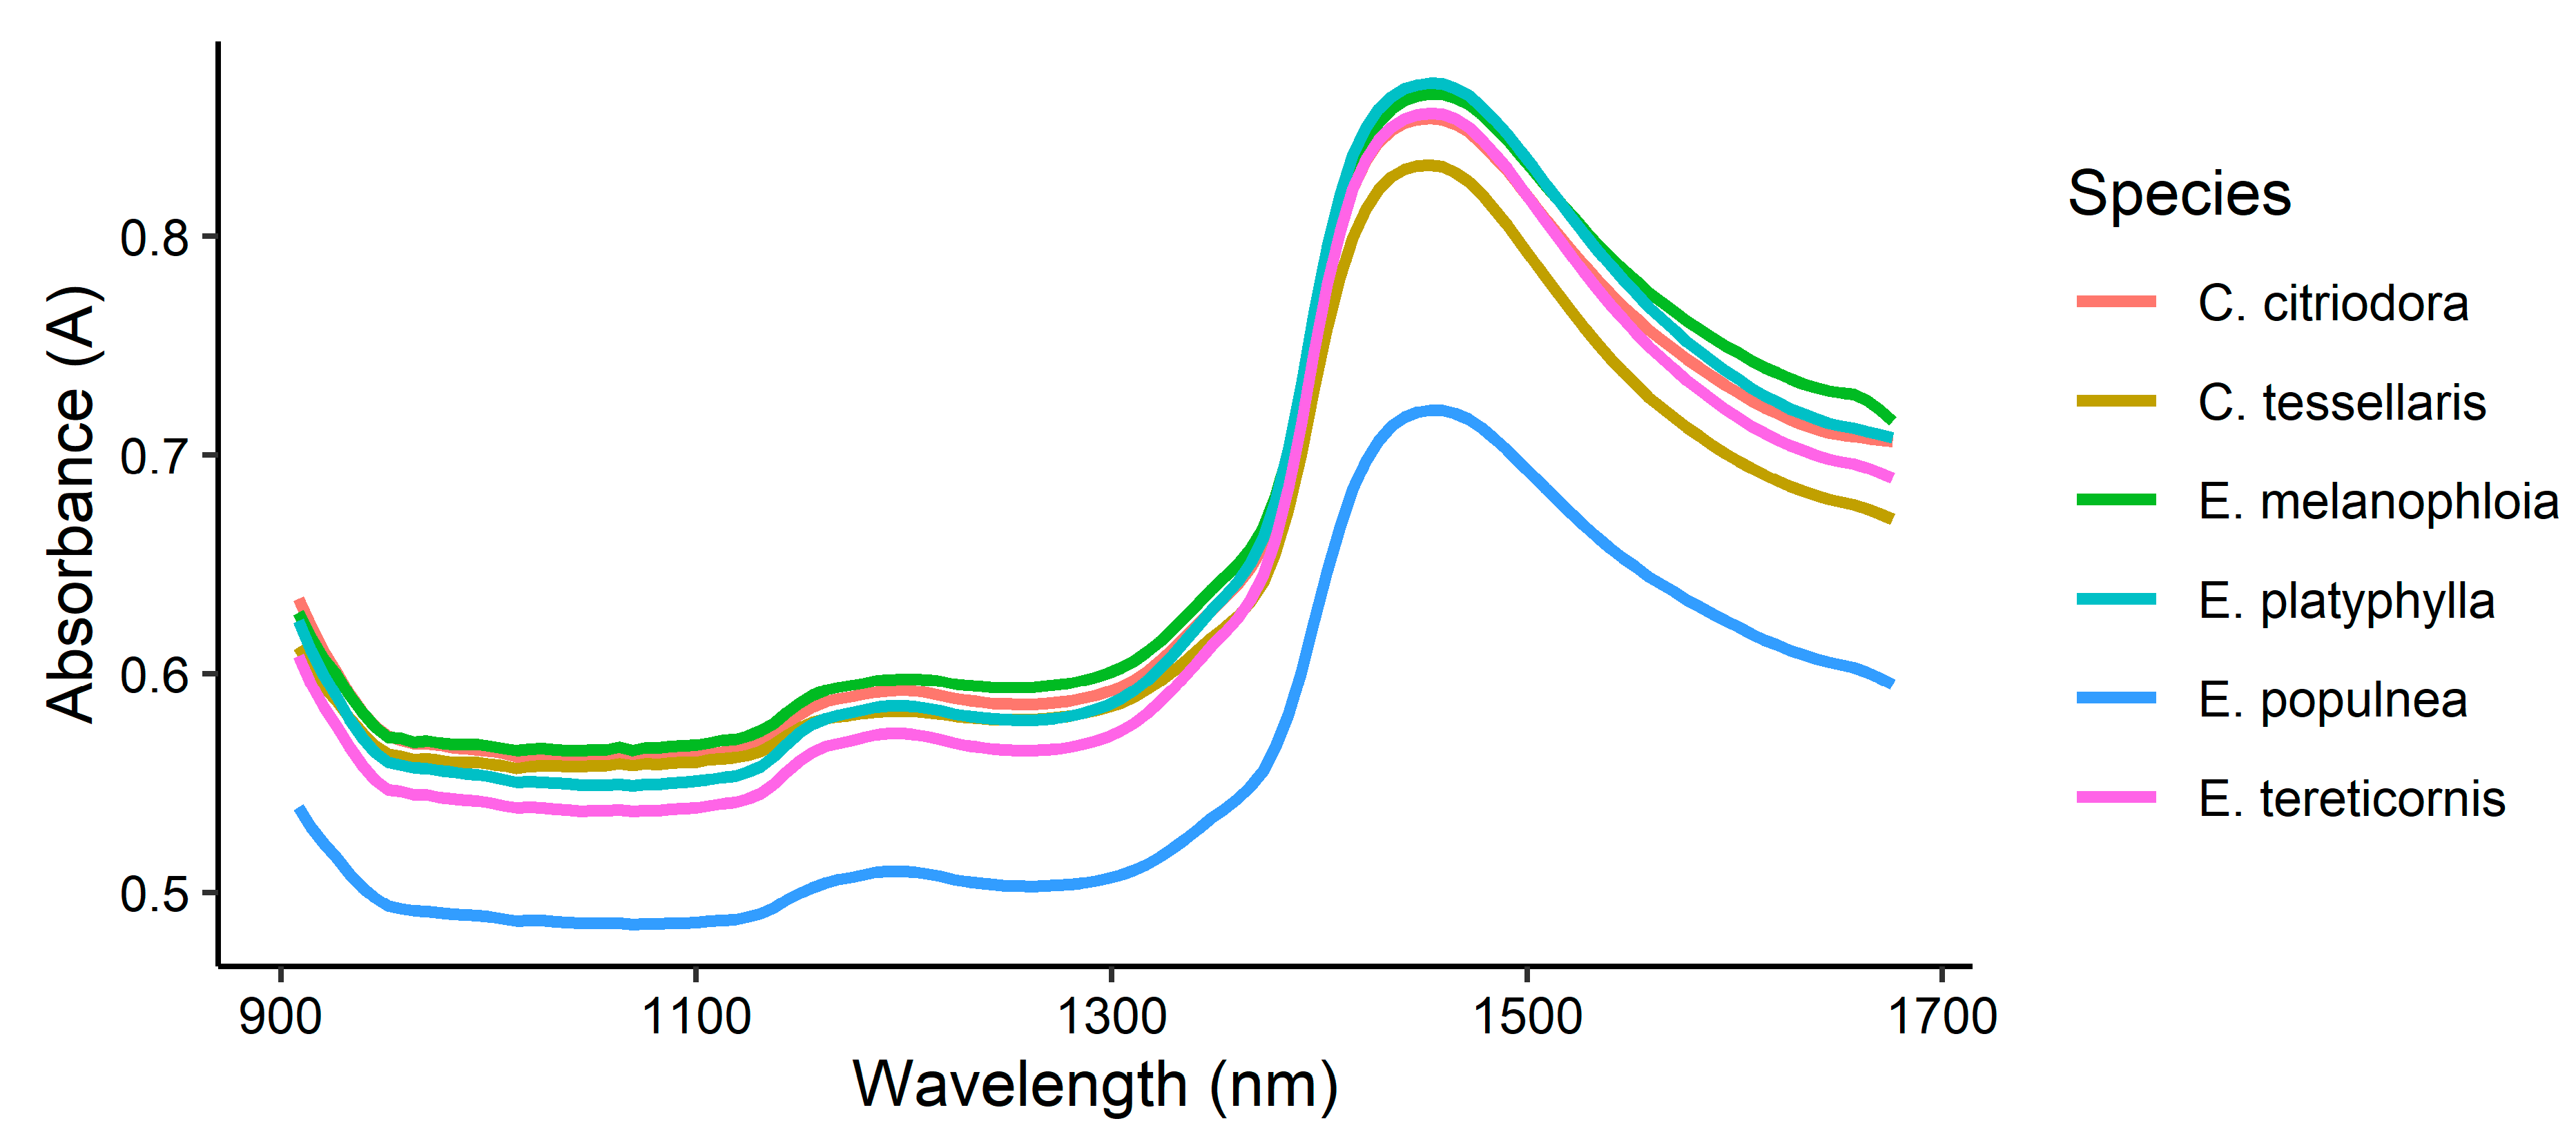
The NIR spectra of the leaf samples showed a large peak at 1454 nm, a shoulder at approximately 1350 nm, and a smaller peak centred at 1196 nm (Figure 3). These may be attributed to the OH first overtone, CH first overtone combination, and CH second overtone of the stretching mode, respectively [34,35]. Only a very small peak was observed in the OH second overtone region (around 970 nm). Overall, the spectra were very similar to those previously reported for E. pellita leaves [36] and mulberry (Morus alba) leaves [37].
Additionally, there were clear visual differences in the leaf samples with different moisture contents, with lower absorption in the ca. 1450 nm region (first overtone of the stretching mode (vs) of -OH) in samples with less water content.
3.3. Prediction of Leaf Water Content
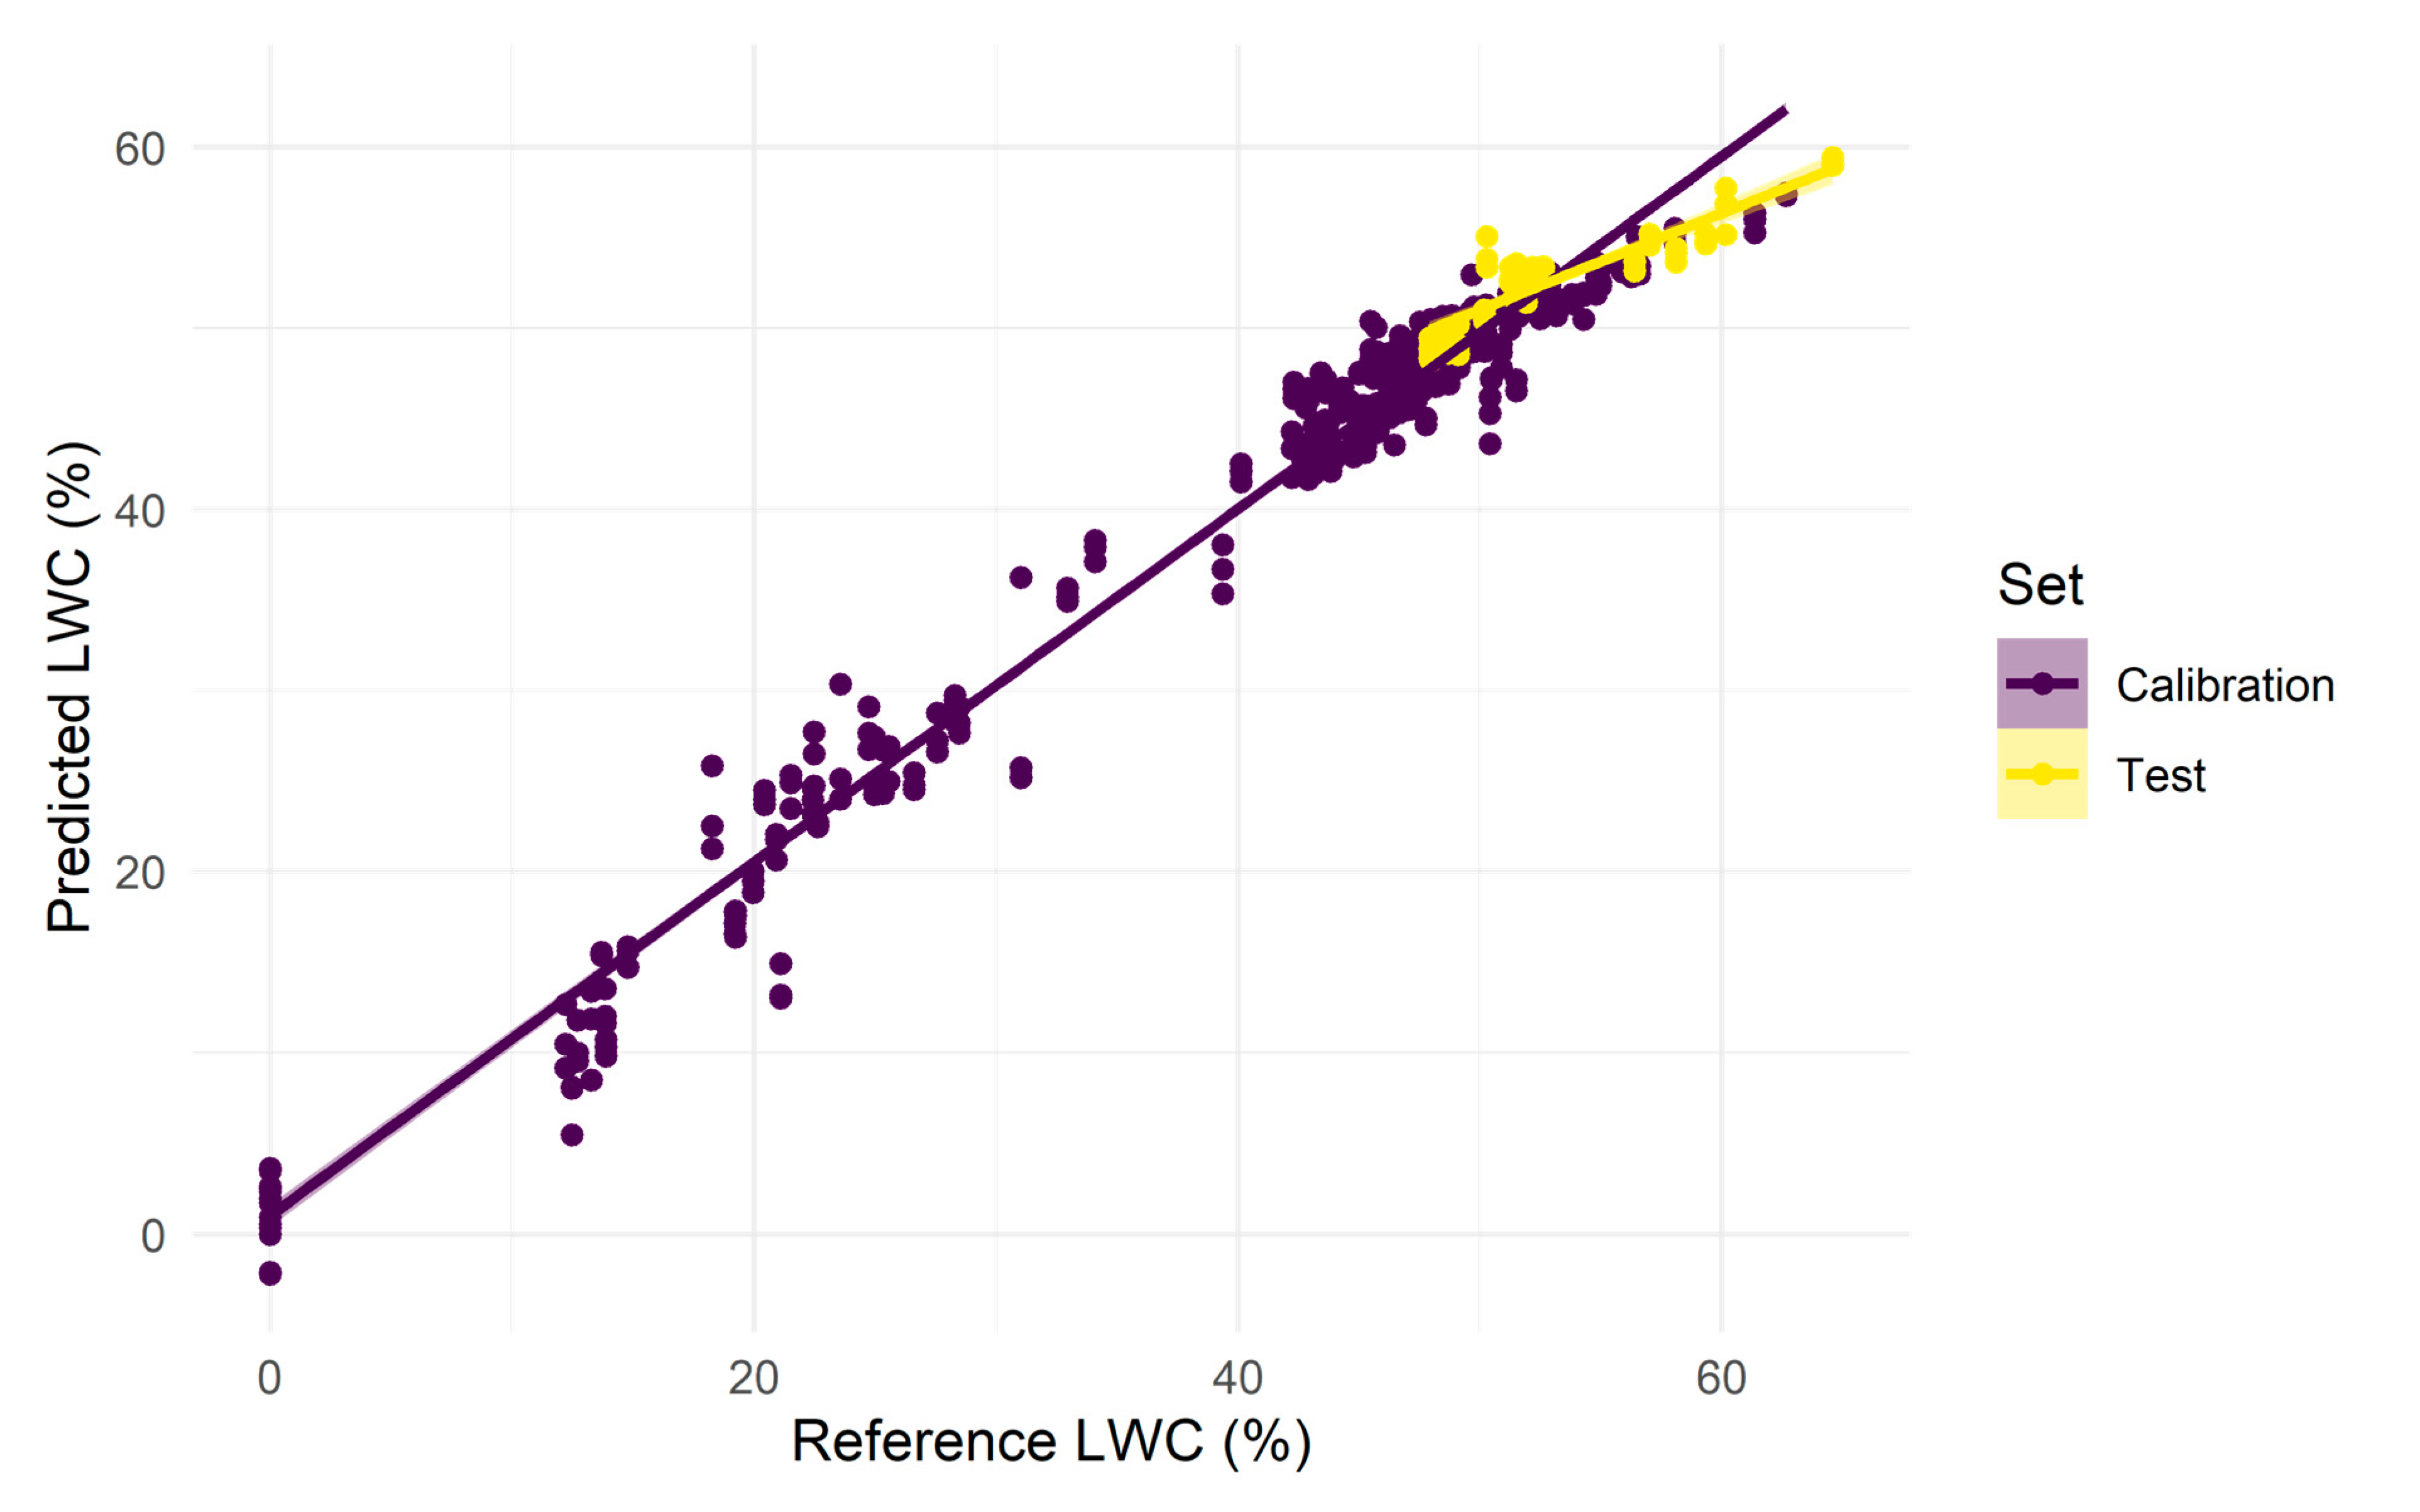
As shown in Table 3, most of the analyte values for the independent test set fell within the range of values included in the calibration set. Moderately good results were found for the prediction of LWC from the NIR spectra. The best pre-processing method was SNV smoothing (Table 4), which gave an excellent R2CV of 0.97 and RMSECV of 2.21% (Figure 4). Furthermore, the performance on the independent test set was acceptable, with an R2pred of 0.80 and RMSEP of 2.46%.
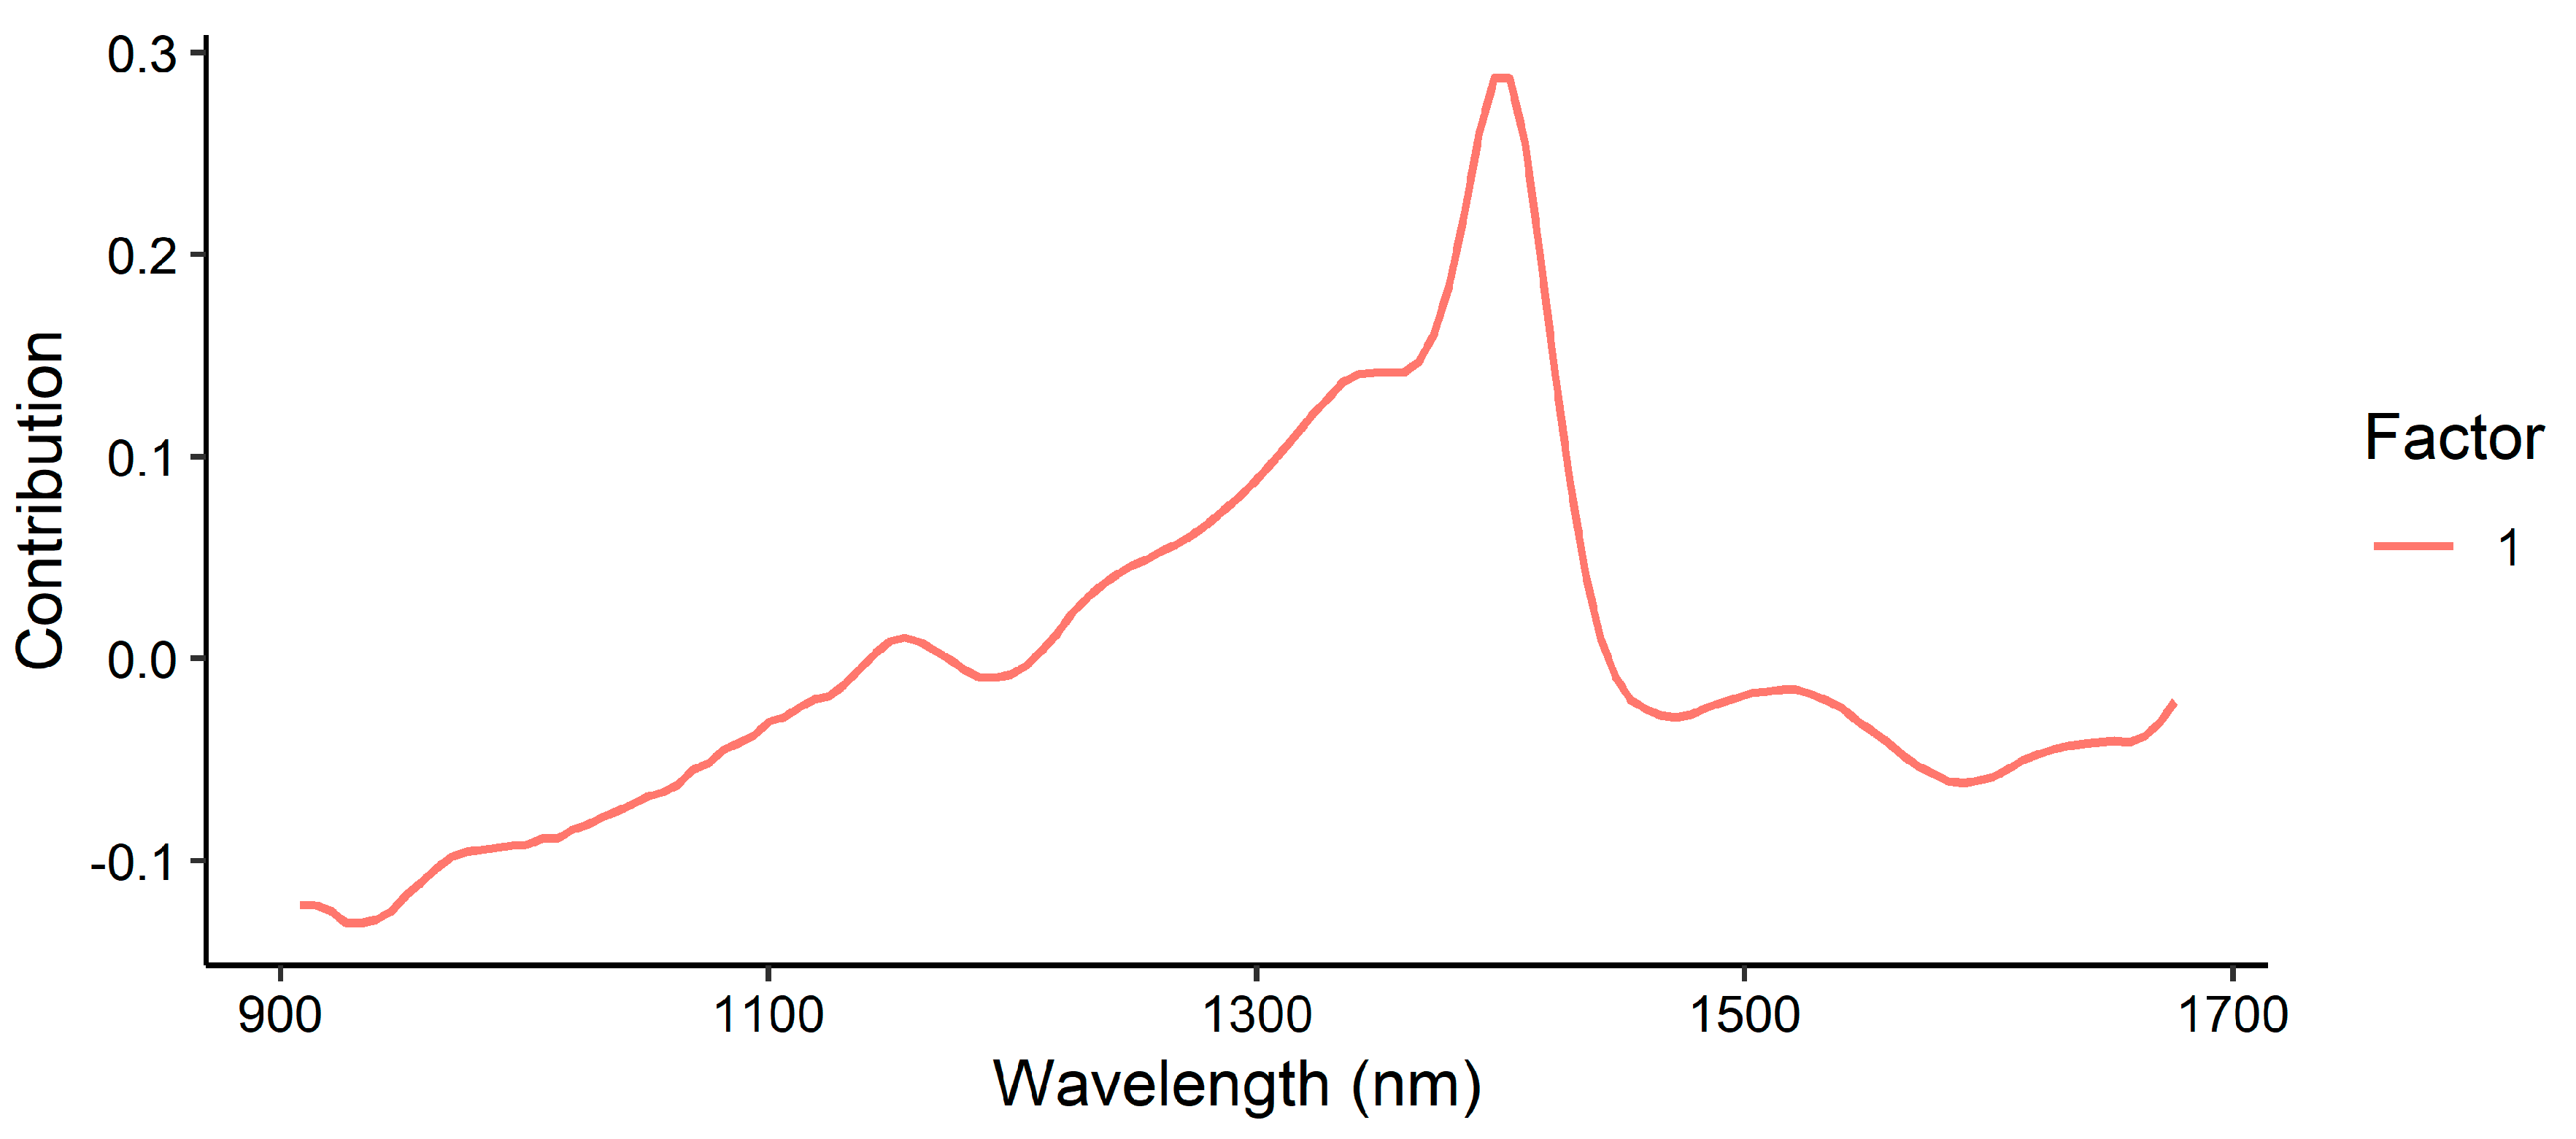
The loadings plot for the LWC model showed a strong positive loading at around 1404 nm, with a smaller shoulder at 1348 nm (Figure 5). This corresponded to the first overtone of the OH bond in water, with potentially a more minor contribution from the CH combination overtone.
The use of support vector regression (SVR) was also trialled for the prediction of LWC in the leaf spectra. Again, the pre-processing method had a strong impact on the model accuracies, with the lowest RMSEP found using 2d11 pre-processing. A similar RMSEP and higher linearity (R2pred) were found using 2d15 pre-processing. As shown in Table 5, the SVR model with 2d15 pre-processing showed a moderate improvement in performance over the PLSR method, with an R2pred of 0.85 and RMSEP of 2.32%.
3.4. Prediction of Leaf Thickness
Compared to the predictions of LWC, somewhat poorer prediction results were found for the predictions of leaf thickness (Table 6). This is because the leaf thickness was indirectly sensed by the magnitude of absorbance resulting from all IR-active compounds present in the leaves. In other words, thinner leaves showed less absorbance from compounds such as structural carbohydrates, proteins, and water, and therefore had weaker NIR signals.
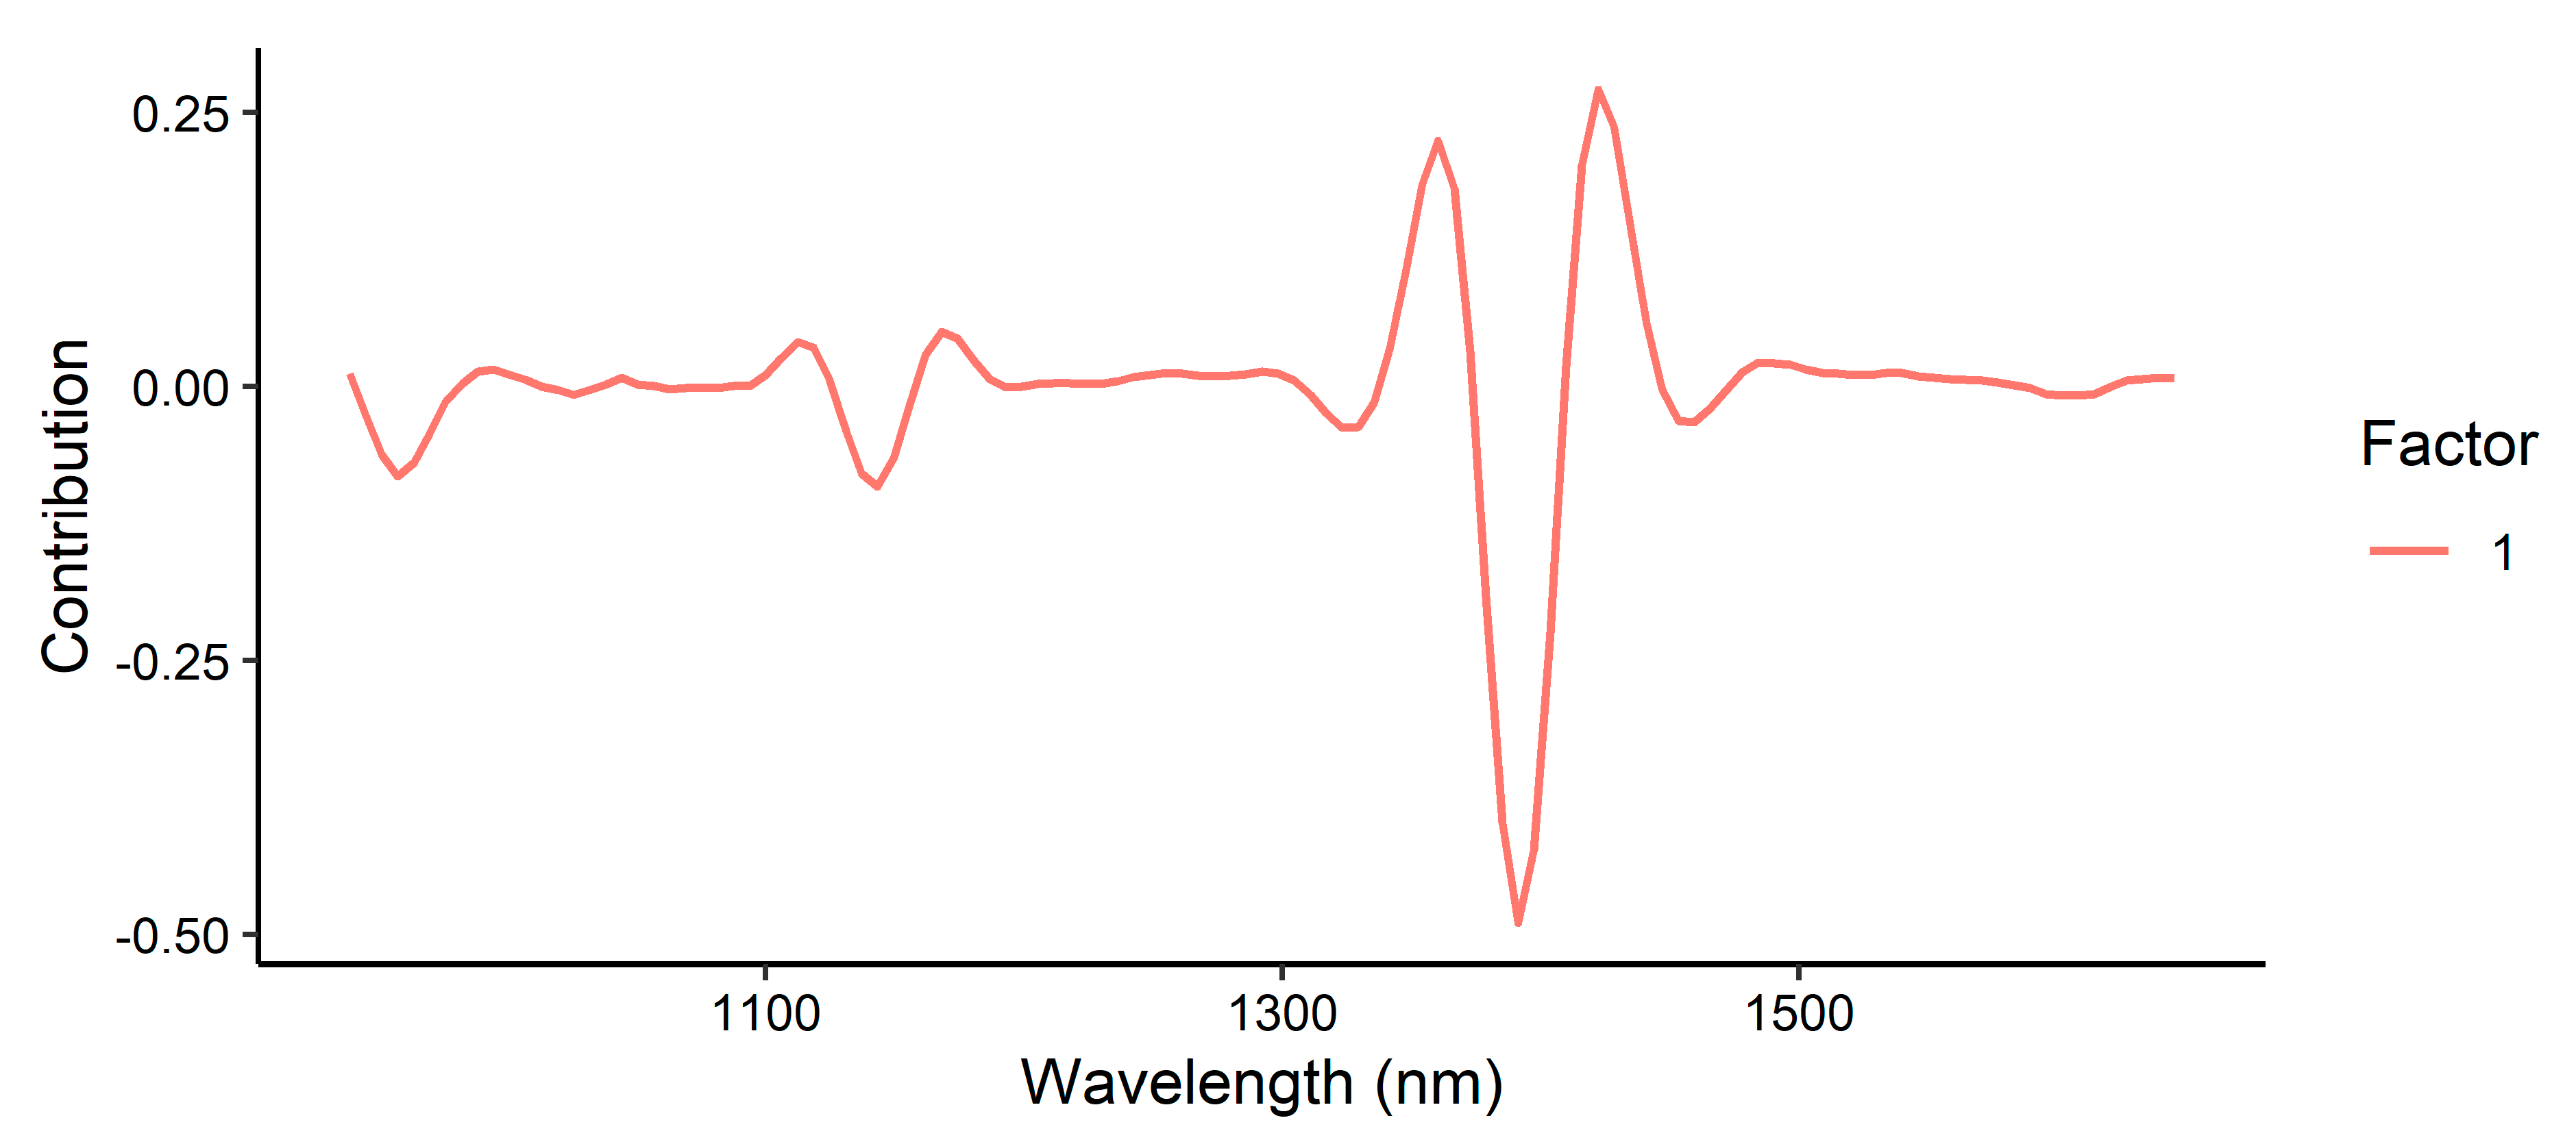
The best-performing PLSR model for leaf thickness was found using 2d11 pre-processing, with an R2CV of 0.63, RMSECV of 3.0 µm, R2pred of 0.58, and RMSEP of 2.7 µm. This appears to be the best pre-processing combination for smoothing out the background noise while retaining the informative wavelengths for the prediction of LWC. While a greater number of smoothing points does necessarily remove a proportionate number of wavelengths from both ends of the spectrum, the wavelengths found in these regions were not considered to contain informative peaks arising from OH bonds, so should not significantly influence the results. The loadings plot for leaf thickness indicated the strongest contribution was from approximately 1390 nm (Figure 6), again corresponding to the combination of the OH and CH first overtones.
In contrast to the results observed for the prediction of LWC, the use of support vector regression gave slightly poorer results for the prediction of leaf thickness, with an R2pred of 0.53 and RMSEP of 2.8 µm (Table 7).
Despite the lower accuracy compared with the prediction of LWC, the results may be useful for general screening of leaf thickness in some settings. For example, leaf thickness could be another piece of information extracted from leaf NIR spectra collected during field surveys.
3.5. Correlations between Leaf Height and LWC/Thickness
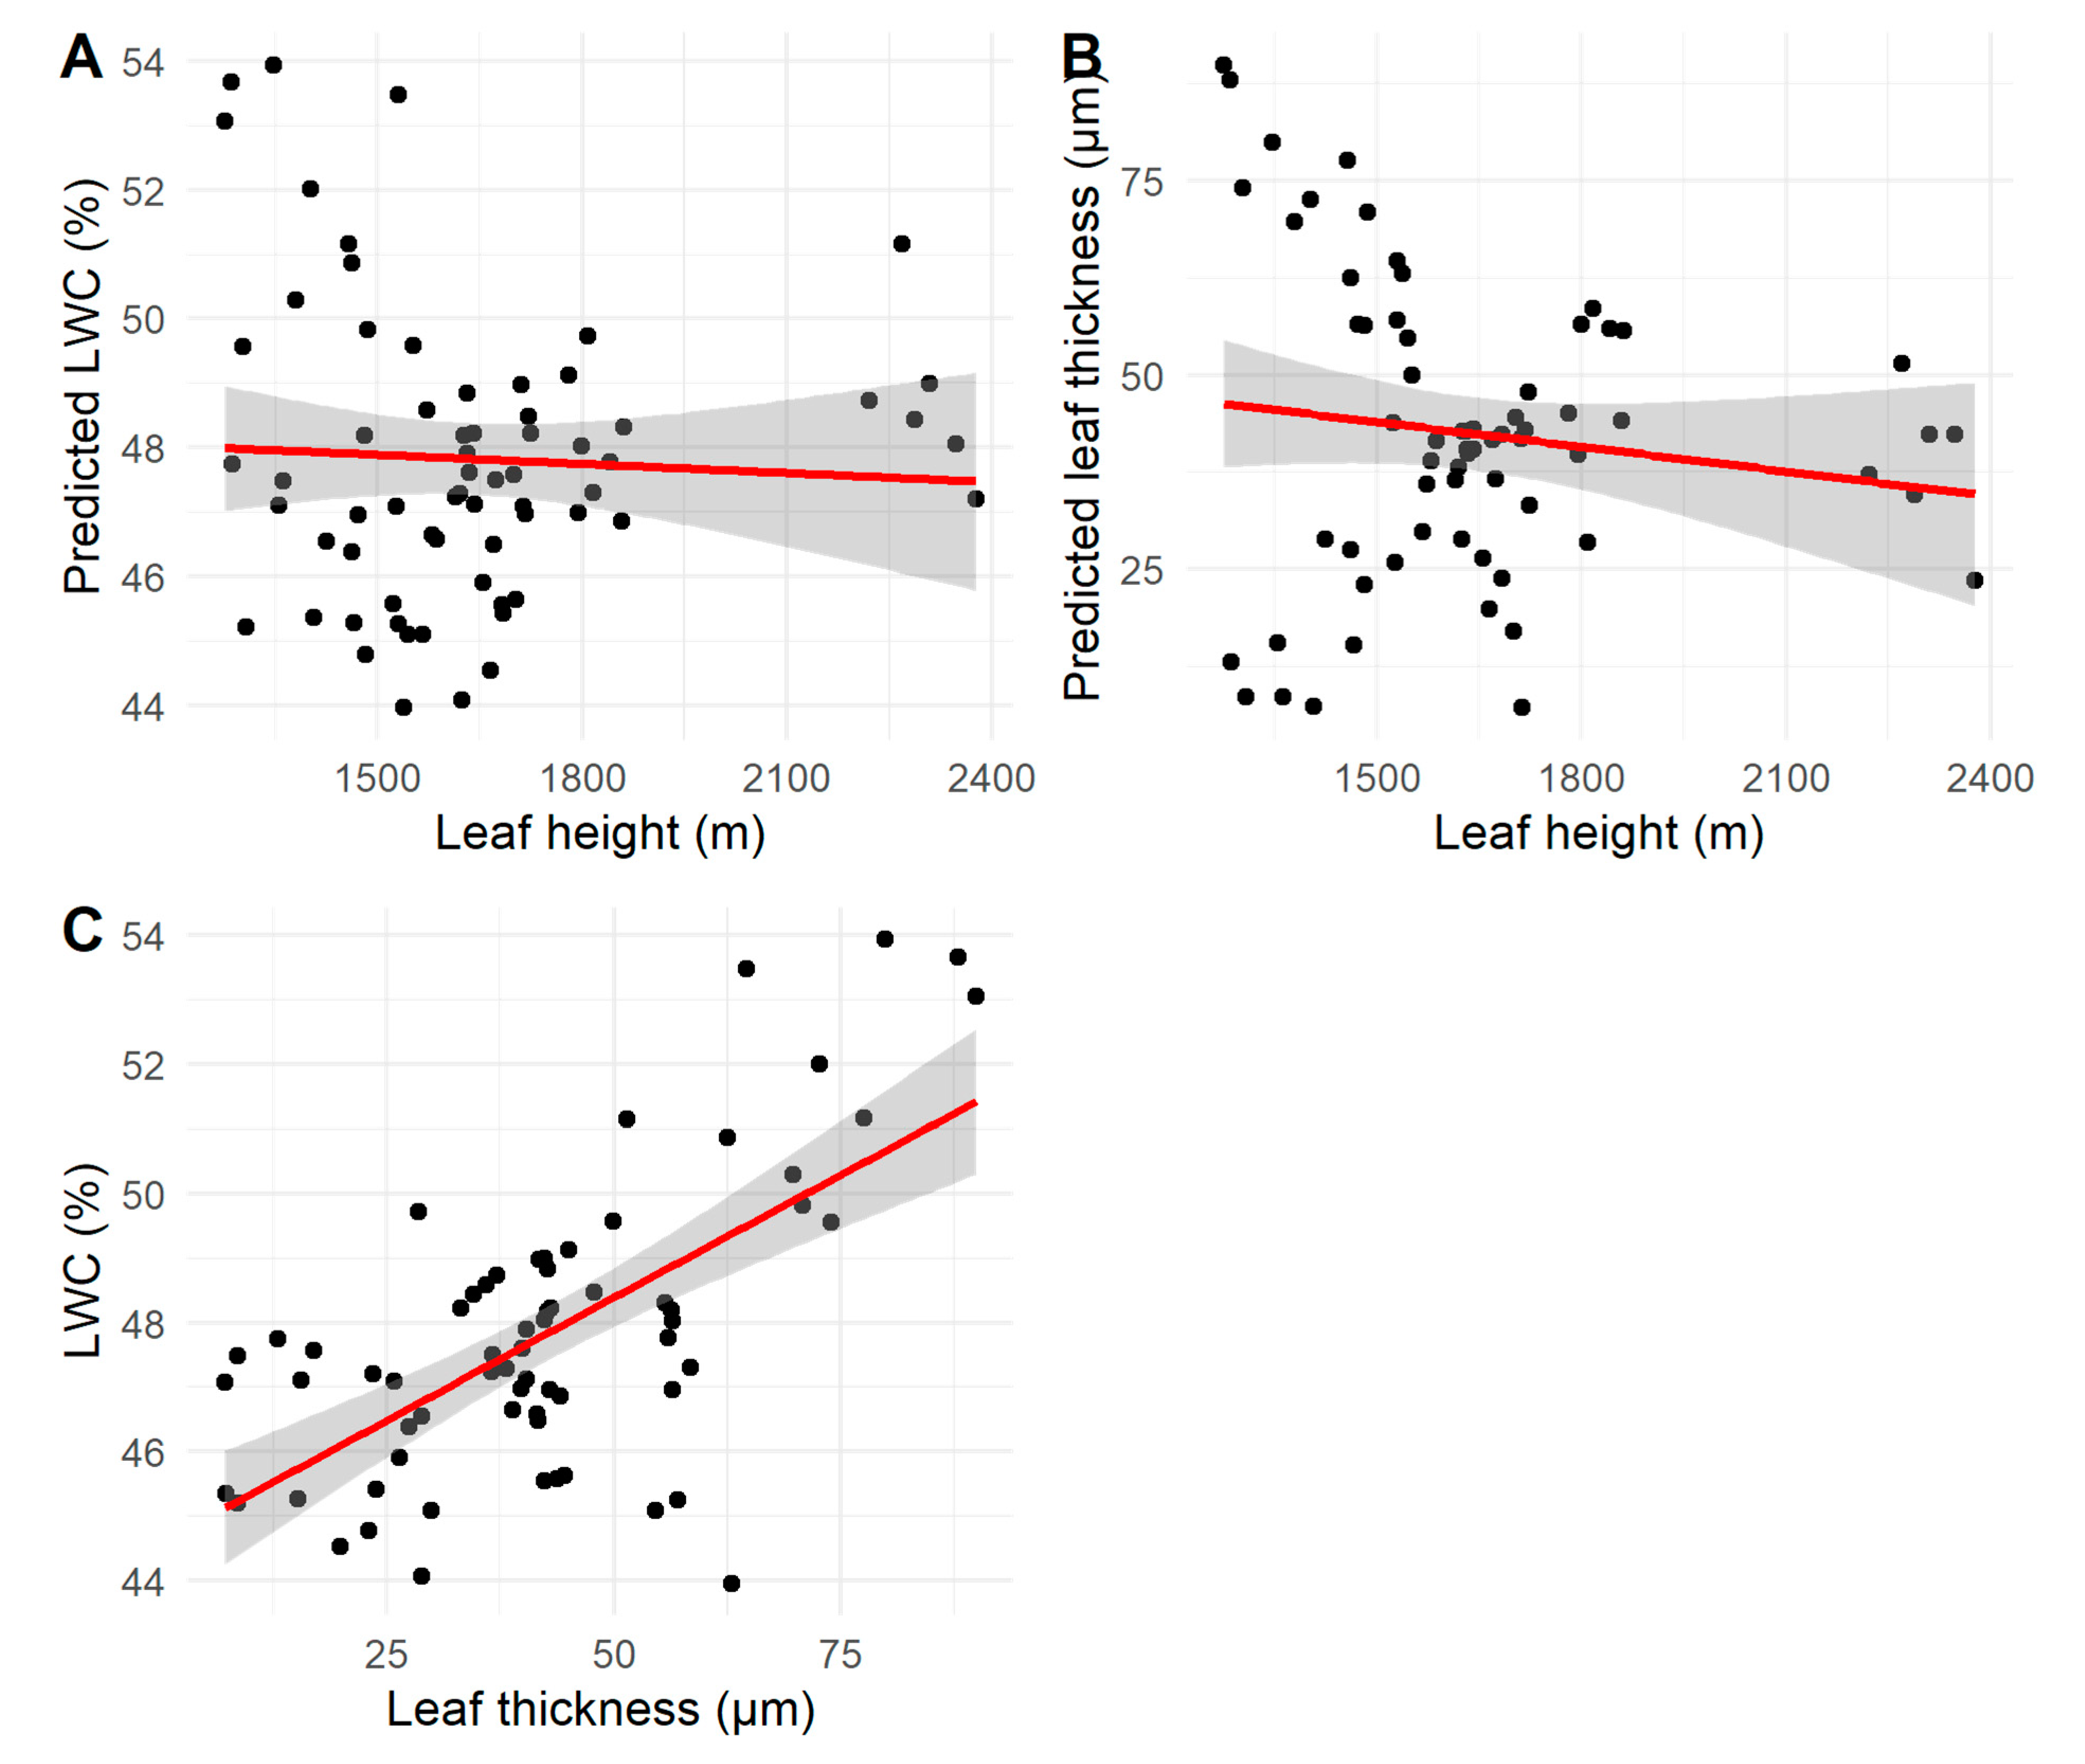
Finally, to demonstrate the potential in-field use of this technique, NIR spectra were collected from all 67 leaves on a 2.5-metre-tall E. populnea sapling. The predicted LWCs ranged from 44.0–53.9% (mean 47.8 ± 2.3%), while the leaf thickness was between 7.1–89.9 µm (mean 42.4 ± 19.3 µm).
There was no significant correlation between leaf height and LWC or thickness (Figure 7; p > 0.05 for both). However, LWC and thickness were positively correlated with one another in this sapling (r65 = 0.65, p < 0.001; Figure 7). This concurred with previous research by Búrquez [38], who found a positive correlation between leaf thickness and water potential in four non-woody species.
4. Conclusions
This study developed for the first time a rapid NIRS model for the prediction of leaf water content across Corymbia and Eucalyptus genera. High accuracy was obtained using NIRS for the prediction of leaf water content, with an R2pred of 0.85 and RMSEP of 2.32. Somewhat poorer results were found for the prediction of leaf thickness; however, the results could still be useful for screening purposes where high accuracy is not required. Handheld NIR instrumentation with a diffuse reflectance geometry—such as the instrument used in this study—may be particularly useful for the rapid, in-field measurement of LWC during survey studies.
Funding
This research received no external funding.
Institutional Review Board Statement
Not applicable.
Informed Consent Statement
Not applicable.
Data Availability Statement
The datasets supporting the findings of this paper are available from the corresponding author upon request.
Acknowledgments
Thanks to Kerry Walsh for providing access to the MicroNIR instrument.
Conflicts of Interest
The author declares no conflict of interest.
References
- Li, B.; Zhao, X.; Zhang, Y.; Zhang, S.; Luo, B. Prediction and monitoring of leaf water content in soybean plants using terahertz time-domain spectroscopy. Comput. Electron. Agric. 2020, 170, 105239. [Google Scholar] [CrossRef]
- Buckley, T.N. How do stomata respond to water status? New Phytol. 2019, 224, 21–36. [Google Scholar] [CrossRef] [PubMed]
- Lawlor, D.W.; Tezara, W. Causes of decreased photosynthetic rate and metabolic capacity in water-deficient leaf cells: A critical evaluation of mechanisms and integration of processes. Ann. Bot. 2009, 103, 561–579. [Google Scholar] [CrossRef] [PubMed]
- Nautiyal, P.C.; Rachaputi, N.R.; Joshi, Y.C. Moisture-deficit-induced changes in leaf-water content, leaf carbon exchange rate and biomass production in groundnut cultivars differing in specific leaf area. Field Crops Res. 2002, 74, 67–79. [Google Scholar] [CrossRef]
- Suriya-arunroj, D.; Supapoj, N.; Toojinda, T.; Vanavichit, A. Relative leaf water content as an efficient method for evaluating rice cultivars for tolerance to salt stress. Sci. Asia 2004, 30, 411–415. [Google Scholar] [CrossRef]
- Ishino, M.N.; De Sibio, P.R.; Rossi, M.N. Leaf trait variation on Erythroxylum tortuosum (Erythroxylaceae) and its relationship with oviposition preference and stress by a host-specific leaf miner. Austral Ecol. 2011, 36, 203–211. [Google Scholar] [CrossRef]
- Steinbauer, M.J. Oviposition preference and neonate performance of Mnesampela privata in relation to heterophylly in Eucalyptus dunnii and E. globulus. Agric. For. Entomol. 2002, 4, 245–253. [Google Scholar] [CrossRef]
- Torres, I.; Sánchez, M.-T.; Benlloch-González, M.; Pérez-Marín, D. Irrigation decision support based on leaf relative water content determination in olive grove using near infrared spectroscopy. Biosyst. Eng. 2019, 180, 50–58. [Google Scholar] [CrossRef]
- Zhou, H.; Zhou, G.; He, Q.; Zhou, L.; Ji, Y.; Lv, X. Capability of leaf water content and its threshold values in reflection of soil–plant water status in maize during prolonged drought. Ecol. Indic. 2021, 124, 107395. [Google Scholar] [CrossRef]
- Zygielbaum, A.I.; Gitelson, A.A.; Arkebauer, T.J.; Rundquist, D.C. Non-destructive detection of water stress and estimation of relative water content in maize. Geophys. Res. Lett. 2009, 36, L12403. [Google Scholar] [CrossRef]
- Omae, H.; Kumar, A.; Egawa, Y.; Kashiwaba, K.; Shono, M. Midday Drop of Leaf Water Content Related to Drought Tolerance in Snap Bean (Phaseolus vulgaris L.). Plant Prod. Sci. 2005, 8, 465–467. [Google Scholar] [CrossRef]
- Ashok, K.; Sharma, K.D. Leaf water content—A simple indicator of drought tolerance in crop plants. Indian J. Agric. Sci. 2010, 80, 1095–1097. [Google Scholar]
- De Lillis, M.; Bianco, P.M.; Loreto, F. The influence of leaf water content and isoprenoids on flammability of some Mediterranean woody species. Int. J. Wildland Fire 2009, 18, 203–212. [Google Scholar] [CrossRef]
- Yebra, M.; Chuvieco, E.; Riaño, D. Estimation of live fuel moisture content from MODIS images for fire risk assessment. Agric. For. Meteorol. 2008, 148, 523–536. [Google Scholar] [CrossRef]
- Song, X.; Zhou, G.; He, Q. Critical Leaf Water Content for Maize Photosynthesis under Drought Stress and Its Response to Rewatering. Sustainability 2021, 13, 7218. [Google Scholar] [CrossRef]
- Wang, R.; He, N.; Li, S.; Xu, L.; Li, M. Spatial variation and mechanisms of leaf water content in grassland plants at the biome scale: Evidence from three comparative transects. Sci. Rep. 2021, 11, 9281. [Google Scholar] [CrossRef] [PubMed]
- Bennett, A.F. Eucalypts, wildlife and nature conservation: From individual trees to landscape patterns. Proc. R. Soc. Vic. 2016, 128, 71–86. [Google Scholar] [CrossRef]
- Zheng, L.; Wang, Z.; Sun, H.; Zhang, M.; Li, M. Real-time evaluation of corn leaf water content based on the electrical property of leaf. Comput. Electron. Agric. 2015, 112, 102–109. [Google Scholar] [CrossRef]
- Gillon, D.; Dauriac, F.; Deshayes, M.; Valette, J.C.; Moro, C. Estimation of foliage moisture content using near infrared reflectance spectroscopy. Agric. For. Meteorol. 2004, 124, 51–62. [Google Scholar] [CrossRef]
- Santos, A.O.; Kaye, O. Grapevine leaf water potential based upon near infrared spectroscopy. Sci. Agric. 2009, 66, 287–292. [Google Scholar] [CrossRef]
- Johnson, J.B.; Naiker, M. Seeing red: A review of the use of near-infrared spectroscopy (NIRS) in entomology. Appl. Spectrosc. Rev. 2019, 55, 810–839. [Google Scholar] [CrossRef]
- Maraphum, K.; Saengprachatanarug, K.; Wongpichet, S.; Phuphaphud, A.; Posom, J. In-field measurement of starch content of cassava tubers using handheld vis-near infrared spectroscopy implemented for breeding programmes. Comput. Electron. Agric. 2020, 175, 105607. [Google Scholar] [CrossRef]
- Wang, J.; Shen, C.; Liu, N.; Jin, X.; Fan, X.; Dong, C.; Xu, Y. Non-Destructive Evaluation of the Leaf Nitrogen Concentration by In-Field Visible/Near-Infrared Spectroscopy in Pear Orchards. Sensors 2017, 17, 538. [Google Scholar] [CrossRef] [PubMed]
- Cozzolino, D. Use of Infrared Spectroscopy for In-Field Measurement and Phenotyping of Plant Properties: Instrumentation, Data Analysis, and Examples. Appl. Spectrosc. Rev. 2014, 49, 564–584. [Google Scholar] [CrossRef]
- Steinbauer, M.J.; Davies, N.W.; Gaertner, C.; Derridj, S. Epicuticular waxes and plant primary metabolites on the surfaces of juvenile Eucalyptus globulus and E. nitens (Myrtaceae) leaves. Aust. J. Bot. 2009, 57, 474–485. [Google Scholar] [CrossRef]
- Kane, C.N.; Jordan, G.J.; Jansen, S.; McAdam, S.A.M. A Permeable Cuticle, Not Open Stomata, Is the Primary Source of Water Loss From Expanding Leaves. Front. Plant Sci. 2020, 11, 774. [Google Scholar] [CrossRef]
- Yang, G.; Lu, W.; Lin, Y.; Luo, J.; Wang, C.; Meder, R.; Warburton, P.; Arnold, R. Monitoring water potential and relative water content in Eucalyptus camaldulensis using near infrared spectroscopy. J. Trop. For. Sci. 2017, 29, 121–128. [Google Scholar]
- Datt, B. Remote Sensing of Water Content in Eucalyptus Leaves. Aust. J. Bot. 1999, 47, 909–923. [Google Scholar] [CrossRef]
- Kumar, L. High-spectral resolution data for determining leaf water content in Eucalyptus species: Leaf level experiments. Geocarto Int. 2007, 22, 3–16. [Google Scholar] [CrossRef]
- Knapp, A.K.; Carter, G.A. Variability in leaf optical properties among 26 Species From A Broad Range Of Habitats. Am. J. Bot. 1998, 85, 940–946. [Google Scholar] [CrossRef] [PubMed]
- Boland, D.J.; Brooker, M.I.H.; Chippendale, G.M.; Hall, N.; Hyland, B.P.M.; Johnston, R.D.; Kleinig, D.A.; Turner, J.D. Forest Trees of Australia; Nelson–CSIRO: Melbourne, Australia, 1984. [Google Scholar]
- De Bei, R.; Cozzolino, D.; Sullivan, W.; Cynkar, W.; Fuentes, S.; Dambergs, R.; Pech, J.; Tyerman, S. Non-destructive measurement of grapevine water potential using near infrared spectroscopy. Aust. J. Grape Wine Res. 2011, 17, 62–71. [Google Scholar] [CrossRef]
- R Core Team. R: A Language and Environment for Statistical Computing, Version 4.0.2; R Foundation for Statistical Computing: Vienna, Austria, 2020.
- Workman, J.; Weyer, L. Practical Guide to Interpretive Near-Infrared Spectroscopy; CRC Press: Boca Raton, FL, USA, 2007. [Google Scholar]
- Lapcharoensuk, R.; Danupattanin, K.; Kanjanapornprapa, C.; Inkawee, T. Combination of NIR spectroscopy and machine learning for monitoring chili sauce adulterated with ripened papaya. In Proceedings of the 13th Thai Society of Agricultural Engineering International Conference (TSAE 2020), Nakhon Ratchasima, Thailand, 30–31 July 2020; Volume 187, p. 04001. [Google Scholar] [CrossRef]
- Alwi, A.; Meder, R.; Japarudin, Y.; Hamid, H.A.; Sanusi, R.; Yusoff, K.H.M. Near infrared spectroscopy of Eucalyptus pellita for foliar nutrients and the potential for real-time monitoring of trees in fertiliser trial plots. J. Near Infrared Spectrosc. 2021, 29, 158–167. [Google Scholar] [CrossRef]
- Ma, Y.; Zhang, G.-Z.; Rita-Cindy, S.A.-A. Quantification of Water, Protein and Soluble Sugar in Mulberry Leaves Using a Handheld Near-Infrared Spectrometer and Multivariate Analysis. Molecules 2019, 24, 4439. [Google Scholar] [CrossRef] [PubMed]
- Búrquez, A. Leaf Thickness and Water Deficit in Plants: A Tool for Field Studies. J. Exp. Bot. 1987, 38, 109–114. [Google Scholar] [CrossRef]
Figure 1.
Boxplot of leaf thickness for the six eucalypt species. The points are outlier samples.

Figure 2.
Boxplot of leaf water content for the fresh leaves from the six eucalypt species. The points are outlier samples.
Figure 2.
Boxplot of leaf water content for the fresh leaves from the six eucalypt species. The points are outlier samples.

Figure 3.
NIR spectra of the fresh and dried leaf samples, averaged by species.

Figure 4.
Predicted vs. reference leaf water content in the calibration set (purple) and test set (yellow), using PLSR with SNV pre-processing.
Figure 4.
Predicted vs. reference leaf water content in the calibration set (purple) and test set (yellow), using PLSR with SNV pre-processing.

Figure 5.
Loadings plot (first factor) for the prediction of LWC using NIRS, with SNV pre-processing.
Figure 5.
Loadings plot (first factor) for the prediction of LWC using NIRS, with SNV pre-processing.

Figure 6.
Loadings plot (first factor) for the prediction of leaf thickness using NIRS, with 2d11 pre-processing.
Figure 6.
Loadings plot (first factor) for the prediction of leaf thickness using NIRS, with 2d11 pre-processing.

Figure 7.
(A) Correlation between sapling leaf height and NIR-predicted leaf water content. (B) Correlation between sapling leaf height and NIR-predicted leaf thickness. (C) Correlation between leaf thickness and leaf water content.
Figure 7.
(A) Correlation between sapling leaf height and NIR-predicted leaf water content. (B) Correlation between sapling leaf height and NIR-predicted leaf thickness. (C) Correlation between leaf thickness and leaf water content.


Table 1.
Physical parameters and leaf water contents for the fresh eucalypt leaf samples. The one-way ANOVA row shows the results of ANOVA testing between the six species. Results followed by the same superscript letter were not significantly different according to post-hoc Tukey testing at α = 0.05.
| Species | Leaf Fresh Mass (g) | Leaf Thickness (µm) | Leaf Water Content (%) |
|---|---|---|---|
| C. citriodora (n = 20) | 0.72 ± 0.24 c | 28.4 ± 2.0 b | 46.1 ± 1.3 d |
| C. tessellaris (n = 20) | 0.39 ± 0.15 d | 24.6 ± 3.7 c | 51.2 ± 1.5 ab |
| Corymbia average (n = 40) | 0.55 ± 0.26 | 26.5 ± 3.5 | 48.6 ± 3.0 |
| E. melanophloia (n = 20) | 1.29 ± 0.43 a | 34.8 ± 2.7 a | 45.3 ± 2.5 d |
| E. platyphylla (n = 20) | 1.30 ± 0.48 a | 34.0 ± 3.7 a | 53.1 ± 4.6 a |
| E. populnea (n = 20) | 0.96 ± 0.34 bc | 34.8 ± 3.6 a | 49.7 ± 5.2 bc |
| E. tereticornis (n = 19) | 1.04 ± 0.29 ab | 32.2 ± 3.2 a | 47.8 ± 3.6 cd |
| Eucalyptus average (n = 79) | 1.15 ± 0.42 | 34.0 ± 3.4 | 49.0 ± 5.0 |
| One-way ANOVA | *** | *** | *** |
*** p < 0.001.
Table 2.
Correlation between the fresh leaf mass, thickness, and water content of the eucalypt leaves from five different species. Values are given as Pearson R correlation coefficients (n = 119 leaves).
Table 2.
Correlation between the fresh leaf mass, thickness, and water content of the eucalypt leaves from five different species. Values are given as Pearson R correlation coefficients (n = 119 leaves).
| Parameter | Mass (g) | Thickness (µm) | LWC (%) |
|---|---|---|---|
| Mass (g) | - | - | - |
| Thickness (µm) | 0.58 *** | - | - |
| LWC (%) | −0.13 NS | −0.25 ** | - |
NS = p > 0.05, ** p < 0.01, *** p < 0.001.
Table 3.
Descriptive statistics for the calibration and test sets. Values are given as mean ± SD, with the range provided in brackets.
Table 3.
Descriptive statistics for the calibration and test sets. Values are given as mean ± SD, with the range provided in brackets.
| Sample Set | Leaf Water Content (%) | Leaf Thickness (µm) |
|---|---|---|
| Calibration—five different species (n = 153) | 41.1 ± 13.8 (0–62.6) | 31.1 ± 4.9 (20.4–41.3) |
| Test set—E. platyphylla (n = 20) | 53.1 ± 4.6 (47.9–64.6) | 34.0 ± 3.7 (30.0–42.9) |
Note that all sample numbers refer to the number of samples, not spectra; i.e., 20 samples = 60 spectra.
Table 4.
Statistical results for the prediction of leaf water content (LWC) in eucalypt leaves using different pre-processing methods combined with PLS regression.
Table 4.
Statistical results for the prediction of leaf water content (LWC) in eucalypt leaves using different pre-processing methods combined with PLS regression.
| Pre-Processing | Factors | R2CV | RMSECV (% w/w) | RPD | R2pred | RMSEP (% w/w) | Bias (% w/w) | Slope | Intercept |
|---|---|---|---|---|---|---|---|---|---|
| None | 3 | 0.939 | 3.41 | 4.05 | 0.567 | 4.38 | −3.12 | 0.43 | 26.9 |
| MSC | 5 | 0.962 | 2.68 | 5.15 | 0.738 | 2.76 | −0.90 | 0.51 | 25.1 |
| SNV | 6 | 0.974 | 2.21 | 6.24 | 0.803 | 2.46 | −0.40 | 0.53 | 24.4 |
| 1d5 | 3 | 0.943 | 3.30 | 4.18 | 0.546 | 3.49 | −1.68 | 0.50 | 25.1 |
| 1d11 | 4 | 0.955 | 2.93 | 4.71 | 0.788 | 2.85 | −1.77 | 0.63 | 17.7 |
| 1d15 | 3 | 0.946 | 3.21 | 4.30 | 0.651 | 3.54 | −2.32 | 0.64 | 16.8 |
| 2d5 | 5 | 0.953 | 3.00 | 4.60 | 0.478 | 3.99 | −2.27 | 0.43 | 27.9 |
| 2d11 | 6 | 0.961 | 2.73 | 5.05 | 0.582 | 2.95 | −1.34 | 0.58 | 21.1 |
| 2d15 | 4 | 0.947 | 3.17 | 4.35 | 0.576 | 2.99 | −2.42 | 0.51 | 23.7 |
Table 5.
Statistical results for the prediction of leaf water content (LWC) in eucalypt leaves, obtained using different pre-processing methods combined with support vector regression.
Table 5.
Statistical results for the prediction of leaf water content (LWC) in eucalypt leaves, obtained using different pre-processing methods combined with support vector regression.
| Pre-Processing | R2CV | RMSECV (% w/w) | RPD | R2pred | RMSEP (% w/w) | Bias (% w/w) | Slope | Intercept |
|---|---|---|---|---|---|---|---|---|
| None | 0.897 | 4.48 | 3.08 | 0.264 | 5.93 | −4.26 | 0.10 | 43.3 |
| MSC | 0.961 | 2.76 | 4.99 | 0.72 | 3.67 | −2.26 | 0.41 | 28.8 |
| SNV | 0.965 | 2.62 | 5.26 | 0.735 | 3.47 | −2.01 | 0.43 | 28.2 |
| 1d5 | 0.973 | 2.31 | 5.96 | 0.837 | 2.69 | −1.18 | 0.52 | 24.5 |
| 1d11 | 0.970 | 2.42 | 5.69 | 0.807 | 3.01 | −1.48 | 0.47 | 26.8 |
| 1d15 | 0.968 | 2.49 | 5.53 | 0.784 | 3.16 | −1.74 | 0.47 | 26.4 |
| 2d5 | 0.979 | 2.09 | 6.59 | 0.778 | 2.53 | −0.72 | 0.55 | 23.1 |
| 2d11 | 0.979 | 2.09 | 6.59 | 0.800 | 2.22 | −0.45 | 0.64 | 18.7 |
| 2d15 | 0.973 | 2.31 | 5.96 | 0.845 | 2.32 | −0.71 | 0.58 | 21.7 |
Table 6.
Prediction results for leaf thickness in eucalypt leaves using different pre-processing methods combined with PLS regression.
Table 6.
Prediction results for leaf thickness in eucalypt leaves using different pre-processing methods combined with PLS regression.
| Pre-Processing | Factors | R2CV | RMSECV (µm) | RPD | R2pred | RMSEP (µm) | Bias (µm) | Slope | Intercept |
|---|---|---|---|---|---|---|---|---|---|
| None | 5 | 0.543 | 3.29 | 1.48 | 0.546 | 2.98 | −1.46 | 0.73 | 7.8 |
| MSC | 7 | 0.54 | 3.31 | 1.47 | 0.488 | 2.89 | −1.10 | 0.61 | 12.1 |
| SNV | 6 | 0.524 | 3.36 | 1.45 | 0.571 | 2.83 | −0.88 | 0.56 | 14.2 |
| 1d5 | 7 | 0.569 | 3.19 | 1.52 | 0.483 | 2.85 | −0.25 | 0.70 | 10.1 |
| 1d11 | 7 | 0.557 | 3.24 | 1.50 | 0.500 | 2.83 | −0.46 | 0.71 | 9.3 |
| 1d15 | 5 | 0.529 | 3.38 | 1.44 | 0.479 | 2.97 | −0.40 | 0.73 | 8.7 |
| 2d5 | 7 | 0.602 | 3.07 | 1.58 | 0.487 | 2.90 | −0.88 | 0.66 | 10.6 |
| 2d11 | 7 | 0.626 | 2.97 | 1.64 | 0.583 | 2.73 | −1.11 | 0.76 | 7.0 |
| 2d15 | 7 | 0.608 | 3.05 | 1.59 | 0.480 | 3.14 | −0.37 | 0.80 | 6.4 |
Table 7.
Prediction results for leaf thickness in eucalypt leaves using different pre-processing methods combined with support vector regression.
Table 7.
Prediction results for leaf thickness in eucalypt leaves using different pre-processing methods combined with support vector regression.
| Pre-Processing | R2CV | RMSECV (µm) | RPD | R2pred | RMSEP (µm) | Bias (µm) | Slope | Intercept |
|---|---|---|---|---|---|---|---|---|
| None | 0.257 | 4.22 | 1.15 | 0.312 | 3.18 | −0.87 | 0.23 | 25.3 |
| MSC | 0.448 | 3.61 | 1.35 | 0.438 | 2.84 | −0.67 | 0.52 | 15.6 |
| SNV | 0.461 | 3.57 | 1.36 | 0.443 | 2.85 | −0.68 | 0.54 | 15.0 |
| 1d5 | 0.589 | 3.12 | 1.56 | 0.469 | 2.88 | −0.20 | 0.68 | 10.7 |
| 1d11 | 0.539 | 3.30 | 1.47 | 0.441 | 2.97 | −0.22 | 0.66 | 11.5 |
| 1d15 | 0.525 | 3.35 | 1.45 | 0.454 | 2.90 | −0.33 | 0.65 | 11.7 |
| 2d5 | 0.673 | 2.79 | 1.74 | 0.522 | 2.70 | −0.38 | 0.70 | 9.7 |
| 2d11 | 0.684 | 2.74 | 1.77 | 0.527 | 2.75 | −0.62 | 0.72 | 8.9 |
| 2d15 | 0.595 | 3.09 | 1.57 | 0.461 | 2.87 | −0.10 | 0.66 | 11.6 |
Disclaimer/Publisher’s Note: The statements, opinions and data contained in all publications are solely those of the individual author(s) and contributor(s) and not of MDPI and/or the editor(s). MDPI and/or the editor(s) disclaim responsibility for any injury to people or property resulting from any ideas, methods, instructions or products referred to in the content. |
© 2023 by the author. Licensee MDPI, Basel, Switzerland. This article is an open access article distributed under the terms and conditions of the Creative Commons Attribution (CC BY) license (https://creativecommons.org/licenses/by/4.0/).
Share and Cite
MDPI and ACS Style
Johnson, J.B. Rapid Prediction of Leaf Water Content in Eucalypt Leaves Using a Handheld NIRS Instrument. Eng 2023, 4, 1198-1209. https://doi.org/10.3390/eng4020070
AMA Style
Johnson JB. Rapid Prediction of Leaf Water Content in Eucalypt Leaves Using a Handheld NIRS Instrument. Eng. 2023; 4(2):1198-1209. https://doi.org/10.3390/eng4020070
Chicago/Turabian StyleJohnson, Joel B. 2023. "Rapid Prediction of Leaf Water Content in Eucalypt Leaves Using a Handheld NIRS Instrument" Eng 4, no. 2: 1198-1209. https://doi.org/10.3390/eng4020070