
A Method to Identify the Critical Seismic Input for Curved Bridges

School of Construction Management Technology, Purdue University, West Lafayette, IN 47906, USA
*
Author to whom correspondence should be addressed.
CivilEng 2023, 4(2), 567-583; https://doi.org/10.3390/civileng4020033
Submission received: 16 February 2023
/
Revised: 26 March 2023
/
Accepted: 19 May 2023
/
Published: 24 May 2023
(This article belongs to the Special Issue Site-Specific Seismic Design of Buildings)
Abstract
:To address the rapidly growing demands of traffic congestion, more highway bridges have been constructed, especially curved bridges. With more curved bridges designed and constructed, people have conducted a comprehensive analysis of the structural performance. Due to the nature of the structural complexity of curved bridges, dynamic responses of the curve bridges vary dramatically from the standard linear bridges. Although some work has been conducted to investigate the curved bridge dynamic analysis under seismic inputs, the framework for analyzing the curved bridges’ vulnerability under various angles of inputs is still lacking. In this paper, we conducted a series of curved bridge seismic analyses based on different inputs and conducted a parametric study of the bridge performance using finite element models. We conducted time history analyses by applying seismic inputs to investigate the bridge dynamic responses based on different angle inputs and other different structural parameters. We developed an approach identifying the most vulnerable direction of the seismic inputs and the strongest dynamic responses for curved bridges based on time series analysis. This approach was validated with the dynamic analysis of a simplified bridge model. The method developed in this paper will help improve the curved bridge design code and further provide suggestions about mitigating seismic response for device design.
1. Introduction
Highway bridge safety is critical for our society’s economic sustainable growth. Depending on the practical needs of the project, highway bridge shapes vary dramatically. In many cases, due to the high cost and construction difficulty of linear bridges, curved bridges are often adopted. In addition, to reduce the accumulation of drivers’ fatigue from driving on long, linear bridges with a similar environment, more and more curved bridges are used to replace long, linear bridges. In some other cases, for aesthetic purposes, curved bridges are designed to match the surrounding environment. More importantly, to address the heavy traffic issues of the city, curved overpass bridges are becoming more popular. Various types of curved bridges play a more important role in addressing city traffic.
Infrastructure is the backbone of our society, especially against extreme events, such as natural hazards. One essential topic about mitigating natural hazards and damages on infrastructures is focused on highway bridges. In 1971, the San Fernando earthquake caused severe damage to many highway bridges. In 1989, the Loma Prieta earthquake also induced huge losses in the economy and highway bridges. In 1994, the Northridge earthquake introduced multiple highway bridge collapses near Los Angeles. In 1995, the Kobe earthquake causes great highway and railroad bridge damage in Japan. Considering the huge losses due to seismic damage on highway bridges, it is very important to investigate bridge safety under seismic inputs.
Among the city infrastructure systems, due to the space limit, in many cases, small-radius-curvature curved bridges need to be constructed. Compared with linear bridges, curved bridges demonstrate different dynamic responses, especially small-curvature bridges. Curved bridges may show some moment–torsion combination under both the vehicle load and horizontal seismic inputs. When analyzing the curved bridge response in the horizontal and vertical directions, the moment–torsion combination cannot be easily de-coupled. Due to the complexity of the curvature and torsional vibration, it is very challenging to develop a rational theoretical dynamic analysis of the curved bridge. Nowadays, people conduct extensive horizontal and vertical seismic input studies because linear bridges often demonstrate strong responses in these two directions. However, for curved bridges, due to the continuous variations in the radius and tangential directions along the bridges, we cannot simply follow the same approach of identifying the linear bridge’s worst seismic input. Nowadays, design codes often recommend analyzing various seismic inputs and adopting the maximum values for design purposes. This approach is time-consuming and uses huge computational costs. Developing a more efficient method to identify the most vulnerable input for curved bridge design is highly demanding.
The goal of this paper was to identify the most vulnerable seismic input angle and the associated strongest seismic responses of curved bridges. The dynamic responses of the curved bridges were investigated using finite element analysis and parametric study. Based on the comprehensive analysis, we came up with a framework for a curved bridge seismic design. In this paper, first, a comprehensive literature review of previous curved bridge seismic analyses was summarized. Then, a series of finite element analyses of a practical curved model was conducted to investigate its dynamic responses and relationships associated with various structural parameters. Third, multiple inputs of seismic inputs were simulated to analyze the structural responses. Based on various structural responses, we introduced a new method for identifying the most vulnerable seismic inputs of curved bridges. In the end, conclusions about the curved bridge seismic design and future works to improve the design were summarized.
Curved bridges, due to their nature, exhibit more complicated dynamic responses than linear bridges. Curved bridges often demonstrate stronger bending–torsion coupling effects than linear bridges under seismic inputs. From the 1970s to the 1990s, several strong earthquakes caused massive damages and economic losses on curved bridges in many countries around the world. Since then, many countries started spending more effort investigating curved bridge seismic analysis. In 1971, the San Fernando earthquake caused many high-rise buildings and bridge structures to collapse [1]. One 235 m long curved bridge with 7 spans suffered severe damage from this earthquake. Major damage occurred at the bottom of the bridge columns, and the whole bridge structure collapsed to the exterior curve and fell into several parts. This bridge failure turned engineers’ attentions to improving the ductility of the curved bridge. In 1989, the Loma Prieta earthquake caused two layers of curved bridge damage due to column failure [2]. This accident caused huge economic losses and many human injuries. The reason for the bridge collapse was due to the foundation liquefaction. In 1994, the Northridge earthquake paralyzed the traffic infrastructure system in Los Angeles [3]. Four major highways were closed for several months. Part of the curved bridge at the intersection of highways 5 and 14 was damaged and collapsed, due to the low ratio of rebar and a small cross-section of the corbel. This accident also verified that ductility is critical for bridge safety against earthquakes and that vertical restriction is effective against bridge collapses. In 1995, the Kobe earthquake caused huge damage to the highway and railroad system in a large area of Japan. Some curved bridge failures were due to the damage to the bridge columns [4].
Nowadays, most curved bridge analyses are focused on static analysis and linear dynamic analysis, including natural frequencies, modal shapes, and damping conditions. The goal of this analysis is to provide suggestions for spectrum analysis and structural design, such as support arrangement. Some researchers investigated the simple box-girder curved bridge dynamic performance relationship between the natural frequency and bridge connections or the radius curvature effect [5,6,7]. When focusing on the modal shape of the curved bridges, how the modal shapes are affected by different parameters needs to be investigated.
Since the 1971 San Fernando earthquake, many researchers have conducted several studies on curved bridge earthquake analysis. Tsening and Penzien developed a curved bridge analysis program and analyzed one bridge that failed during the San Fernando earthquake [8]. Williams and Godden conducted curved bridge shake table experiments [9,10]. Cheng analyzed the tall-column curved bridge modal analysis using the Rayleigh–Ritz method. Buckle et al. conducted a curved bridge field testing and dynamic analysis [11]. Abdel and Heins conducted an earthquake analysis and measured the stress changes under earthquake inputs [12]. Richardson and Douglas measured the curved bridge responses at the site and compared them with finite element analysis [13]. Desroches and Fenves investigated bridge responses of single-point and multiple-point seismic inputs [14]. Hirasawa et al. investigated different types of supports and how they affected the bridge response [15]. Otsuka et al. investigated the sliding of the curved bridge under horizontal inputs [16]. More recently, researchers have focused on the seismic vulnerability assessment of curved bridges [17,18,19,20]. Some researchers recently developed some methods of identifying the critical seismic input angles for curved bridges and compared simulation results with shake table experiments [21,22]. These methods demonstrated good accuracy but took high computational costs.
2. Curved Bridge Dynamic Response Analysis
Simplifying the practical bridge design into a finite element model with adequate detailing and accuracy is critical. We adopted the 3D beam element (6 DOF) for beam and column members of the curved bridge model and used concrete as the material. To create the finite element model of the curved bridge, we studied several practical designs of curved bridges and summarized their characteristics in Table 1.
In this paper, we picked a curved bridge ramp segment and conducted a series of finite element analyses of this segment under two assumptions:
- There was no restriction of the plate rubber support properties under tension.
- There was no friction difference when installing the rubber support under or above the covered beam.
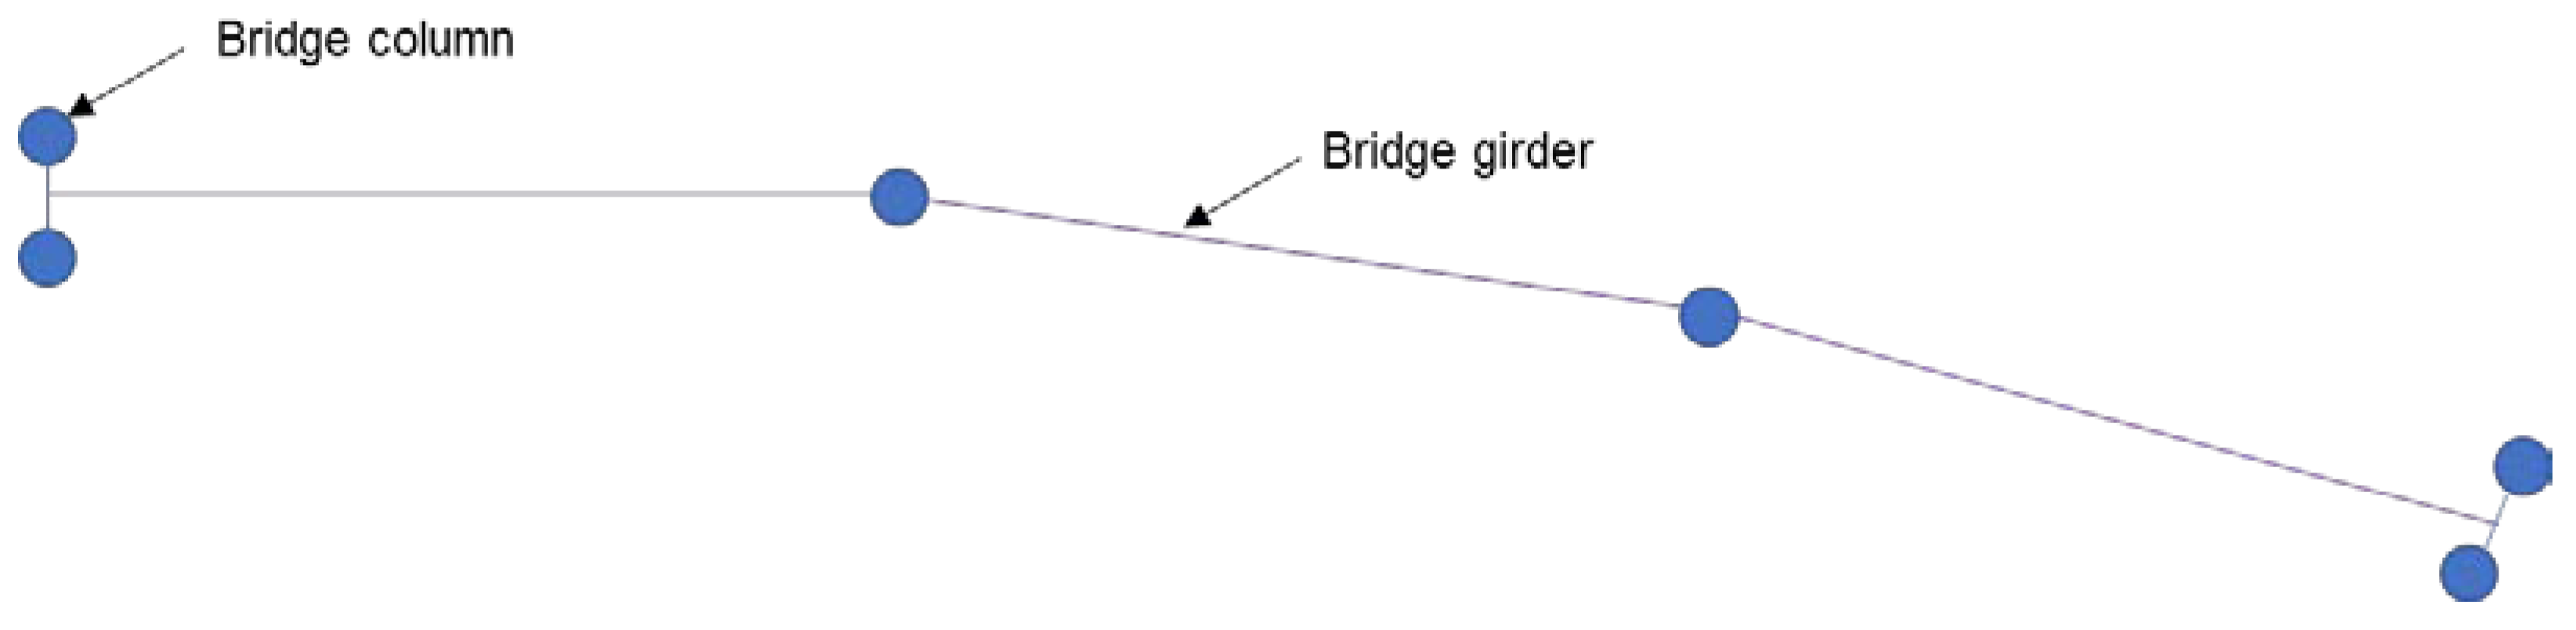
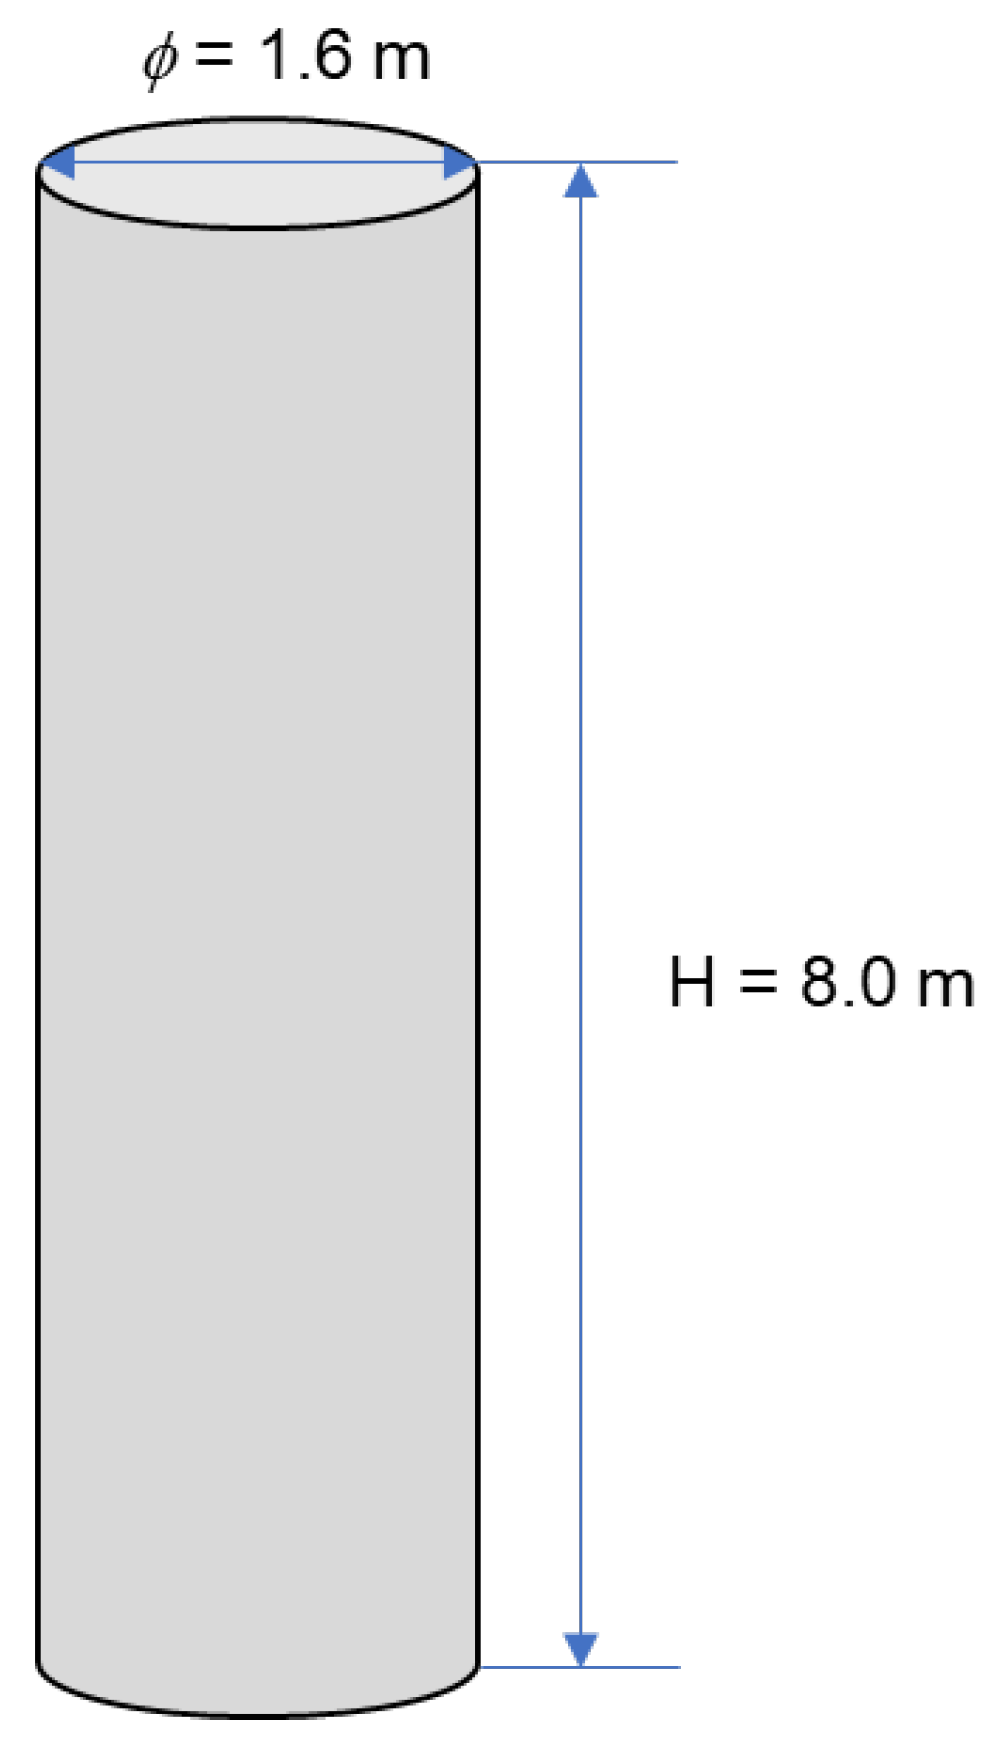
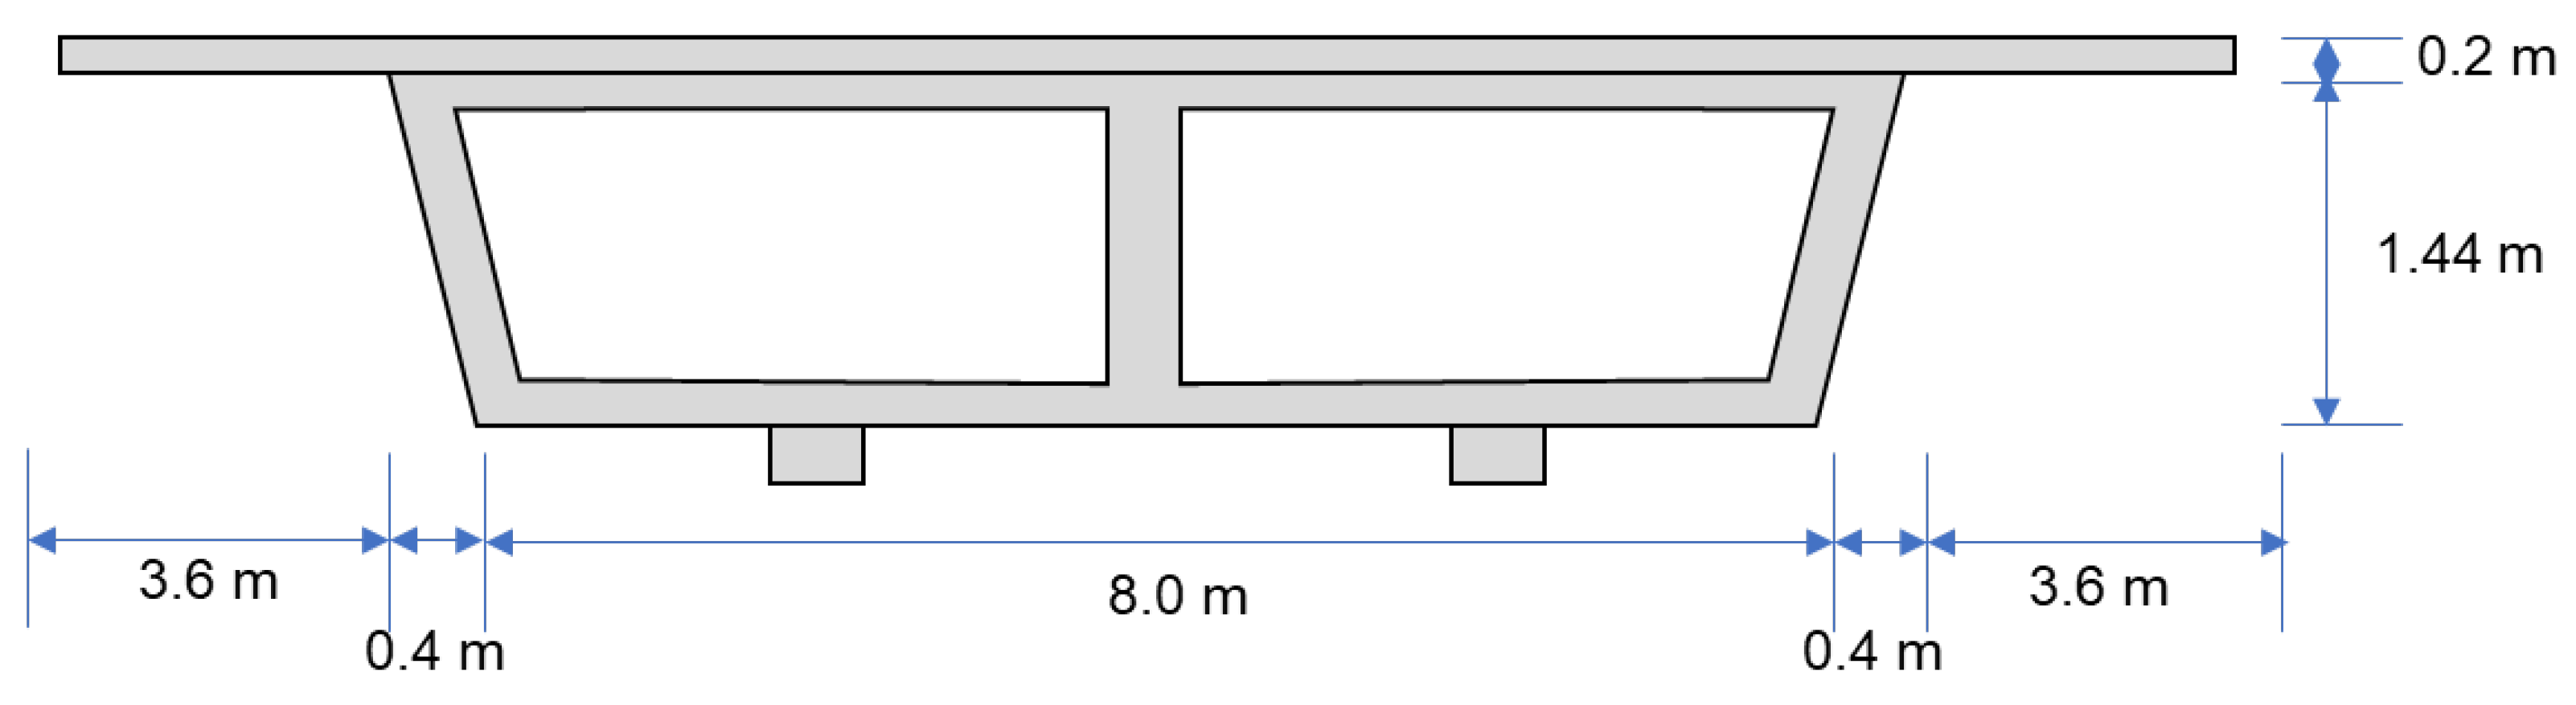
Both assumptions provided the possibility of investigating different support arrangements of continuous curved bridge models. The plant view of this representative curved bridge ramp segment is shown in Figure 1. The cross-section of the bridge column is shown in Figure 2. The bridge girder property information is shown in Figure 3. The geometry information of the bridge column is shown below: cross-section area A = 2.0106 m2; the moment of inertia Iy = Iz = 0.3217 m4; and the torsional moment of inertia Id = 0.6434 m4. The geometrical information of the bridge girder was calculated to be: cross-section area A = 6.372 m2; moment of inertia Iy = 1.896 m4; Iz = 99.482 m4; and torsional moment of inertia Id = 5.187 m4.
The 3D elastic beam elements were adopted for both bridge girders and columns. To minimize the element assignment time, automatically generated meshing was used. For the multi-layer rubber plate supports, three directions of support were simplified as three springs with some stiffness, although much more accurate uniaxial [23,24] or biaxial [25] hysteretic springs can be adopted. We assumed there was a good connection between the bridge column and the girder with the support installed, and vertical stiffness was a large order number. In this model, we used 1010 kN/m as the vertical stiffness.
Finite element modal dynamic analysis was conducted using the SAP2000 software [26]. In linear dynamic analysis, bridge dynamic response, including natural frequencies and modal shapes, are only related to the structural properties but not related to the external inputs. In this paper, we investigated different structural parameters, including column heights, radius curvature, bridge span, and support arrangement effects on curved bridge dynamic performance.
2.1. Different Column Heights Effects
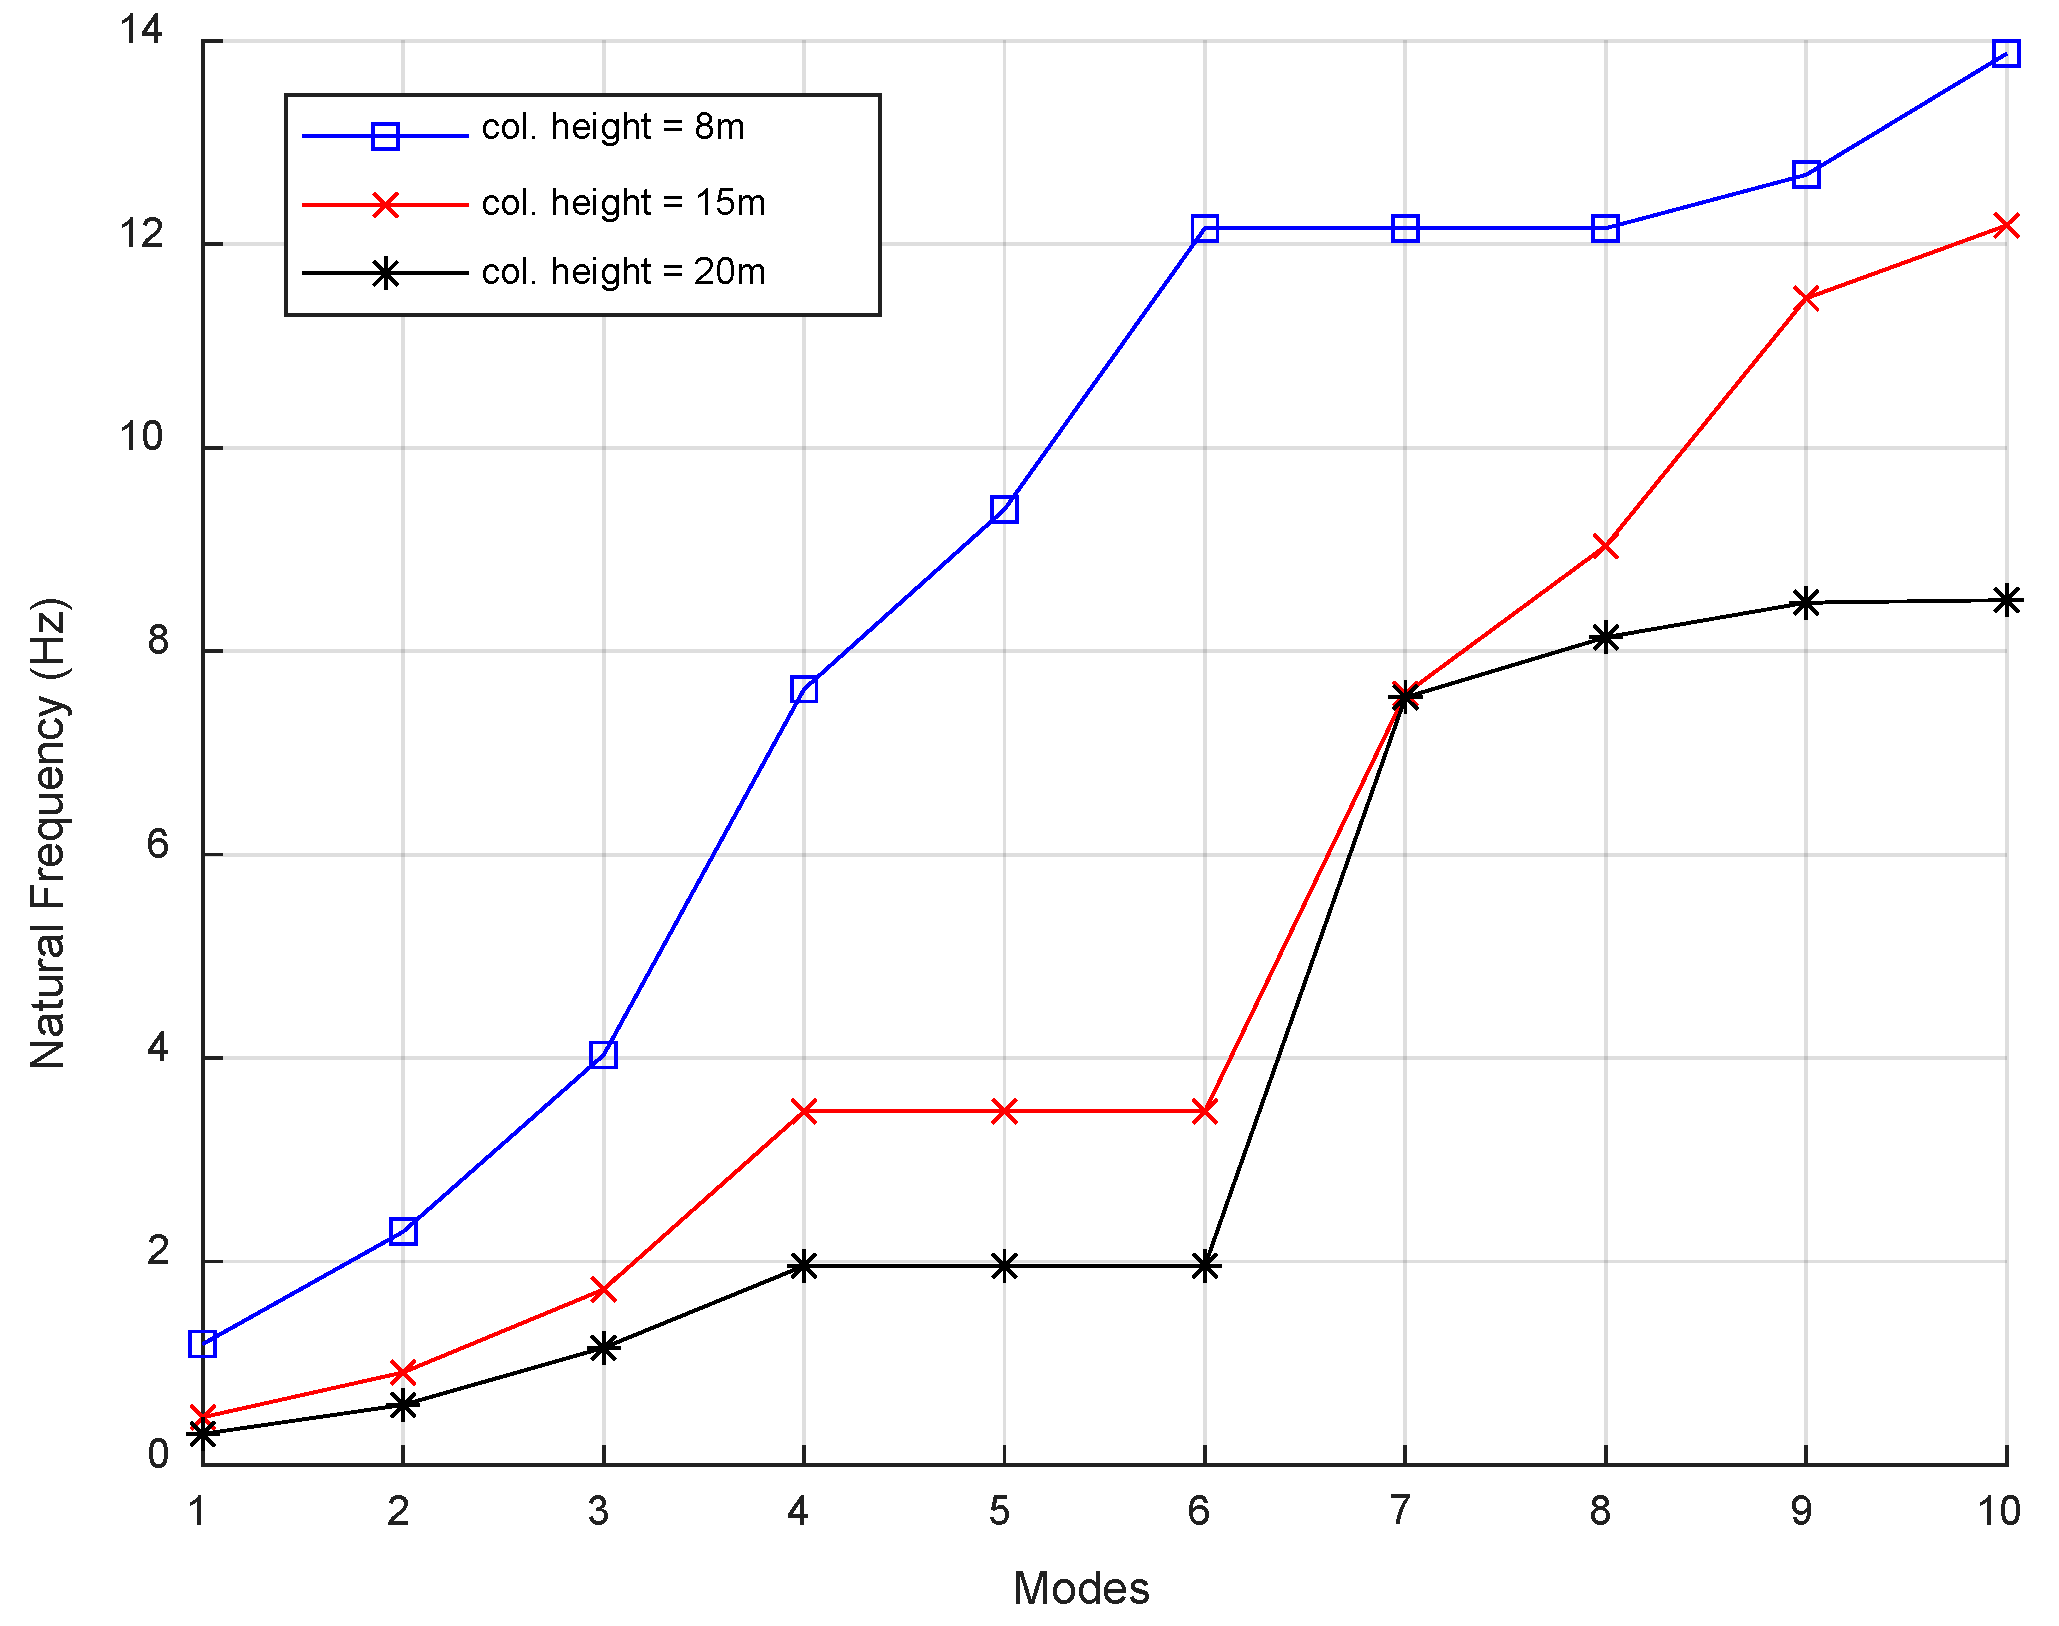
To investigate different column heights’ effects on the curved dynamic performance, three different column heights were selected: 8 m, 15 m, and 20 m. The bridge girders, columns, and supports were the same for all three cases. The bridge column cross-section is shown in Figure 2. The bridge girder cross-section is shown in Figure 3. The connections between the bridge columns and the ground were fixed. The natural frequencies (first 10 modes) of the curved bridge models via finite element analysis are shown in Figure 4. The first ten modes are summarized in Table 2.
From the natural frequency results of the first 10 modes:
- Column heights had strong effects on natural frequencies, especially for lower modes.
- The first mode’s natural frequency was usually less than 2 Hz. It showed some coupling effects for higher modes.
- With the column height increasing, higher-mode-shape natural frequencies were reduced.
From the modal shape analysis results of the first 10 modes:
- The first two modes were motions along the horizontal or longitudinal direction.
- The higher mode demonstrated coupling between the bridge girder and the column.
2.2. Different Bridge Spans Effects
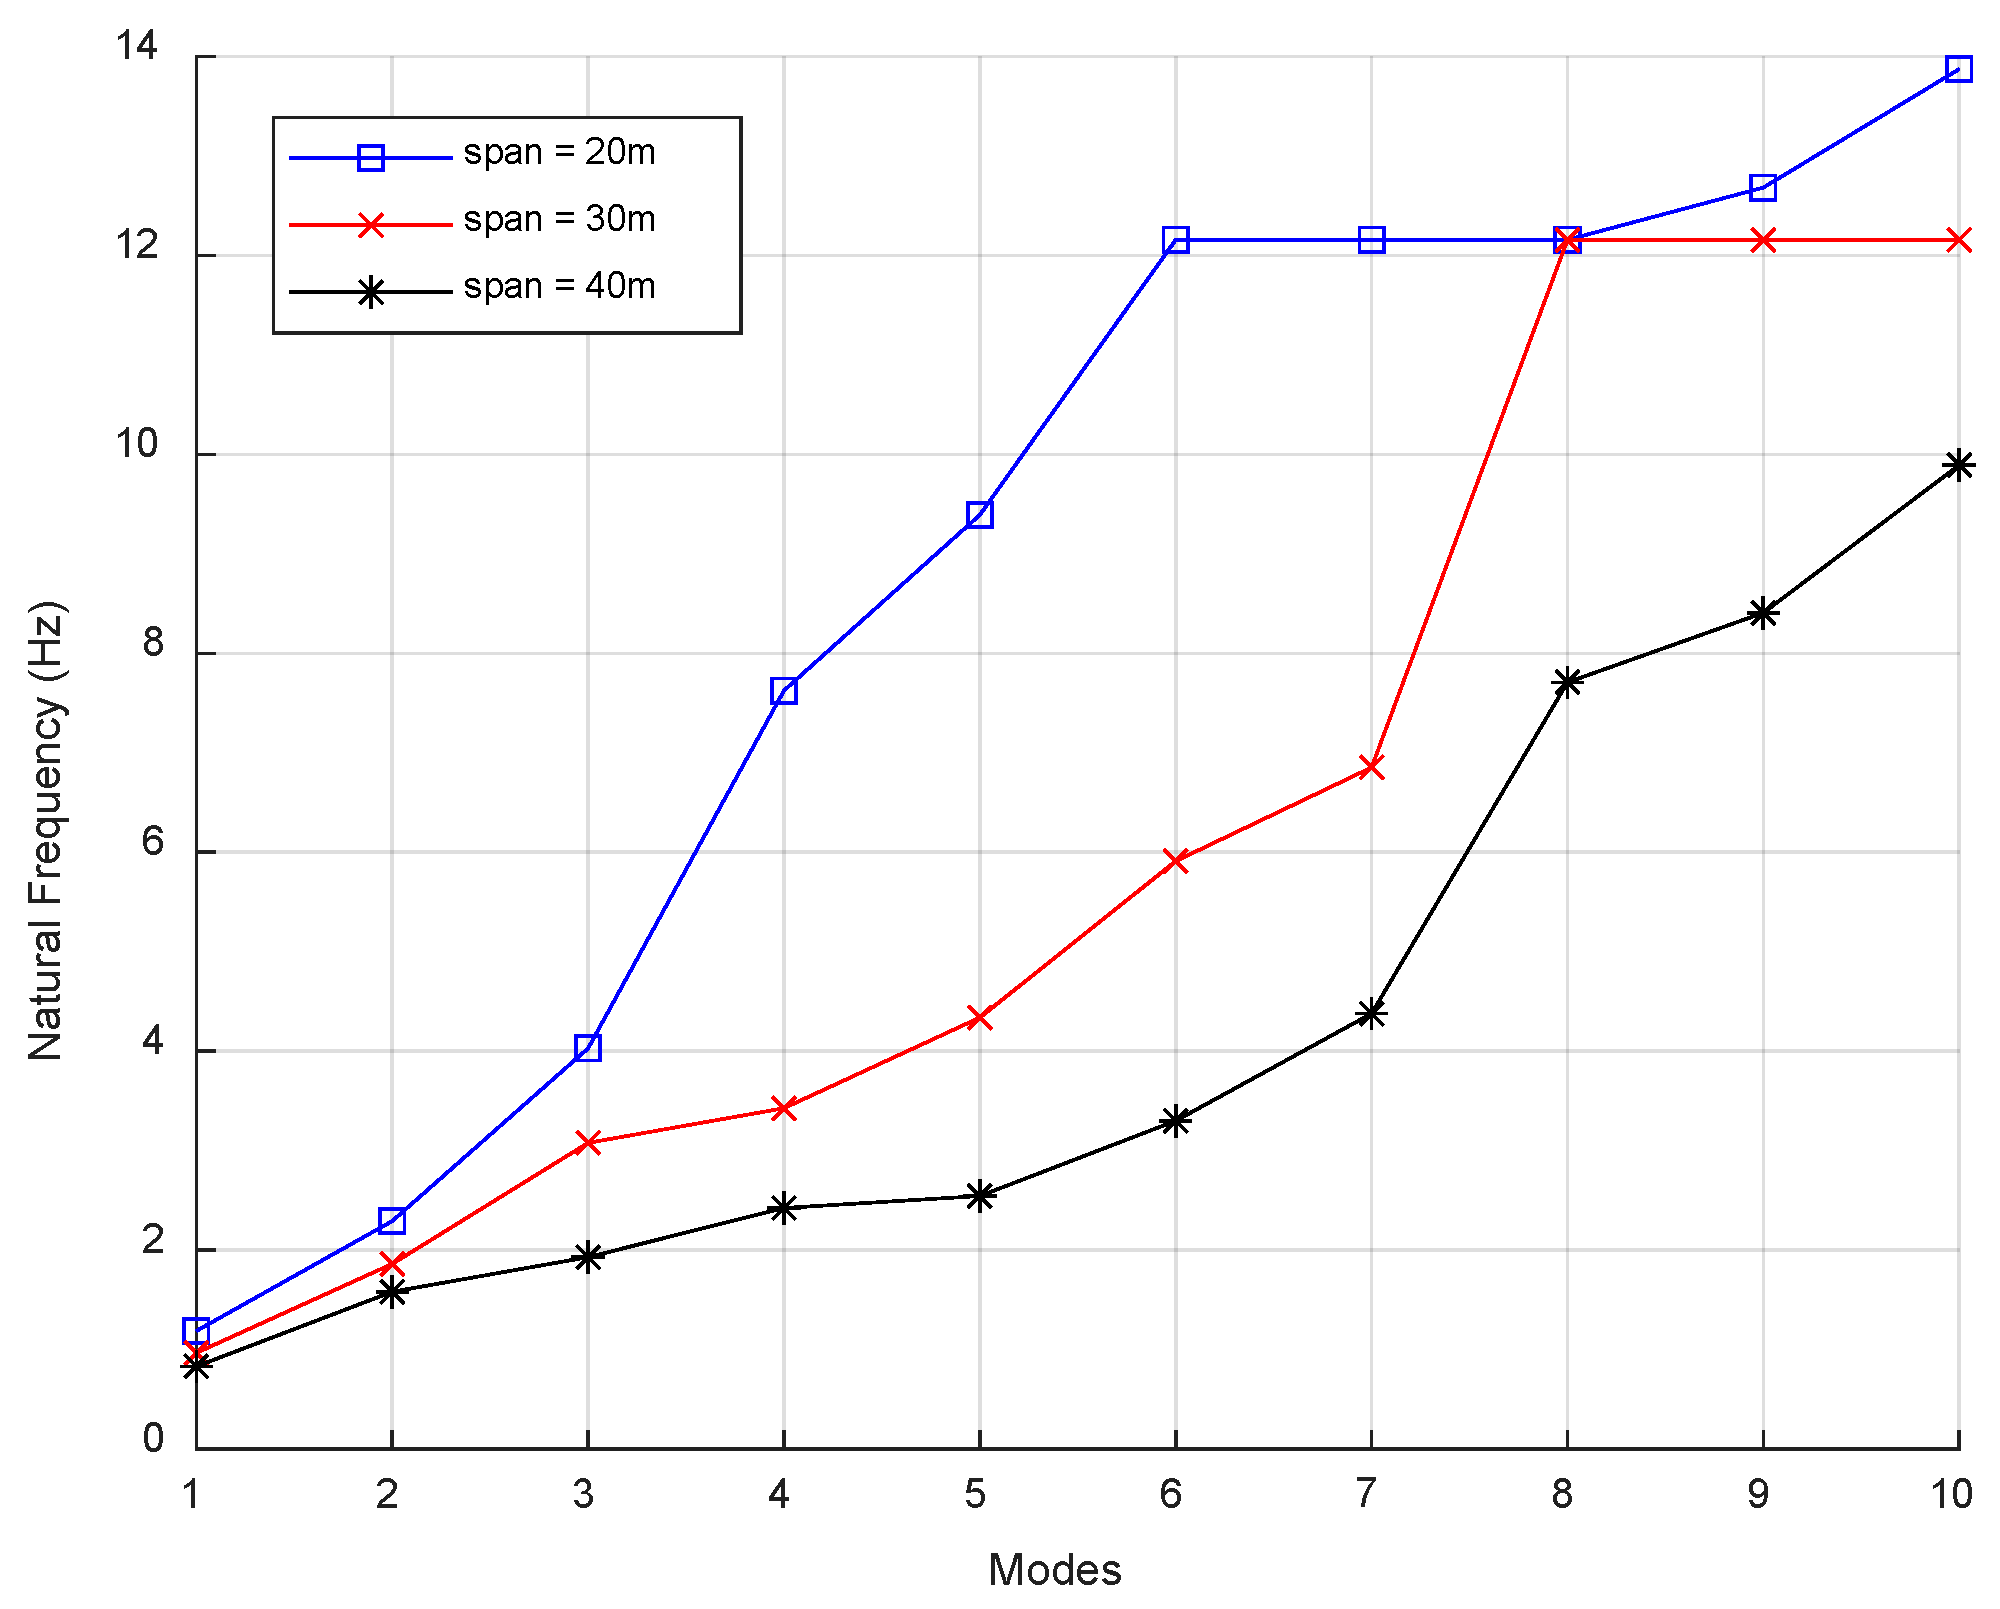
We also investigated different bridge spans’ effects on curved dynamic performance. The bridge column cross-section is shown in Figure 2. The bridge girder cross-section is shown in Figure 3. The connections between the bridge columns and the ground were fixed. Bridge spans were selected with three different values: 20 m, 30 m, and 40 m. The natural frequencies (first 10 modes) of the curved bridge model are shown in Figure 5. The first ten modes are summarized in Table 3.
From the natural frequency results of the first 10 modes’ natural frequencies:
- Bridge span length had some effects on the natural frequency, but there were no strong impacts on the lower natural frequency.
- It showed some coupling effects for higher modes.
- With the column height increasing, the higher-mode-shape natural frequencies changed rapidly.
From the shape analysis of the first 10 modes:
- The first two modes were motions along the horizontal or longitudinal directions.
- The first three mode shapes were not affected by span length differences.
2.3. Different Radius Curvature Effects
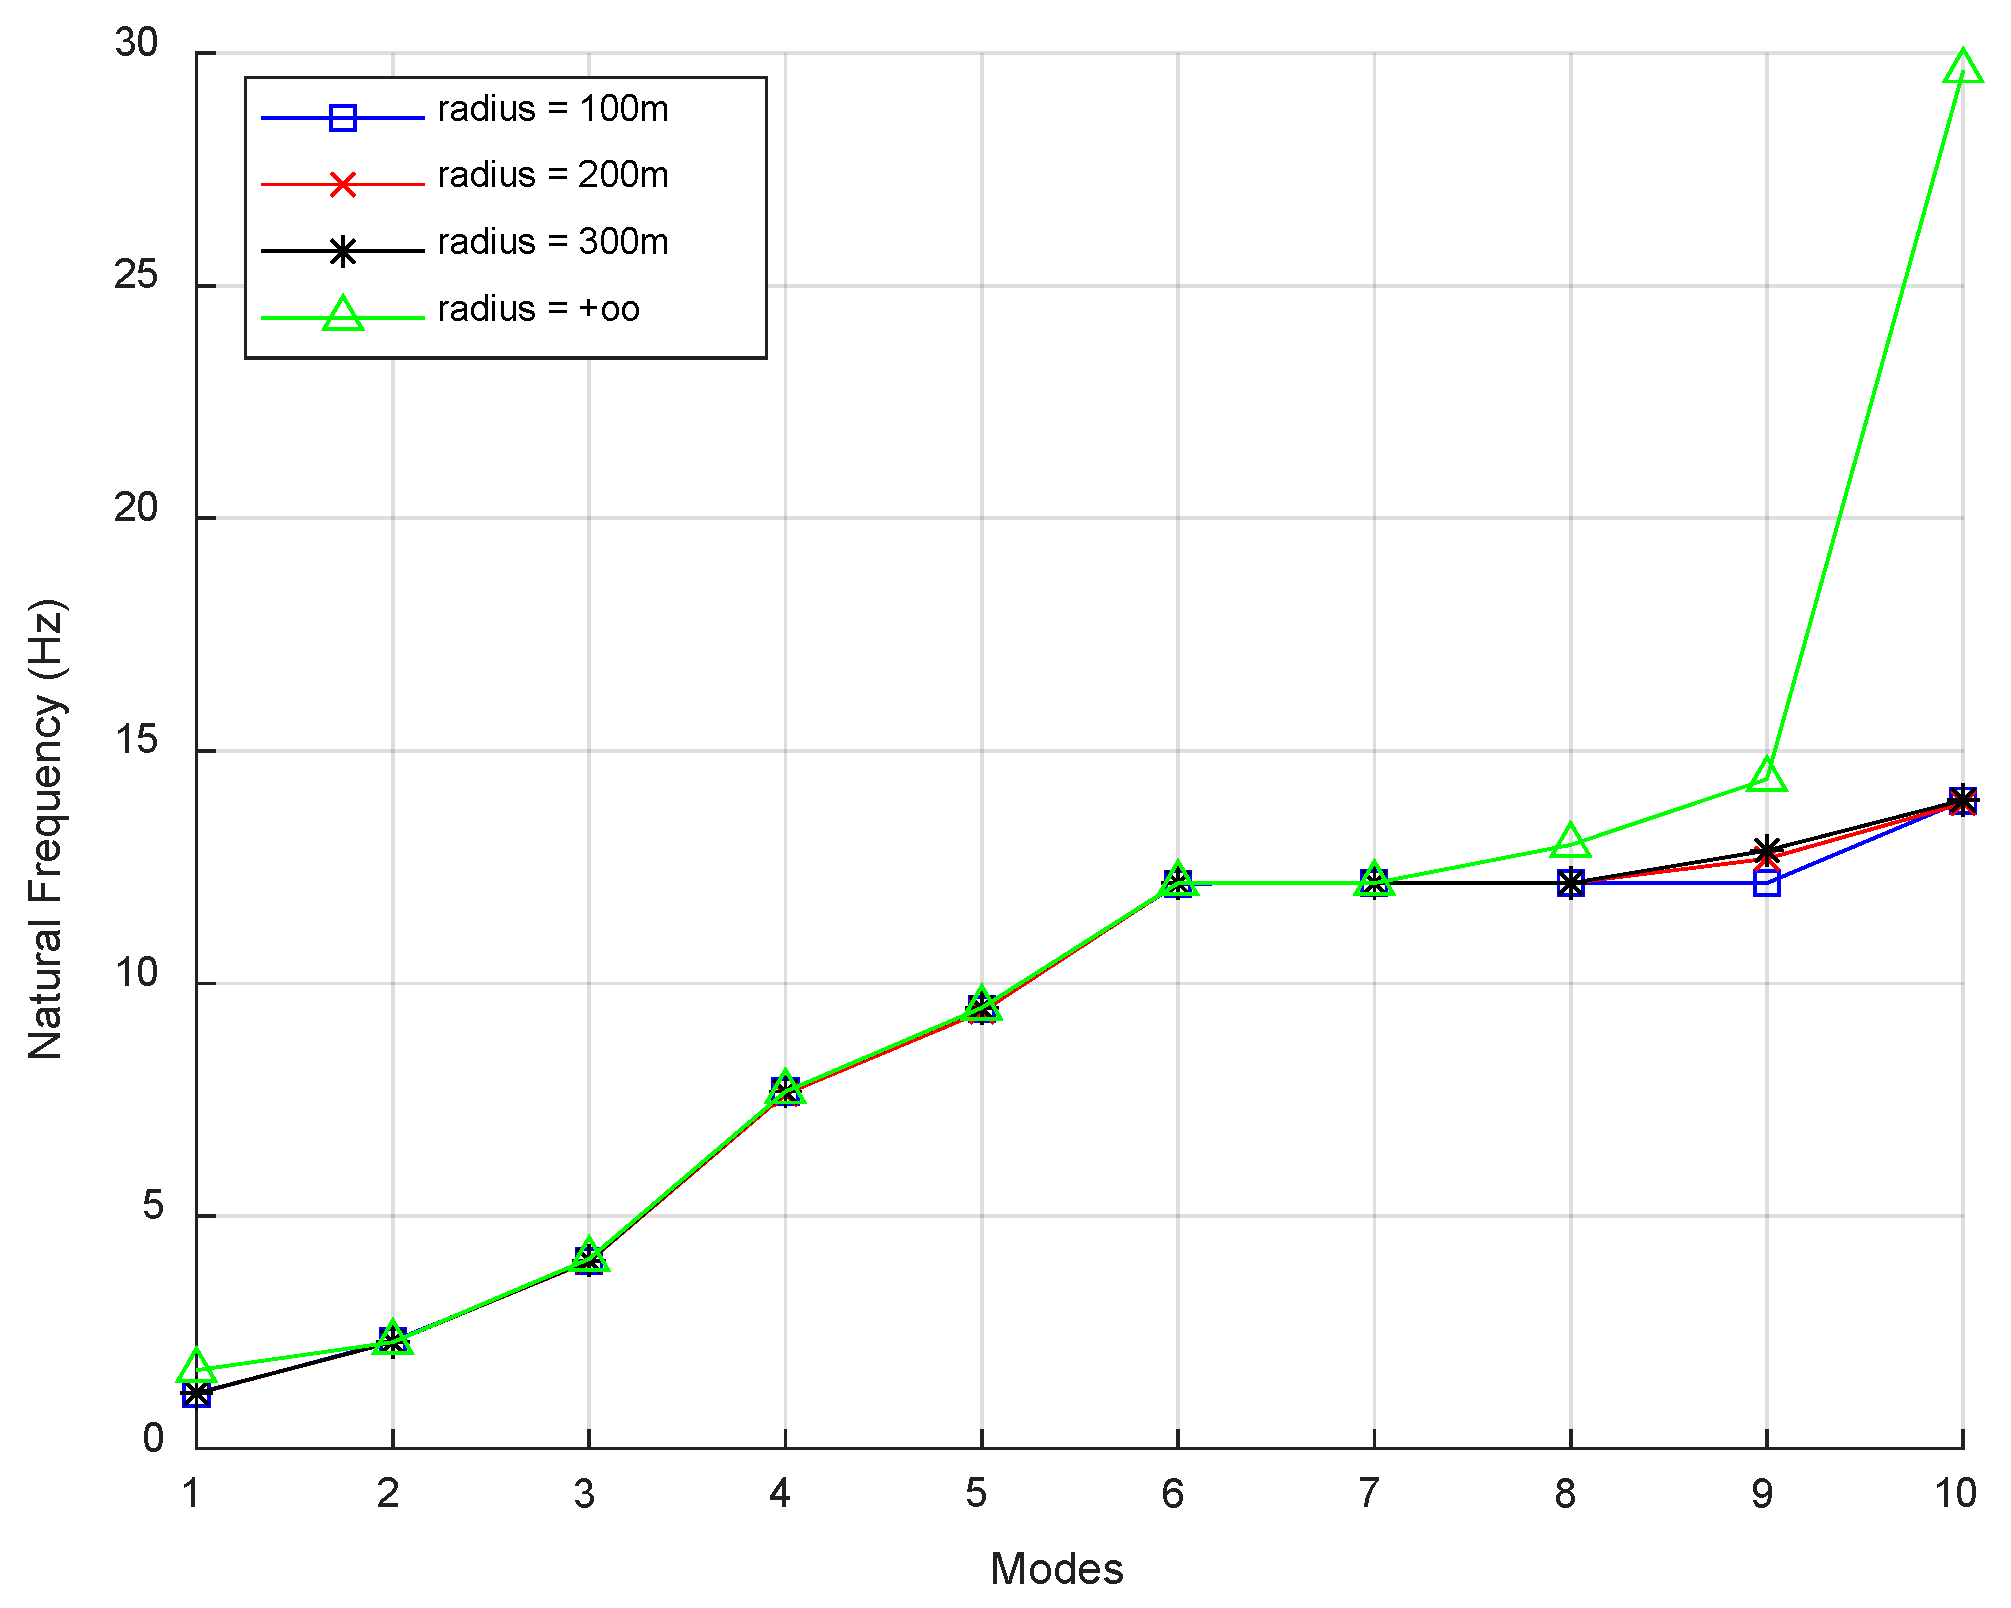
We also investigated different radius curvature effects on the curved dynamic performance. The bridge column cross-section is shown in Figure 2. The bridge girder cross-section is shown in Figure 3. The connections between the bridge columns and the ground were fixed. The radius curvature of the bridge was selected with four different values: 100 m, 200 m, 300 m, and infinity. The natural frequencies (first 10 modes) of the curved bridge model are shown in Figure 6. The first ten modes are summarized in Table 4.
From the natural frequency results of the first 10 modes:
- The radius curvature had minimal effects on the natural frequency.
- It showed some coupling effects for higher modes.
From the analysis of the first 10 mode shapes:
- The first two modes were motions along the horizontal or longitudinal directions.
- The radius curvature had minimal impacts on the modal shape. The first five modal shapes were not affected by radius curvature changes.
- When the radius curvature reached infinity, modal shapes higher than six modes varied dramatically. This might be due to the radius changes in our models not changing gradually.
2.4. Various Support Arrangements Effects
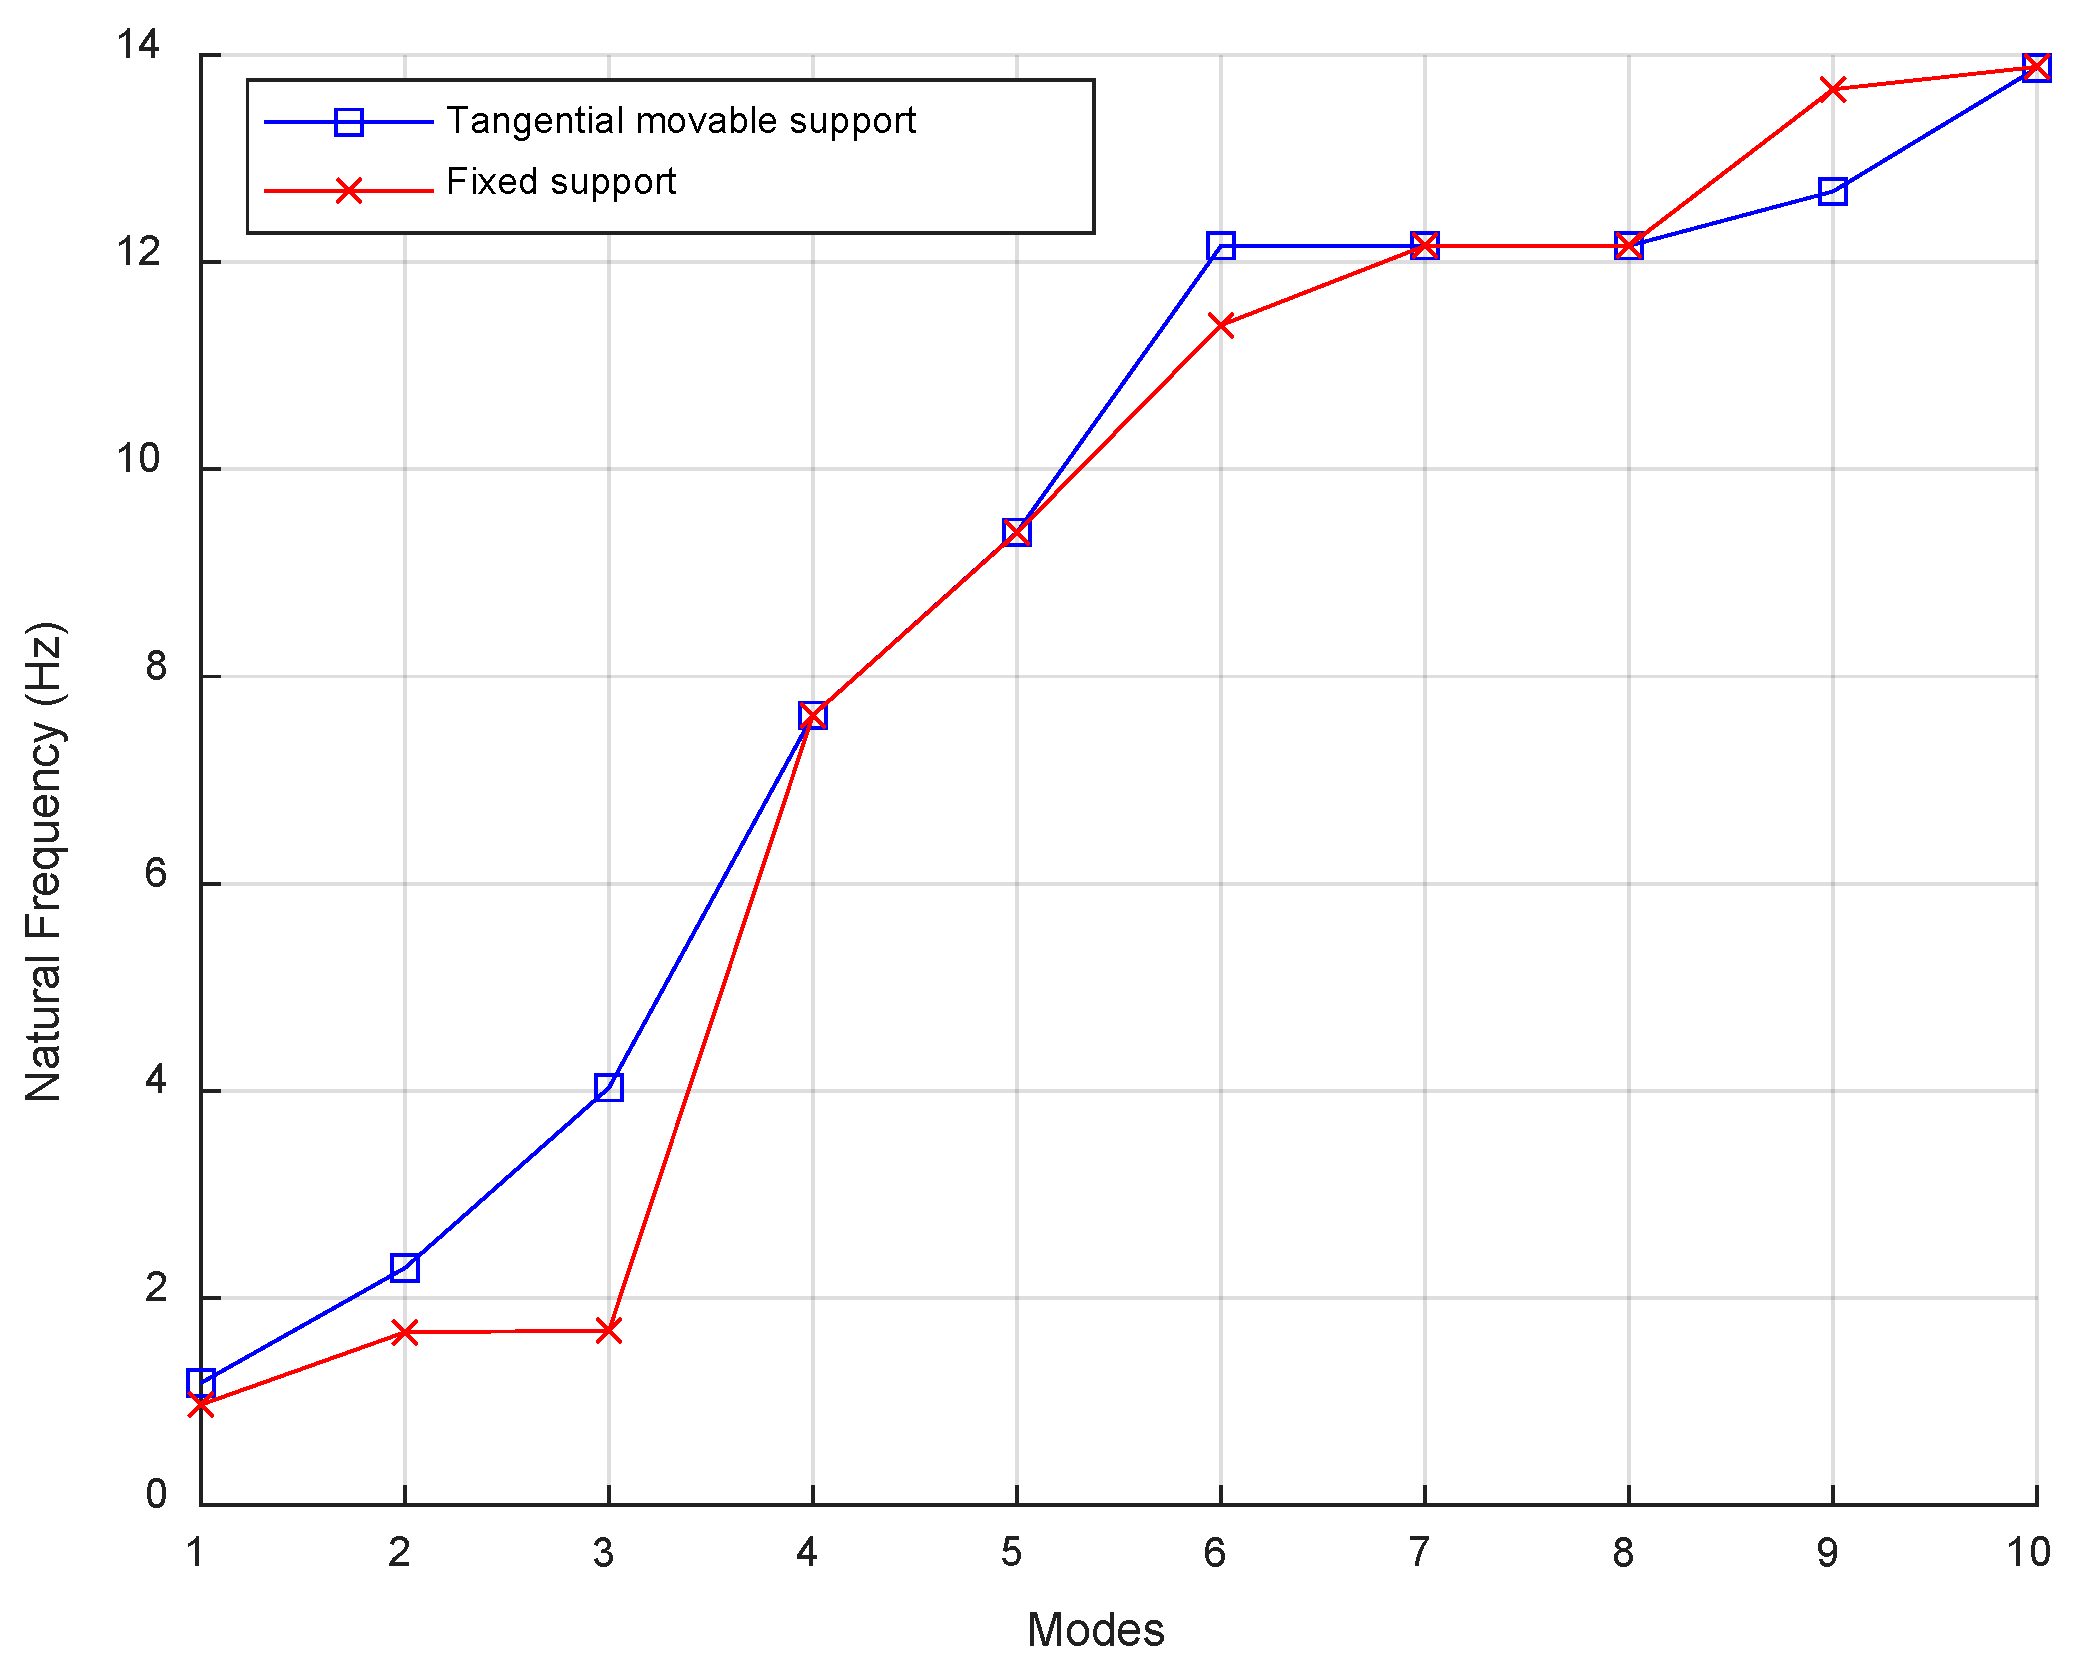
The finite element model of the curved bridge adopted the bridge girder cross-section of Figure 3 and the bridge column cross-section of Figure 2, and the connection between the bridge columns and the ground was fixed. Two different types of supports (all directions were fixed, and the tangential direction was movable) at columns 2 or 3 were selected to investigate the support arrangements’ impacts on the bridge dynamic performance.
We also investigated different bridge support arrangement effects on the curved dynamic performance. The bridge column cross-section is shown in Figure 2. The bridge girder cross-section is shown in Figure 3. The natural frequencies (first 10 modes) of the curved bridge model are shown in Figure 7. The first ten modes are summarized in Table 5.
From the natural frequency results of the first 10 modes:
- Different supports had some effects on natural frequency values, especially for the first three modes, but not for higher modes.
- It showed some coupling effects for higher modes.
From the analysis of the first 10 mode shapes:
- Mode shapes were mostly symmetrical and anti-symmetrical.
- Support arrangements had impacts on both lower and higher modes.
- When fixed supports were adopted at columns 2 and 3, the mode shape natural frequencies of columns 1 and 4 were reduced and occupied a higher percentage.
3. Curved Bridge Time History Analysis under Seismic Input
The text continues here.
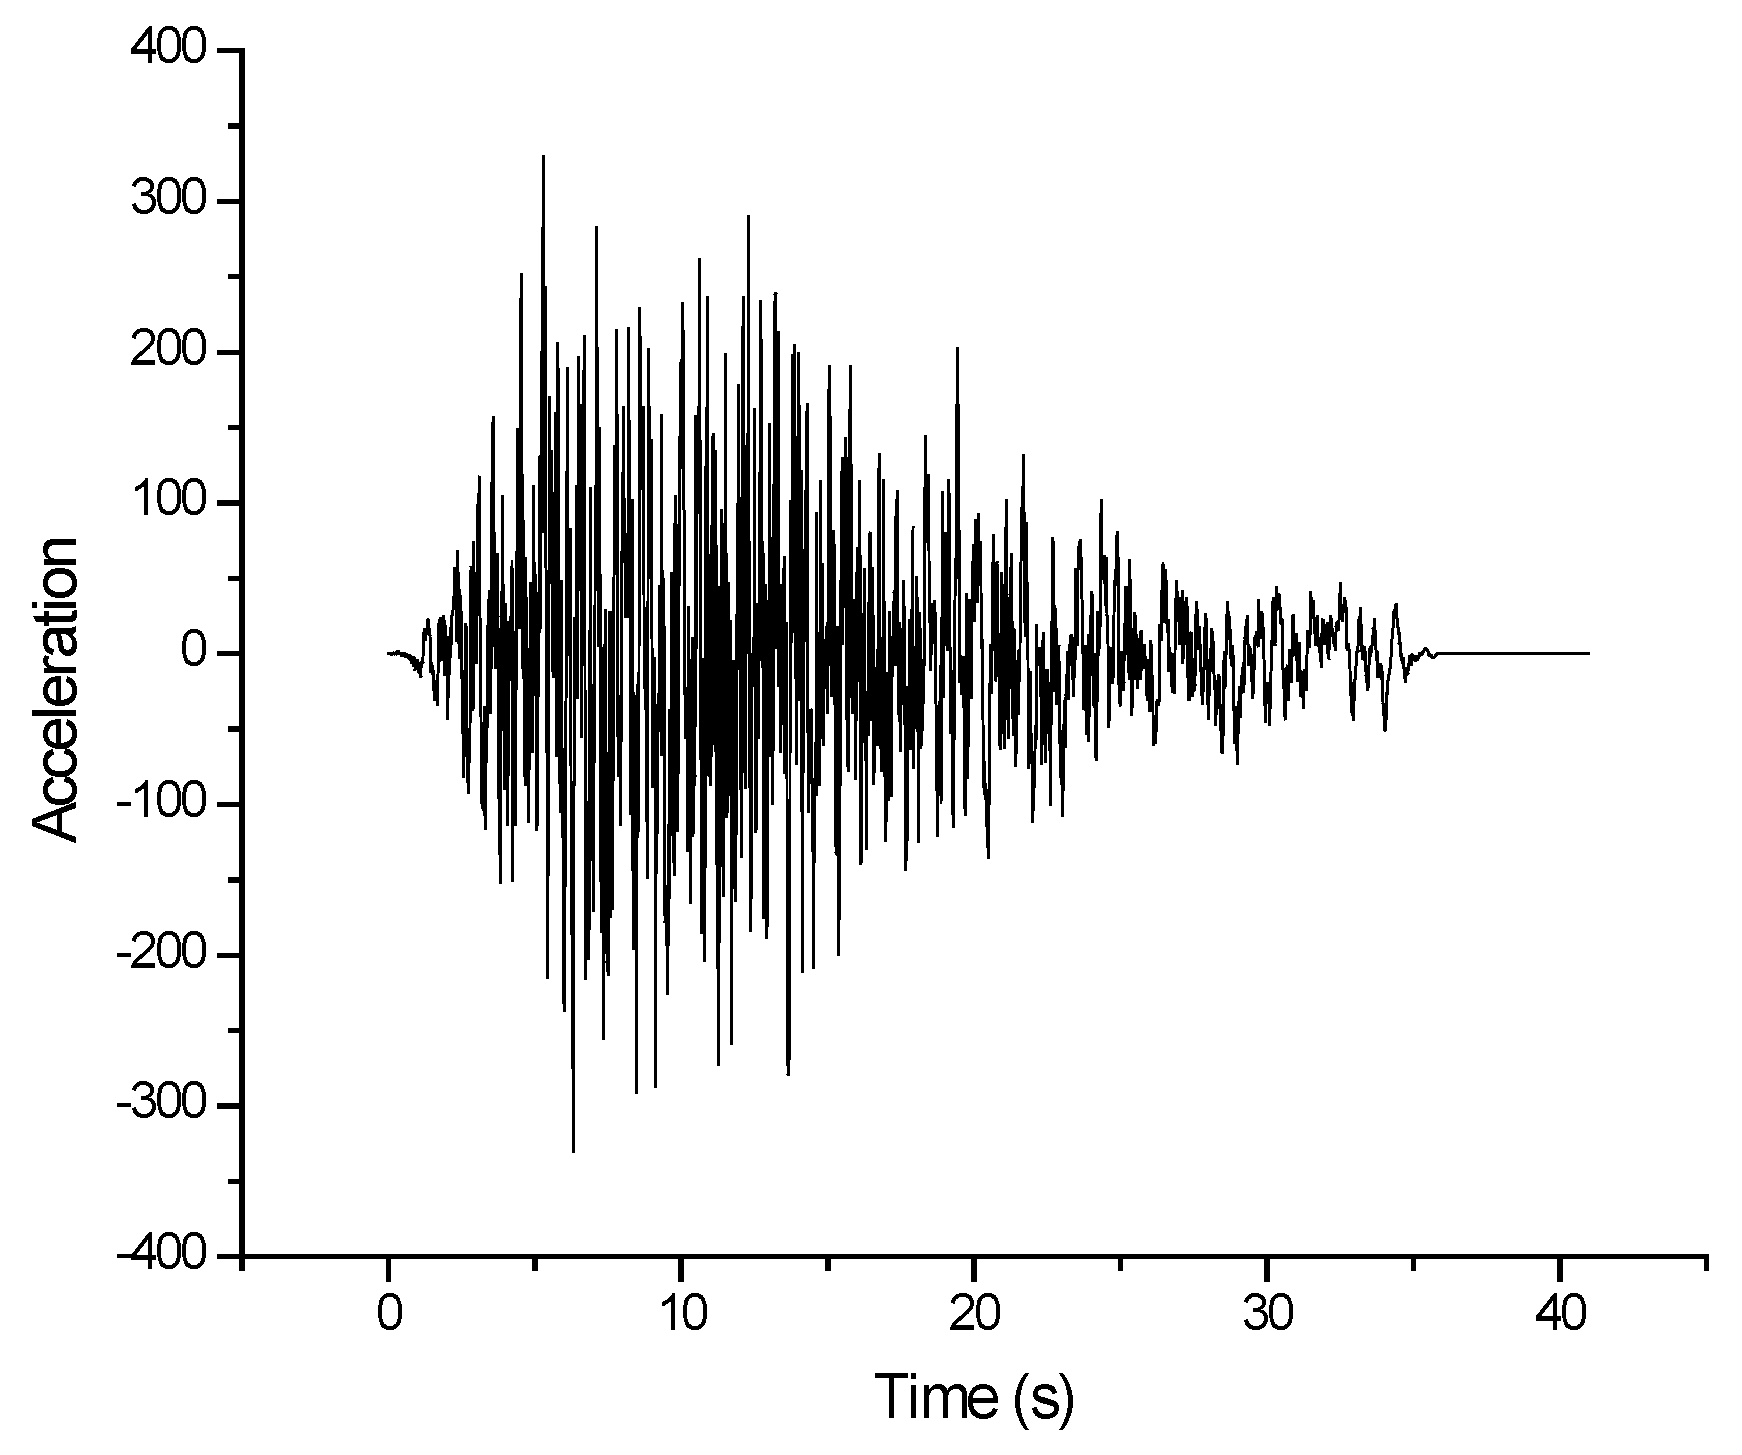
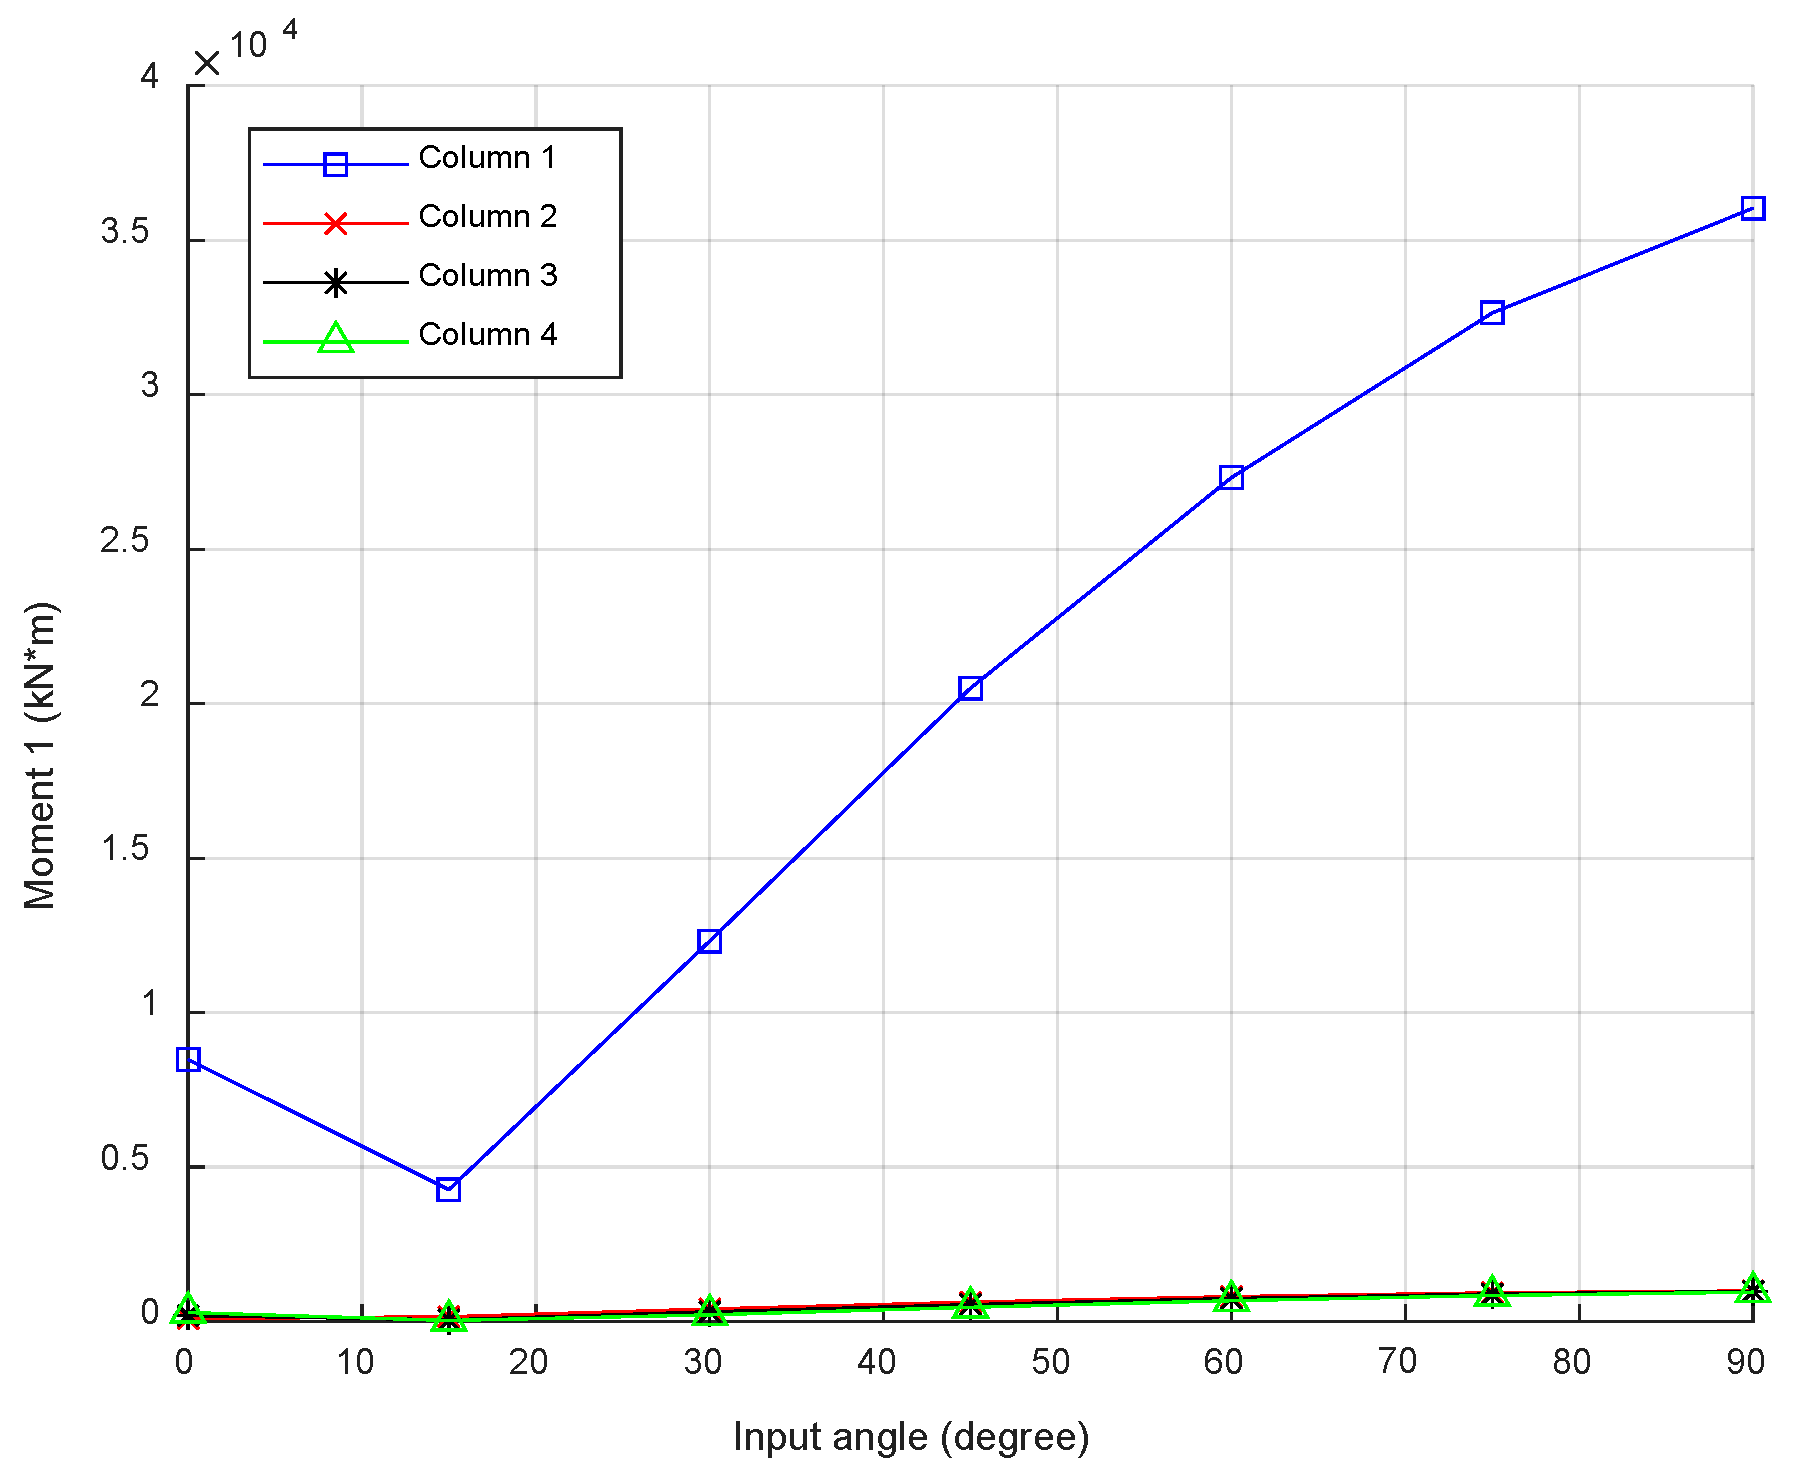
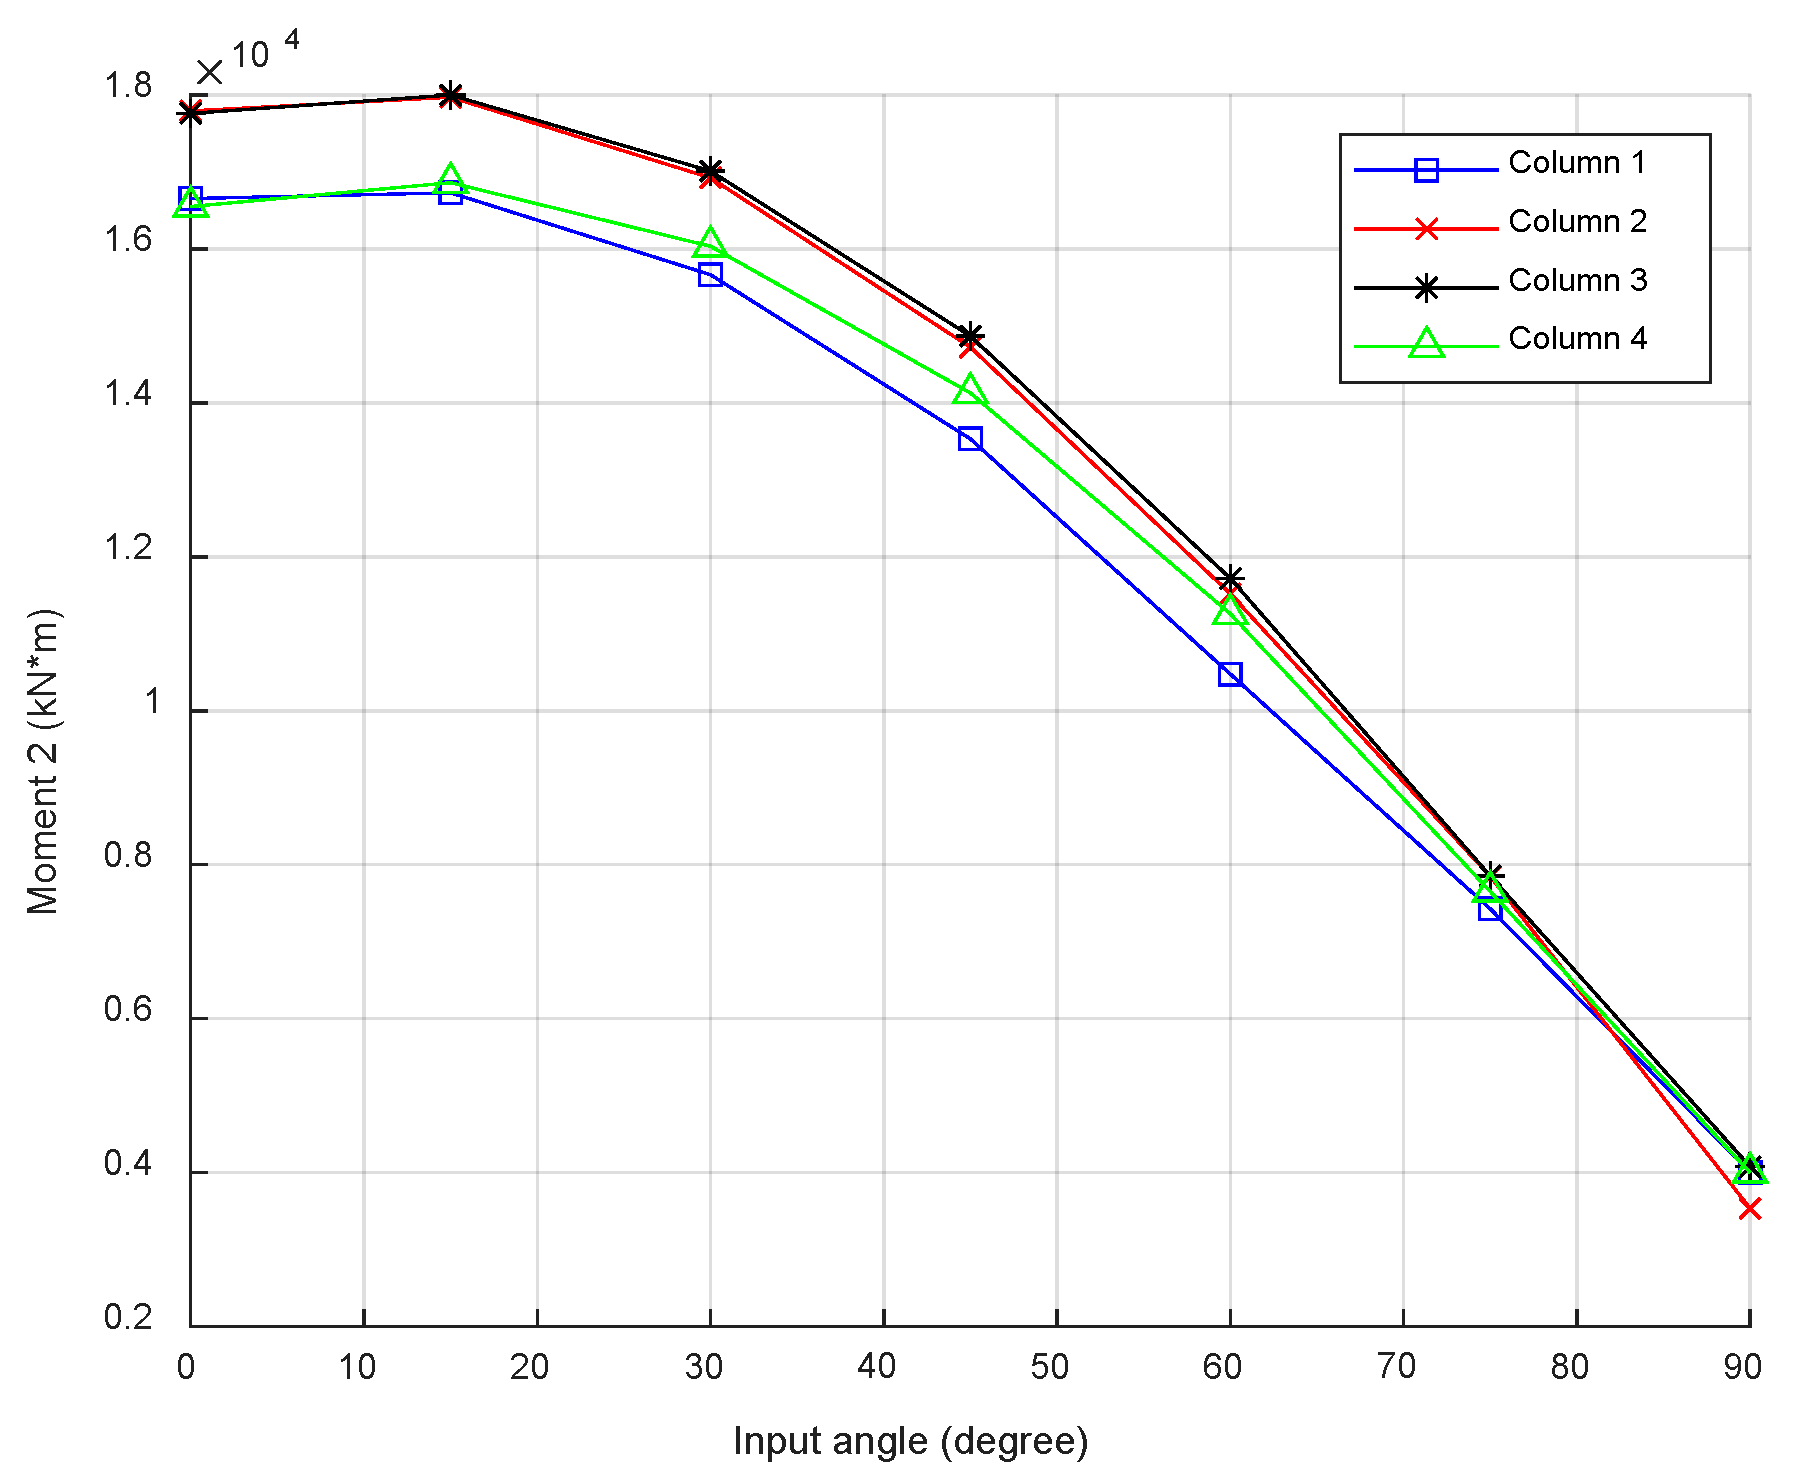
In addition to the dynamical responses of the curved bridge, we also conducted a time history analysis using the same finite element model of the curved bridge under multiple directions of seismic inputs. Time history analysis has the advantage of calculating structural responses while considering structural complexities, soil and foundation interactions, multiple simultaneous earthquake inputs, and geometrical and physical nonlinearity, such as the hysteresis behaviors of materials. The curved bridge was a complex 3D irregular-shaped model. When performing time history analysis, we needed to identify the most vulnerable direction of seismic input. In this paper, we selected a segment of a C-shaped curved bridge from a practical design and analyzed the internal forces of each column under different directions of seismic inputs. The radius curvature of the bridge was 200 m, the bridge span was 20 m, and other dimensions of the curved bridge were the same as in Figure 2 and Figure 3. Finite element analysis was conducted using SAP2000 software. We followed CalTrans standards for the curved bridge design, adopting a line connecting both ends, with the cross-section center as the longitudinal direction and the direction perpendicular to the longitudinal direction as the lateral direction when conducting spectrum analysis. To investigate the structural responses, two perpendicular-direction inputs should be simulated at the same time. To identify the most vulnerable direction of the inputs, different directions of seismic inputs, in addition to the longitudinal and lateral directions of the curved bridge, should be considered and rotated from 0 to 90° from the longitudinal direction. In our paper, to improve the calculation accuracy, we rotated the seismic inputs with a 15° interval and used a single seismic input to identify the worst case. One representative random seismic input, including both compressional and shear waves, is shown in Figure 8. We calculated the responses of all the bridge columns to identify the most vulnerable direction of the seismic inputs and the maximum dynamic responses. The internal forces of the time history analysis results of individual columns are shown in Figure 9, Figure 10 and Figure 11.
4. Identifying the Most Vulnerable Seismic Input Direction Method
Based on the CQC3 method, we came up with a new method of identifying the most vulnerable seismic inputs. In the CQC3 method, the modal and spatial combination are performed simultaneously. The issue with the original CQC3 method is that for curved bridges, the maximum response for longitudinal and lateral directions may not be achieved at the same time. The modal shape for both directions to achieve maximum responses may not occur at the same time. Using the original CQC3 method calculations is more conservative for achieving the maximum responses, and there may exist some errors in identifying the most vulnerable direction.
If time history analysis is applied with small time steps (0.005 s), and time history analysis for two perpendicular-direction combinations is conducted, the same process for the entire time history is repeated. We can achieve the maximum responses for the time history record and avoid the maximum responses not being achieved synchronously at both directions, improving the accuracy of the calculation. Any earthquake inputs can be decomposed into two perpendicular directions. Assuming this earthquake has an angle α from the bridge direction, instead of using a single earthquake input, we decomposed the original earthquake into two perpendicular seismic inputs (along and perpendicular to the bridge direction) by multiplying the magnitude of the original earthquake with cos α and sin α. Then, we excited the bridge both along and perpendicular to the bridge directions with the decomposed seismic input, simultaneously.
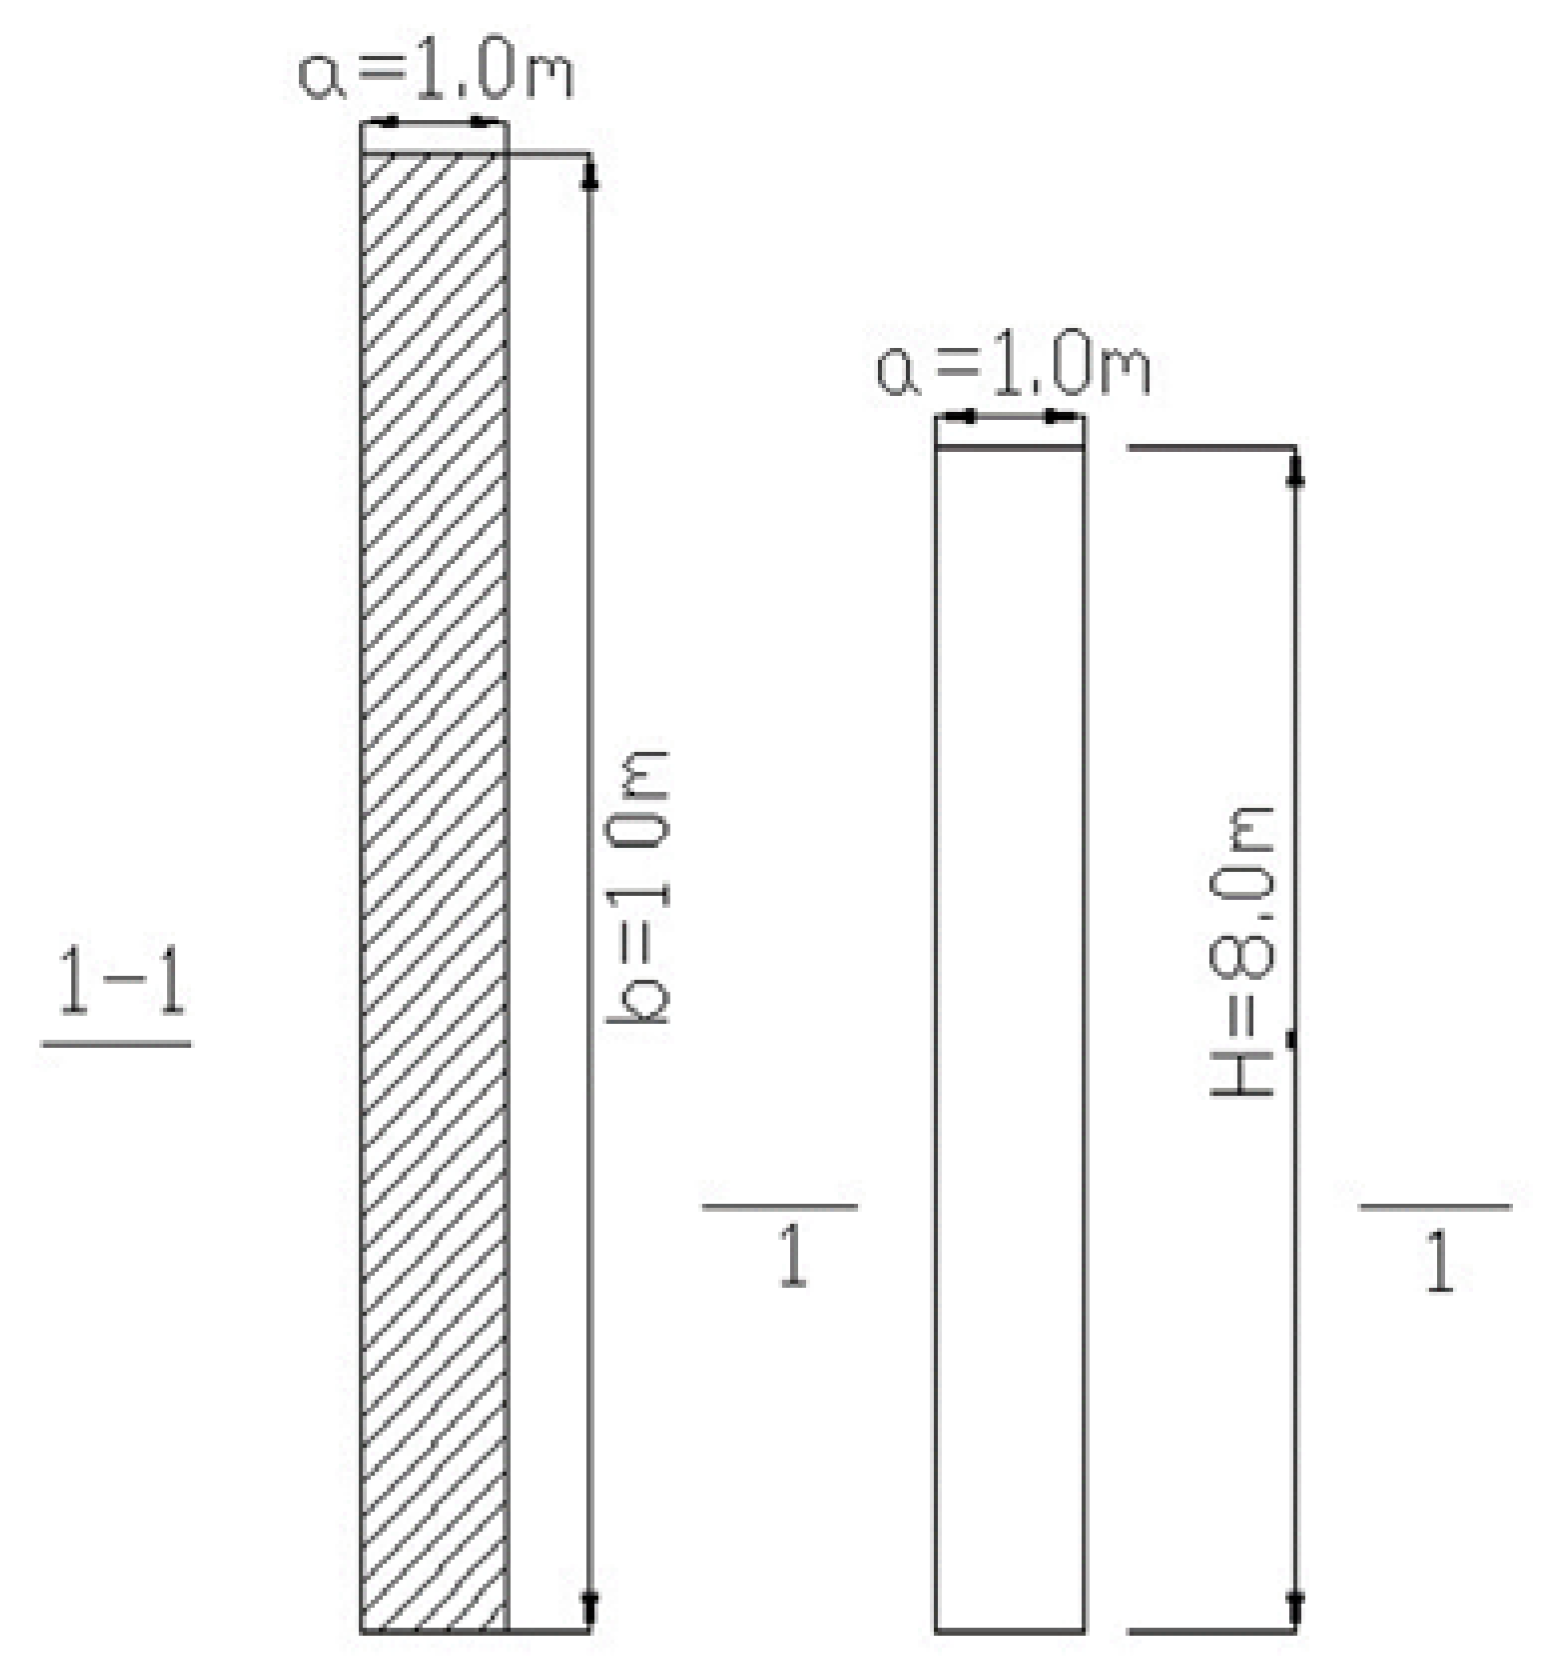
To demonstrate our method, a curved bridge segment with rectangular columns was used to conduct finite element analysis and to identify the most vulnerable seismic input by evaluating the maximum stress of the square columns. The square cross-section is shown in Figure 12. The geometry calculations of the cross section were A = 10.0 m2, Iy = 0.8333 m4, Ix = 83.3 m4, and Id = 31.123 m4.
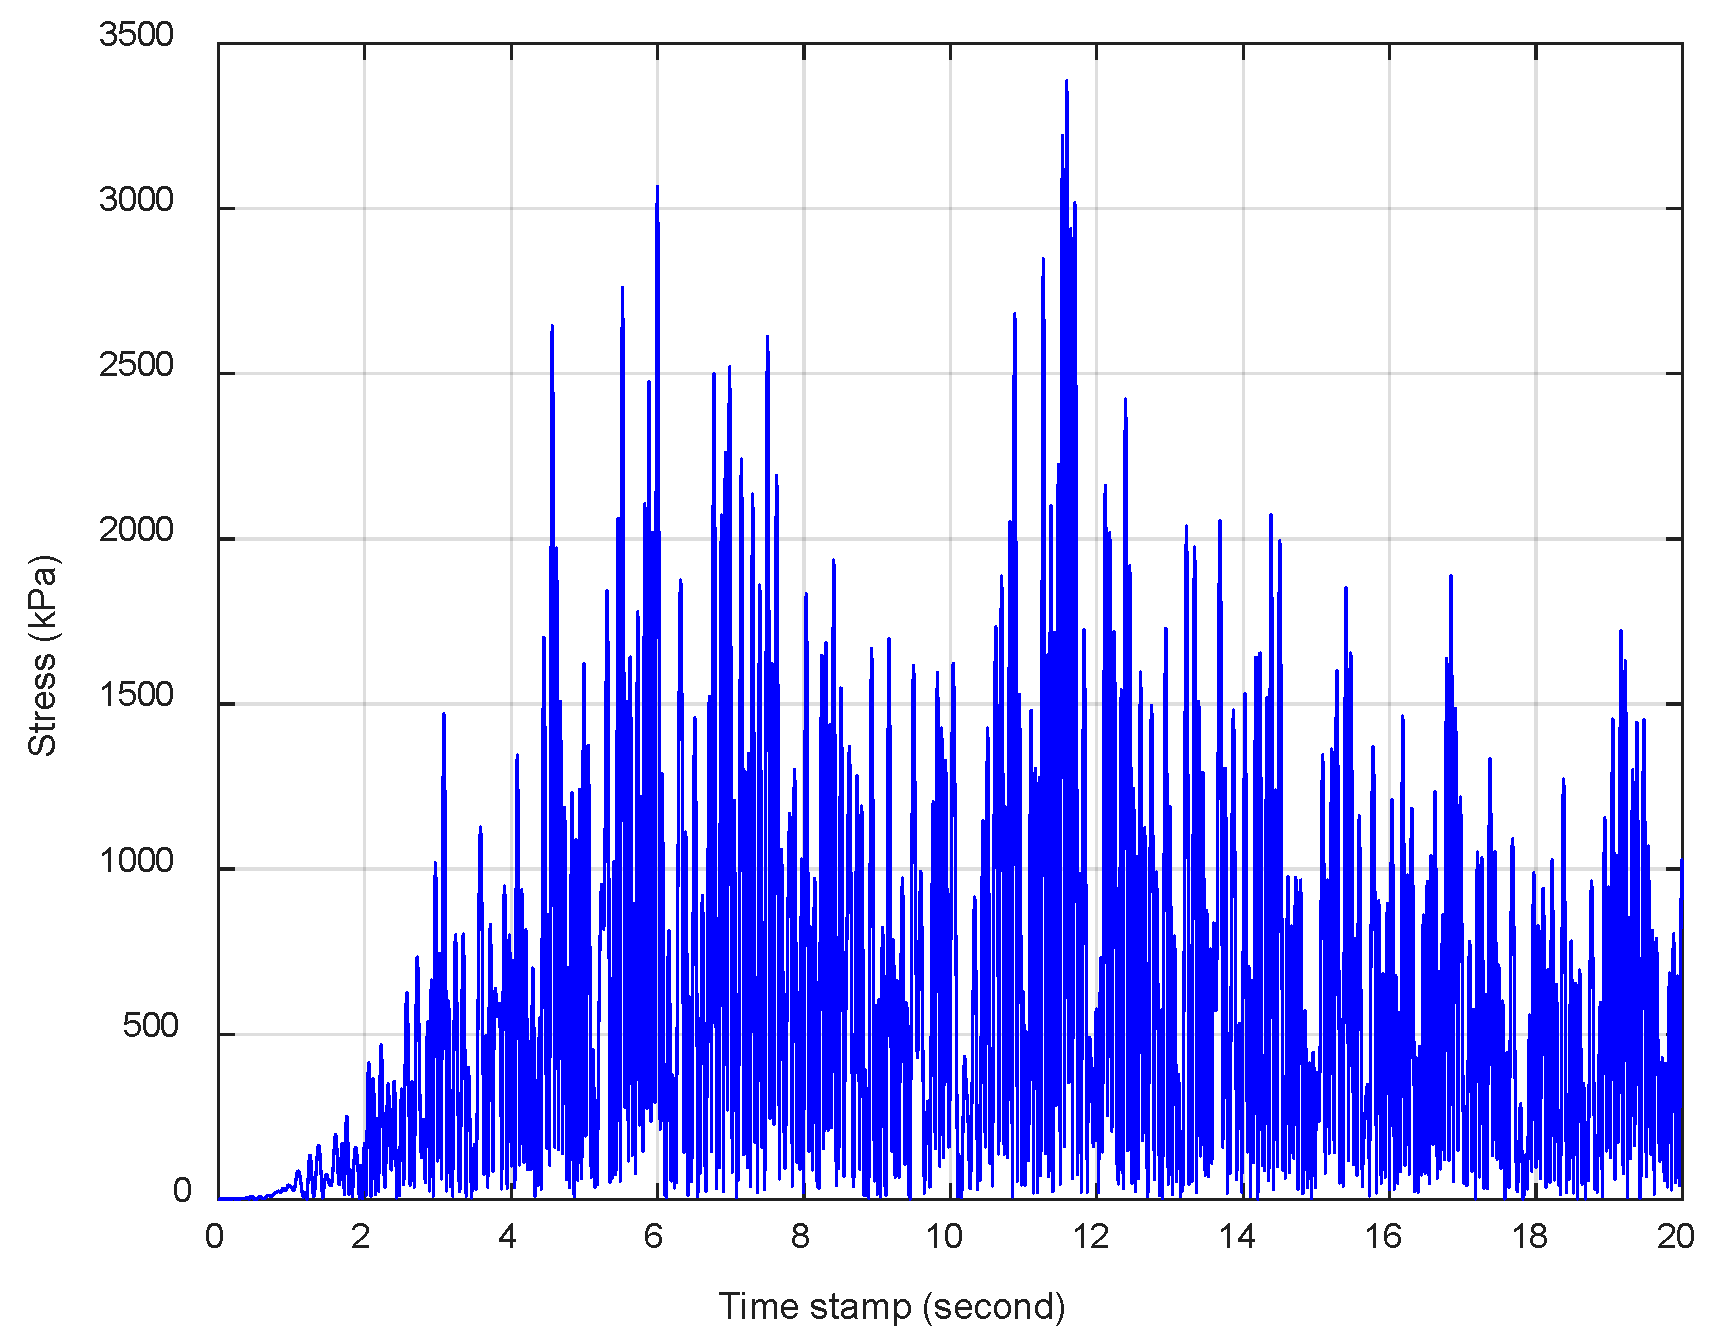
Seismic inputs were applied along two perpendicular directions. The seismic input was the same as in the time history analysis section. Assuming the seismic input was along the longitudinal direction (X direction, namely 0°) with no input from the lateral direction (Y direction, 90°), we obtained the column internal forces, including normal force N, and moments in both directions, Mx and My, at every time stamp. Then, we calculated the stress combination by considering both moments and normal forces using Equation (1). The maximum stress should happen at one of the four corners of the column. We compared the stresses at the four points and used the maximum stresses at that point as the maximum stress for that time stamp. Other time stamps repeated the same process, allowing us to achieve the maximum stress at any moment for the seismic input along 0°. The stress of the column at 0° input is shown in Figure 13.
When comparing the maximum stress at every time stamp, the maximum stress of this input was 3388.9 kPa. Then, when we rotated the seismic input angle at 15° intervals from 0 to 90°, we calculated the maximum time history and maximum dynamic responses for each angle. The results are shown in Figure 14.
If we compare the maximum stress of the stress time history results for each seismic input, we can achieve the maximum stress with different seismic input angles. The results are shown in Figure 15.
As Figure 15 shows for this curved bridge, the most vulnerable direction was along the longitudinal direction (0°). Based on the modal shape analysis of the square-shaped column, the first modal shape was along the longitudinal direction. Thus, we applied the first modal shape direction as the most vulnerable seismic input direction, which would reduce the computational cost, compared to calculating the maximum responses of each seismic input angle.
The steps of our proposed method of calculating the most vulnerable direction of the seismic input and maximum structural responses of curved bridges are summarized below:
- Based on the modal analysis results, the first major modal shape direction was used as the most vulnerable direction of seismic input.
- The structure coordinate system and the angle between the most vulnerable direction and the structure coordinate system were configured and found. For the curved bridge, the structure coordinate system was configured using the longitudinal and lateral directions of the bridge. The magnitude of the original seismic inputs with cos α and sin α were multiplied, and the structure with these two perpendicular components were excited.
- The structural response at every time stamp was achieved, and the responses from the two perpendicular directions were combined. The maximum stress response at that time stamp was calculated.
- We repeated step 3 for every time step and achieved the maximum structural response at every time stamp.
- We found the maximum structural response for the entire time history.
5. Discussion
To validate our approached method performance, we adopted the same finite element model of the curved bridge from Figure 2 and Figure 3 to find the most vulnerable direction of seismic inputs. The only difference was that 2 m × 2 m square-shaped columns were used instead of circular columns, which made it easier to calculate the maximum column stress. Following our method, we first conducted the modal shape analysis of the curved bridge model. From the modal shape analysis, the first mode was the longitudinal direction of the curved bridge. We configured the longitude direction of the curved bridge as the 0° seismic input. Then, the most vulnerable direction of the curved bridge should be 0°. To validate our methods, we created seismic inputs with different angles from 0 to 90° with 30° intervals to reduce our computational cost.
From the first modal shape analysis of the curved bridge, the major motion of the curved bridge was the column 1 motion, which supported displacement and beam motion, since the beam’s longitudinal motion and support displacement could be reduced with some structural design approaches. Thus, we only compared the column 1 base stress calculation. The time history stress response of column 1 at different input angles is shown in Figure 16.
From the time history responses of column 1 stress at each angle, the maximum stress of the entire time history was recorded for each angle. The results of the maximum results at each angle are shown in Figure 17.
As Figure 17 shows that for column 1, the most vulnerable direction of the seismic input was at 0 degrees, which was the same as the direction in our proposed approach. To compare our method’s accuracy and efficiency, we also applied the commonly used CQC3 method, calculating the maximum stress of column 1 from the same finite element model. The difference in the stress calculations between these methods was less than 1.5%, which is negligible, considering the nonlinearity factors of the model. In addition, since our proposed method could identify the most vulnerable seismic input angle direction without a trial-and-error approach using the CQC3 method, our method reduced the computational cost by more than 90%. Our method demonstrated very promising performance for future curved bridge designs.
6. Conclusions
Due to the complicated dynamic characteristics and moment–torsion coupling effects of curved bridges, more research needs to be conducted on curved bridge seismic analysis. In this paper, we conducted curved bridge dynamic analysis under seismic inputs using SAP2000 and investigated the patterns of the performance based on different structural parameters. We analyzed different parameters, including bridge column height, span length, radius curvature, support arrangement, and their effects on bridge dynamic responses. We adopted spectrum analysis and time history analysis, investigating a three-span curved bridge dynamic response and identifying the most vulnerable direction of the seismic inputs. Building on the CQC3 combination method, we came up with a framework of time history analysis of curved bridges and identified the most vulnerable direction of seismic input. Based on our work in this paper, we found that the first mode natural frequency of curved bridges was often less than 2 Hz, and higher modal shapes demonstrated some coupling effects. Column height and bridge span had more impacts on the natural frequencies of curved bridges, especially for lower modes. With the column height and bridge span increasing, higher-mode natural frequencies were reduced. Span variation did not cause too many changes in the first three modes. Radius curvature did not affect the natural frequencies too much, nor did the first five modes. If the radius curvature became a large number (e.g., infinite), natural frequencies and mode shapes changed dramatically. The middle column, when adopting the fixed connection of the support, did not affect the lower modes or the higher modes. When performing time history analysis, there existed the most vulnerable direction of the seismic inputs. The framework developed by this paper reduces the computational cost, compared with the traditional methods, and is more accurate than traditional methods. The results from this paper will raise the awareness of bridge designers when designing and constructing curved bridges. More focus will be spent on identifying the critical seismic input and further improve the bridge resilience. This paper is more focused on uniform column height. Research on different column heights of curved bridge impacts under seismic inputs is under investigation. In future works, more accurate nonlinear time history analyses need to be performed by taking into account the real hysteretic behavior of the adopted materials, and the influence of seismic isolation devices [27] on the curved bridge response needs to be investigated by using a probabilistic approach [28]. We will conduct more comprehensive performance comparisons between our method and other researchers’ methods.
Author Contributions
Conceptualization, S.G. and C.T.; methodology, S.G. and C.T.; writing—review and editing, S.G. and C.T. All authors have read and agreed to the published version of the manuscript.
Funding
This research received no external funding.
Data Availability Statement
The data is available from the corresponding author upon request.
Conflicts of Interest
The authors declare no conflict of interest.
References
- Jennings, P.C. Enduring Lessons and Opportunities Lost from the San Fernando Earthquake of February 9, 1971. Earthq. Spectra 1997, 13, 25–44. [Google Scholar] [CrossRef]
- Mitchell, D.; Tinawi, R.; Sexsmith, R.G. Performance of bridges in the 1989 Loma Prieta earthquake—Lessons for Canadian designers. Can. J. Civ. Eng. 1991, 18, 711–734. [Google Scholar] [CrossRef]
- Housner, G.W.; Thiel, C.C., Jr. The continuing challenge: Report on the performance of state bridges in the Northridge earthquake. Earthq. Spectra 1995, 11, 607–636. [Google Scholar] [CrossRef]
- Karim, K.R.; Yamazaki, F. Effect of earthquake ground motions on fragility curves of highway bridge piers based on numerical simulation. Earthq. Eng. Struct. Dyn. 2001, 30, 1839–1856. [Google Scholar] [CrossRef]
- McCallen, D.B.; Romstad, K.M. Dynamic Analyses of a Skewed Short-Span, Box-Girder Overpass. Earthq. Spectra 1994, 10, 729–755. [Google Scholar] [CrossRef]
- Seo, J.; Linzell, D.G. Nonlinear Seismic Response and Parametric Examination of Horizontally Curved Steel Bridges Using 3D Computational Models. J. Bridg. Eng. 2013, 18, 220–231. [Google Scholar] [CrossRef]
- Jeon, J.-S.; DesRoches, R.; Kim, T.; Choi, E. Geometric parameters affecting seismic fragilities of curved multi-frame concrete box-girder bridges with integral abutments. Eng. Struct. 2016, 122, 121–143. [Google Scholar] [CrossRef]
- Tseng, W.S.; Penzien, J. Seismic analysis of long multiple-span highway bridges. Earthq. Eng. Struct. Dyn. 1975, 4, 1–24. [Google Scholar] [CrossRef]
- Williams, D.; Godden, W.G. Experimental Model Studies on the Seismic Response of High Curved Overcrossings; (No. EERC-76-18); National Technical Information Service: Springfield, VA, USA, 1976. [Google Scholar]
- Williams, D.; Godden, W. Seismic response of long curved bridge structures: Experimental model studies. Earthq. Eng. Structural. Dyn. 1979, 7, 107–128. [Google Scholar] [CrossRef]
- Buckle, I.G.; Mayes, R.L.; Button, M.R. Seismic Design and Retrofit Manual for Highway Bridges; (No. FHWA-IP-87-6); United States. Federal Highway Administration, Office of Implementation: Washington, DC, USA, 1987. [Google Scholar]
- Abdel-Salam, M.N.; Heins, C.P. Seismic Response of Curved Steel Box Girder Bridges. J. Struct. Eng. 1988, 114, 2790–2800. [Google Scholar] [CrossRef]
- Richardson, J.A.; Douglas, B.M. Results from field testing A curved box girder bridge using simulated earthquake loads. Earthq. Eng. Struct. Dyn. 1993, 22, 905–922. [Google Scholar] [CrossRef]
- Desroches, R.; Fenves, G.L. Evaluation of Recorded Earthquake Response of a Curved Highway Bridge. Earthq. Spectra 1997, 13, 363–386. [Google Scholar] [CrossRef]
- Hirasawa, H.; Koyama, A.; Hayashikawa, T.; Sato, K. Effects of cross beam’s position on mechanical properties of curved two-girder bridge. J. Constr. Steel 1998, 6, 349–356. [Google Scholar]
- Otsuka, H.; Kanda, M.; Suzuki, M.; Yoshizawa, T. Dynamic analysis of sliding behavior of curved bridge super-structure caused by horizontal ground motion. Doboku Gakkai Ronbunshu 1997, 570, 305–314. [Google Scholar] [CrossRef]
- Guo, J.; Zhong, J.; Dang, X.; Yuan, W. Influence of Multidirectional Cable Restrainer on Seismic Fragility of a Curved Bridge. J. Bridg. Eng. 2019, 24, 04019001. [Google Scholar] [CrossRef]
- Feng, R.; Wang, X.; Yuan, W.; Yu, J. Impact of seismic excitation direction on the fragility analysis of horizontally curved concrete bridges. Bull. Earthq. Eng. 2018, 16, 4705–4733. [Google Scholar] [CrossRef]
- Amjadian, M.; Agrawal, A.K. Feasibility study of using a semiactive electromagnetic friction damper for seismic response control of horizontally curved bridges. Struct. Control. Health Monit. 2019, 26, e2333. [Google Scholar] [CrossRef]
- Serdar, N.; Folić, R. Vulnerability and optimal probabilistic seismic demand model for curved and skewed RC bridges. Eng. Struct. 2018, 176, 411–425. [Google Scholar] [CrossRef]
- Ni, Y.; Chen, J.; Teng, H.; Jiang, H. Influence of earthquake input angle on seismic response of curved girder bridge. J. Traffic Transp. Eng. 2015, 2, 233–241. [Google Scholar] [CrossRef]
- Feng, R.; Deng, T.; Lao, T.; Sextos, A.G.; Yuan, W. Theory and experimental verification of a resultant response-based method for assessing the critical seismic excitation direction of curved bridges. Eng. Struct. 2020, 216, 110713. [Google Scholar] [CrossRef]
- Vaiana, N.; Rosati, L. Classification and unified phenomenological modeling of complex uniaxial rate-independent hysteretic responses. Mech. Syst. Signal Process. 2023, 182, 109539. [Google Scholar] [CrossRef]
- Vaiana, N.; Sessa, S.; Rosati, L. A generalized class of uniaxial rate-independent models for simulating asymmetric mechanical hysteresis phenomena. Mech. Syst. Signal Process. 2020, 146, 106984. [Google Scholar] [CrossRef]
- Vaiana, N.; Losanno, D.; Ravichandran, N. A novel family of multiple springs models suitable for biaxial rate-independent hysteretic behavior. Comput. Struct. 2020, 244, 106403. [Google Scholar] [CrossRef]
- SAP2000 Manual. Available online: https://docs.csiamerica.com/manuals/sap2000/CSiRefer.pdf (accessed on 1 July 2016).
- De Domenico, D.; Losanno, D.; Vaiana, N. Experimental tests and numerical modeling of full-scale unbonded fiber reinforced elastomeric isolators (UFREIs) under bidirectional excitation. Eng. Struct. 2023, 274, 115118. [Google Scholar] [CrossRef]
- Sessa, S.; Marmo, F.; Vaiana, N.; Rosati, L. Probabilistic assessment of axial force–biaxial bending capacity domains of reinforced concrete sections. Meccanica 2019, 54, 1451–1469. [Google Scholar] [CrossRef]
Figure 1.
Plan view of a three-span curved bridge (span = 20 m, radius curvature = 100 m, the distance between two supports = 0.4 m).
Figure 1.
Plan view of a three-span curved bridge (span = 20 m, radius curvature = 100 m, the distance between two supports = 0.4 m).

Figure 2.
Bridge column dimensions.

Figure 3.
Cross-section of the bridge girder.

Figure 4.
Natural frequency variations, with various column heights. (The natural frequencies for mode 7 of column heights of 15 m and 20 m were different).
Figure 4.
Natural frequency variations, with various column heights. (The natural frequencies for mode 7 of column heights of 15 m and 20 m were different).

Figure 5.
Natural frequencies with various bridge span lengths.

Figure 6.
Natural frequencies with various radius curvatures.

Figure 7.
Natural frequencies with different support arrangements.

Figure 8.
Time history seismic input (acceleration unit is in m/s2).

Figure 9.
The normal force of each column under different directions of seismic inputs.

Figure 10.
Moment 1 of each column under different directions of seismic inputs.

Figure 11.
Moment 2 of each column under different directions of seismic inputs.

Figure 12.
Bridge column dimensions.

Figure 13.
Column stress at 0° seismic input.

Figure 14.
Column stress at different angles of seismic inputs: (a) 15°, (b) 30°, (c) 45°, (d) 60°, (e) 75°, (f) 90°.
Figure 14.
Column stress at different angles of seismic inputs: (a) 15°, (b) 30°, (c) 45°, (d) 60°, (e) 75°, (f) 90°.

Figure 15.
Maximum stress at different seismic input angles.

Figure 16.
Column 1 stress at different angles of seismic inputs: (a) 0°, (b) 30°, (c) 60°, (d) 90°.
Figure 16.
Column 1 stress at different angles of seismic inputs: (a) 0°, (b) 30°, (c) 60°, (d) 90°.

Figure 17.
Maximum column 1 stress at different seismic input angles.


Table 1.
Common curved bridge types.
| Type | Cross-Section | Span | Radius Curvature | Bridge Shape | Column Type |
|---|---|---|---|---|---|
| Ramp | Single chamber | 20–30 m | 40–100 m | Circular line and gradual circular line | Single or double columns |
| Major Line | Double chambers | 20–50 m | 50–100 m | Circular line or gradual circular line | Double or triple columns |
Table 2.
First 10 modal shapes with different column heights.
| Column Height (m) | Modal Shape | ||||
| 1 | 2 | 3 | 4 | 5 | |
| 8 | Beam Longitudinal | Beam lateral (symmetrical) | Beam lateral (anti-symmetrical) | Beam Vertical (symmetrical) | Beam Vertical (anti-symmetrical) |
| 15 | Beam Longitudinal | Beam lateral (symmetrical) | Beam lateral (anti-symmetrical) | Column 2 Longitudinal | Column 3 Longitudinal |
| 20 | Beam Longitudinal | Beam lateral (symmetrical) | Beam lateral (anti-symmetrical) | Column 2 Longitudinal | Column 3 Longitudinal |
| Column Height (m) | Modal Shape | ||||
| 6 | 7 | 8 | 9 | 10 | |
| 8 | Column 2 Longitudinal | Column 3 Longitudinal | Column 4 Longitudinal | Beam–column coupling | Beam–column coupling |
| 15 | Column 4 Longitudinal | Vertical (symmetrical) | Vertical(anti-symmetrical) | Beam–column coupling | Beam–column coupling |
| 20 | Column 4 Longitudinal | Vertical (symmetrical) | Beam–column coupling | Beam–column coupling | Column (anti-symmetrical) |
Table 3.
First 10 modal shapes with different span lengths.
| Span (m) | Modal Shape | ||||
| 1 | 2 | 3 | 4 | 5 | |
| 20 | Beam Longitudinal | Beam lateral (symmetrical) | Beam lateral (anti-symmetrical) | Beam Vertical (symmetrical) | Beam Vertical (anti-symmetrical) |
| 30 | Beam Longitudinal | Beam lateral (symmetrical) | Beam lateral (anti-symmetrical) | Beam Vertical (symmetrical) | Beam Vertical (anti-symmetrical) |
| 40 | Beam Longitudinal | Beam lateral (symmetrical) | Beam lateral (anti-symmetrical) | Beam lateral (anti-symmetrical) | Beam lateral (anti-symmetrical) |
| Column Height (m) | Modal Shape | ||||
| 6 | 7 | 8 | 9 | 10 | |
| 20 | Column 2 Longitudinal | Column 3 Longitudinal | Column 4 Longitudinal | Beam column coupling | Beam–column coupling |
| 30 | Beam lateral (symmetrical) | Beam lateral (anti-symmetrical) | Columns 2, 3 Longitudinal (anti-symmetrical) | Columns 2, 3 Longitudinal (symmetrical) | Column 4 Longitudinal |
| 40 | Beam lateral (symmetrical) | Beam lateral (anti-symmetrical) | Beams 1, 2, 3 lateral (anti-symmetrical) | Beam Vertical (anti-symmetrical) | Beams 1, 2, 3 lateral (anti-symmetrical) |
Table 4.
First 10 modal shapes with different radius curvatures.
| Radius Curvature (m) | Modal Shape | ||||
| 1 | 2 | 3 | 4 | 5 | |
| 100 | Beam Longitudinal | Beam lateral (symmetrical) | Beam lateral (anti-symmetrical) | Beam Vertical (symmetrical) | Beam Vertical (anti-symmetrical) |
| 200 | Beam Longitudinal | Beam lateral (symmetrical) | Beam lateral (anti-symmetrical) | Beam Vertical (symmetrical) | Beam Vertical (anti-symmetrical) |
| 300 | Beam Longitudinal | Beam lateral (symmetrical) | Beam lateral (anti-symmetrical) | Beam Vertical (symmetrical) | Beam Vertical (anti-symmetrical) |
| ∞ | Beam Longitudinal | Beam lateral (symmetrical) | Beam lateral (anti-symmetrical) | Beam Vertical (symmetrical) | Beam Vertical (anti-symmetrical) |
| Radius Curvature (m) | Modal Shape | ||||
| 6 | 7 | 8 | 9 | 10 | |
| 100 | Beam lateral (symmetrical) | Column 3 Longitudinal | Column 2 Longitudinal | Column 4 Longitudinal | Beam lateral (anti-symmetrical) |
| 200 | Column 2 Longitudinal | Column 3 Longitudinal | Column 4 Longitudinal | Beam–column coupling | Beam–column coupling |
| 300 | Column 3 Longitudinal | Column 2 Longitudinal | Column 4 Longitudinal | Beam lateral (symmetrical) | Beam lateral (anti-symmetrical) |
| ∞ | Column 1 Longitudinal | Column 4 Longitudinal | Beam Vertical (symmetrical) | Beam lateral (anti-symmetrical) | Beam lateral (anti-symmetrical) |
Table 5.
First 10 modal shapes with different support arrangements.
| Support Arrangement | Modal Shape | ||||
| 1 | 2 | 3 | 4 | 5 | |
| Tangential movable support | Beam Longitudinal | Beam lateral (symmetrical) | Beam lateral (anti-symmetrical) | Beam Vertical (symmetrical) | Beam Vertical (anti-symmetrical) |
| Fixed support | Beam lateral (anti-symmetrical) | Beam lateral (symmetrical) | Beam Longitudinal | Beam Vertical (symmetrical) | Beam Vertical (anti-symmetrical) |
| Support Arrangement | Modal Shape | ||||
| 6 | 7 | 8 | 9 | 10 | |
| Tangential movable support | Column 2 Longitudinal | Column 3 Longitudinal | Column 4 Longitudinal | Beam–column coupling | Beam column coupling |
| Fixed support | Columns 1, 4 lateral (symmetrical) | Column 1 Longitudinal | Column 4 Longitudinal | Columns 1, 4 lateral (anti-symmetrical) | Beam lateral (symmetrical) |
Disclaimer/Publisher’s Note: The statements, opinions and data contained in all publications are solely those of the individual author(s) and contributor(s) and not of MDPI and/or the editor(s). MDPI and/or the editor(s) disclaim responsibility for any injury to people or property resulting from any ideas, methods, instructions or products referred to in the content. |
© 2023 by the authors. Licensee MDPI, Basel, Switzerland. This article is an open access article distributed under the terms and conditions of the Creative Commons Attribution (CC BY) license (https://creativecommons.org/licenses/by/4.0/).
Share and Cite
MDPI and ACS Style
Tao, C.; Guan, S. A Method to Identify the Critical Seismic Input for Curved Bridges. CivilEng 2023, 4, 567-583. https://doi.org/10.3390/civileng4020033
AMA Style
Tao C, Guan S. A Method to Identify the Critical Seismic Input for Curved Bridges. CivilEng. 2023; 4(2):567-583. https://doi.org/10.3390/civileng4020033
Chicago/Turabian StyleTao, Chengcheng, and Shanyue Guan. 2023. "A Method to Identify the Critical Seismic Input for Curved Bridges" CivilEng 4, no. 2: 567-583. https://doi.org/10.3390/civileng4020033