
Numerical Modeling and Analysis of Strengthened Steel–Concrete Composite Beams in Sagging and Hogging Moment Regions


Abstract
:1. Introduction
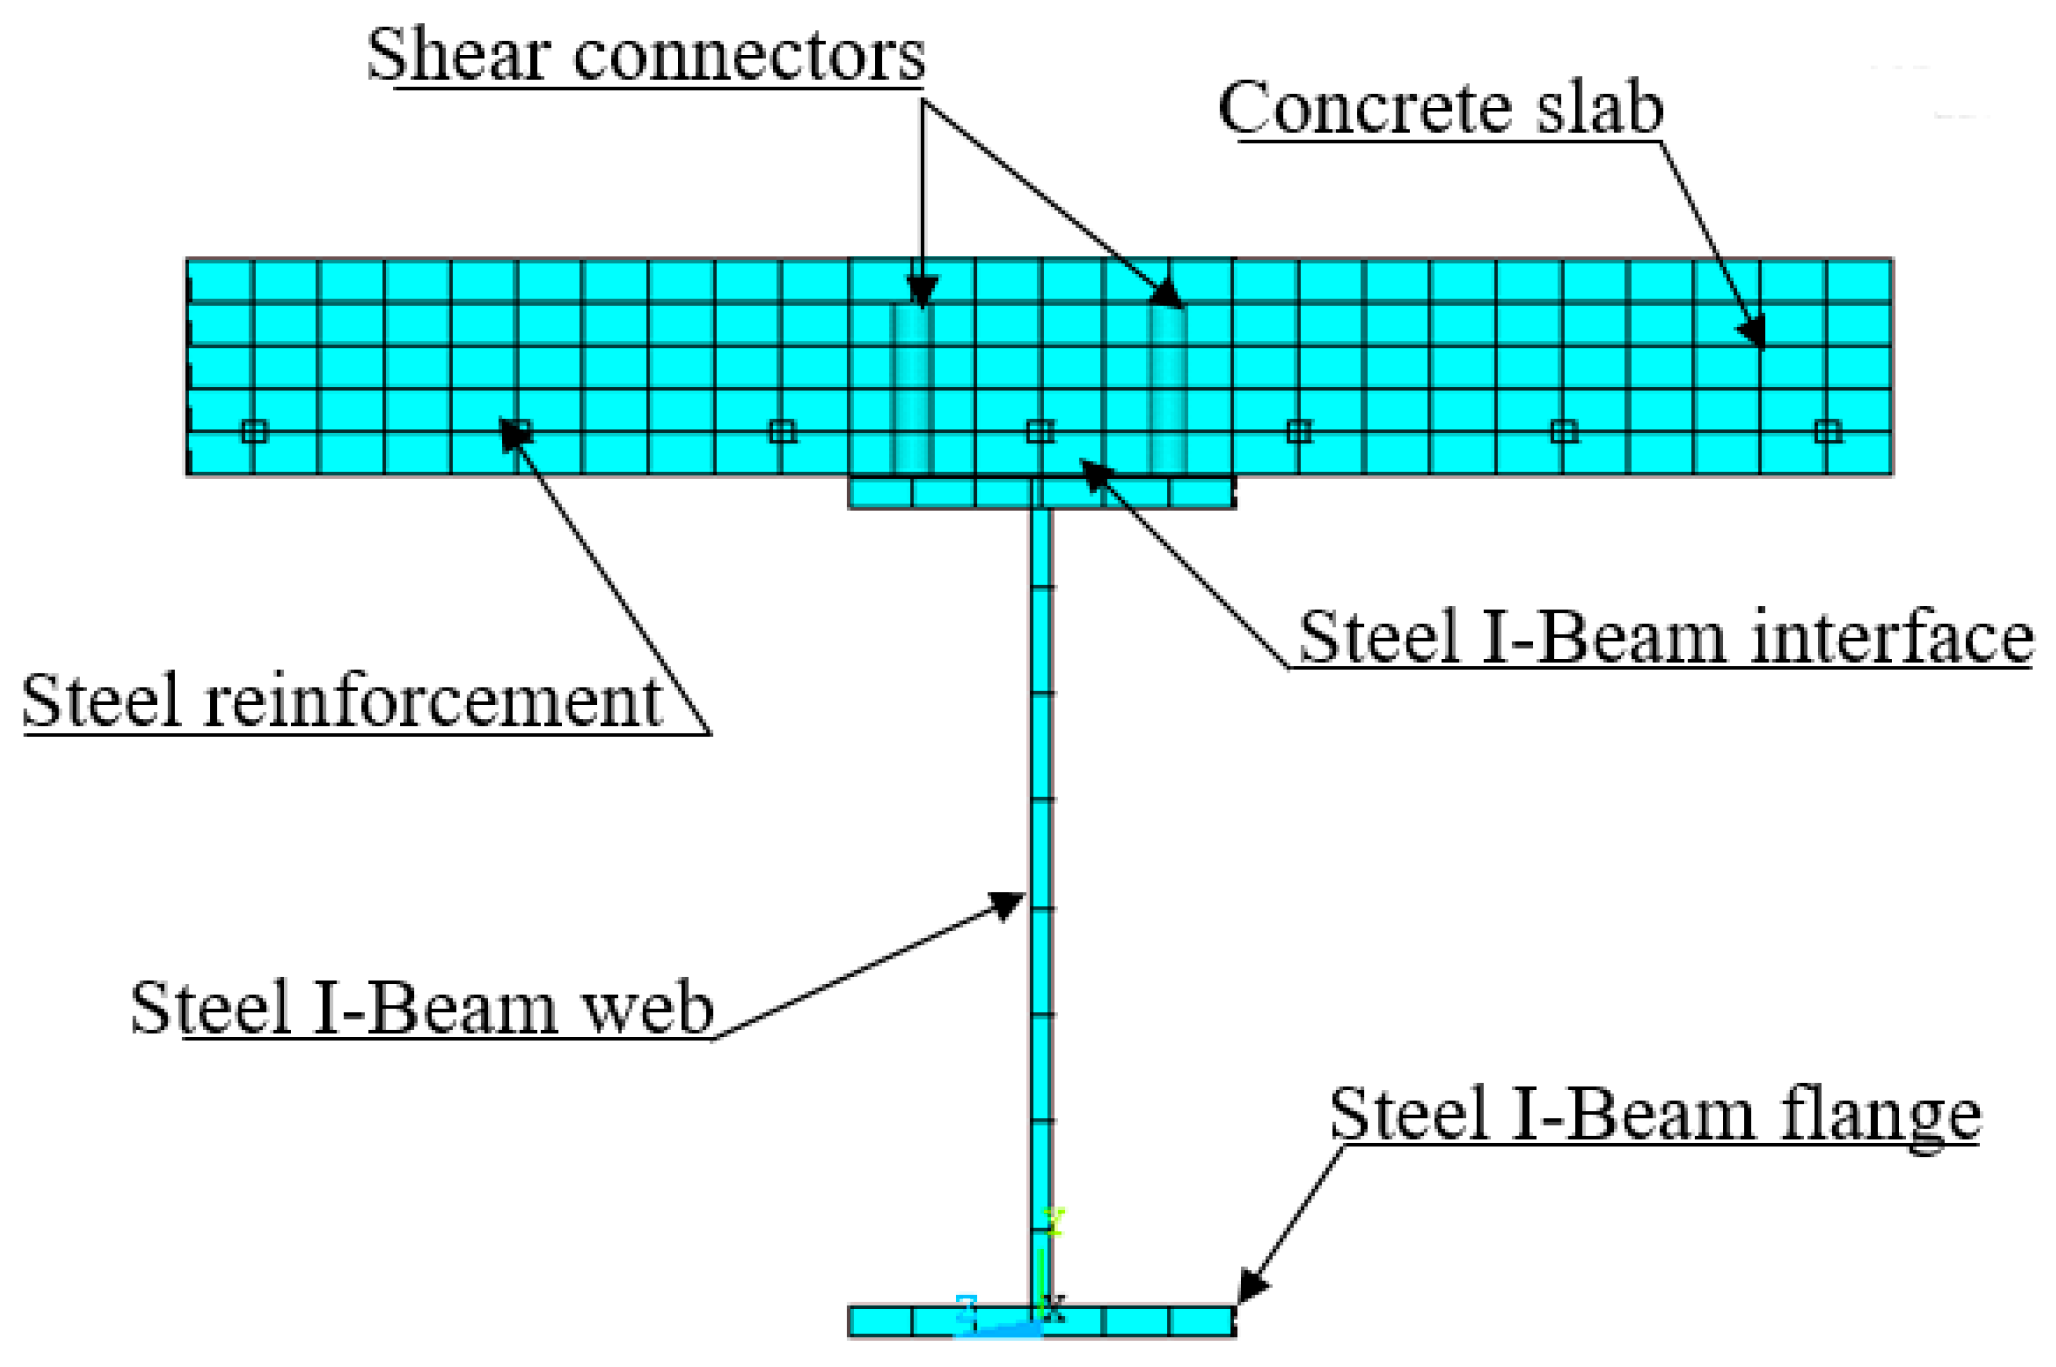
2. Modeling of Strengthened Composite Beams
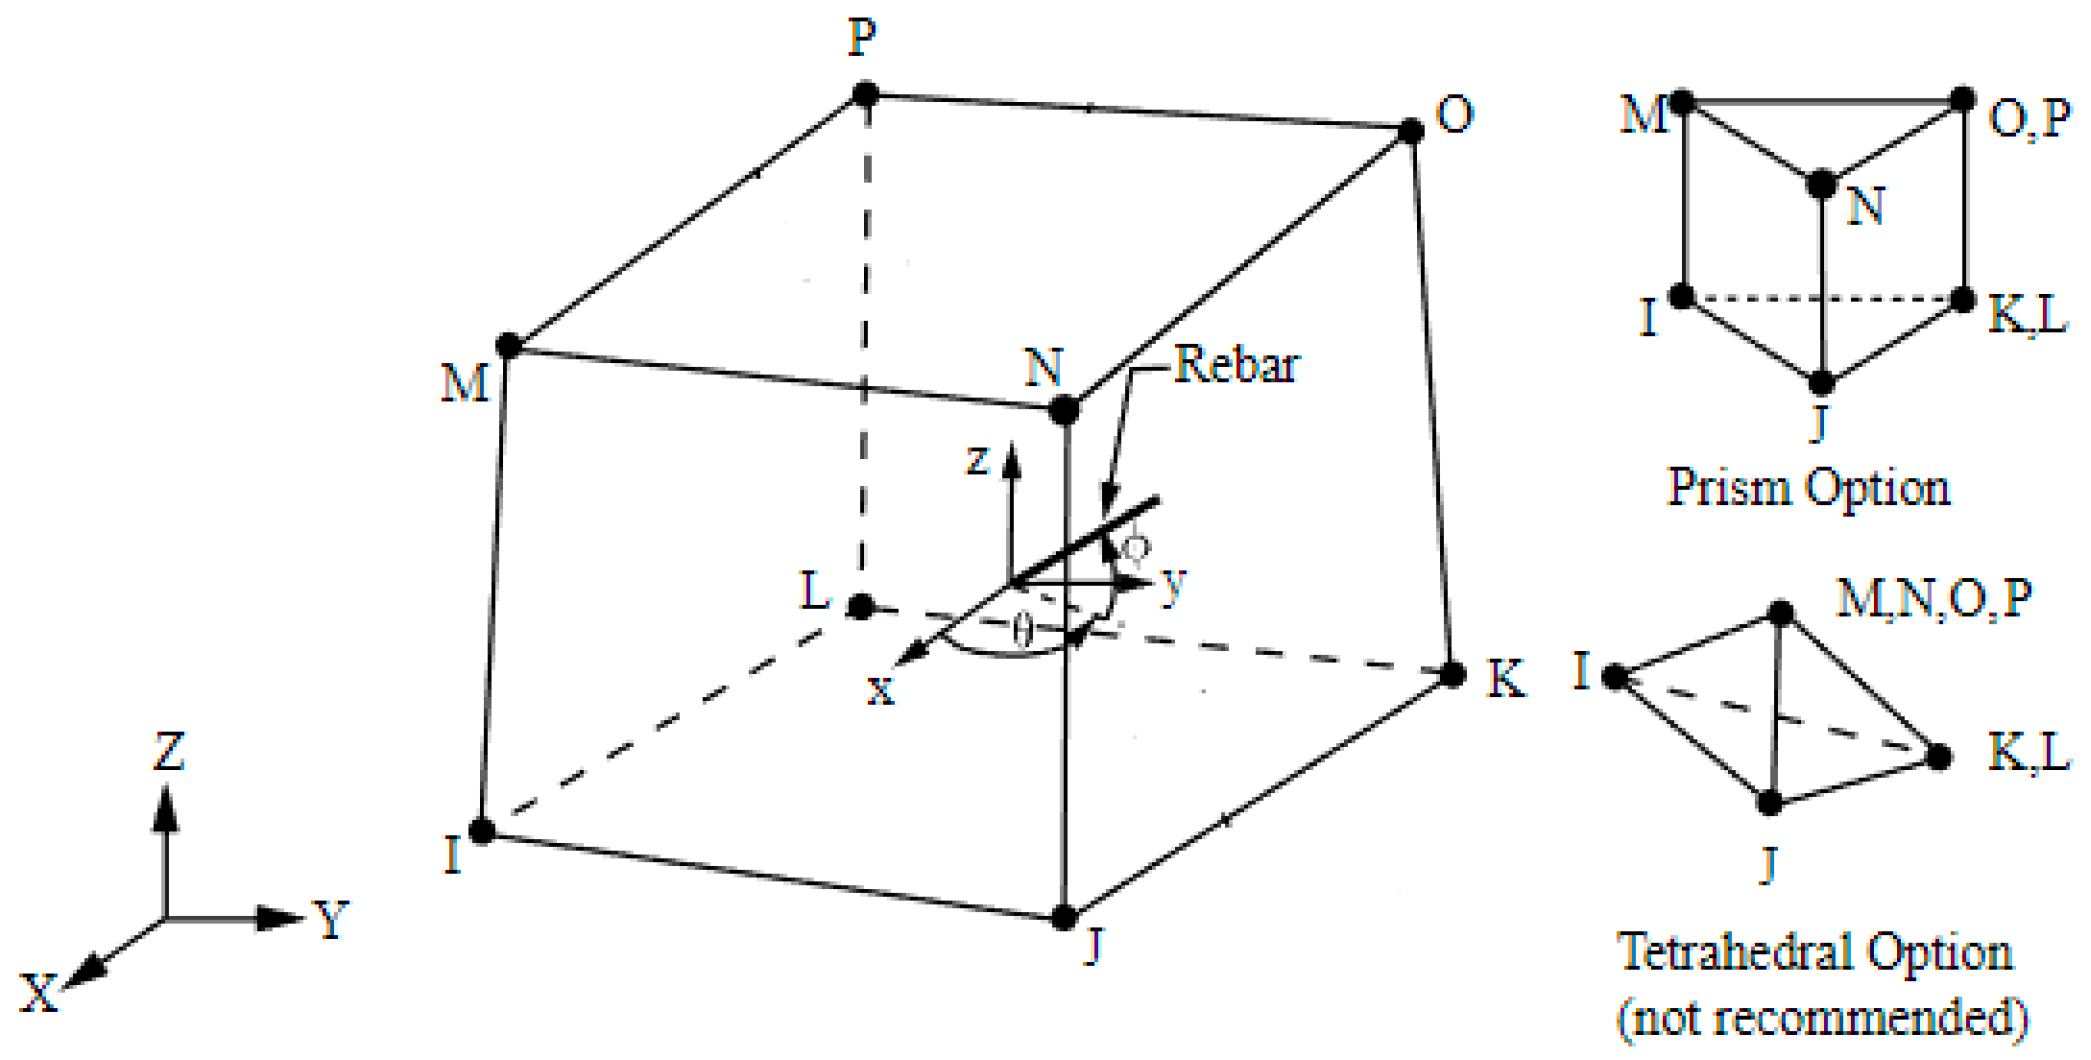
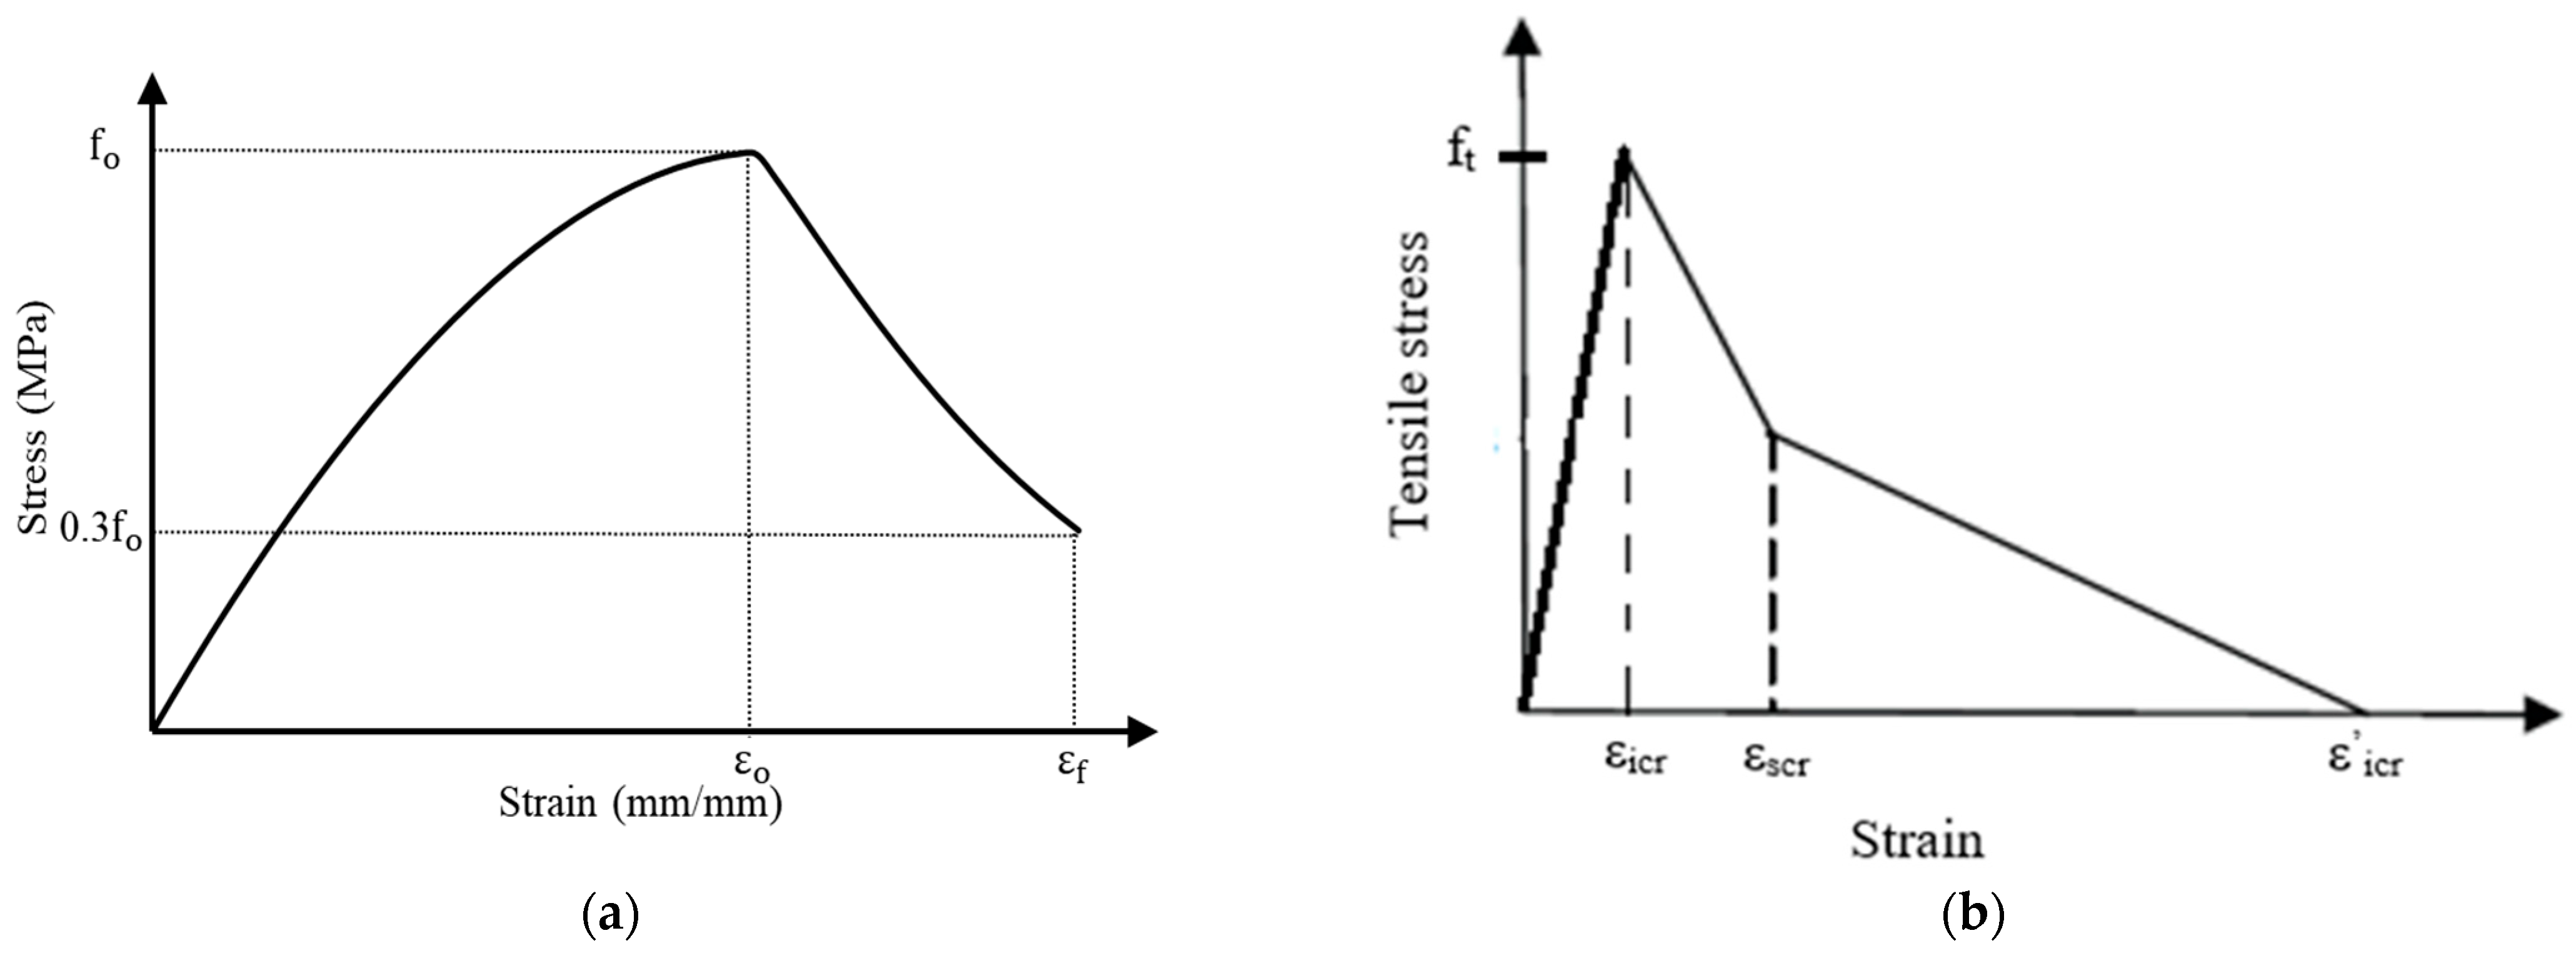
2.1. Concrete Slab
2.2. Reinforcing Rebars and Post-Tensioned Tendons
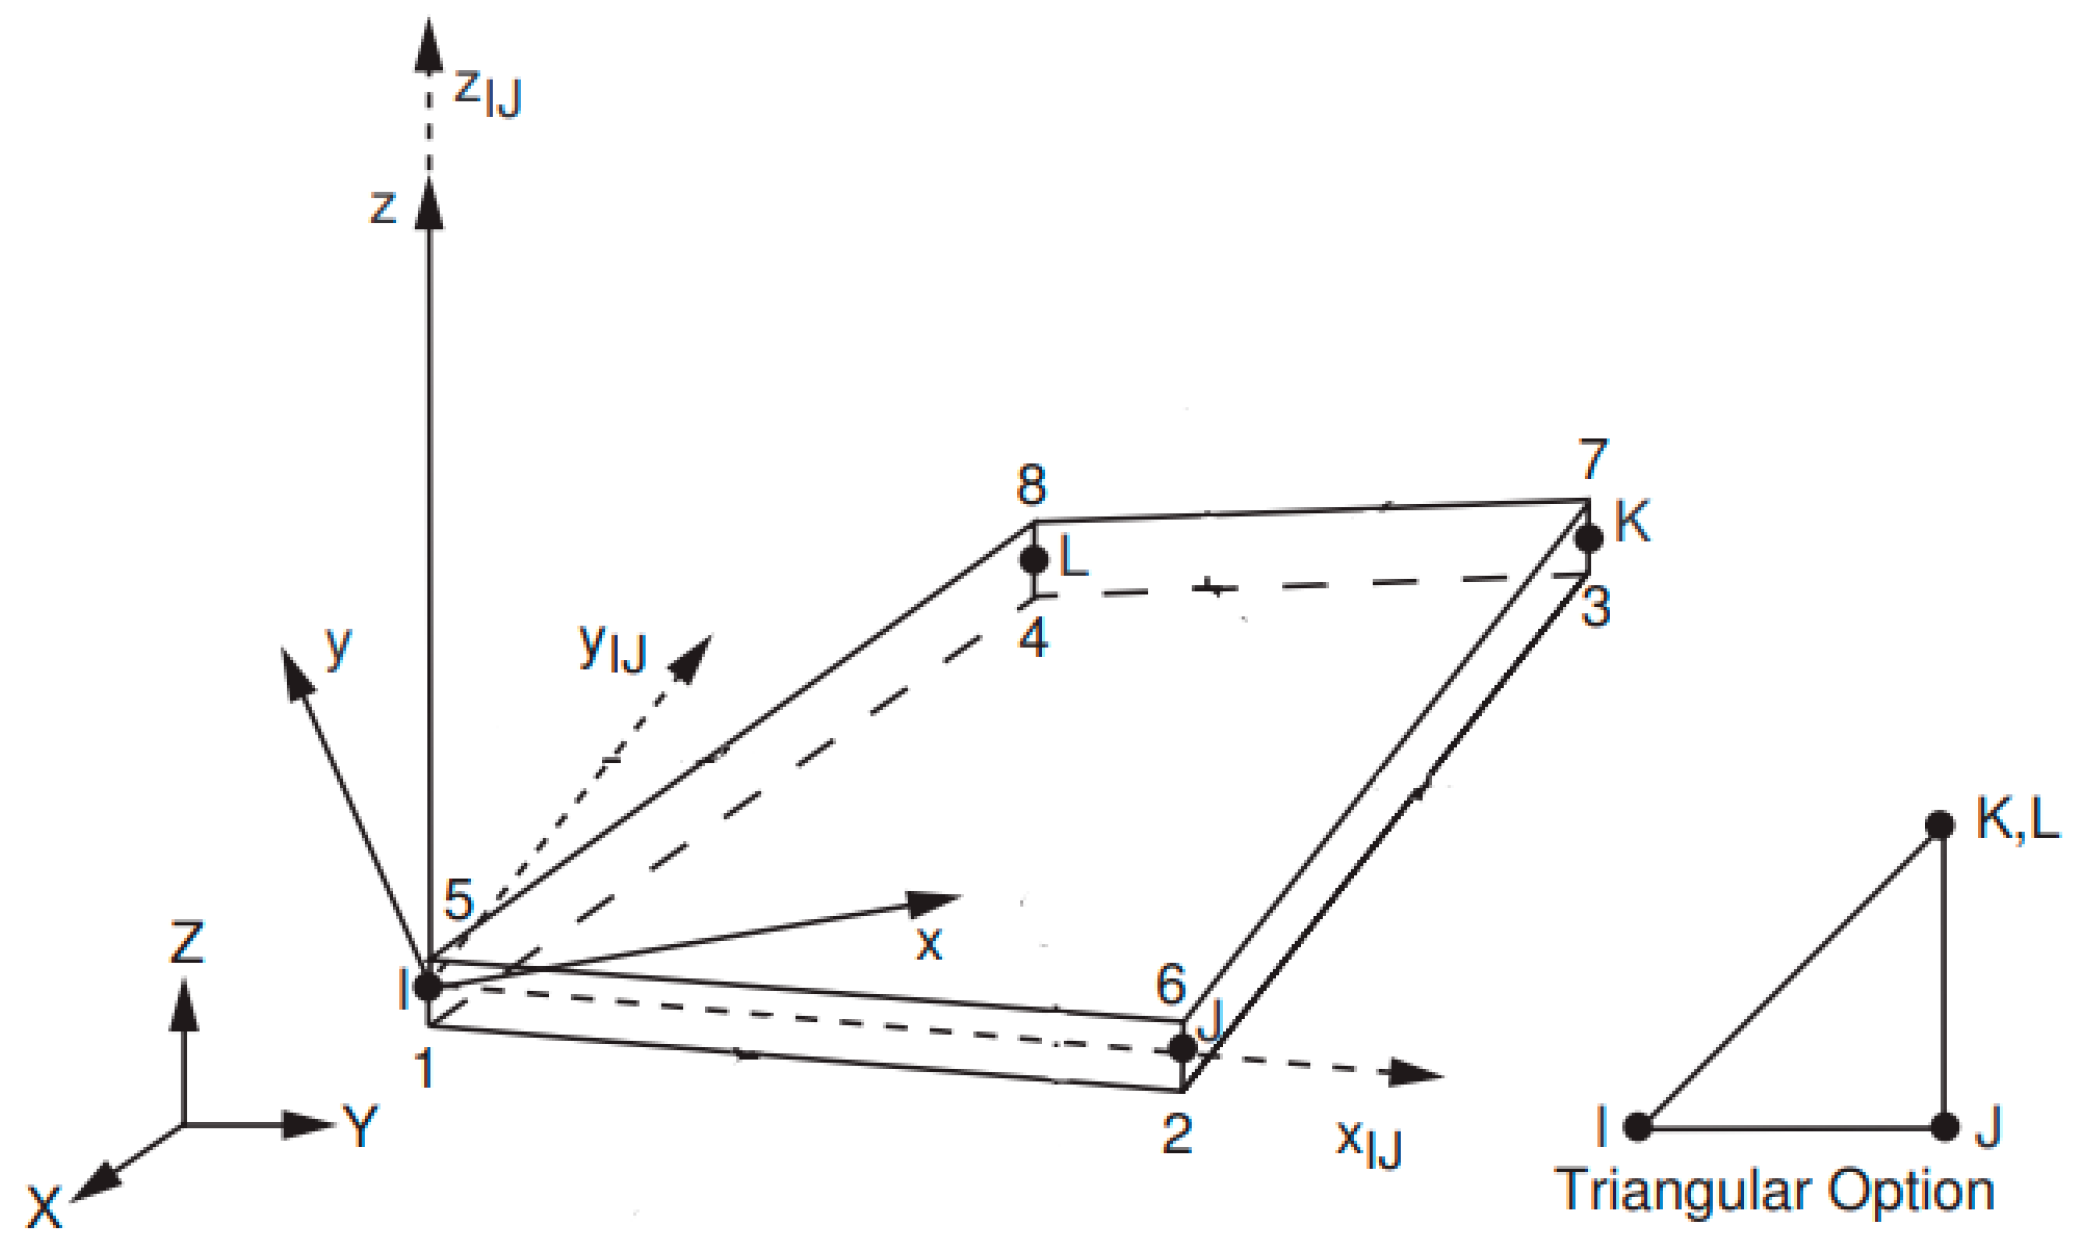
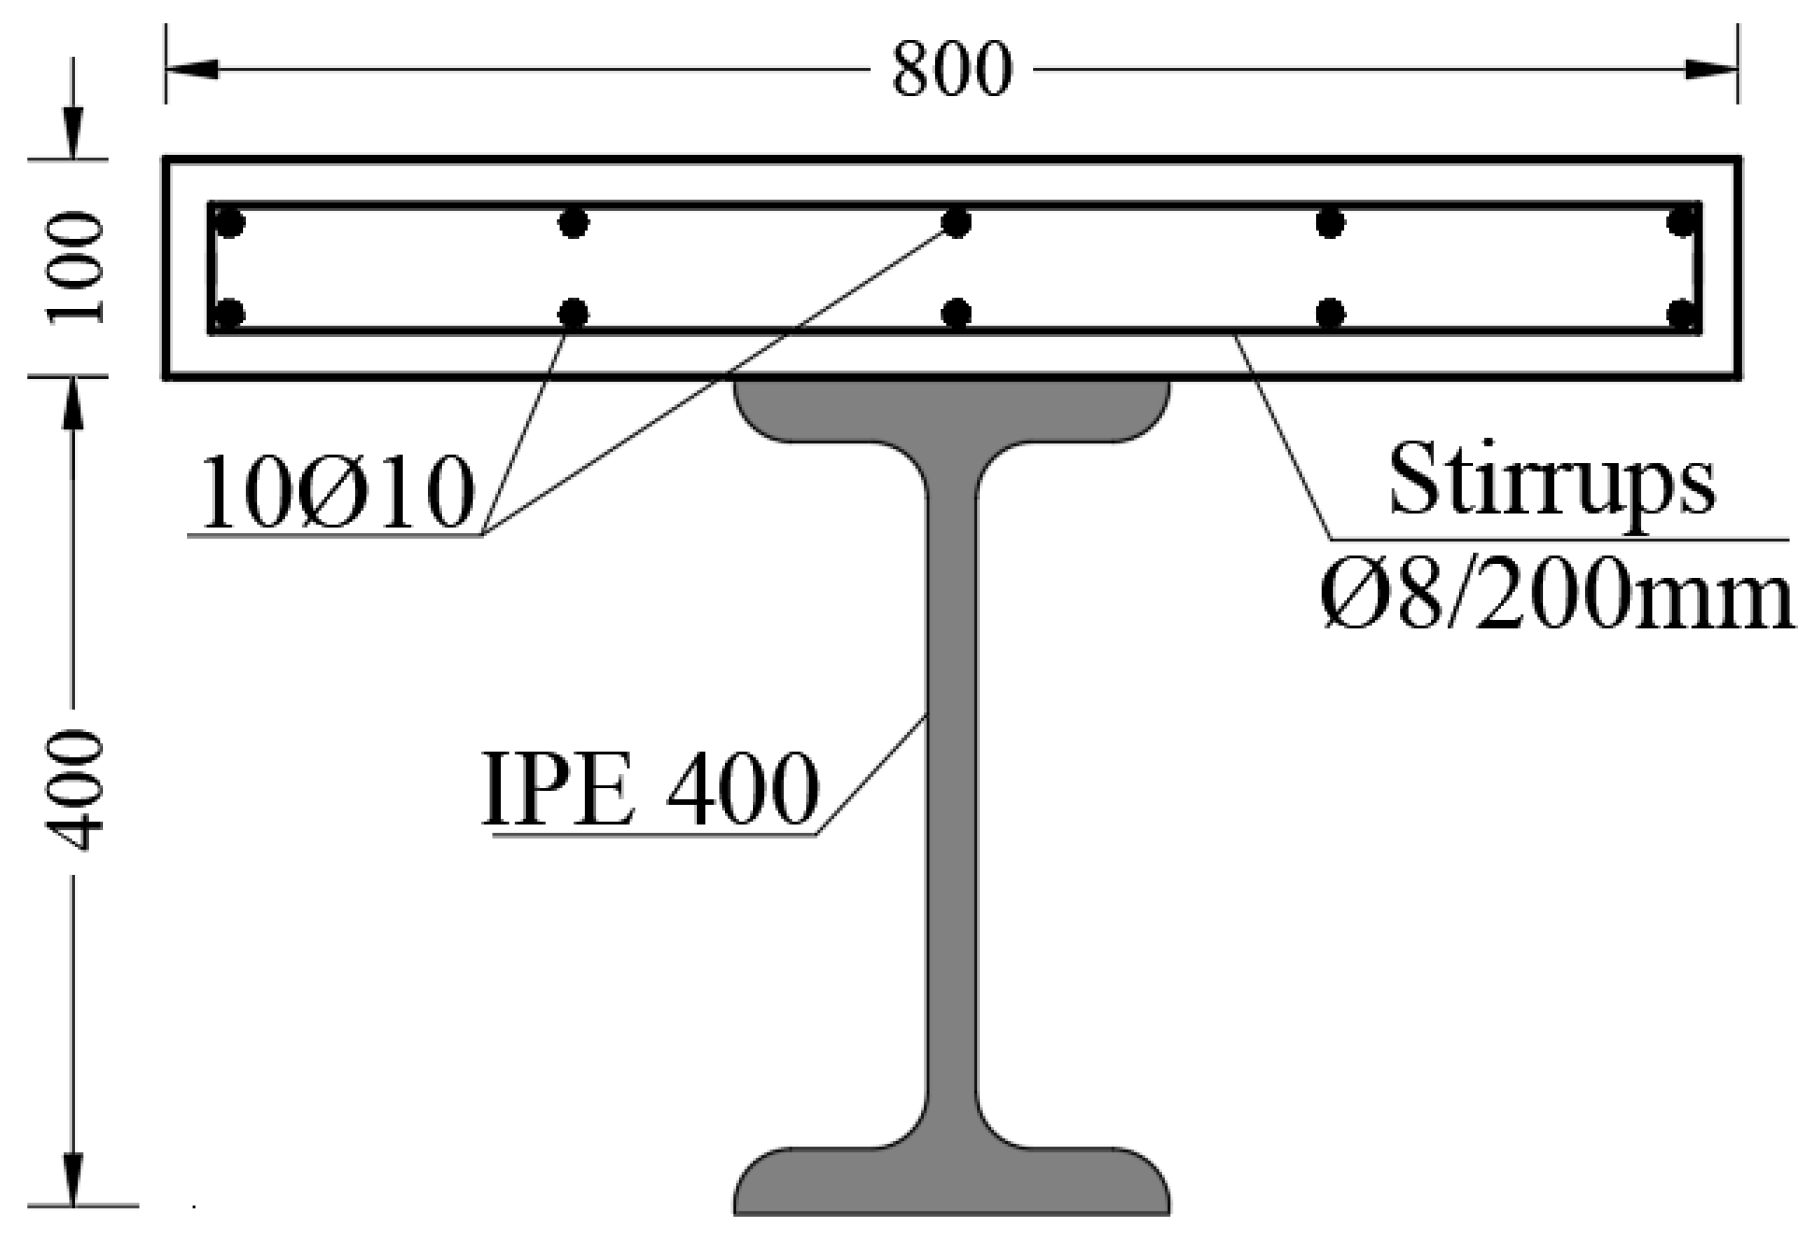
2.3. Steel I-Beam and Corrugated Steel Sheet
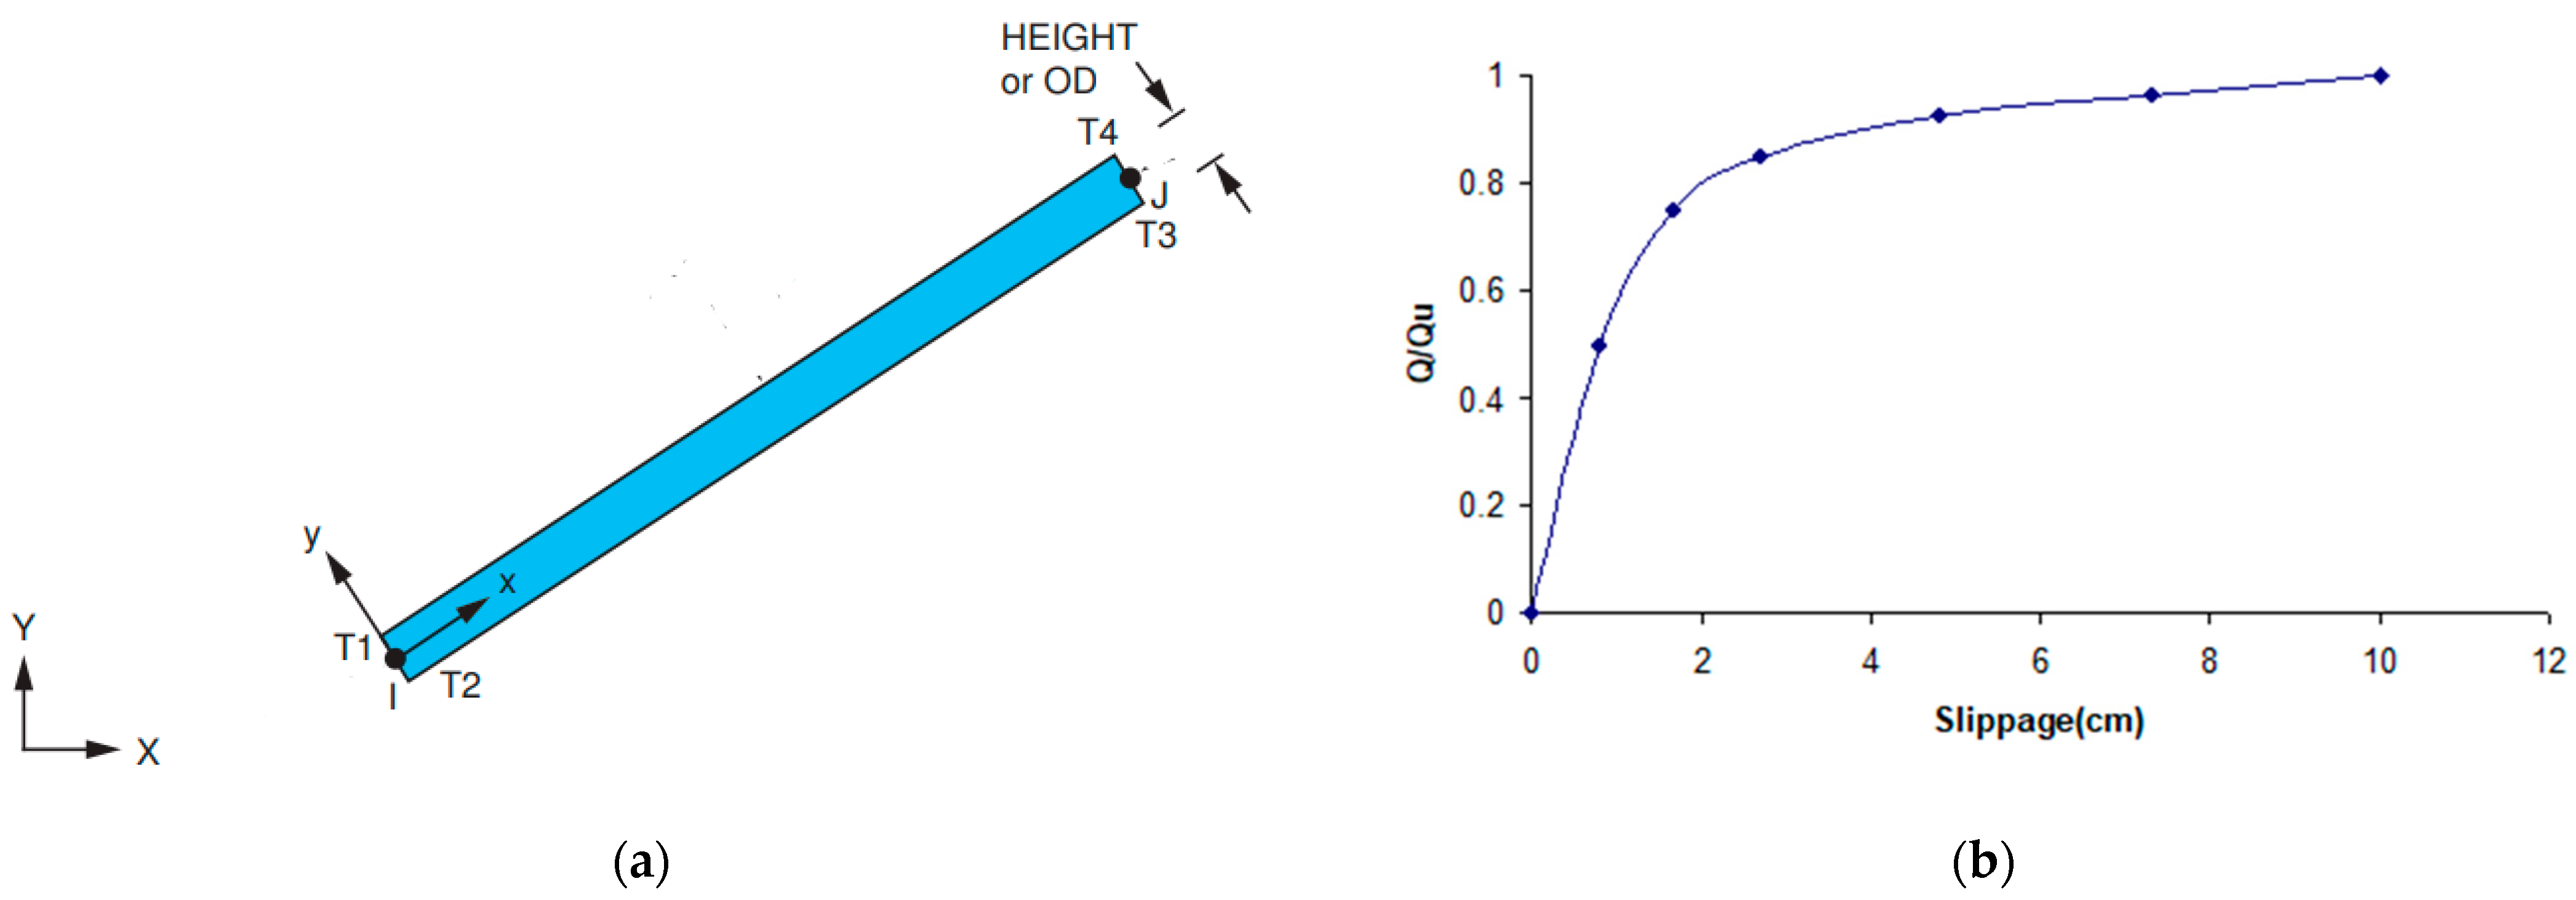
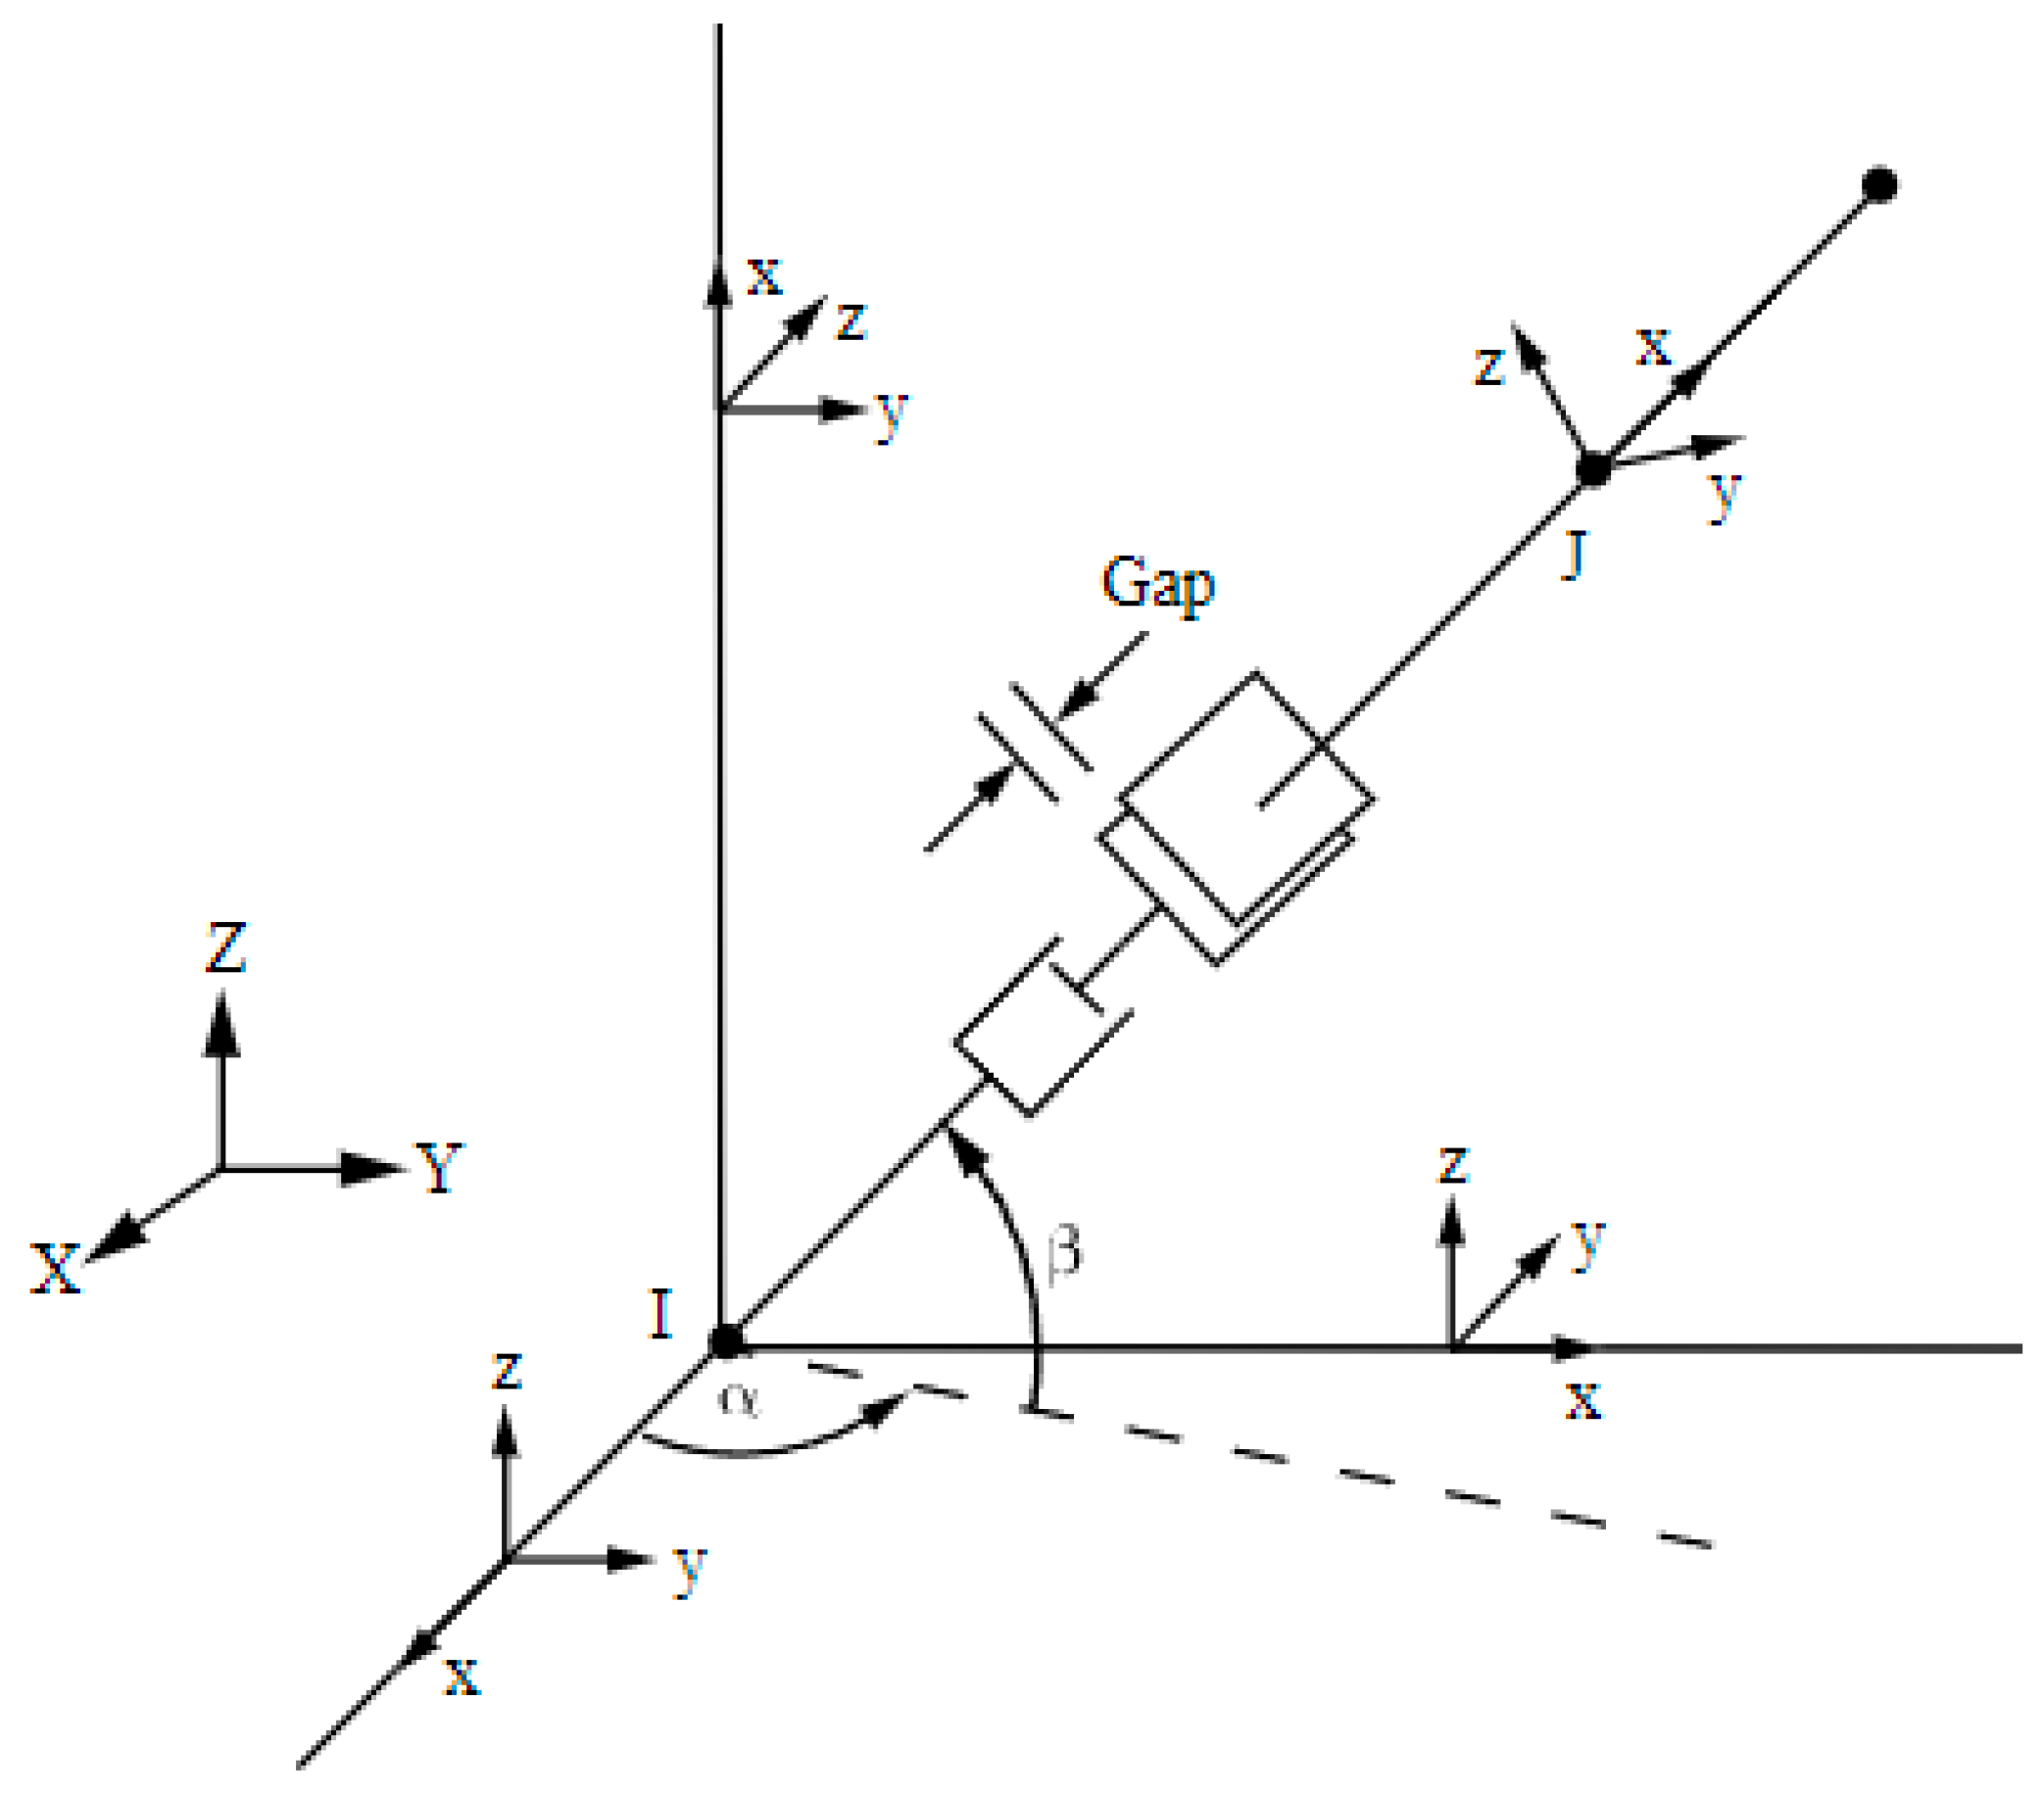
2.4. Shear Connection between the Concrete Slab and Steel Beam
2.5. Steel Beam and Concrete Slab Interface
2.6. CFRP Composites
3. Verification of the Proposed Model
3.1. Composite Beam without Profiled Steel Sheeting
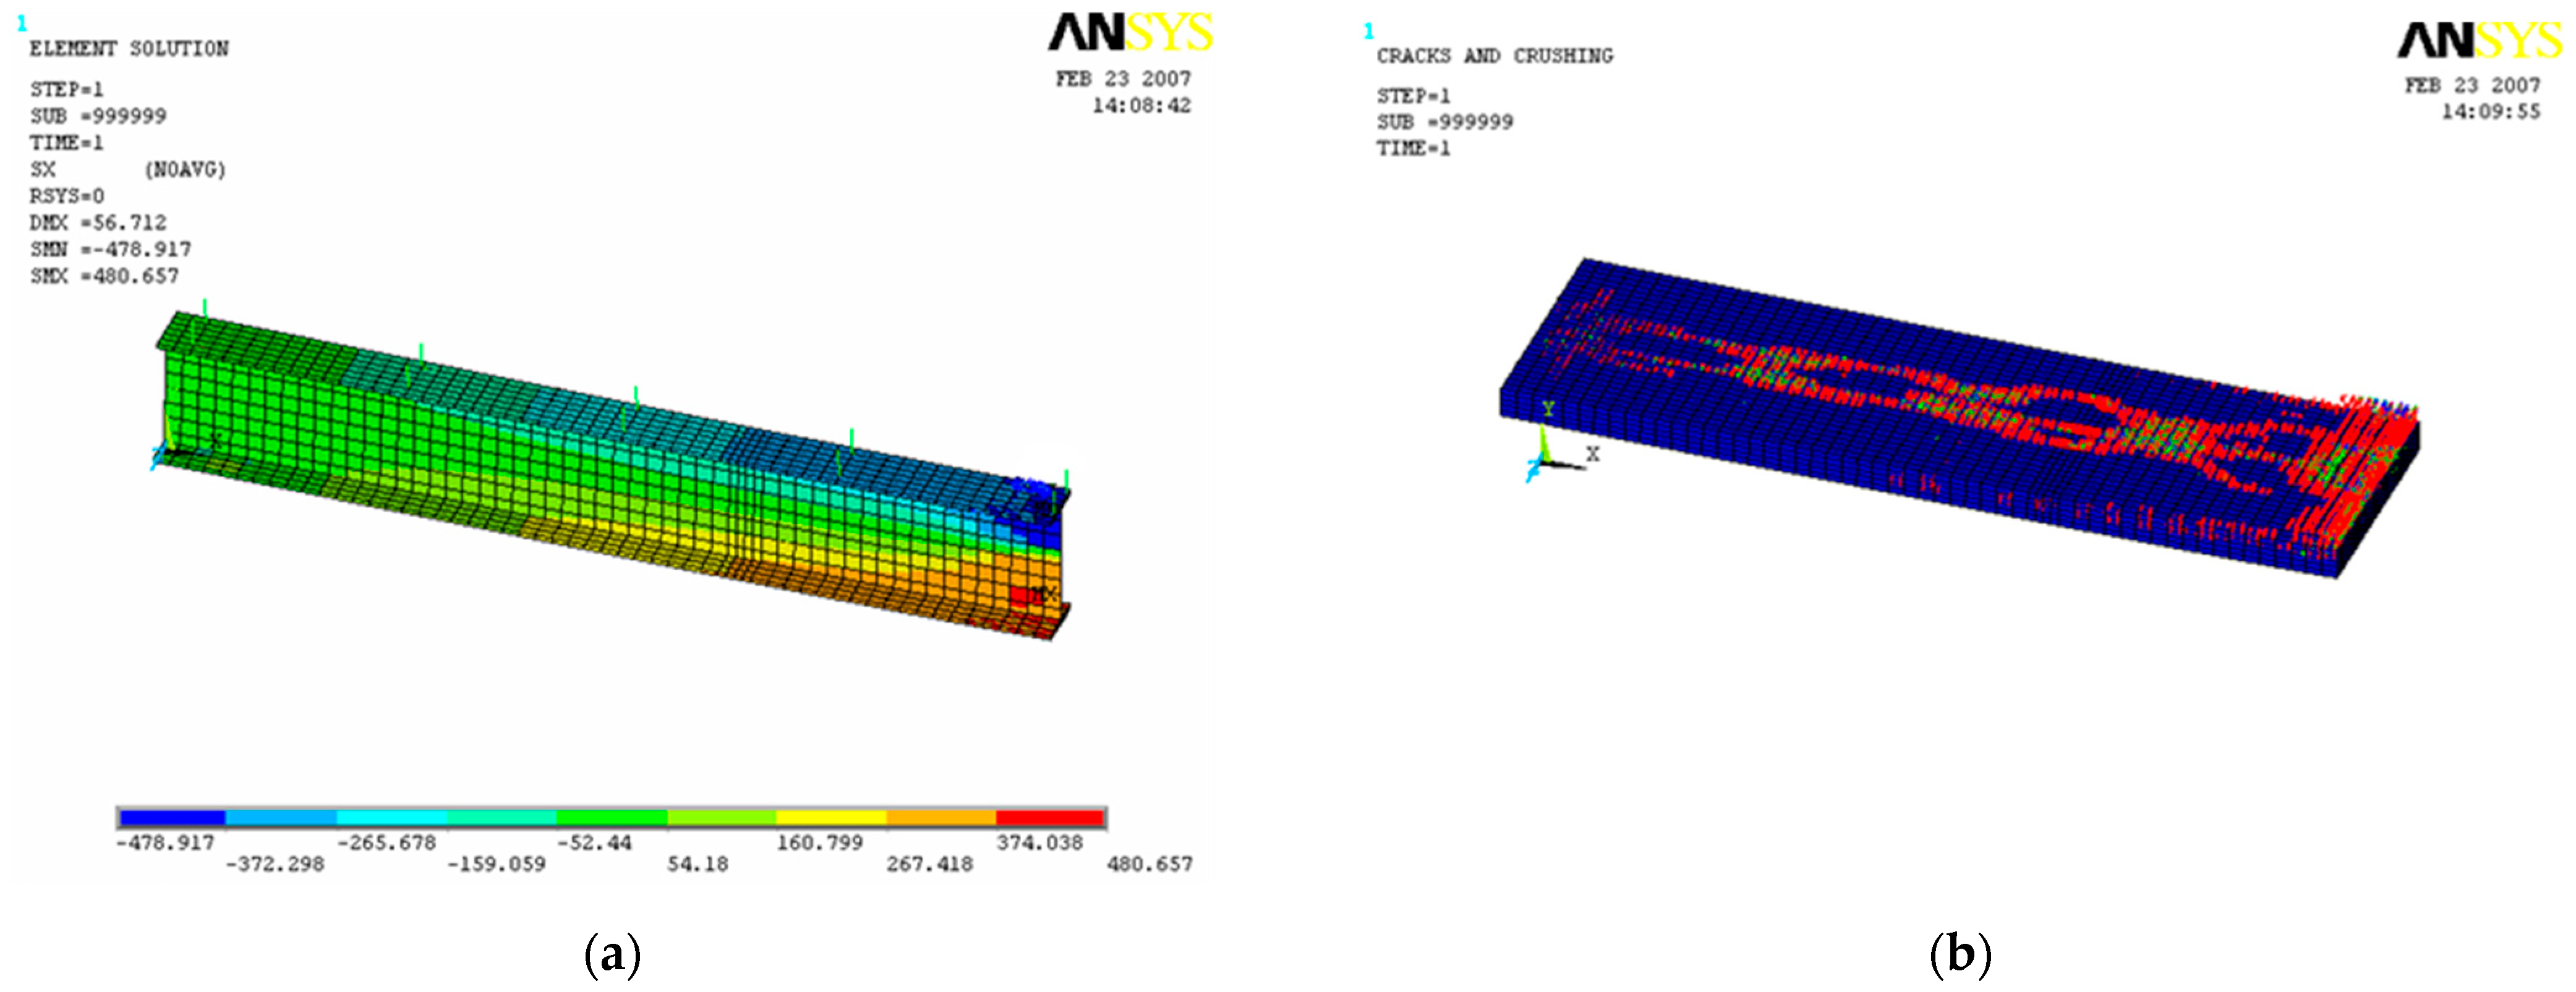
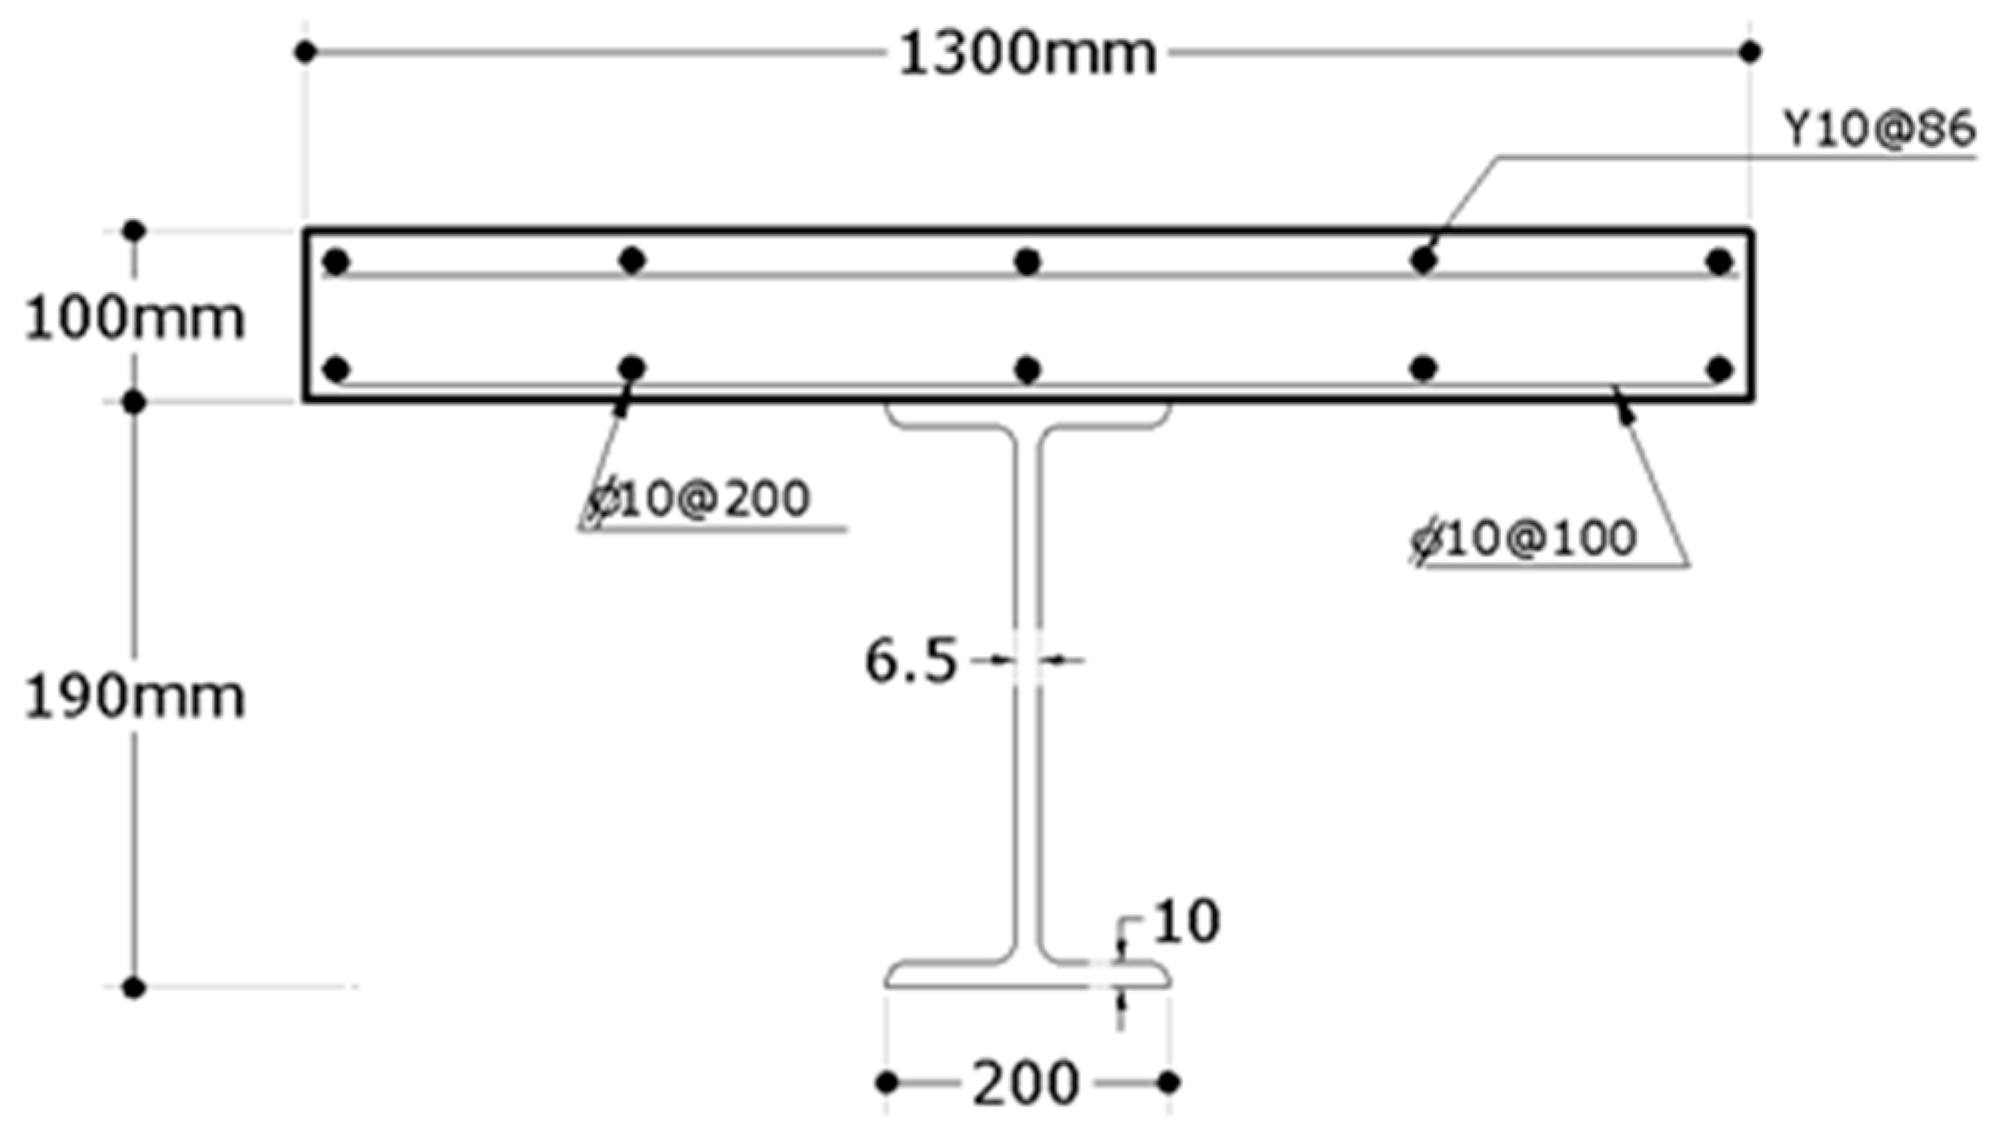
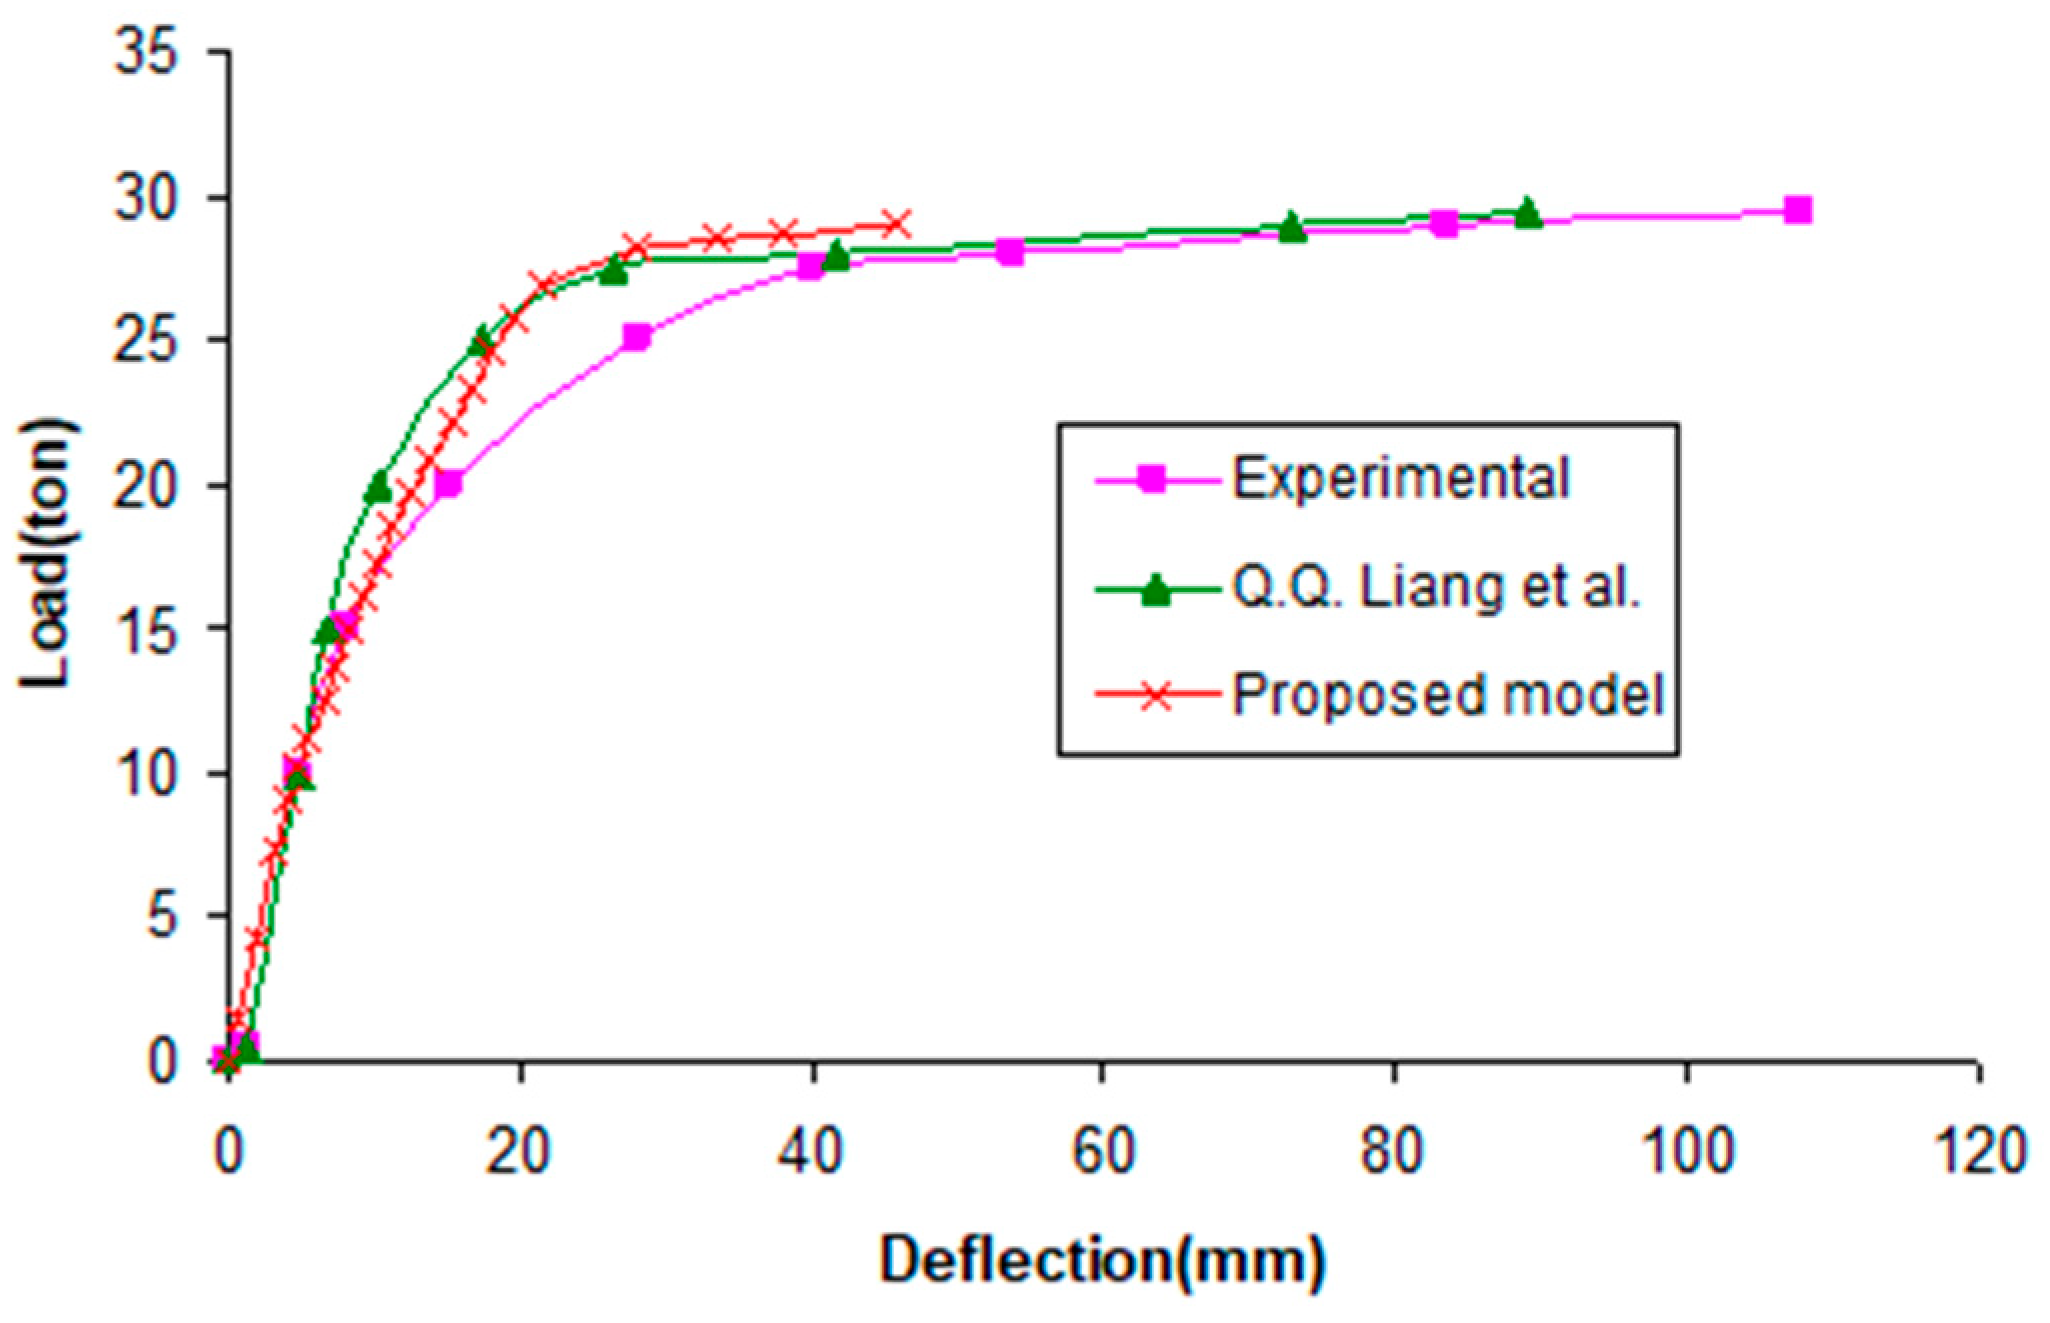
3.2. Continuous Composite Beam without Profiled Steel Sheeting
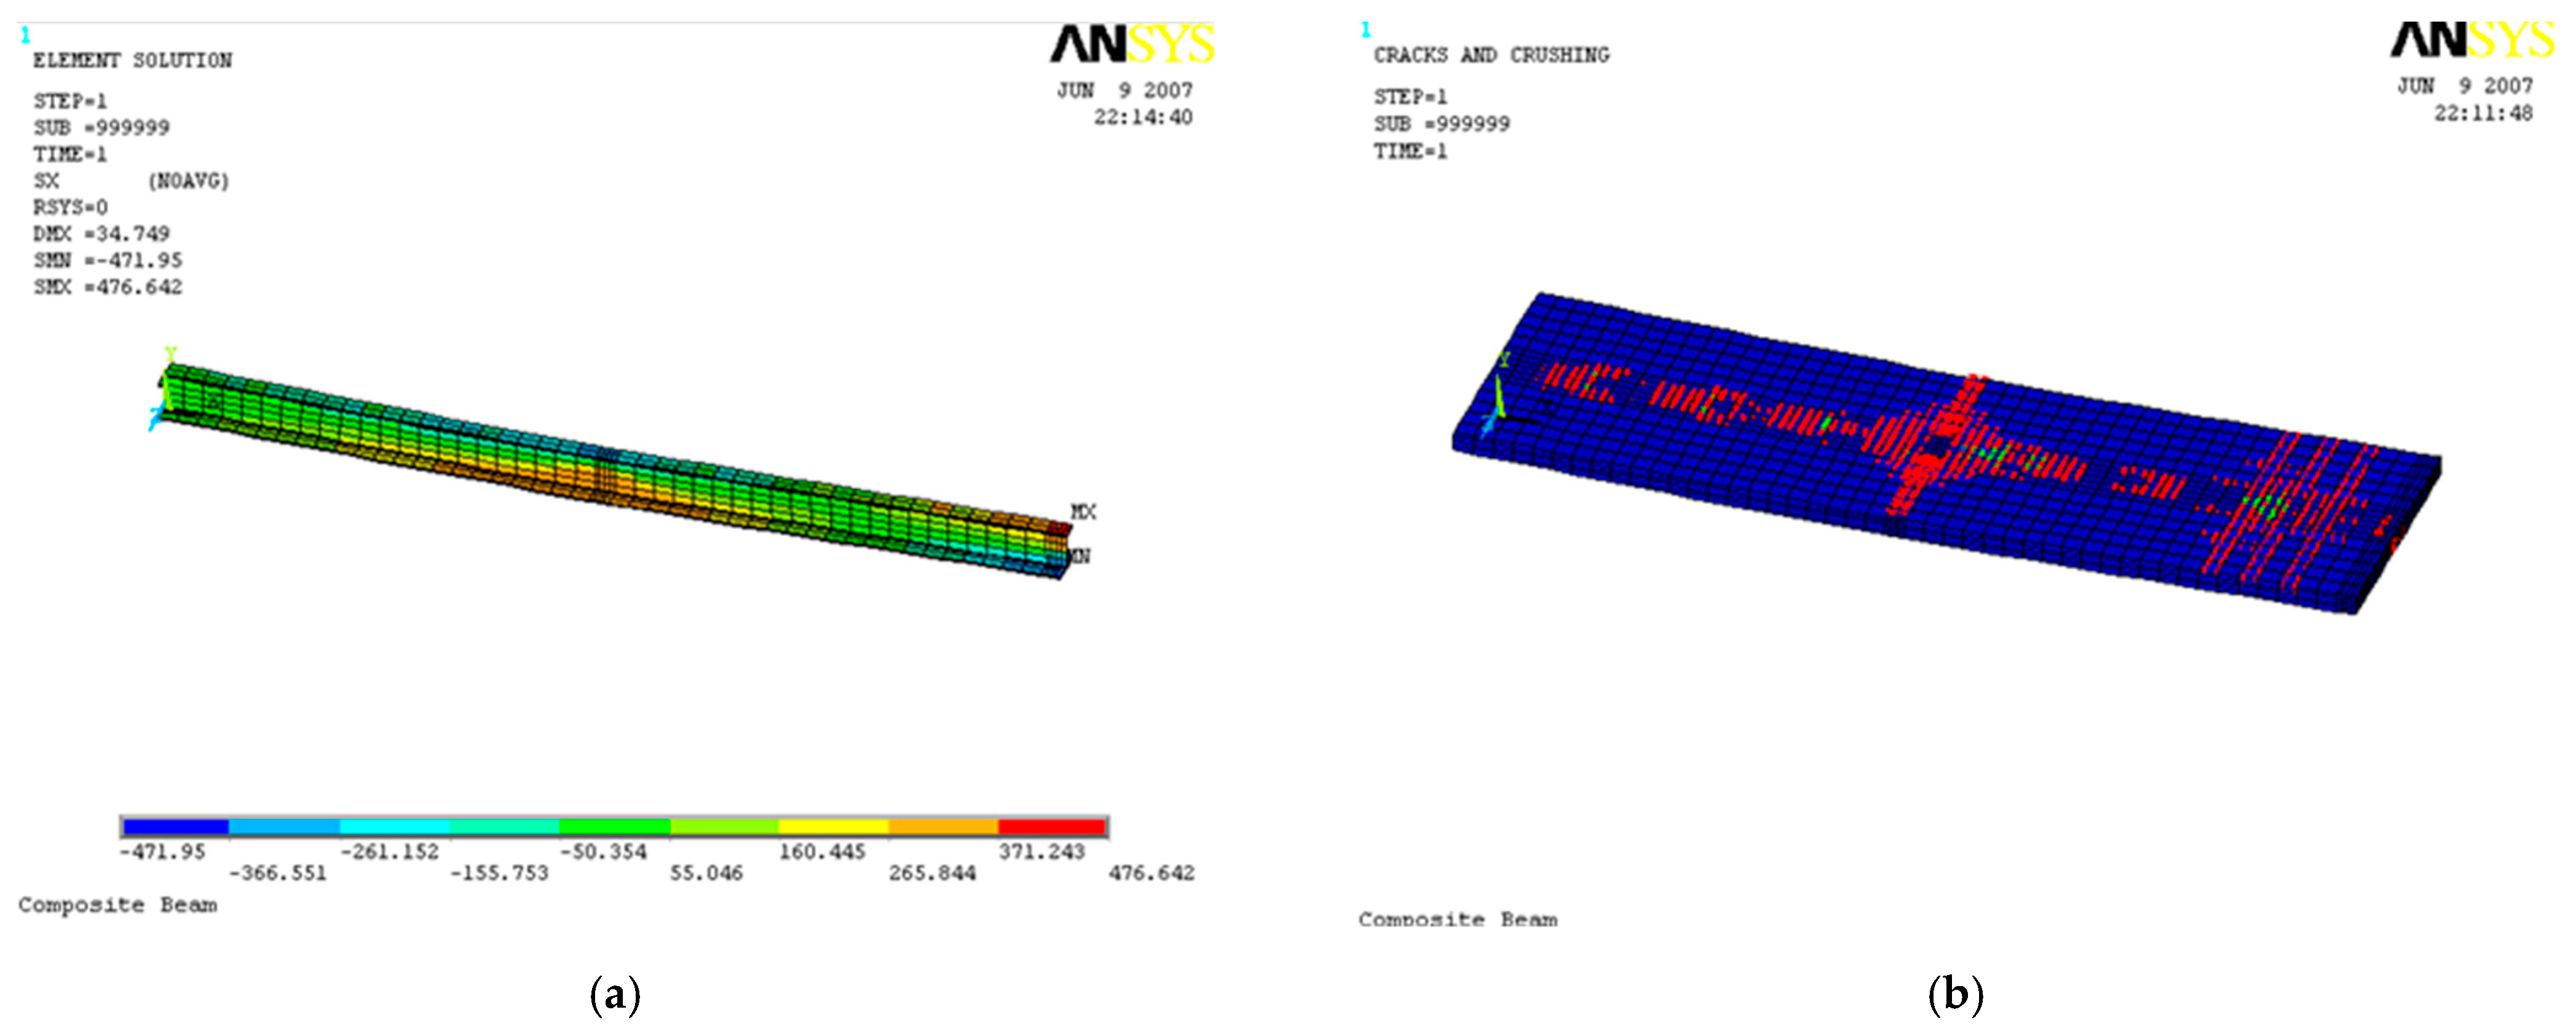
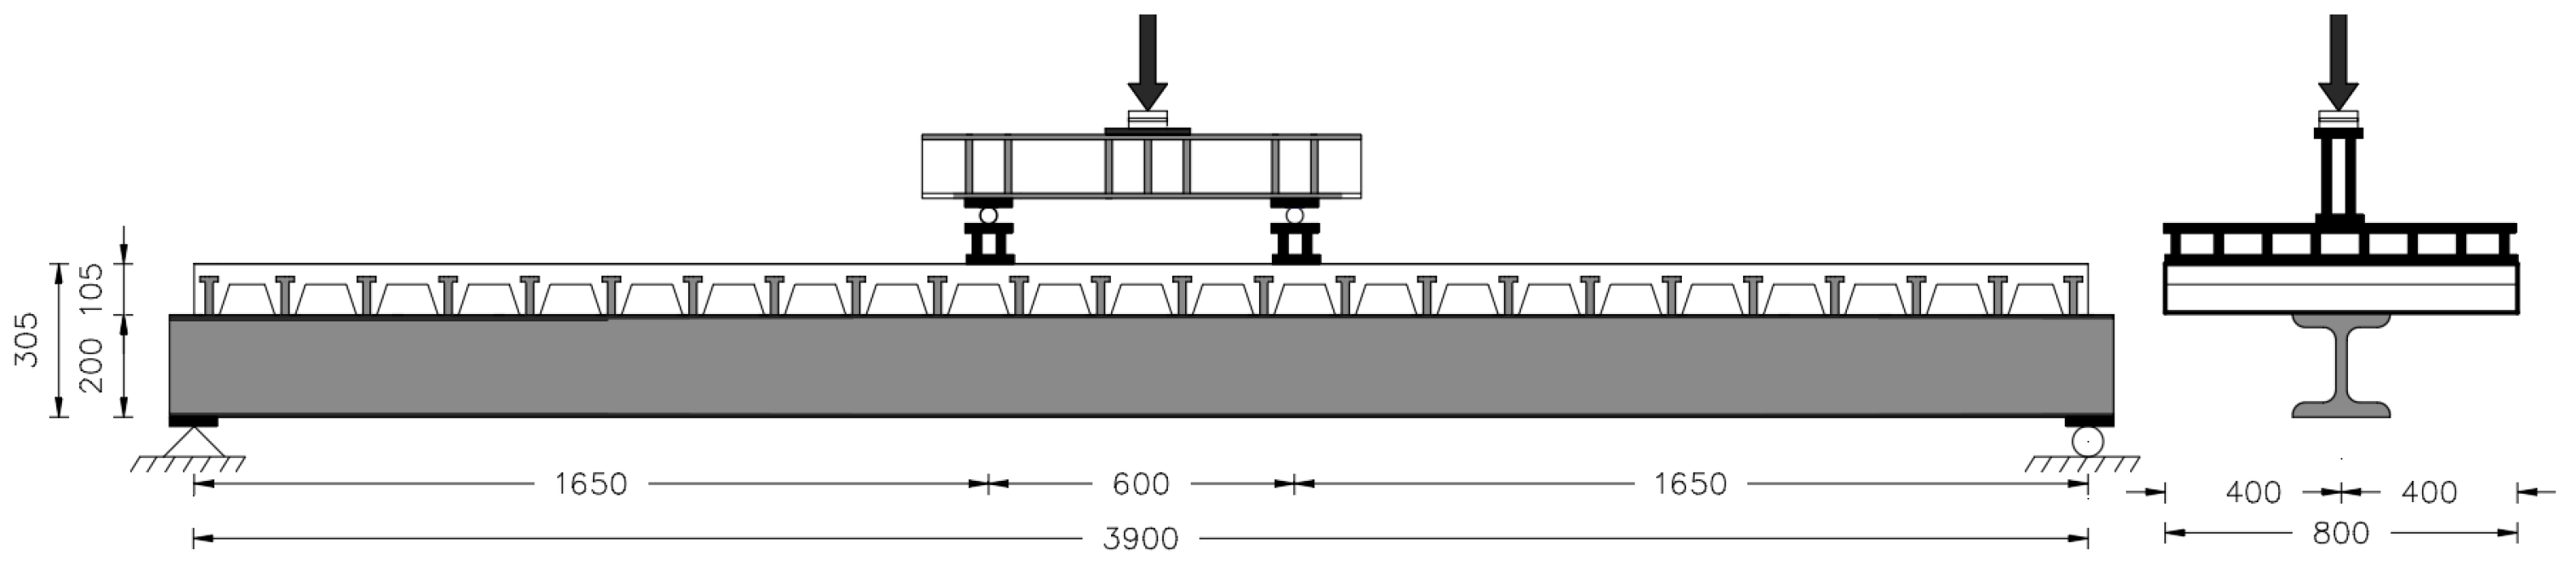
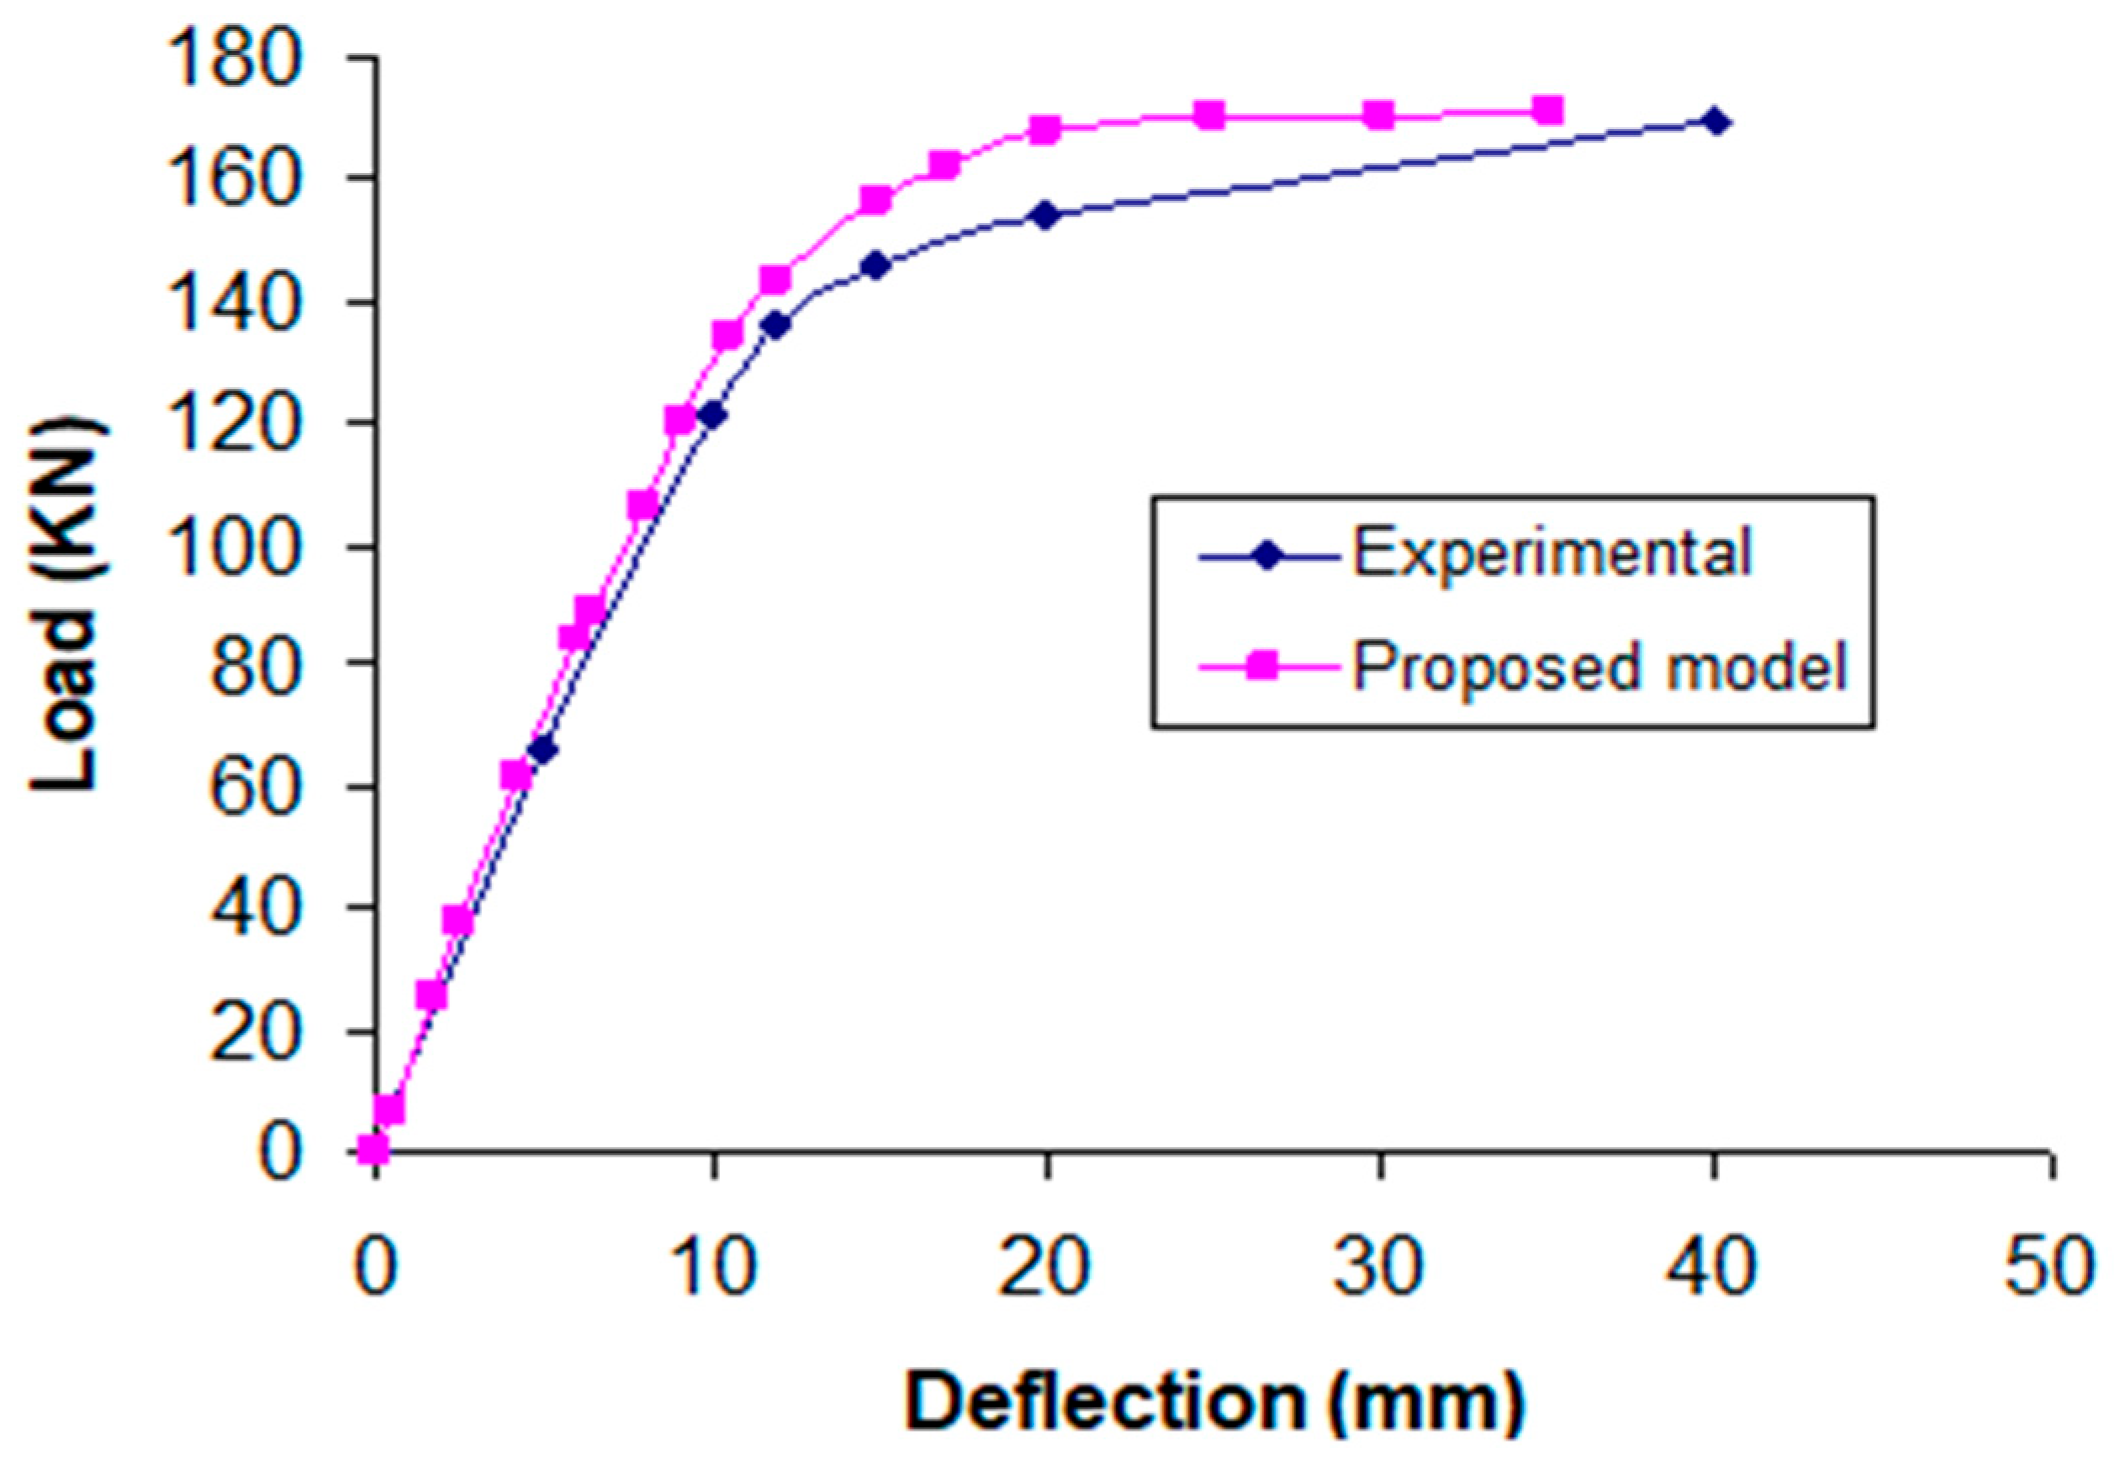
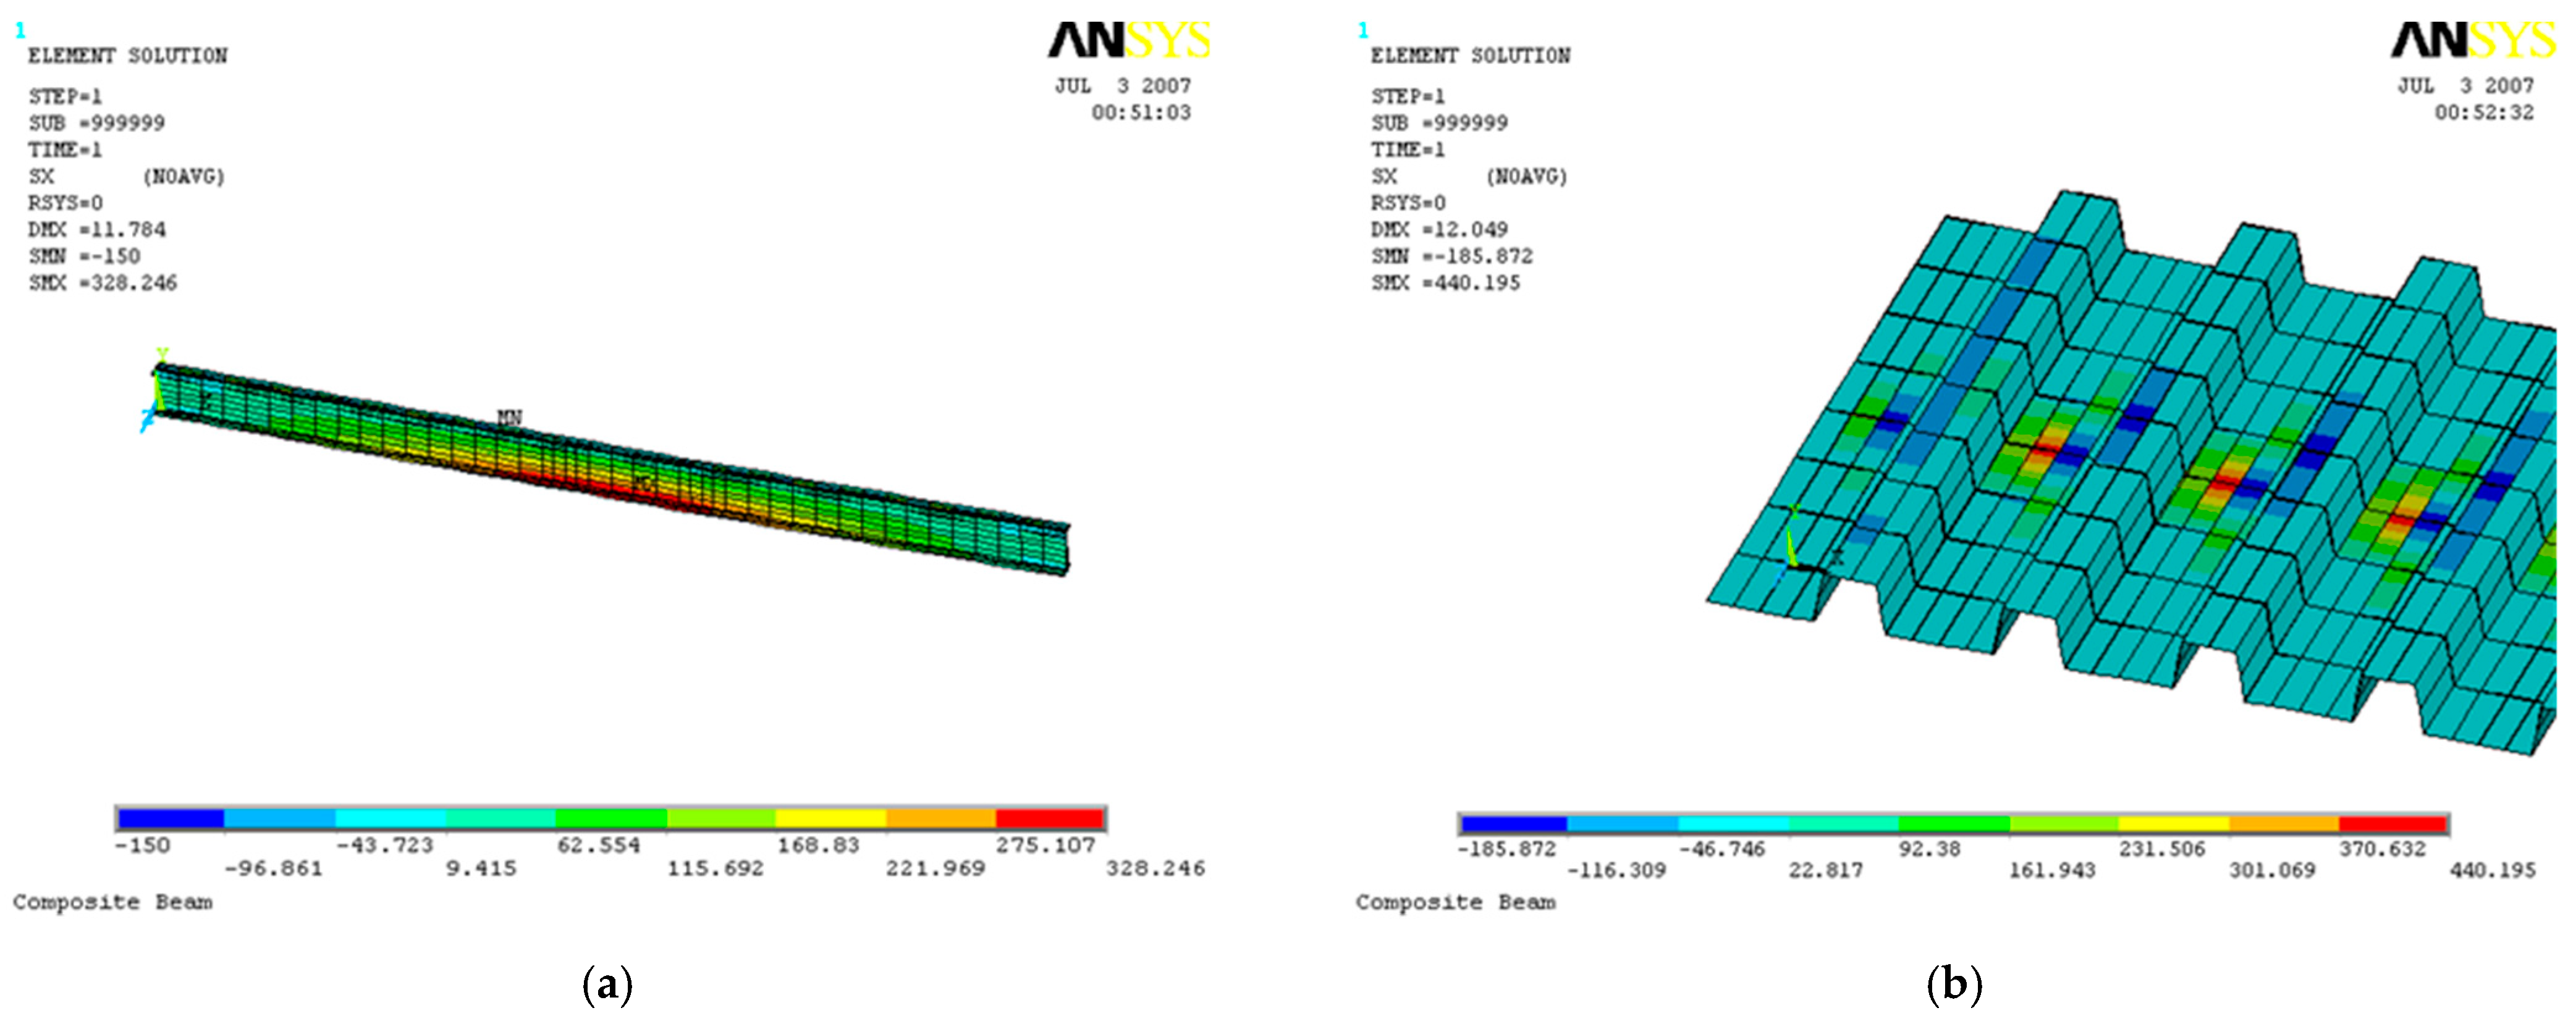
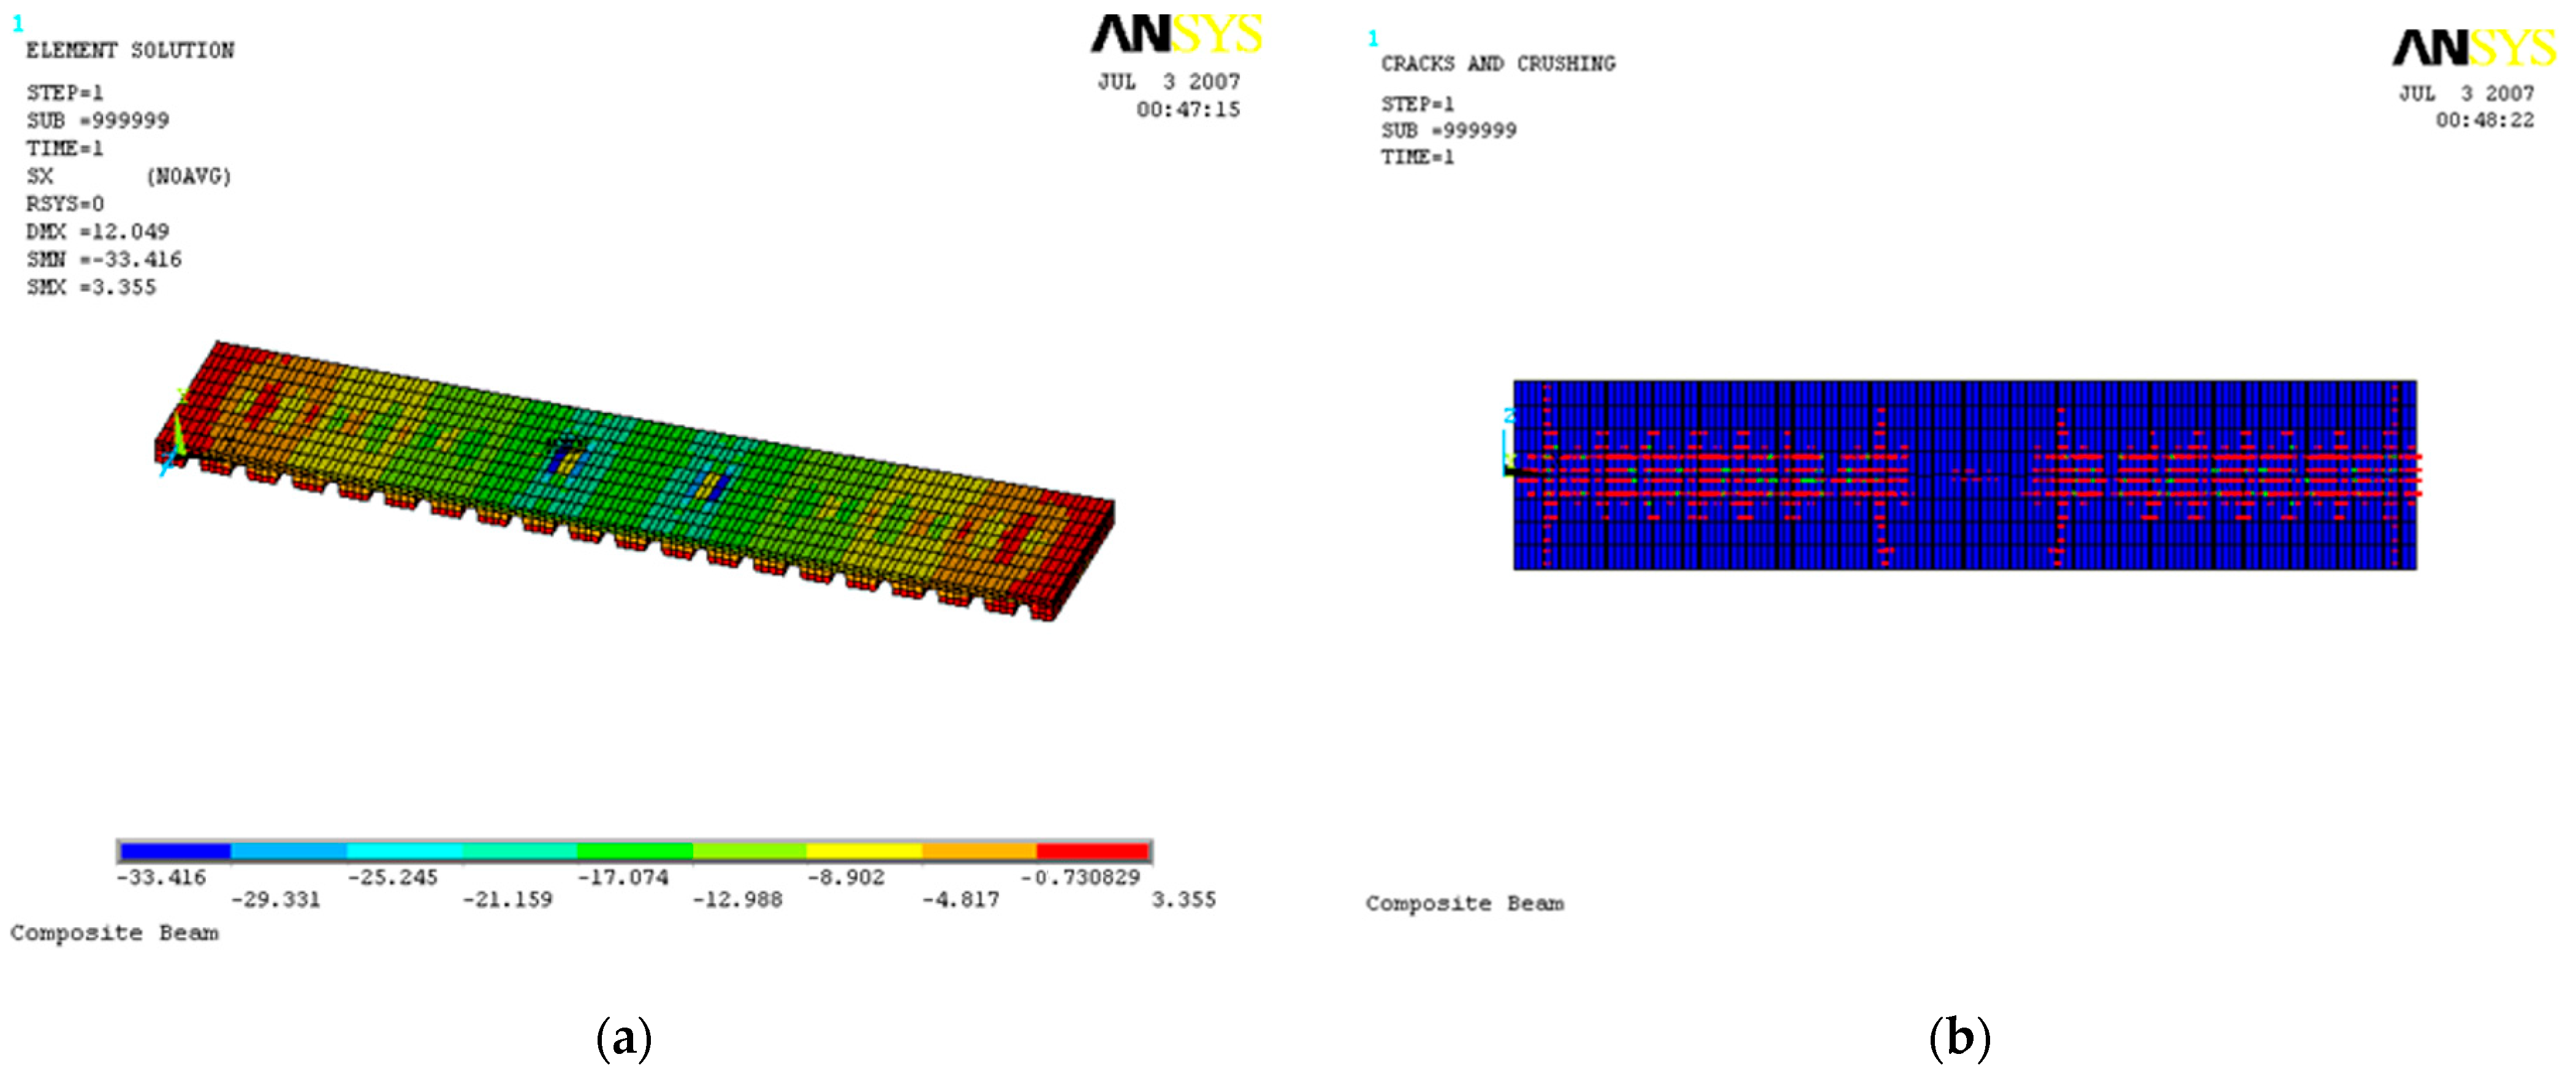
3.3. Simply Supported Composite Beam with Profiled Steel Sheeting
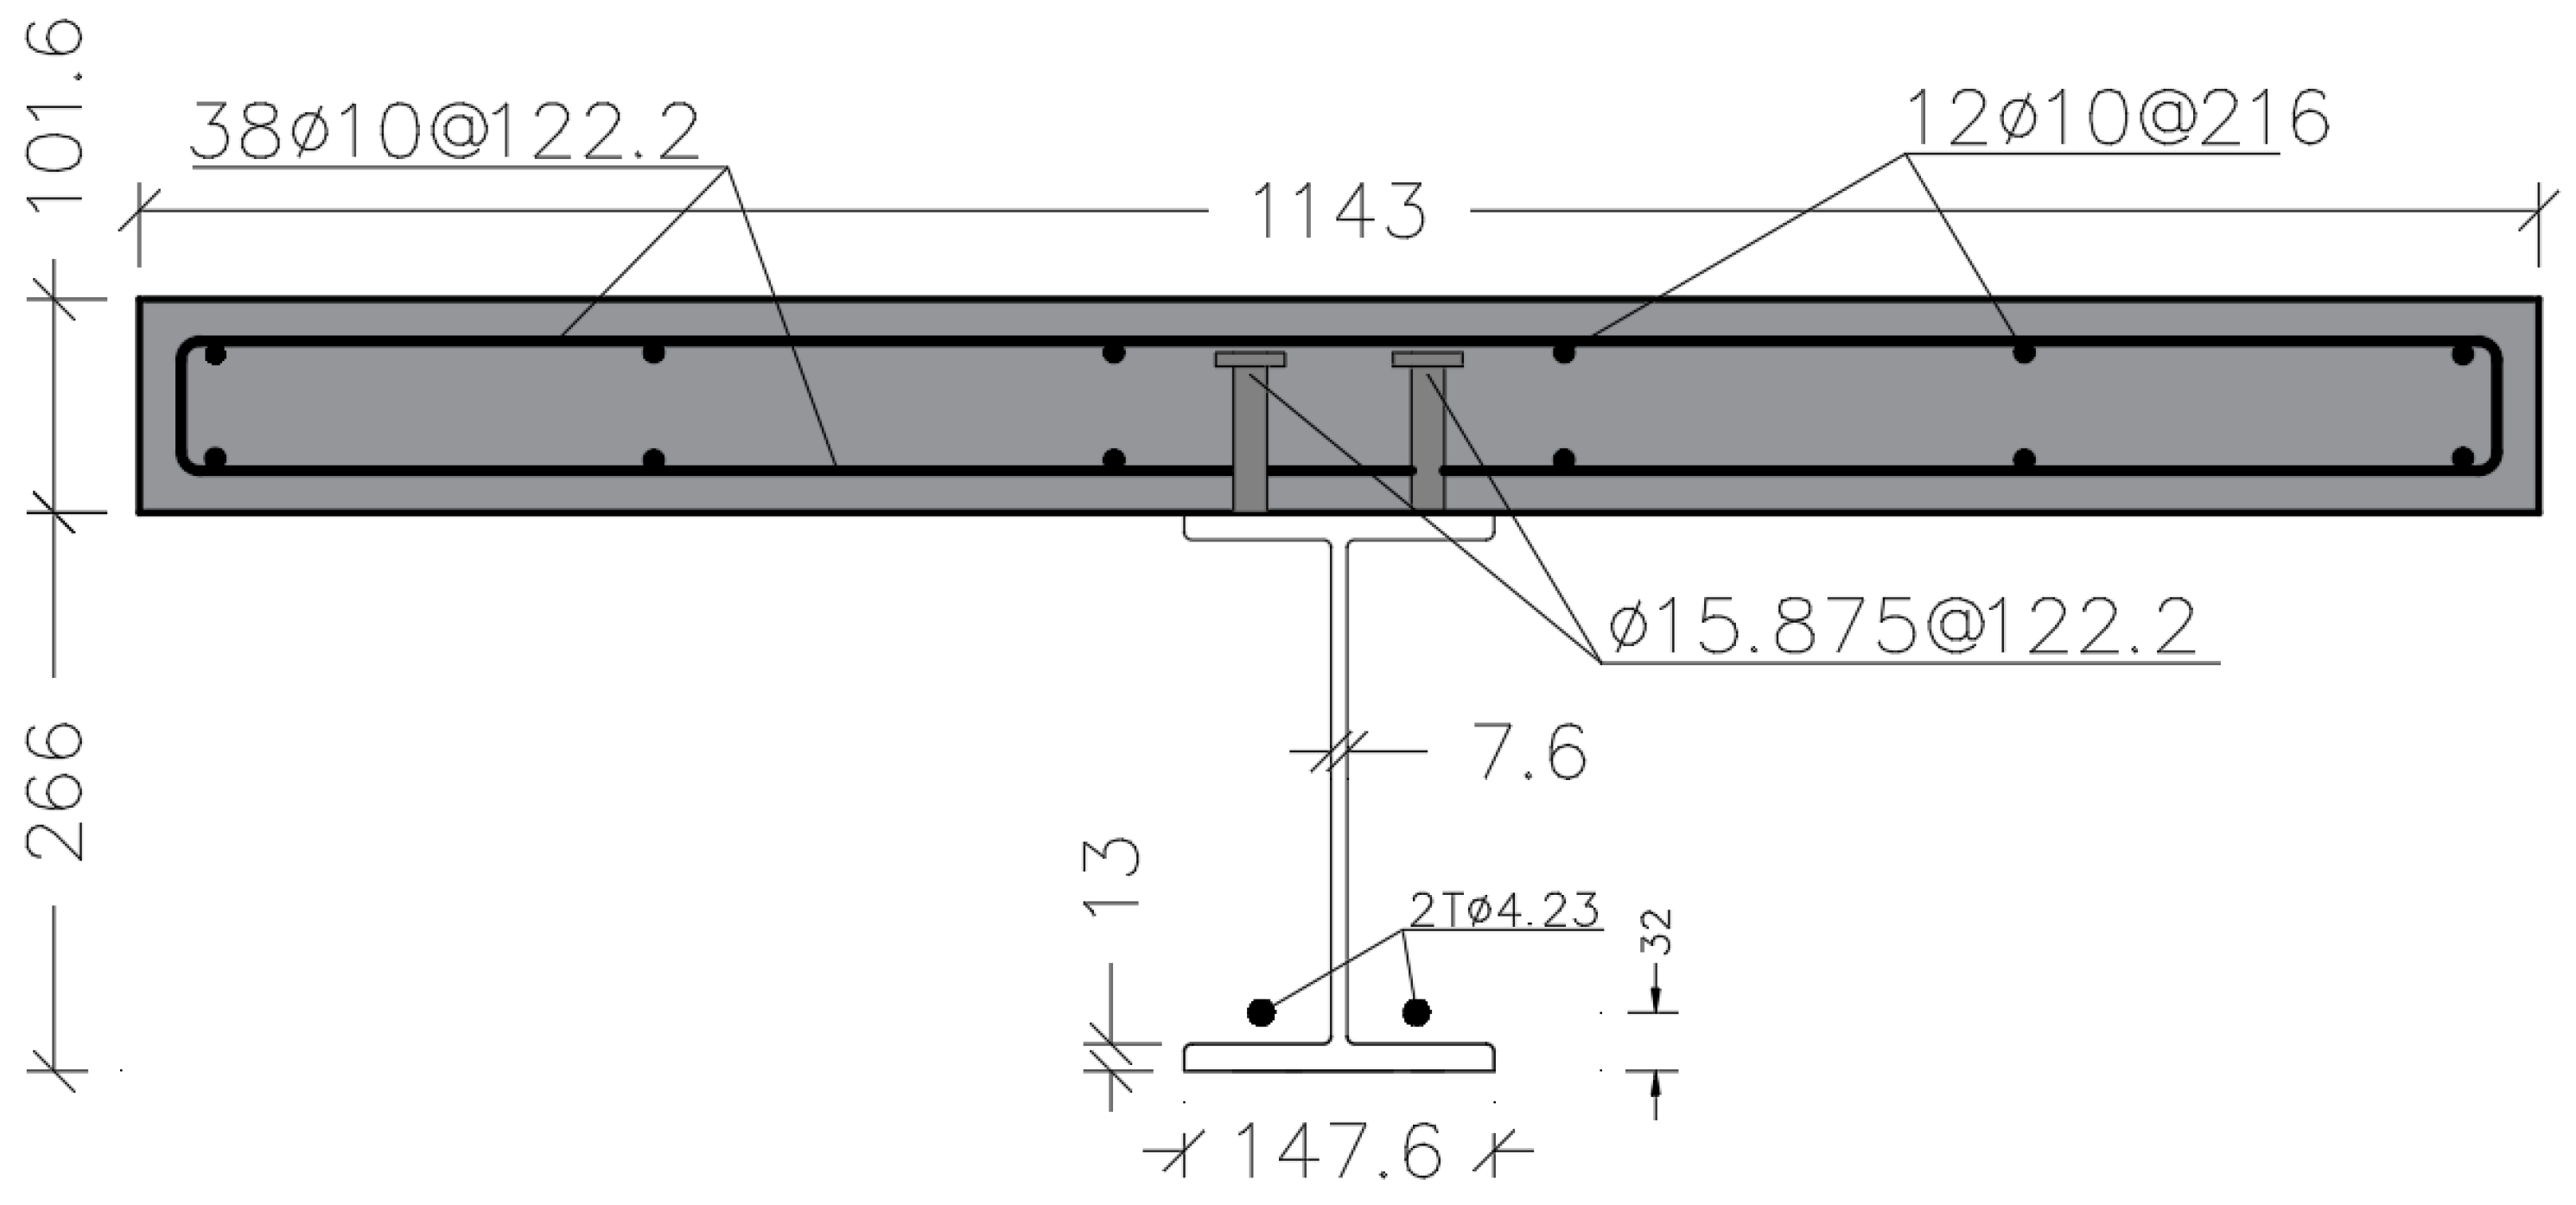
3.4. Post-Tensioned Composite Beam
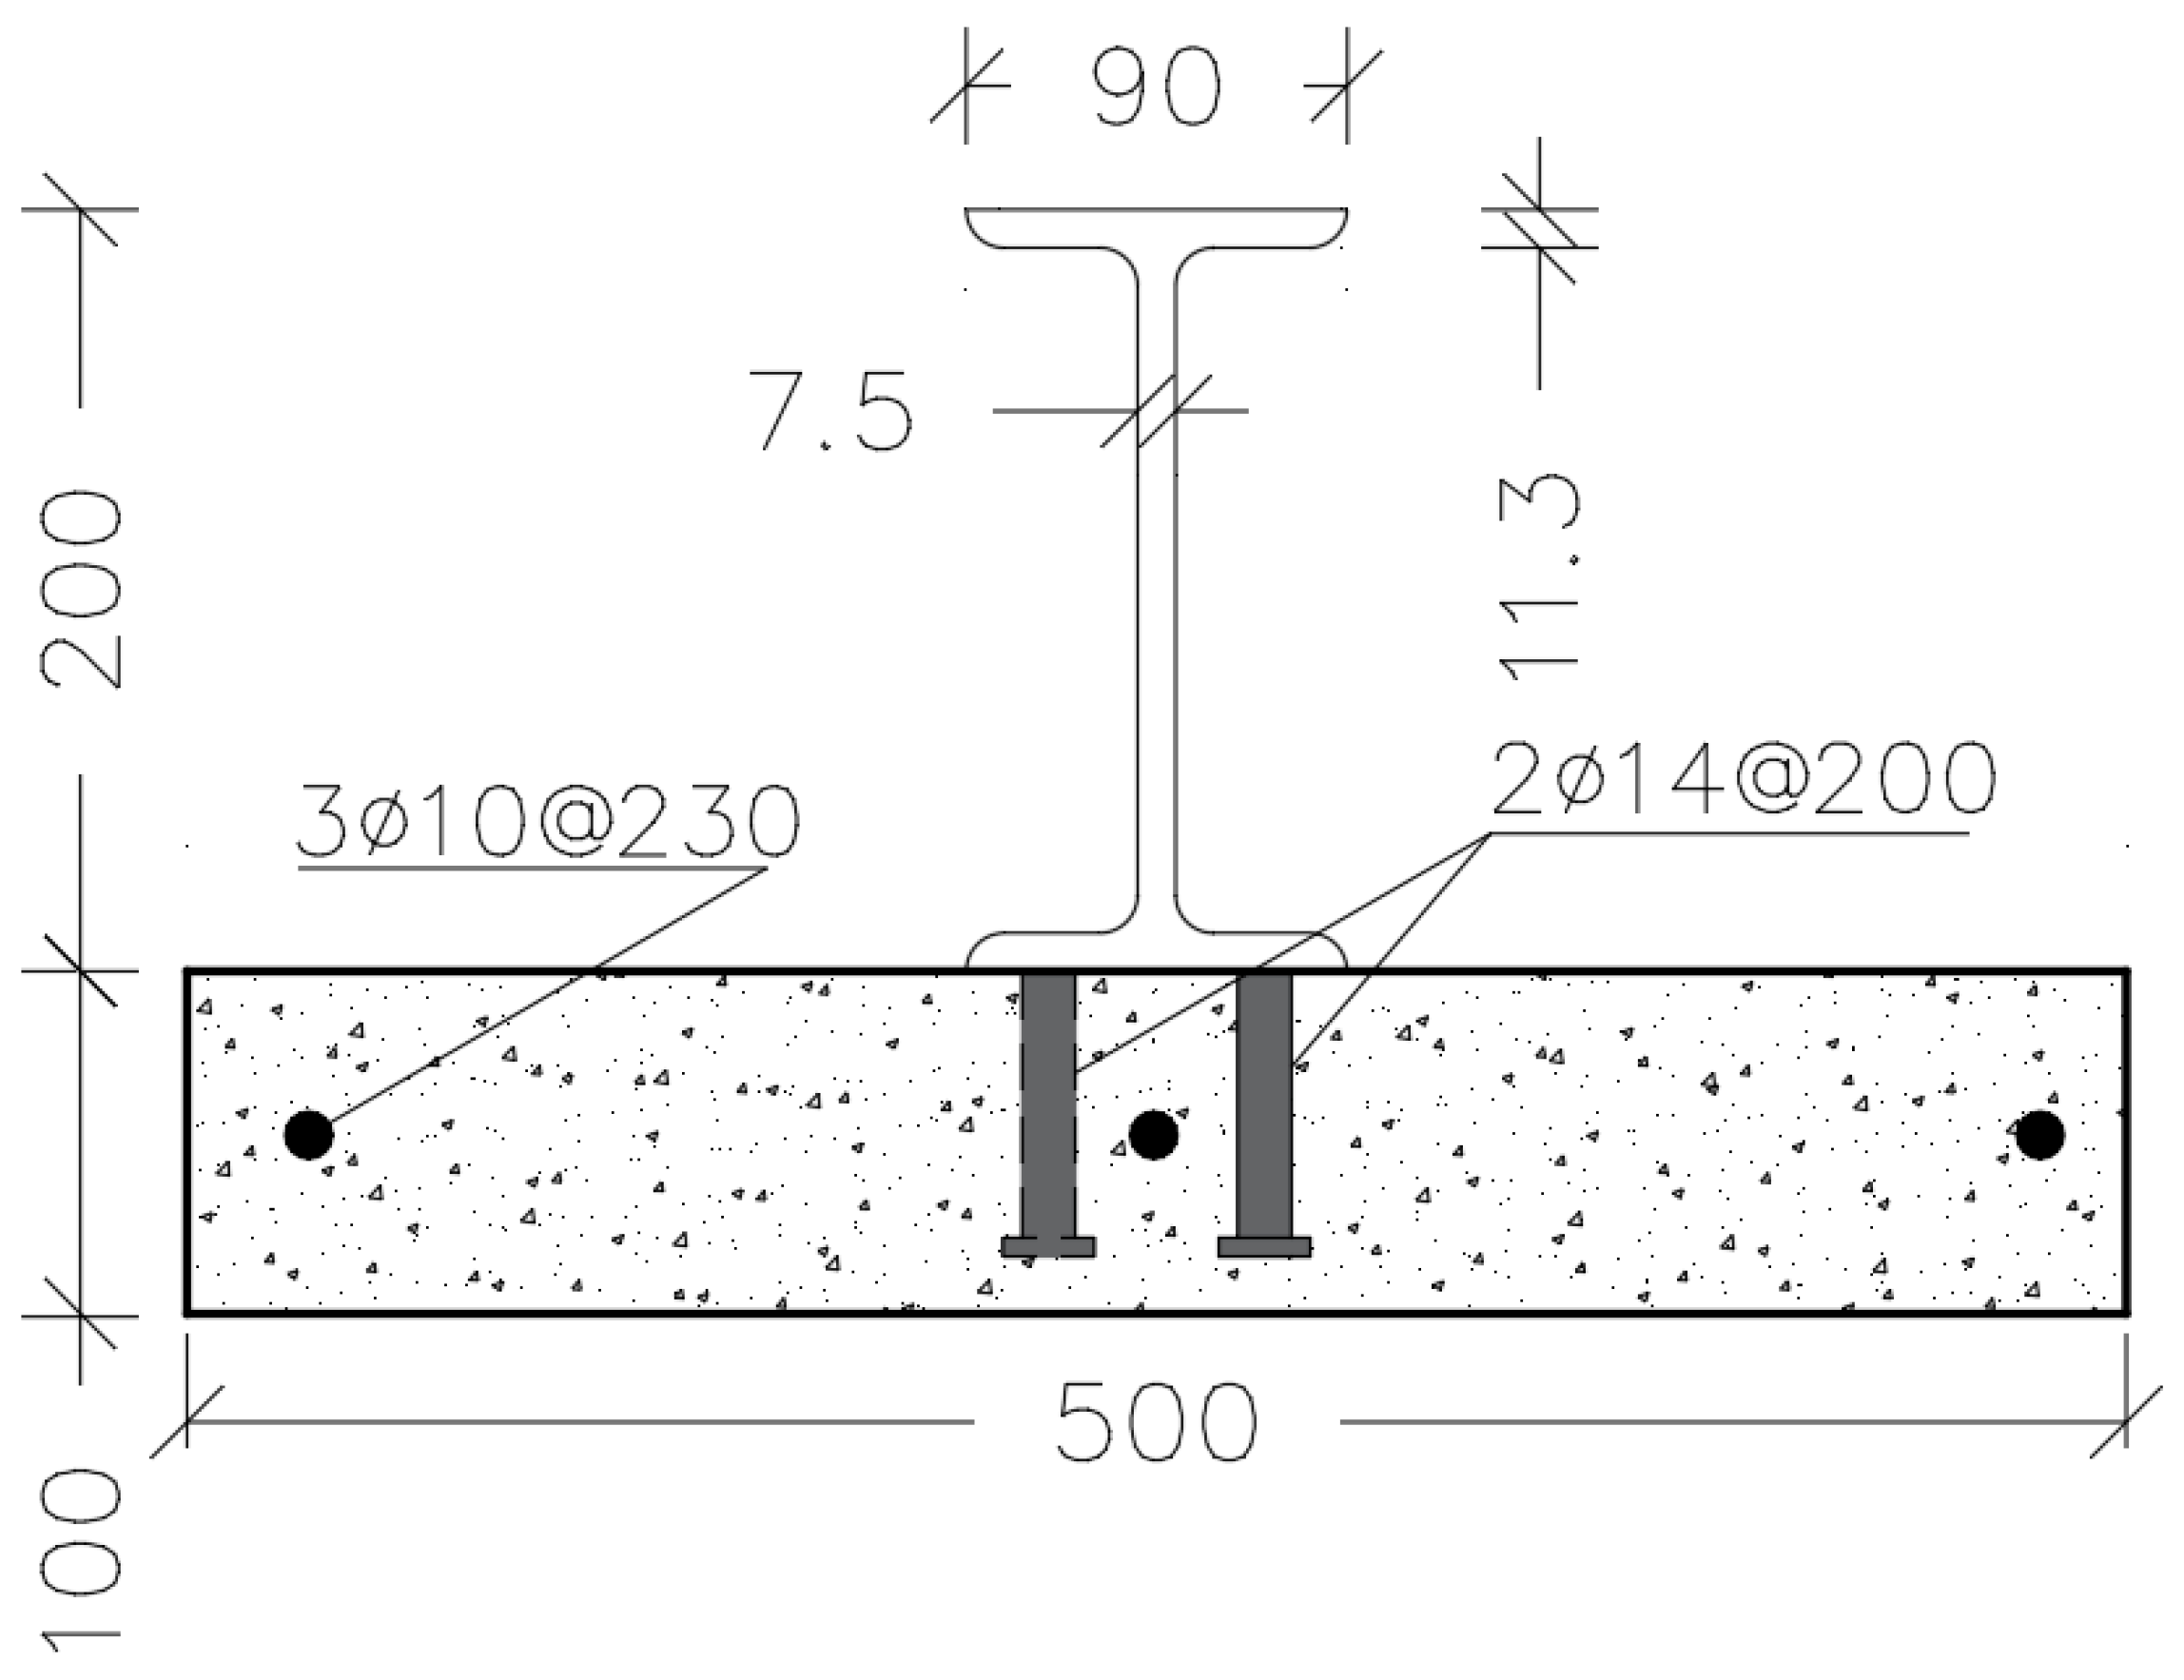
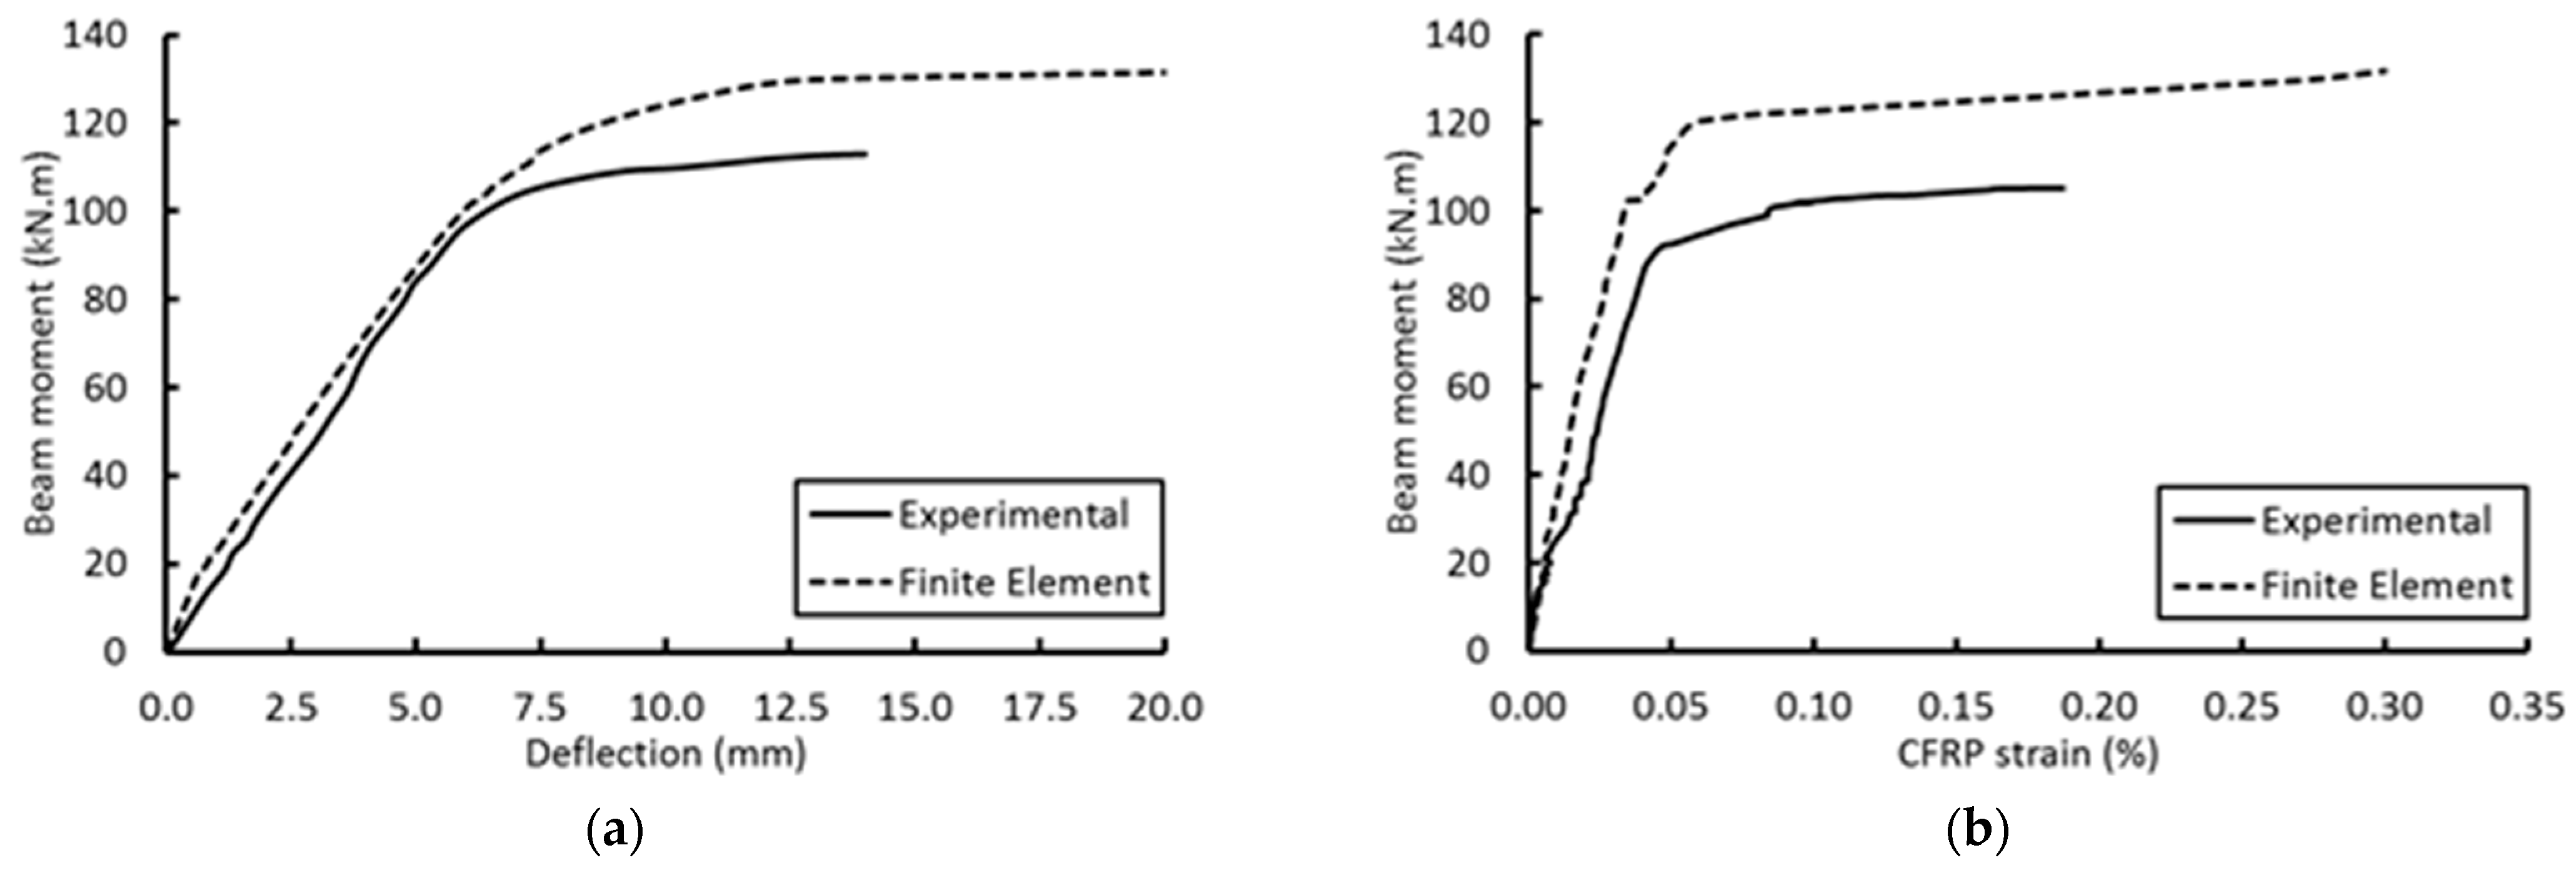
3.5. Strengthened Composite Beam with CFRP Sheet
4. Discussion
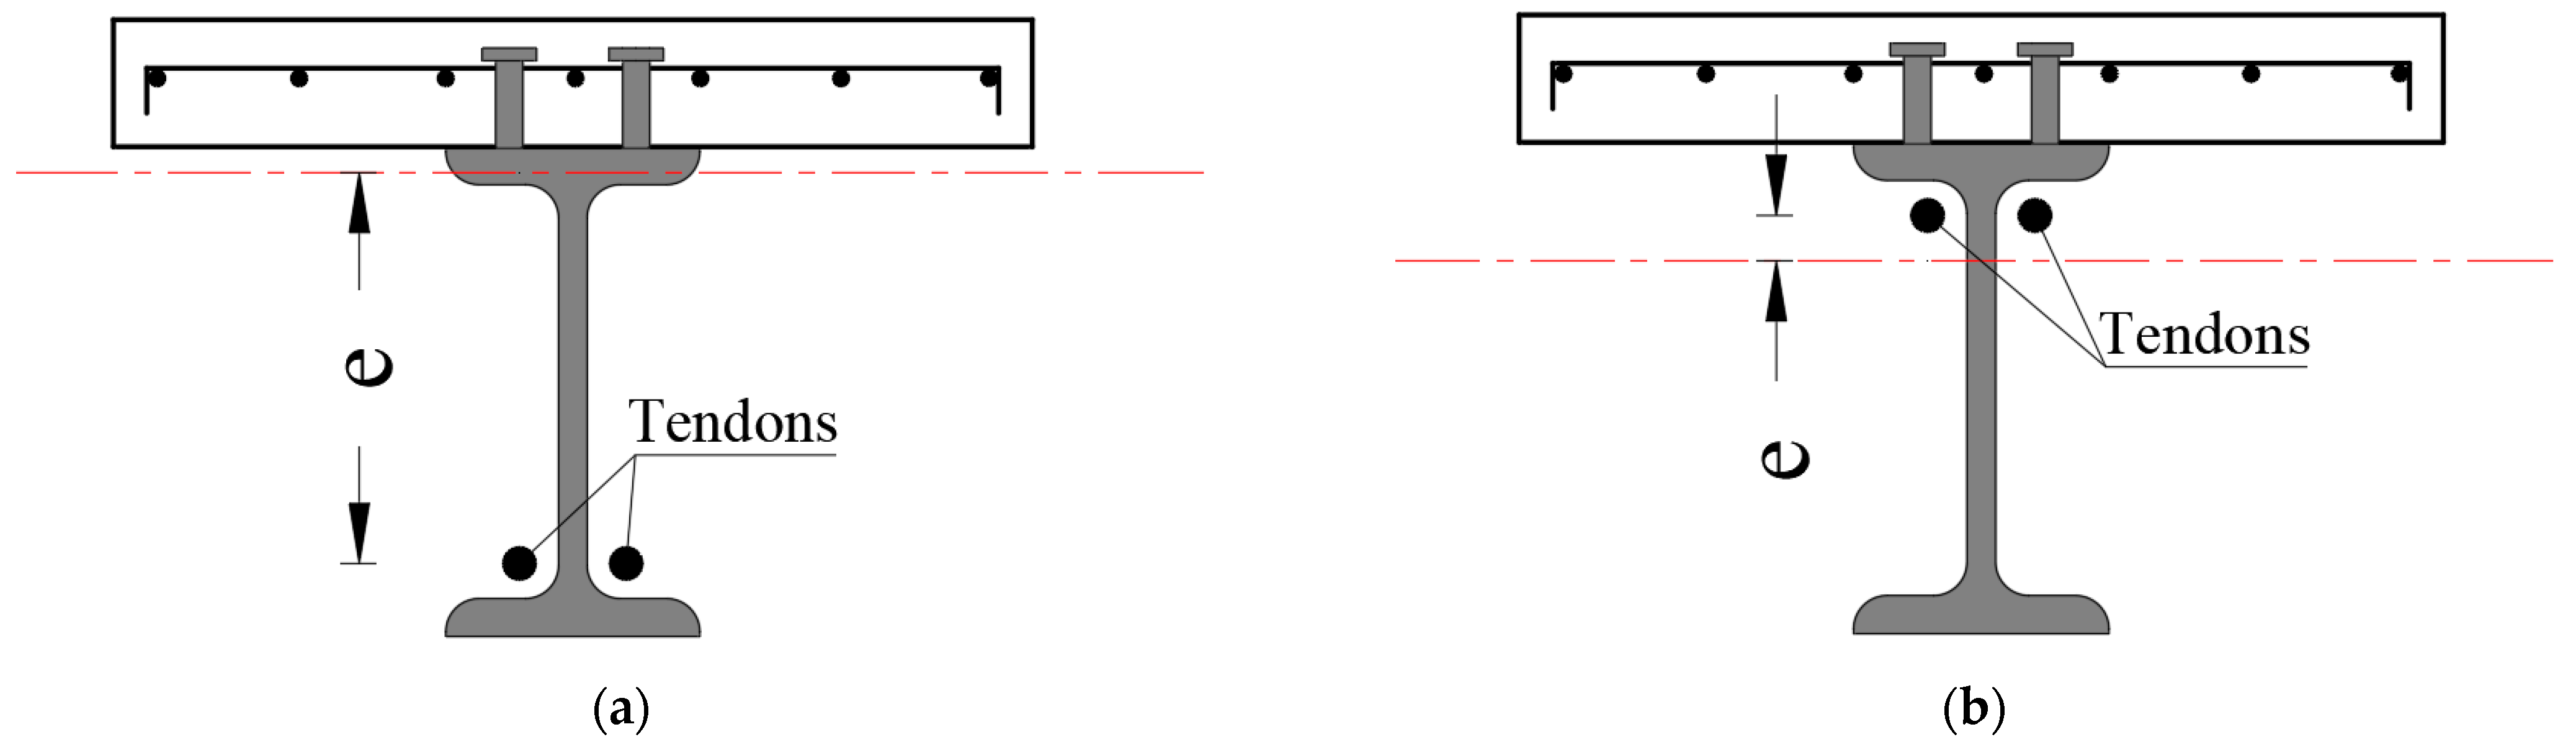
4.1. Effect of the External Post-Tensioning
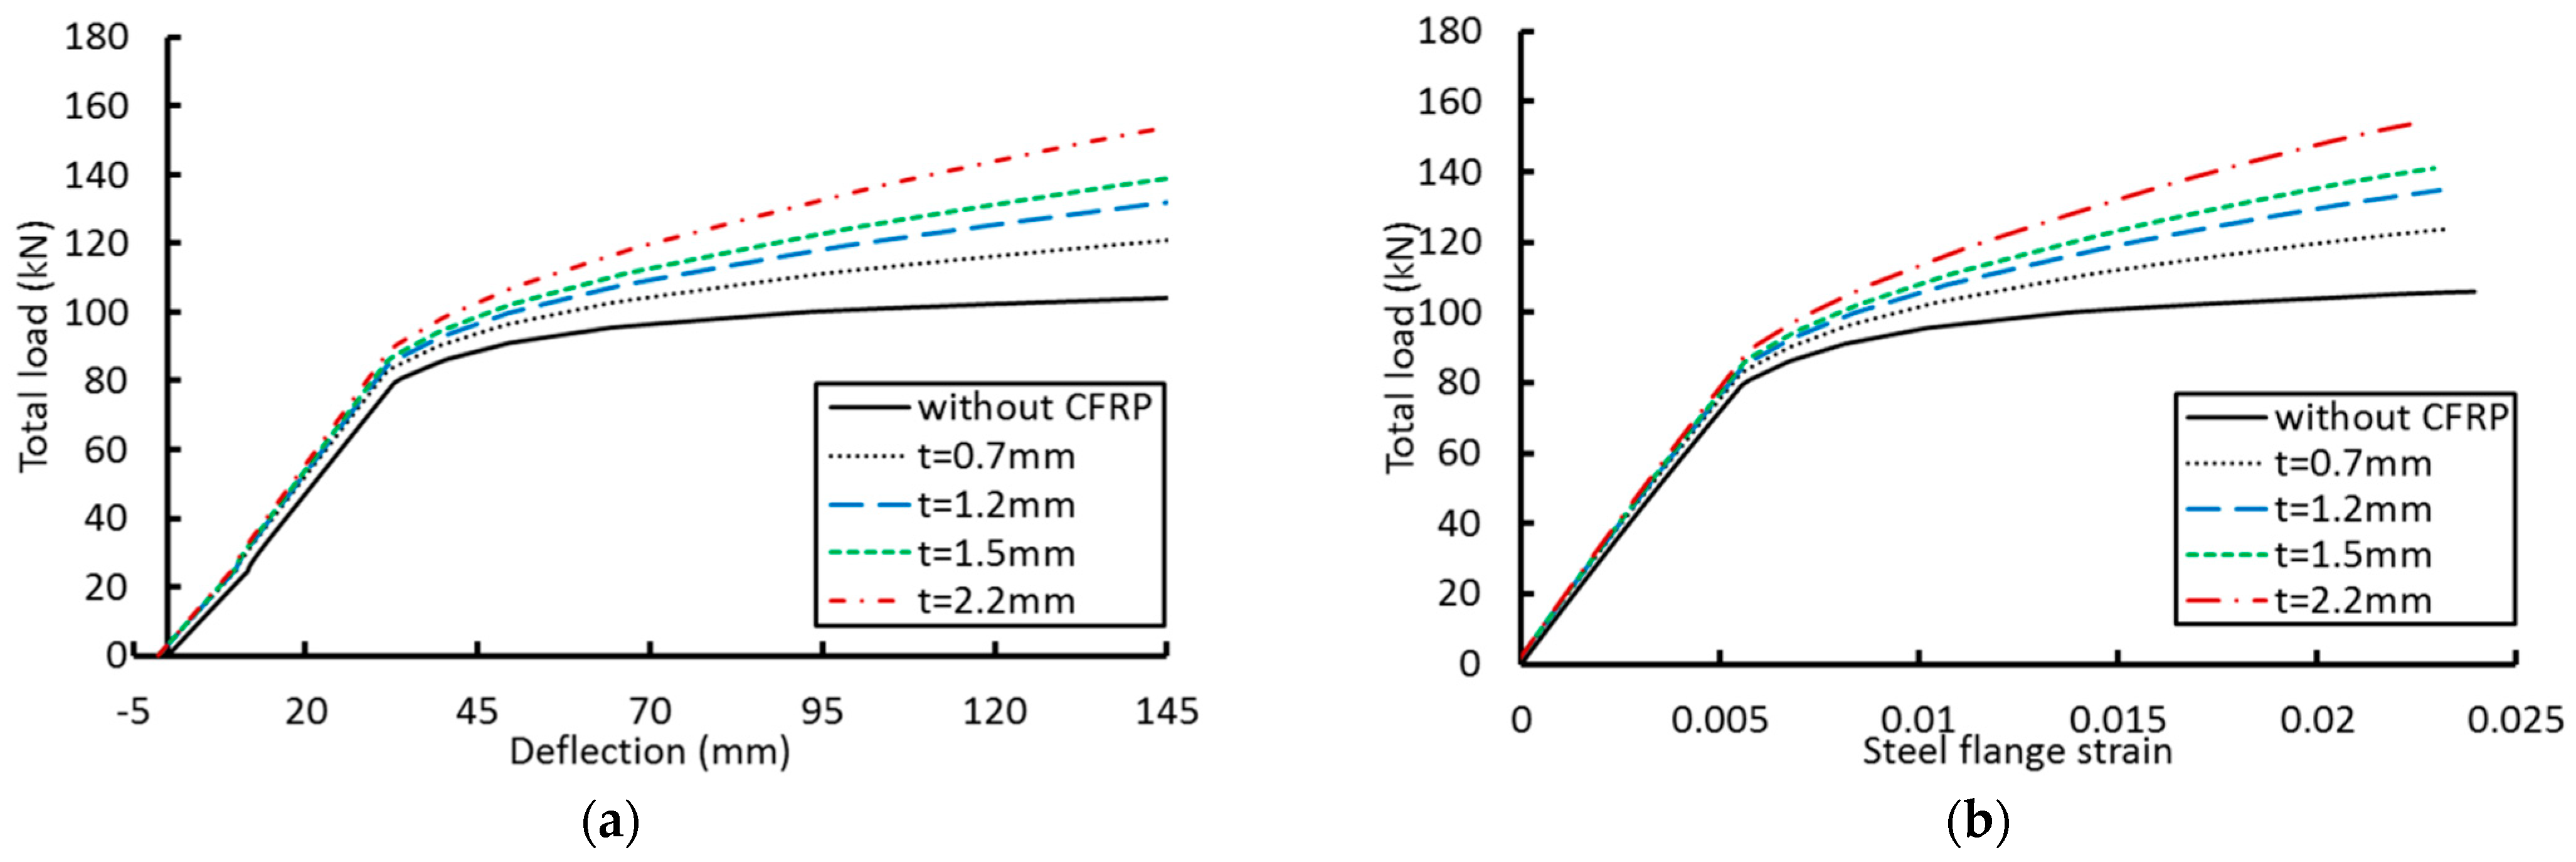
4.2. Effect of the CFRP Laminates
5. Conclusions
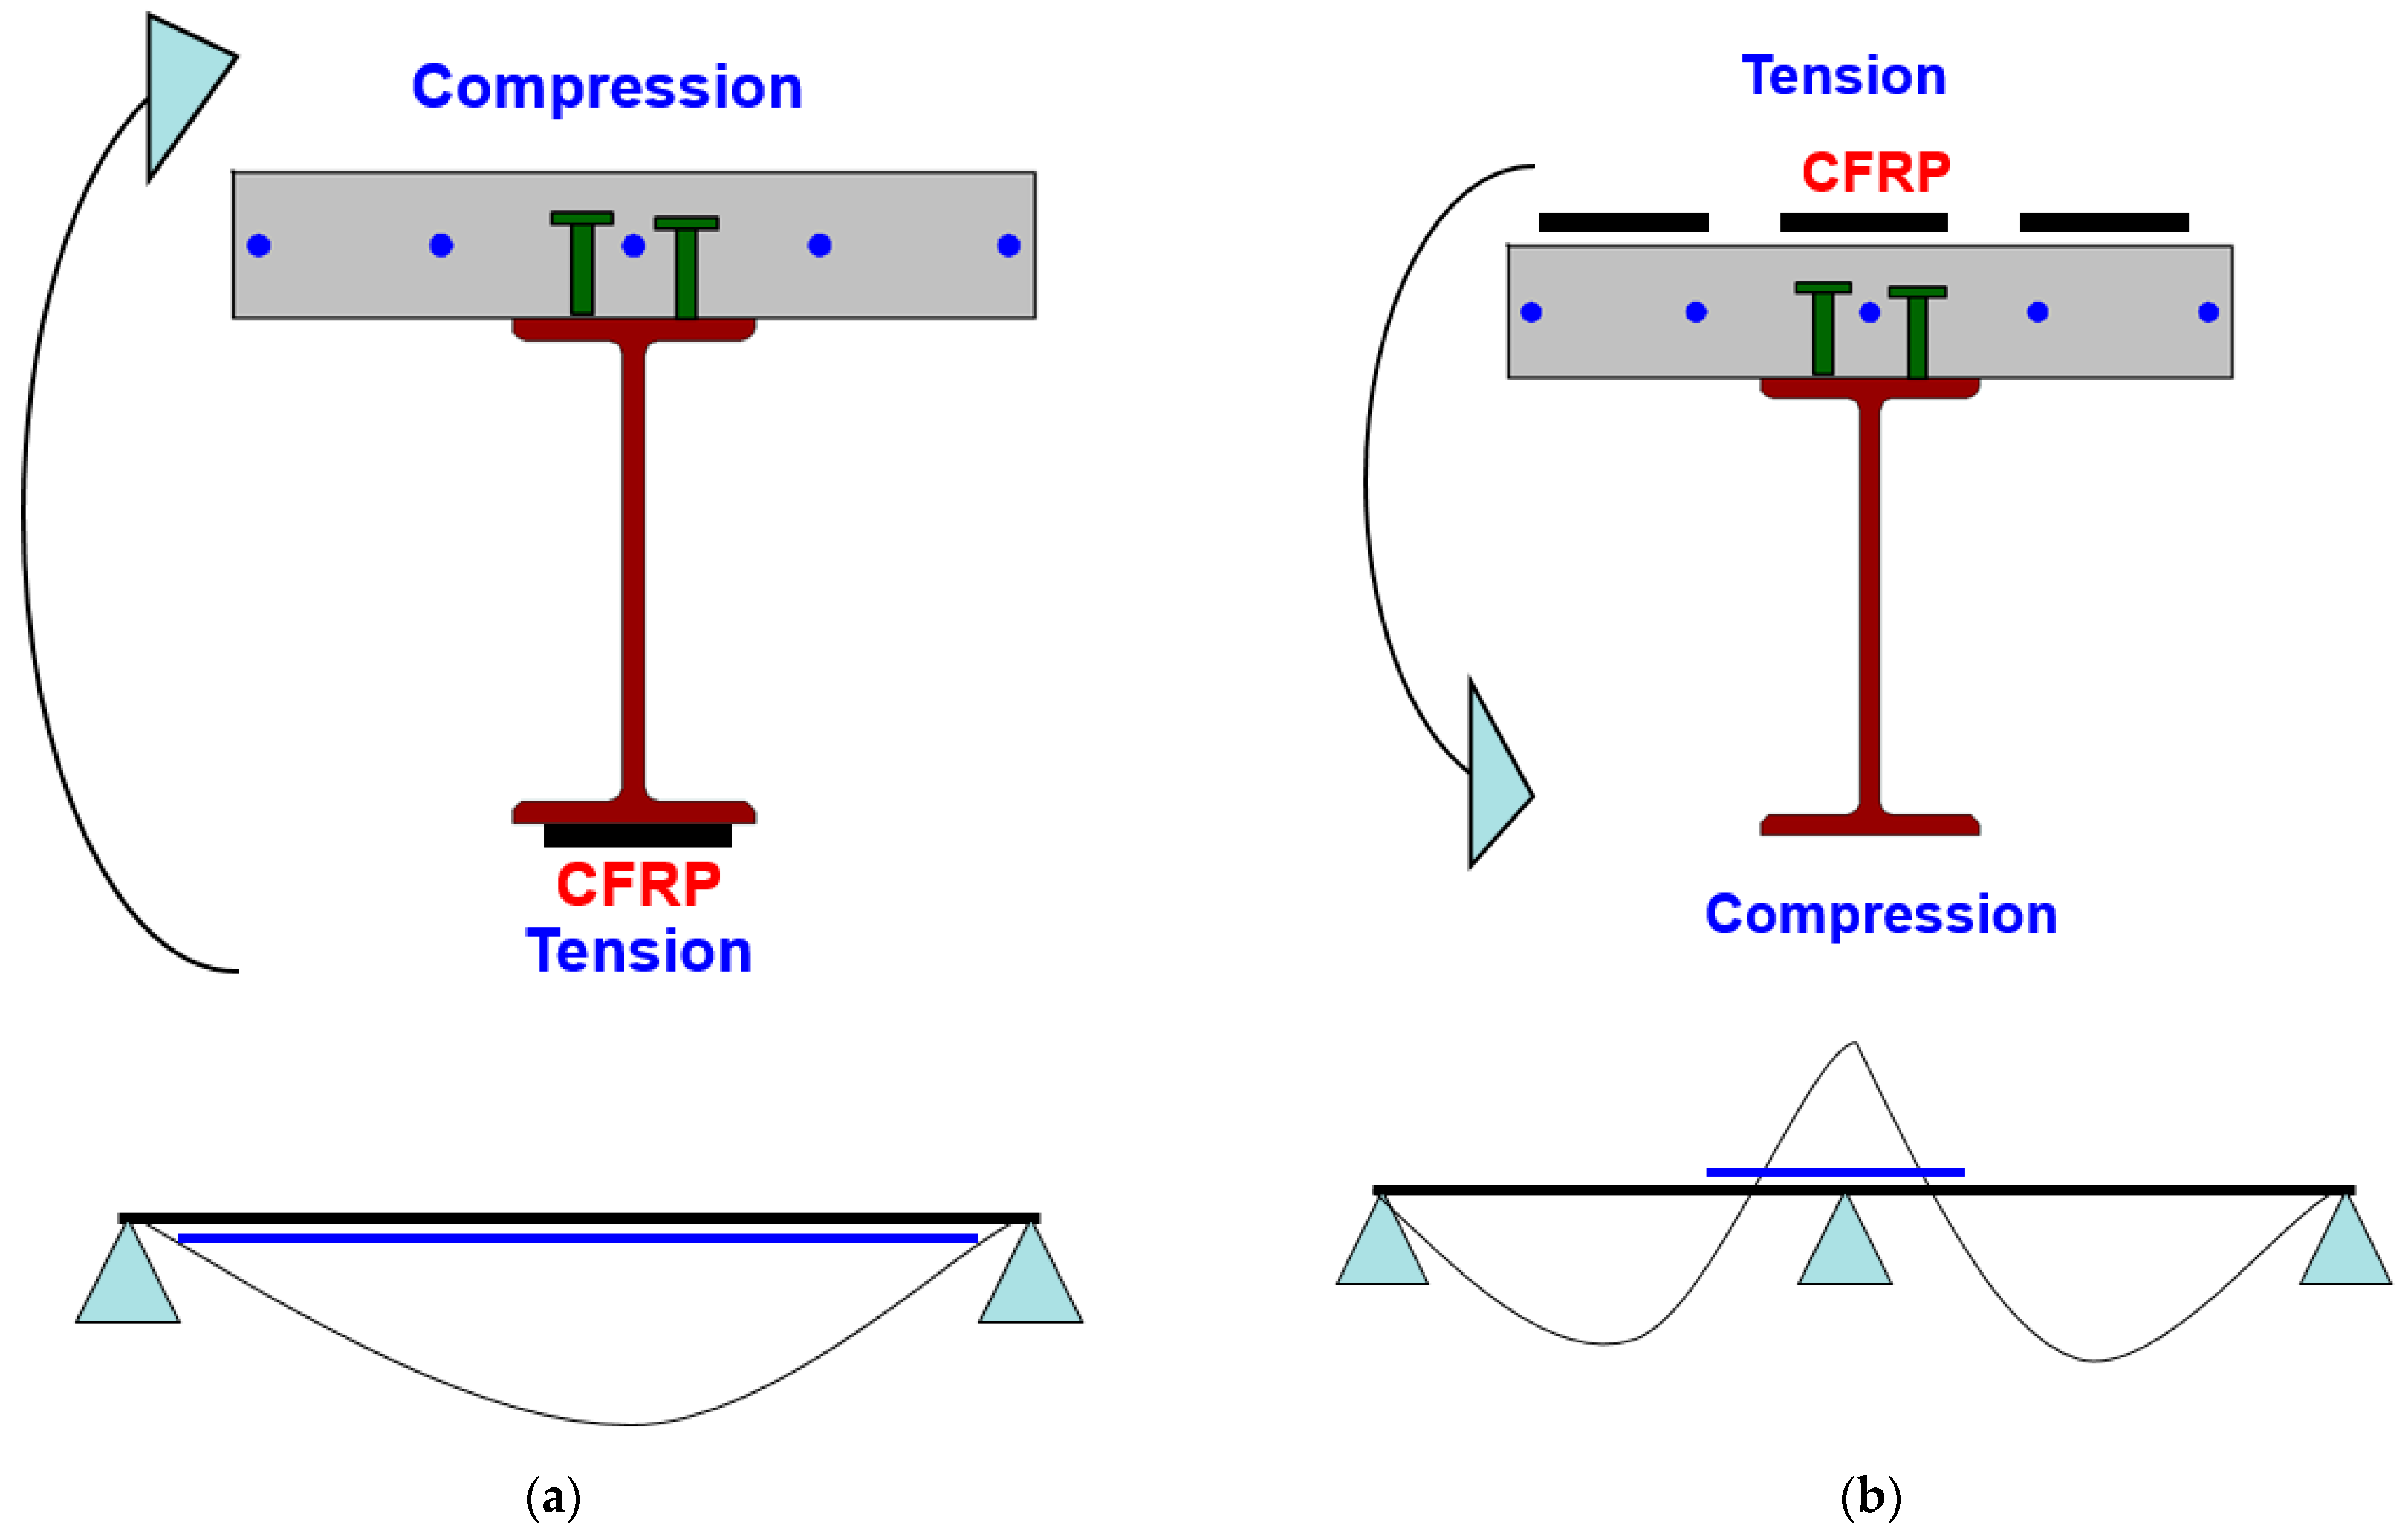
- Applying external post-tensioning at the sagging moment regions is more effective because of the exhibited larger eccentricity. Due to the initial camber and compressive stresses in the bottom flange caused by this reasonable eccentricity, the strengthened beams experience reverse loading that lowers the net tensile stress induced during loading.
- The main issue with the continuous composite beams at the hogging moment regions is that the NA of the composite section is very close to the position of the external post-tensioning. This makes introducing external post-tensioning, as a strengthening technique, not effective because the prestressing force exhibits a small eccentricity, which causes an initial downward deflection. However, initial compressive strains in different parts of the composite section are the main effects of the external post-tensioning application.
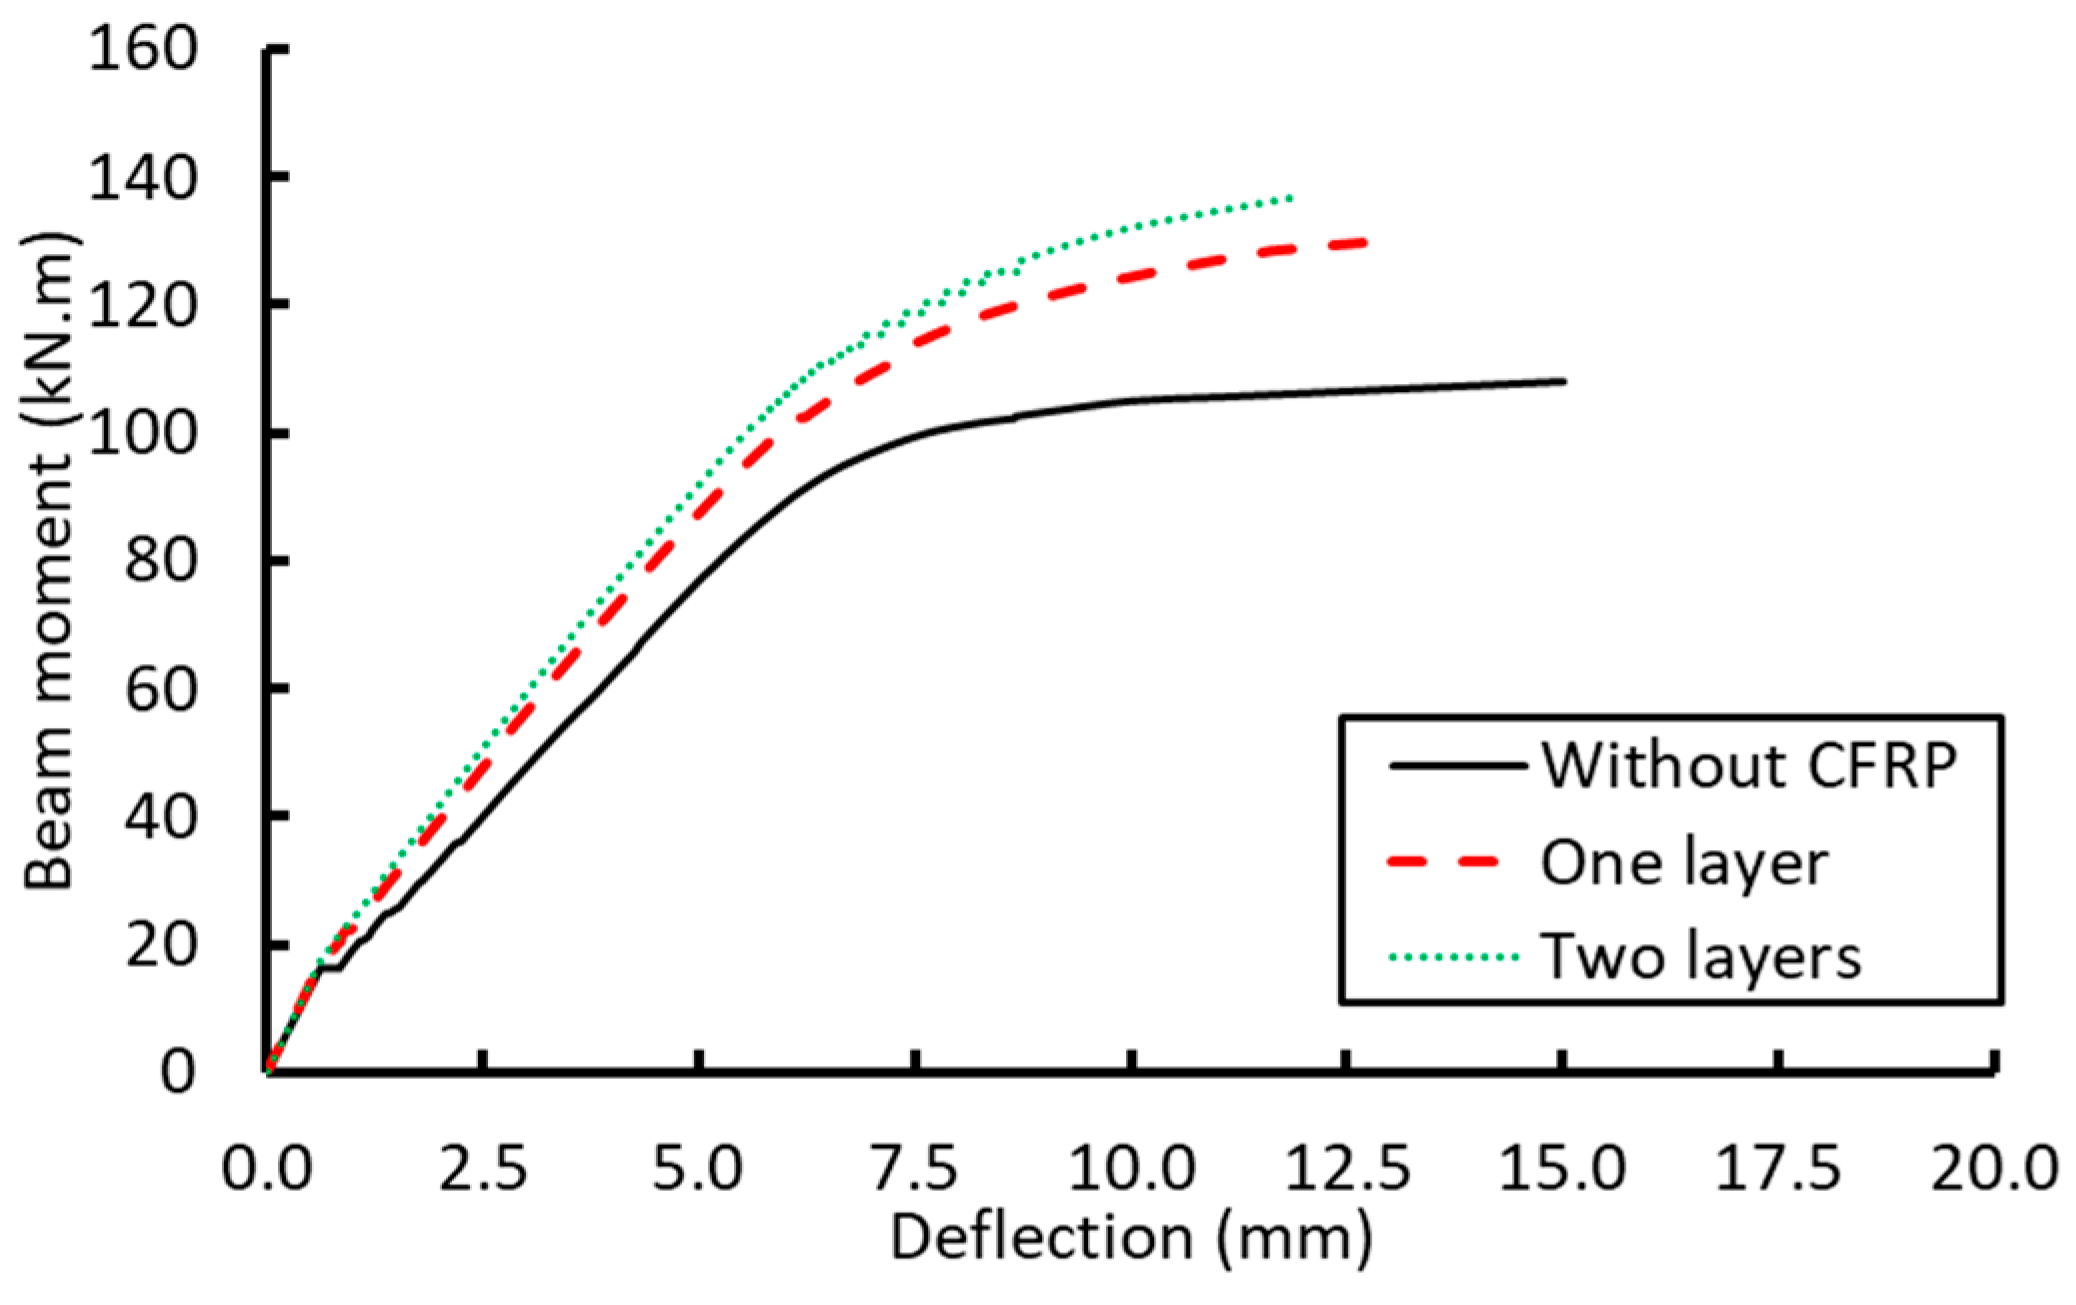
- An improvement was observed in the ultimate capacity of the strengthened beam at the sagging moment region by 25% in comparison with the beam without the CFRP plate.
- Using CFRP laminates on the concrete slab at the hogging moment regions is more effective in enhancing the beam capacity in comparison with using the external post-tension at the hogging moment regions. However, reductions in the beam ductility were obtained.
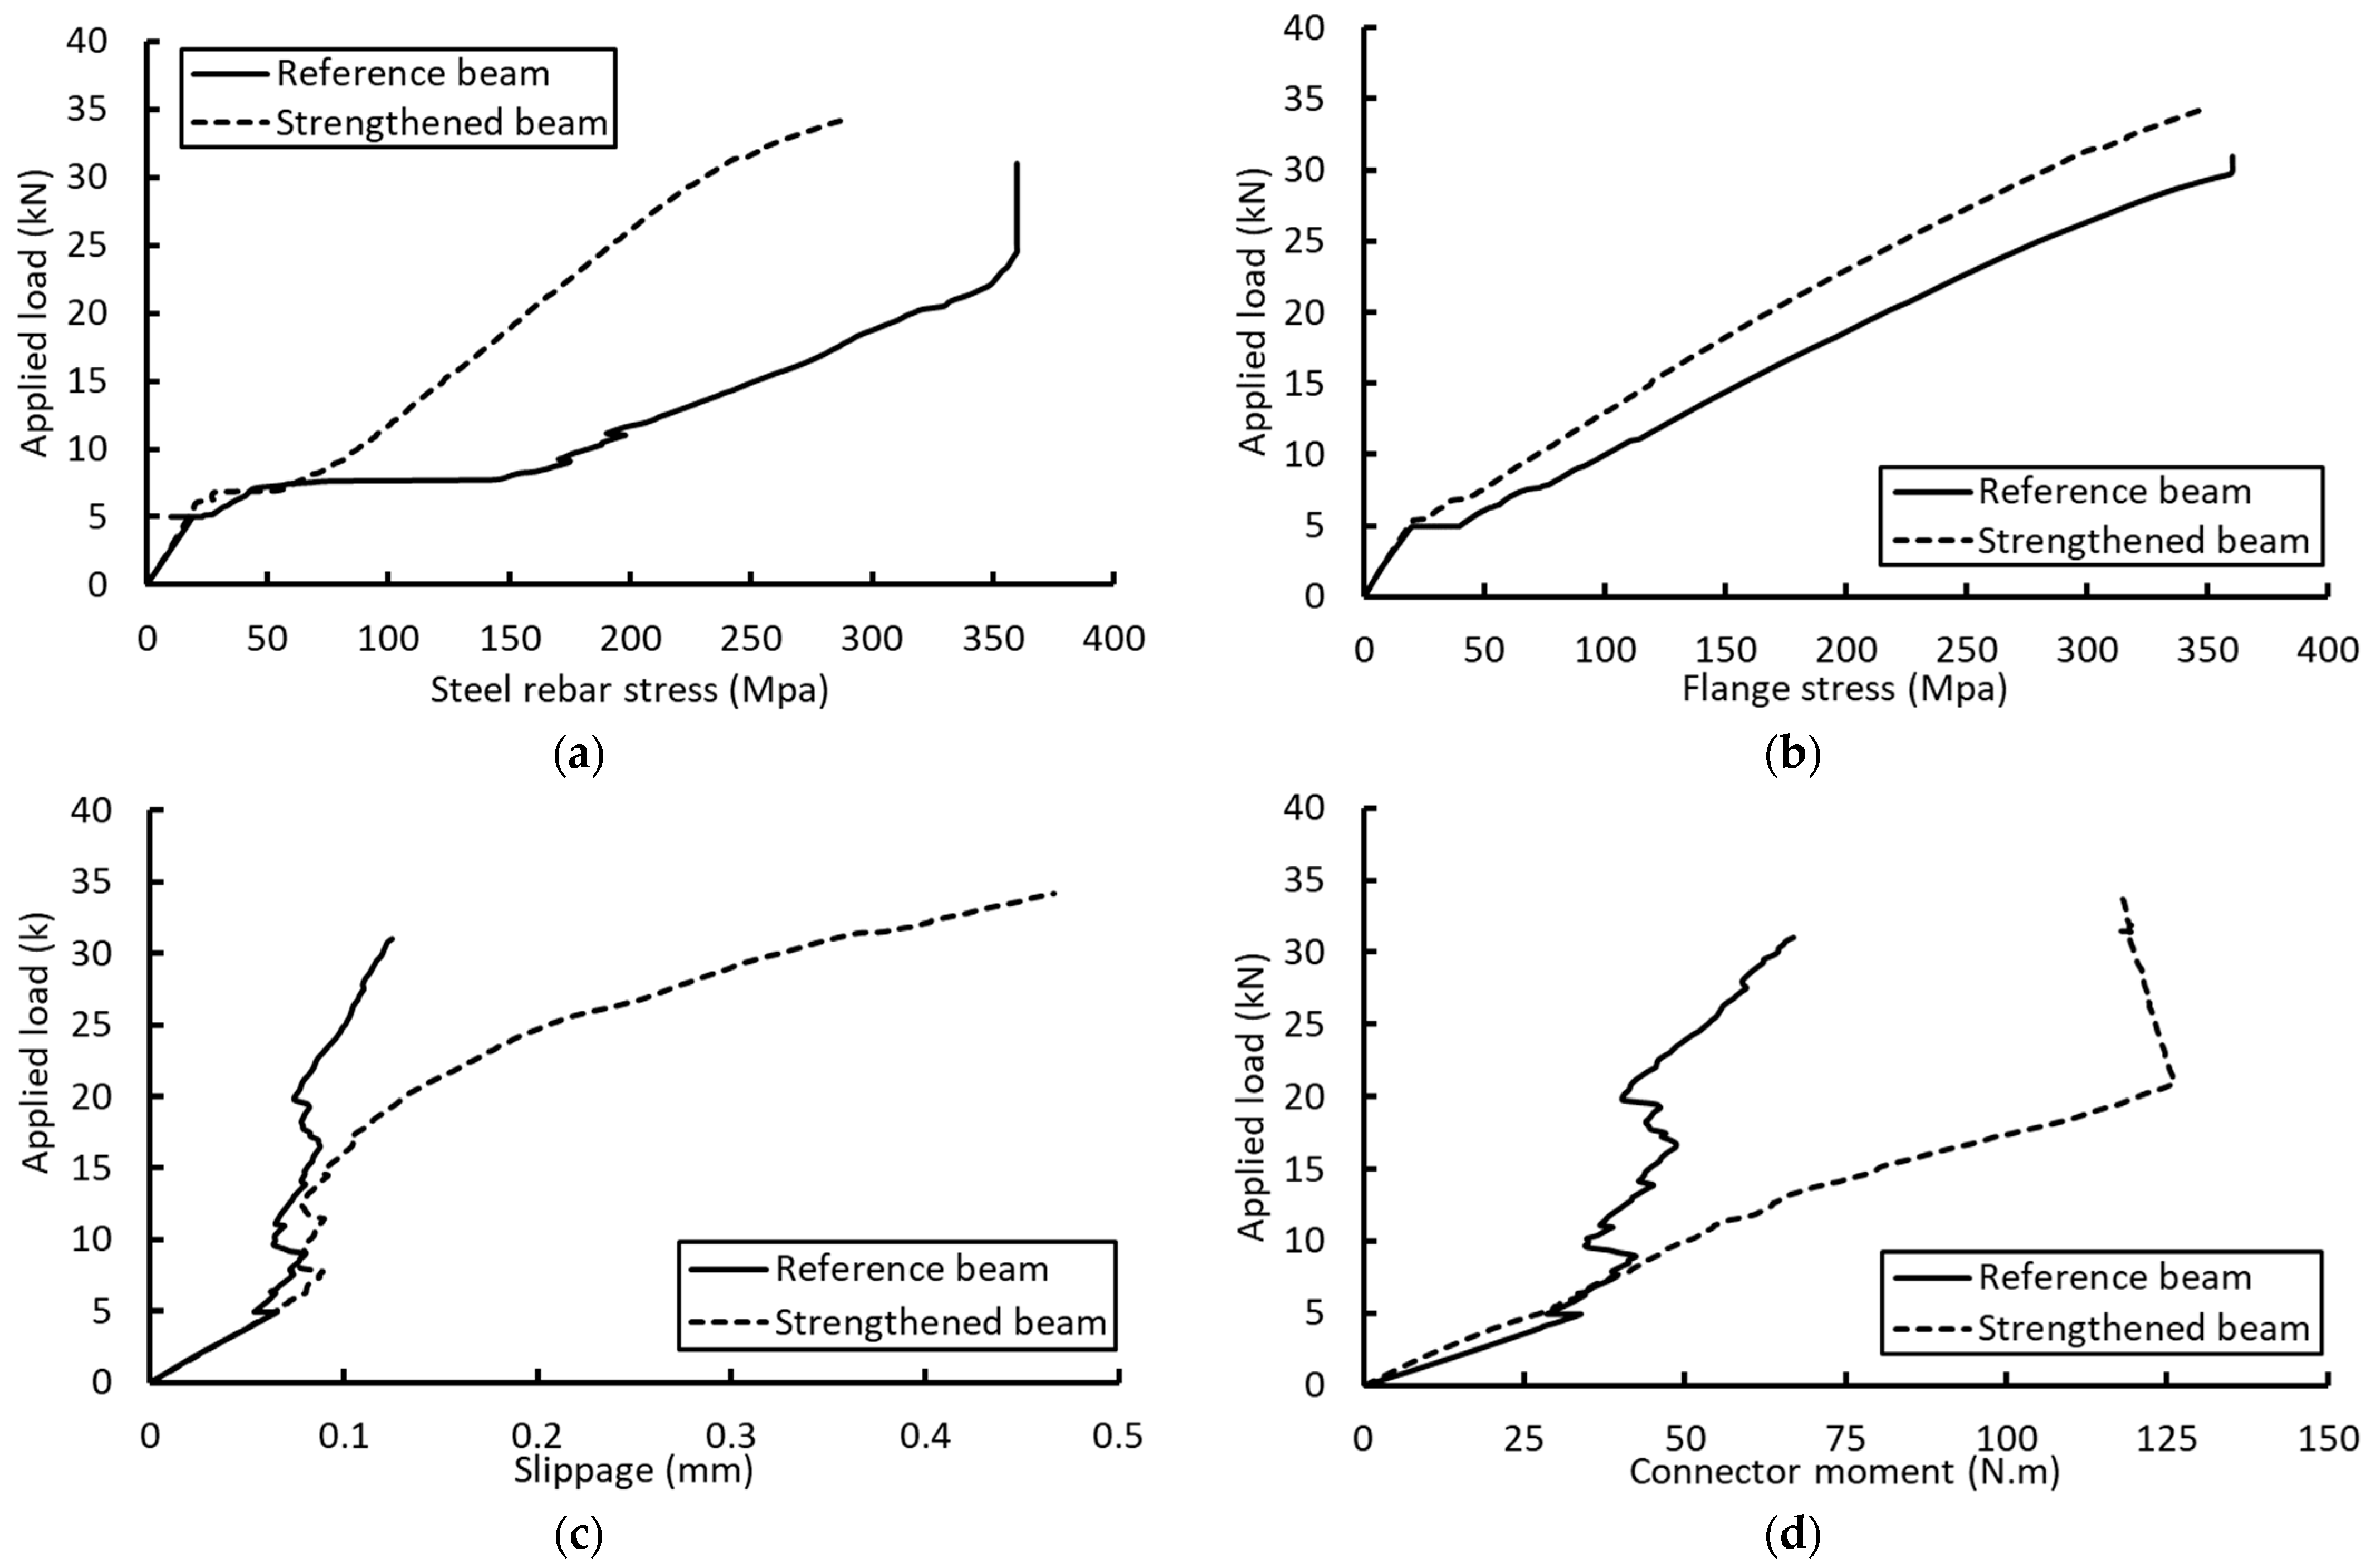
- For continuous composite beams with composite deck, the CFRP strips on the tension side of the composite deck help to relieve parts of the tensile stresses in the steel rebars and steel flange that is attached to the composite deck. However, the CFRP strips maintain the composite deck stiffness which leads to continuous increases in the slippage and induced moments in the shear connectors.
Author Contributions
Funding
Data Availability Statement
Conflicts of Interest
References
- Dabaon, M.A. Effective width of composite beam at region of negative moment. J. Sci. Bull. 2002, 37, 85–109. [Google Scholar]
- Nie, J.; Fan, J.; Cai, C.S. Experimental study of partially shear-connected composite beams with profiled sheeting. J. Eng. Struct. 2008, 30, 1–12. [Google Scholar] [CrossRef]
- Loh, H.; Uy, B.; Bradford, M. The effects of partial shear connection in the hogging moment regions of composite beams. Part I-Experimental study. J. Constr. Steel Res. 2004, 60, 897–919. [Google Scholar] [CrossRef]
- Nie, J.; Cai, C.; Wang, T. Stiffness and capacity of steel–concrete composite beams with profiled sheeting. Eng. Struct. 2005, 27, 1074–1085. [Google Scholar] [CrossRef]
- Marimuthu, V.; Seetharaman, S.; Arul Jayachandran, S.; Chellappan, A.; Bandyopadhyay, T.K.; Dutta, D. Experimental studies on composite deck slabs to determine the shear-bond characteristic (m-k) values of the embossed profiled sheet. J. Constr. Steel Res. 2007, 63, 791–803. [Google Scholar] [CrossRef]
- El-Zohairy, A.; Salim, H.; Saucier, A. Steel–Concrete Composite Beams Strengthened with Externally Post-Tensioned Tendons under Fatigue. J. Bridg. Eng. 2019, 24, 04019027. [Google Scholar] [CrossRef]
- Almeida, M.M.D.R.; de Souza, A.S.C.; de Albuquerque, A.T. Experimental study of prestressed steel-concrete composite beams with profiled steel decking. J. Constr. Steel Res. 2022, 194, 107331. [Google Scholar] [CrossRef]
- Almeida, M.M.D.R.; de Souza, A.S.C.; de Albuquerque, A.T.; Rossi, A. Parametric analysis of steel-concrete composite beams prestressed with external tendons. J. Constr. Steel Res. 2021, 189, 107087. [Google Scholar] [CrossRef]
- El-Zohairy, A.; Salim, H.; Shaaban, H.; Mustafa, S.; El-Shihy, A. Experimental and FE parametric study on continuous steel-concrete composite beams strengthened with CFRP laminates. Constr. Build. Mater. 2017, 157, 885–898. [Google Scholar] [CrossRef]
- El-Shihy, A.M.; Shehab, H.A.; Fawzy, H.M.; Mustafa, S.A.A. Finite element modeling of continuous composite beams. In Proceedings of the International Conference: Future Vision and Challenges for Urban Development, Cairo, Egypt, 10 January 2004. [Google Scholar]
- Sousa, J.B.M.; Silva, A.R. Nonlinear analysis of partially connected composite beams using interface elements. J. Finite Elem. Anal. Des. 2007, 43, 954–964. [Google Scholar] [CrossRef]
- Katwal, U.; Tao, Z.; Hassan, M.K. Finite element modelling of steel-concrete composite beams with profiled steel sheeting. J. Constr. Steel Res. 2018, 146, 1–15. [Google Scholar] [CrossRef]
- Zheng, X.; Li, W.; Huang, Q.; Wang, B. Finite Element Modeling of Steel-concrete Composite Beams with Different Shear Connection Degrees. Int. J. Steel Struct. 2021, 21, 381–391. [Google Scholar] [CrossRef]
- Liang, Q.Q.; Uy, B.; Bradford, M.A.; Ronagh, H.R. Strength Analysis of Steel–Concrete Composite Beams in Combined Bending and Shear. J. Struct. Eng. 2005, 131, 1593–1600. [Google Scholar] [CrossRef]
- El-Zohairy, A.; Salim, H. Parametric study for post-tensioned composite beams with external tendons. Adv. Struct. Eng. 2017, 20, 1433–1450. [Google Scholar] [CrossRef]
- El-Zohairy, A.; Salim, H. Parametric study of the external strengthening of composite beams using post-tensioned ten-dons. In Proceedings of the Structures Congress 2017, Denver, CO, USA, 6–8 April 2017. [Google Scholar]
- El-Zohairy, A.; Salim, H.; Shaaban, H.; Mustafa, S.; El-Shihy, A. Finite element analysis and parametric study of continuous steel–concrete composite beams stiffened with post-tensioned tendons. Adv. Struct. Eng. 2017, 21, 933–945. [Google Scholar] [CrossRef]
- Liang, Q.Q.; Uy, B.; Bradford, M.A.; Ronagh, H.R. Ultimate strength of continuous composite beams in combined bending and shear. J. Constr. Steel Res. 2004, 60, 1109–1128. [Google Scholar] [CrossRef]
- Fahmy, E.H.; Abu-Amra, T.F. Longitudinal cracking of concrete slabs in composite beams with ribbed metal deck. J. Constr. Steel Res. 2008, 64, 670–679. [Google Scholar] [CrossRef]
- ANSYS. Element Manual, 10th ed; Release 4.1; Swanson Analysis Systems: Canonsburg, PA, USA, 2008. [Google Scholar]
- Shah, S.P.; Fafitis, A.; Arnold, R. Cyclic Loading of Spirally Reinforced Concrete. J. Struct. Eng. 1983, 109, 1695–1710. [Google Scholar] [CrossRef]
- Gopinath, S.; Rajasankar, J.; Iyer, N.R.; Krishnamoorthy, T.S.; Bharatkumar, B.H.; Lakshmanan1, N. A Strain-Based Constitutive Model for Concrete under Tension in Nonlinear Finite Element Analysis of RC Flexural Members. Struct. Durab. Health Monit. 2009, 5, 311–336. [Google Scholar]
- Ollgaard, J.G.; Slutter, R.G.; Fisher, J.W. Shear strength of stud connectors in lightweight and normal weight concrete. AISC Eng. J. 1971, 8, 55–64. [Google Scholar]
- Abdel Aziz, K. Modelisation et Etude Experimental de Pouters Mixtes Acier-Beton a Connexion Partielle ou Espacee. Ph.D. Thesis, Institut National des Sciences Appliquees des Rennes, Rennes, France, 1986. [Google Scholar]
- Manfredi, G.; Fabbrocino, G.; Cosenza, E. Modeling of Steel-Concrete Composite Beams under Negative Bending. J. Eng. Mech. 1999, 125, 654–662. [Google Scholar] [CrossRef]
- Ansourian, P. Experiments on continuous composite beams. Proc. Inst. Civ. Eng. 1982, 73, 26–51. [Google Scholar] [CrossRef]
- El-Zohairy, A.; Alsharari, F.; Salim, H.; Arafa, I.T.; Nawar, M.T. Monotonic property of steel–RC composite beams strengthened with externally pre-stressed tendons. Can. J. Civ. Eng. 2022, 49, 1173–1183. [Google Scholar] [CrossRef]
- El-Zohairy, A.; Salim, H.; Shaaban, H.; Mustafa, S.; El-Shihy, A. Finite-Element Modeling of Externally Posttensioned Composite Beams. J. Bridg. Eng. 2015, 20, 04015018. [Google Scholar] [CrossRef]
- Aly, M.Y. Strengthening Steel-Concrete Composite Girders Using Prestressed Fiber Reinforced Polymer. Master’s Thesis, University of Calgary, Calgary, AB, Canada, 2007. [Google Scholar]
- Huh, J.; Haldar, A. Stochastic Finite-Element-Based Seismic Risk of Nonlinear Structures. J. Struct. Eng. 2001, 127, 323–329. [Google Scholar] [CrossRef]
- Mahmoud, M.H.; Afefy, H.M.E. Moment redistribution and ductility of RC continuous beams strengthened with CFRP strips. Int. J. Civil Eng. Res. 2012, 3, 241–255. [Google Scholar]


| Material | Property | Value |
|---|---|---|
| Concrete | Compressive strength, (MPa) | 35 |
| Corresponding strain, | 0.00195 | |
| Tensile strength, (MPa) | 3.5 | |
| Ec (MPa) | 2.65 × 10⁴ | |
| Poisson’s ratio | 0.2 | |
| A | 1.477 | |
| K | 0.081 | |
| Reinforcing steel | Ultimate tensile strength, (MPa) | 375 |
| Yield stress, (MPa) | 370 | |
| Yield strain, | 0.00176 | |
| Ultimate strain, | 0.04 | |
| Es (MPa) | 2.1 × 10⁵ | |
| Poisson’s ratio | 0.3 | |
| Structural steel | Ultimate tensile strength, (MPa)/Ultimate strain, | |
| Web | 372/0.04 | |
| Flange | 361/0.03 | |
| Yield stress, (MPa)/Yield strain, | ||
| Web | 260/0.00124 | |
| Flange | 245/0.00117 | |
| Es (MPa) | 2.1 × 10⁵ | |
| Poisson’s ratio | 0.3 | |
| Stud shear connector | Number of studs | 18 |
| Number of rows | 2 | |
| Spacing between studs (mm) | 650 | |
| Diameter of studs (mm) | 19 | |
| Shear force strength (kN) | 130 | |
| Es (MPa) | 2.1 × 10⁵ | |
| Poisson’s ratio | 0.3 | |
| α | 0.8 | |
| β | 0.7 |
| Material | Property | Value |
|---|---|---|
| Concrete | Compressive strength, (MPa) | 35 |
| Corresponding strain, | 0.00195 | |
| Tensile strength, (MPa) | 3.5 | |
| Ec (MPa) | 2.65 × 10⁴ | |
| Poisson’s ratio | 0.2 | |
| A | 1.477 | |
| K | 0.081 | |
| Reinforcing steel | Ultimate tensile strength, (MPa) | 533 |
| Yield stress, (MPa) | 430 | |
| Yield strain, | 0.002 | |
| Ultimate strain, | 0.04 | |
| Es (MPa) | 2.10 × 10⁵ | |
| Poisson’s ratio | 0.3 | |
| Structural steel | Ultimate tensile strength, (MPa)/Ultimate strain, | |
| Web | 411/0.04 | |
| Flange | 390/0.03 | |
| Yield stress, (MPa)/Yield strain, | ||
| Web | 235/0.0011 | |
| Flange | 220/0.0010 | |
| Es: (MPa) | 2.10 × 10⁵ | |
| Poisson’s ratio | 0.3 | |
| Stud shear connector | Number of studs | 84 |
| Number of rows | 3 | |
| Yield stress, (MPa) | 435 | |
| Ultimate strength, (MPa) | 565 | |
| Es (MPa) | 2.10 × 10⁵ | |
| Poisson’s ratio | 0.3 | |
| Ultimate strain | 0.25 |
| Material | Property | Value |
|---|---|---|
| Concrete | Compressive strength, (MPa) | 34.9 |
| Corresponding strain, | 0.00195 | |
| Tensile strength, (MPa) | 3.5 | |
| Ec (MPa) | 2.65 × 10⁴ | |
| Poisson’s ratio | 0.2 | |
| A | 1.48 | |
| K | 0.081 | |
| Reinforcing steel | Ultimate tensile strength, (MPa) | 375 |
| Yield stress, (MPa) | 291 | |
| Yield strain, | 0.00138 | |
| Ultimate strain, | 0.04 | |
| Es (MPa) | 2.1 × 10⁵ | |
| Poisson’s ratio | 0.3 | |
| Structural steel | Ultimate tensile strength, (MPa)/Ultimate strain, | |
| Web | 372/0.04 | |
| Flange | 361/0.03 | |
| Yield stress, (MPa)/Yield strain, | ||
| Web | 260/0.00123 | |
| Flange | 245/0.00117 | |
| Es: (MPa) | 2.1 × 10⁵ | |
| Poisson’s ratio | 0.3 | |
| Stud shear connector | Number of studs | 20 |
| Number of rows | 1 | |
| Spacing between studs (mm) | 205 | |
| Diameter of studs (mm) | 16 | |
| Shear force strength (kN) | 67 | |
| Es: (MPa) | 2.1 × 10⁵ | |
| Poisson’s ratio | 0.3 | |
| Profiled sheeting | Ultimate tensile strength, (MPa) | 375 |
| Yield stress, (MPa) | 291 | |
| Es (MPa) | 2.1 × 10⁵ | |
| Poisson’s ratio | 0.3 |
| Yielding Stress (MPa) | Yielding Strain | Ultimate Strength (MPa) | Ultimate Strain | Elastic Modulus (GPa) | |
|---|---|---|---|---|---|
| Steel rebars | 294.2 | 0.0014 | 402.5 | 0.04 | 207.8 |
| Steel beam * | 345 | 0.0017 | 450 | 0.04 | 204 |
| Headed studs * | 351.6 | 0.0017 | 448.2 | 0.04 | 206.5 |
| Tendons * | 1680 | 0.0084 | 1860 | 0.10 | 200 |
| Yield Strength (MPa) | Ultimate Strength (MPa) | Modulus of Elasticity (MPa) | Yield Strain % | Poisson’s Ratio | |
|---|---|---|---|---|---|
| Steel beam | 358.2 | 518.9 | 210,000 | 0.171 | 0.3 |
| Steel rebars | 360.5 | 561 | 210,000 | 0.173 | 0.3 |
| Shear studs | 360 | 515 | 210,000 | 0.17 | 0.3 |
| Thickness of Sheet (mm) | Elastic Modulus (GPa) | Major Poisson’s Ratio | Tensile Strength (MPa) | Tensile Elongation % | Shear Modulus (GPa) |
|---|---|---|---|---|---|
| 0.381 | Ex = 74.7 | νxy = 0.22 | 933 | 1.25 | Gxy = 2.90 |
| Ey = 4.85 | νxz = 0.22 | Gxz = 2.90 | |||
| Ez = 4.85 | νyz = 0.3 | Gyz = 1.86 * |
| Post-Tensioning | Initial Camber (mm) | Ultimate Capacity (kN.m) | Steel Flange Stress (MPa) | Concrete Flange Stress (MPa) | Shear stud Moment (N.m) | |||
|---|---|---|---|---|---|---|---|---|
| Initial | Final | Initial | Final | Initial | Final | |||
| Without | 0 | 240 | 0 | 400 | 0 | −20 | 0 | 52 |
| With | 4.2 | 300 | −90 | 400 | 1.5 | −17.0 | −6.0 | 43 |
| Post-Tensioning | Initial Deflection (mm) * | Ultimate Capacity (kN.m) | Cracked Moment (kN.m) | Steel Rebar Stress (MPa) | Yielding Moment (MPa) | Maximum Crack Width (mm) | |
|---|---|---|---|---|---|---|---|
| Initial ** | Final | ||||||
| Without | 0 | 230 | 26.5 | 0 | 240 | 175 | 0.104 |
| With | −1.2 | 250 | 45 | −12.1 | 240 | 219.5 | 0.091 |
| Beam | Mu (kN.m) | % Change | Δy (mm) | Δu (mm) | µ * | Mode of Failure |
|---|---|---|---|---|---|---|
| F1 | 108.1 | - | 4.7 | 17 | 3.6 | Concrete flange failure |
| F2 | 130.2 | 20.4 | 5.4 | 14 | 2.6 | Rupture in CFRP laminates |
| F3 | 137.0 | 26.7 | 5.8 | 12.9 | 2.2 | Rupture in CFRP laminates |
Disclaimer/Publisher’s Note: The statements, opinions and data contained in all publications are solely those of the individual author(s) and contributor(s) and not of MDPI and/or the editor(s). MDPI and/or the editor(s) disclaim responsibility for any injury to people or property resulting from any ideas, methods, instructions or products referred to in the content. |
© 2023 by the authors. Licensee MDPI, Basel, Switzerland. This article is an open access article distributed under the terms and conditions of the Creative Commons Attribution (CC BY) license (https://creativecommons.org/licenses/by/4.0/).
Share and Cite
El-Zohairy, A.; Mustafa, S.; Shaaban, H.; Salim, H.; Allawi, A.A. Numerical Modeling and Analysis of Strengthened Steel–Concrete Composite Beams in Sagging and Hogging Moment Regions. CivilEng 2023, 4, 483-505. https://doi.org/10.3390/civileng4020028
El-Zohairy A, Mustafa S, Shaaban H, Salim H, Allawi AA. Numerical Modeling and Analysis of Strengthened Steel–Concrete Composite Beams in Sagging and Hogging Moment Regions. CivilEng. 2023; 4(2):483-505. https://doi.org/10.3390/civileng4020028
Chicago/Turabian StyleEl-Zohairy, Ayman, Suzan Mustafa, Hesham Shaaban, Hani Salim, and Abbas A. Allawi. 2023. "Numerical Modeling and Analysis of Strengthened Steel–Concrete Composite Beams in Sagging and Hogging Moment Regions" CivilEng 4, no. 2: 483-505. https://doi.org/10.3390/civileng4020028