


Assessing Effectiveness of Shape Memory Alloys on the Response of Bolted T-Stub Connections Subjected to Cyclic Loading
 ,
,
Abstract
:1. Introduction
2. Finite Element Models
The Capability of SMA Material
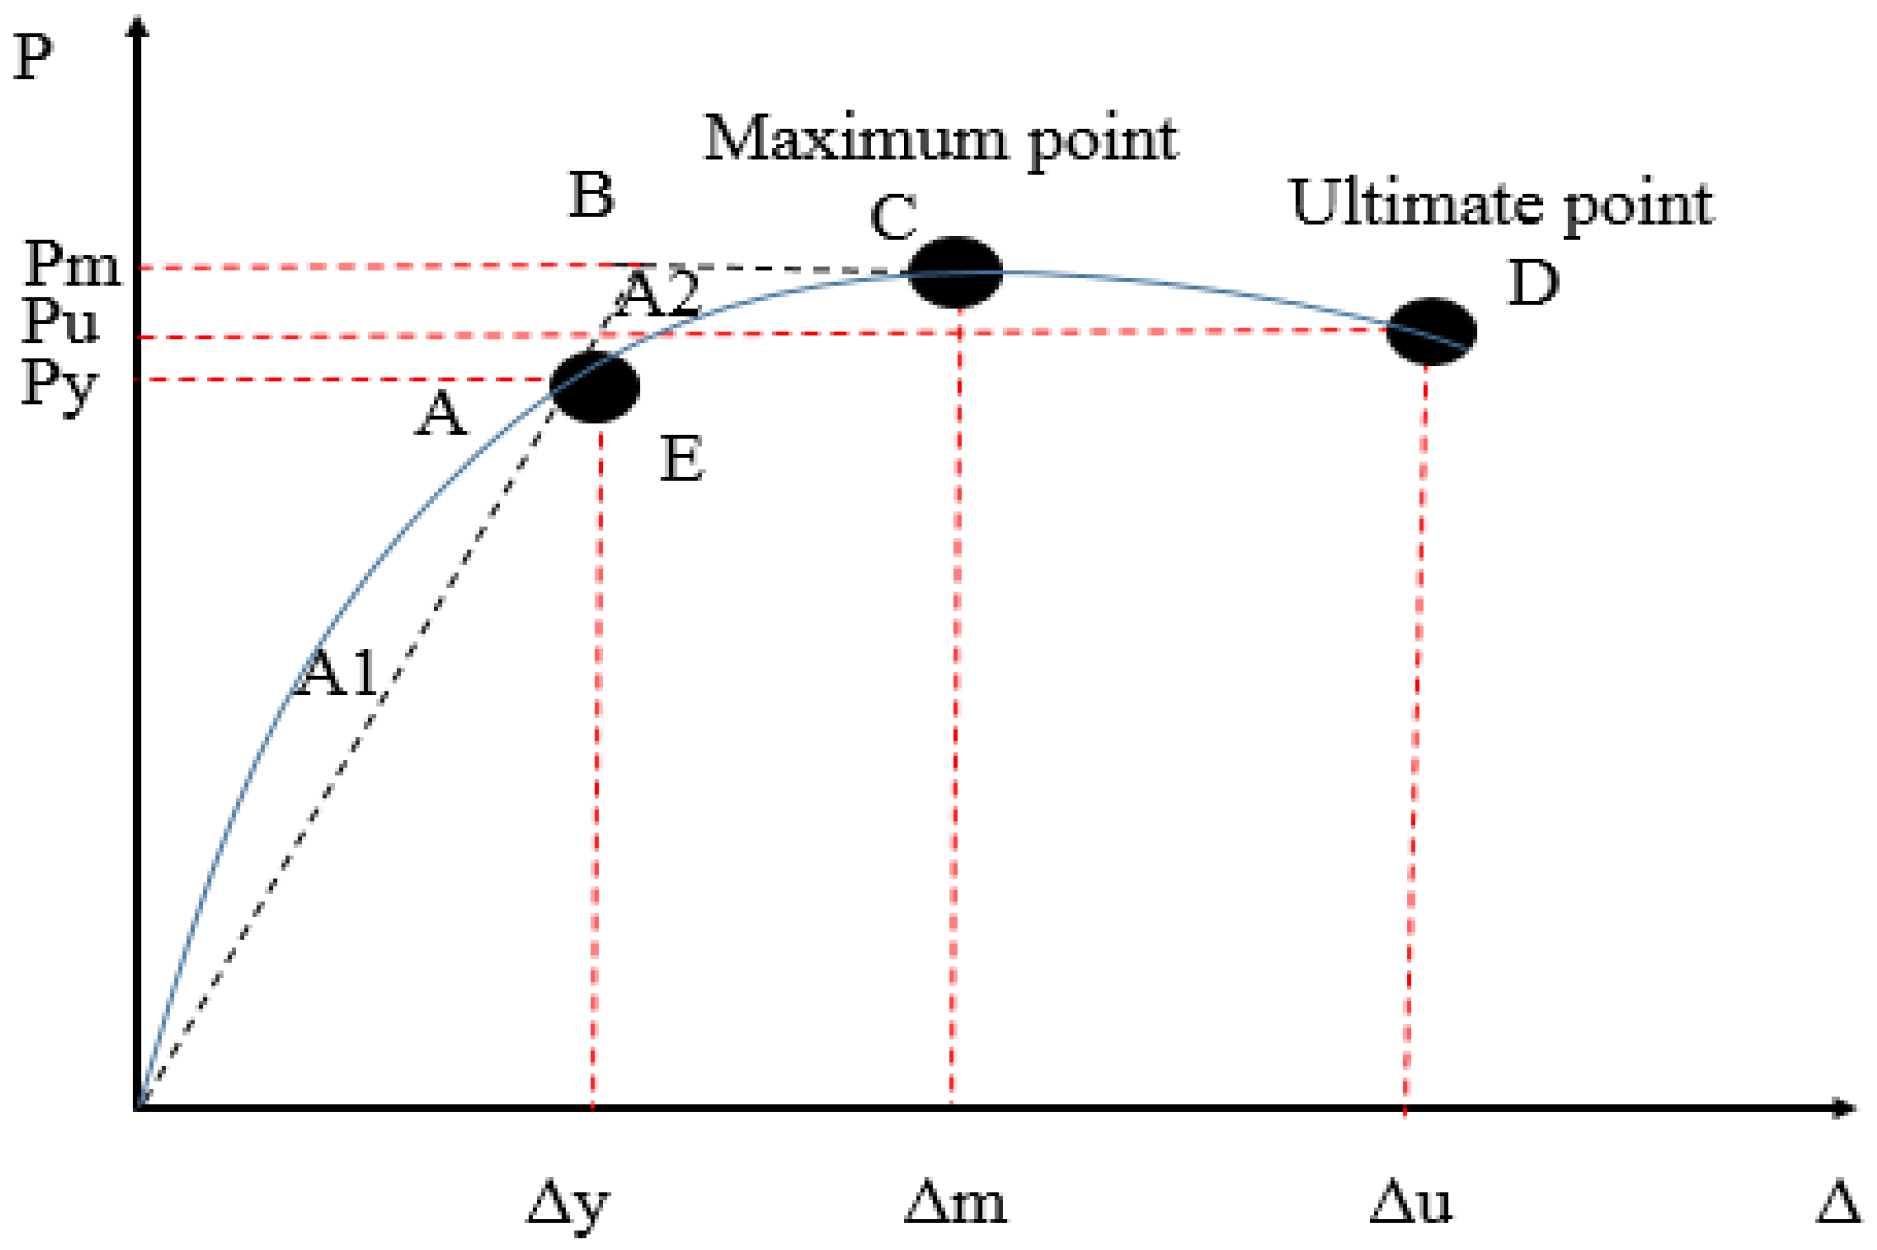
3. Analyzing the Moment–Rotation Curve
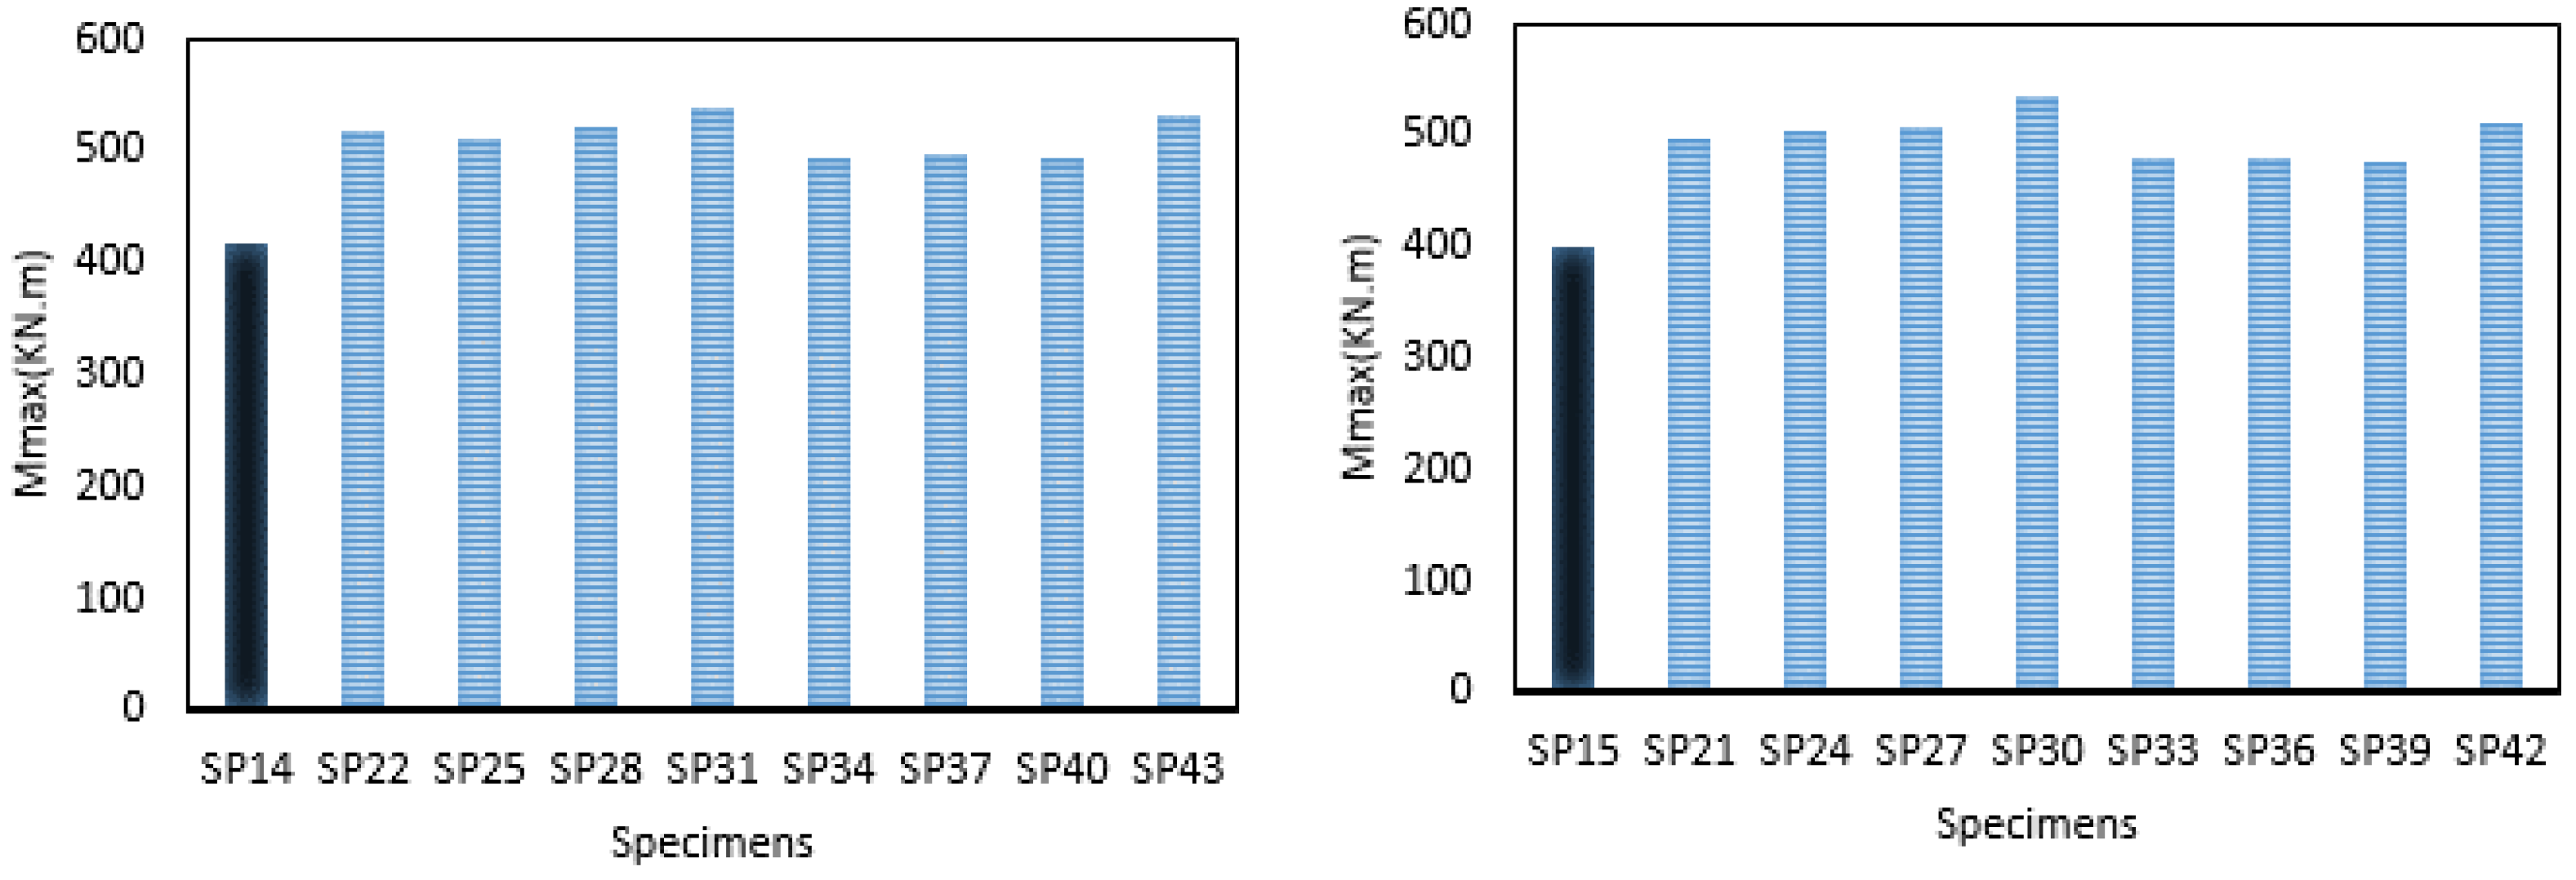
Assessment of Response Curve Variables
4. Failure Indexes
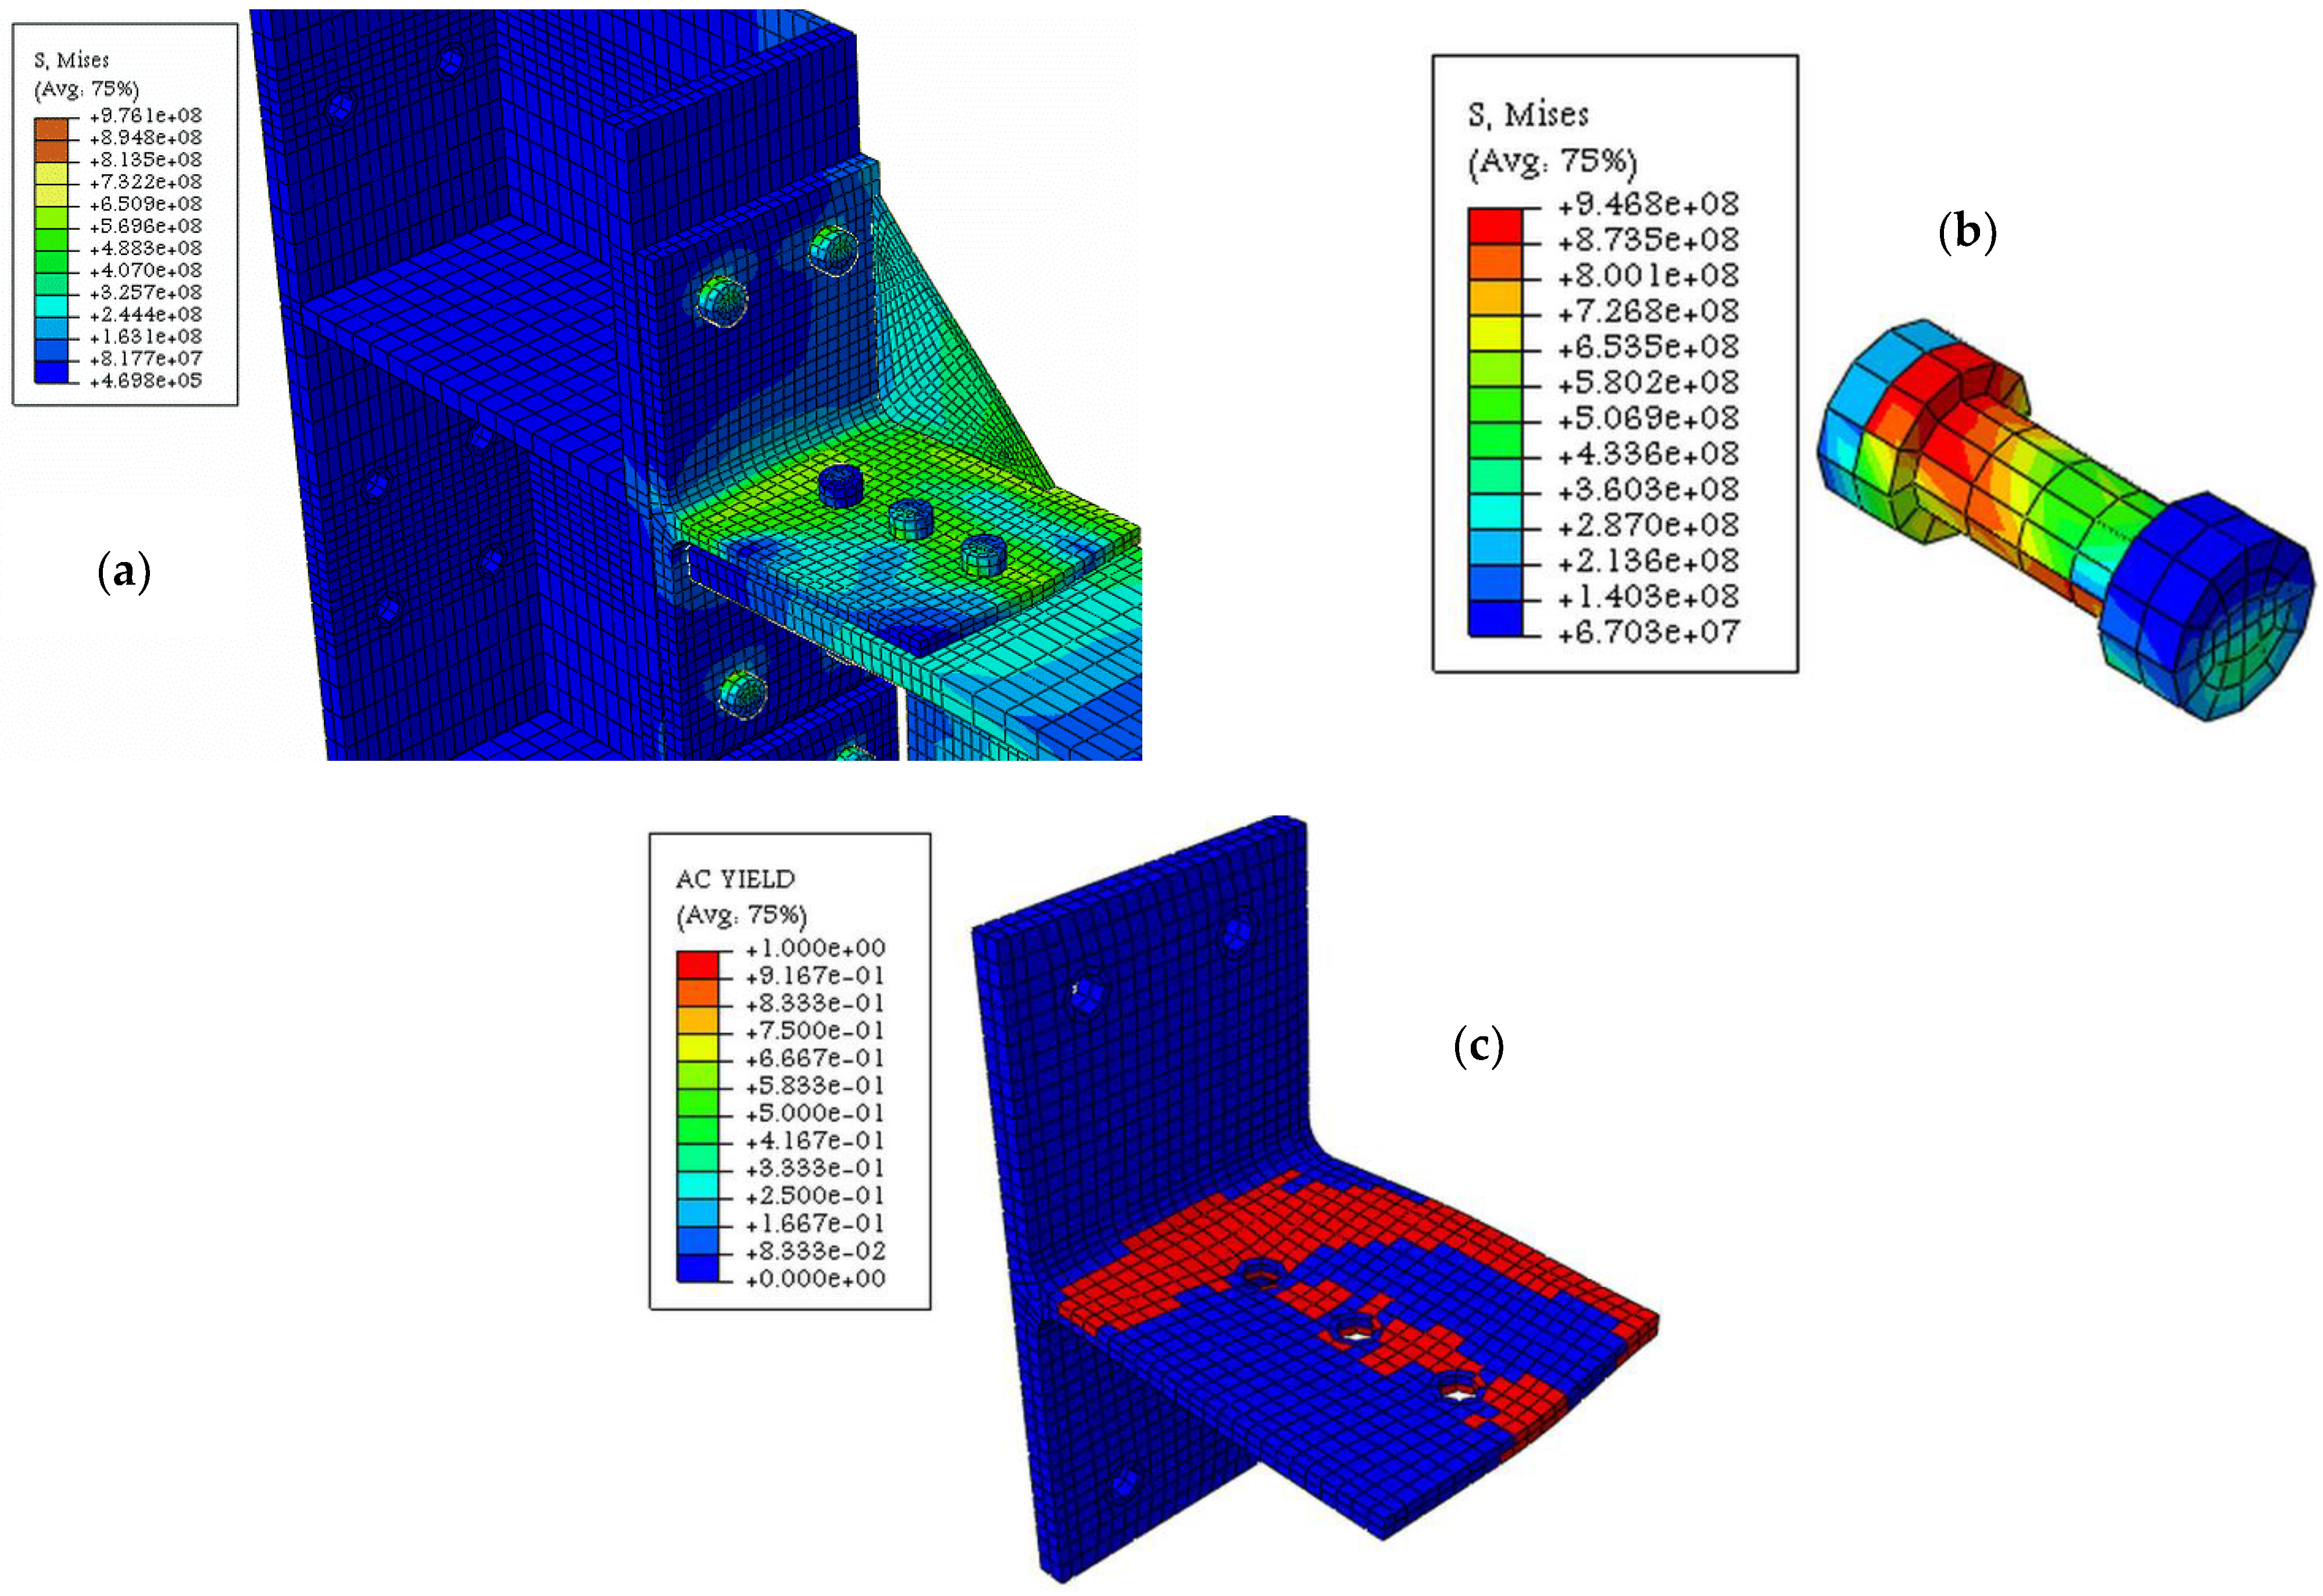
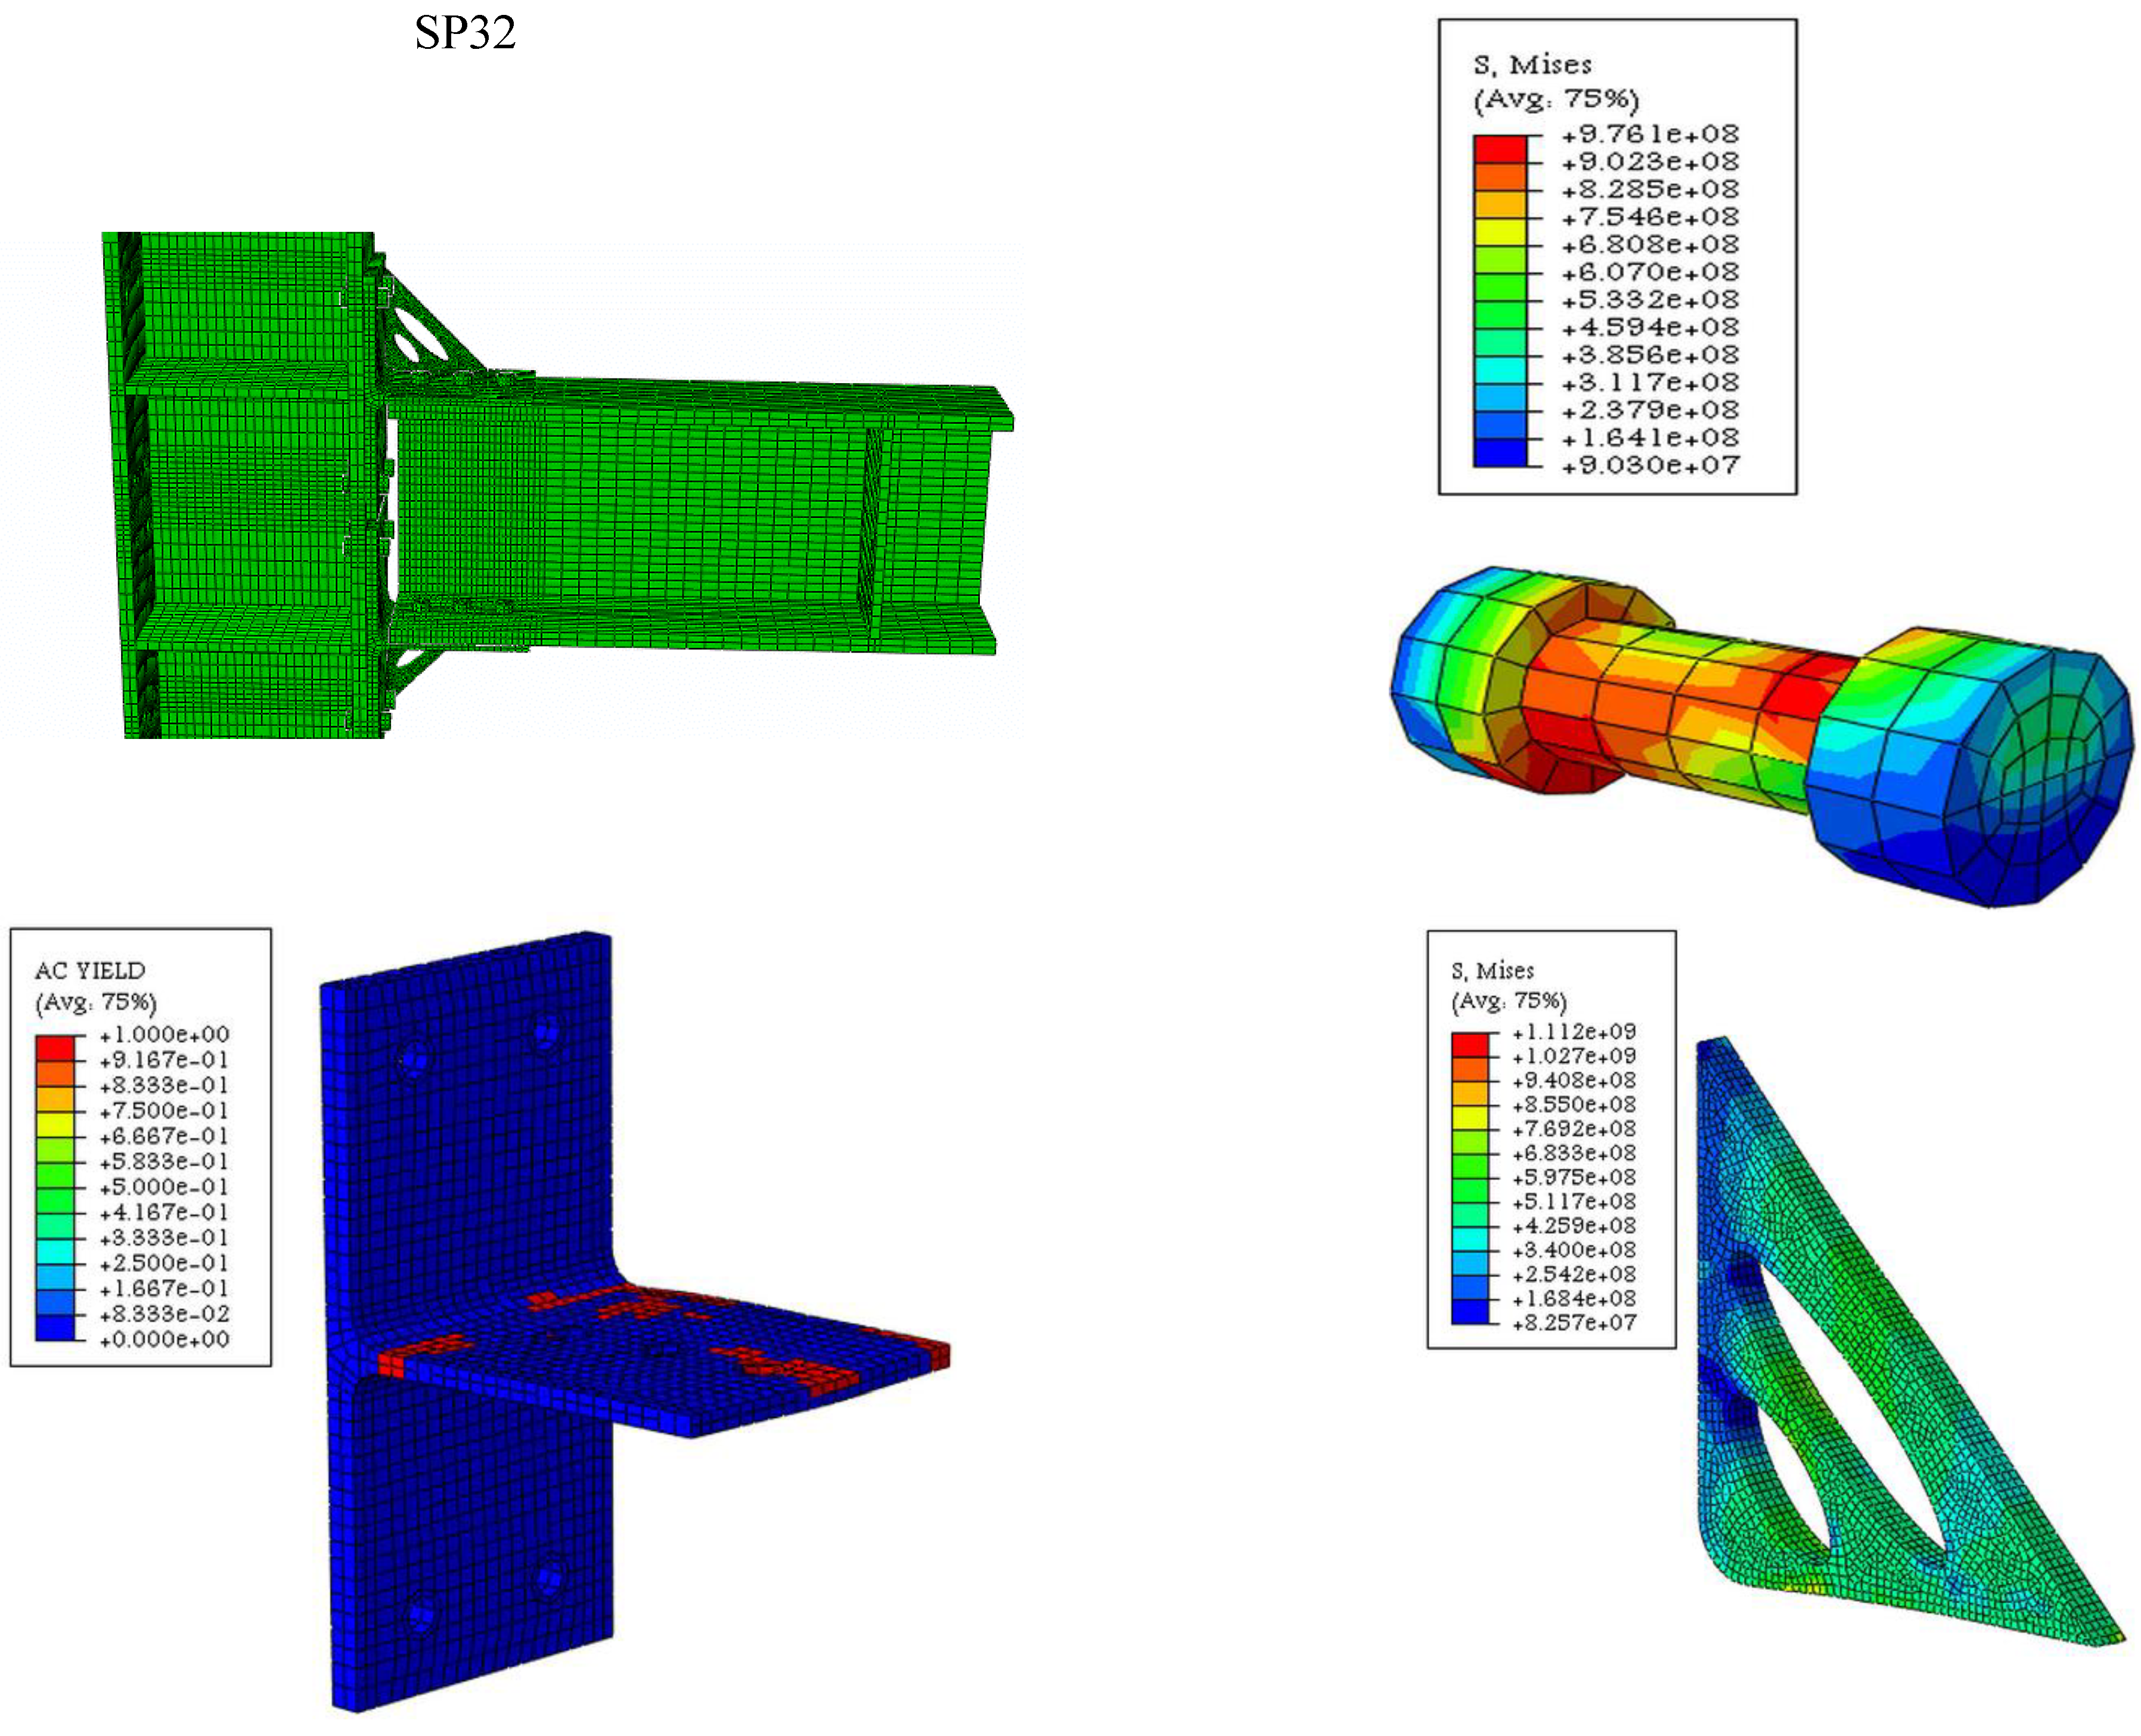
Failure Modes
5. Effects of SMA on Stiffener, T-Stub, and Bolt Column
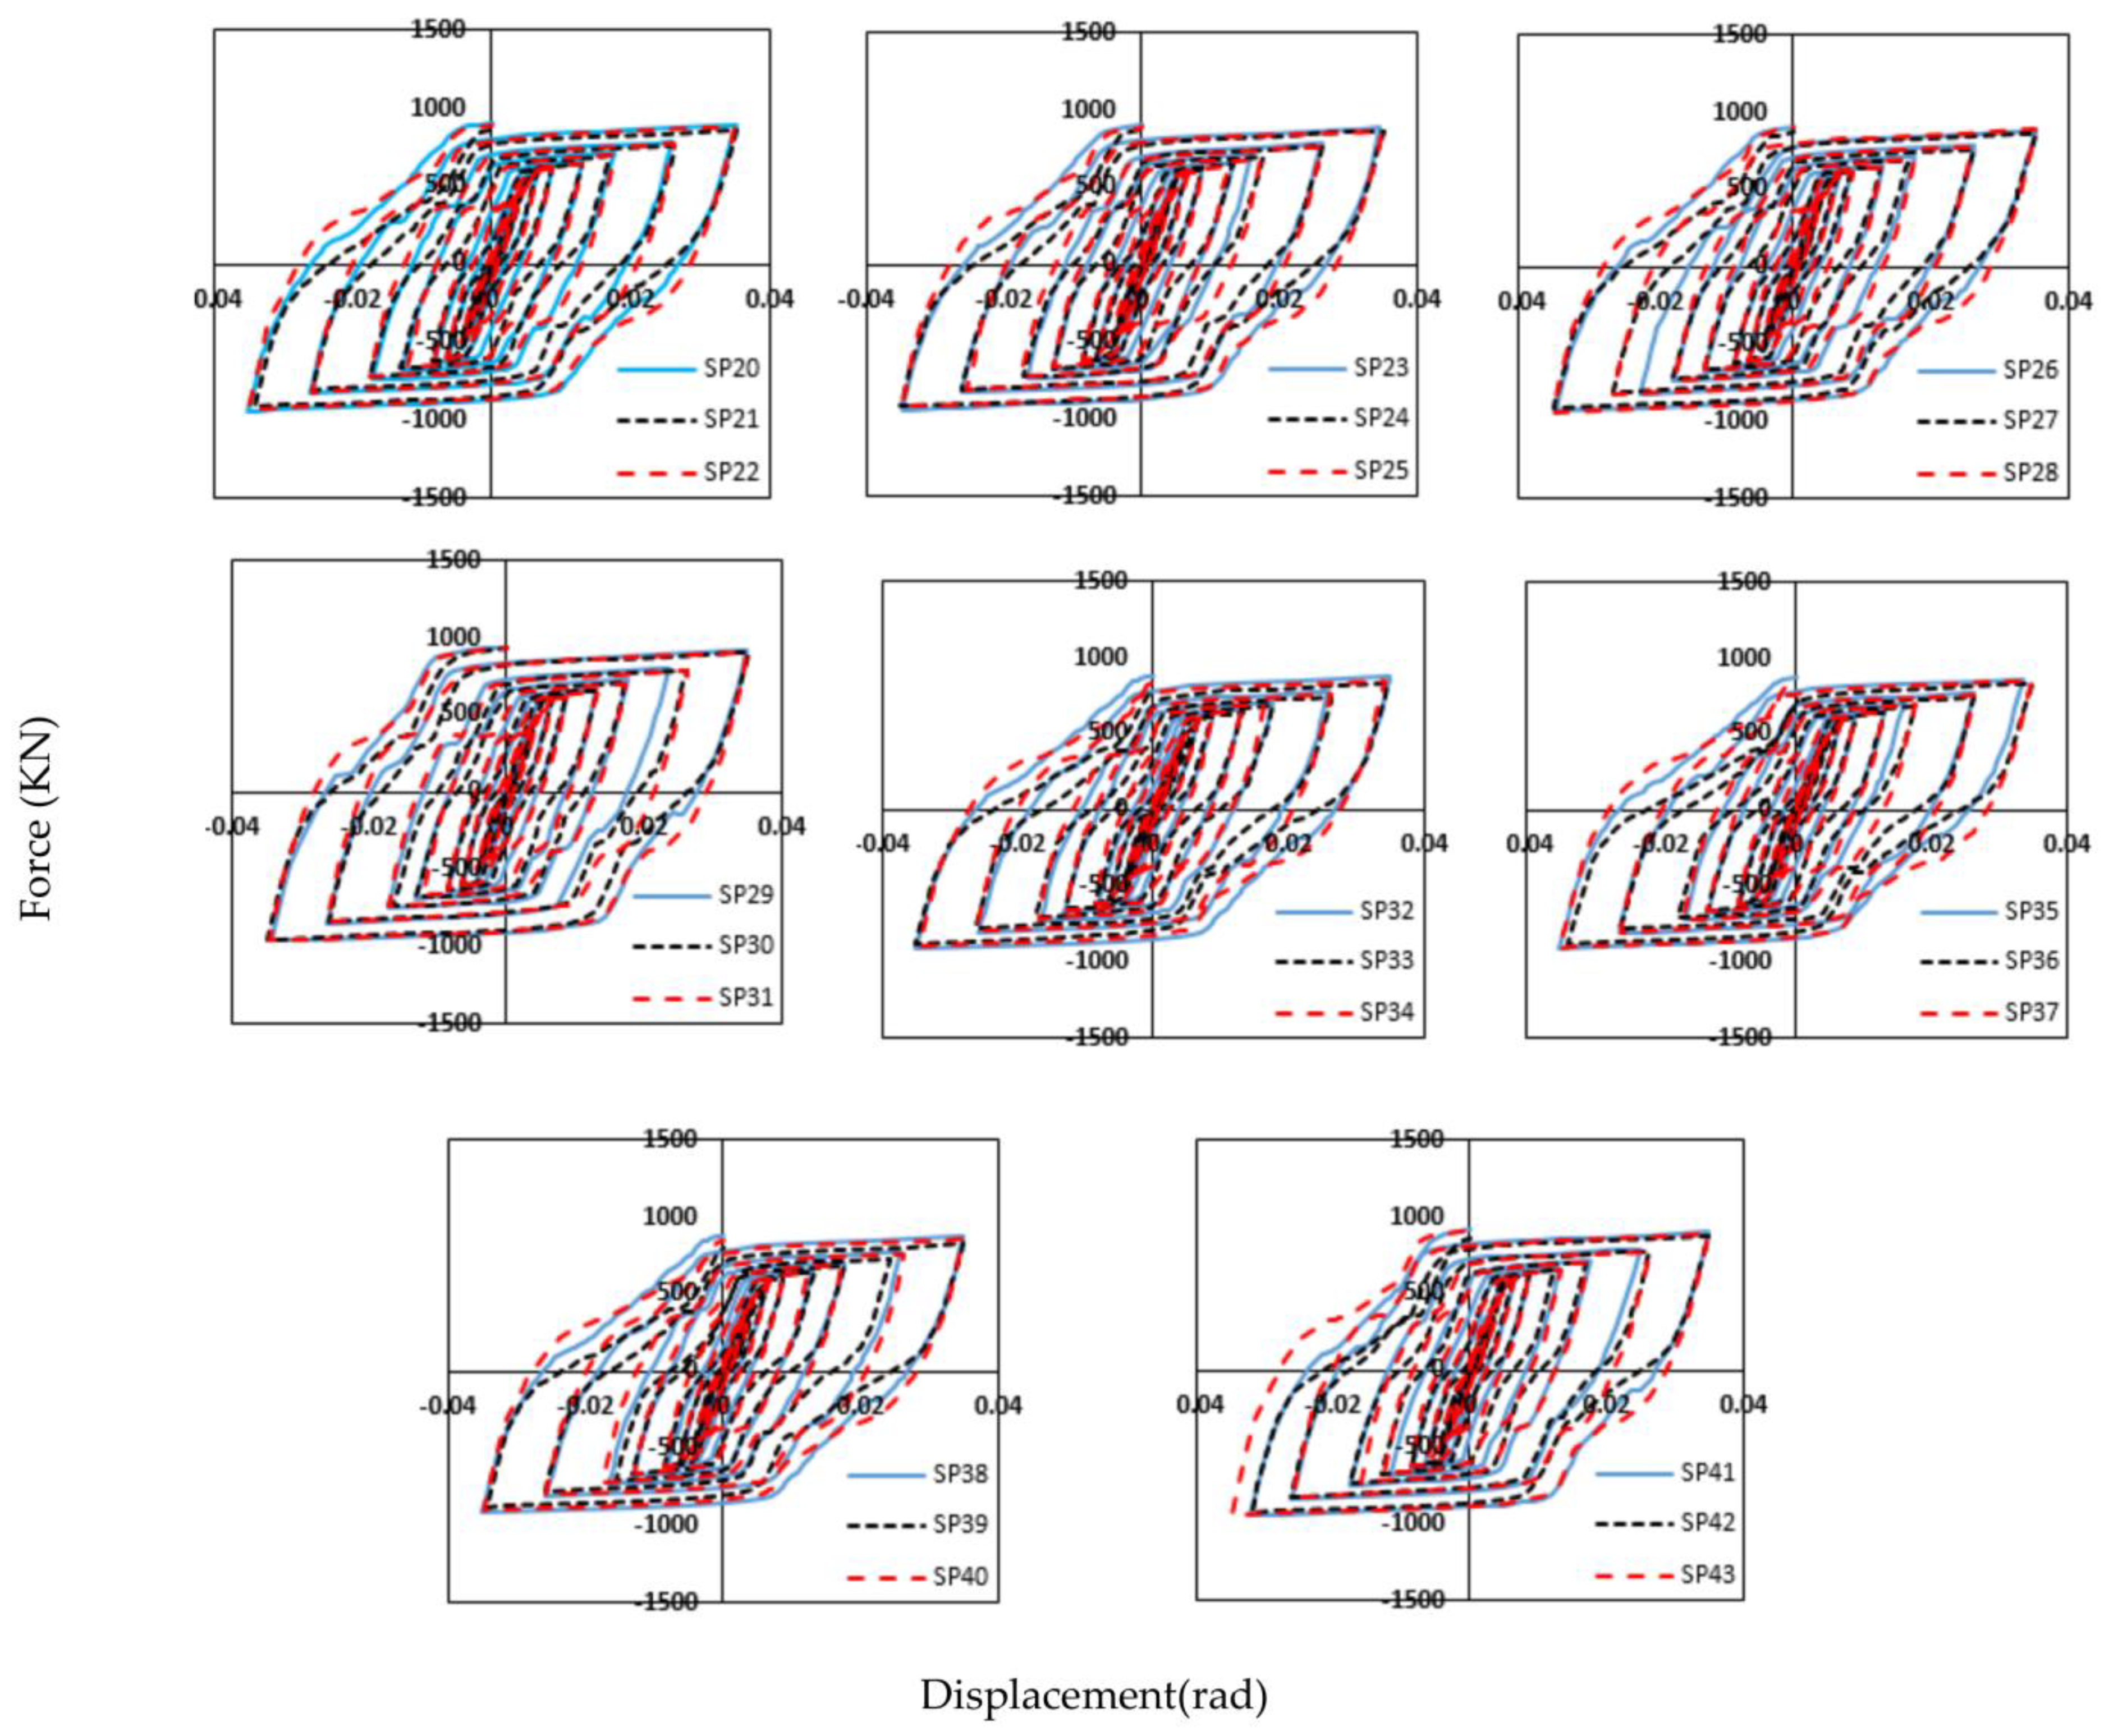
5.1. Monitoring Behavioural Curve
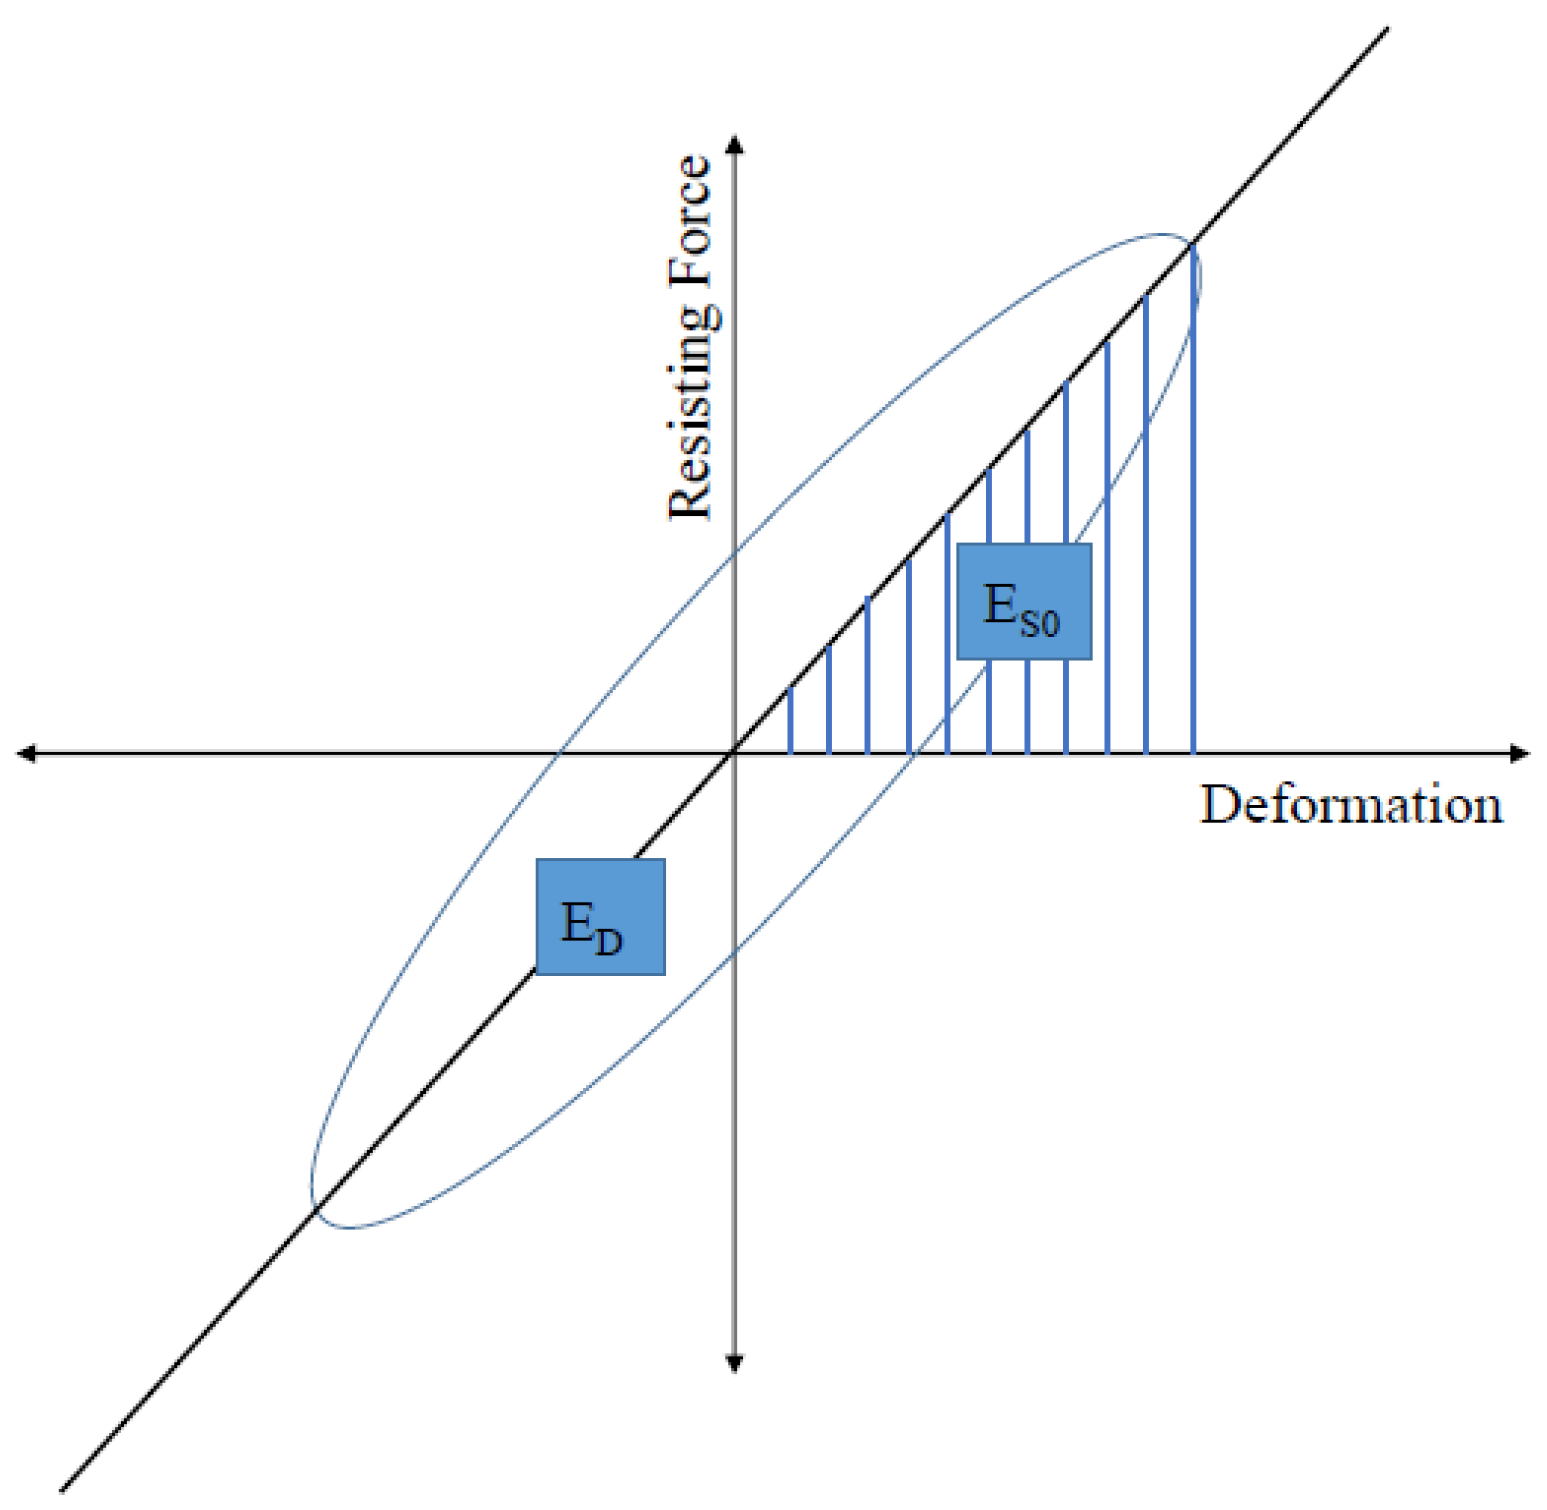
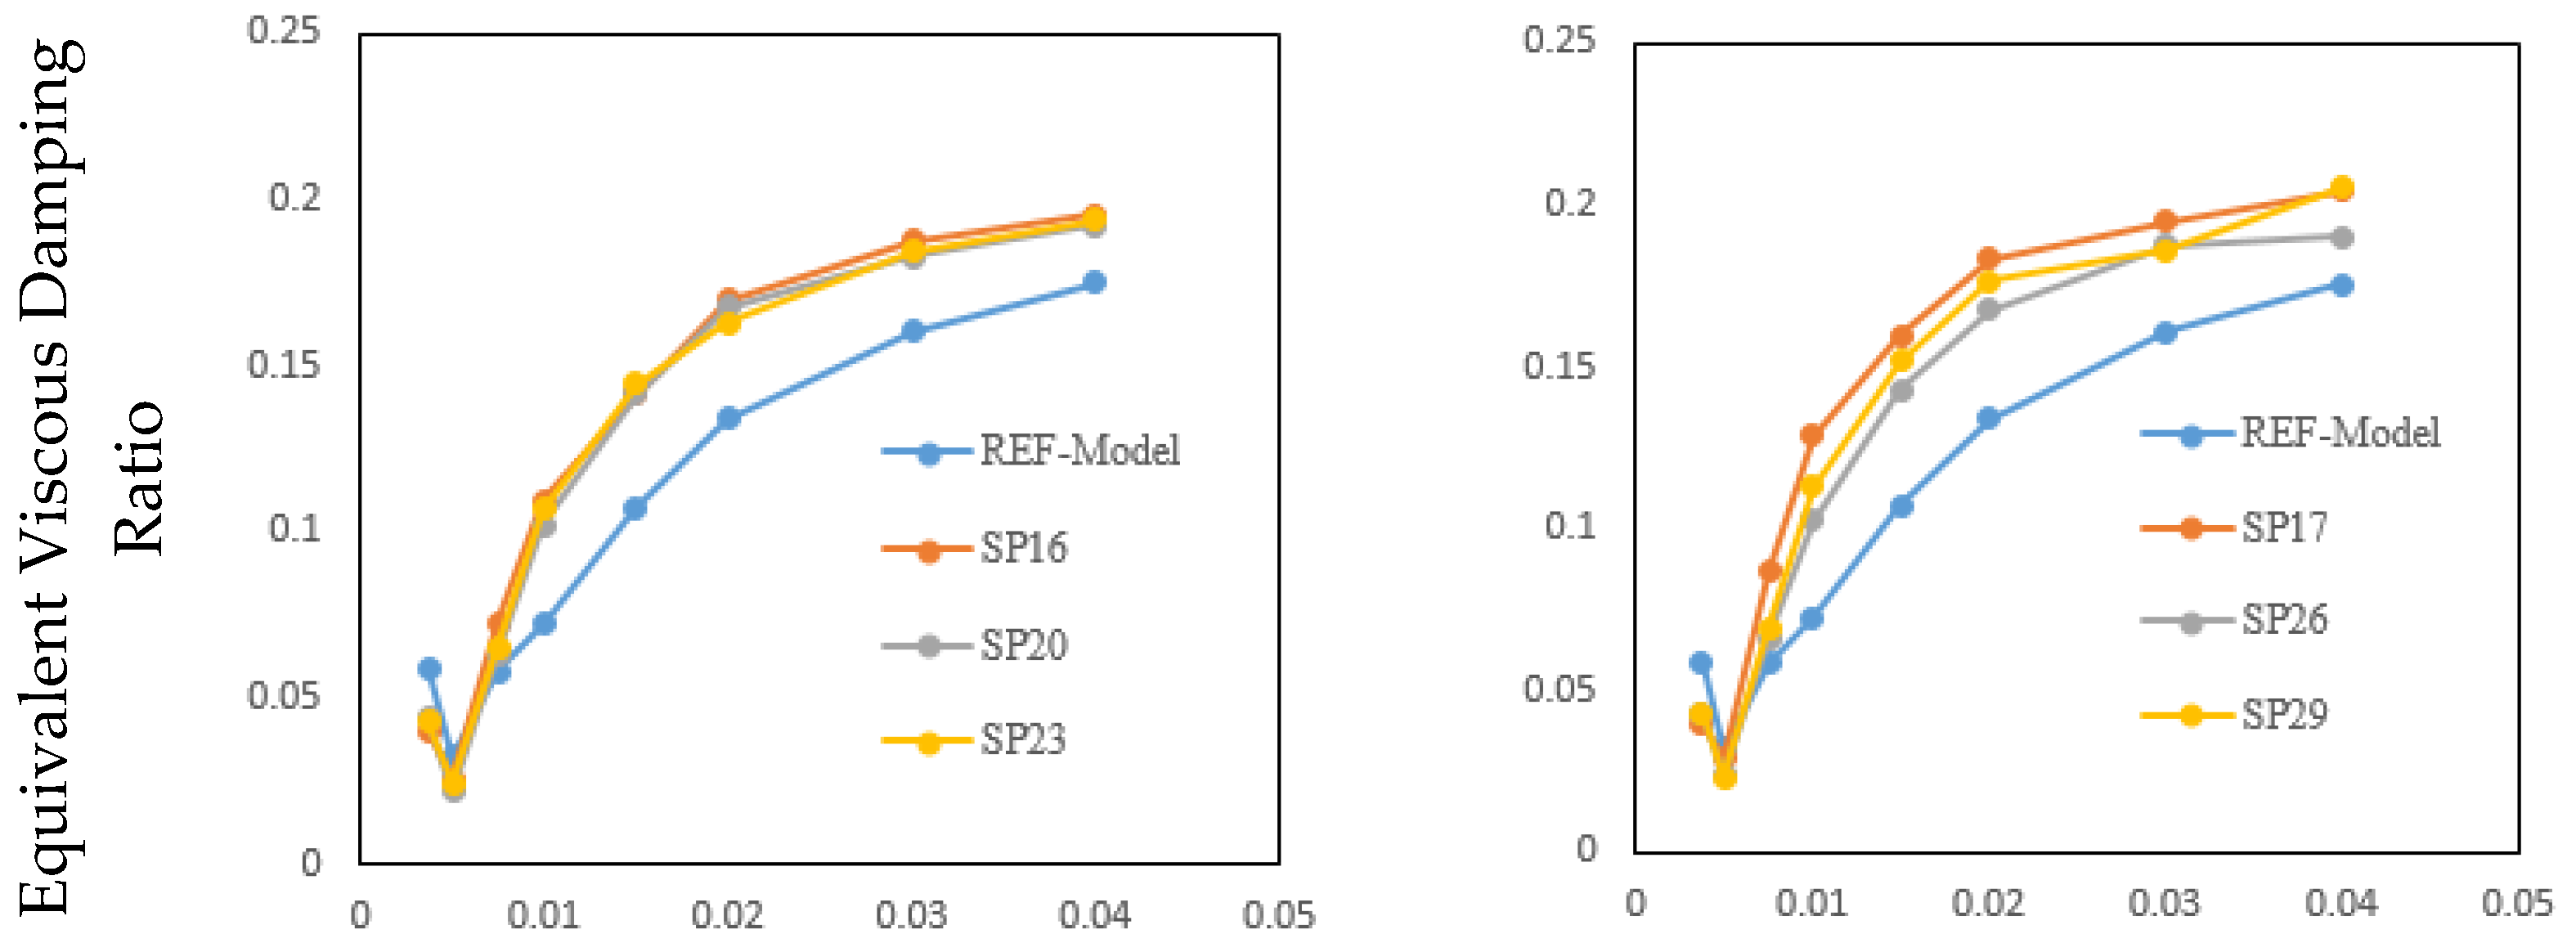
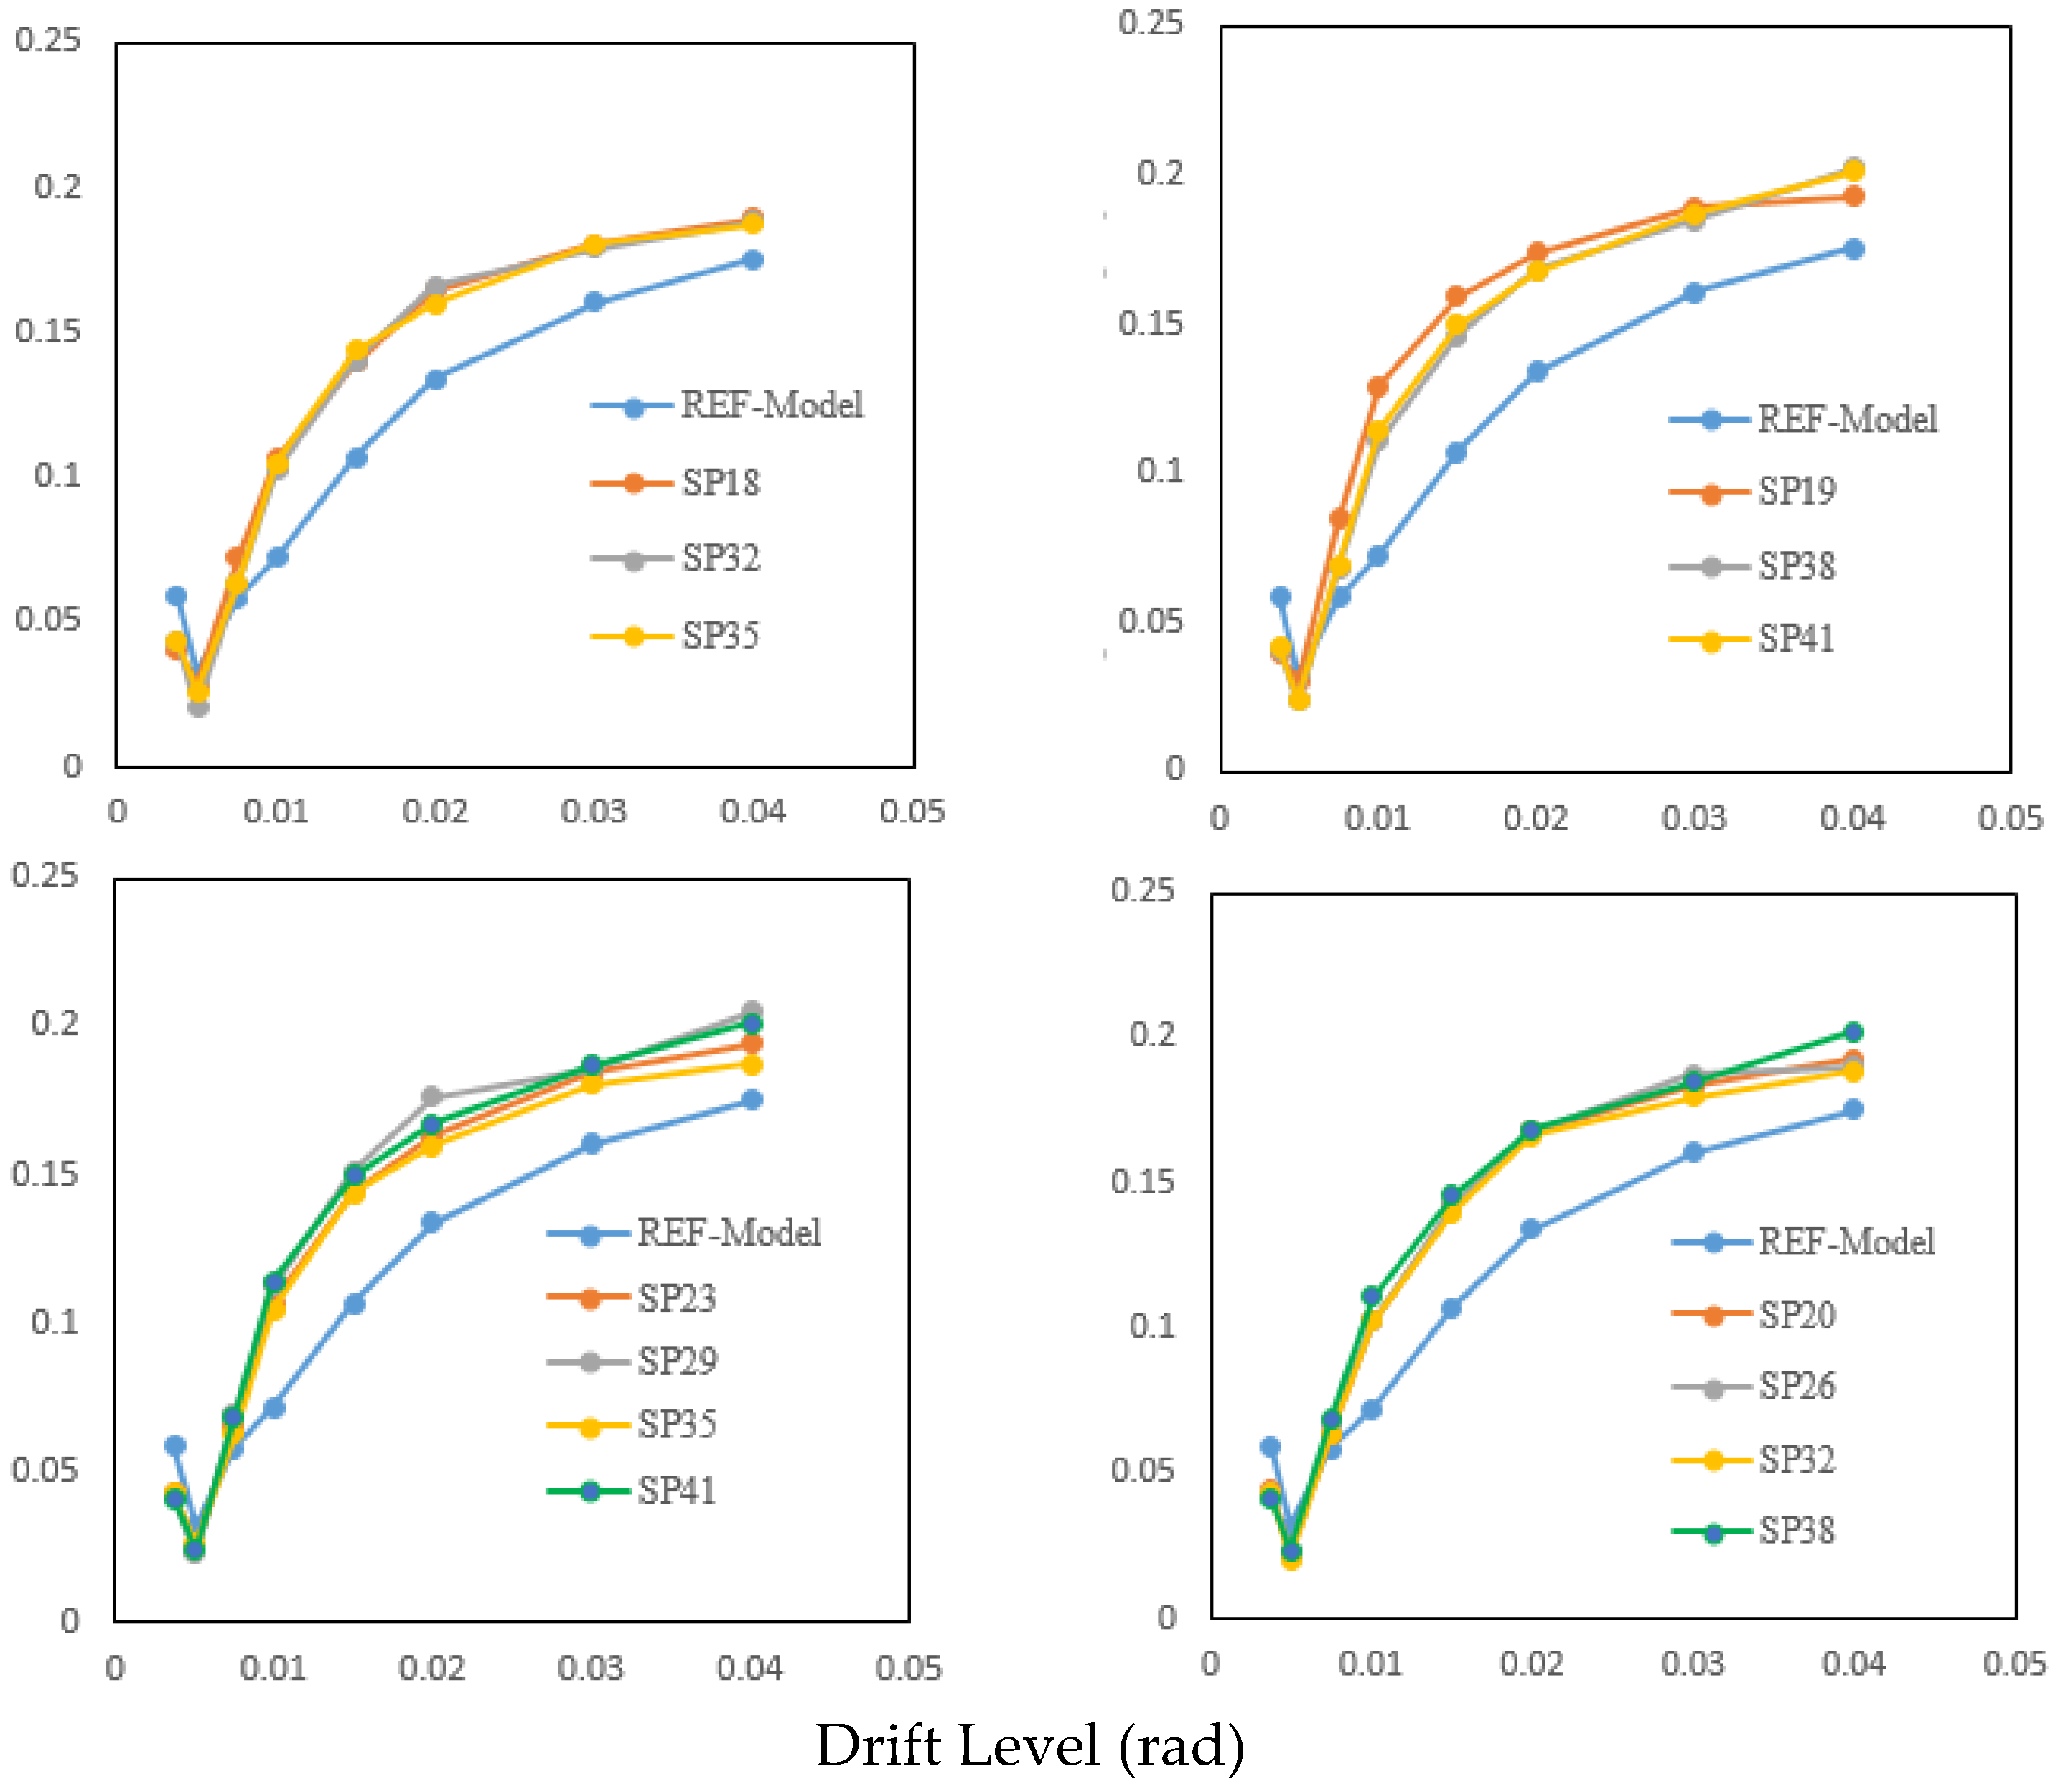
5.2. Equivalent Viscous Damping Ratio
5.2.1. Ductility Capacity and Failure Modes
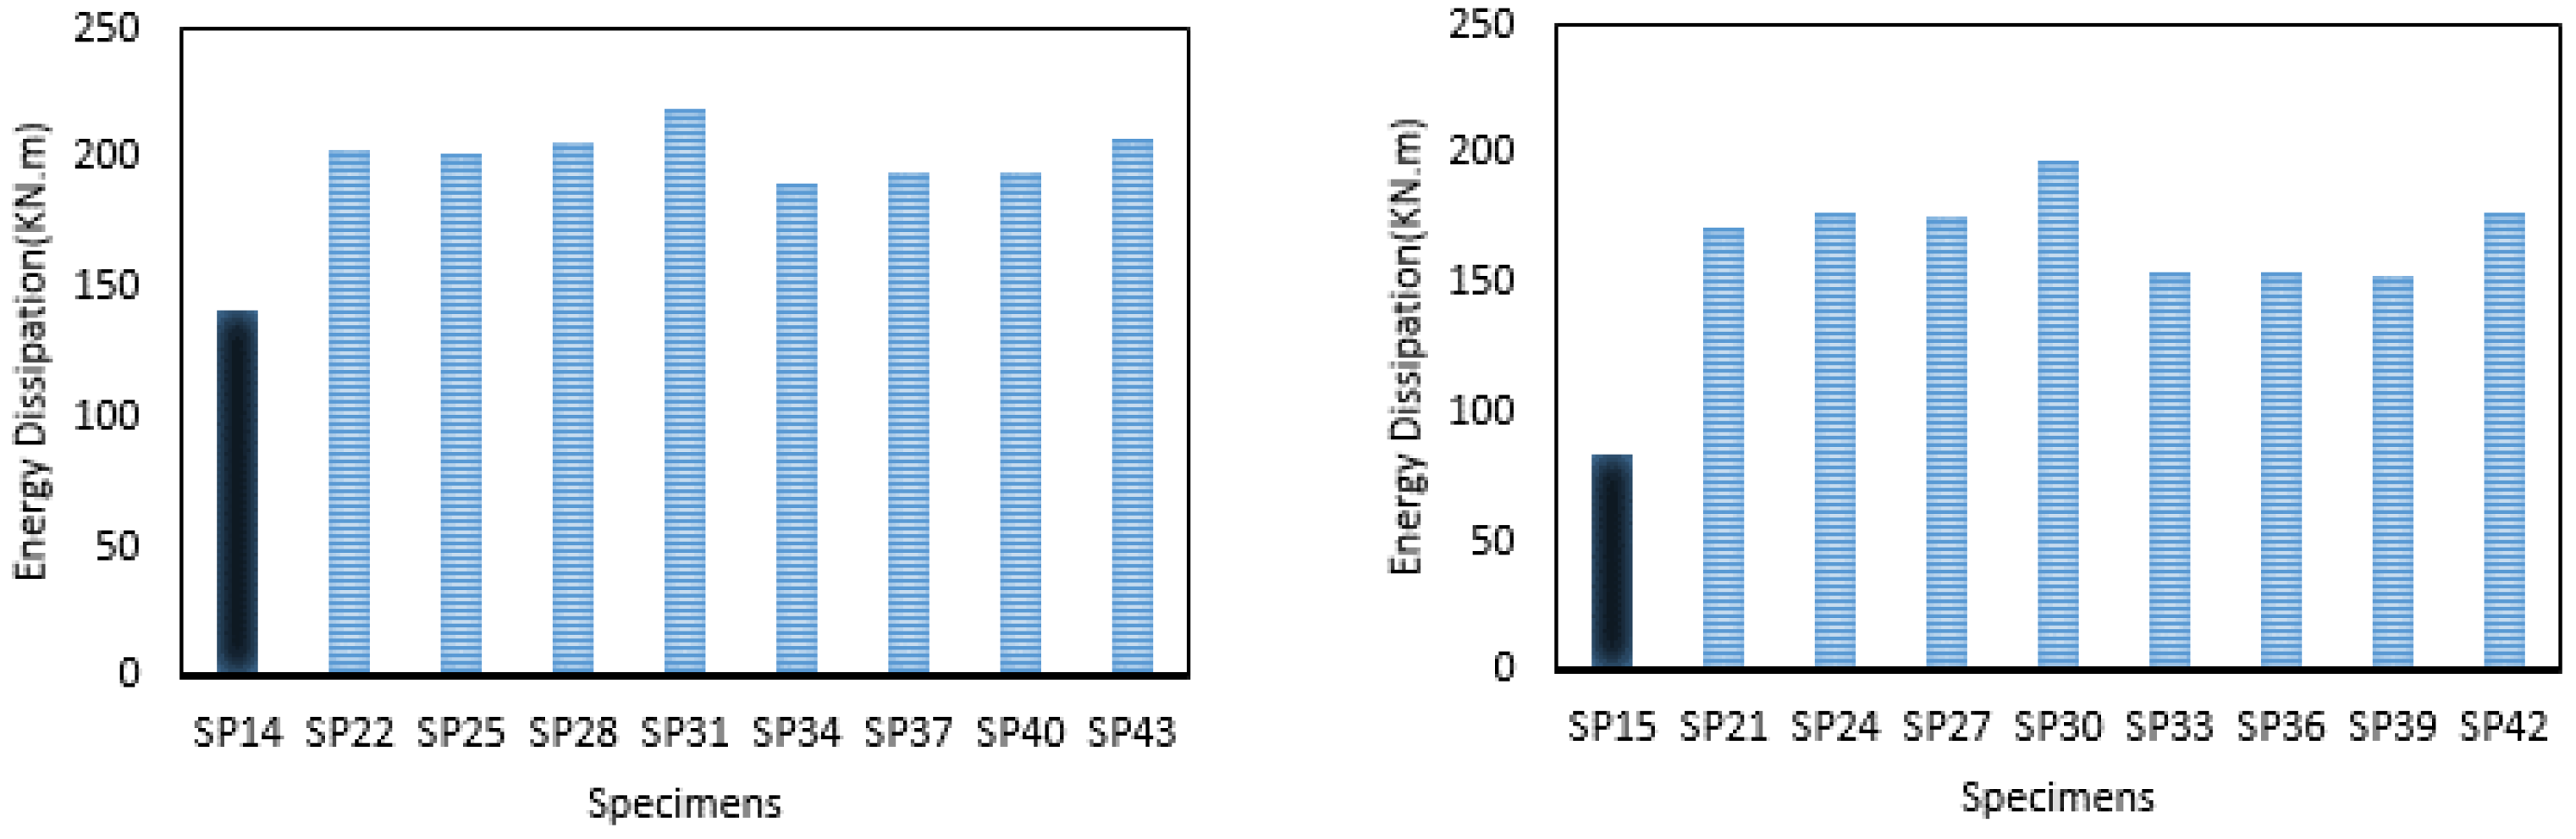
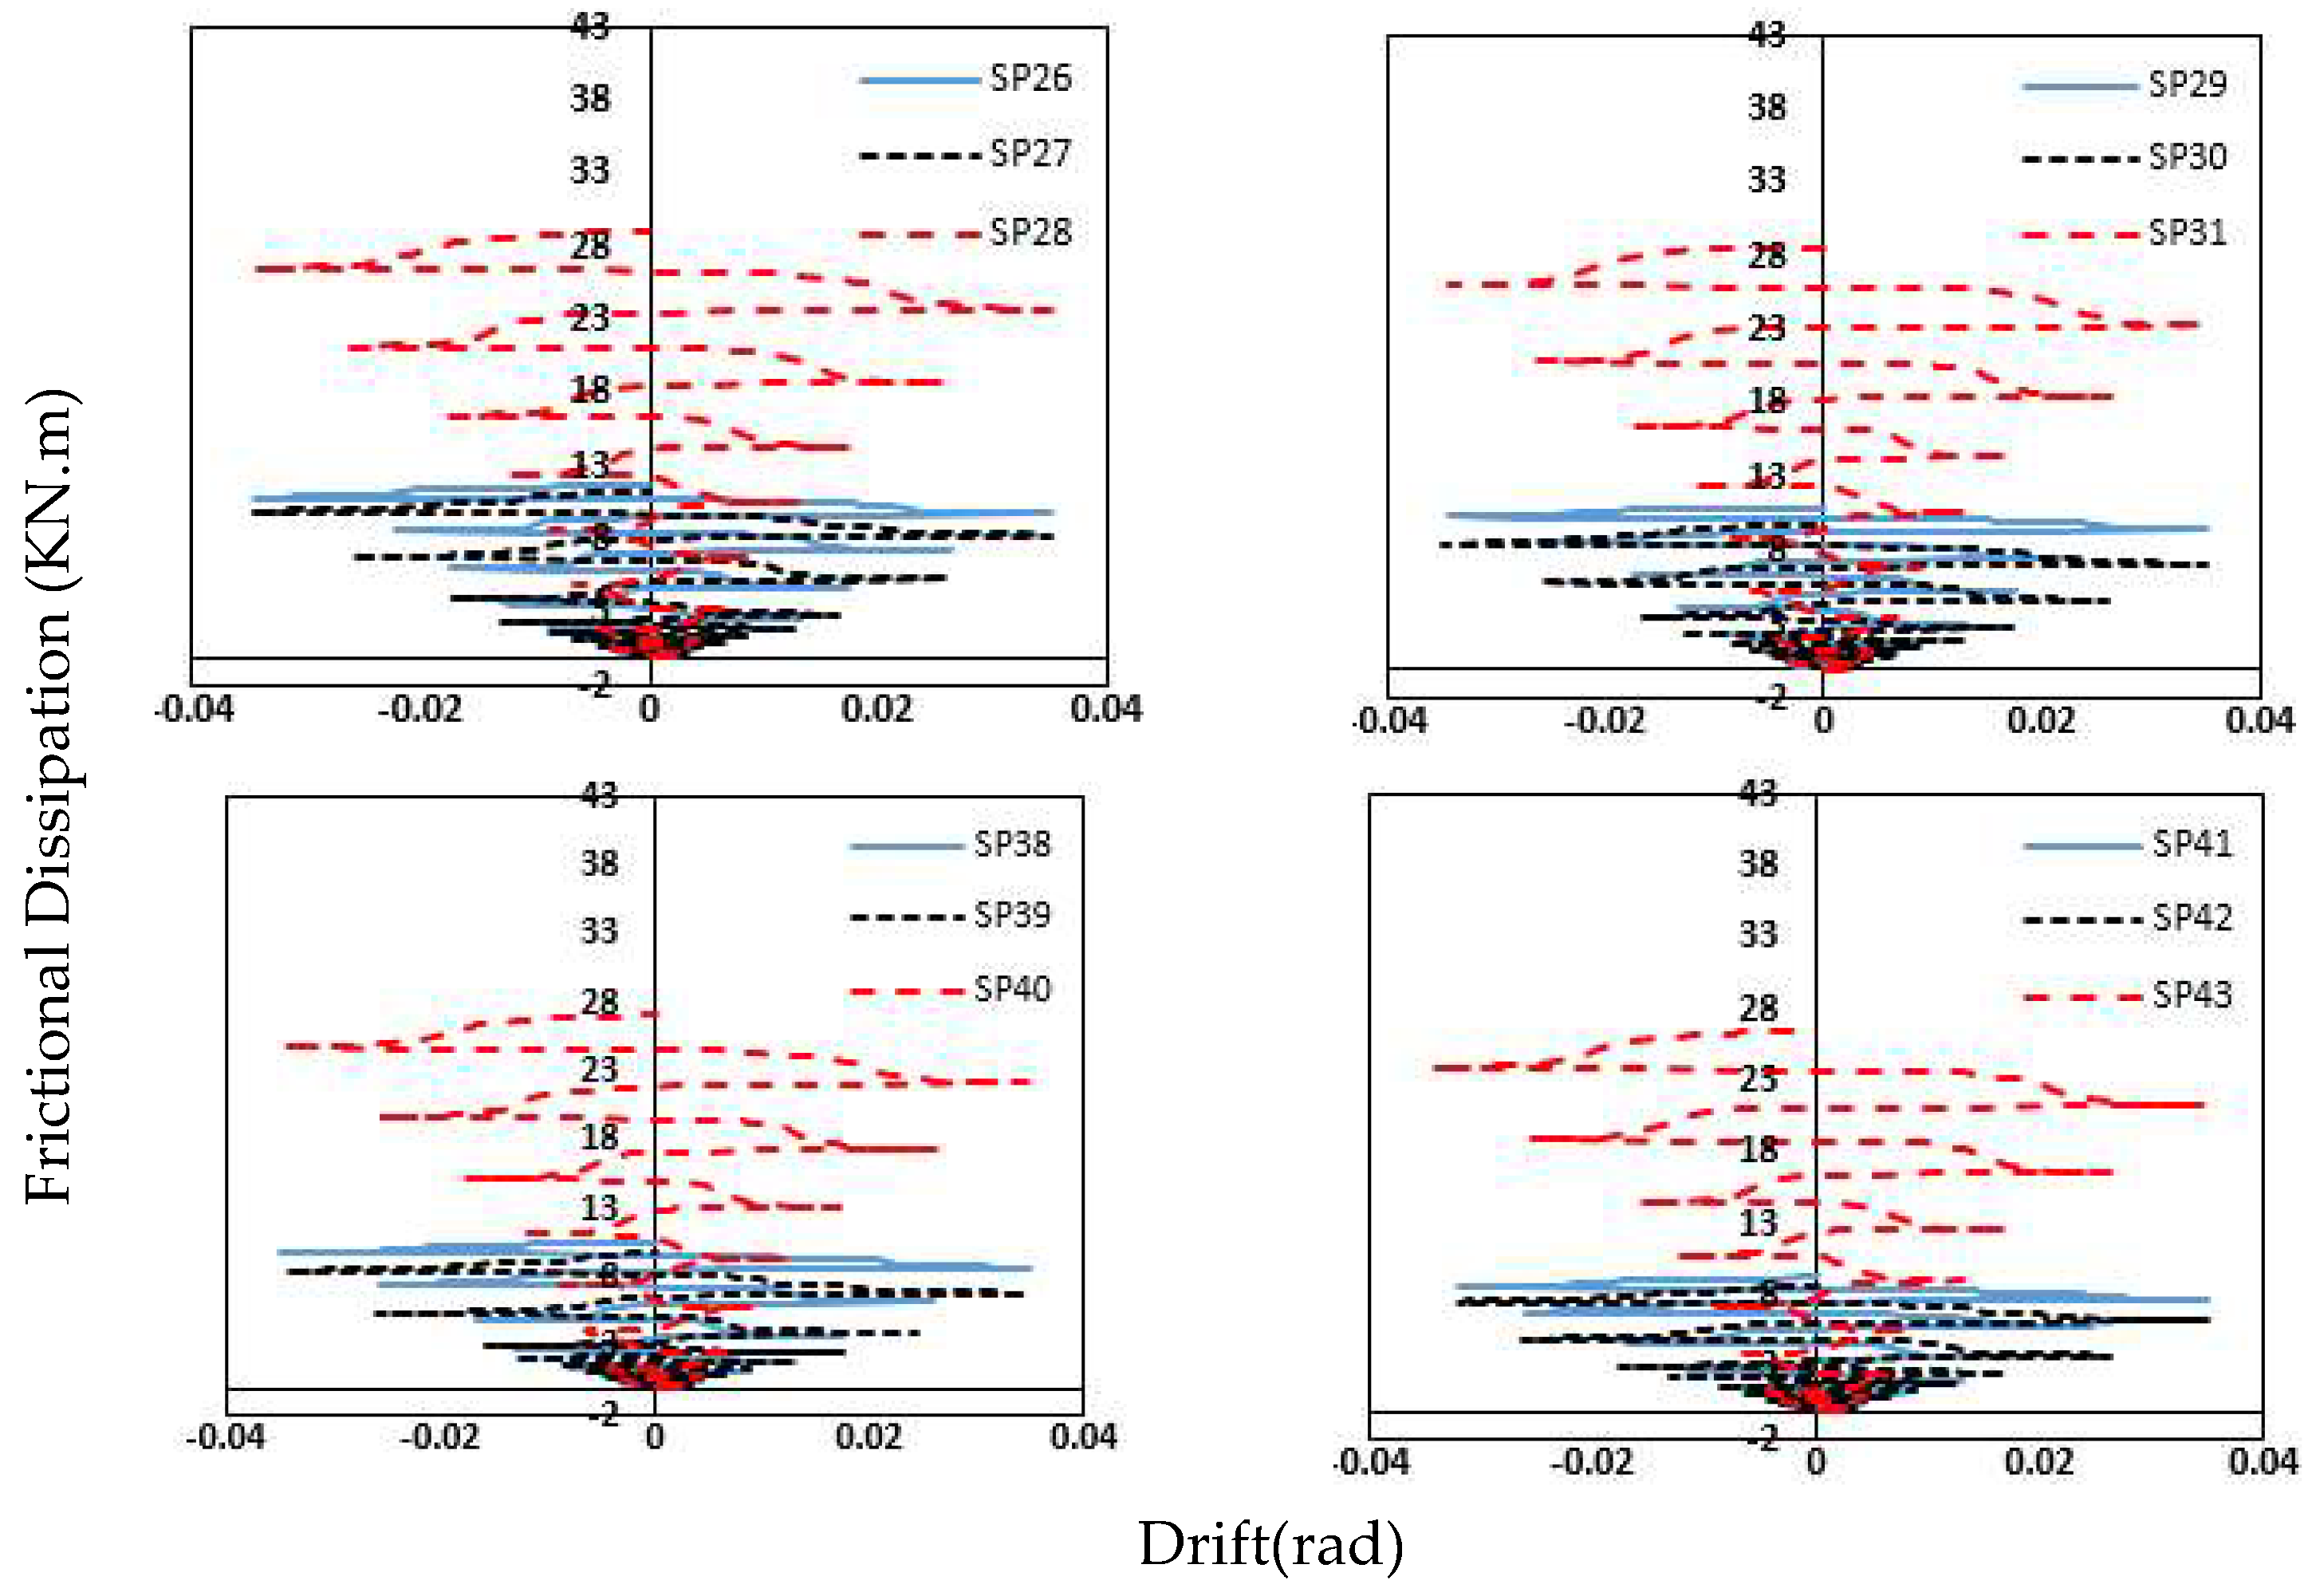
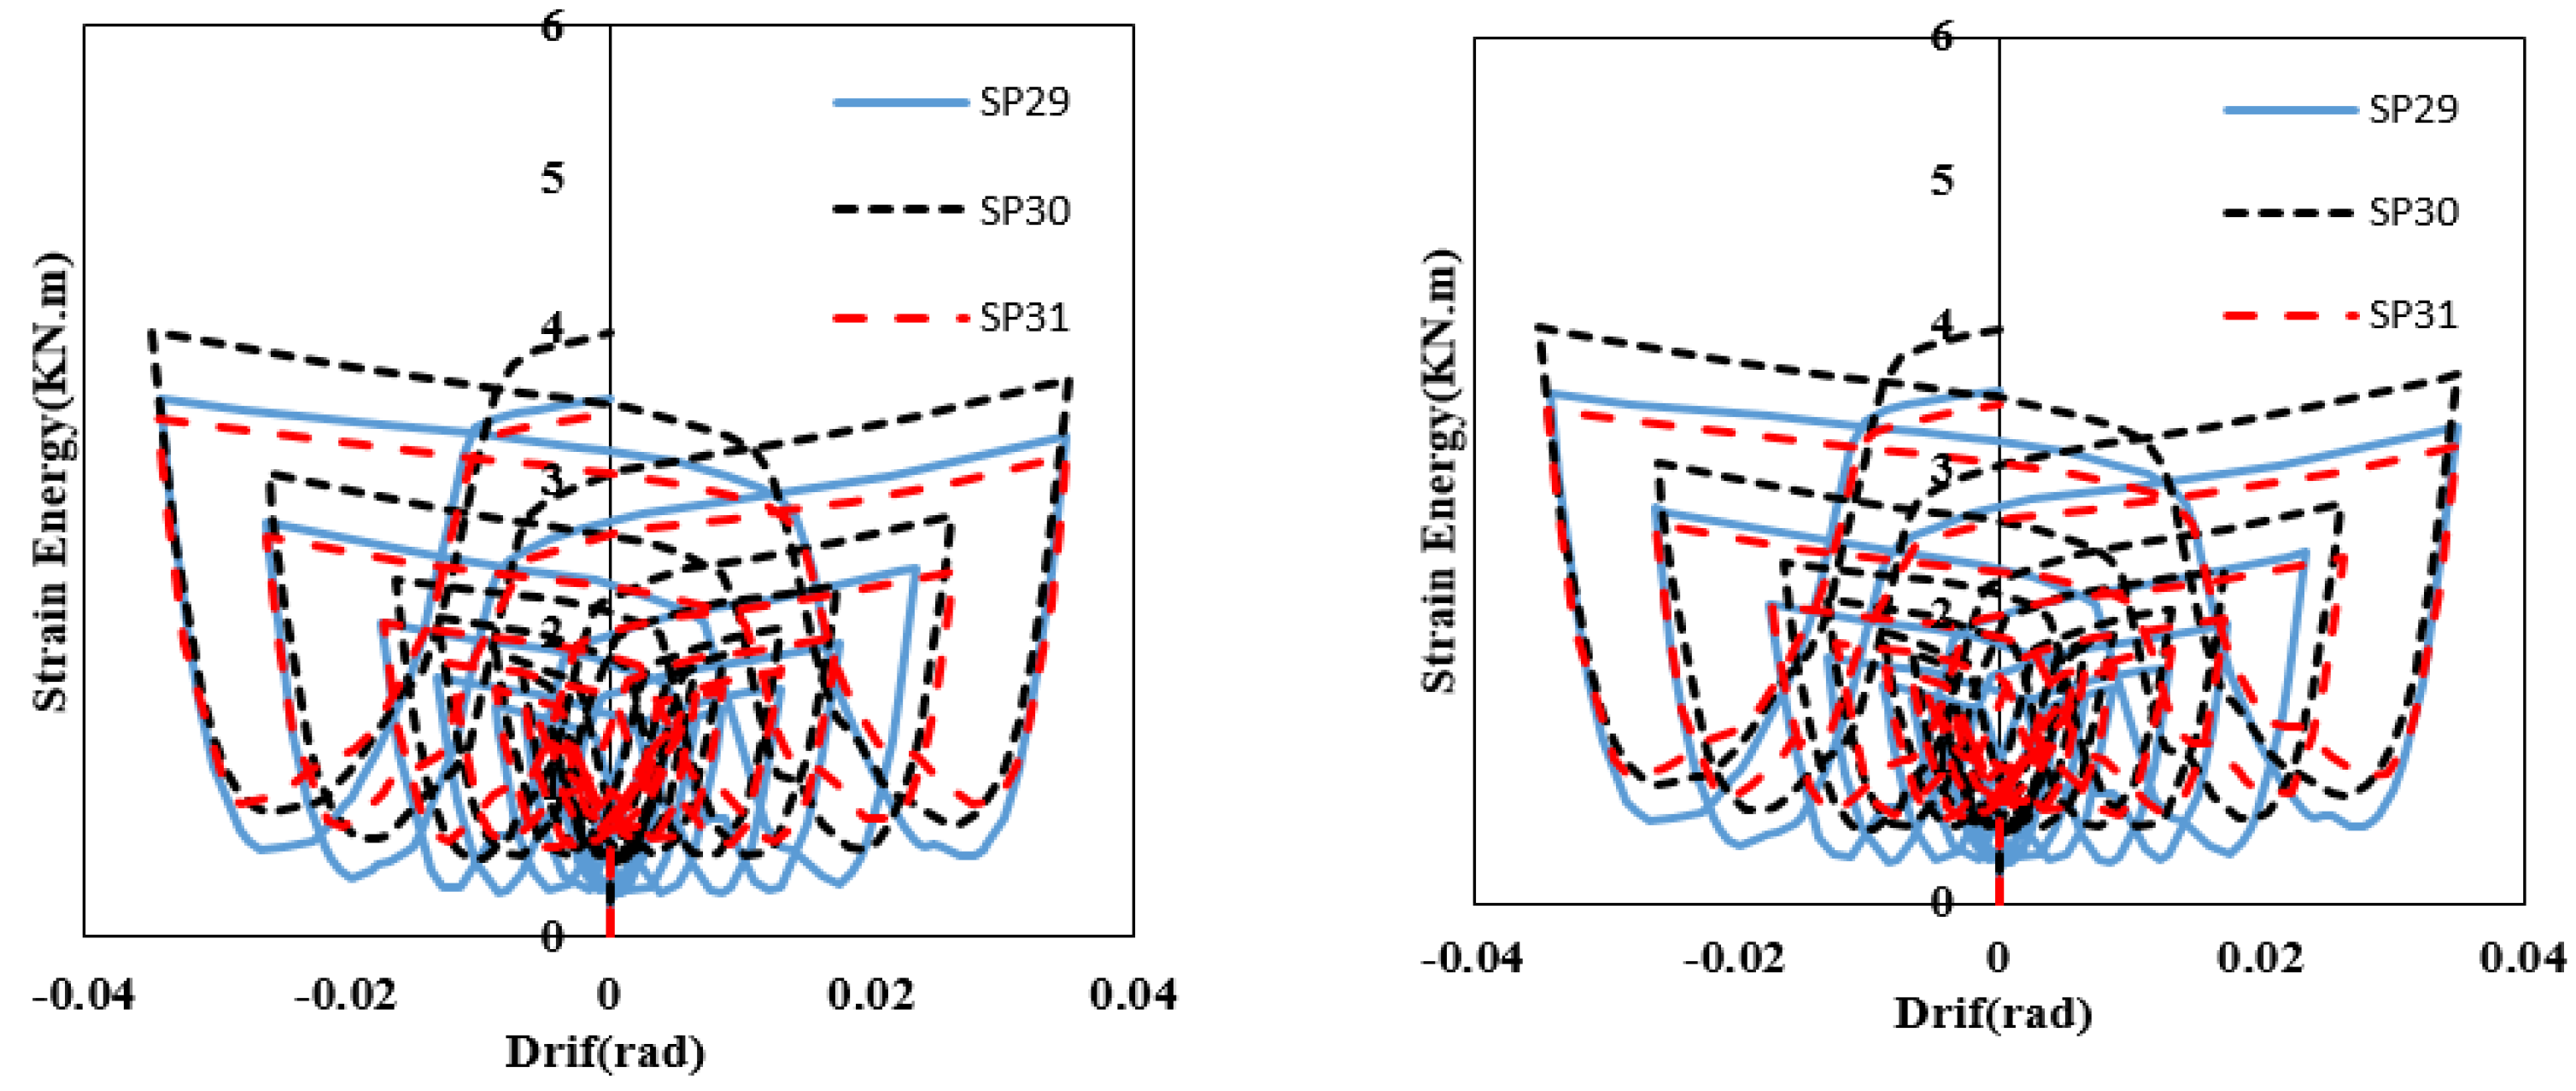
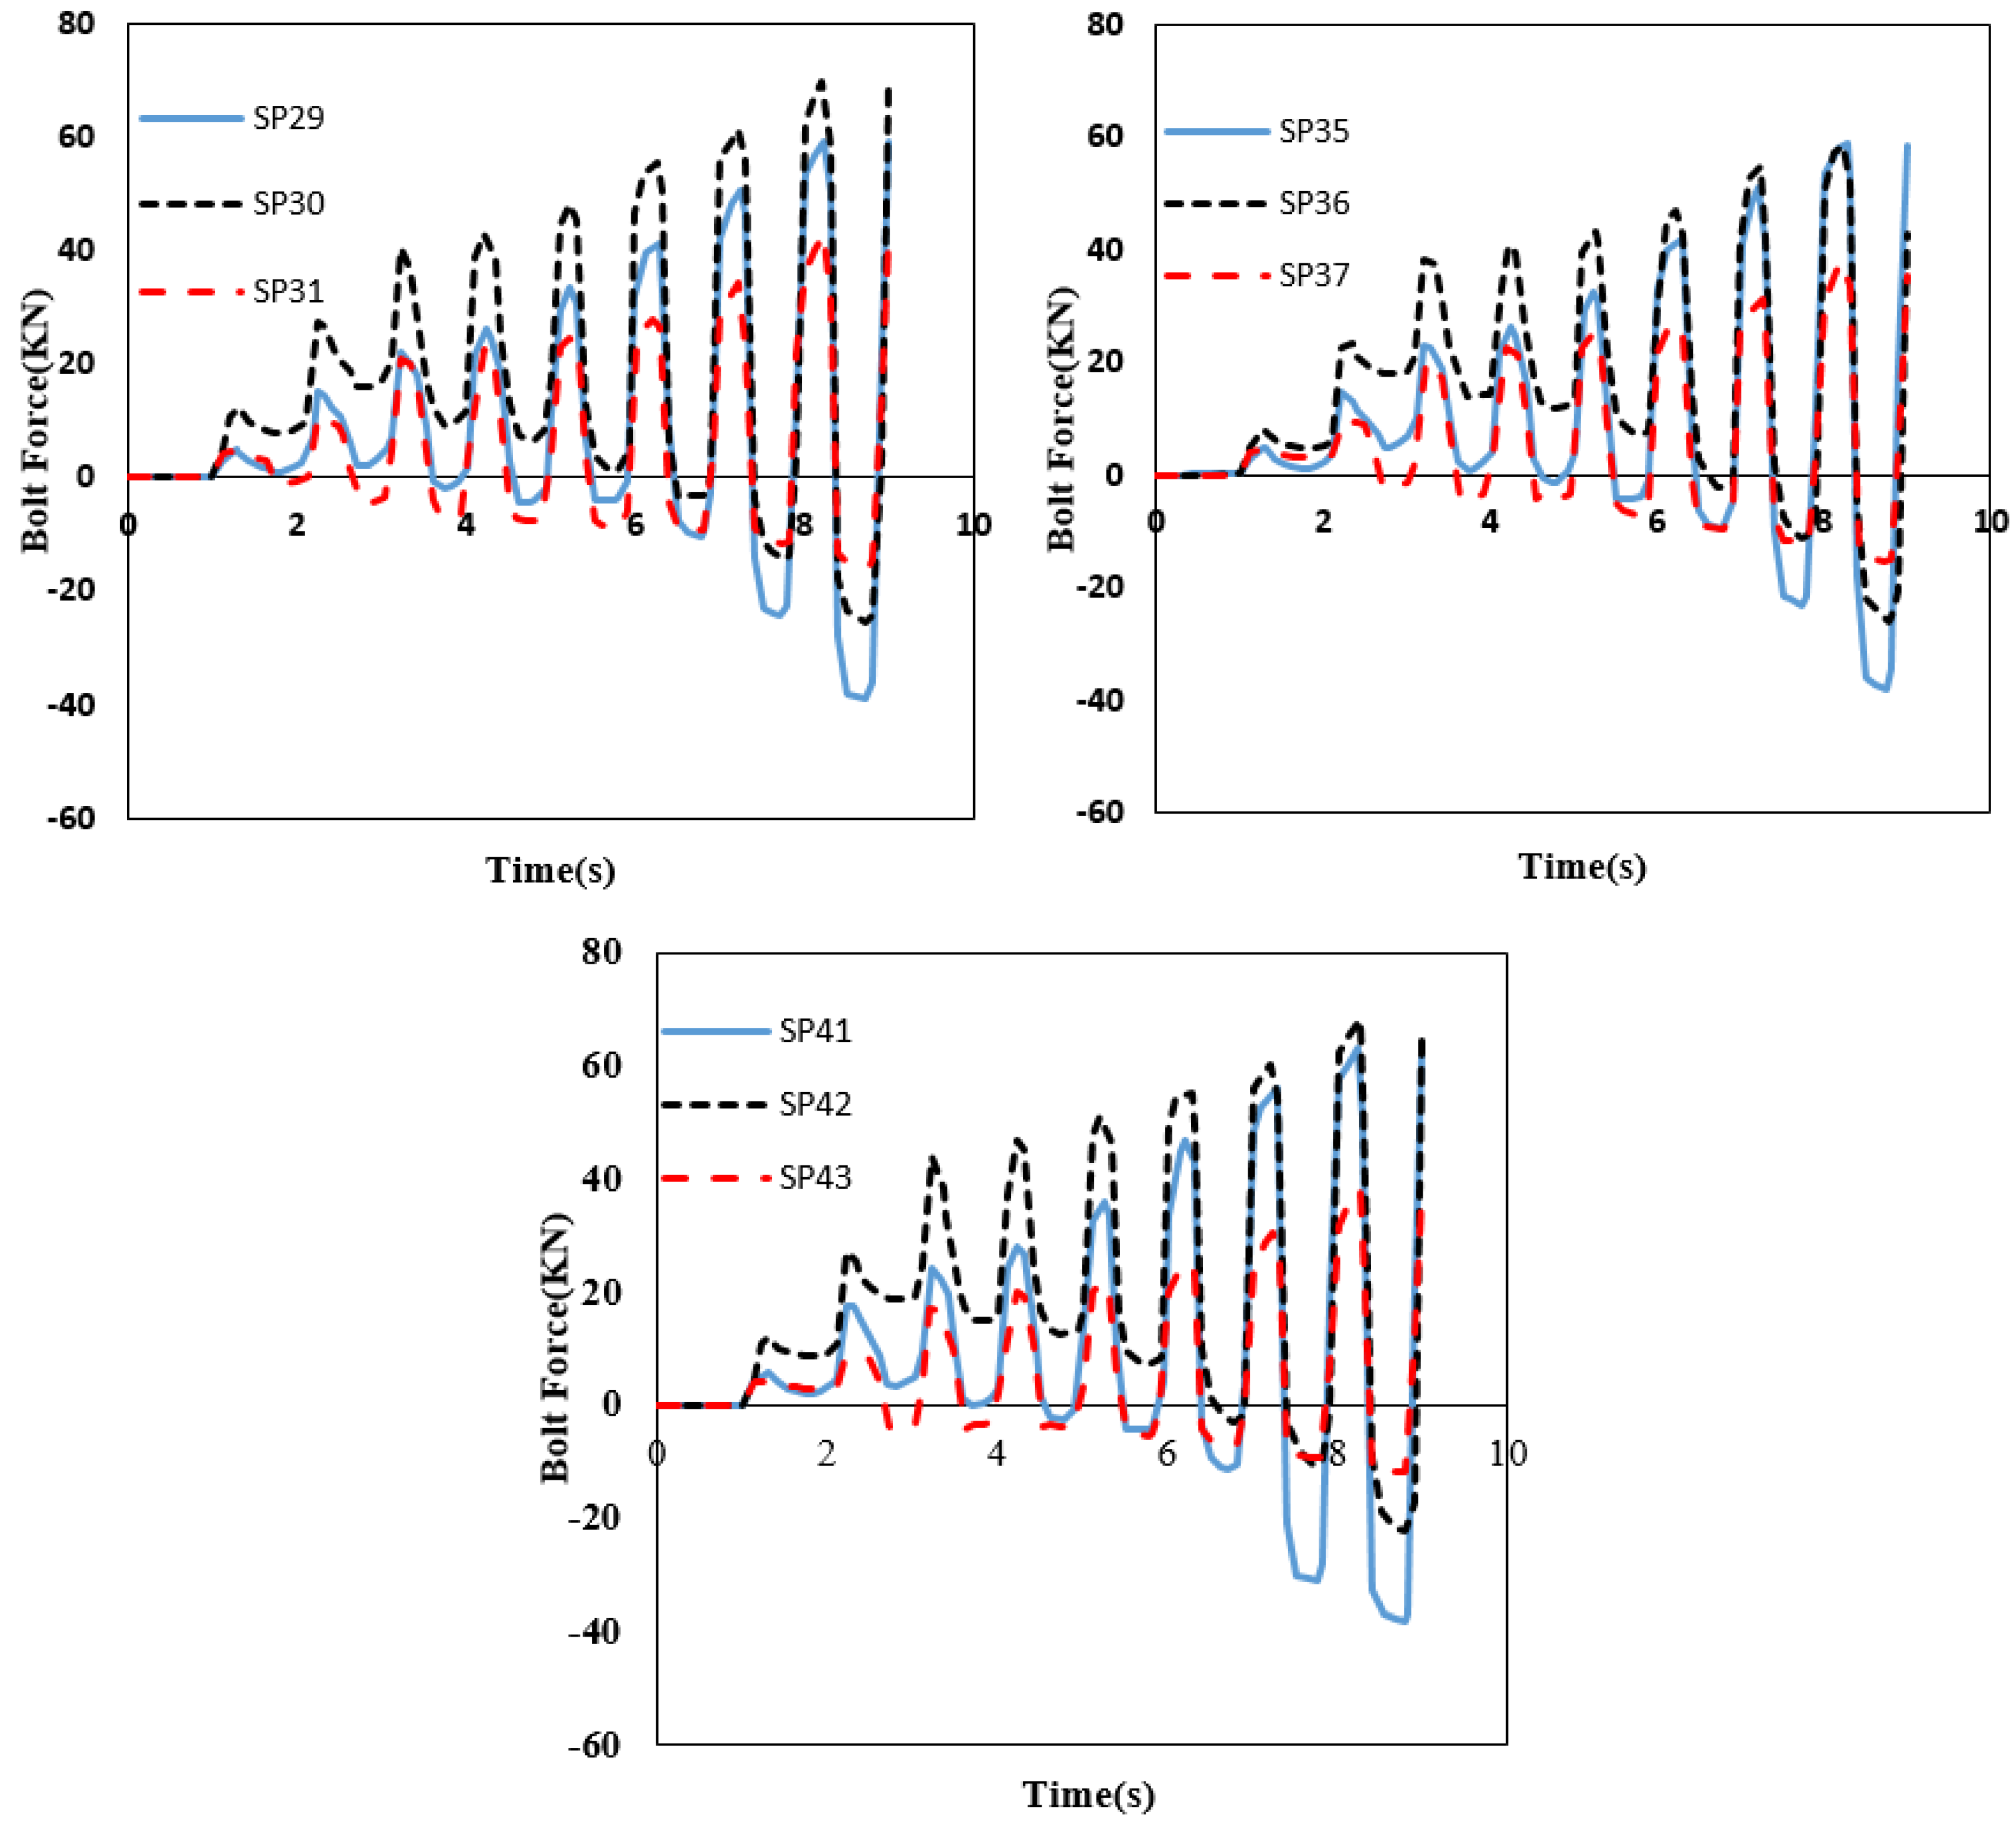
5.2.2. Bolt Force, Strain Energy, and Frictional Energy
6. Conclusions
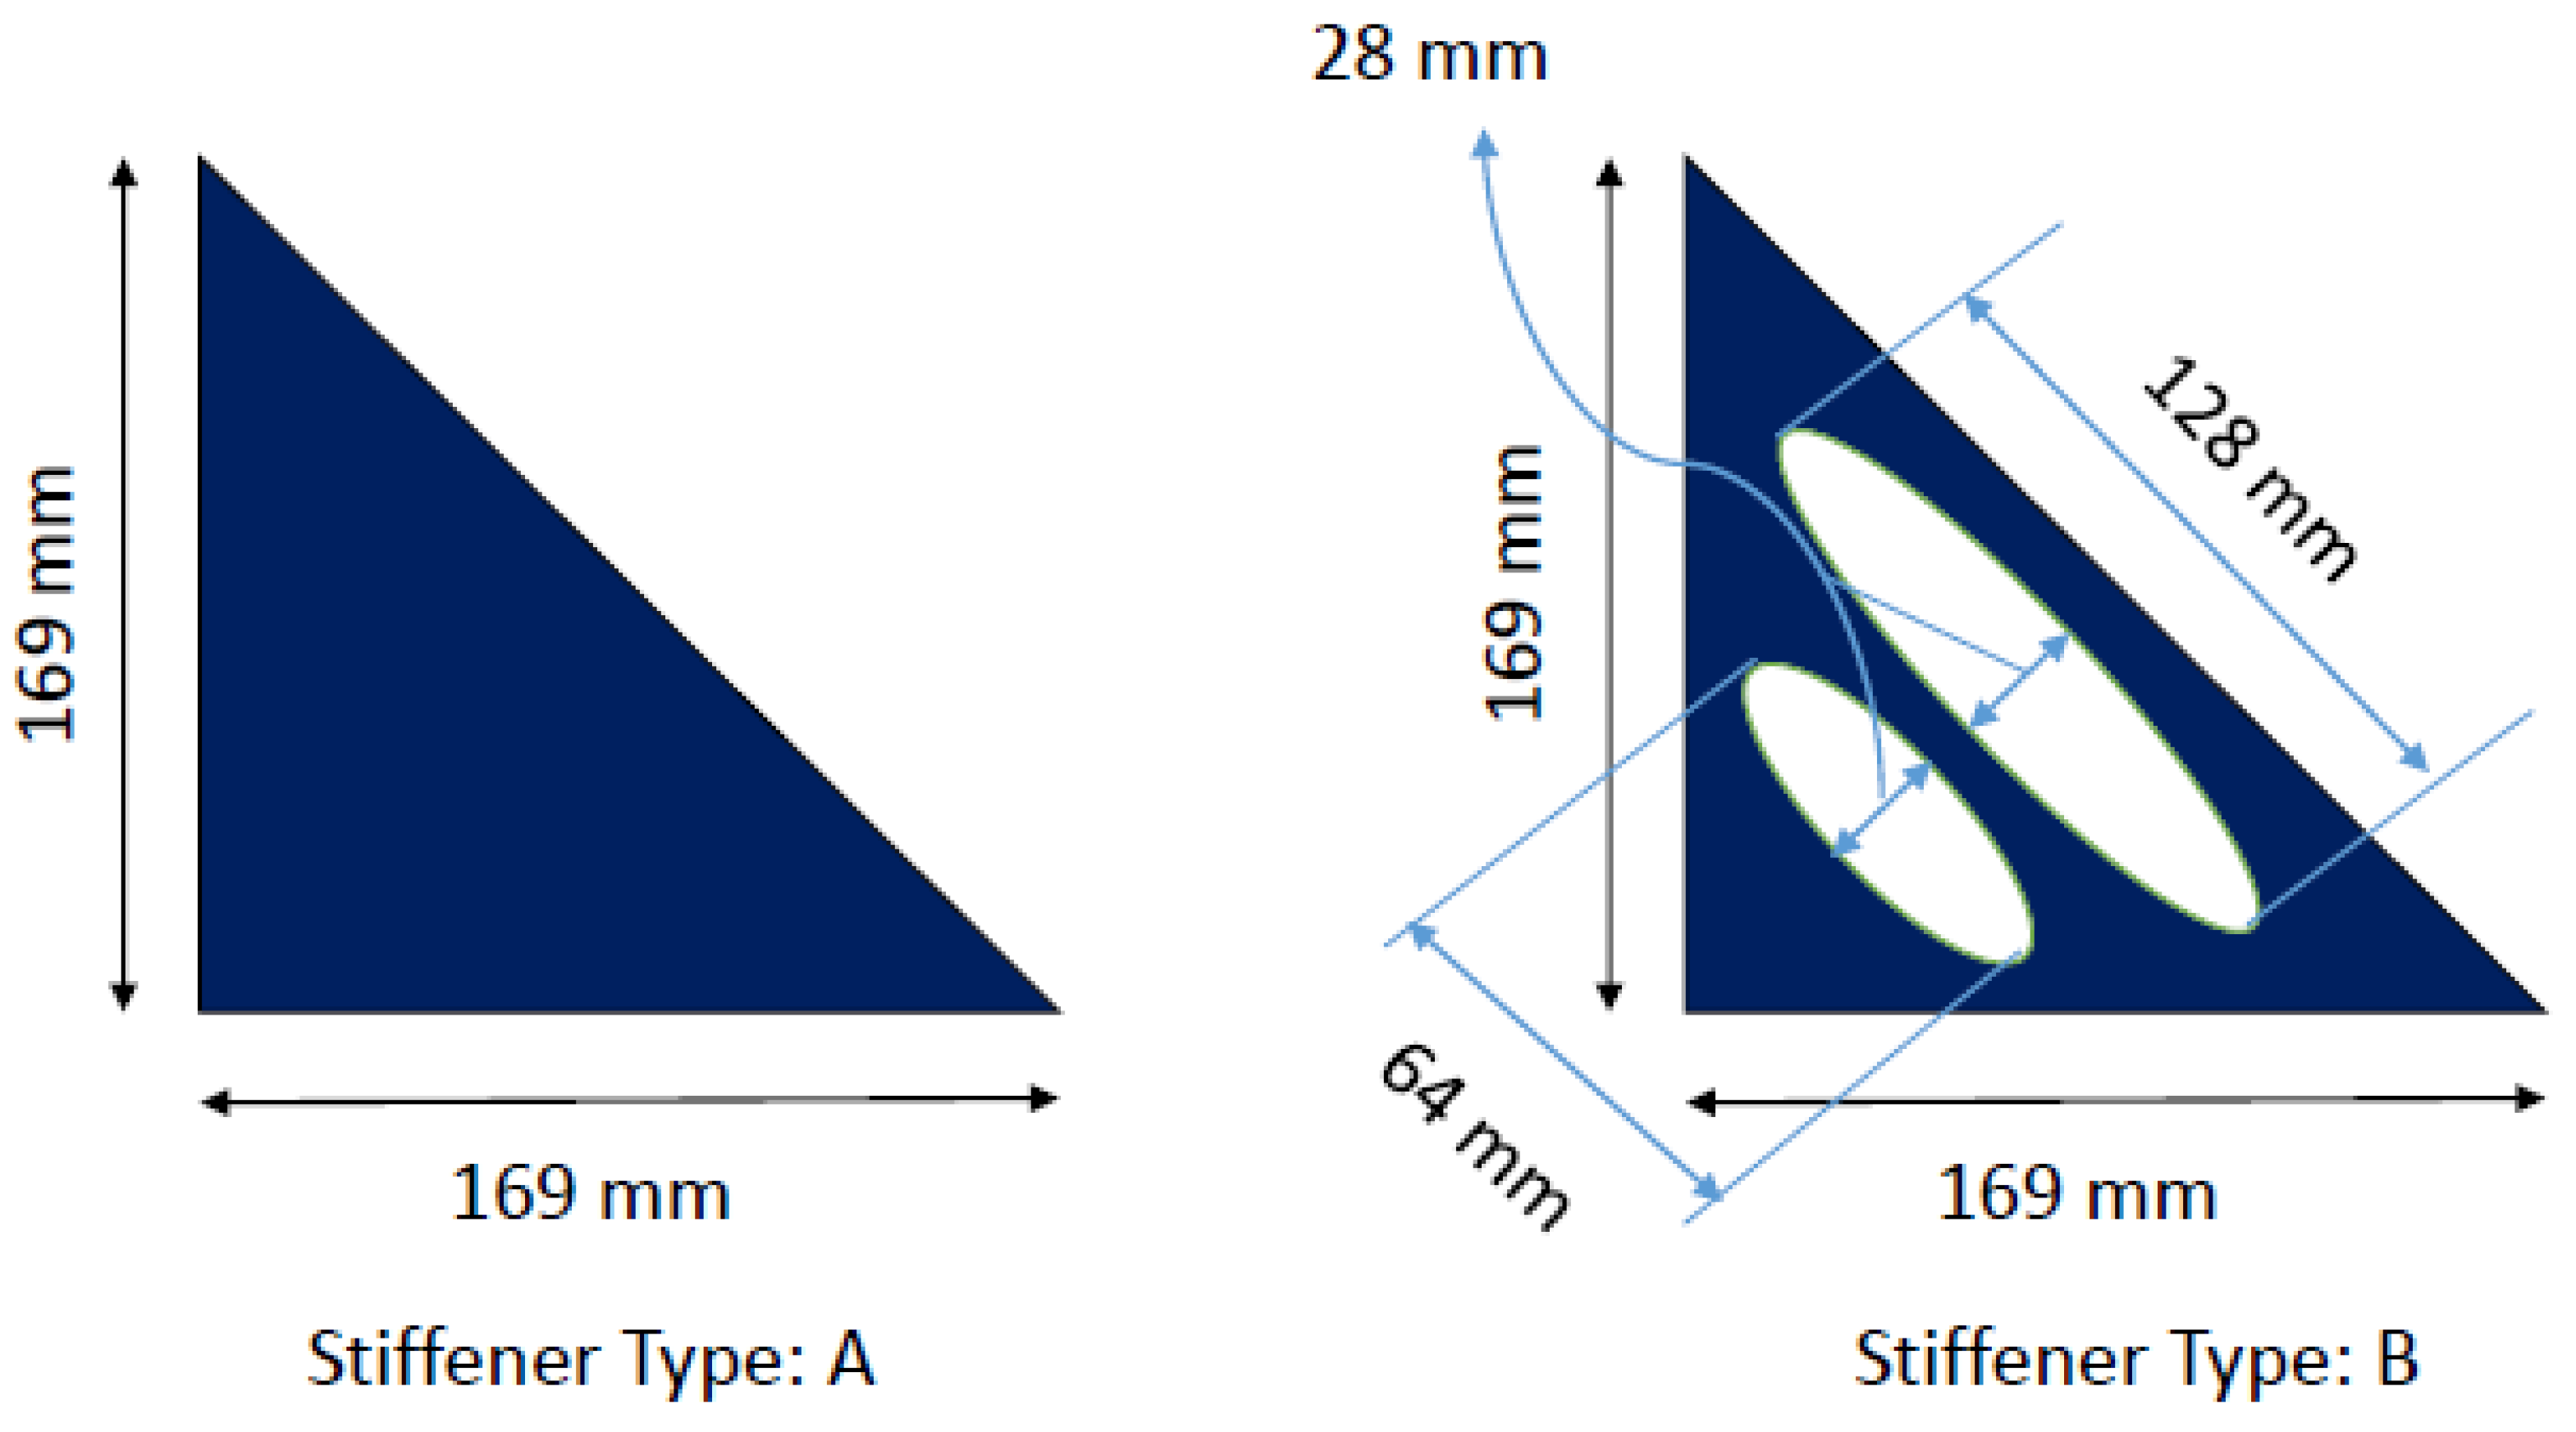
- Investigating the use of different types and thicknesses of stiffeners to determine their impacts on the connection’s performance.
- Examining the effects of different T-stub thickness, yield strength, and bolt preload to improve the ultimate moment and ED capacity of the connection.
- Evaluating the behavior and performance of the connection with different types of loading conditions, such as cyclic, static, and dynamic loading.
- Conducting more comprehensive tests, such as shake table testing, to evaluate the real-world performance of the connection in seismic situations.
- Performing a detailed cost–benefit analysis of using different materials and designs to optimize the practicality and cost-effectiveness of the connection.
- Investigating the behavior of the DST connection under different loading conditions such as cyclic loading, static loading, and dynamic loading.
Author Contributions
Funding
Data Availability Statement
Conflicts of Interest
References
- Grecea, D.; Dinu, F.; Dubină, D. Performance criteria for MR steel frames in seismic zones. J. Constr. Steel Res. 2004, 60, 739–749. [Google Scholar] [CrossRef]
- Carter, C.J.; Iwankiw, N.R. Improved ductility in seismic steel moment frames with dogbone connections. J. Constr. Steel Res. 1998, 46, 448. [Google Scholar] [CrossRef]
- Engelhardt, M.; Winneberger, T.; Zekany, A.; Potyraj, T. Experimental Investigation of Dogbone Moment Connections. Eng. J. 1998, 35, 128–139. [Google Scholar]
- Montuori, R.; Nastri, E.; Piluso, V.; Troisi, M. Influence of connection typology on seismic response of MR-Frames with and without ‘set-backs’. Earthq. Eng. Struct. Dyn. 2017, 46, 5–25. [Google Scholar] [CrossRef]
- Montuori, R.; Nastri, E.; Piluso, V. Advances in theory of plastic mechanism control: Closed form solution for MR-Frames. Earthq. Eng. Struct. Dyn. 2015, 44, 1035–1054. [Google Scholar] [CrossRef]
- Faella, C.; Montuori, R.; Piluso, V.; Rizzano, G. Failure mode control: Economy of semi-rigid frames. In Proceedings of the XI European Conference on Earthquake Engineering, Paris, France, 6–11 September 1998. [Google Scholar]
- Tenchini, A.; D’Aniello, M.; Rebelo, C.; Landolfo, R.; da Silva, L.S.; Lima, L. Seismic performance of dual-steel moment resisting frames. J. Constr. Steel Res. 2014, 101, 437–454. [Google Scholar] [CrossRef]
- Cassiano1a, D.; D’Aniello, M.; Rebelo, C.; Landolfo, R.; da Silva, L.S. Influence of seismic design rules on the robustness of steel moment resisting frames. Steel Compos. Struct. 2016, 21, 479–500. [Google Scholar] [CrossRef]
- Paella, C.; Piluso, V.; Rizzano, G. Structural Steel Semirigid Connections: Theory, Design, and Software; CRC Press: Boca Raton, FL, USA, 2000. [Google Scholar]
- Kong, Z.; Kim, S.-E. Numerical estimation for initial stiffness and ultimate moment of T-stub connections. J. Constr. Steel Res. 2018, 141, 118–131. [Google Scholar] [CrossRef]
- Guo, H.; Liang, G.; Li, Y.; Liu, Y. Q690 high strength steel T-stub tensile behavior: Experimental research and theoretical analysis. J. Constr. Steel Res. 2017, 139, 473–483. [Google Scholar] [CrossRef]
- Liang, G.; Guo, H.; Liu, Y.; Li, Y. Q690 high strength steel T-stub tensile behavior: Experimental and numerical analysis. Thin-Walled Struct. 2018, 122, 554–571. [Google Scholar] [CrossRef]
- Atasoy, M. Determination of Prying Load on Bolted Connections. Master’s Thesis, Middle East Technical University, Ankara, Türkiye, 2012. [Google Scholar]
- Kulak, G.; Fisher, J.; Struik, J. Guide to Design Criteria for Bolted and Riveted Joints, 2nd ed.; American Institute of Steel Construction: Chicago, IL, USA, 2001. [Google Scholar]
- Bezerra, L.M.; Bonilla, J.; Freitas, C.S.; Massicotte, B. Behavior of T-stub steel connections bolted to rigid bases. J. Constr. Steel Res. 2022, 192, 107242. [Google Scholar] [CrossRef]
- American Institute of Steel Construction. Steel Construction Manual, 14th ed.; American Institute of Steel Construction: Chicago, IL, USA, 1927. [Google Scholar]
- Douty, R.; McGuire, W. High strength bolted moment connections. J. Struct. Div. 1965, 91, 101–128. [Google Scholar] [CrossRef]
- Nair, R.; Birkemoe, P.; Munse, W. High strength bolts subject to tension and prying. J. Struct. Div. 1974, 100, 351–372. [Google Scholar] [CrossRef]
- Zhu, X.; Wu, Z. Study on New Bolted T-Stub Connection with Inserted Plates under Axial and Cyclic Loads. Appl. Sci. 2020, 10, 2631. [Google Scholar] [CrossRef] [Green Version]
- ABNT NBR 8800; Design of Steel and Composite Structures for Buildings. ABNT: Rio de Janeiro, Brazil, 2008.
- Struik, J.; de Back, J. Tests on Bolted T-Stubs with Respect to a Bolted Beam-to-Column Connections; Stevin Laboratory, Delft University of Technology: Delft, The Netherlands, 1969; pp. 6–69. [Google Scholar]
- American Institute of Steel Construction. Load and Resistance Factor Design (LRFD) Specifications for Structural Steel Buildings; American Institute of Steel Construction: Chicago, IL, USA, 1986. [Google Scholar]
- American Society of Civil Engineers. Plastic Design in Steel: A Guide and Commentary; Manual and Report of Engineering Practice Ser. No. 41; American Society of Civil Engineers: New York, NY, USA, 1971. [Google Scholar]
- American Institute of Steel Construction. Manual of Steel Construction, 7th ed.; American Institute of Steel Construction: Chicago, IL, USA, 1970. [Google Scholar]
- European Committee for Standardization (CEN). Eurocode 3: Design of Steel Structures—Part 1-1: General Rules and Rules for Buildings; European Committee for Standardization (CEN): Brussels, Belgium, 1992. [Google Scholar]
- Kato, B.; McGuire, W. Analysis of T-stub flange-to-column connections. J. Struct. Div. 1973, 99, 865–888. [Google Scholar] [CrossRef]
- Packer, J.; LJ, M. A limit state design method for the tension region of bolted beam-column connections. Struct. Eng. 1977, 55, 446–458. [Google Scholar]
- Agerskov, H. Analysis of bolted connections subject to prying. J. Struct. Div. 1977, 103, 2145–2163. [Google Scholar] [CrossRef]
- Yee, Y.; Melchers, R. Moment-rotation curves for bolted connections. J. Struct. Eng. 1986, 112, 615–635. [Google Scholar] [CrossRef]
- Astaneh, A. Procedure for design and analysis of hanger-type connections. Eng. J. AISC 1985, 22, 63–66. [Google Scholar]
- Thornton, W.A. Prying action-a general treatment. Eng. J. 1985, 22, 67–75. [Google Scholar]
- Bursi, O.S.; Jaspart, J.P. Calibration of a finite element model for isolated bolted end-plate steel connections. J. Constr. Steel Res. 1997, 44, 225–262. [Google Scholar] [CrossRef]
- Swanson, J.A.; Kokan, D.S.; Leon, R.T. Advanced finite element modeling of bolted T-stub connection components. J. Constr. Steel Res. 2002, 58, 1015–1031. [Google Scholar] [CrossRef]
- Girão Coelho, A.M.; Bijlaard, F.S.K.; Simões da Silva, L. Experimental assessment of the ductility of extended end plate connections. Eng. Struct. 2004, 26, 1185–1206. [Google Scholar] [CrossRef]
- Girão Coelho, A.M. Rotation capacity of partial strength steel joints with three-dimensional finite element approach. Comput. Struct. 2013, 116, 88–97. [Google Scholar] [CrossRef]
- Abidelah, A.; Bouchaïr, A.; Kerdal, D.E. Influence of the flexural rigidity of the bolt on the behavior of the T-stub steel connection. Eng. Struct. 2014, 81, 181–194. [Google Scholar] [CrossRef]
- Barata, P.; Ribeiro, J.; Rigueiro, C.; Santiago, A.; Rodrigues, J.P. Assessment of the T-stub joint component at ambient and elevated temperatures. Fire Saf. J. 2014, 70, 1–13. [Google Scholar] [CrossRef]
- Elflah, M.; Theofanous, M.; Dirar, S. Behaviour of stainless steel beam-to-column joints-part 2: Numerical modelling and parametric study. J. Constr. Steel Res. 2019, 152, 194–212. [Google Scholar] [CrossRef] [Green Version]
- Rostami, A.; Moghadam, A.S.; Hosseini, M.; Asghari, N. Evaluation of Formation of Plastic Hinge and Seismic Behavior of Steel Structures Due to Soil–Structure–Tunnel Interaction. J. Earthq. Tsunami 2020, 14, 2050014. [Google Scholar] [CrossRef]
- Girão Coelho, A.M.; Bijlaard, F.S.K.; Gresnigt, N.; Simões da Silva, L. Experimental assessment of the behaviour of bolted T-stub connections made up of welded plates. J. Constr. Steel Res. 2004, 60, 269–311. [Google Scholar] [CrossRef]
- Gil, B.; Goñi, R.; Bayo, E. Initial stiffness and strength characterization of minor axis T-stub under out-of-plane bending. J. Constr. Steel Res. 2018, 140, 208–221. [Google Scholar] [CrossRef]
- Sumner, E.; Mays, T.; Murray, T. Cyclic Testing of Bolted Moment End-Plate Connections; Research Report SAC/BD-00/21. CE/VPI-ST 00/03; Department of Civil and Environmental Engineering, Virginia Polytechnic Institute and State University: Blacksburg, VA, USA, 2000. [Google Scholar]
- Gerami, M.; Saberi, H.; Saberi, V.; Saedi Daryan, A. Cyclic behavior of bolted connections with different arrangement of bolts. J. Constr. Steel Res. 2011, 67, 690–705. [Google Scholar] [CrossRef]
- Özkılıç, Y.O. Cyclic and monotonic performance of stiffened extended end-plate connections with large-sized bolts and thin end-plates. Bull. Earthq. Eng. 2022, 20, 7441–7475. [Google Scholar] [CrossRef]
- Özkılıç, Y.O.; Topkaya, C. Extended end-plate connections for replaceable shear links. Eng. Struct. 2021, 240, 112385. [Google Scholar] [CrossRef]
- Özkılıç, Y.O. A comparative study on yield line mechanisms for four bolted extended end plated connection. J. Struct. Mech. 2021, 7, 93–106. [Google Scholar] [CrossRef]
- Özkılıç, Y.O. Investigation of the effects of bolt diameter and end-plate thickness on the capacity and failure modes of end-plated beam-to-column connections. Res. Eng. Struct. Mater. 2021, 7, 445–463. [Google Scholar] [CrossRef]
- Mistakidis, E.S.; Baniotopoulos, C.C.; Bisbos, C.D.; Panagiotopoulos, P.D. Steel T-Stub connections under static loading: An effective 2-D numerical model. J. Constr. Steel Res. 1997, 44, 51–67. [Google Scholar] [CrossRef]
- European Commission. Numerical Aspects for the Simulation of End Plate Connections by the Finite Element Method; European Commission: Brussels, Belgium, 1999; pp. 13–31. [Google Scholar]
- Sherbourne, A.N.; Bahaari, M.R. 3D simulation of bolted connections to unstiffened columns—I. T-stub connections. J. Constr. Steel Res. 1996, 40, 169–187. [Google Scholar] [CrossRef]
- Bursi, O.S.; Jaspart, J.-P. A refined finite element model for tee-stub and endplate steel connections. In Proceedings of the Giornate Italiane della Costruzione in Acciaio, Riva del Garda, Italy, 15–18 October 1995. [Google Scholar]
- Bursi, O.S.; Jaspart, J. Finite element based models for the analysis of bolted beam-to-column steel connections. In Proceedings of the IABSE Colloquium on Semi-Rigid Structural Connections, Istanbul, Turkey, 25–27 September 1996. [Google Scholar]
- Bursi, O.S.; Jaspart, J.P. Basic issues in the finite element simulation of extended end plate connections. Comput. Struct. 1998, 69, 361–382. [Google Scholar] [CrossRef]
- Bursi, O.S.; Jaspart, J.P. Benchmarks for finite element modelling of bolted steel connections. J. Constr. Steel Res. 1997, 43, 17–42. [Google Scholar] [CrossRef]
- Hantouche, E.; Kukreti, A.; Rassati, G.; Swanson, J. Prying models for strength in thick-flange built-up T-stubs with complete joint penetration and fillet welds. J. Struct. Eng. 2015, 141, 04014102. [Google Scholar] [CrossRef]
- Hantouche, E.; Kukreti, A.R.; Rassati, G.A. Investigation of secondary prying in thick built-up T-stub connections using nonlinear finite element modeling. Eng. Struct. 2012, 36, 113–122. [Google Scholar] [CrossRef]
- Hantouche, E.; Kukreti, A.; Rassati, G.; Swanson, J. Modified stiffness model for thick flange in built-up T-stub connections. J. Constr. Steel Res. 2013, 81, 76–85. [Google Scholar] [CrossRef]
- Hantouche, E.; Abboud, N.H. Stiffness modeling of bolted thick built-up T-stub connections including secondary prying effect. J. Constr. Steel Res. 2014, 95, 279–289. [Google Scholar] [CrossRef]
- Hantouche, E.; Rassati, G.; Kukreti, A.; Swanson, J. Built-up T-stub connections for moment resisting frames: Experimental and finite element investigation for prequalification. Eng. Struct. 2012, 43, 139–148. [Google Scholar] [CrossRef]
- Lemonis, M.; Gantes, C. Finite Element Modeling of T-Stub Steel Connections. In Proceedings of the 4th GRACM Congress on Computational Mechanics GRACM, Patras, Greece, 27–29 June 2002. [Google Scholar]
- Lemonis, M.; Gantes, C. Numerical analysis of simple and preloaded T-stub steel connections. In Computational Fluid and Solid Mechanics 2003; Bathe, K.J., Ed.; Elsevier Science Ltd.: Oxford, UK, 2003; pp. 414–417. [Google Scholar] [CrossRef]
- Gantes, C.J.; Lemonis, M.E. Influence of equivalent bolt length in finite element modeling of T-stub steel connections. Comput. Struct. 2003, 81, 595–604. [Google Scholar] [CrossRef]
- Lemonis, M.; Gantes, C. Incremental modeling of T-stub connections. J. Mech. Mater. Struct. 2006, 1, 1135–1159. [Google Scholar] [CrossRef] [Green Version]
- Soltani, R.; Kerdal, D. Behaviour of elementary bolted steel T-stub connections: An evaluation of EC3 design procedure. Turk. J. Eng. Environ. Sci. 2011, 35, 1–20. [Google Scholar]
- Ceniceros, J.F. Numerical-Informational Methodology for Characterising Steel Bolted Components Coupling Finite Element Simulations and Soft Computing Techniques; Universidad de La Rioja: Logroño, Spain, 2015. [Google Scholar]
- Fernandez-Ceniceros, J.; Sanz-Garcia, A.; Antoñanzas-Torres, F.; Martinez-de-Pison, F.J. A numerical-informational approach for characterising the ductile behaviour of the T-stub component. Part 1: Refined finite element model and test validation. Eng. Struct. 2015, 82, 236–248. [Google Scholar] [CrossRef]
- Fernandez-Ceniceros, J.; Sanz-Garcia, A.; Antoñanzas-Torres, F.; Martinez-de-Pison, F.J. A numerical-informational approach for characterising the ductile behaviour of the T-stub component. Part 2: Parsimonious soft-computing-based metamodel. Eng. Struct. 2015, 82, 249–260. [Google Scholar] [CrossRef]
- Kombate, T.J.D.L.C.; Taşkın, K. State-of-the-art review on the behaviour of T-stubs and prying action. J. Constr. Steel Res. 2022, 191, 107203. [Google Scholar] [CrossRef]
- Bravo, M.A.; Herrera, R.A. Performance under cyclic load of built-up T-stubs for Double T moment connections. J. Constr. Steel Res. 2014, 103, 117–130. [Google Scholar] [CrossRef]
- Herrera, R.A.; Bravo, M.; Gómez, G.; Aedo, G. Performance of built-up T-stubs for Double T moment connections. J. Constr. Steel Res. 2013, 88, 289–295. [Google Scholar] [CrossRef]
- Vahdati, V.J.; Yaghoubi, S.; Torabipour, A.; Correia, J.A.F.O.; Fazeres-Ferradosa, T.; Taveira-Pinto, F. Combined solutions to reduce scour around complex foundations: An experimental study. Mar. Syst. Ocean Technol. 2020, 15, 81–93. [Google Scholar] [CrossRef]
- Ribeiro, J.; Santiago, A.; Rigueiro, C.; Barata, P.; Veljkovic, M. Numerical assessment of T-stub component subjected to impact loading. Eng. Struct. 2016, 106, 450–460. [Google Scholar] [CrossRef]
- Özkılıç, Y.O.; Topkaya, C. The plastic and the ultimate resistance of four-bolt extended end-plate connections. J. Constr. Steel Res. 2021, 181, 106614. [Google Scholar] [CrossRef]
- Özkılıç, Y.O. The effects of stiffener configuration on stiffened T-stubs. Steel Compos. Struct. 2022, 44, 475–488. [Google Scholar]
- Özkılıç, Y.O. The capacities of unstiffened T-stubs with thin plates and large bolts. J. Constr. Steel Res. 2021, 186, 106908. [Google Scholar] [CrossRef]
- Özkılıç, Y.O. The capacities of thin plated stiffened T-stubs. J. Constr. Steel Res. 2021, 186, 106912. [Google Scholar] [CrossRef]
- Daryan, A.S.; Sadri, M.; Saberi, H.; Saberi, V.; Moghadas, A.B. Behavior of semi-rigid connections and semi-rigid frames. Struct. Des. Tall Spec. Build. 2014, 23, 210–238. [Google Scholar] [CrossRef]
- Shiravand, M.R.; Torabipour, A.; Mahboubi, S. Parametric Study on Effect of Adding Stiffener to Post-tensioned Steel Connection. Int. J. Steel Struct. 2019, 19, 478–494. [Google Scholar] [CrossRef]
- Abdollahzadeh, G.; BarehKheil, N.A.; Torabipour, A. Moment–rotation response of post-tensioned self-centring beam–column connection. Proc. Inst. Civ. Eng. Struct. Build. 2020, 173, 440–457. [Google Scholar] [CrossRef]
- Torabipour, A.; Abdollahi, A.; Yaghoubi, S. Assess the Effectiveness of SMA on Response of Steel Connection with PT Strands. KSCE J. Civ. Eng. 2019, 23, 5133–5142. [Google Scholar] [CrossRef]
- Maghsoudi, A.; Maghsoudi, M.; Haghighi, H. FE Modeling and Experimental Comparison of RC Beams Consisting Shape Memory Alloys under Cyclic Loading. Amirkabir J. Civ. Eng. 2018, 49, 745–754. [Google Scholar] [CrossRef]
- Asada, H.; Tanaka, T.; Yamada, S.; Matoba, H. Proposal for seismic retrofit of beam-to-column connection by the addition of H-section haunches to beams using bolt connection. Int. J. Steel Struct. 2014, 14, 865–871. [Google Scholar] [CrossRef]
- Sebbagh, H.R.; Kerdal, D.E.D.; Abidelah, A.; Bouchaïr, A. T-stubs with two and four bolts under monotonic and cyclic loading. J. Constr. Steel Res. 2021, 178, 106486. [Google Scholar] [CrossRef]
- Yadupriya, M.C.; Rajeevan, B. Numerical analysis on bolted T-stub to square hollow section connections under tension. 2022. Available online: https://ssrn.com/abstract=4269427 (accessed on 6 November 2022).
- Tartaglia, R.; D’Aniello, M.; Zimbru, M. Experimental and numerical study on the T-Stub behaviour with preloaded bolts under large deformations. Structures 2020, 27, 2137–2155. [Google Scholar] [CrossRef]
- Wang, Y.; Qiao, X.; Jia, L.; Zhang, T.; Jiang, Q. Experimental research on seismic behavior of stainless steel beam-column connections with different link modes. J. Southeast Univ. 2018, 48, 316–322. [Google Scholar]
- Liu, M.; Shi, G. Cyclic loading tests of duplex stainless steel beam-to-column joints with WUF-W connections. In Proceedings of the Ninth International Conference on Advances in Steel Structures (ICASS), Hong Kong, China, 5–7 December 2018; pp. 947–956. [Google Scholar]
- Bu, Y.; Wang, Y.; Zhao, Y. Study of stainless steel bolted extended end-plate joints under seismic loading. Thin-Walled Struct. 2019, 144, 106255. [Google Scholar] [CrossRef]
- Yuan, H.X.; Liu, X.H.; Liu, J.L.; Theofanous, M. Cyclic behaviour and hysteretic model of austenitic stainless steel bolted T-stubs. J. Constr. Steel Res. 2021, 182, 106659. [Google Scholar] [CrossRef]
- Zhao, M.S.; Lee, C.K.; Chiew, S.P. Tensile behavior of high performance structural steel T-stub joints. J. Constr. Steel Res. 2016, 122, 316–325. [Google Scholar] [CrossRef] [Green Version]
- Sun, F.F.; Xue, X.Y.; Xiao, Y.; Le, Y.M.; Li, G.Q. Effect of welding and complex loads on the high-strength steel T-stub connection. J. Constr. Steel Res. 2018, 150, 76–86. [Google Scholar] [CrossRef]
- Wang, Z.Y.; Tizani, W.; Wang, Q.Y. Strength and initial stiffness of a blind-bolt connection based on the T-stub model. Eng. Struct. 2010, 32, 2505–2517. [Google Scholar] [CrossRef]
- Yang, J.-G.; Lee, S.-K.; Moon, J.-K.; Baek, M.-C. Prediction models for the initial rotational stiffness and ultimate plastic moment for a double split tee connection. Int. J. Steel Struct. 2014, 14, 213–222. [Google Scholar] [CrossRef]
- SAC Joint Venture. Protocol for Fabrication, Inspection, Testing, and Documentation of Beam-Column Connection Tests and Other Experimental Specimens; Rep. No. SAC/BD-97; SAC Joint Venture: Redwood City, CA, USA, 1997; p. 2. [Google Scholar]
- Liu, Y.; Málaga-Chuquitaype, C.; Elghazouli, A.Y. Response and component characterisation of semi-rigid connections to tubular columns under axial loads. Eng. Struct. 2012, 41, 510–532. [Google Scholar] [CrossRef] [Green Version]
- Massimo, L.; Gianvittorio, R.; Aldina, S.; da Silva Luis, S. Experimental analysis and mechanical modeling of T-stubs with four bolts per row. J. Constr. Steel Res. 2014, 101, 158–174. [Google Scholar] [CrossRef]
- De Matteis, G.; Mandara, A.; Mazzolani, F.M. T-stub aluminium joints: Influence of behavioural parameters. Comput. Struct. 2000, 78, 311–327. [Google Scholar] [CrossRef]
- Wang, Z.Y.; Wang, Q.-Y. Yield and ultimate strengths determination of a blind bolted endplate connection to square hollow section column. Eng. Struct. 2016, 111, 345–369. [Google Scholar] [CrossRef]
- Yapici, O.; Theofanous, M.; Yuan, H.; Dirar, S.; Afshan, S. Numerical simulation and design of ferritic stainless steel bolted T-stubs in tension. J. Constr. Steel Res. 2022, 198, 107555. [Google Scholar] [CrossRef]
- Royal Civil Service Commission. Specification for Structural Joints Using High-Strength Bolts; American Institute of Steel Construction: Chicago, IL, USA, 2014. [Google Scholar]
- American Institute of Steel Construction. Specification for Structural Steel Buildings. In An American National Standard; American Institute of Steel Construction: Chicago, IL, USA, 2016. [Google Scholar]
- DesRoches, R.; McCormick, J.; Delemont, M. Cyclic properties of superelastic shape memory alloy wires and bars. J. Struct. Eng. 2004, 130, 38–46. [Google Scholar] [CrossRef]
- Wang, B.; Zhu, S.; Qiu, C.-X.; Jin, H. High-performance self-centering steel columns with shape memory alloy bolts: Design procedure and experimental evaluation. Eng. Struct. 2019, 182, 446–458. [Google Scholar] [CrossRef]
- Wang, B.; Zhu, S. Cyclic tension–compression behavior of superelastic shape memory alloy bars with buckling-restrained devices. Constr. Build. Mater. 2018, 186, 103–113. [Google Scholar] [CrossRef]
- Pereiro-Barceló, J.; Bonet, J.L.; Cabañero-Escudero, B.; Martínez-Jaén, B. Cyclic behavior of hybrid RC columns using High-Performance Fiber-Reinforced Concrete and Ni-Ti SMA bars in critical regions. Compos. Struct. 2019, 212, 207–219. [Google Scholar] [CrossRef]
- Chowdhury, M.A.; Rahmzadeh, A.; Moradi, S.; Alam, M.S. Feasibility of using reduced length superelastic shape memory alloy strands in post-tensioned steel beam–column connections. J. Intell. Mater. Syst. Struct. 2019, 30, 283–307. [Google Scholar] [CrossRef]
- Özkılıç, Y.O. A new replaceable fuse for moment resisting frames: Replaceable bolted reduced beam section connections. Steel Compos. Struct. 2020, 35, 353–370. [Google Scholar] [CrossRef]
- Ricles, J.M.; Sause, R.; Garlock, M.M.; Zhao, C. Posttensioned Seismic-Resistant Connections for Steel Frames. J. Struct. Eng. 2001, 127, 113–121. [Google Scholar] [CrossRef]
- Bozkurt, M.B.; Kazemzadeh Azad, S.; Topkaya, C. Development of detachable replaceable links for eccentrically braced frames. Earthq. Eng. Struct. Dyn. 2019, 48, 1134–1155. [Google Scholar] [CrossRef]
- Bozkurt, M.B.; Topkaya, C. Replaceable links with direct brace attachments for eccentrically braced frames. Earthq. Eng. Struct. Dyn. 2017, 46, 2121–2139. [Google Scholar] [CrossRef]
- Bozkurt, M.B.; Topkaya, C. Replaceable links with gusseted brace joints for eccentrically braced frames. Soil Dyn. Earthq. Eng. 2018, 115, 305–318. [Google Scholar] [CrossRef]
- Özkılıç, Y.O. Optimized stiffener detailing for shear links in eccentrically braced frames. Steel Compos. Struct. Int. J. 2021, 39, 35–50. [Google Scholar] [CrossRef]
- Özkılıç, Y.O.; Bozkurt, M.B.; Topkaya, C. Mid-spliced end-plated replaceable links for eccentrically braced frames. Eng. Struct. 2021, 237, 112225. [Google Scholar] [CrossRef]
- Özkılıç, Y.O. Interaction of flange and web slenderness, overstrength factor and proposed stiffener arrangements for long links. J. Constr. Steel Res. 2022, 190, 107150. [Google Scholar] [CrossRef]
- Korkmaz, H.H.; Dere, Y.; Özkılıç, Y.O.; Bozkurt, M.B.; Ecemiş, A.S.; Özdoner, N. Excessive snow induced steel roof failures in Turkey. Eng. Fail. Anal. 2022, 141, 106661. [Google Scholar] [CrossRef]
- El-Tawil, S.; Mikesell, T.; Vidarsson, E.; Kunnath, S. Strength and Ductility of FR Welded-Bolted Connections; Department of Civil and Environmental Engineering, University of Central Florida: Orlando, FL, USA, 1998; p. 150. [Google Scholar]
- Fang, C.; Wang, W.; He, C.; Chen, Y. Self-centring behaviour of steel and steel-concrete composite connections equipped with NiTi SMA bolts. Eng. Struct. 2017, 150, 390–408. [Google Scholar] [CrossRef]
- Fang, C.; Yam, M.C.H.; Lam, A.C.C.; Xie, L. Cyclic performance of extended end-plate connections equipped with shape memory alloy bolts. J. Constr. Steel Res. 2014, 94, 122–136. [Google Scholar] [CrossRef]
- Chopra, A.K. Dynamics of Structures: Theory and Applications to Earthquake Engineering, 4th ed.; Prentice Hall: Englewood Cliffs, NJ, USA, 2011. [Google Scholar]
- He, M.-j.; Liu, H.-f. Comparison of glulam post-to-beam connections reinforced by two different dowel-type fasteners. Constr. Build. Mater. 2015, 99, 99–108. [Google Scholar] [CrossRef]
- Elmenshawi, A.; Brown, T. Hysteretic energy and damping capacity of flexural elements constructed with different concrete strengths. Eng. Struct. 2010, 32, 297–305. [Google Scholar] [CrossRef]
- Speicher, M.S.; DesRoches, R.; Leon, R.T. Experimental results of a NiTi shape memory alloy (SMA)-based recentering beam-column connection. Eng. Struct. 2011, 33, 2448–2457. [Google Scholar] [CrossRef]
- American Society for Testing and Materials. Standard Test Methods for Cyclic (Reversed) Load Test for Shear Resistance of Vertical Elements of the Lateral Force Resisting Systems for Buildings; American Society for Testing and Materials: West Conshohocken, PA, USA, 2019; p. 15. [Google Scholar]


| Components | Fy (MPa) | Fu (MPa) |
|---|---|---|
| Bolt | 912.7 | 976.1 |
| T-stub | 399.61 | 435.85 |
| Beam or column | 399.61 | 435.85 |
| Sample Model | M0 (KN.m) | max (%) | Mmax (KN.m) | |
|---|---|---|---|---|
| G260-T15-B350 | PS1Ex | 257.62 | 0.087 | 451.22 |
| PS1Nu | 251.88 | 0.09 | 442.48 | |
| Error percent | 2.23 | 3.45 | 1.937 | |
| G310-T15-B400 | PS2Ex | 197.42 | 0.098 | 402.4 |
| PS2Nu | 195.23 | 0.1 | 399.61 | |
| Error percent | 1.11 | 2.041 | 0.69 | |
| G260-T19-B350 | PS3Ex | 411.11 | 0.037 | 454.36 |
| PS3Nu | 408.34 | 0.038 | 435.85 | |
| Error percent | 0.674 | 2.7 | 4.07 | |
| G310-T19-B400 | PS4Ex | 329.86 | 0.13 | 448.68 |
| PS4Nu | 324.52 | 0.125 | 443.17 | |
| Error percent | 1.62 | 3.84 | 1.23 | |
| G260-T21-B350 | PS5Ex | 458.08 | 0.023 | 502.84 |
| PS5Nu | 452.34 | 0.024 | 495.51 | |
| Error percent | 1.253 | 4.37 | 1.46 | |
| G310-T21-B400 | PS6Ex | 411.78 | 0.0385 | 447.97 |
| PS6Nu | 407.47 | 0.04 | 440.73 | |
| Error percent | 1.05 | 3.9 | 1.62 | |
| Sample Model | tf (mm) | Fyt (T-Stub) (KN) | Bolt Pretension (KN) | * No (Bolt Beam) | Fyb (Bolt) (KN) | L1 (mm) | L2 (mm) | Stiffener of T-Stub (mm) | Equipped SMA Material |
|---|---|---|---|---|---|---|---|---|---|
| SP01 | 19 | 538.5 | 165 | 6 | 912.7 | 50 | 150 | …. | …. |
| SP02 | 19 | 538.5 | 165 | 6 | 912.7 | 100 | 100 | …. | …. |
| SP03 | 19 | 538.5 | 165 | 6 | 912.7 | 150 | 50 | …. | …. |
| SP04 | 19 | 538.5 | 165 | 2 | 912.7 | 100 | 100 | …. | …. |
| SP05 | 19 | 538.5 | 165 | 4 | 912.7 | 100 | 100 | …. | …. |
| SP06 | 19 | 538.5 | 165 | 6 | 950.7 | 100 | 100 | …. | …. |
| SP07 | 19 | 538.5 | 165 | 6 | 874.7 | 100 | 100 | …. | …. |
| SP08 | 19 | 620 | 165 | 6 | 912.7 | 100 | 100 | …. | …. |
| SP09 | 19 | 458 | 165 | 6 | 912.7 | 100 | 100 | …. | …. |
| SP10 | 23 | 538.5 | 165 | 6 | 912.7 | 100 | 100 | …. | …. |
| SP11 | 15 | 538.5 | 165 | 6 | 912.7 | 100 | 100 | …. | …. |
| SP12 | 19 | 538.5 | 190 | 6 | 912.7 | 100 | 100 | …. | …. |
| SP13 | 19 | 538.5 | 140 | 6 | 912.7 | 100 | 100 | …. | …. |
| SP14 | 19 | 538.5 | 165 | 6 | * | 100 | 100 | …. | Bolt column |
| SP15 | 19 | * | 165 | 6 | 912.7 | 100 | 100 | …. | T-stub |
| SP16 | 19 | 538.5 | 165 | 6 | 912.7 | 100 | 100 | 3PL169 × 15 | …. |
| SP17 | 19 | 538.5 | 165 | 6 | 912.7 | 100 | 100 | 3PL169 × 25 | …. |
| SP18 | 19 | 538.5 | 165 | 6 | 912.7 | 100 | 100 | PL169 × 15 | …. |
| SP19 | 19 | 538.5 | 165 | 6 | 912.7 | 100 | 100 | PL169 × 25 | …. |
| Specimen | SP01 | SP02 | SP03 | SP04 | SP05 | SP06 | SP07 | SP08 | SP09 | SP10 |
|---|---|---|---|---|---|---|---|---|---|---|
| Mmax(KN.m) | 455.25 | 450.9 | 427.82 | 399.14 | 447.83 | 453.94 | 448.2 | 455.36 | 444.46 | 465.3 |
| ED(KN.m) | 142.9 | 138 | 110.2 | 87.96 | 136.7 | 139.9 | 135.9 | 140.81 | 135.34 | 140 |
| RD(mm) | 28.65 | 27.18 | 25.44 | 27.58 | 27 | 27.23 | 26.3 | 27.65 | 26.81 | 28.9 |
| Specimen | SP11 | SP12 | SP13 | SP14 | SP15 | SP16 | SP17 | SP18 | SP19 | |
| Mmax(KN.m) | 440.46 | 452.56 | 449.17 | 417 | 399.73 | 541.81 | 557.5 | 523.47 | 545.2 | |
| ED(KN.m) | 137 | 140.9 | 134.8 | 142.05 | 84.75 | 192.1 | 213.6 | 181.8 | 196.85 | |
| RD(mm) | 26.83 | 28.18 | 26.58 | 25.92 | 18.73 | 27.38 | 28.25 | 26.33 | 27.84 |
| Specimen | SP01 | SP02 | SP03 | SP04 | SP05 | SP06 | SP07 | SP08 | SP09 | SP10 |
|---|---|---|---|---|---|---|---|---|---|---|
| Ki (KN.m) | 21,709 | 24,072 | 24,845 | 21,148 | 19,860 | 19,851 | 20,354 | 21,056 | 19,638 | 19,758 |
| Kr (KN.m) | 10,712 | 7130 | 3710 | 12,476 | 5918 | 5720 | 6729 | 5994 | 6410 | 5980 |
| Fmax (KN) | 737.62 | 777.43 | 781.47 | 688.17 | 772.12 | 775.76 | 774.37 | 785.11 | 766.31 | 776.38 |
| Specimen | SP11 | SP12 | SP13 | SP14 | SP15 | SP16 | SP17 | SP18 | SP19 | |
| Ki (KN.m) | 20,255 | 20,654 | 20,062 | 12,147 | 17,471 | 34,440 | 48,684 | 29,242 | 35,300 | |
| Kr (KN.m) | 5917 | 3500 | 6037 | 4168 | 4417 | 4302 | 3747 | 5883 | 6589 | |
| Fmax (KN) | 776.65 | 780.27 | 774.43 | 719.13 | 689.2 | 934.16 | 961.2 | 902.54 | 940 |
| Sample Model | PEEQ | PI | MI | Plasticity Index | TI | RI | ||
|---|---|---|---|---|---|---|---|---|
| SP01 | 694.2 | −567.499 | 1.09814 | −1.0538 | 1.2891 | 463.1547 | −0.8175 | 3.7428 |
| SP02 | 694.2 | −497.691 | 0.511864 | −0.9242 | 1.2891 | 215.8853 | −0.7169 | 1.5003 |
| SP03 | 667.68 | −470.156 | 0.341547 | −0.8730 | 1.2399 | 144.0518 | −0.7042 | 0.9821 |
| SP04 | 694.2 | −419.191 | 0.241981 | −0.7784 | 1.2891 | 102.0586 | −0.6038 | 0.5986 |
| SP05 | 694.2 | −468.181 | 0.566258 | −0.8694 | 1.2891 | 238.8266 | −0.6744 | 1.5572 |
| SP06 | 694.2 | −497.293 | 0.511835 | −0.9235 | 1.2891 | 215.8730 | −0.7163 | 1.4990 |
| SP07 | 676.48 | −484.384 | 0.508633 | −0.8995 | 1.2561 | 214.5225 | −0.7161 | 1.4889 |
| SP08 | 694.2 | −509.196 | 0.470578 | −0.9456 | 1.2891 | 198.4723 | −0.7335 | 1.4140 |
| SP09 | 694.2 | −488.235 | 0.544232 | −0.9066 | 1.2891 | 229.5369 | −0.7033 | 1.5629 |
| SP10 | 694.2 | −499.25 | 0.51937 | −0.9271 | 1.2891 | 219.0510 | −0.7192 | 1.5274 |
| SP11 | 694.2 | −493.445 | 0.492601 | −0.9163 | 1.2891 | 207.7608 | −0.7108 | 1.4307 |
| SP12 | 694.2 | −498.05 | 0.527099 | −0.9249 | 1.2891 | 222.3108 | −0.7174 | 1.5462 |
| SP13 | 646.8 | −469.976 | 0.486086 | −0.8727 | 1.2011 | 205.0130 | −0.7266 | 1.4457 |
| SP14 | 694.2 | −494.392 | 0.472123 | −0.9181 | 1.2891 | 199.124 | −0.7122 | 1.374 |
| SP15 | 1309.81 | −347.098 | 0.025471 | −0.6445 | 2.4323 | 10.7427 | −0.265 | 0.03790 |
| SP16 | 596.152 | −386.19 | 0.07693 | −0.7171 | 1.1071 | 32.4463 | −0.6478 | 0.2033 |
| SP17 | 553.96 | −357.88 | 0.030672 | −0.6646 | 1.0287 | 12.9363 | −0.646 | 0.0808 |
| SP18 | 665.99 | −433.944 | 0.170127 | −0.8058 | 1.2367 | 71.7532 | −0.6516 | 0.4521 |
| SP19 | 614.55 | −420.317 | 0.101485 | −0.7805 | 1.1412 | 42.8026 | −0.6839 | 0.2831 |
| Specimen | SP01 | SP02 | SP03 | SP04 | SP05 | SP06 | SP07 | SP08 | SP09 | SP10 |
|---|---|---|---|---|---|---|---|---|---|---|
| Failure mode | Mode 3 | Mode 3 | Mode 3 | Mode 2 | Mode 3 | Mode 3 | N/A | Mode 3 | Mode 3 | Mode 3 |
| Specimen | SP11 | SP12 | SP13 | SP14 | SP15 | SP16 | SP17 | SP18 | SP19 | |
| Failure mode | Mode 2 | Mode 3 | N/A | N/A | N/A | Mode 3 | Mode 3 | Mode 3 | Mode 3 |
| Sample Model | tf (mm) | No (Bolt Beam) | No (Bolt Column) | L1 (mm) | Thickness of Stiffener (mm) | Number of Stiffener | Type of Stiffener | Equipped SMA Material |
|---|---|---|---|---|---|---|---|---|
| SP20 | 19 | 6 | 4 | 100 | 15 | 3 | B | Stiffener |
| SP21 | 19 | 6 | 4 | 100 | 15 | 3 | B | T-stub |
| SP22 | 19 | 6 | 4 | 100 | 15 | 3 | B | Bolt column |
| SP23 | 19 | 6 | 4 | 100 | 15 | 3 | A | Stiffener |
| SP24 | 19 | 6 | 4 | 100 | 15 | 3 | A | T-stub |
| SP25 | 19 | 6 | 4 | 100 | 15 | 3 | A | Bolt column |
| SP26 | 19 | 6 | 4 | 100 | 25 | 3 | B | Stiffener |
| SP27 | 19 | 6 | 4 | 100 | 25 | 3 | B | T-stub |
| SP28 | 19 | 6 | 4 | 100 | 25 | 3 | B | Bolt column |
| SP29 | 19 | 6 | 4 | 100 | 25 | 3 | A | Stiffener |
| SP30 | 19 | 6 | 4 | 100 | 25 | 3 | A | T-stub |
| SP31 | 19 | 6 | 4 | 100 | 25 | 3 | A | Bolt column |
| SP32 | 19 | 6 | 4 | 100 | 15 | 1 | B | Stiffener |
| SP33 | 19 | 6 | 4 | 100 | 15 | 1 | B | T-stub |
| SP34 | 19 | 6 | 4 | 100 | 15 | 1 | B | Bolt column |
| SP35 | 19 | 6 | 4 | 100 | 15 | 1 | A | Stiffener |
| SP36 | 19 | 6 | 4 | 100 | 15 | 1 | A | T-stub |
| SP37 | 19 | 6 | 4 | 100 | 15 | 1 | A | Bolt column |
| SP38 | 19 | 6 | 4 | 100 | 25 | 1 | B | Stiffener |
| SP39 | 19 | 6 | 4 | 100 | 25 | 1 | B | T-stub |
| SP40 | 19 | 6 | 4 | 100 | 25 | 1 | B | Bolt column |
| SP41 | 19 | 6 | 4 | 100 | 25 | 1 | A | Stiffener |
| SP42 | 19 | 6 | 4 | 100 | 25 | 1 | A | T-stub |
| SP43 | 19 | 6 | 4 | 100 | 25 | 1 | A | Bolt column |
| Specimen | SP20 | SP21 | SP22 | SP23 | SP24 | SP25 | SP26 | SP27 | SP28 | SP29 | SP30 | SP31 |
|---|---|---|---|---|---|---|---|---|---|---|---|---|
| Ki (KN.m) | 52,452 | 40,758 | 40,550 | 53,813 | 50,839 | 46,142 | 51,400 | 49,365 | 43417 | 637,812 | 62,677 | 33,782 |
| Kr (KN.m) | 6024.2 | 4966.7 | 6976.2 | 2995.2 | 2860 | 5901.1 | 6049 | 2787.5 | 6061.4 | 2888.4 | 2964.7 | 6884.8 |
| Fmax (KN) | 903.91 | 859.88 | 893.02 | 905.02 | 873.7 | 884.59 | 898.64 | 874 | 898.98 | 936.24 | 927.67 | 933.52 |
| Specimen | SP32 | SP33 | SP34 | SP35 | SP36 | SP37 | SP38 | SP39 | SP40 | SP41 | SP42 | SP43 |
| Ki (KN.m) | 48,168 | 45,036 | 39,201 | 48,720 | 43,267 | 41,326 | 49,444 | 44,392 | 39,722 | 55,153 | 55,666 | 48,044 |
| Kr (KN.m) | 2613.2 | 3571 | 2794.3 | 3436.8 | 3510.3 | 2870 | 2998.6 | 3402 | 3082.3 | 2572 | 2989.2 | 2778.7 |
| Fmax (KN) | 875.46 | 826.82 | 850.24 | 869.38 | 830.87 | 856.18 | 875.46 | 824.27 | 854.91 | 912.73 | 880.57 | 916.7 |
| Specimen | SP20 | SP21 | SP22 | SP23 | SP24 | SP25 | SP26 | SP27 | SP28 | SP29 | SP30 | SP31 |
|---|---|---|---|---|---|---|---|---|---|---|---|---|
| (rad) | 0.012 | 0.013 | 0.012 | 0.011 | 0.013 | 0.011 | 0.013 | 0.012 | 0.01 | 0.013 | 0.011 | 0.011 |
| (rad) | 0.0349 | 0.0349 | 0.0348 | 0.0345 | 0.0349 | 0.0344 | 0.0349 | 0.0349 | 0.0349 | 0.0348 | 0.0349 | 0.0349 |
| My (KN.m) | 385.92 | 373.61 | 382.11 | 385.37 | 376.4 | 376.19 | 382.45 | 375.51 | 384.48 | 399.42 | 392.52 | 395.94 |
| 2.99 | 2.68 | 2.88 | 3.11 | 2.67 | 3.17 | 2.68 | 2.78 | 3.33 | 2.66 | 3.04 | 3.24 | |
| Failure mode | 3 | 3 | N/A | 3 | 3 | N/A | 3 | 3 | N/A | 3 | 3 | N/A |
| Specimen | SP32 | SP33 | SP34 | SP35 | SP36 | SP37 | SP38 | SP39 | SP40 | SP41 | SP42 | SP43 |
| (rad) | 0.01 | 0.01 | 0.012 | 0.01 | 0.009 | 0.013 | 0.011 | 0.008 | 0.012 | 0.011 | 0.009 | 0.012 |
| (rad) | 0.0348 | 0.0345 | 0.0341 | 0.0334 | 0.0347 | 0.0347 | 0.0348 | 0.0347 | 0.0346 | 0.0348 | 0.0347 | 0.0346 |
| My (KN.m) | 377.55 | 359.25 | 369.42 | 375.06 | 361.01 | 372 | 377.55 | 358.14 | 371.45 | 391.08 | 382.6 | 387 |
| 3.32 | 3.84 | 2.81 | 3.25 | 3.61 | 2.68 | 3.11 | 3.97 | 2.85 | 3.07 | 3.82 | 2.74 | |
| Failure mode | 3 | 3 | N/A | 3 | 3 | N/A | 3 | 3 | N/A | 3 | 3 | N/A |
Disclaimer/Publisher’s Note: The statements, opinions and data contained in all publications are solely those of the individual author(s) and contributor(s) and not of MDPI and/or the editor(s). MDPI and/or the editor(s) disclaim responsibility for any injury to people or property resulting from any ideas, methods, instructions or products referred to in the content. |
© 2023 by the authors. Licensee MDPI, Basel, Switzerland. This article is an open access article distributed under the terms and conditions of the Creative Commons Attribution (CC BY) license (https://creativecommons.org/licenses/by/4.0/).
Share and Cite
Torabipour, A.; Asghari, N.; Haghighi, H.; Yaghoubi, S.; Urgessa, G. Assessing Effectiveness of Shape Memory Alloys on the Response of Bolted T-Stub Connections Subjected to Cyclic Loading. CivilEng 2023, 4, 105-133. https://doi.org/10.3390/civileng4010008
Torabipour A, Asghari N, Haghighi H, Yaghoubi S, Urgessa G. Assessing Effectiveness of Shape Memory Alloys on the Response of Bolted T-Stub Connections Subjected to Cyclic Loading. CivilEng. 2023; 4(1):105-133. https://doi.org/10.3390/civileng4010008
Chicago/Turabian StyleTorabipour, Ahmadreza, Nima Asghari, Homa Haghighi, Shaghayegh Yaghoubi, and Girum Urgessa. 2023. "Assessing Effectiveness of Shape Memory Alloys on the Response of Bolted T-Stub Connections Subjected to Cyclic Loading" CivilEng 4, no. 1: 105-133. https://doi.org/10.3390/civileng4010008