1. Introduction
Earthquake is the most destructive phenomenon that humans are ever privy to; the exact time of earthquake occurrence is not always expectable and can happen with no preceding alarm. Earthquake destroys buildings and results in many deaths for the habitants. In earthquake zones before 1970, multi-story RC frame structures were constructed and designed to handle gravity loads regardless of lateral loads. In this case, the structure is called a gravity load designed (GLD) structure. In GLD structures, earthquake considerations are not enough, which causes the non-ductile nature that results in inadequate lateral load resistance of such buildings for even moderate seismic activity. To avoid this, since a long time ago, structural engineers have studied the behavior of earthquakes and measured them using devices known as accelerographs.
Accelerographs are constructed to measure the ground acceleration versus time during of earthquakes and produce time-history records known as ground motion records (GMR) that are usually stored as database.
Prior to designing a suitable repair or improvement system, existing structures must be assessed for their seismic resistance and limitations. This project provides an approach to assess the seismic behavior of existing RC frames with the assistance of SAP2000 and ETABS. These software stand as efficient and reliable analytical tools for predicting the actual response of such structures during an earthquake [
1,
2,
3,
4,
5].
The objective of this project is to analyze pre-existing multi-story RC frame buildings with available earthquake time histories. Furthermore, the seismic behaviour of two different buildings will be compared in terms of various responses, such as base shear and displacement. Moreover, the relationship between earthquake intensities and the responses will be delineated. The fundamental period of the construction of the buildings will be compared using modal analysis and NBCC 2010 recommendations.
A severe earthquake can result in heavy damage to buildings or cause them to collapse. Previous studies have shown structural damage caused by earthquakes is the cause of large displacements. Buildings are designed with shear walls to prevent lateral loads from entering the structure. In this way, it is possible using shear walls to prevent large displacements and the damages that come along in buildings [
6,
7,
8,
9,
10]. There has been a common misperception that foundations and superstructures are unrelated structures, and that superstructures are restricted to the base. As a result, buildings’ superstructures are the only part of the buildings that can be analyzed seismically. Although the method is straightforward and convenient, the foundations need to be flexible; otherwise, the structures may not perform as they should in the real world due to dynamic characteristics and seismic behavior [
11,
12,
13].
In order to improve the seismic resistance of a focused structure, Zhuang et al. [
14] described a MPED system as a combination of passive energy dissipation (PED) devices that target different weaknesses of the structure. For evaluating seismic performance of structural elements, they developed a highly accurate and efficient numerical model based on the secondary development of the proprietary finite-element analysis package MARC.MSC. Developing spring elements with cyclic hardening properties allowed composite members to be simulated under complex loading conditions. In addition, PED devices were emulated using the spring elements with cyclic hardening properties. The structure was analyzed nonlinearly for key substructures and over time for the entire structure.
There have often been serious damages caused by the collapse of intermediate columns in underground constructions following catastrophic earthquake events. Shaking table modeling tests are elaborately used to study the mechanism of stiffening an underground structure through the replacement of general reinforced concrete columns with square concrete-filled steel tube (CFT) columns. The effects on structural seismic behavior are both positive and negative. According to the test findings, it is important to achieve a balance between the safety of underground structures and their applicability. This is when sturdier intermediate columns are needed to resist seismic actions. In addition to increasing structural aseismic capacity, the strengthened intermediate column will also result in large structural acceleration responses during the same intense earthquake [
15].
Sanches et al. [
16] stated that buildings with repeatable components can be constructed using modular technology as a viable alternative to traditional on-site construction methods. Typically, modular steel buildings (MSBs) are constructed from prefabricated volumetric modules produced in controlled environments such as factories. After being transported and assembled on-site, the modules can be used as part of a permanent building. Despite the fact that studies on the dynamics of modular buildings are limited to up to ten-story buildings, a lately accomplished 32-story building in New York illustrates its applicability beyond mid-rise structures. According to the National Building Code, the ductility modification factor and the overstrength modification factor for seismic force resisting systems are both determined based on the type of seismic force resisting system. The correlation between these design factors and the building height has been demonstrated in previous studies to be detrimental to adequate design changes as the height of the building increases.
In light of the foregoing, this paper is designed for the analysis of seismic responses of reinforced concrete (RC) buildings which are subjected to the earthquake records for case studies of 6- and 12-story buildings. It is a novel procedure that is expected to elaborate and strengthen the performance of existing buildings.
2. Literature Review
This section reviews the approach of seismic performance of existing buildings with concrete moment resisting structure. Additionally, few researchers have opted to study the seismic performance of existing reinforced concrete buildings.
Sadjad et al. [
17] mentioned that seismic performance can be assessed for lateral load resistance, classification of yielding of the members, and distribution of inter-story drift. A typical 5-story frame is developed as ductile, nominally ductile, GLD, and retrofitted GLD in this project. It provides an analytical approach for the seismic evaluation of RC frames with the help of nonlinear time-history analysis and momentum over analysis. These analytical models are authenticated against accessible experimental results. Along with this, a study was conducted to assess the seismic behavior of these 5-storey frames. To sum up the discussion, one could say that the ductile and nominally ductile frames behaved well under the influence of the considered earthquake; on the other hand, the seismic performance of the GLD structure was not sufficient. The seismic performance was enhanced when a modification of the damaged GLD was undertaken. Moreover, the seismic performance of a twelve-story reinforced concrete moment-resisting frame structure along with shear walls with the help of 3D finite element models was presented by Sea et al. (2015) [
18], in accordance with seismic design regulations based on the Federal Emergency Management Agency (FEMA) recommendations and seismic building codes together with the Los Angeles Tall Building Structural Design Council (LATBSDC) code.
As the building is located in seismic zone 4, and according to the U.S. Geological Survey, it is known for the highest seismic risk classification. A commercially available software named finite element software was applied to generate the 3D finite element model. In the two approaches, response spectrum analysis and nonlinear time-history analysis were used for the seismic performance assessment. The seismic performance of ordinary Moment-Resisting Concrete Frames (OMRCF) was highlighted by Han et al. [
19] for gravity loads. A 3-story OMRCF was designed in this regard according to the minimum design requirements in the American Concrete Institute Building Code ACI 318 (1999). In addition to a regular structure, the model frame displayed flexure-dominated behavior. Using quasi-static reversed cyclic lateral loading, a 1/3-scale 3-story model was constructed and tested. In the final experiment, the OMRCF displayed full stability without sudden loss of strength. According to the UBC 1997, the measured base shear strength for seismic zones 1, 2A, and 2B was greater than the design base shear force.
In addition, the seismic performance of reinforced concrete frame was assessed using the capacity spectrum method. Değer et al. [
20] opted to associate the seismic performance of two 42-story reinforced concrete buildings located in Los Angeles, California. One was a combined core wall building and the other was a comparable core wall building with perimeter moment-resisting frames (i.e., dual system). Two different approaches were introduced to design the buildings. The first approach followed the traditional code prescriptive design approach as mentioned in the International Building Code (2006). On the other hand, the second approach followed a performance-based design approach that was aligned with the seismic design guideline published by the Pacific Earthquake Engineering Research Center. These two systems were modeled with detailed finite element methods, resulting in different design approaches. To assess the seismic performance of the sample model at five dissimilar earthquake shaking intensities, these models are used.
An experimental study on corroded RC moment-resisting frames was performed to study the effect of longitudinal reinforcement corrosion on the seismic behavior of RC frames by Liu et al. [
21]. An experiment was conducted on six frame specimens, five of which were corroded and one of which was not. The specimens were loaded with quasi-static cyclic forces for a period of three weeks after loading. The corrosion ratio of longitudinal reinforcement and the axial compression ratio were appraised to be the most important variables. The results showed that, with an increase in the corrosion ratio, the lateral load carrying capacity and the deformation capacity of RC frames decreased roughly linearly, and the energy dissipation capacity minimized approximately exponentially. For corroded frames with low axial compressive load level, the lateral strength and the energy dissipation capacity were enhanced with an increase in the axial compression ratio, and the effect of the axial compression ratio on the deformation capacity was insignificant. During the loading process, the frames with increased corrosion ratio or axial compression faced significantly more destructions at the beam ends. The damage evolution of the columns was not affected enough by the corrosion ratio and the axial compression ratio compared to the beam.
Furthermore, the study by Daei et al. [
22] quantified the effects of pulse-like near-fault ground motions on reinforced concrete moment-resisting frames (MRFs) in order to compare the results to those induced by non-pulse-like ground motions. Accordingly, three archetype buildings with 3-, 9-, and 18-story heights were designed and subjected to 48 ground motions in four sets that included forward-directivity, fling-step, non-pulse near-fault, and far-fault motions. In addition, compared to pulse-like ground motions, non-pulse-like motions showed significantly higher contributions from higher modes to the seismic responses. A pulse-like ground motion also imposed a higher maximum seismic demand than a non-pulse-like motion.
By installing self-centering braces on SMRFs, Hu et al. [
23] proposed a peak and residual displacement-based design (PRDBD) method to control the peak and residual inter-story drift. According to the proposed PRDBD method, peak displacements and residual displacements served as the design targets. A machine learning prediction model was developed, based on the median response of a single-degree-of-freedom system, to determine the inelastic and residual displacement ratios during earthquakes. It was discussed in detail the steps involved in the design of the PRDBD method. Retrofitting three- and nine-story demonstration buildings was achieved using the PRDBD. Here, two different design targets were used. Static and dynamic analyses were used to corroborate the efficiency of the proposed PRDBD method. The results of the static analysis showed that the self-centering braces could effectively improve a SMRF’s stiffness and strength. The retrofitted SMRFs presented no strength deterioration, and the original SMRFs presented obvious strength deterioration at the roof drifts of 3.2% and 2.5% in the three- and nine-story buildings, respectively. On the other hand, Cao et al. [
24] highlighted an external substructure designed to improve the seismic performance of existing frame buildings, namely the post-tensioned precast bolt-connected steel-plate reinforced concrete frame (PT-PBSPC frame). It involved the introduction of the mechanism and the design of a sub-structure, and pseudo-static experiments were performed on the basis of four scaled frames to demonstrate the technical details (e.g., precast or monolithic, and with or without prestress) and the macro responses (e.g., failure patterns, hysteresis curves, strain developments, and self-centering capacities). In order to clarify the distinct varying tendency and appropriate detail selection, the simulation model as verified by experiments was presented and the numerical elements and materials were compared, in addition to extending an experimental work that involved a detailed parametric study with different controlling parameters. As a general conclusion, the precast assembly had an equal performance to the monolithic specimen.
Fazileh et al. [
25] explained the seismic performance of this system using the FEMA P695 methodology. For this purpose, by using nonlinear static and dynamic analyses, many different archetype configurations were developed and analyzed. According to the results of the performance assessment, the CSA and NBC requirements for the CC-CMF system showed a lower bound of values for seismic force modification factors, and the system conservatively met the life safety objectives presented in the NBC. Additionally, different scenarios were contemplated for identifying ductility-related seismic force modification factor from pushover curves. The influence of height and gravity load levels on seismic force modification factors and the failure margin ratios were also studied by comparing the archetypes with different configurations. Furthermore, Soureshjani and Massumi [
26] studied the seismic sequence of reinforced concrete (RC) moment-resisting structures with concrete shear walls. Two three-dimensional structures of short and medium height were premeditated and investigated under seven real mainshock–aftershock sequences of earthquakes. The models were encumbered and considered in accordance with the Iranian seismic code (4th ed.; Standard No. 2800) and the ACI-318. These structures were evaluated with the help of the nonlinear explicit finite element method. In this study, the maximum displacement, inter-story drift ratio, residual displacement, and ratio of aftershock PGA to mainshock PGA were analyzed. Due to the high imaginative stiffness of the shear walls along with their entirely elastic behavior, the aftershocks did not result in an intensification of the inter-story drift ratio or the relative displacement in the short structure model. The medium height model under the seismic sequences presented a significant growth in the relative displacement (approx. 25% in some cases), inter-story drift ratio, plastic strain, and residual displacement (42.22% growth on average) compared to the structure that was only subjected to the mainshock. In some of the cases, significantly, the aftershock doubled the residual displacement.
Xin et al. [
27] proposed that long-span bridges which are near the fault regions can sustain significant damage as a result of the special characteristics of earthquakes there, such as fling-step and forward-directivity effects. Using fling-step motions, the vibration behavior of a long-span concrete-filled steel tubular arch bridge was investigated in this paper. In order to construct a finite element model of the bridge, nonlinearities in the material and geometric nonlinearities were taken into account. Secondly, three types of dynamic loadings were presented in detail, incorporating recorded ground motions, residual components, and overemphasized pulse models. Afterwards, comparative and parametric analyses were performed to gain a deeper understanding of how components in fling-step motions affected seismic response. Based on the strain index used in the performance evaluation, the CFST arch might be dangerous at certain locations. Based on the findings of these studies, fling-step motions that consist of both static and dynamic pulses can have a significant impact on seismic response. Along with the pulse period, pulse amplitude, and mode contribution, the earthquake demands are affected by ‘narrow band’ effects at different pulse periods. In addition, Rutenberg and De Stefano [
28] discussed the evolution of the seismic provisions for asymmetric structures, primarily within the context of the design eccentricity specified in the code. Although the Ed formulas were initially developed for linear ranges, the UBC formula leads to similar levels of ductility demand as predicted for similar yet symmetric structures. This is when overstrength is judiciously distributed. There are mainly single-story models studied in these studies. Recently, however, it has been suggested that single-story model results may be applicable to regular asymmetric shear buildings, albeit with minor modifications. In order to test the predictive power of pushover analyses, a 7-storey R/C wall frame is compared with the results of pushover analyses with mass locations based on the ED formulas.
Yeganeh and Fatahi [
29] concluded that plasticity exhibits a significant influence on the seismic performance of a 20-story moment-resisting frame. This is more evident in structures with mat foundations than those with rock foundations during earthquakes. In this context, a city-based soil constitutive model, dubbed hyperbolic hardening with hysteretic damping, was carried out using isotropic elastic with hysteretic damping and elastic-perfectly plastic Mohr–Coulomb with hysteretic damping. In order to simulate three-dimensional soil-structure systems with the FLAC3D software, a direct method of analysis was used to analyze the soil–foundation–structure system in one step without having to analyze each part separately. The seismic responses were generated using a numerical approach, including response spectra, base shear forces, shear forces distributed along the building height, maximum and permanent foundation displacements, foundation rocking, and flooring deflections and drifts between floors. As a result, soil hardening plasticity sustains an immense influence on the seismic performance of a 20-story moment-resisting frame, especially when there are structures with mat foundations.
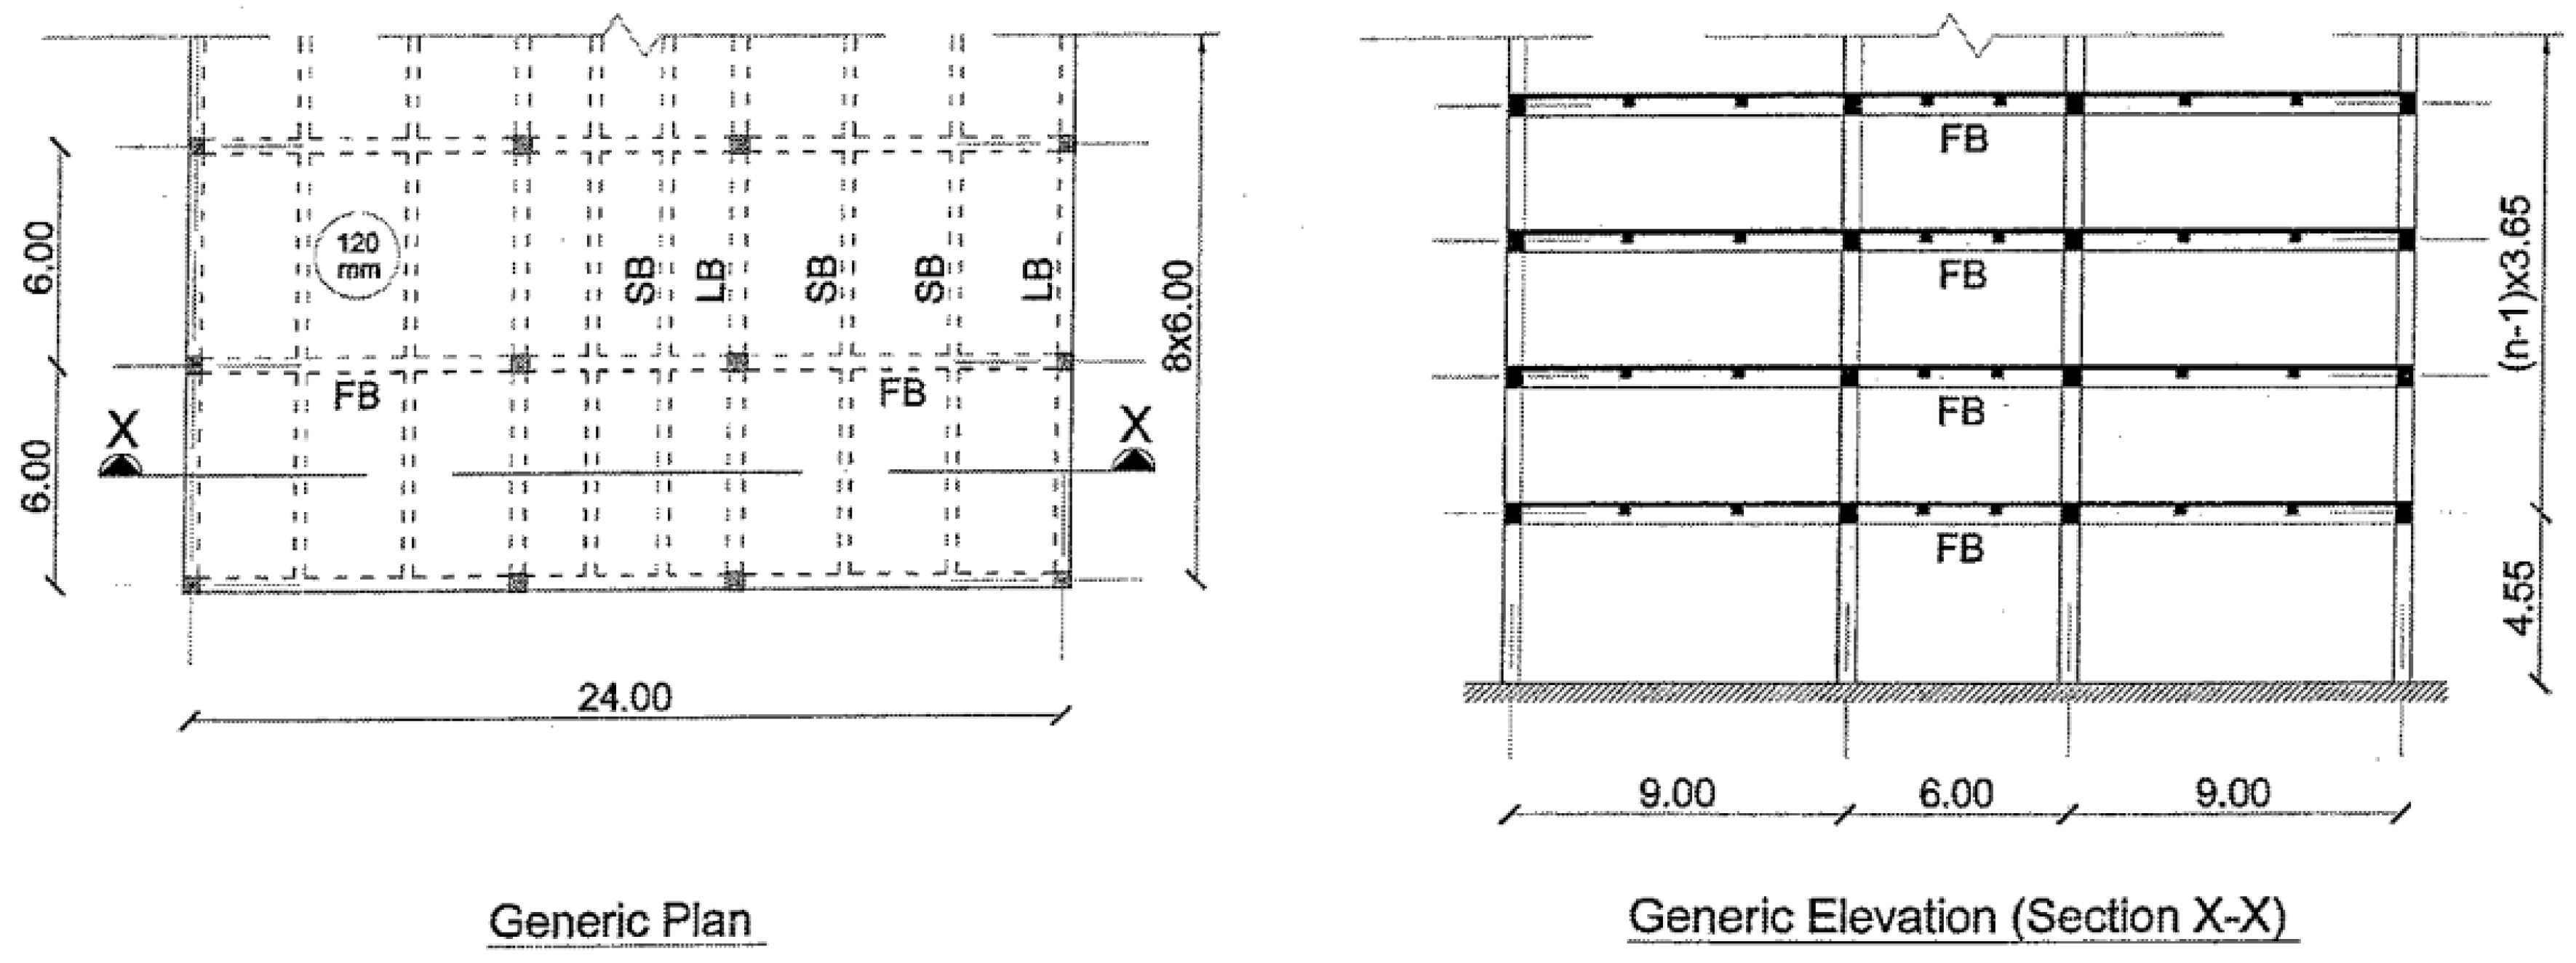
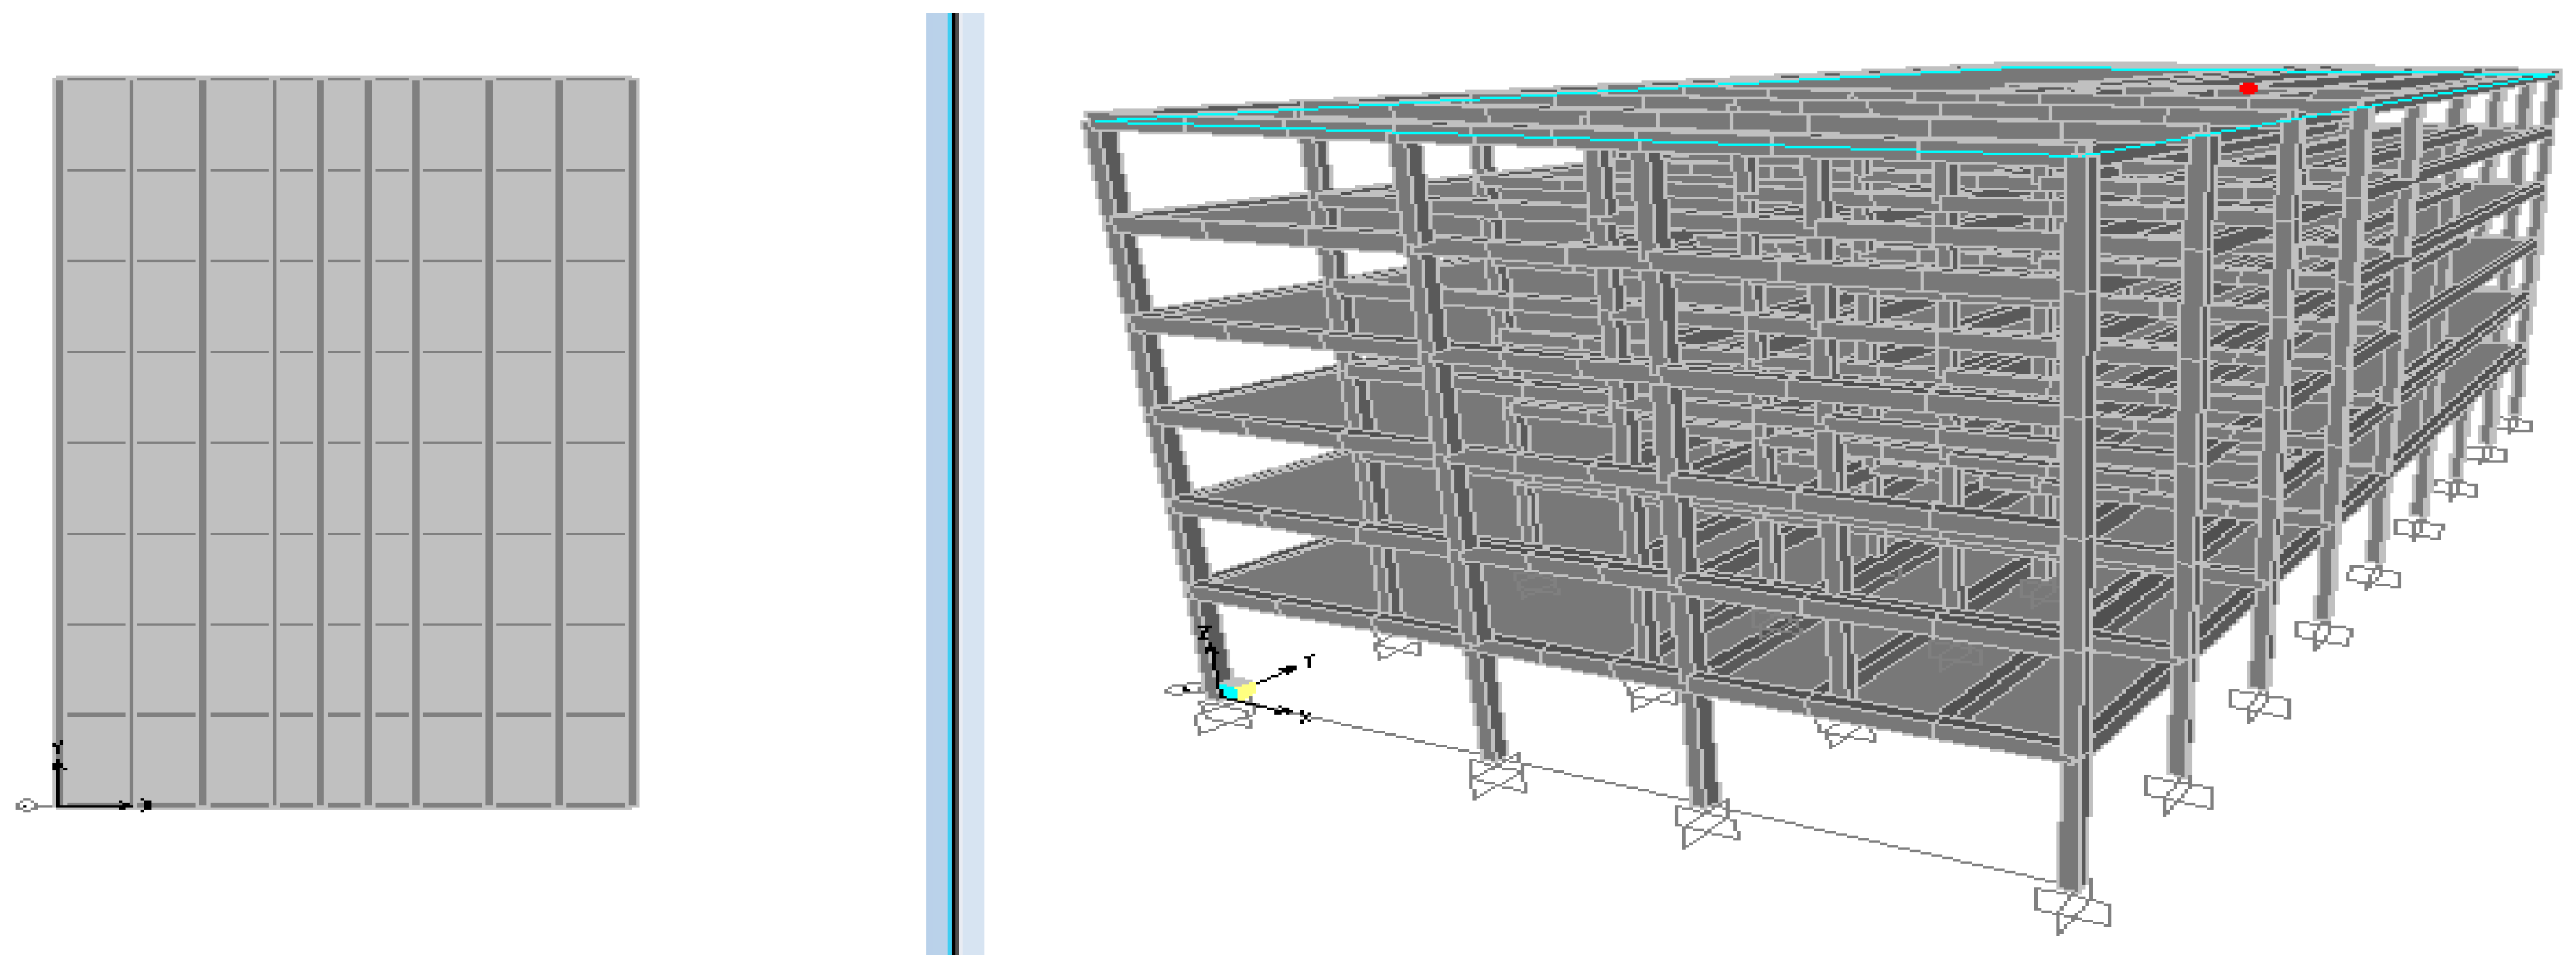
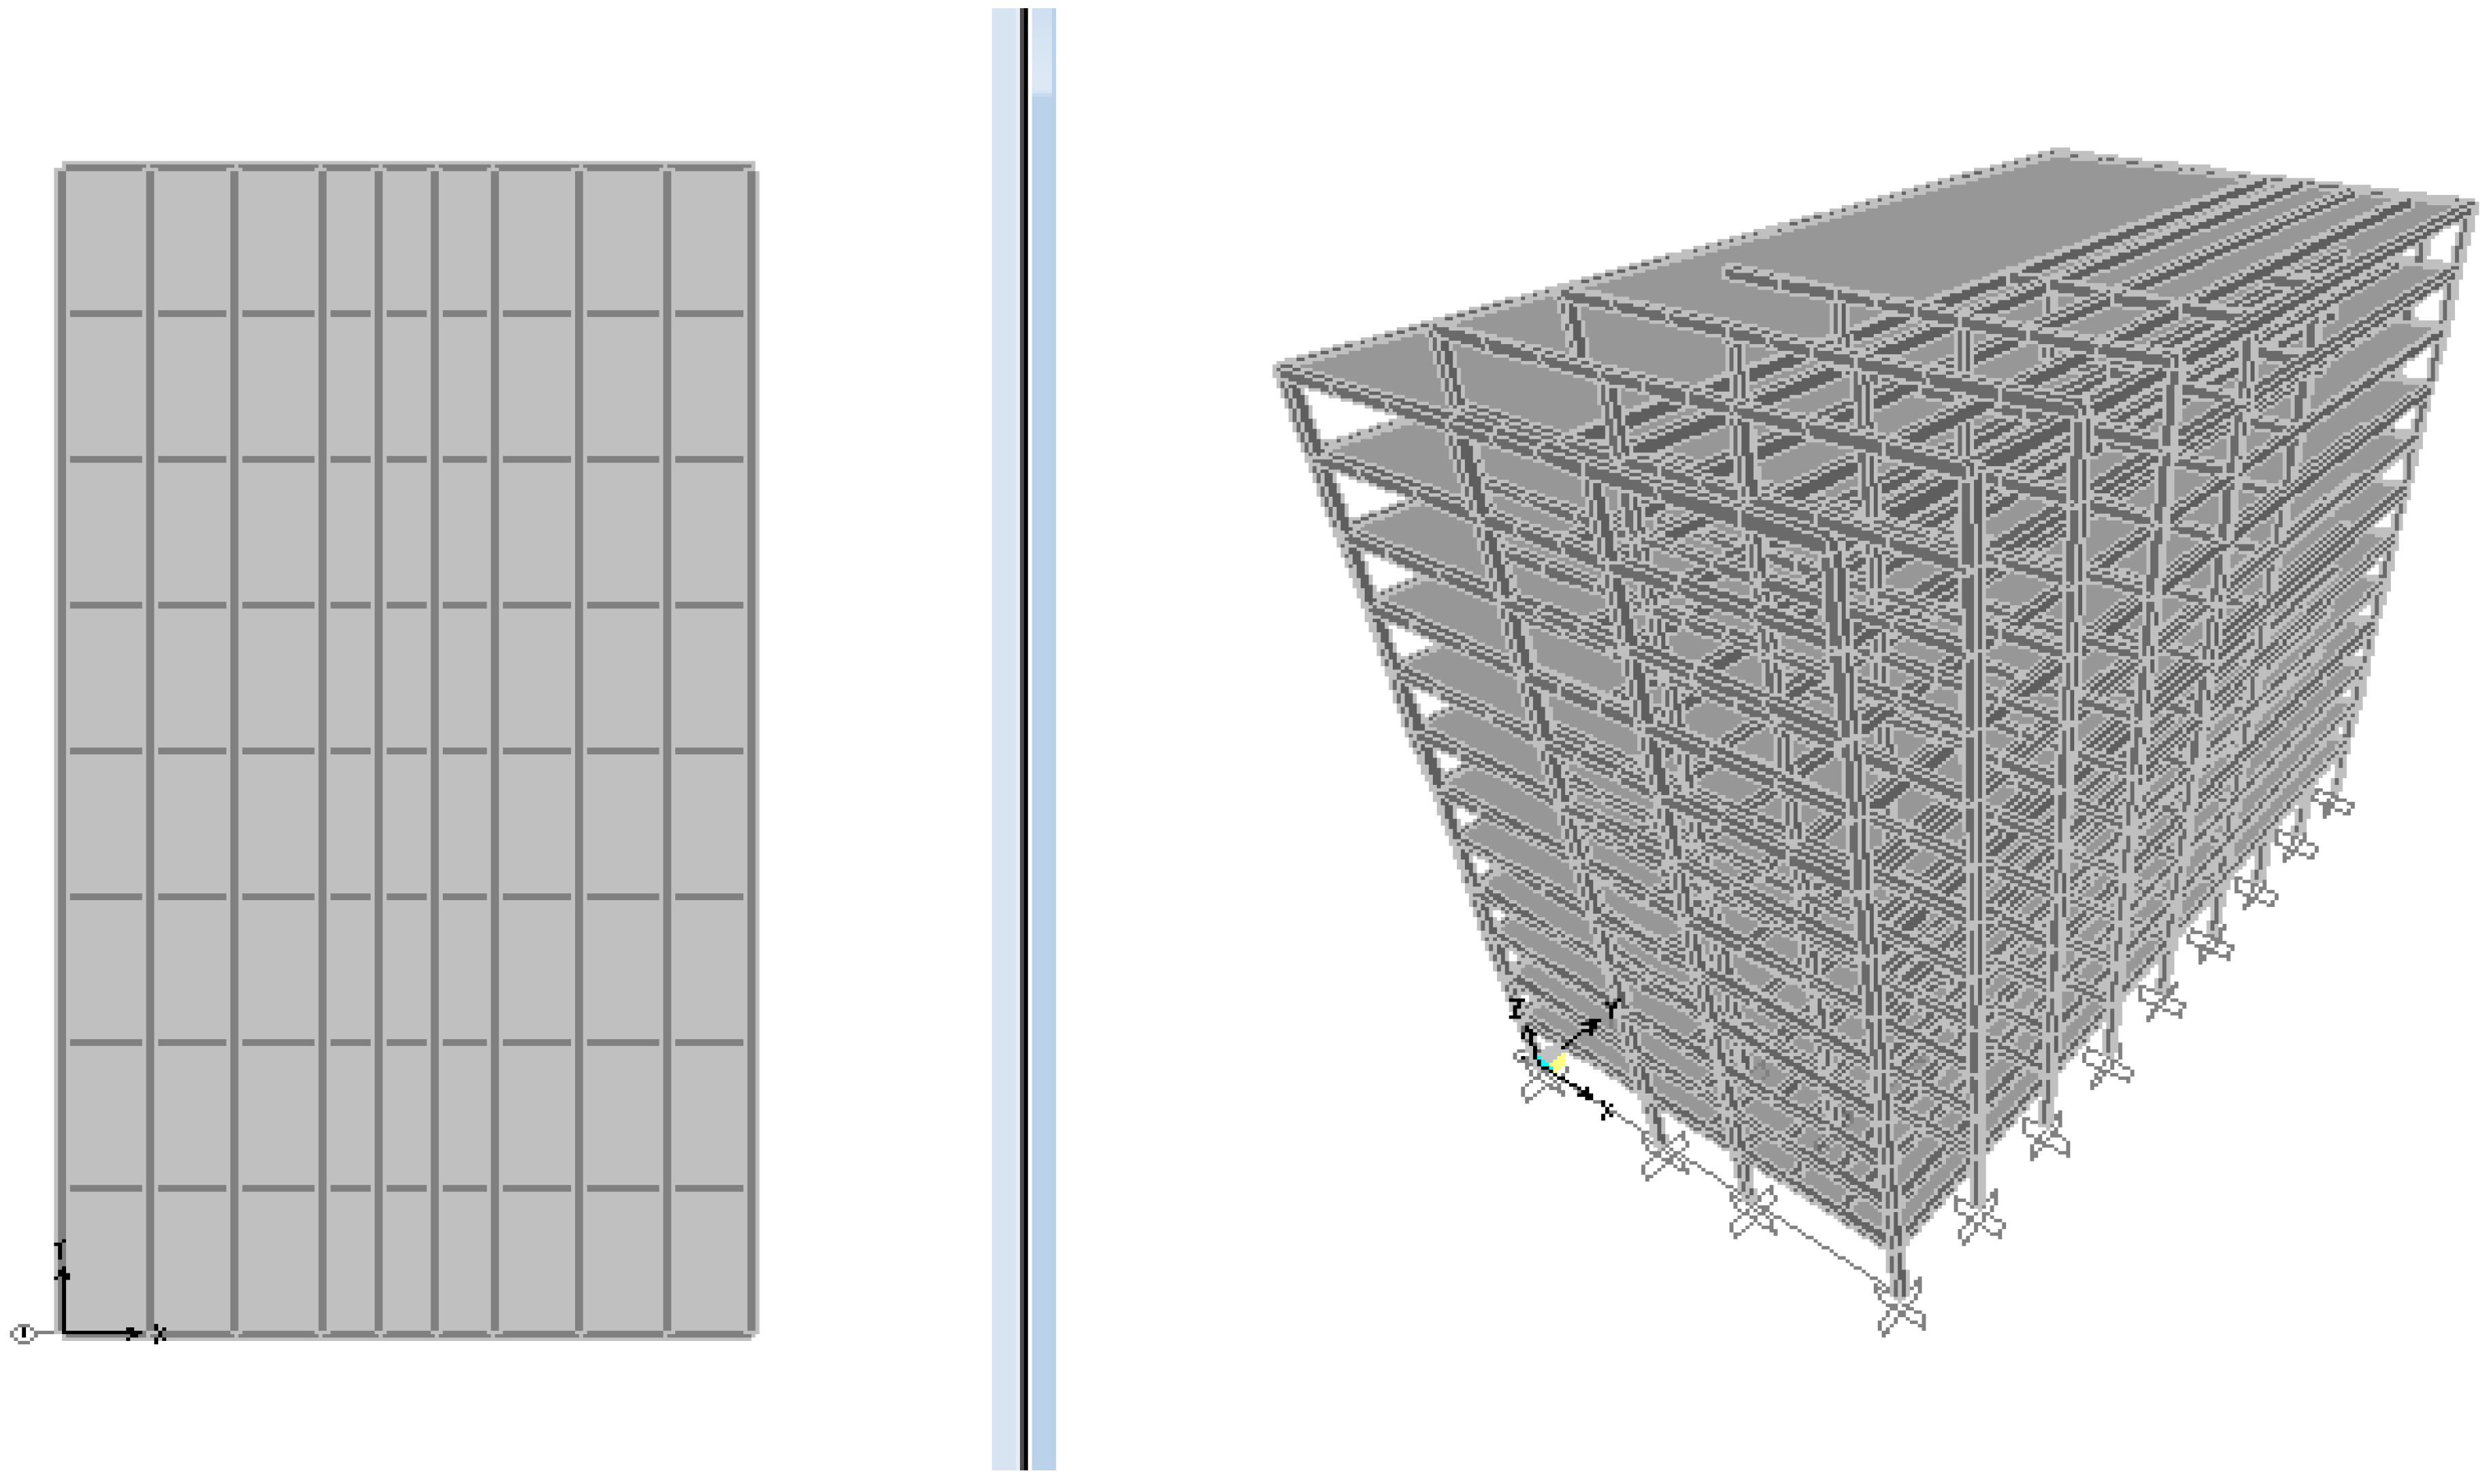
6. Time-History Analysis
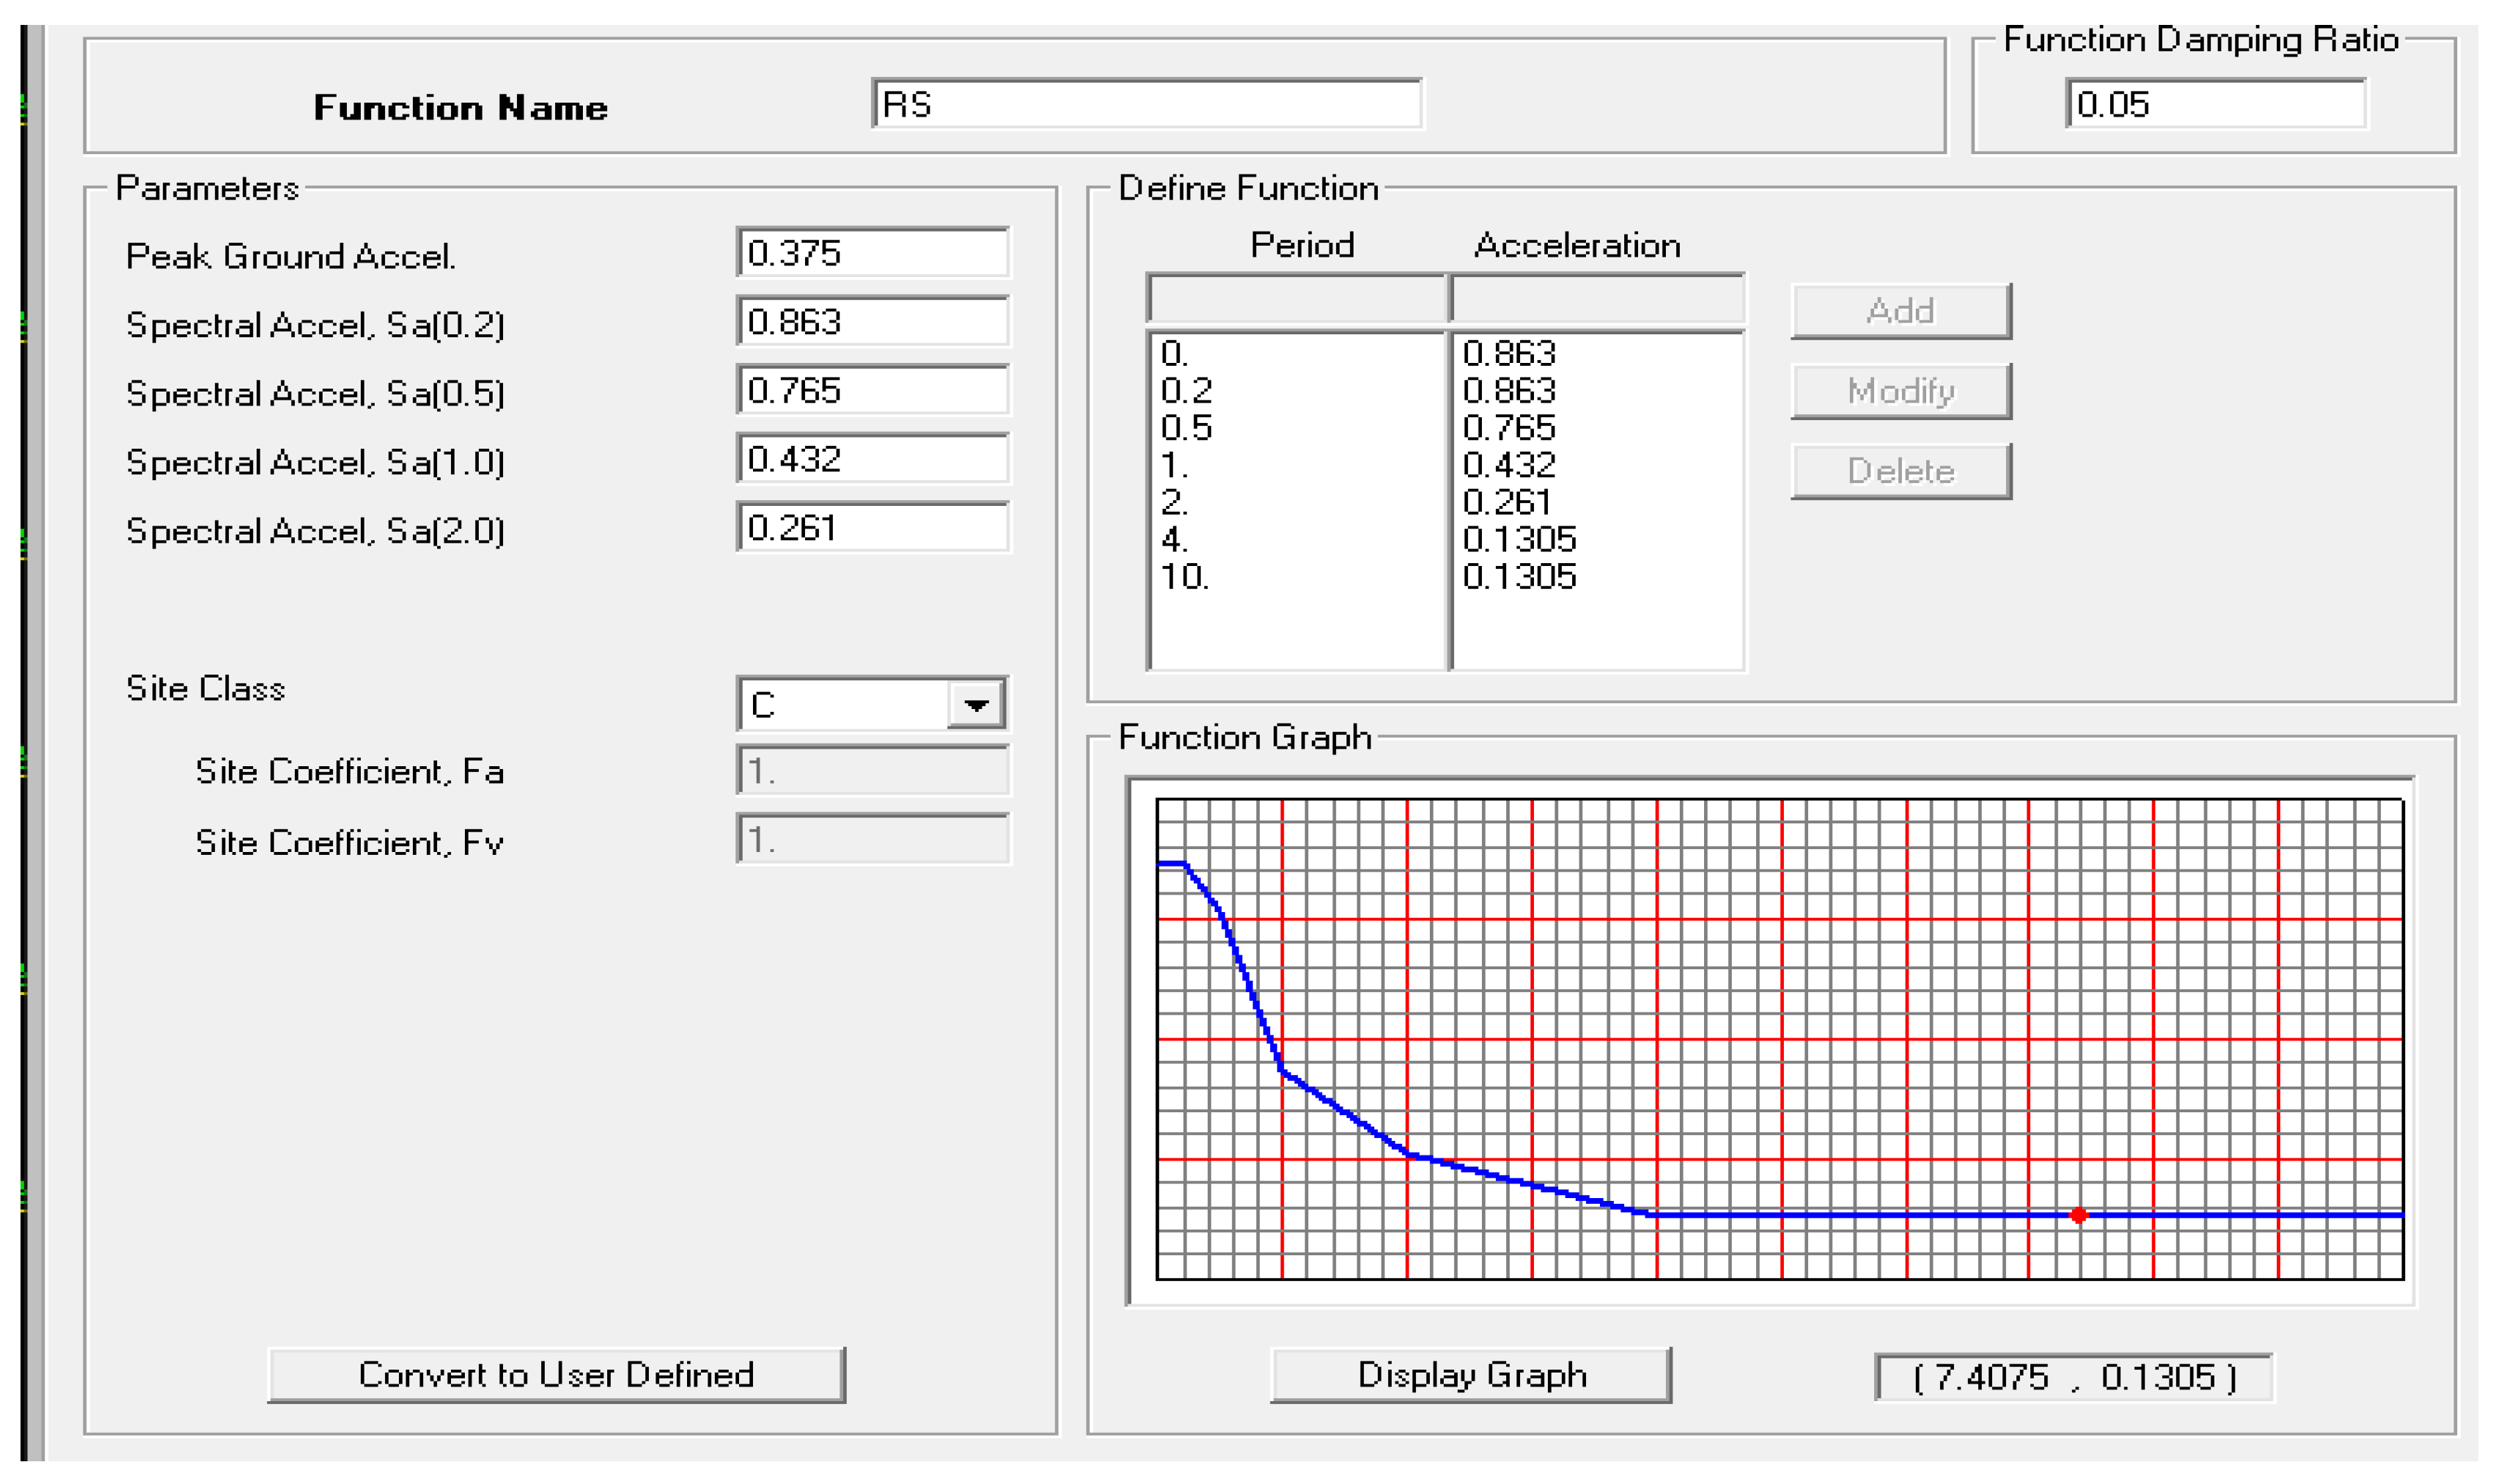
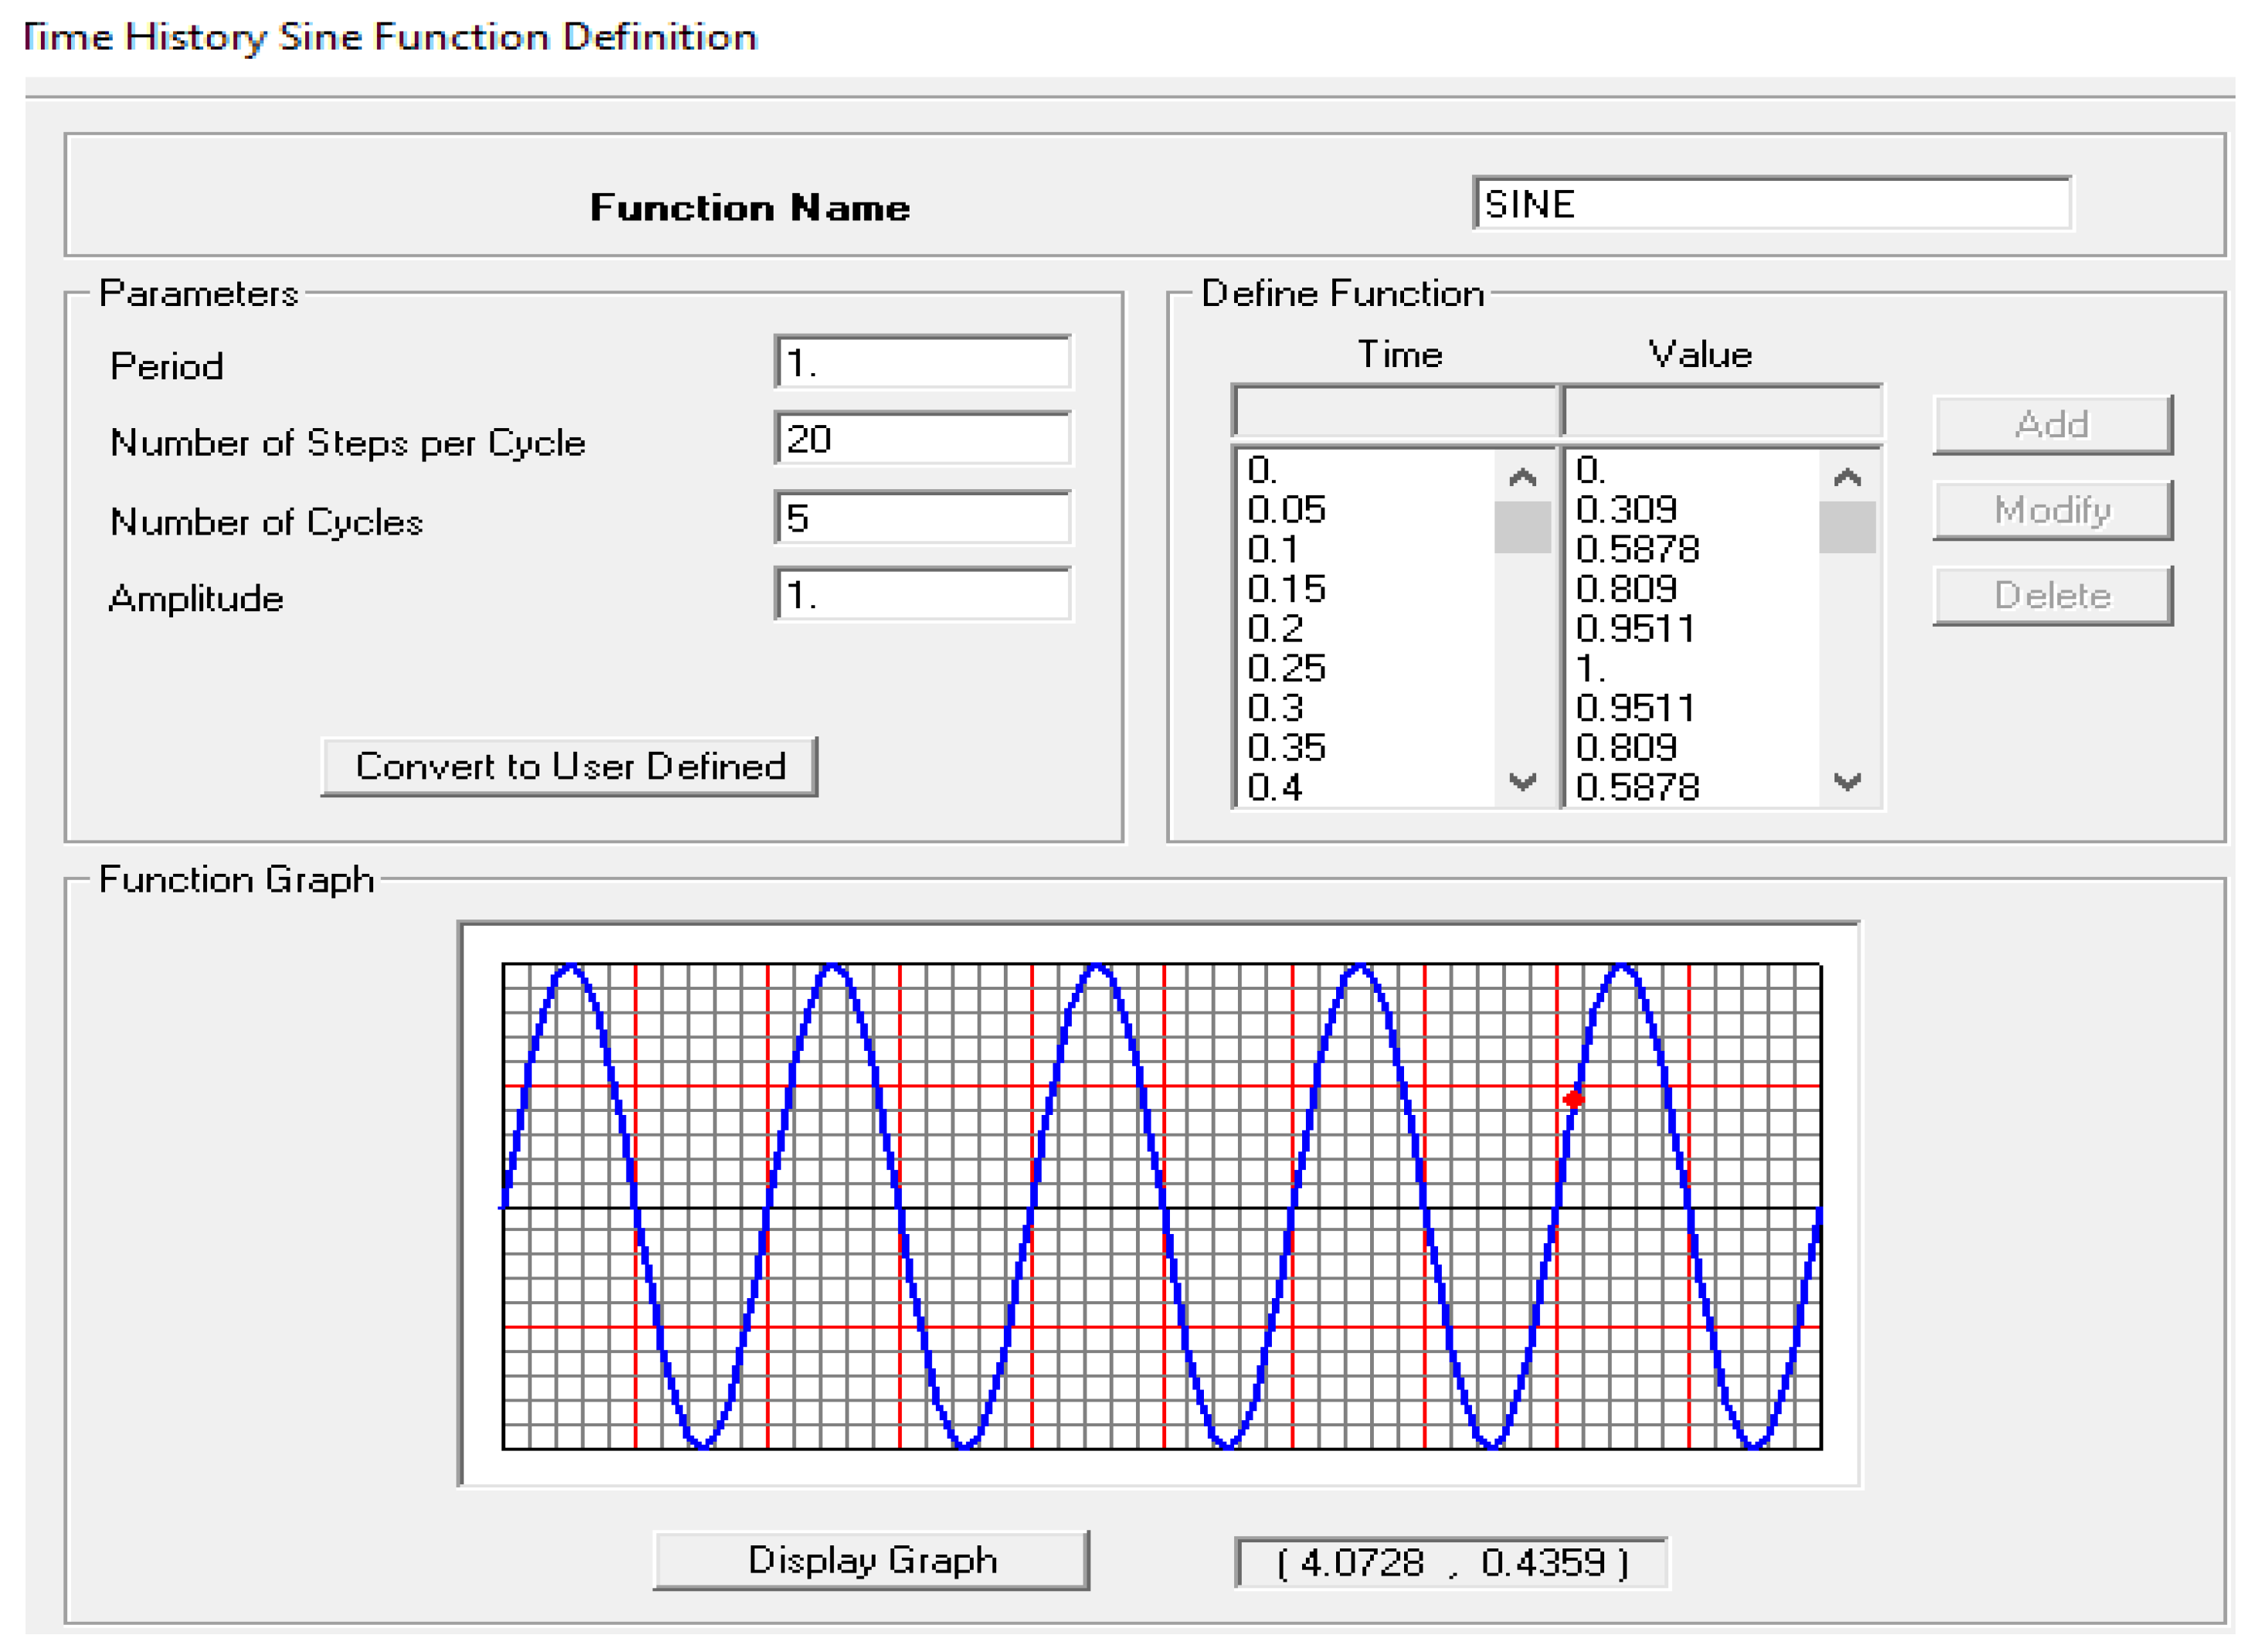
The most precise method for predicting the force and deformation demand at several components of a structure is the inelastic time-history analysis. However, its use is restricted due to the sensitive nature of the dynamic response to the modeling and ground motion characteristics. It needs actual modeling of the cyclic load-deformation characteristics. In order to perform the nonlinear dynamic time-history analysis, the analysis was performed on the three-dimensional models of pre-existing buildings. In addition, the SAP2000 was used in the current study with the help of sine function to clarify the load cases in both the X and Y directions, as shown in
Figure 12.
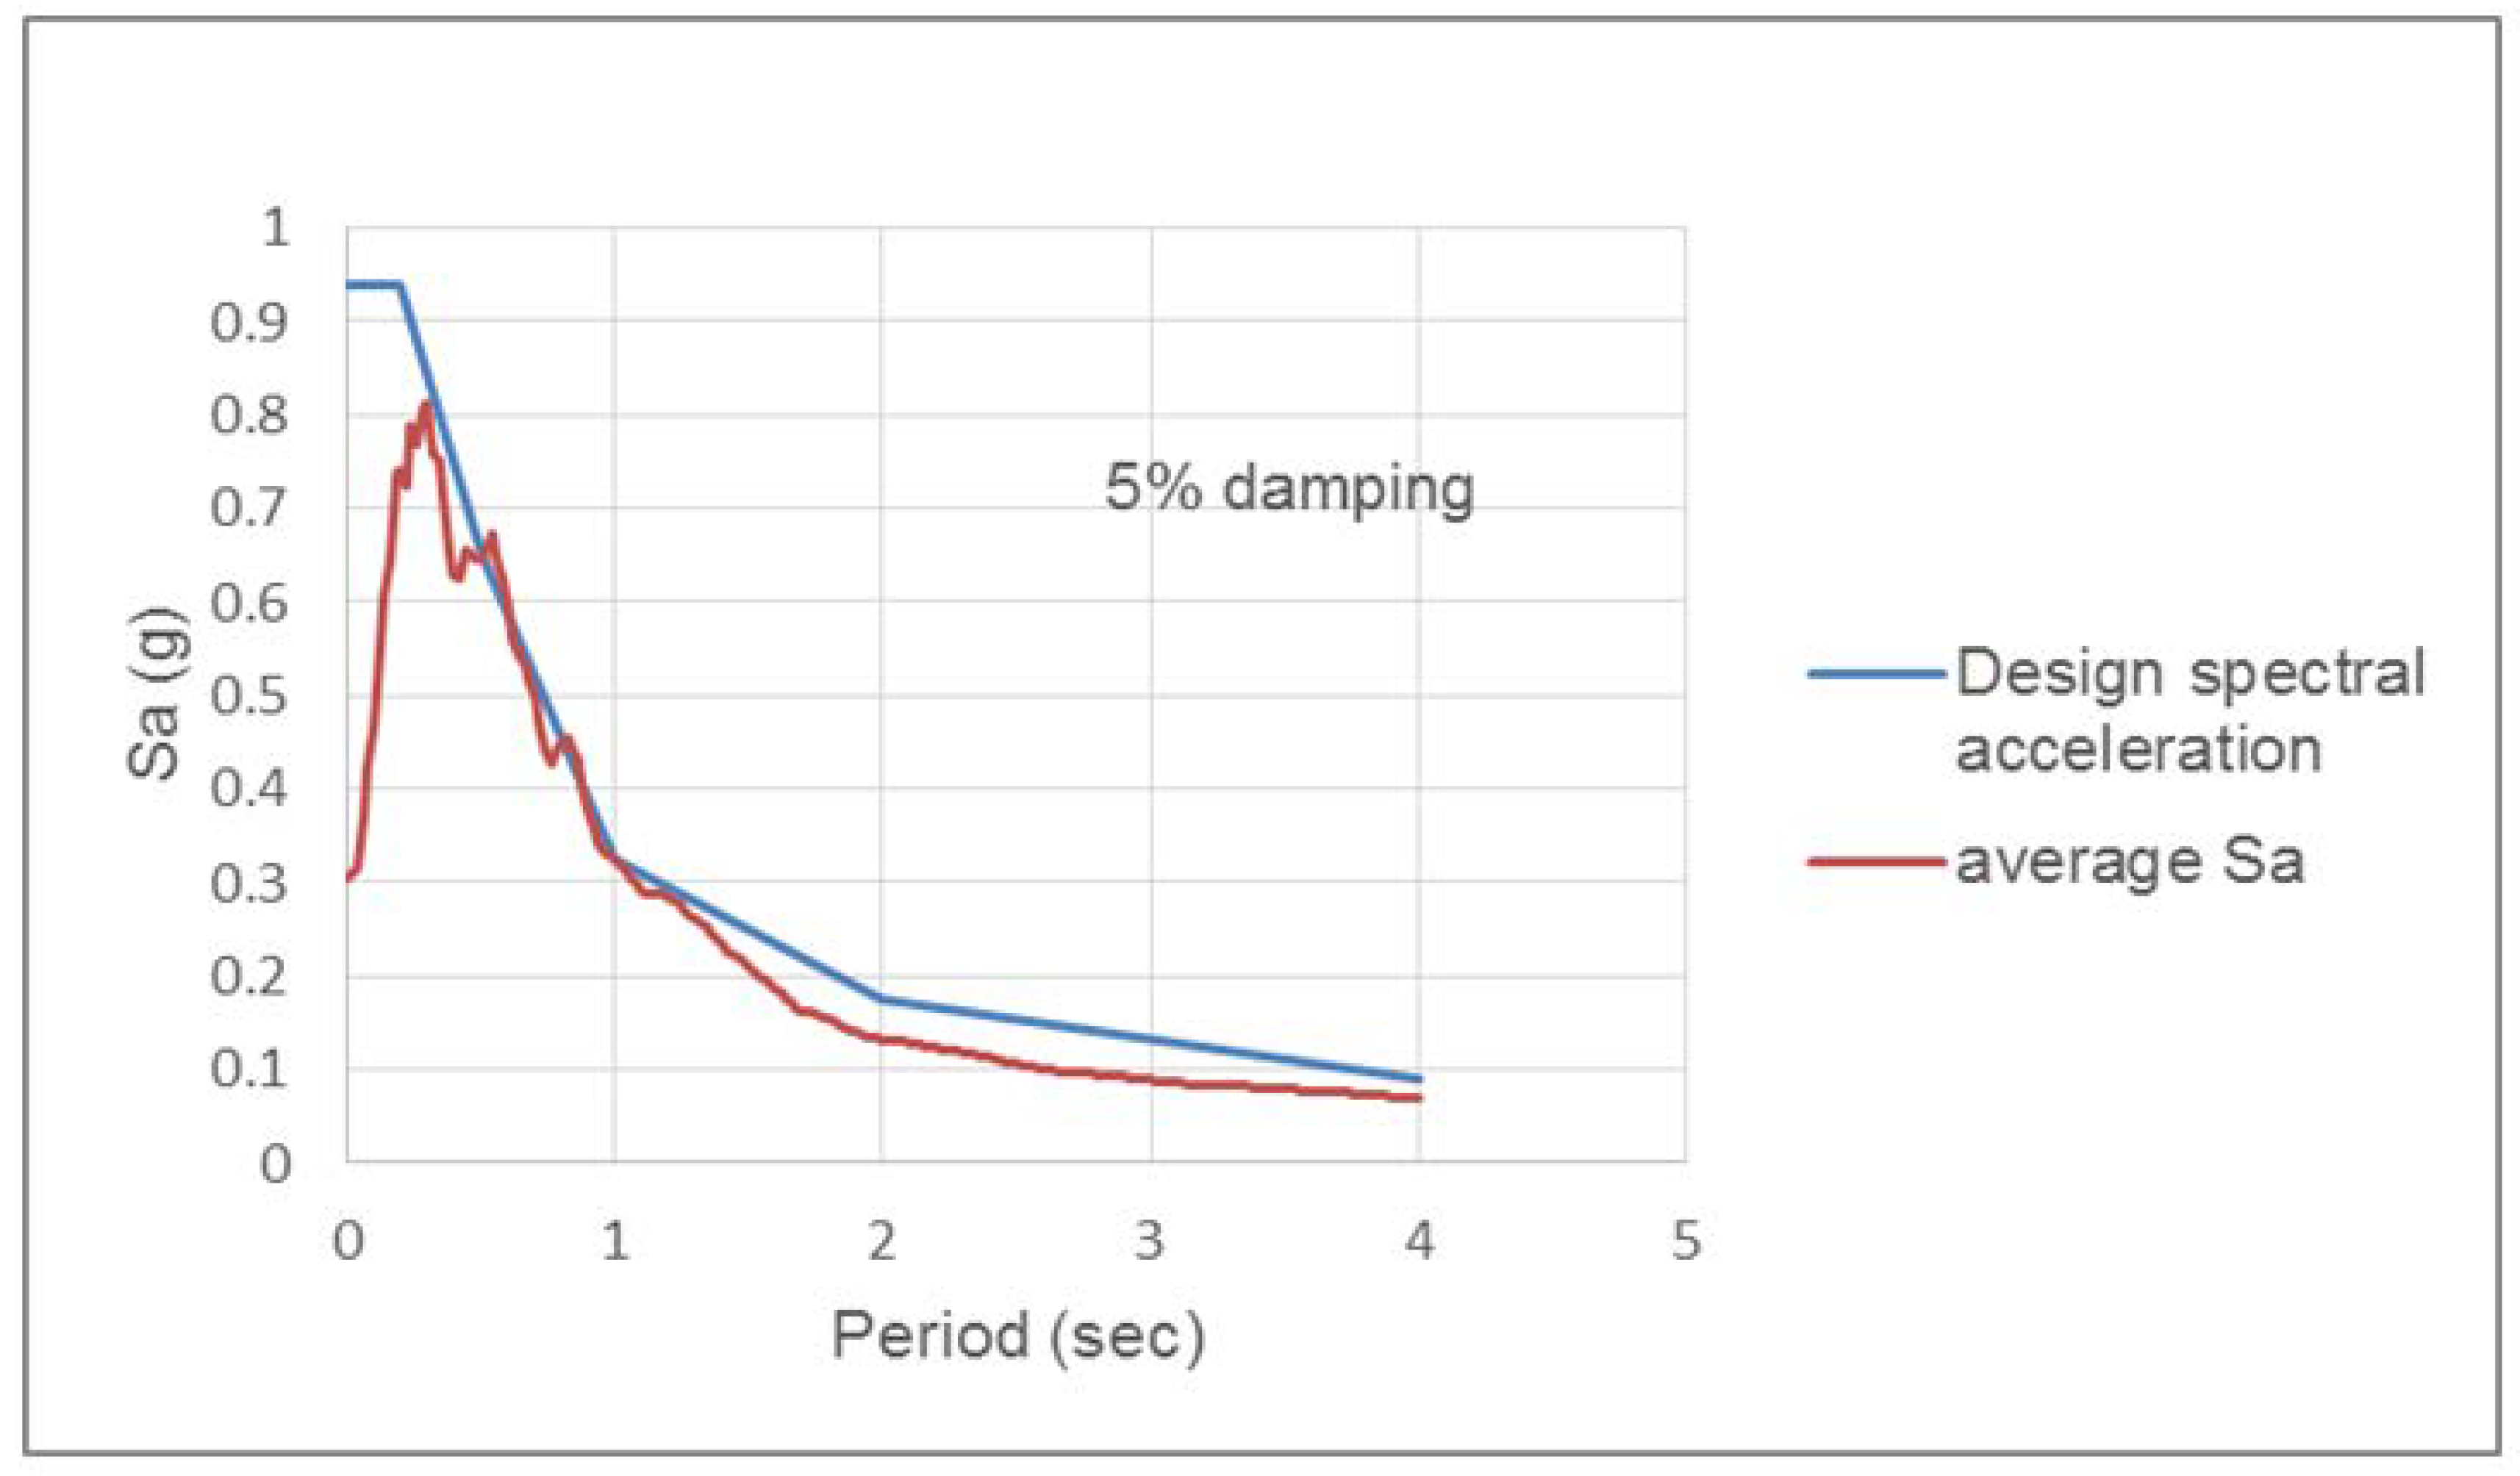
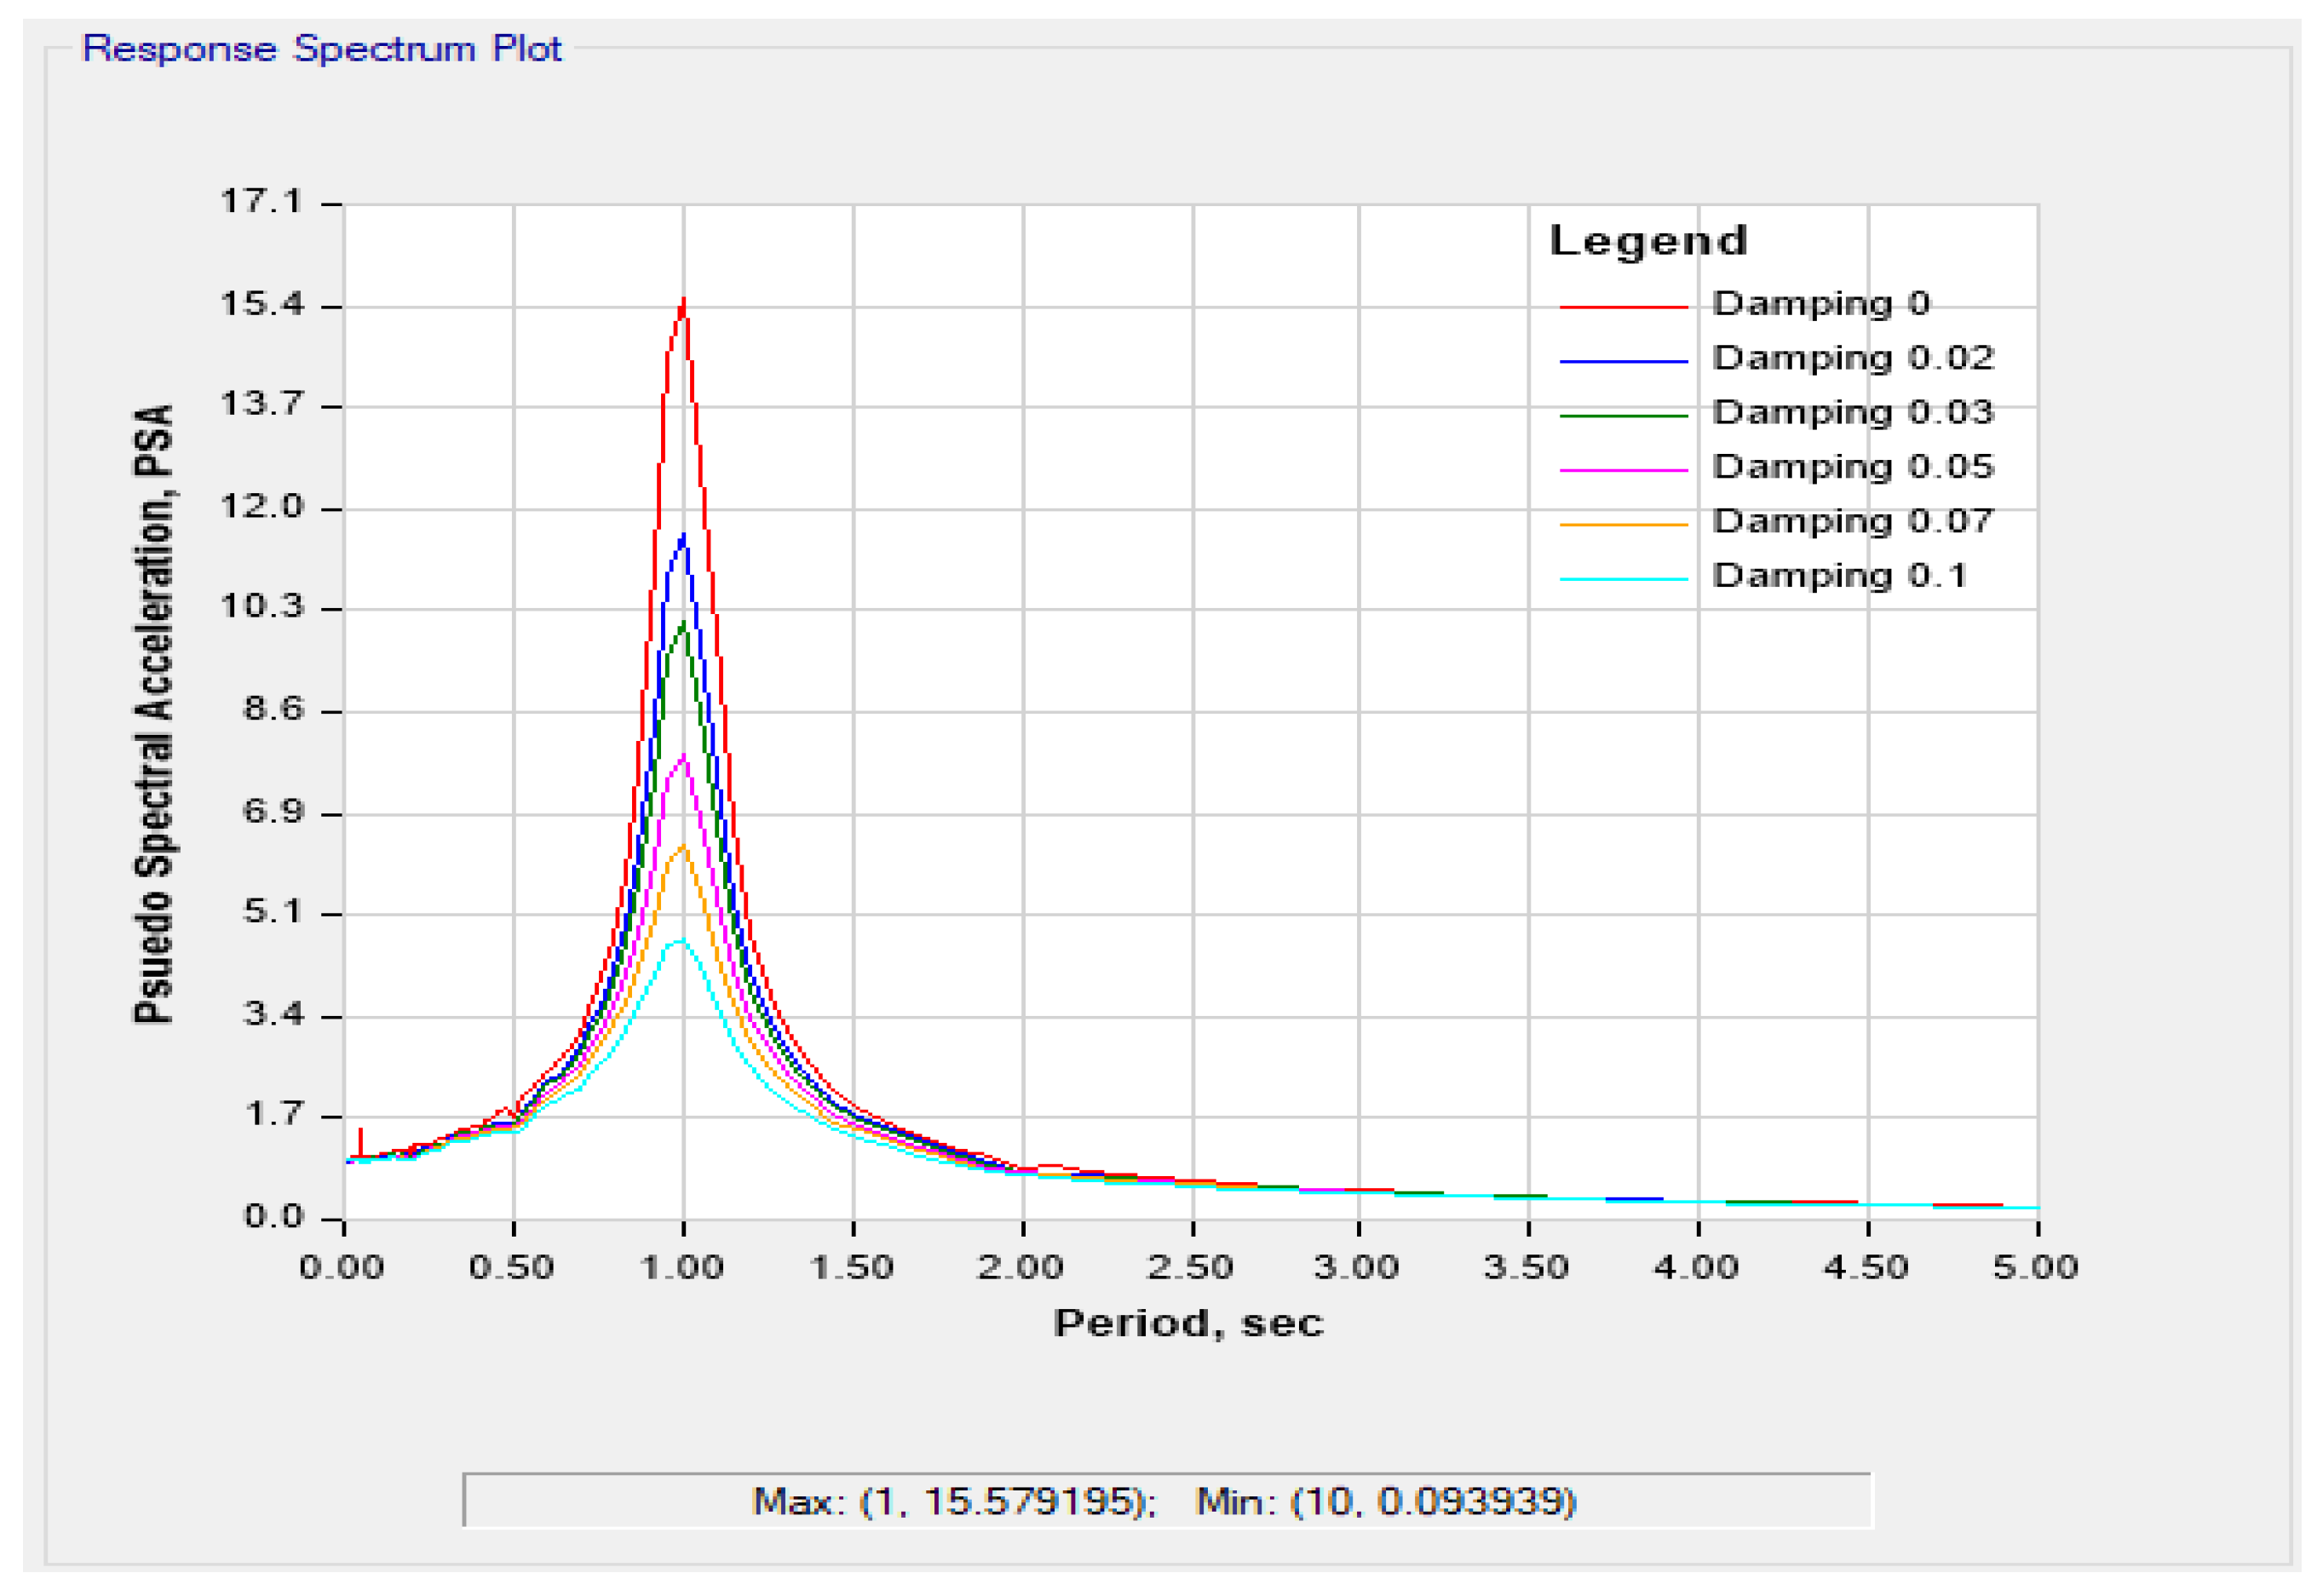
Figure 13 shows the plot of spectral acceleration and time period for the different damping ratios used in this project. It can be noted that increasing the damping ratio will reduce the spectral acceleration.
6.1. Time-History Analysis of Model-1 (6-Story)
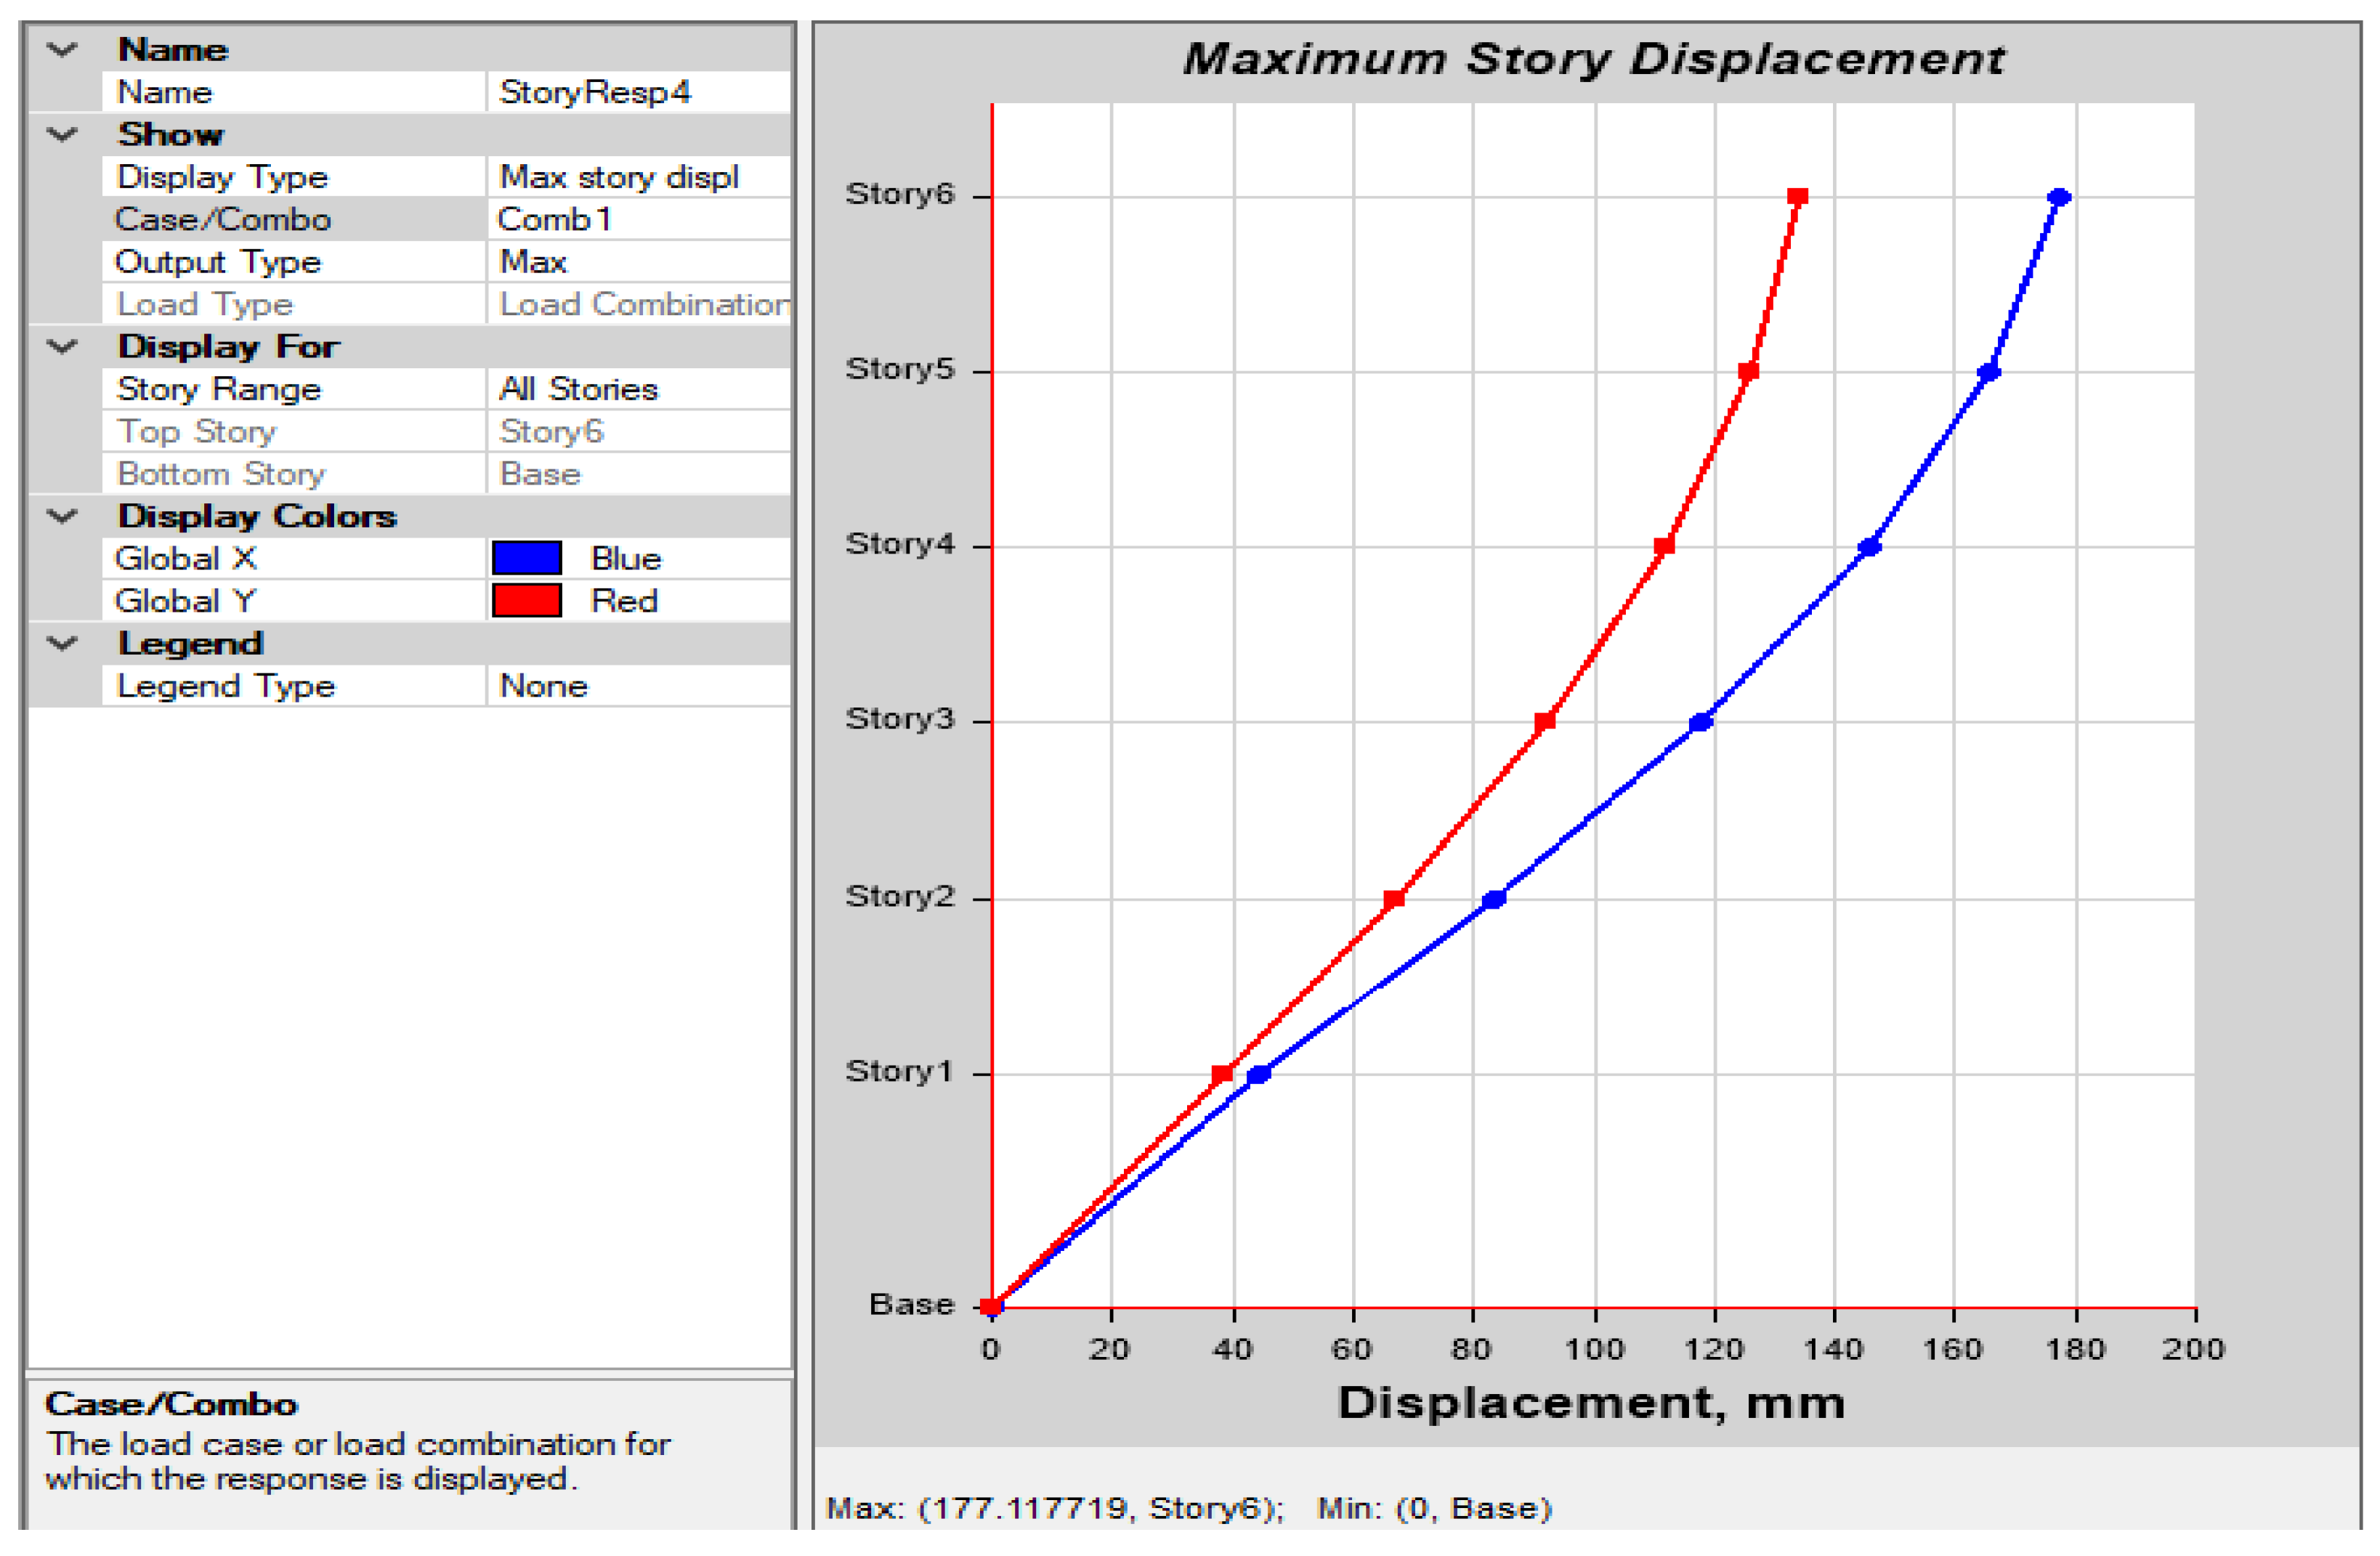
Figure 14 illustrates the displacement of the 6-story building which is calculated at each story location in both X and Y directions. The absolute maximum displacement is 230 mm and 200 mm, respectively.
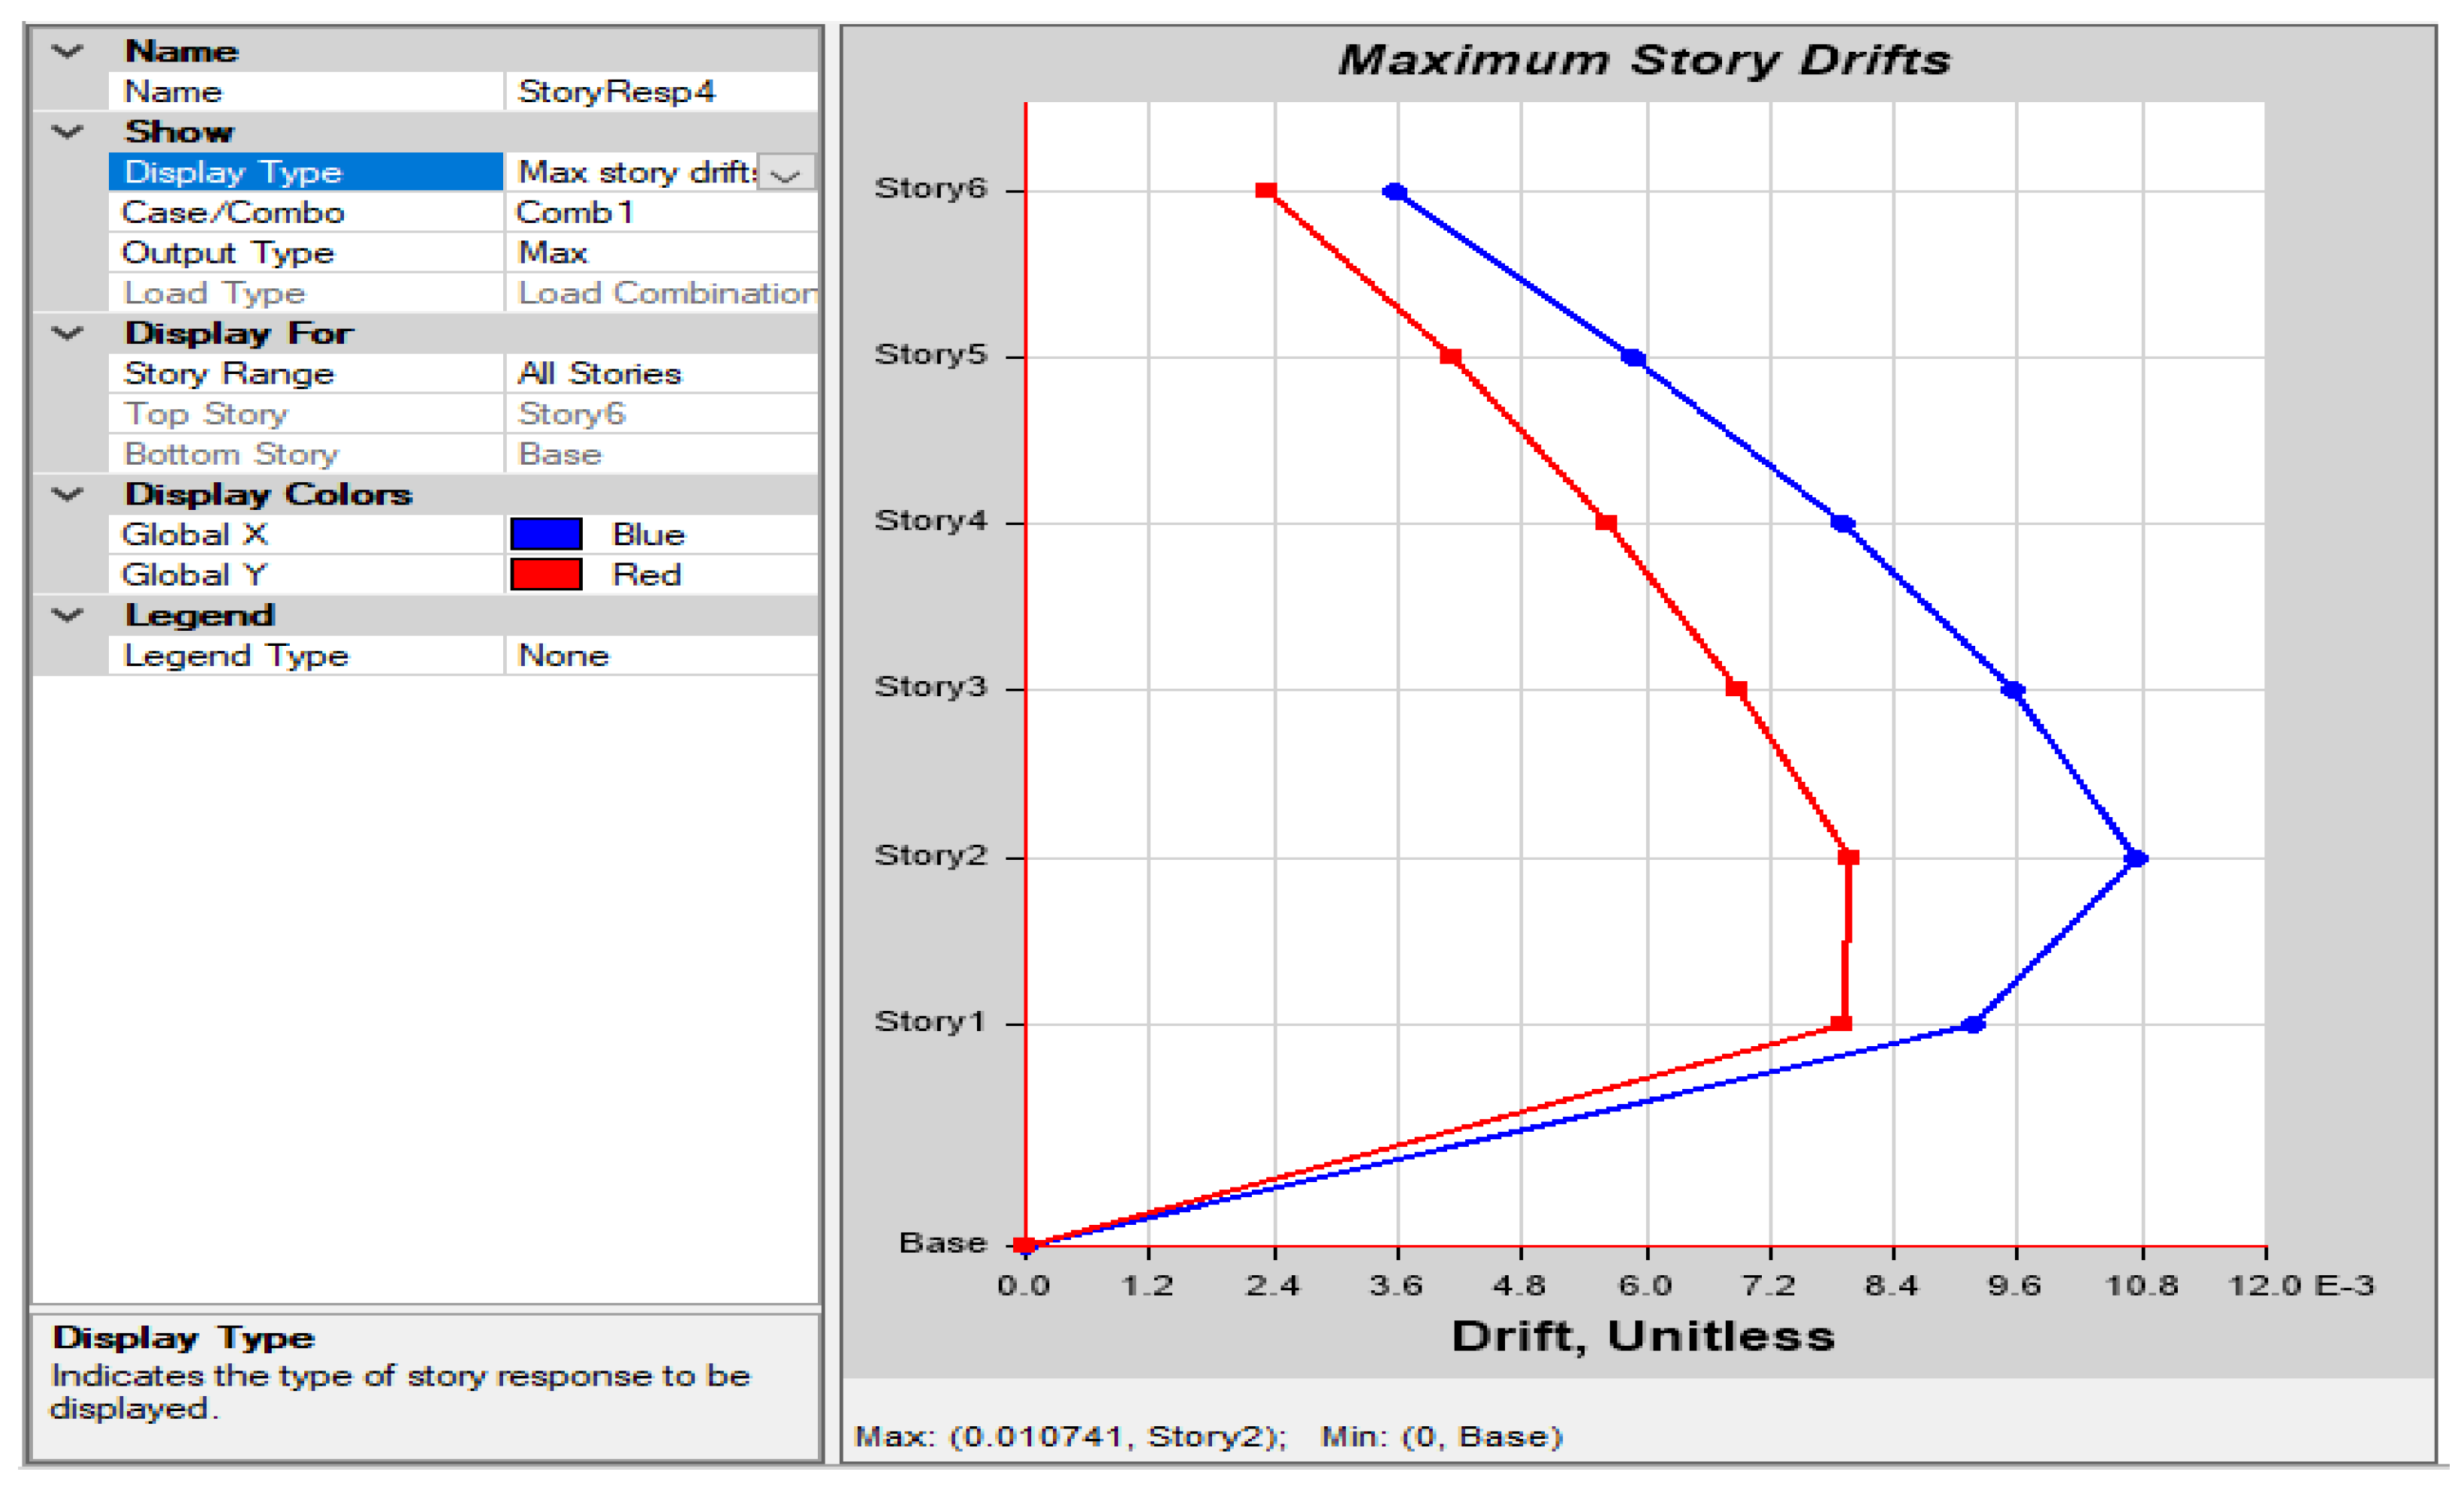
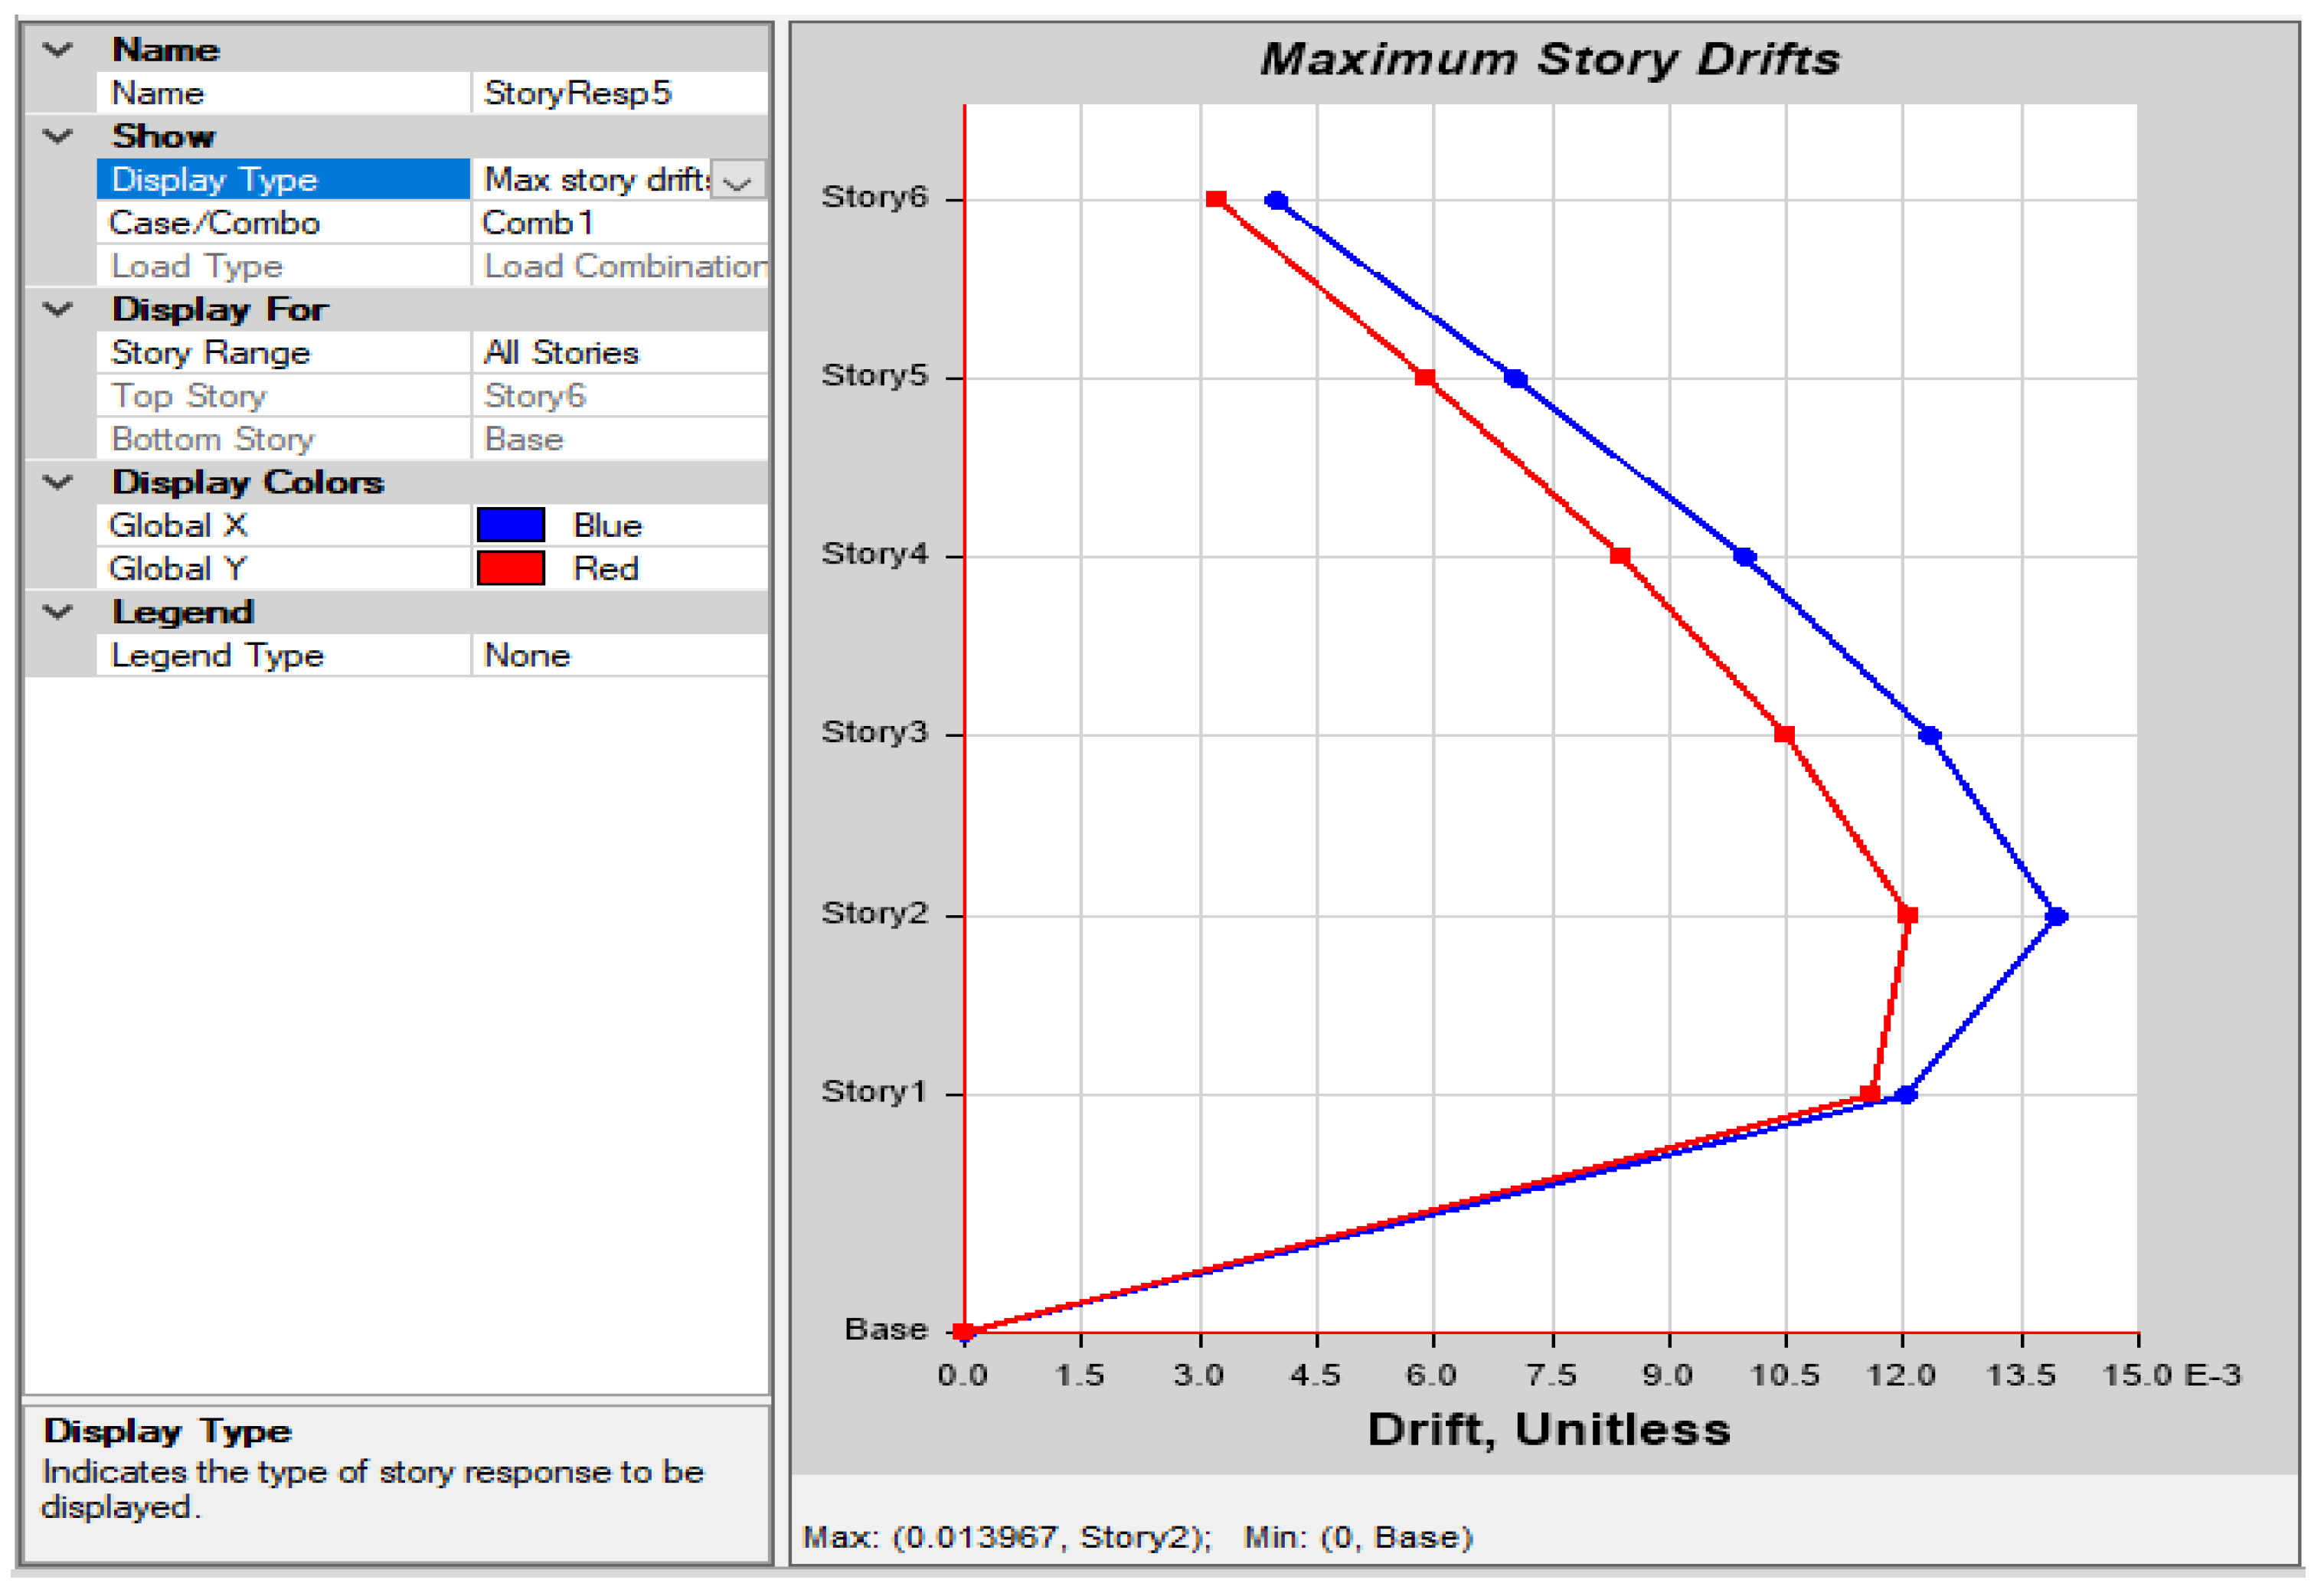
The maximum story drift for model-1 is plotted in
Figure 15. According to the plot, the highest drift which happens in story 1 in the X direction is 0.0139 mm.
Table 3 reports the maximum inter-story drift ratios for the bare frames of the 6- and 12-story buildings. In this study, inter-story drift ratios in the ranges of 0.2–0.5%, 0.5–1.5%, and 1.5–3% correspond to non-structural damage, moderate structural damage, and severe structural damage, respectively. Inter-story drift ratios greater than 3% can be assumed to correspond to a collapsed story.
The maximum inter-story drift ratio in the current study occurs on the second floor at 1.4%, which does not exceed moderate structural damage; in a previous study, a ratio of 2.07% occurs on the first floor and indicates severe structural damage in the story. For the 12-story scenario, there is a slight difference in the results with ratios of 2.30% and 2.25%, respectively.
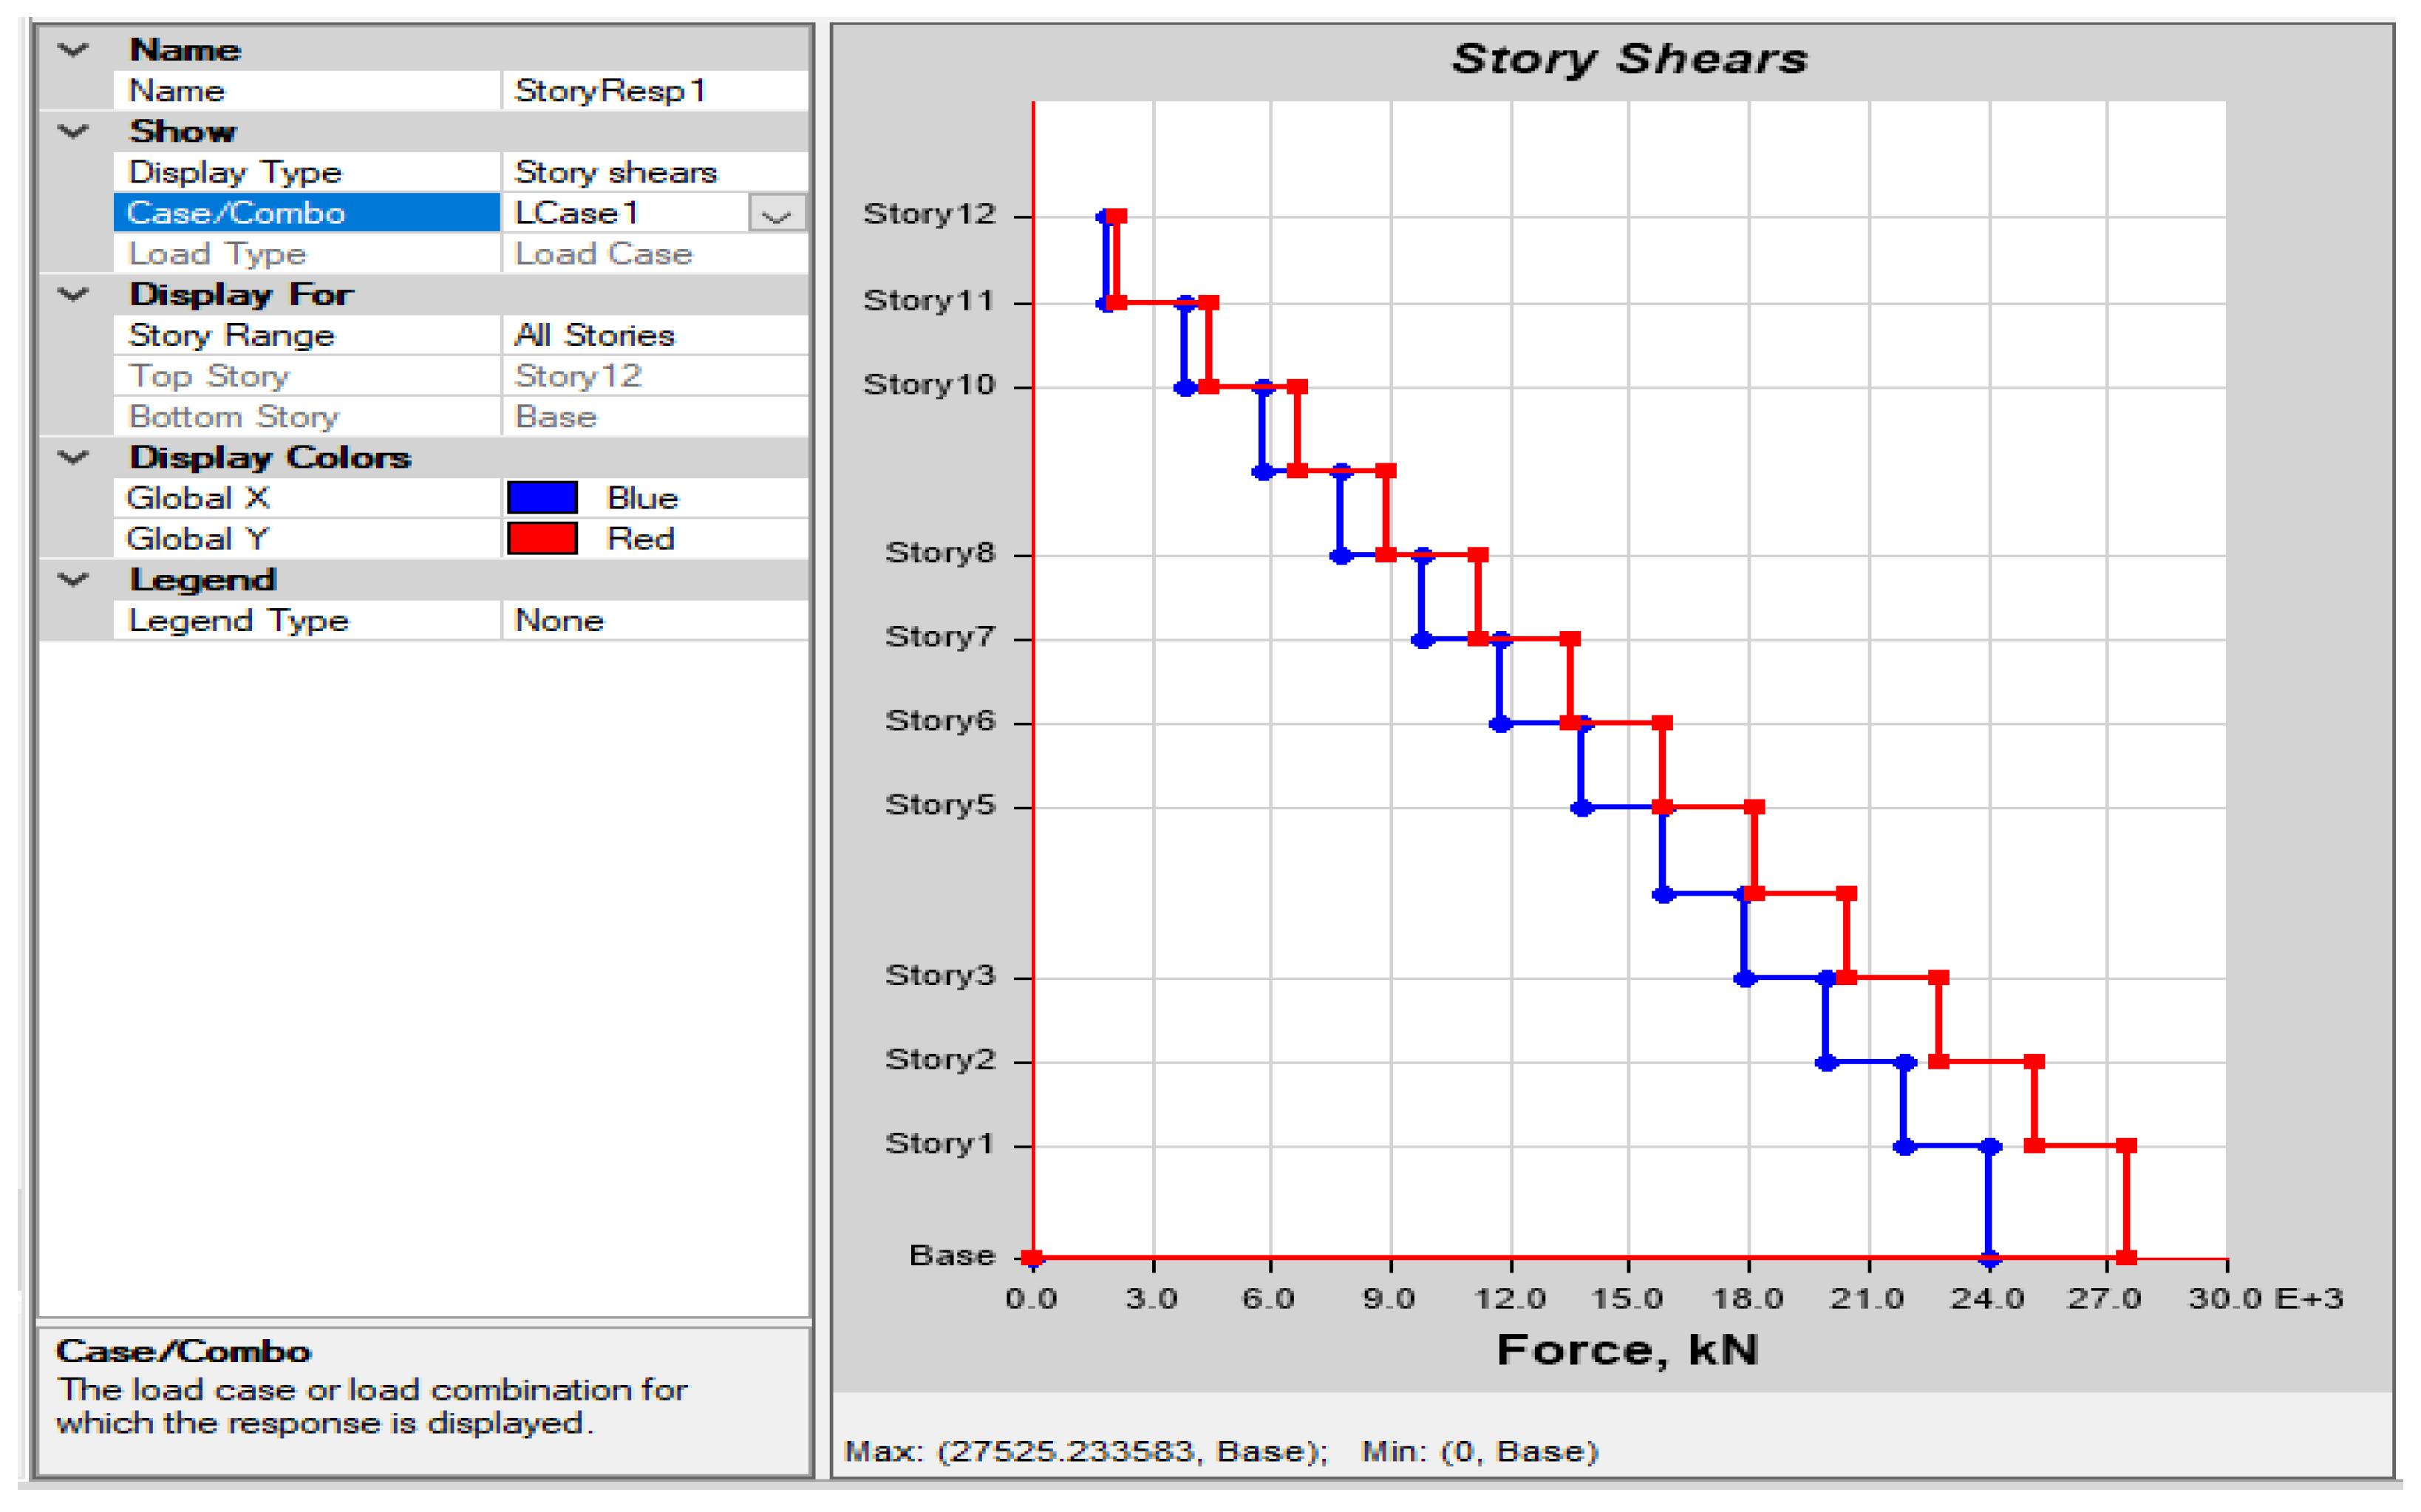
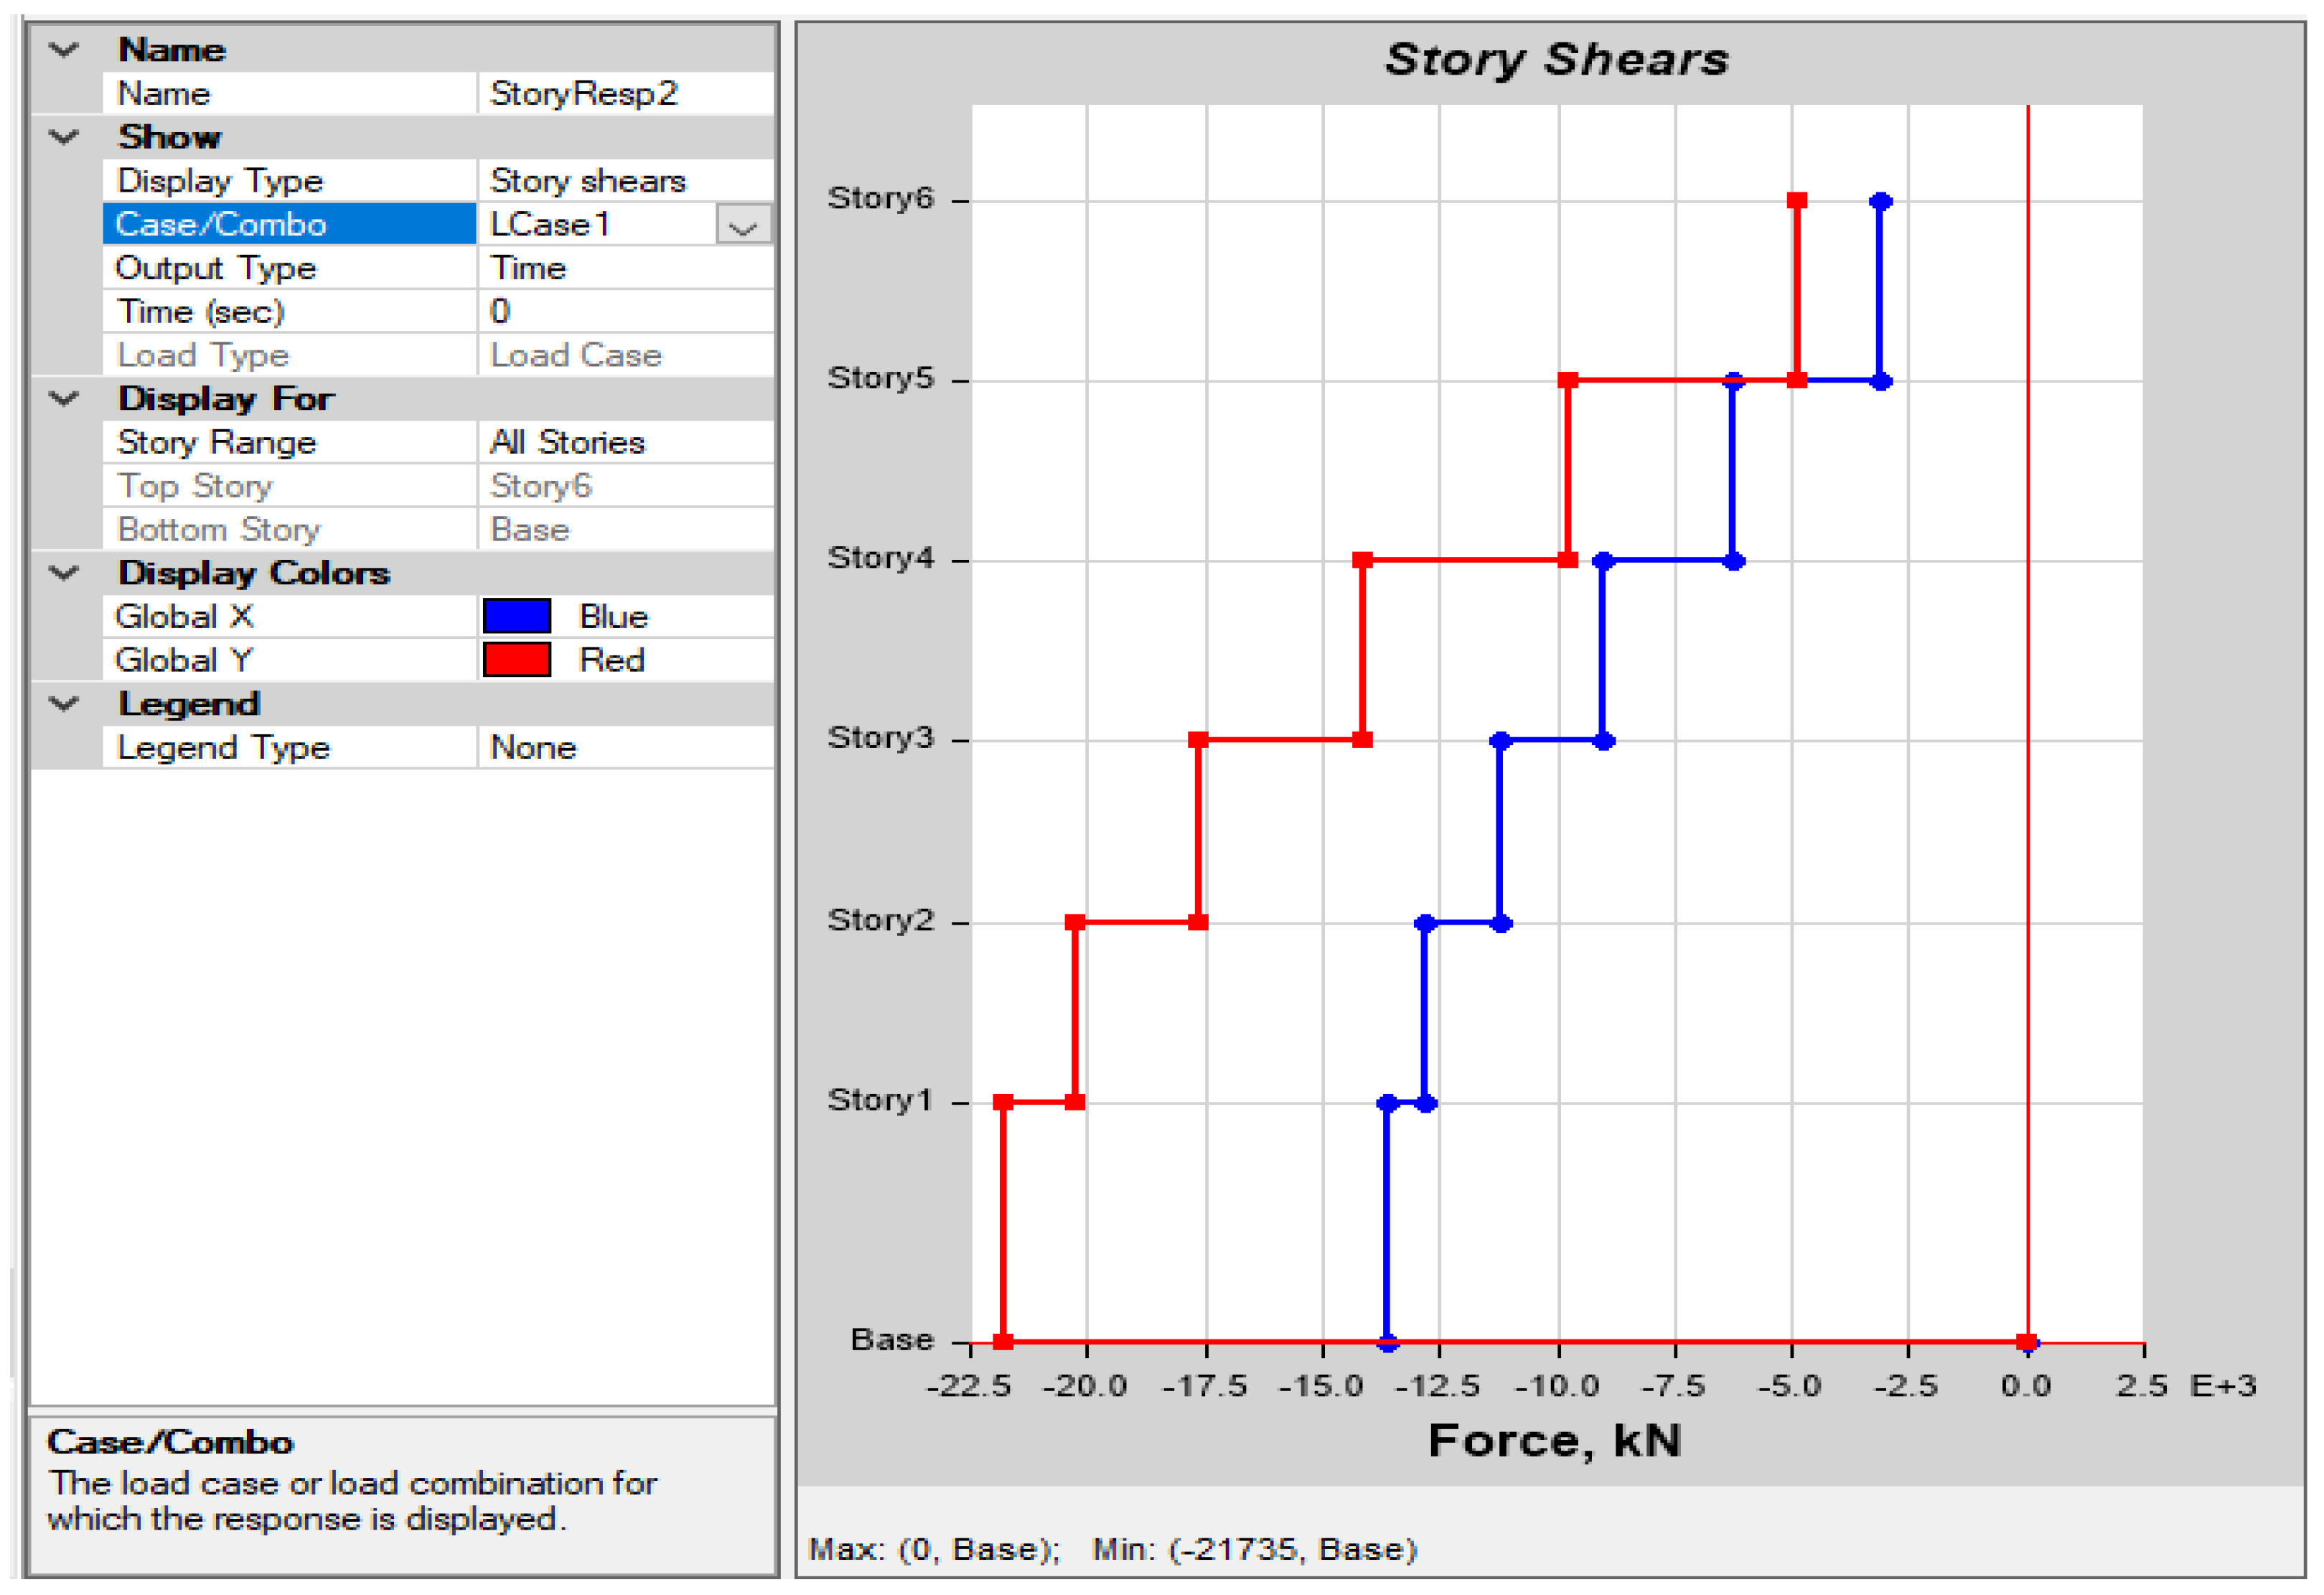
The base shear for model-1 corresponding to each story is shown in
Figure 16. The highest force is developed at the bottom of the building, and it is 22,000 KN. The magnitude of the shear force is lower in the upper stories. The biggest difference in the shear force occurs between stories 3 and 4, and it is obvious by observing a significant gap in the story shear graph, which means that story 3 is subjected to the maximum story force, and it equals to approximately 17,500 KN.
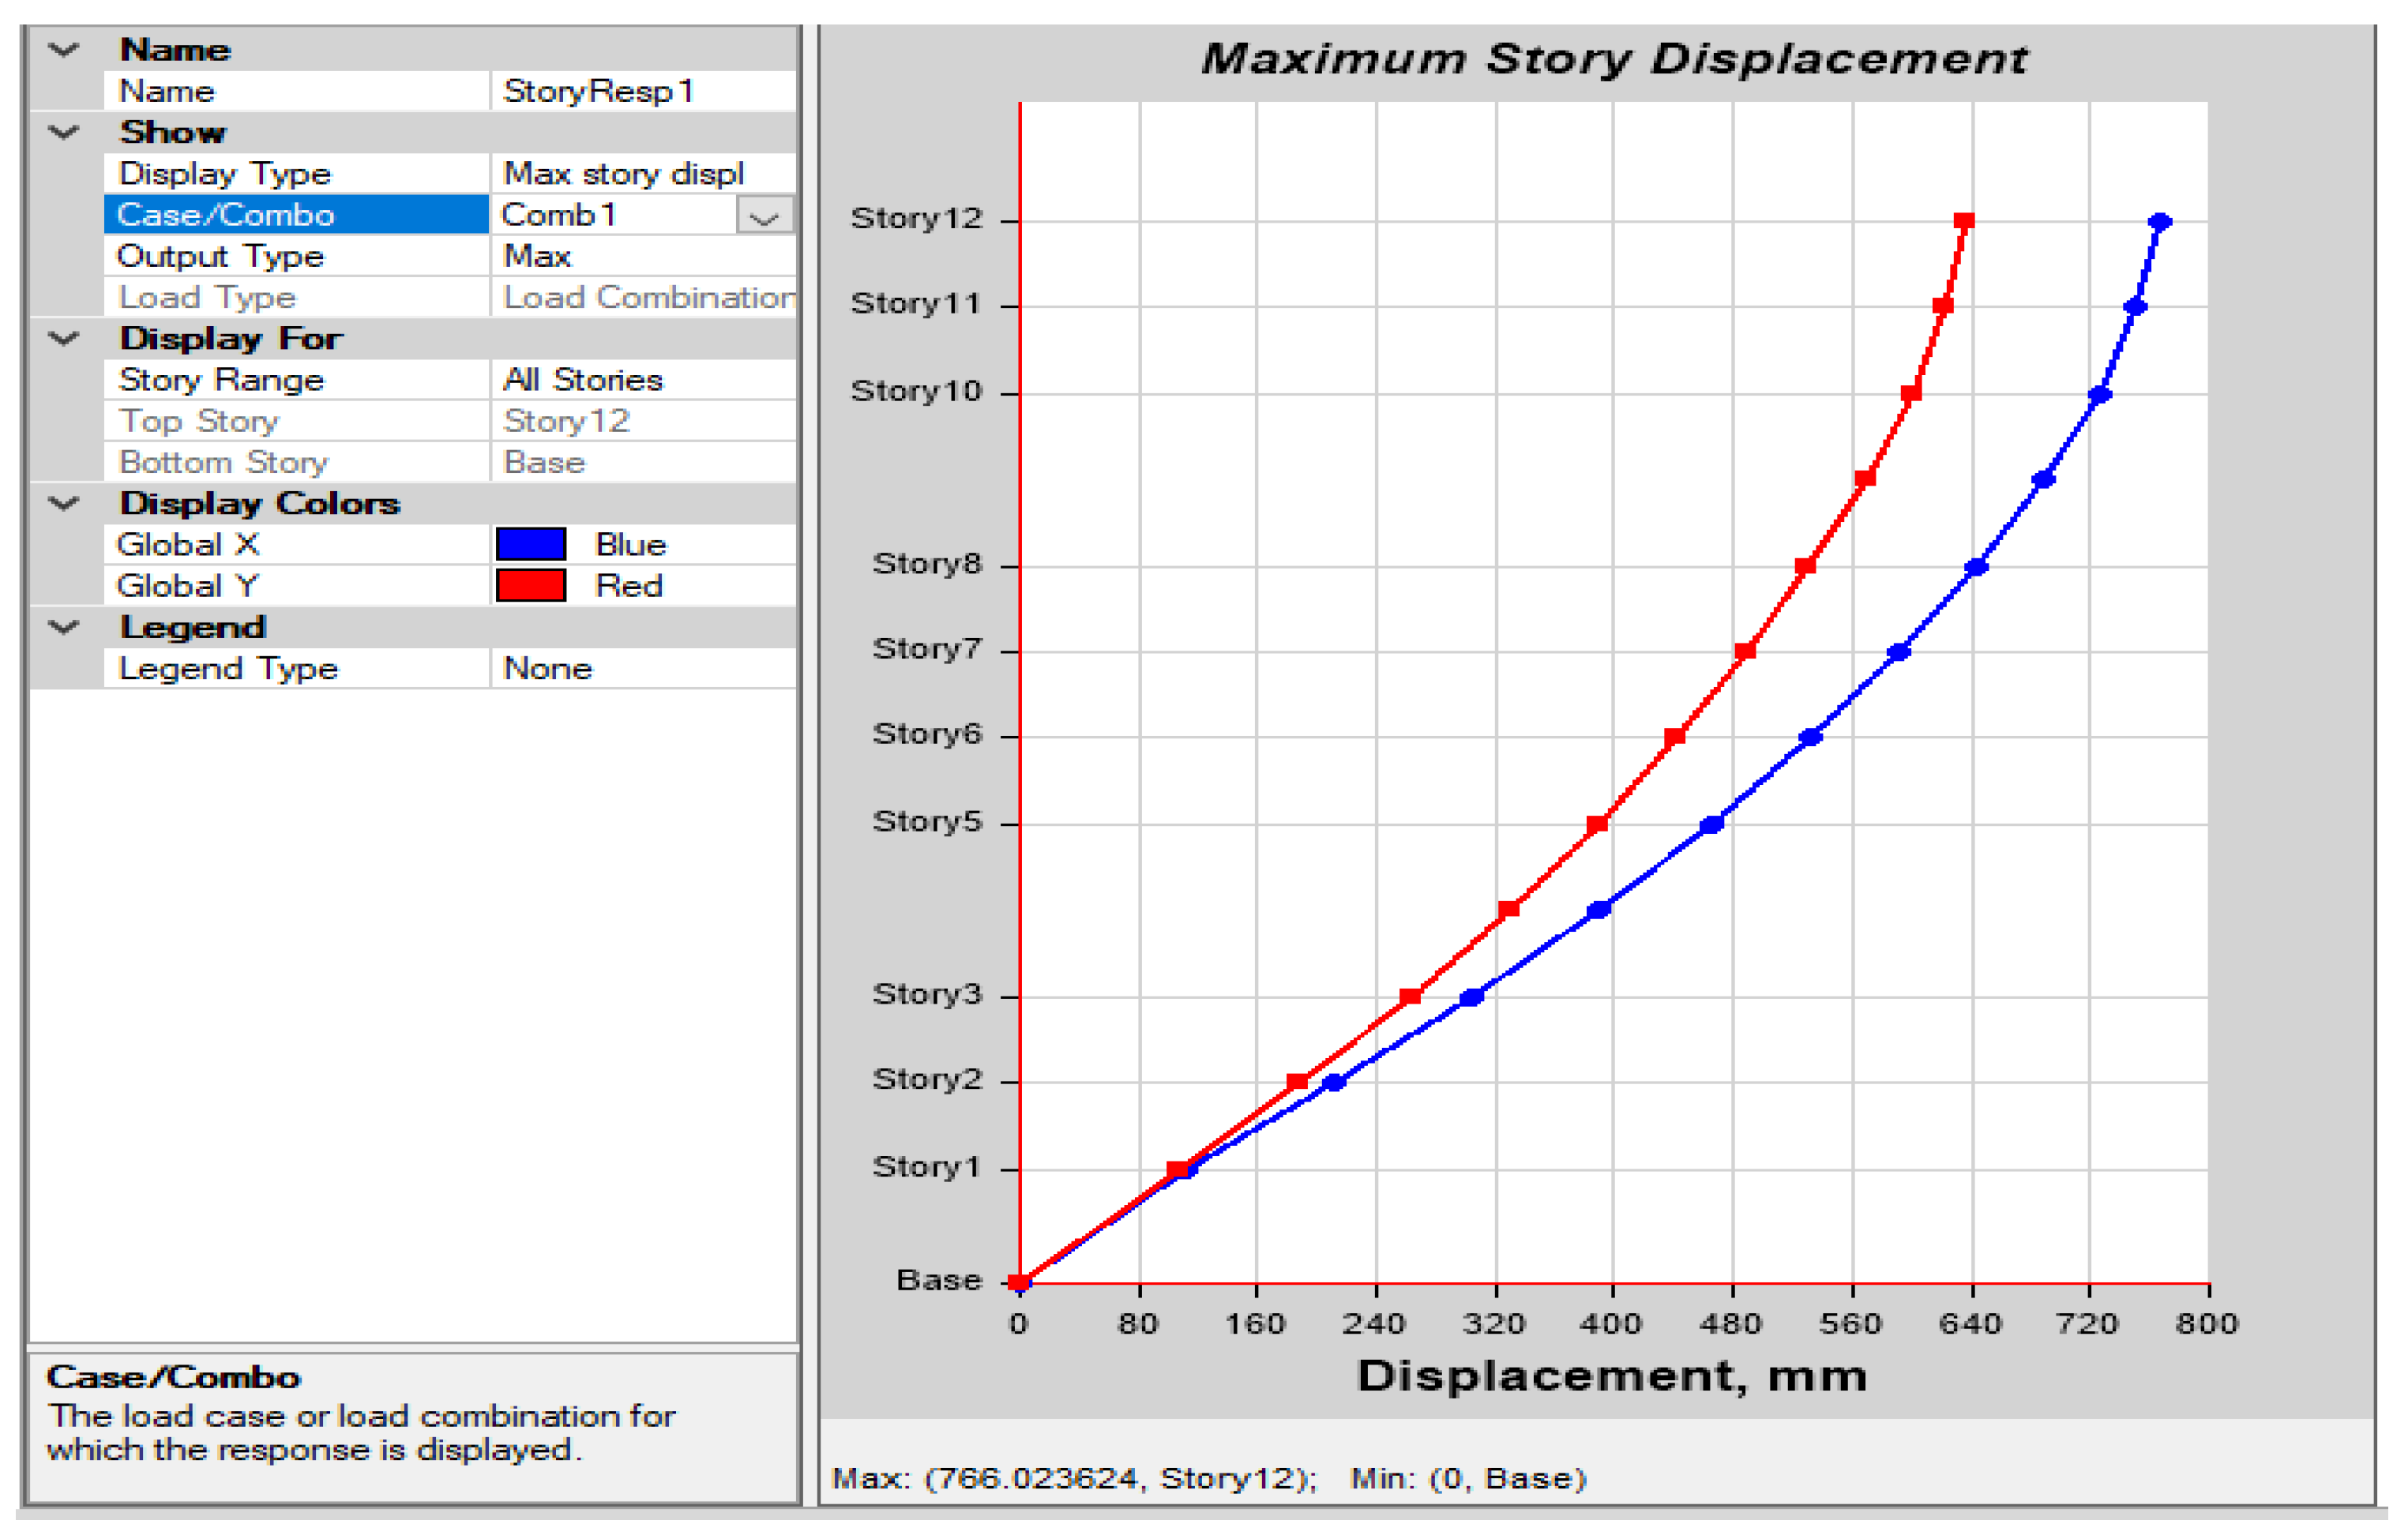
6.2. Time-History Analysis for Model-2 (12-Story)
The steps will be repeated for model-2 as the previous one, and the displacements and maximum story shear of the 12-story building are calculated at each story location for both directions. The graphs and results are highlighted in the
Section 7.
6.3. Comparison of Results
The liner static and response spectrum analysis and nonlinear time-history analysis were accomplished in both longitudinal and transverse directions as follows:
6.4. Maximum Displacement Comparison
The tables below illustrate the maximum displacements for each model and the results are shown (see
Table 4,
Table 5 and
Table 6).
The displacement tables above show the displacement in both X and Y directions. Obviously, the static analysis has very small amount of displacement due to its rigidity. In the dynamic analysis, the time-history analysis has higher value than the spectrum analysis because it gives all the possible forces which are generated.
6.5. Base Shear Comparison
In
Table 7, the base shear for static loads for the static linear analysis is very low, approximately zero due to the rigidity of the structure.
Table 8,
Table 9 and
Table 10 show the base shear results by performing response spectrum and time-history analyses corresponding to design spectrum in the NBCC-2015 for both 6-story and 12-story buildings for the average spectral acceleration. It is obvious that the time-history analysis has higher value for the shear due its accuracy and full details.
6.6. Comparison of Fundamental Periods of Buildings
The fundamental period is a worldwide characteristic expressing the behavior of a building under the load of an earthquake. Because of this fact, it is beneficial to identify the global demands on a structure due to a given seismic input. Generally, the phase of a bare frame in its basic mode of vibration is higher than the value acquired using the expression suggested by the NBCC-2010. Non-structural elements in a frame play an important role in thickening the structure, significantly reducing its fundamental phase of vibration (see
Table 11).
In this study, only the bare frames are considered and compared against by using the guidelines of the NBCC 2005. For concrete frames, the code recommends the following empirical expression (see Equation (4)):
where
T is the fundamental period.
hn is the height of the building above its base.
If the modal analysis of the frame indicates a higher value of T, the lateral loads are revised using a higher value of the period not exceeding 1.5 T, as suggested in the NBCC 2015.
The periods of the bare frame models of the six- and twelve-story buildings, as obtained from a modal analysis, are listed in
Table 12. For the six-story building, the period of the bare frame is 1.865 s, while the period obtained from the NBCC 2015 expression is 0.790 s. For the twelve-story building, the period of the bare frame is 2.2 s, while the corresponding NBCC value is 1.303 s.
Table 12 shows the fundamental period from a previous study. It is obvious that the current study has a higher fundamental period for the 6-story building, which is 1.865 s, than the previous study. In the case of the 12-story building, there is similarity in magnitude, which is 2.202 and 2.31, respectively. Both studies exceed the 1.5 Ta reported by the code. Therefore, this study uses the maximum allowable limits rendered by the NBCC 2015.
7. Conclusions
The vulnerability level of structures in eastern Canada is subjected less to earthquake hazards than buildings in western Canada. This is why buildings in western Canada should be more ductile to the lateral load-resisting frames. A typical 6- and 12-story buildings of pre-existing concrete moment-resisting frame were modeled using two software, namely SAP2000 and ETABS, in this project. To generate the static and seismic behaviors of each structure, different methods were used including as the linear static, response spectrum, and time-history methods. Later, these methods were leveraged in order to determine their displacements and shear. Additionally, the buildings’ displacement was assumed to be inconstant. The rigid nature of the static analysis caused a small amount of displacement when compared against the dynamic analysis. The value of the time-history analysis was higher than the spectrum analysis as it provided all the possible forces produced. Furthermore, the more accurate method was found to be the time-history analysis, but it has a disadvantage as it consumes more resources. On the other hand, response spectrum is fast and economically friendly. Moreover, the time-history method must be used over response analysis in paramount structures because the prediction of structure behavior is more reliable using the time-history method. In addition, a comparison was reported between previous studies that used the IDARC2D software and the proposed results that used the ETABS software. As a result, after the investigation, it is obvious that the 3D software is much accurate than 2D ones. In addition, this research also tackled the expected risk due to the absence of climate effect on earthquake errors. To this end, the present study rendered an in-depth investigation for the seismic response of buildings. In this regard, this research paper scrutinized moment-resisting frame type buildings that were subjected to seismic force with two different heights. The importance of buildings nowadays has been increased due to the rapid industrial development and increase in population. Hence, this study is promising and there is a huge potential for researchers and students to study other factors in this field.


