1. Introduction
The intercity passenger rail services in Bangladesh have faced continuous economic losses despite the increasing volume of rail passengers, because of the poor services provided by the Bangladesh Railway Authority, [
1]. This has led the authors to believe in the presence of systematic deficiencies in the railway system, which has motivated the authors most to use a meticulous endeavor to assess its service quality. The perception of rail passengers on service quality of intercity rail transport is vital for improving the services within budget constraints. The rail passengers’ perception depends on their demographic characteristics, trip purposes and travel behavior [
2,
3]. A major portion of intercity rail commuting is for work and education purposes. Commuters have been defined as people traveling periodically and recurrently between places of residence and work, or study. In the process, such people exceed the boundary of their residential community. Although such people can significantly contribute to the country’s economy, their preferences or attitudes are rarely accounted for in public transport [
4,
5,
6,
7]. Thus, it is important to assess commuters’ perception of rail service quality in Bangladesh.
Bangladesh, being a developing country, has social and transportation conditions different from that of developed nations [
8,
9,
10,
11]. Consequently, six unique factors have been explored in this study. Observations of railway stations and surrounding road infrastructure revealed the presence of human porters who can be employed to carry passenger luggage in exchange for monetary compensation. Additionally, the presence of homeless people and mobile hawkers/vendors plying their trade can irritate passengers in the railway station. In addition, some shops have been set up illegally without government permission inside station premises. The majority of the shops sell low-quality food to consumers at exorbitant prices [
12,
13]. Moreover, the traffic congestion is extremely high at level crossings near railway stations, causing an additional delay for rail passengers both en route to stations and traveling by train [
14,
15,
16,
17]. Additionally, the presence of a solitary railway line between Joydebpur Railway Station and successive destinations (instead of a minimum of two lines that is practiced worldwide) increases train arrival and departure scheduling conflicts, which have been further discussed in
Section 4 [
18,
19]. This can lead to situations where passengers may have to wait several hours before a train departs from the station. Thus, to obtain a true picture of passenger discomfort, arrival and departure performances have been considered separately in this study. Considering such unique factors, among other things, a methodological assessment of people traveling via commuter rails is essential. Hence, this paper aims to evaluate passenger satisfaction for Joydebpur railway station, which is considered to be a very significant railway station in Bangladesh. Particularly, the present study focuses to help relevant authorities identify current railway service deficiencies and facilitate future service improvements. This is performed by analyzing 24 service quality attributes and 5 demographic parameters. In fact, to the best knowledge of the authors, no other single study has investigated so many service quality attributes together. Additionally, carrying out the study in a developing country has enabled the authors to investigate six factors not only unique to but also reflective of the study area. Moreover, the study is the first among its kind to holistically understand the service quality factors by merging several types of analyses, including the significance of regression coefficients, factor rankings, correlation pairs and average ratings.
This brief introduction is followed by a literature review concerning different methods of assessing customer satisfaction focusing on railway services. This is directed to address the research gap that no study has been previously done using a vast number of service quality attributes in a developing country hosting several unique factors to assess intercity commuter rail passenger satisfaction, identify significant attributes, and rank those through developing models and correlation matrix. The experimental context is next described in detail, focusing on the study area and methodology of passenger perception assessment using a questionnaire survey. This is followed by the theoretical background of ordinal logistic regression (OLR).
Section 5 explains the results obtained from the application of OLR. Finally, a brief general discussion of the work and overall research findings are provided.
2. Literature Review
Parasuraman et al. (1985) defined service quality as the degree and direction of discrepancy between consumers’ perceptions and expectations in terms of different but relatively important dimensions of the service quality, which can affect their future behavior [
20]. This has been interpreted to indicate the aggregate of characteristics of a commodity or service influencing the needs of consumers. A strong correlation between service quality and customer satisfaction reveals that customer satisfaction is dictated by how well a company can respond to a customer’s needs. Thus, customers’ opinion reflected by the degree of their satisfaction portrays service quality, underscoring the importance of conducting customer satisfaction surveys [
20].
Railway service quality has been assessed worldwide, as shown by
Table 1. However, a greater share of the studies has been performed in developed countries. The travel demand, legal restrictions, travel behavior, and disharmony among planning authorities in developing countries are different from those in developed countries, while the developing countries face extensive challenges of ensuring mobility for huge population at an affordable price while balancing the environmental concerns [
14,
21,
22,
23]. In fact, developing countries often have context-specific factors not found in more advanced nations. For example, Geetika and Nandan (2010) were the first to study about porter behavior. Porters are people that help to carry luggage inside the station in exchange for money [
5]. Often, these porters may be people with low education levels who have grown up in tough neighborhoods [
24]. Geetika and Nandan (2010) emphasized the need for porter to acquire “soft skills” to deal politely and maturely with passengers [
5].
A few studies developed demographic models to determine the significant attributes of rail passenger perceptions in developing countries, as shown in
Table 1. Geetika et al. (2010) investigated the passenger satisfaction at Indian railway platforms on refreshment, information system, porter behavior, basic facility, safety and security [
5]. Mijares et al. (2016) analyzed the waiting time, in-vehicle travel time, fare, air quality, risk perception, and adaptation of a small number of rail passengers (225 respondents) to understand passenger satisfaction and their adjustable behavior in severe environments at a metro rail line in Philippines. Mijares et al. (2016) considered income as the only demographic characteristics of rail passengers, ignoring their demographic diversity [
25]. Kriswardhana et al. (2018) assessed the 400 rail passengers’ responses on 13 ordinal variables of rail services in Indonesia and found that the scheduled arrival of trains positively affected the overall satisfaction level. A major drawback of the study is that none of the ordinal variables investigated were clearly explained beforehand. For example, the variable “officer service” seems to be ambiguous because it does not indicate whether passengers judged officers’ performance on the basis of efficiency, promptness, politeness or ethics, or on a combination of all the mentioned bases [
26]. Hadiuzzaman et al. (2019) used the adaptive neuro-fuzzy inference system (ANFIS) to assess the effects of physical and service quality attributes on intercity train service for regular and festival scenarios at Kamalapur Railway Station, Dhaka. Although the study provides important insight into intercity trains in Dhaka city, it neither addressed income variety among respondents nor developed correlation among studied variables [
27,
28]. Islam et al. (2018) assessed railway service quality in Joydebpur Railway Station (which also happens to be the study area of this article) using 21 service quality attributes by considering the situation both at the station and inside trains. The study found that people were slightly more dissatisfied with facilities inside train than those inside the station. A major limitation of the study is its simplistic weighted average method to assess the service quality attributes. However, the study is interesting as it uses photographs to visualize the current service conditions inside trains and at the station. Such conditions are uncommon in advanced countries. For example, the study shows people jam-packed inside unhygienic trains. To save time from finding later trains, some people try to board trains at full capacity and sit on train roofs. Such people may have safety problems throughout the train journey [
15]. In fact, trains are jam-packed with people above the rooftop during the holiday season in Bangladesh [
29,
30].
Table 1.
Selected literature on application of statistical modelling to customer opinion on trains.
Table 1.
Selected literature on application of statistical modelling to customer opinion on trains.
| Literatures | Country (Type) | Type of Train | Statistical Method |
|---|
| Islam et al. [15] | Bangladesh (developing) | Mixed train services | Weighted average |
| Hadiuzzaman et al. [27] | Bangladesh (developing) | intercity | Adaptive Neuro-Fuzzy Inference System |
| Zhang et al. [31] | China (developing) | Mixed train services | Logit model |
| Wang, Zhang, and Sun [32] | China (developing) | Metro | Fuzzy decision |
| Zhen, Cao and Tang [33] | China (developing) | High speed | Logistic regression, IPA |
| Zhang, Wang and Cai [34] | China (developing) | High speed | OLR |
| Geetika and Nandan [5] | India (developing) | Mixed train services | Factor analysis |
| Ghosh, Ojha and Geetika [35] | India (developing) | Mixed train services | Logistic Regression |
| Kriswardhana, Hayati and Septiana [29] | Indonesia (developing) | Mixed train services | OLR |
| Mijares, Suzuki and Yai [25] | The Phillipines (developing) | Metro | OLR |
| Shao et al. [36] | Australia (developed) | commuter | OLR |
| Paramita et al. [37] | Australia (developed) | Mixed train services | Logit model |
| Eboli and Mazzulla [2] | Italy (developed) | Regional, suburban and express | Structural Equation Modelling |
| De Oña, Eboli and Mazzulla [38] | Italy (developed) | Regional, suburban and express lines | CART |
| Cavana, Corbett and lo [39] | New Zealand (developed) | Mixed train services | SERVQUAL |
| De Oña et al. [40] | Spain (developed) | metro | Cluster analysis |
| Chou et al. [41] | South Korea (developed) | High speed | IPA |
| Cheng [42] | Taiwan (developed) | High speed | RASCH measurement model |
| Brons, Givoni and Rietveld [43] | The Netherlands (developed) | Mixed train services | Logistic Regression |
| Çelik and Senger [44] | Turkey (developed) | Mixed train services | Logistic Regression |
| Monsuur et al. [45] | UK (developed) | Commuter, rural, interurban, high-speed, open-access, long-distance | Logit model |
| Stuart, Mednick and Bockman [46] | USA (developed) | metro | Structural Equation Modelling |
Previous studies on Bangladesh railway have identified train schedules, train information, and ticket systems (including illegal ticket scalping) to be the major source of problems for passengers. Studies have referred to the presence of “syndicates” that buy railway tickets in advance to create an artificial crisis of tickets that leave passengers with no option but to get those from the black market during vacation rushes. Moreover, researchers have expressed concern about the ailing infrastructure of railway (rail track, rolling stocks, signal system, etc.) and the inadequate spread of the general railway network across the country. Further problems highlighted via previous studies include poor quality of railway compartments, poor hygiene, poor lighting facilities, poor seat conditions, long delays in train schedules, and long waiting time in ticket queues [
47,
48]. De (2016) also found that current railway management is understaffed, which delays many vital railway operations [
47]. In fact, the mismanagement and lack of maintenance of railway lines have caused numerous derailments and fatal accidents [
49]. Such deficiencies have motivated the authors to assess railway service quality in Bangladesh.
A critical review of previous literature (in
Table 1) reveals that commuter rail has not received particular attention in developing countries. Commuter rail is an important part of urban life of Bangladesh, because many people use it to commute from city periphery to inside Dhaka, the capital for daily work. High housing and living costs inside Dhaka force many people to live in suburbs [
14,
27]. Although people can also commute using buses, rail is viewed as a cheaper and safer option, whose popularity is growing among the low- and middle-income classes [
14,
27,
50]. Such considerations have encouraged the authors to assess intercity commuter rail passenger satisfaction in Bangladesh.
The prospect of studying a large concentration of commuters in the setting of a developing country has led the authors to investigate passengers at Joydebpur railway station, one of the busiest railway stations in Bangladesh. A total of 24 service quality attributes have been considered in this study to investigate a wide range of problems and issues faced by railway commuters. In fact, 6 out of the 24 considered factors have never been considered in previous studies. The remaining 18 attributes are summarized in
Table 2, revealing the frequency of their occurrence in previous literature. Six unique factors, namely
Level crossing facility,
Illegal establishments,
Illegal shops,
Floating people,
Arrival performance, and
Departure performance, have never been considered in any of the previous studies. Hence, those factors have not been listed in
Table 2. Moreover, five studies, namely [
29,
35,
40,
42,
43], investigated different factors compared to those investigated in this study, and hence have been omitted from the table. Outside of the 18 factors mentioned in
Table 2, some factors remain that have been considered by previous studies but not considered in this study. Such factors are not listed in
Table 2.
Table 2 reveals that sufficiently large numbers of clearly defined attributes were not investigated using a large enough sample of passengers to draw meaningful conclusions regarding effect of attributes on railway passenger satisfaction in developing countries. This gap will be addressed through this study. Previous studies reveal that most papers considered safety and security-related issues, followed by
Ticket counter staff mentality,
Arrival performance,
Departure performance, and
Sanitation. However, none of the studies considered all 24 factors in a single research article. In fact, four factors, namely
Level crossing facility,
Illegal shop,
Illegal establishment, and
Floating people, have never been considered by any previous studies, and are hence unique to this study. Two additional unique factors, namely
Arrival performance and
Departure performance, have been considered combined in several previous studies. However, the consideration of two factors as a combined attribute does not give an actual picture of passenger satisfaction. In this study, the factor arrival performance measures how closely the train stuck to schedule when arriving
at the station where the concerned passenger is waiting to board the train. Unlike in other studies, this factor does not measure how closely a train stuck to schedule
in transferring the concerned passenger to the destination station. Hence, the arrival performance is a unique factor. The departure performance is also unique in the sense that studies that measure schedule accuracy tend to lump arrival and departure performances together, whereas the factors have been kept separate in this study. Previous studies and news reports have often disparately touched on passenger situations during boarding on trains. To the best of the knowledge of the authors, this is the first study to discuss the plight of passengers holistically during train departure in Bangladesh. Such discussions presented in
Section 4.5 reveal critical conditions in the study area that can lead rail passengers to apprehend the arrival and departure of trains distinctively. Thus, to obtain a true picture of passenger discomfort, arrival and departure performances have been considered separately in this study. In addition, three factors, namely
Road connectivity,
Platform crossing facility, and
E-ticketing, were only considered once in the literature. Thus, this study assesses commuter rail passenger perception over a wide range of issues, some of which are unique to the study area.
Previous studies on railway service quality have used a myriad of techniques including linear and logistic regression models [
33,
37,
41], structural equation models (SEM) [
2,
46,
51,
52], logit models [
31,
45,
53], classification and regression tree approach (CART) [
38], factor analysis [
5], intuitionistic fuzzy group decision model [
32], RASCH measurement model [
42], importance–performance analysis [
33,
41] and cluster analysis [
40]. In this study ordinal logistic regression (OLR) has been used to account for the ordinal and discrete nature of the dependent and independent variables. The advantage of using ordinal measurement is the ease of collation and categorization [
54]. In public transit, OLR has been applied to assess customer satisfaction at airlines [
22], bus services [
55] and trains [
34,
36,
37,
46]. However, most of these have occurred in developed countries, as shown in
Table 1. In fact, it is surprising to note that no developing countries have utilized OLR in assessing commuter rail service quality.
To sum up, the gap in the literature addressed by this study, no other paper in the literature has worked with six unique factors investigated in this study, namely Level crossing facility, Illegal establishments, Illegal shops, Floating people, Arrival performance, and Departure performance. These factors have never been explored in any previous study but may reflect the context of the study area. Besides, no previous study has considered such an extensive number of factors as this study did (24 factors). Moreover, this is the first paper to use and merge several analyses to understand the service quality factors. Within such context, this study aims to contribute to the literature by highlighting six unique factors, namely, Level crossing facility, Illegal establishments, Illegal shops, Floating people, Arrival performance, and Departure performance, which can provide interesting insights to problems faced by countries in similar circumstances as well (especially developing countries). Along the way, this study aims to identify primary railway service quality factors and demographic factors in Bangladesh and develop an empirical relation between overall service quality and service quality factors, which can be used to predict passenger response in future.
3. Study Area and Methodology
3.1. Study Area
To assess passenger perception, data was collected through a questionnaire survey from Joydebpur Railway Station (JRS) in Gazipur district of Dhaka division, Bangladesh. The rationale for selecting this station is that JRS is an intermediate point of major rail routes connecting the north, north-west, and south-west parts of the country, as well as serving as a gateway to Dhaka, the capital of Bangladesh. Additionally, the station serves the momentous role of connecting Bangladesh to its biggest neighbor, India. This has been illustrated in
Figure 1. The station also facilitates the movement of massive numbers of commuters from Gazipur to Dhaka, particularly those who work at Dhaka but live in Gazipur due to low living costs [
1,
14]. Therefore, JRS has immense commercial importance, and hence, authors have selected this station to conduct the present study.
To select the variables for this study, an extensive literature review was performed. Later, a pilot survey on 100 passengers was performed incorporating passengers from different occupations, i.e., students, teachers, shopkeepers, service holders, farmers, guards, railway porters, housewives, garment-workers. To ensure the meticulous preparation of the questionnaire, local transportation experts and people from railway authorities were interviewed. Based on a literature review, expert opinion and passenger perception, the authors developed a list of candidate variables (also known as candidate predictors). These are potential variables that might or might not appear in the final model. Data on candidate variables were collected from survey respondents. A correlation matrix (correlation matrix) was created involving all candidate variables and overall passenger quality (OPS). Variables showing relatively weak correlation with OPS were excluded from the final scrutiny. Thus, the final 24 service quality attributes were selected, and the final questionnaire survey was designed.
The main survey was carried out in three months from 6 August 2019 to 5 November 2019 at the Joydebpur Railway Station (JRS). Under rigorous supervision and direction of a team leader, the survey team comprising five members collected 1057 (one thousand and fifty-seven) responses incorporating all passenger class using this station. Data screening was also performed to eliminate unengaged respondents and outliers, reducing the sample size from 1057 to 1000.
The survey included two parts:
Passenger basic information on demographic factors and travel habits, which have been considered together as demographic attributes. Such attributes include gender, age, occupation, travel frequency, and income level [
2,
27].
Extensive opinion about the rail different service quality attributes and overall passenger satisfaction using five-point Likert scale with categories of very poor, poor, fair, good, and excellent [
3,
13]. The likert scale describes the variations in the subject with a question rather than a statement. A larger scale could offer more choices to respondent on the railway services, but human behavior tends to respond using average categories instead of selecting the extreme values, even when those respondents may actually have extreme views in mind. This is called central tendency bias. Moreover, a scale may be graded so finely that it exceeds the rater’s limited powers of discrimination. This results in difficulties in differentiating among categories that are only slightly different. On the other hand, a small scale may not sufficiently differentiate the categories, although it might be more user-friendly [
56]. This is why this study has chosen a five-point Likert scale. Its usage can also be confirmed in previous studies assessing service quality in the transportation sector (e.g., [
57,
58,
59]).
The above-mentioned data were collected to investigate specific relationships through the conceptual framework outlined in
Figure 2.
The conceptual framework shown in
Figure 2 is developed to establish relationship between (i) demographic attributes and rail overall passenger satisfaction; (ii) service quality attributes and rail overall passenger satisfaction; and (iii) service quality attributes and demographic attributes.
In order to establish these relationships, the following hypotheses are investigated in this study:
H1. Passenger demographic attributes have impact on rail overall passenger satisfaction and service quality attributes.
- 2.
To investigate the significance of rail service quality attributes on the overall passenger satisfaction, Model 2 (M2) uses the following hypothesis:
H2. Individual railway service quality attributes have positive impact on rail overall passenger satisfaction.
More specifically, OLR has been performed using SPSS-v25 to (i) identify significant service quality attributes, and demographic attributes, (ii) develop two separate models to establish the relationships as described above, and (iii) rank them from most significant to least significant. To achieve the study objectives based on these hypotheses, a total of 5 demographic characteristics and 24 service quality attributes were investigated and modeled as per equations outlined in the following section. This paper developed two ordinal logistic regression (OLR) models: the M1 model investigated the impact of demographic attributes of the rail passengers on the rail overall passenger satisfaction, and the M2 model investigated the impact of railway service quality attributes on the rail overall passenger satisfaction. The developed models have been validated using both goodness of fit parameters and through a second response set from 1000 passengers collected at Kamalapur Railway Station, Bangladesh.
To validate the developed models, a second response set from 1000 passengers collected at Kamalapur Railway Station, Bangladesh. Kamalapur Railway Station is considered to be the prime railway station of Bangladesh, and is located at the capital of Bangladesh, Dhaka (Latitude: 23°43′52.1328″ N, Longitude: 90°25′34.7376″ E). The rationale for selecting this station for data validation purpose is that it has the maximum number of commuter passengers, and it would be more appropriate to obtain the perceptions of passengers from different stations other than JRS. Hence, Kamalapur Railway Station is the best candidate among all the stations of Bangladesh (Bangladesh Railway, 2018). Using the same questionnaire survey as used in our primary study area (Joydebpur Railway Station), only commuters were surveyed from the Kamalapur Railway Station. In total, 1022 responses were collected from 5 November to 31 December 2020, and after data screening through rigorous checking, a final set of 1000 responses was chosen for validation purposes.
Finally, to assess the relative effect of each attribute on OPS, attribute ranking was performed using Pearson chi-square (χ2) test, and a correlation matrix was shown to apprehend the interaction effects. The study concludes by discussing the policy implications based on the study outcomes.
3.2. Model Specification
The ordinal logistic regression (OLR) is a maximum likelihood estimation base method, which is generally known as the proportional odds model (POM). In an OLR model, the outcome variable has more than two levels [
60]. The OLR model generally estimates the set of independent variables using both numerical and categorical responses, based on the logarithm of the probability where the dependent variables are assuming low values instead of high values [
61]. The POM was proposed by McCullagh [
62] for OLR and is based on the cumulative distribution function:
where,
j: set of ordinal values, i.e., 1, 2, 3,……j − 1.
: cumulative probability for the jth DV category.
: threshold for the jth DV category.
to : regression coefficient of independent variables (IV).
to : IVs.
: number of IVs.
: error term.
Taking the antilog on both side of Equation (1), the prediction of the probability of the occurrence of interested outcome can be written as Equation (2) or (3):
Furthermore, the odds and the odds ratio (OR) can be estimated using the following Equations (4) and (5), which enables the proportional in the odd resulting from a unit change in the predictor (i.e., one unit score change in X).
Moreover, to access the significant level of model estimated coefficient (threshold (
) and predictor (
) and their associated standard error (SEs) of variables, the Wald
statistics based on the
z statistics was constructed, following Equations (6) and (7):
3.3. Goodness of Fit
To measure the OLR mode results, several statistical criterial were followed, such as log-likelihood, pearson chi-square, and pseudo R square (cox and snell R square, and negelkerge R square).
Loglikelihood ratio test: Loglikelihood is a measure of how well all of the independent variables affect the outcome or dependent variable. This can be assessed by comparing the fit of null model and given model. The likelihood of the null model is the likelihood of the observation if the independent variables had no effect on the outcome. The likelihood of the given model is the likelihood of obtaining the observations with all independent variables incorporated in the model. The difference of this two a goodness of fit index LL,
statistics with k degree of freedom [
63,
64]. The equation can be written as follows.
Chi-square test (): With ordinal logistic regression, instead of
as the statistics of the overall fit of linear model deviance between observed values from the expected values is used. Chi-square test can be based on the residual
where the standard deviation of the residual is
[
63,
64].
Pseudotest: To measure the strength of association between the selected set of IVs and the DV, pseudo
measures Cox and Snell R square, and Nagelkerke R square using Equations (12) and (13), respectively [
63,
64].
where
is the log-likelihood function for the model with the estimated parameters,
is the log-likelihood with just the thresholds, and
n is the number of cases (sum of the weights).
4. Data Analyses and Interpretations
4.1. Demographic Characteristics of the Respondents
Table 3 displays demographic characteristics of the respondents in both absolute and relative terms at Joydebpur Railway Station (main study) and Kamalapur Railway Station (validation study). Moreover, where possible, data from the latest published national census (2011) have been added for comparison [
65]. In this table, all demographic characteristics are treated as categorical variables. For example,
Travel frequency has been categorized to differentiate among frequent and non-frequent travelers.
Income level has been categorized according to the national pay scale. The reliability of the data pertaining to the 1000 respondents has been confirmed in Joydebpur and Kamalpur by Cronbach’s alpha value of 0.974 and 0.821, respectively [
66].
Table 3 shows that male respondents slightly outnumber female respondents, which is consistent across all three respondent distributions. Moreover, the respondent percentage is reduced drastically with each successive age group in all three surveys. The ten-year gap between the 2011 census and this study may be responsible for the slight changes in population parameters. Moreover, information about
Occupation and
Income level are presented in the census in a format different from the sub-categories outlined in this study. Besides, the census does not contain information about train
Travel frequency [
65]. Hence, information about
Occupation,
Travel frequency and
Income level are not presented in the census for comparison. Nevertheless, the fact that age and gender proportions in the main and validation studies are similar to census proportions may indicate that the respondents surveyed at Joydebpur and Kamalapur railway stations are representative of the population of Bangladesh.
Table 3 shows that most respondents are male and are dominated by the age group of 18 to 30 years in both surveys of the study. However, the differences start to widen for other demographic attributes. For example, the respondent distribution is heavily skewed towards service holders in Joydebpur but involves a greater proportion of students in Kamalapur. Nevertheless, the combined proportions of service holders, businessmen and students are similar for both sites (77.9% in Joydebpur and 81.1% in Kamalapur). This implies that a high percentage of passengers are job holders or students who regularly use these commuter trains, and who also make up the bulk of commuters in any country.
Income level distribution is similar for both stations. Comparatively lower income groups use the stations for their travel purpose. Uneven distribution of the income group of respondents may imply that existing facilities fail to attract all of income groups equally. It can be inferred that solvent people prefer not to travel by rail. Interview with some solvent people traveling by rail revealed their preference to use private vehicles since train services or other public transport modes are not as per their desired level. In contrast with
Income level distribution, travel frequencies vary widely among respondents of both stations, with more people identifying with both extremes of this category at Kamalapur Railway Station. Nevertheless, considering the overall situation, respondents in both stations have similar characteristics, which supports the use of Kamalapur Railway Station to validate results obtained from Joydebpur Railway Station.
4.2. OPS Response Analyses
An overall rating of the service quality based on passengers’ perception reveals that responses have been categorized into five distinct groups of ratings using a five-point Likert scale. The five rating groups along with the percentage of response obtained in each group are mentioned as follows: very poor (24%), poor (32%), fair (21%), good (13%) and excellent (10%). In this study, very poor indicates the worst rating, while excellent indicates the best rating. The distribution of passenger ratings reveals that out of a thousand respondents, a large portion (56%) rated the facilities as very poor or poor, while only 10% of respondents rated facilities as excellent. This is an indicator of passenger dissatisfaction over rail station facilities. The contributing factors behind this dissatisfaction were identified based on their significance of overall passenger satisfaction.
4.3. Model Estimation
This section presents the estimation results of models in measuring overall passenger satisfaction (OPS) with railway service quality attributes, and with passenger demographic attributes. Model estimations are performed by OLR using SPSS-v25. The dependent variable is based on the respondent’s perception of OPS from 1 as “very poor” to 5 as “excellent”. In order to test the goodness of the models, four fitness parameters were calculated, which show that the model results are highly reliable.
4.4. Model 1 (M1)
Model 1 (M1) investigates the effect of passenger demographic characteristics attributes on the overall passenger satisfaction, where the considered factors are Gender (Y1), Age (Y2), Occupation (Y3), Travel frequency (Y4), and Income level (Y5). Model 1 (M1) deals with categorical data (Gender and Occupation). Hence, M1 has been developed using proportional odds model, where each subcategory has been compared with a reference sub-category. Multi-collinearity test using Spearman correlation revealed medium to weak correlation among the demographic attributes, as shown in
Figure 3 [
67,
68]. Hence, all demographic attributes were considered as independent variables in M1.
Figure 3 reveals moderate correlation in
Age-Occupation,
Age-Travel Frequency,
Occupation-Travel Frequency, and
Travel Frequency-Income Level.From
Table 4, it can be inferred that
Age,
Occupation, and
Travel frequency have significant impact on OPS with 95% confidence level. The standard for
p-value at 95% confidence level is less than 0.05, which indicates that the variable is statistically significant [
9,
27].
Table 4 shows that estimates for sub-categories in
Gender,
Age and
Travel frequency are negative. This indicates that older people are associated with lower OPS; hence, passengers of older age groups are more dissatisfied with the facilities. Similarly, passengers with higher travel frequencies are more dissatisfied with existing facilities, and hence they rated lower OPS. The estimate for all categories of
Occupation is positive, indicating that all occupational categories gave higher ratings to OPS compared to other occupations. Again, subcategories in
Gender and
Income Level have
p-values greater than 0.05. Hence, the
Gender and
Income level are not statistically significant for OPS rating, which indicates that OPS is independent of Gender and Income level.
In
Table 4, the odds ratio (OR) indicates the odds of improving opinion on OPS by one point along the five-point Likert scale when moving from the reference sub-category to another sub-category. For example, the OR for
Service-holder subcategory under
Occupation is 1.667, which is greater than 1. This indicates that compared to the reference category, (others occupation) service-holders are 1.667 times more likely to give a unit higher rating in OPS (along the ordinal scale) than give a unit lower rating. Using the same analogy, compared to the reference category, (others occupation) students are 2.212 times more likely to give a unit higher rating in OPS (along the ordinal scale) than give a unit lower rating. Thus,
Table 4 reveals that among all the considered occupations, students are the most likely to give high OPS ratings while “other” occupations are the least likely to give high OPS ratings.
Interestingly, OR for all subcategories of
Income level and
Gender hover around 1.00, indicating negligible difference among those subcategories for OPS ratings.
Gender,
Age and
Income level have revealed negative standardized coefficients. For example, people using trains only one to four times per week are 0.856 times more likely to give a a unit higher rating in OPS (along the ordinal scale) than give a unit lower rating, compared people traveling more than 20 times per week. This means that respondents traveling one to four times per week are 14.4% less likely to give a unit higher rating in OPS (along the ordinal scale) than give a unit lower rating, when compared to respondents traveling more than 20 times per week. A general trend noticed here is that more frequent travelers are less likely to give high OPS ratings. No such trend is observed in
Age category. These are discussed in greater detail in
Section 4.5.3.
The suitability of model M1 is assessed, respectively, by the following goodness of fit indicators: −2 log-likelihood, Pearson chi-square, Cox and Snell R square, and Negelkerge R square. The R square values indicate reliability of the model, where greater R square value indicates good correlation between the data [
69]. However, as argued by some researchers, low R Square values in logistic regression are the norm and thus this indicator is not recommended as a measure of model goodness [
62,
70]. Nevertheless, the Cox and Snell R square values and Negelkerge R square values indicate that models M1 has been reliably fit to the given data.
4.5. Model 2 (M2)
Model 2 (M2) investigates the significance of railway service quality attributes on the rail overall passenger satisfaction.
Table 5 displays descriptive statistics of the 24 railway service quality attributes. Attribute mean and standard deviation (SD) range between 1.671 and 3.157 and between 0.767 and 1.145, respectively, indicating that the data are well spread. All the attributes are rated on a five-point Likert scale with 1 being “very poor” and 5 being “excellent”. Cronbach’s alpha value (0.875) indicates the reliability of the questionnaire [
71], and reliability and authenticity of passenger responses. The subsequent discussion in this section has been enriched with unique and non-unique factors, who have been discussed separately. Nevertheless, these discussions are further complemented by
Section 4.8.
4.5.1. Non-Unique Factors
This study investigates 18 factors that have appeared in previous investigations.
Vehicle parking facilities provide parking for private cars, para-transit vehicles (e.g., tempo), ride-hailing vehicles (e,g, rickshaw, CNG) [
8]. Although it was not strictly asked, the low income of the majority of the respondents reveal that they are not expected to own cars. However, a considerable number of people still use para-transit vehicles and ride-hailing vehicles to get around Gazipur [
72]. These vehicles use unoccupied parking spots to drop off passengers in stations and wait to pick up potential passengers from stations to their final destination, essentially working as feeder vehicles for Joydepbur Railway Station. Without the parking space, respondents may have to get off their vehicle at a further place and walk to the station. Hence, the presence of parking facilities can quicken the journey between the station and the initial/final place. A foot overpass can be used to traverse among various rail platforms. However, people in Bangladesh are generally averse to using foot overpasses and underpasses partly because of poor condition of such grade-separation structures, and partly because of the physical exertion and extra time spent in traversing grade-separation structures instead of traversing at-grade [
73,
74]. Thus, this study attempts to understand how well overpasses serve passengers. Waiting room facilities are designed to be used by passengers before train arrival. However, previous reports reveal Bangladeshi rail station waiting rooms to be unclean with limited seat capacity [
75,
76]. The situation of train tickets has already been discussed in
Section 2. Rahaman and Rahaman (2009) found that there were no assigned staff or help points to provide information in some stations. Staff in the ticketing room did not talk much about anything except selling tickets. However, a few stations had display boards and screens, although they provided limited information such as train fare and schedule [
75]. In
Table 5,
Female safety ratings were filled up by both males and females. When filled up by males, respondents rated how they perceived females would feel regarding security. Such ratings were based on a female who had previously ridden a train and was personally known to the male respondent.
4.5.2. Unique Factors
As mentioned in the literature review, this study includes six factors that have not been previously considered in other studies, including
Level crossing facility,
Illegal establishment,
Illegal shop,
Floating people,
Arrival performance and
Departure performance. The presence of at-grade rail line has necessitated a level crossing facility adjacent to the investigated railway station. The frequent ringing of level crossing bells annoys people waiting for trains at the station. Additionally, level crossings delays both trains and motor vehicles, for which commuters may be delayed more than once during their overall journey from home to work. Moreover, many people returning to Joydebpur station by train on their trip from work to home jump from trains that are stuck at the level crossing. The intention of such people is to reach home early, which they feel can be done while bypassing the congestion at level crossing. Relaxed safety measures make this possible because of loosely bolted train doors and collaborative train staff willing to release passengers early. This can affect the safety of the passengers, who may be tired after finishing their day jobs. To a large extent, the level crossing affects the level of service of the roads connected with stations, as commuters may be delayed in the following instances: (i) on the road from home to the station, (ii) on the train from station near home to the station near office, (iii) on the train from station near office to the station near home, and (iv) on the road from the station to home. The only study we could find about road connectivity was performed by Cavana and Corbett [
39], which included road connectivity in New Zealand, a developed country. However, road user behavior is different in Bangladesh, where it may take several attempts to lower the level crossing. This is because of the constant movement of pedestrians, motorcycles and rickshaws (a type of local non-motorized vehicle) defying the level crossing barrier while trying to reach their destination. This causes trains to wait longer at level crossings before they are allowed to proceed [
17].
There are hardly any government-approved shops inside the station. As per
Table 5, a few illegal establishments have been set up without the permission of the authority, but are backed by local political influential people. Such shops do not have to pay formal rent to the government, but have to provide security money to influential people. Often, these shops are built on railway authority’s land grabbed illegally by local influential people. Although there have been several drives by the Railway Authority to try to evict these shops, such measures have failed to have a lasting impact in the face of unscrupulous politicians and corrupt governmental officials. On the other hand, the shopkeepers themselves are too poor to afford to close down shops for several days, and they are not provided with alternative places to peddle their trade. Hence, under the protection of local influential people, these shopkeepers are able to set up their shops again soon after eviction drives end [
12,
13,
76,
77]. Hence, the presence of illegal establishments is a significant and perpetual phenomenon in railway stations in Bangladesh. These shops mainly sell food items and do not face much competition from outside sources except hawkers. Since passengers are forced to buy from such shops, the shops do not face any pressure or incentive to improve their service standards. Thus, such shops try to cut costs and maximize profits, leading to reduced safety, hygiene and service standards. For example, the food preparation in several food courts at the station does not follow hygiene standards. Additionally, to reduce costs, they do not keep basic furniture such as chairs and tables to serve customers. So, such passengers usually eat at platforms and waiting rooms while waiting for their train [
78].
In addition to the illegal shops in fixed locations, hawkers (floating shops) ply their trade inside stations, selling a variety of products ranging from kitchen utensils to toys and food. Although people can buy non-food items from hawkers at a lower price compared to those obtained from regular shops, the quality of the goods is questionable. Hawkers can afford to sell at low prices because they do not have to pay rent and because such goods are often smuggled from abroad while bypassing tariffs and other taxes [
79]. On the other hand, hawkers selling refreshments may charge high prices, since they only face competition from illegal shops. Conversations revealed that survey respondents think some hawkers collude with the shops to drive up prices. Some hawkers have also been linked to illegal drug peddling and ticket scalping, which damage the overall image and environment of the station and promote crimes. Hawkers have also been reported to occupy railway lines or the place beside railway lines, which can interrupt train services and cause accidents [
78]. Although these provide enough grounds for the railway authority to evict hawkers or at least ensure compliance from hawkers with ethical business standards, the authority does not seem to have a lasting/significant impact on hawkers. This is because hawkers have been reported to be under the protection of local politicians, who protect hawkers in exchange for “protection” money [
80]. Thus, the presence of hawkers is a significant and perpetual phenomenon in railway stations in Bangladesh.
Since Dhaka is the capital of Bangladesh and offers the greatest number of job opportunities and a dream for leading a better livelihood, it attracts people from all over the country. However, high living expenses in the city force many people to live in streets and slums [
17]. Consequently, many homeless people live in stations and sleep on the chairs designated for waiting passengers in platforms. The homeless population in Bangladesh is known to face extortion, erratic unemployment, exposure to violence, and sexual harassment and to engage in high-risk behaviors (such as drug abuse). Consequently, they not only act as visual disturbance for passers-by (passengers in stations), but can also engage in criminal activities to ensure their survival [
81]. Additionally, beggars harass people for alms, which can delay passengers when boarding trains. The majority of the inhabitants in Bangladesh follow Islam, where the religion encourages to help the people who are really poor and needy. While helping the poor is a universal attribute, it is religiously ingrained in the mindsets of many Bangladeshi people. On the other hand, poverty in Bangladesh may force many people into beggary. However, many such people beg just to sustain themselves instead of focusing on overcoming the poverty barrier. The situation is exacerbated by the presence of beggary syndicates who ensure a continuous supply of child beggars for their vested economic benefits. Thus, beggary is not only a significant social phenomenon but also a perpetual one in this country [
82,
83]
As mentioned in
Section 2,
Arrival performance and
Departure performance have been considered separately in this study. Observations in the study areas have revealed that people perceive that the trains will not arrive at the station at the scheduled time. In spite of this, people tend to arrive at the station early to wait for the trains, in case any trains do come early/in time. When waiting for the train to arrive, people can do other activities such as eating, reading newspapers, etc. Once the trains do arrive, people tend to fill up the compartments as fast as possible. The boarding rush occurs because of the unpredictable nature of train delays. In some cases, delayed trains trying to make up for lost time may dwell in a station less than the designated time, which may hurry the passengers. In other cases, people try to fill up seats as soon as possible because they are not sure when the next train will arrive at the station.
Steep stairs on trains create discomfort and slow down people (especially the elderly) trying to board trains hurriedly, creating chances for injuries and accidents. The platform–train interface (PTI) presents a number of potential hazards for station users, which can be exacerbated by their own behavior such as rushing [
84]. Although such non-collision injuries have not been studied in Bangladesh, they have been investigated in both developed and developing countries such as the United Kingdom [
84,
85], Austria, Germany, USA, Chile, Mexico, Thailand, and so on [
86,
87]. An exhaustive list of studies involving PTI incidents are explored in Poirier et al. (2021) [
88]. It is alarming to find that boarding and alighting accounted for 6.3% of total UK passenger injuries in the 2019–2020 period [
89]. Considering that both the railway infrastructure and crowd behavior are worse in Bangladesh than in the UK, PTI accidents can be expected to be higher in Bangladesh [
87]. In fact, Bangladeshis have been reported to climb on to rooftops while starting from ground level [
13,
88,
89].
Even after people manage to find a seat on the train, they are extremely uncertain of when the trains will actually leave. This is mainly because of the presence of only a single railway line entering and leaving the station [
18]. Rail sections should have at least two parallel lines to ensure lines are not clogged up by trains waiting to move in either direction. The solitary railway line entering Joydepbur Railway Station (study area) splits into three lines to accommodate trains bypassing the station, before joining again into a solitary line when leaving the station. This problem is especially critical considering the railway line from Joydebpur Railway Station, Gazipur to Kamalapur Railway Station, Dhaka, which is the main route accommodating commuter flow. There are several intermediate rail stations between Dhaka and Gazipur, among which the station of interest is Tongi Rail Station. Currently, there are two parallel lines running between Dhaka and Tongi, but only one line running between Tongi and Gazipur. Thus, from the point of view of the commuters, the railway stations suffering from schedule conflicts caused by the solitary railway line are located in Tongi, Dhirashram (intermediate station between Tongi and Gazipur) and Gazipur. In this regard, such conflicts are usually resolved on an ad hoc basis by the Centralized Traffic Control located in Dhaka (capital of Bangladesh). The problem is compounded by the lack of direct railway lines connecting the central Bangladesh (Dhaka) with the southern parts. Hence, many trains going to southern Bangladesh pass through this railway line (shown in
Figure 1), further aggravating the conflict management. Consequently, even the station master in Joydebpur Railway Station cannot predict beforehand when trains will be allowed to depart from the station. A natural ramification of the presence of a solitary line is that no train can travel from Gazipur to Tongi when a train is coming from the opposite direction. The route length from Gazipur to Tongi is 9 km long [
18]. JICA (2010) states that it can take trains 145 min to travel 34 km from Dhaka to Joydebpur, which roughly translates to 14 km/h operational speed. Assuming this speed to remain the same over the Tongi to Joydebpur railway line, it would take roughly 40 min for a train to travel from Tongi to Gazipur over the 9 km rail tract. The reason for the slow operational speeds of the trains can be attributed to speed restrictions, absence of access control walls, old signaling system, numerous rail-road crossings (many unauthorized) on the road, and rolling stock inappropriate for commuter trains. The absence of access control walls has enabled kitchen markets and households to be set up beside the railway line, which encourages dangerous pedestrian movement along the line [
18]. Although the solitary railway line affects both arrival and departure performance, the effect is unequal because people can engage in a variety of activities while waiting for trains to come to the station. However, such activities become limited to only waiting for the train to reach the destination once people embark the train, which can create psychological pressure on the passengers. Additionally, the haphazard/desperate behavior of passengers is more applicable during train departure than during train arrival, creating more chances of non-collision accidents and injuries. Thus, if arrival and departure performance were considered together as a single variable, the true picture of passenger discomfort would not have surfaced. It would not have been possible to differentiate these two cases separately and identify which particular case is causing this discomfort. The fact that passengers can give different ratings to these two cases would have been ignored. It is thus proposed to the relevant authority to consider these two cases separately.
4.5.3. Effect of Demographic Attributes on Individual Service Quality Attributes
To assess the effect of demographic attributes on individual service quality attributes, the average rating provided by each sub-group of demographic attributes has been presented in
Table 6. The mean rating for all service quality attributes provided by each of the subcategories are presented at the bottom of
Table 6. Additionally, the minimum and maximum average rating provided by each sub-category are placed in bold. According to
Table 6, as the age of respondents increased, their mean rating decreased. The same trend is seen for travel frequency and income levels. Thus, people aged over 50, traveling more than 20 times per month over trains, and earning more than BDT 40,000 per month gave the most pessimistic view on the service quality attributes. As the travel frequency of the respondents increased, the mean rating decreased. Thus, people traveling more than 20 times per month by train had the most pessimistic view on the service quality attributes.
Since richer people have more travel alternatives, including private cars, they tend to have higher expectations from trains. Hence, people with higher incomes gave lower ratings to people. Usually, commuter trains are crammed with passengers, reducing ventilation inside the train. Shoving and jostling often occurs in trains when passengers are moving inside. Because of limited seat availability inside trains, many passengers have to travel the entire journey while standing. Moreover, during train arrival and departure, embarkation and disembarkation rushes over steep stairs are common. Compared to old people, younger passengers are more habituated with such physically demanding procedures [
90]. Most of the young people are students and traveling to college or universities as a group. Such people are more inclined than older passengers to converse with their group members to pass the journey time. People who travel infrequently usually have more choices regarding which trains to travel on. Hence, they evaluate such information, including train schedules, to minimize waiting times in station and maximize comfort, speed and safety in trains. Thus, infrequent passengers do not use platform facilities much, but are usually influenced by the good trains they ride smoothly in. Thus, they usually give higher ratings to such facilities. On the other hand, frequent travelers do not usually have much choice in traveling using a variety of trains. Such people have been described in the literature as captive riders. This group of passengers may have to be satisfied with whatever options are available at that moment, which may not be good. Additionally, trains may not be available at the exact time when such frequent passengers want to travel. Thus, such passengers have to wait longer times at stations. Moreover, the trains they are riding on may stop frequently in many stations, which may increase the journey time of the passengers. These may induce the frequent passengers to give poor ratings, which has also been observed in previous literature [
90,
91].
According to
Table 6, on average, females gave lower mean ratings than males did. The physically demanding practices inside trains are more suited towards males than females. Moreover, an important consideration to females is female safety, which is confirmed by the lowest rating provided by females to
Female safety. Females are unnecessarily touched in crowded trains. Moreover, as they are shorter than males, females face more discomfort when boarding or alighting stairs in trains from or to very low-level platforms [
92]. Such actions are exacerbated during menstruation [
93,
94]. However, even after this, females are forced to use trains because the alternate mode, buses, takes longer.
With respect to occupation, people in the “Others” category gave the lowest mean rating, while service holders gave the highest mean rating. One of the lowest mean ratings (1.91) was given by housewives. In addition to the problems faced by women mentioned above, housewives felt unaccustomed to train travel. Such people usually live in the comfort of their homes and rarely travel large distances. Service holders and businessmen gave the highest mean ratings because they compared rail service facilities with those of alternate modes, namely buses. Such people rate rail facilities higher than they rate bus facilities.
Most subcategories gave their highest ratings to Announcement performance, followed by Food and soft drinks. Since passengers prefer to get accurate information regarding train arrival and departure, they rely heavily on announcement facilities in the station. Moreover, some voluntary organizations have been observed to give supplementary announcements to ensure people do not miss their trains. On the other hand, most subcategories gave their lowest ratings to Floating people, followed by Level crossing facility. These floating people are beggars and other homeless people who disturb and passengers for alms. As mentioned previously in the Introduction, level crossings create traffic congestion, delaying both trains and motor vehicles. It is thus a major source of discomfort for passenger attributes.
4.5.4. Model 2 Results
To investigate impacts of railway service quality attributes on overall passenger satisfaction (OPS), M2 considers OPS as the dependent variable and the 24 service quality attributes as independent variables. The attributes were first checked for multi-collinearity using Spearman correlation. This revealed medium to weak correlation among the demographic attributes, as shown in
Figure 4 [
67,
68]. Hence, all demographic attributes were considered as independent variables in M2. Independent of the previous argument, an attempt has also been made to identify meaningful correlations within various sub-groups of attributes, namely,
Station Facilities,
Ticketing Facilities,
Illegal Infrastructure,
Illegal People,
Train Information Facilities, and
Passenger Safety. The sub-groups are highlighted by red boxes in
Figure 4. From the correlation matrix of
Station Facilities shown in
Figure 4, moderate correlation has been observed in
Level crossing facility-Road connectivity,
Level crossing facility-Food and soft drinks,
Road connectivity- Food and soft drinks,
Car parking facilities-Sanitation,
Car parking facilities-Waiting room facility, and
Sanitation-Food and soft drinks. The correlation matrix of
Illegal Infrastructure shows moderate positive correlation between illegal establishment and illegal shops. This means people who gave high ratings on illegal establishments also gave similar ratings to illegal shops. A correlation matrix of passenger safety shows moderate positive correlation between
Female safety and
Pickpocketing activity. Thus, improvement in one factor can be expected to improve the other factor in the correlation pair. Weak correlation has been observed in the remaining pairs. These correlation pairs are used as one of the deciding criteria for focusing on particular service quality attributes, which will be discussed again in
Section 4.8.
The model results are shown in
Table 7. From
Table 7, it can be inferred that road connectivity (X
2), car (vehicle) parking facilities (X
3), sanitation (X
4), platform crossing facility (X
5), waiting room facility (X
6), food and soft drinks (X
7), ticket counter staff mentality (X
9), ticket price (X
10), E -ticketing (X
13), porter behavior (X
17), information scope (X
18), announcement performance (X
20), and departure performance (X
22) have a significant impact on OPS with 95% confidence level. Odds ratio (OR) indicates the odds of improving opinion on OPS by one point along the five-point Likert scale for unit change of rail service quality attribute. From the significant factors identified previously, only food and soft drinks (X
7) and porter behavior (X
17) have OR greater than 1. If those two facilities are improved, the odd of improving perception of OPS by one ordinal scale will be 1.35 and 1.21, respectively. ORs for the remaining identified factors are less than 1, indicating that improving these facilities will have a higher chance of reducing OPS. For example, OR for road connectivity is 0.857. Hence, there is a 14.3% less probability of increasing OPS by one ordinal scale when the rating for road connectivity is increased. Out of these thirteen significant factors, five factors, namely ticket price, E -ticketing, announcement performance, departure performance, and platform crossing facility received average rating of 3 (Fair). On the other hand, the remaining eight factors, namely road connectivity, ticket counter staff mentality, food and soft drinks, porter behavior, information scope, sanitation, car parking facilities, and waiting room facility received average rating of 2 (Poor). Hence, these eight factors should be given priority to improve OPS. The remaining eleven attributes were not found to be statistically significant in measuring OPS at 95% confidence level, implying that passengers perceive factors such as level crossing facility, illegal shopping, illegal establishments, floating people, pickpocketing activities, etc., to be nonsignificant.
Table 7 also shows the univariate Wald statistic, which has been calculated in SPSS using formula provided in [
94]. The Wald statistic portrays how far the ratings have deviated from the mean of normally distributed ratings. In this study, if the ratings were normally distributed, each attribute would have a mean rating of 3. As shown in
Table 7, the suitability of model M2 is assessed, respectively, by the following goodness of fit indicators: −2 log-likelihood, Pearson chi-square, Cox and Snell R square, and Nagelkerke R square. The R square values indicate reliability of the model, where greater R square value indicates good correlation between the data [
67]. However, as argued by some researchers, low R Square values in logistic regression are the norm and thus this indicator is not recommended as a measure of model goodness [
62,
70]. Nevertheless, the Cox and Snell R square values and Negelkerge R square values indicate that models M2 has been reliably fit to the given data.
4.6. Model Validation
The suitability of our two models M1 and M2 are assessed by both goodness of fit parameters and through data collected in a second railway station. The goodness of fit parameters have been discussed in
Section 4.4 and
Section 4.5. Hence, only the results used to validate the developed models are described below. The obtained models M1 and M2 were used to predict OPS based on demographic attributes, and service quality attributes obtained from 1000 response sets at Kamalapur Railway Station, Dhaka, Bangladesh. Kamalapur Railway Station is the largest station in the country, accommodating a variety of rail passengers. Many commuters use trains to come to Dhaka through Kamalapur Railway Station. Using the same questionnaire survey as used in our primary study area (Joydebpur Railway Station), only commuters were surveyed from 5 November to 31 December 2020 to produce 1022 response sets. Data screening and elimination of unengaged respondents created 1000 response sets. Models M1 and M2 have been validated using confusion matrices presented in
Figure 5. The confusion matrix shows the one-to-one matching between predicted classes (1–5) and observed classes (1–5). The OPS values obtained from survey in Kamalapur Railway Station are treated as observed values in
Figure 5, while OPS values predicted using models M1 and M2 are treated as predicted values. The demographic characteristics of the respondents and the chosen opinions (classes) on individual service quality attributes were used to predict OPS using models M1 and M2, respectively. These predicted values were then matched against observed OPS for that particular respondent.
The diagonal green boxes illustrate the amounts and percentages that are identical in both observed and corresponding predicted classes. The red boxes explain the amounts of misclassification. The blue box at the bottom-right corner shows the total correct classifications (green) and misclassifications (red) in percentages. Here, the top value in the blue box represents accuracy, which is calculated as the ratio of the number of correct classifications to the total number of classifications. From
Figure 5, models M1 and M2 have overall accuracy of 66.30% and 64%, respectively. This means that M1 and M2 were able to correctly predict OPS in 66.30% and 64% cases, respectively. Values in the rightmost column (white boxes) represent the true positive rate (top value) and false positivity rate (lower value). The true positive rate (also known as recall or sensitivity) is a measure of the accuracy relative to the observation of a specific class. It is calculated as the ratio of the true positives of a specific class to the sum of its true positives and false negatives. For example, when observing class 1 in Model 1, 35% of the observations were correctly predicted, while the remaining 65% observations were paired against incorrect predictions. Values in the bottom column (white boxes) represent the precision (top value). Precision is a measure of the accuracy relative to the prediction of a specific class. It is calculated as the ratio of the true positives to the sum of the true positives and false positives. For example, when predicting class 1 in Model 1, 36.84% of the predictions were correct, while the remaining 63.16% of the predictions were incorrect.
Figure 5 reveals that the two models M1 and M2 do not have much difference in accuracy. Although very few studies have used confusion matrices in evaluating rail passenger satisfaction, Hadiuzzaman et al. [
27] used confusion matrices to validate two models produced by ANFIS, where the study achieved 54.1% and 60.2% accuracy, respectively, in forecasting. So, the models in our study perform better than those used in Hadiuzzaman et al.
4.7. Attribute Ranking
To assess the relative effect of each attribute on OPS, Pearson chi-square (
χ2) test has been performed using SPSS-v25 considering each of the twenty-four factors’ relation with OPS, as shown in
Table 8. Attribute rankings can give an idea to policymakers about the extent to which factors are related to OPS, as perceived by passengers. This can partially justify the need to focus on such factors to improve service quality. Although given in
Table 8 for comparison, ranks obtained using standardized coefficients are not considered valid in this study because some of the factors with high standardized coefficients have been found to be insignificant in the obtained models of this study (e.g.,
Female safety,
Ticket collection line), whereas some factors having poor ranks from the viewpoint of standardized coefficients have been found to be significant in this study (e.g.,
Information scope,
Ticket price,
Ticket counter staff mentality). On the other hand, all significant factors are ranked strongly, and insignificant factors are ranked poorly in a Chi-square test. This is confirmed by significant factors having
p-values < 0.05 (highlighted in bold) in
Table 8. This is why chi-square test rankings have been used in this study. Pearson Chi-square test indicates how independent factors are related to a dependent variable [
95,
96]. The rank is obtained by taking OPS as the dependent variable and all the service quality attributes separately as independent variables. Here, rank 1 and rank 24 indicate greatest and smallest correlation between respective attribute and OPS.
Table 8 reveals that Pearson Chi-square value ranged from 46.93 (Rank 1,
Food and soft drinks) to 2.32 (Rank 24,
Floating people). The rank represents the relationship strength between a factor and OPS as perceived by respondents. Thus, the factor ranked first is perceived by respondents to have the strongest relationship with OPS. Hence,
Food and soft drinks could be vital to improving overall passenger satisfaction, while floating people might hardly impact OPS. Insignificant factors are those which passengers were not bothered about. The most significant attributes should be given priority to improve passenger satisfaction. After
Food and drinks, the next four most important attributes have been found to be
Departure performance,
Waiting room facility,
E-ticketing, and
Porter behavior. In the waiting room facility, commuters have been observed to eat while waiting for their trains to come. Thus, adequate provisions for chairs and tables in the waiting room may benefit them. It has been observed that adjacent food courts have very limited seats. Thus, commuters are forced to take their food while keeping one eye on train arrivals. Moreover, as they are in a hurry, they prefer to purchase tickets online instead of waiting in line. A considerable portion of the commuters are businessmen who carry heavy luggage containing goods to be sold in Dhaka city (work destination). Such people include those from the informal sector such as hawkers selling plastic wares, food, kitchen utensils, clothes, etc. Thus, they rely on porters to carry goods to and from trains.
4.8. Policy Implications and Discussion
In general, the respondents in the sample rate service quality poorly. A holistic view of the respondents regarding the studied attributes is presented in
Table 9, showing the summary of the results. According to
Table 9, the relevant authority needs to give priority to demographic factors based on whether or not it significantly affects OPS. Hence, authority needs to focus on age, occupation and travel frequency. As per
Table 8, majority age groups gave the lowest ratings to Female safety and Train ticket sufficiency. On the other hand, the majority of the occupations gave the lowest rating to floating people.
According to
Table 9, the relevant authority needs to give priority to service quality factors based on four criteria: (i) significance from OLR model, (ii) attribute ranking, (iii) number of pairs associated with moderate positive correlation, and (iv) rating severity. In short, the attribute factors that need to be prioritized are those that have been found to be significant from OLR model, be ranked near the top, be correlated with large number of attributes, and have poor rating. Since none of the service quality attribute pairs showed large positive correlations, the study is prioritizing attributes showing moderate correlations now. A factor associated with a large number of pairs of moderate correlation implies that an improvement in one factor is associated with a moderate chance of improvement in many related factors.
The above-mentioned conditions are met by Food and drinks, Road connectivity, Sanitation and Waiting room facility. Thus, the rail authority should increase quality and variety of food while keeping food prices affordable. This is because many commuters come to the station early in the morning and have their breakfast while waiting in the waiting room for trains to come. From attribute rankings, people gave the most importance to Food and drinks, implying that an improvement in Food and drinks will cause the largest improvement in OPS rating. As discussed in Model 2 Estimation, Level crossing facility and Road connectivity have received poor ratings because of traffic congestion, where people spend a significant amount of time unproductively. If basic furniture (chairs and tables) and the range of food products offered was increased, it may encourage more people to have proper meals while waiting for trains. Conversation with survey respondents revealed that currently many people have to start early from their homes without getting the chance to eat a proper breakfast in order to beat the morning rush hour. Thus, traffic congestion on roads prevents them from enjoying a proper breakfast. Moreover, these people are traveling a considerable amount of time in both trains and non-train modes before reaching their workplace without getting enough energy from food. This can reduce their productivity for the rest of the day. This could be a reason for the people to give low ratings on Level crossing facility and Road connectivity. Thus, the relevant authority needs to ensure the food courts offer seating facilities for customers. Although one restaurant legally occupies space in the station, it is currently too small to serve all passengers adequately. It is thus advisable to expand the restaurant floor space, or legalize the illegal food courts and regulate those shops to serve customers better.
Moreover, as mentioned previously, incessant traffic congestion in surrounding roads can delay people entering or leaving railway station, and subsequently their final destination. So, the government may need to redesign the surrounding road facilities while giving priority to rail passengers. Based on the results, it is evident that sanitation needs to be improved. The government can employ toilet inspectors at the railway station.
Regarding unique factors investigated in this study, only
Departure performance was found to be significant. Surprisingly
Arrival performance has not been found to be significant. This may imply that passengers are more concerned with train departure, which has already been explored in
Section 4.5. In light of the unpredictability of train departure, embarking passengers waiting for train departure do not try to switch to alternative modes (usually bus) even during long waiting times in trains. This is because severe road traffic congestion can excessively delay road trips along the same route [
97]. Passengers may also be worried that the train may leave as soon as they step off the train looking for alternative transport systems. Thus, rail passengers often try to wait as long as required for train departure. On the other hand, train arrival may affect passengers to a lesser extent because of the ability to track trains. Such a tracking system can notify the user of the live movement status of trains, their destination, current location, speed rates and so on, which can help the commuter plan activities before train arrival (such as determining the time to leave the house and reach the rail station). However, the tracking system cannot predict how long trains will actually stay at a station before departure [
98]. Thus, mobile tracking systems are more helpful to determine train arrival rather than train departure at a station. Considering the above situation, commuters get more anxious after boarding a train while waiting for it to depart, rather than when waiting for the arrival of the train at the boarding station. Consequently,
Departure performance has become more significant than
Arrival performance from the viewpoint of the commuters. One of the reasons behind the uncertainty in train departures has been attributed to the solitary railway line running from Joydebpur Railway Station to Tongi Railway Station. The government of Bangladesh has correctly identified the shortcoming along this route and has planned for the construction for a second line to reduce pressure on the existing railway track. However, until the second line is complete and opened to the public, passengers may continue to face excessive delays and uncertainties in train departures from Joydebpur Railway Station [
99].
Other unique factors such as Illegal shops and Floating people have been found to be insignificant in this study, and were rated among the least important in attribute ratings. Thus, railway authority can relax measures regarding illegal shops and people. However, since Food and drinks has been found to be significant, and most shops and hawkers sell refreshments, the authority administration should have tighter control over such shops and people. Moreover, Waiting room facility has been found to be a significant factor. Considering such analysis, it would be wise to provide more chairs and tables for people to rest and take their food. Observations revealed that extra furniture and amenities cannot be placed in the existing designated waiting room. Moreover, it would be quicker for people to board trains if they waited in the platforms rather than in the waiting room. Thus, it is suggested to increase amenities in the platforms where people wait for trains to come.
The study thus provides some interesting insights with regard to commuter rail services in developing nations. This study found Sanitation, Waiting room facility, and Information scope as significant factors, which have been found to be significant in both developed and developing countries.
This study found Ticket counter staff mentality and Porter behavior to significantly affect passenger satisfaction, which can be confirmed by previous studies as well. Passenger satisfaction in our study area is significantly affected by the offensive behavior of staff and porters. Observations have revealed that officers do not maintain proper code of conduct in ticket reservation systems, station entrance points and sometimes in platforms. Porters have been found to charge exorbitant prices to passengers who cannot carry large volumes of goods by themselves. Moreover, people who are boarding or alighting trains hurriedly may need porters’ help to quickly transport luggage, and may be charged excessive fares in that case.
This study found Information scope as a significant factor, which can be confirmed by previous studies as well. Observations have revealed that designated information desks are not available to help passengers with train schedules. A few LED screens are available to show real-time information, but they are inadequate compared to the station size. On the other hand, announcement performance has been found to be significant in our study. Such a factor been found to be significant in developing countries, but not in developed countries. The poor sound system may hamper clarity of announcements. Mismatches in announcements regarding train arrival and departure are common. Announcements are important to commuters especially because they wait to catch the earliest train departing from the station. So, railway administration should maintain all necessary facilities to ensure accuracy and clarity of announcement at platforms.
This study found
Ticket price to be a significant factor, which can also be confirmed by previous studies. Although
E-ticketing has been found to be significant in this study, the authors cannot confirm whether it was found significant in other studies. The only previous study that has been confirmed by the authors to have studied E-ticketing (online ticket purchase/booking) is by Hadiuzzaman et al. (2019) [
27], where the factor was found to be insignificant. Another study by Wenstein [
100] found ticket selling activity involving vending machines to be significant. Although vending machines do not involve physical activity, it is different from online ticket purchase investigated in this study. Interestingly, this study found road connectivity to be significant, which has not been found to be significant in other studies. As mentioned previously, commuters want to reach their workplace in time, hence want to waste as less time as possible in the journey process. Moreover, rough behavior from ticket counter staff and long queue lines encourages them to avoid physical ticket purchases and instead opt for E-ticketing. Additionally, good road connectivity would lower traffic congestion and delays during journeys. Currently, train tickets are cheaper than those of buses competing along the same route. Hence, commuters prefer trains over buses at the moment. However, price rises in train tickets may shift their inclination to buses.
5. Conclusions and Recommendation
Demographic characteristics and preferences vary from country to country. Hence, the significance and importance of service quality attributes change from region to region [
101]. Consequently, studies from a variety of countries have emphasized the necessity of such investigations. Eboli and Mazzulla (2012) stated that “the impact of each service attribute could largely vary from one transit service to another, from one country to another, or even from one region to another” [
2]. Moreover, since the service delivery environment differs between developed and developing nations, the user perception of service quality varies between these economic regions [
102,
103]. Hence, it is vital to determine which factor dominates in what settings. Moreover, knowledge about all possible factors that can improve the service quality is needed to ensure that the service quality can satisfy the passengers 100%, or to investigate the reasons behind poor service quality in any setting. Consequently, gathering knowledge about different factors from a variety of studies can aid in making a conclusive, holistic remark about the service quality in a particular setting.
The present study examined Overall Passenger Satisfaction (OPS) based on passengers’ perception of the facilities of Joydebpur Railway Station (JRS) using OLR. Overall, passengers in Joydebpur Railway Station are not satisfied with the commuter railway service quality: only 10% of the customers rated the service as ‘excellent’ and only 13% rated the service as ‘good’. In addition, if we were to randomly choose a commuter rail passenger in Dhaka, the expected score of rail service quality was found to be only 2.53 on a scale of 1 (‘very poor’) to 5 (‘excellent’).
Model 1 evaluates the significance of passenger demographic attributes on OPS. Among the five factors, Age, Occupation, and Travel frequency significantly influenced OPS. Elderly passengers and frequent travelers were discontented with facilities. Comparatively lower income groups were satisfied with the station facilities. Model 2 establishes a relationship between OPS and Rail service quality attributes. Out of twenty-four factors considered, thirteen have been proven to significantly affect OPS at 95% confidence level. Eight of these thirteen attributes received average ratings of 2 (Poor), indicating these to be the most unsatisfactory attributes. Based on model estimates and odd ratio, Food and soft drinks, and Waiting room facility are the two most influencing factors, whereas Floating people is the least significant factor.
Pearson correlation matrix shows a moderate positive correlation between Age-Occupation, Age-Travel Frequency, Occupation-Travel Frequency, and Travel Frequency-Income Level, Level crossing facility-Road connectivity, Level crossing facility-Food and soft drinks, Road connectivity- Food and soft drinks, Car parking facilities-Sanitation, Car parking facilities-Waiting room facility, and Sanitation-Food and soft drinks, and Illegal establishment-Illegal shops. Thus, improvement in one factor can be expected to improve the other factor in the correlation pair. Factor ranking based on the Pearson chi-square test implies that passengers gave the most and least importance to Food and soft drinks and Floating people, respectively.
Negative estimates of model M1 suggest that the elderly and frequent travelers are mostly dissatisfied with rail station facilities. Policy makers should pay special attention to these groups of passengers to improve overall passenger satisfaction. The eight significant factors that received poor ratings should be given highest consideration to improve OPS. Considering overall assessment, Food and drinks, Road connectivity, Sanitation and Waiting room facility should be the top priority when improving service quality.
This study has some limitations. The most important limitation is that the study quantifies the impact of satisfaction ratings with individual attributes on overall satisfaction but does not explain them. The results indicate, for instance, that passengers are more likely to rate the rail service as good or excellent when passengers perceive better service when consuming food and soft drinks. However, it is difficult to ascertain the exact reasons for which passengers perceive the rail service as better in these instances. This makes it difficult to quantify the benefits of policies aimed at improving perceived quality of the rail service. Further research could focus on the ‘why’ behind these ratings.
Another limitation this survey suffers is from a possible sampling bias. Even though the survey collected valid responses from 1000 participants (both from main survey and validation survey), sampling biases may be present because the demographic coverage of the respondents cannot be validated/weighted against any present national census fully covering the demographic characteristics of commuters. Such biases may make the respondent sample unrepresentative of the intended population and hurt generalizability claims about inferences drawn from the biased sample [
103]. For example, frequent travelers were probably just more likely to be captured in this survey, as they were likely to be present at the station more frequently. Nevertheless, future studies can attempt to reduce this sampling bias using a larger sample.
Although this study specifically focuses on intercity commuter train facilities, the methodology and evaluation framework may also be applicable and contextualized to intercity train facilities. This study has focused on railway station facilities only. Further evaluation can be performed considering in-train compartment facilities incorporating more detailed classification and higher resolutions of demographic attributes.
One of the main limitations of the study regarding its acceptability among transportation planners is its focus on only one aspect of railway service—passengers. However, passenger satisfaction is not the only practical priority of railway authority. Railways have to perform the dual juxtaposing roles of commercial organization and social organization. Social obligations of railways include concessionary movement of passenger and freight, particularly to remote areas; and ensuring environmental sustainability around transport projects, etc. among other objectives. In doing so, rail networks can affect the location and pattern of economic activity and growth. Train operators often face exorbitant operating costs partly because of the afore-mentioned reasons and partly because their monopolistic nature have hindered their motivation for organizational reforms and efficiencies. Besides, misguided government interventions, sometimes geared towards political gains, have occasionally imposed unsustainable fare and service conditions on public transport operators and overestimated what can be accommodated through subsidy [
104,
105]. It is evident that there are multiple perspectives in assessing public transport, namely, drivers, passengers, transport operators, and regulators or communities. These perspectives represent several stakeholders interested in the efficiency, comfortability, and effective operations of the transport systems; consequently, a conflict of interest is observed [
106]. Thus future studies need to assess railway service quality from the viewpoint of rail operators considering the above-mentioned factors.


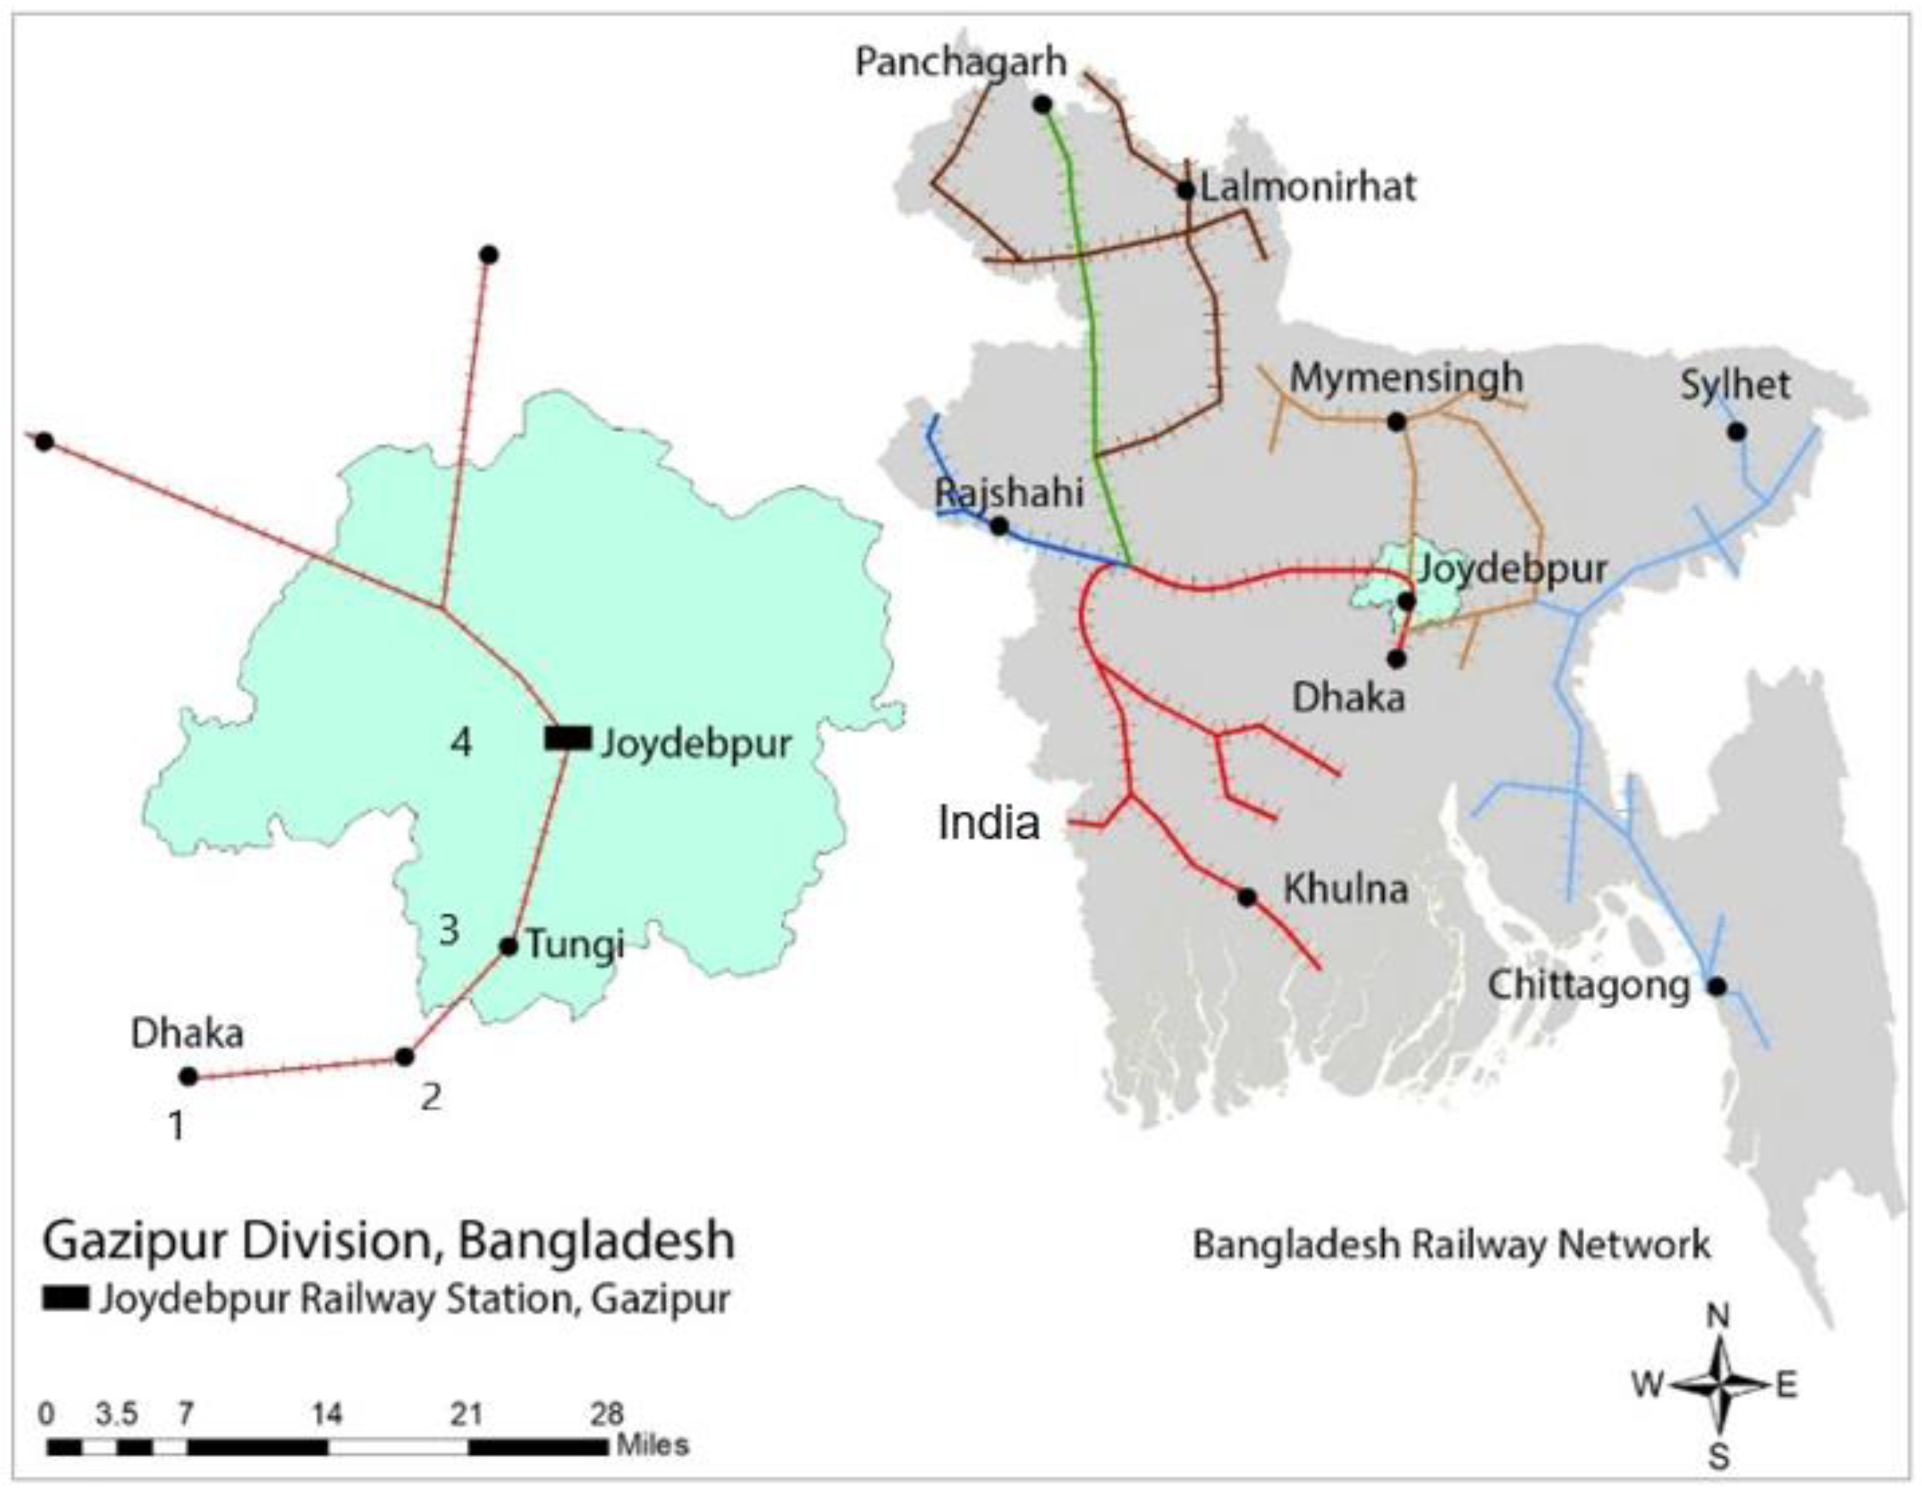
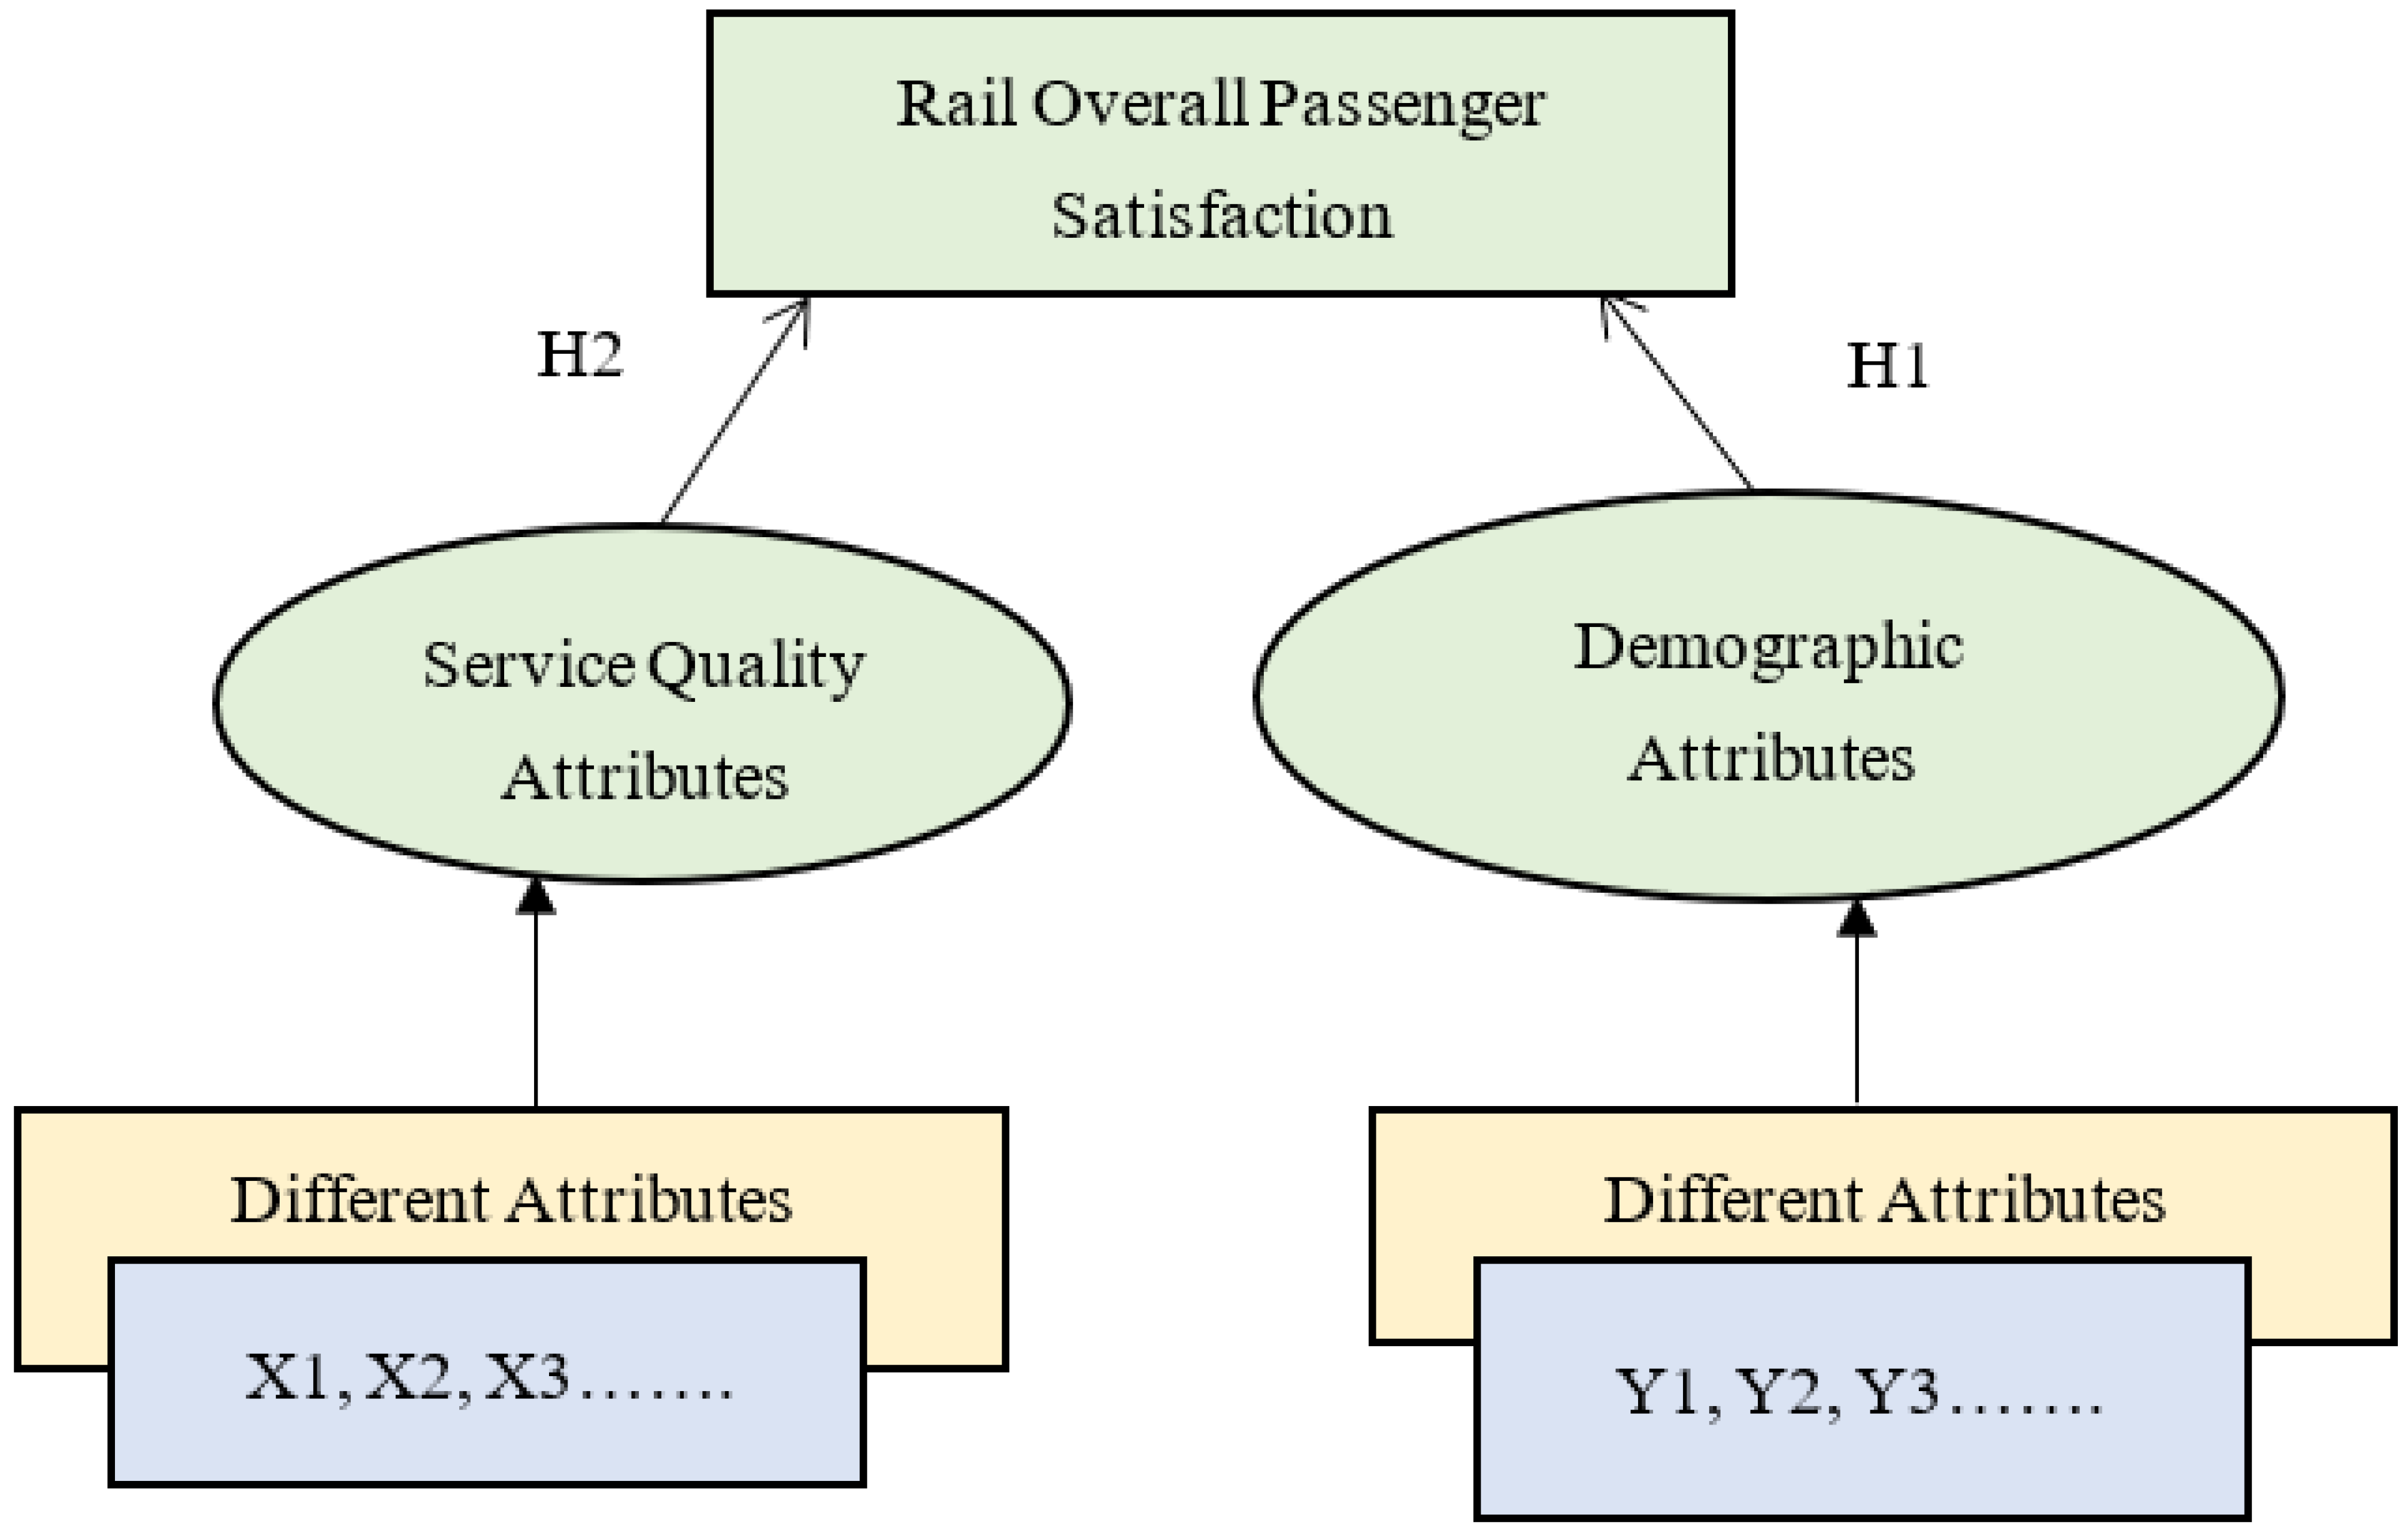
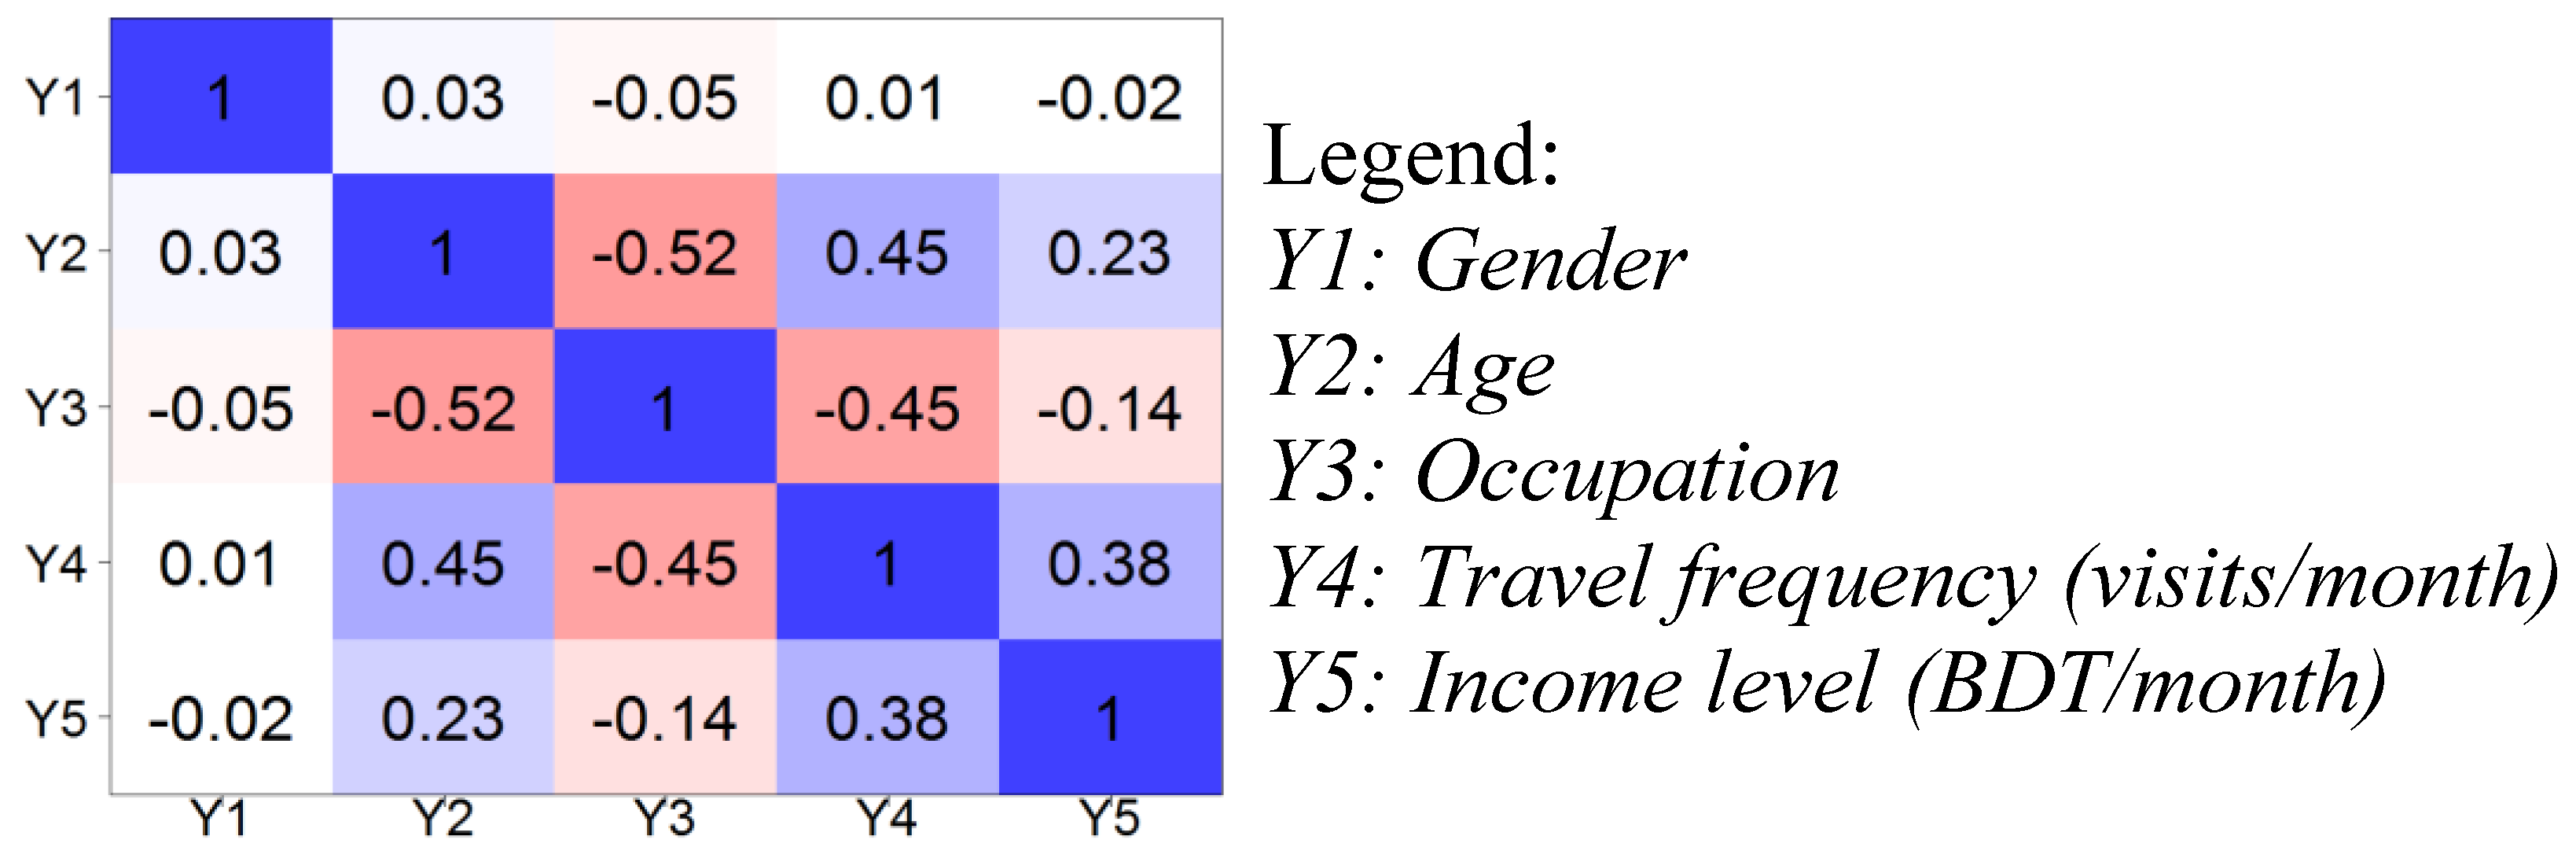
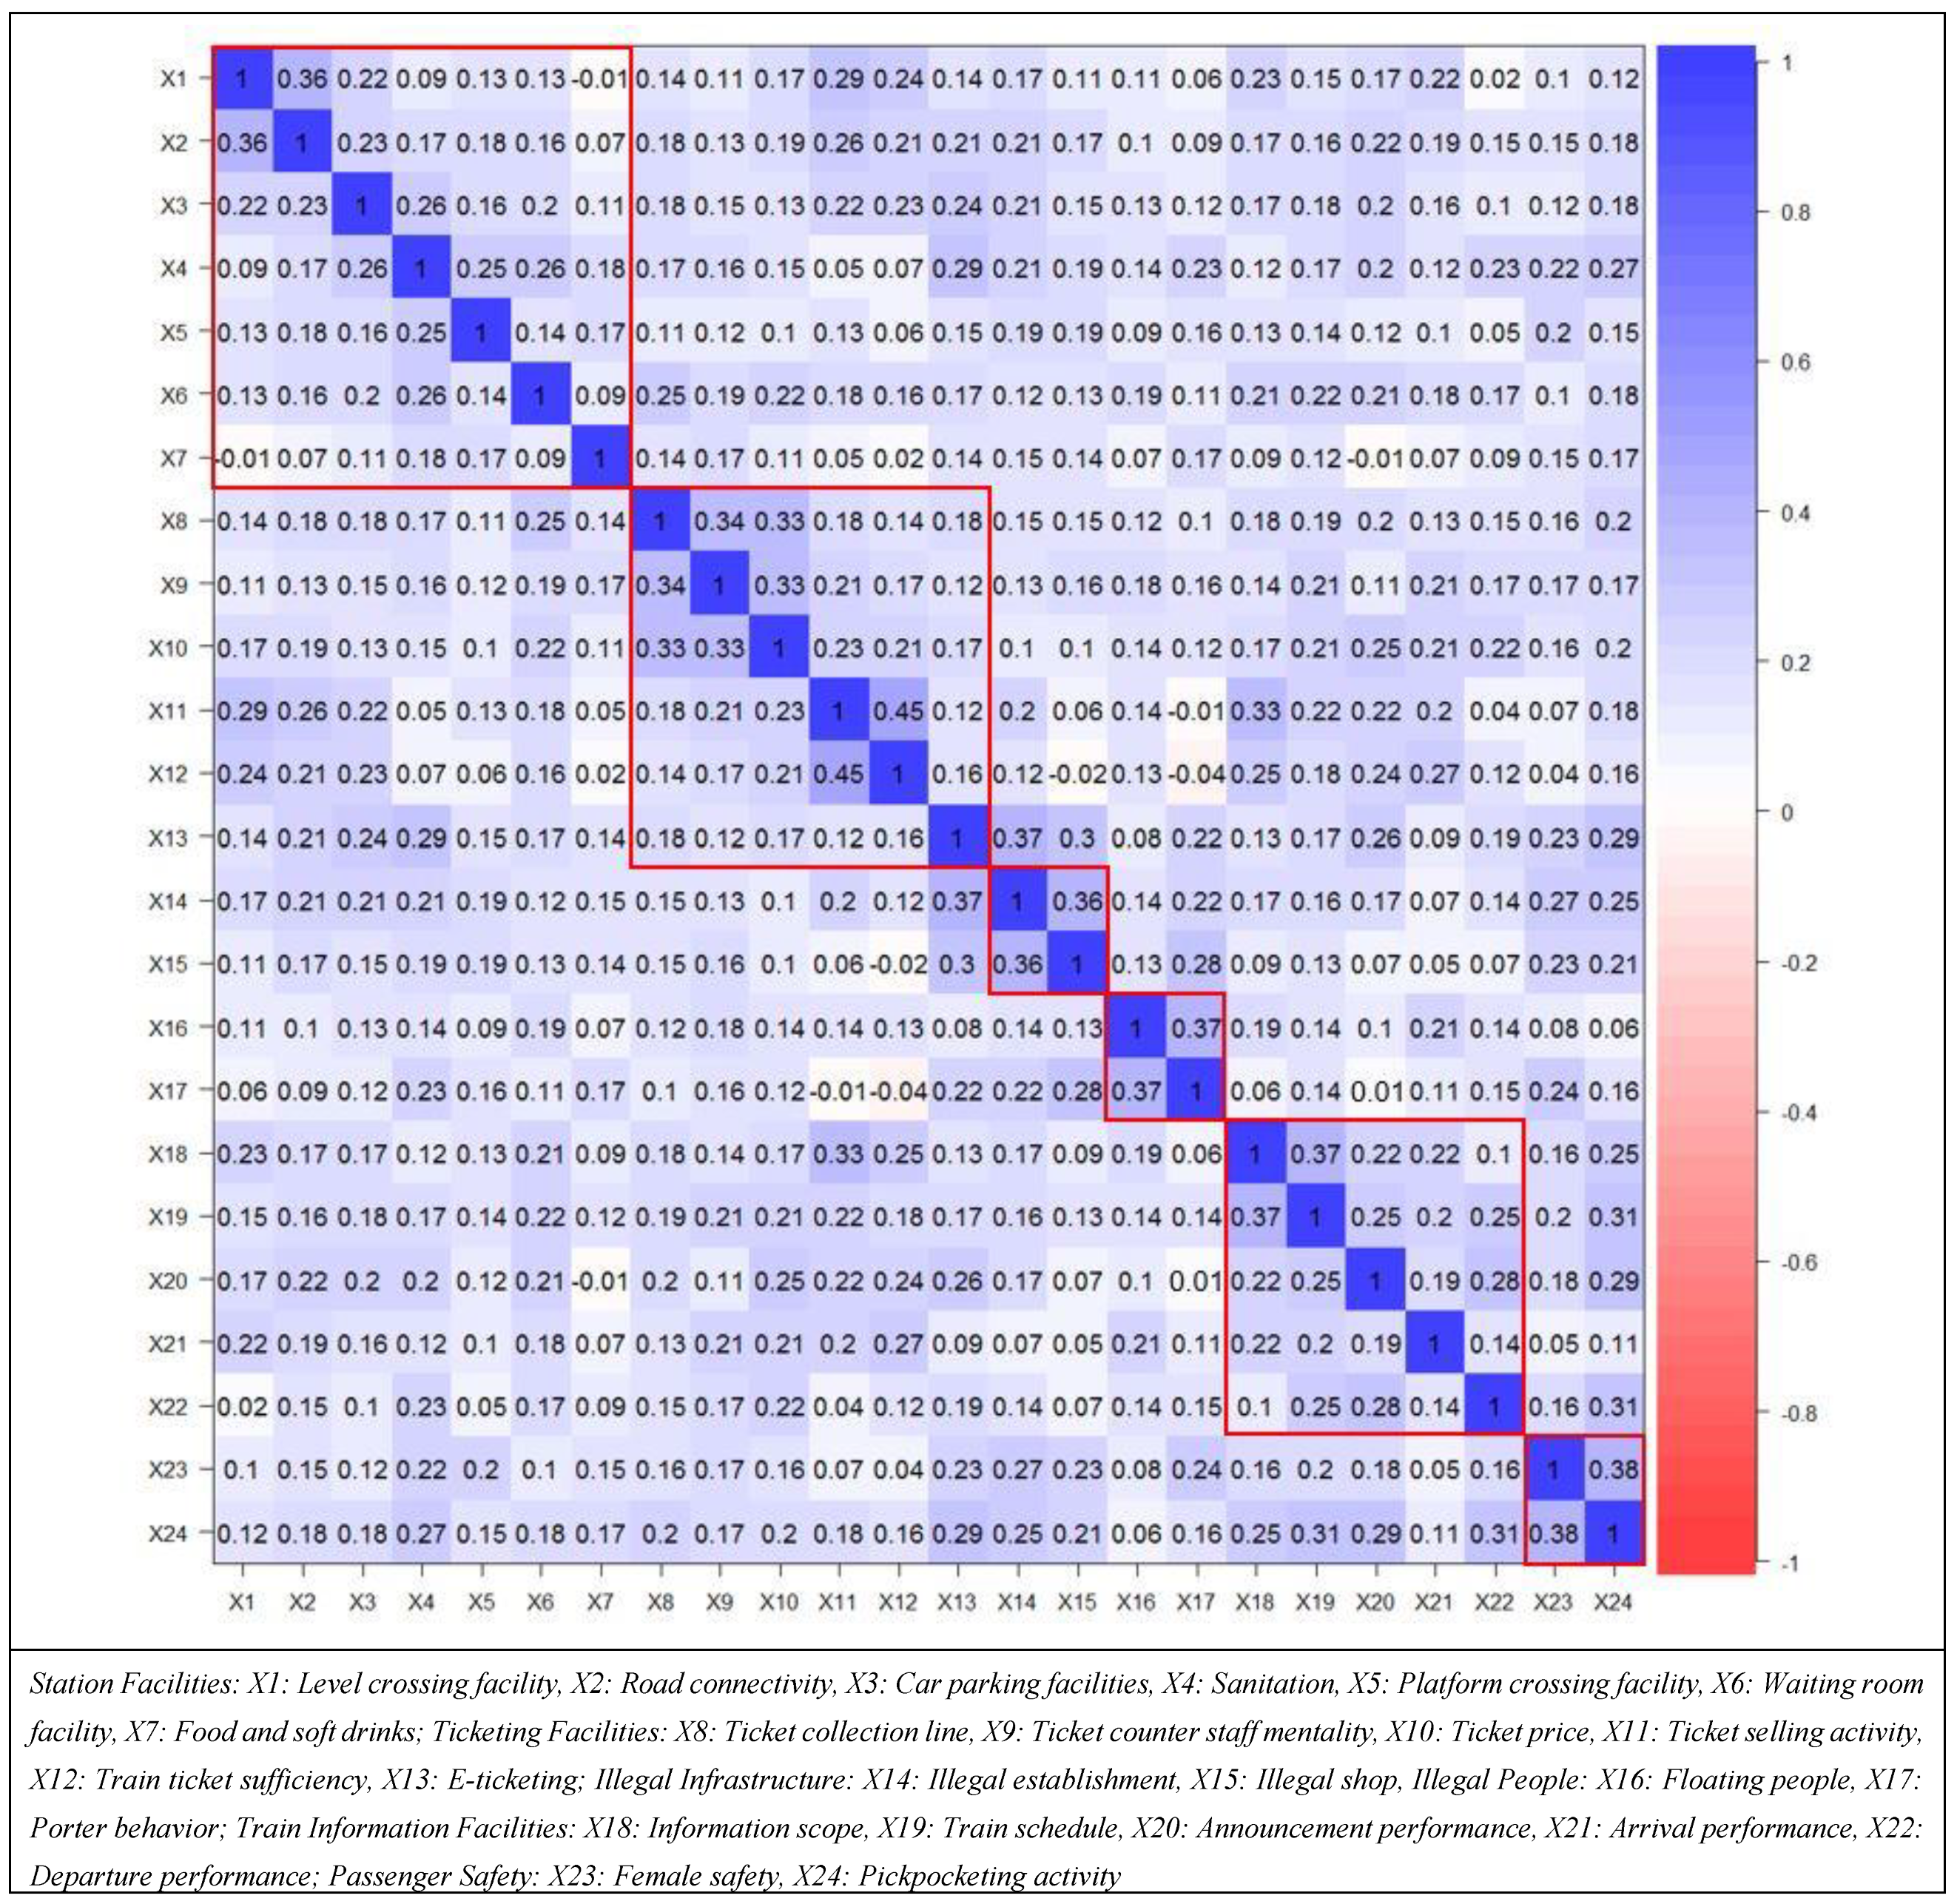


