
Deficits in Cerebellum-Dependent Learning and Cerebellar Morphology in Male and Female BTBR Autism Model Mice
 ,
,
Abstract
:1. Introduction
2. Materials and Methods
2.1. Animals
2.2. Accelerating Rotarod
2.3. Surgery
2.4. Eyeblink Conditioning

2.5. Tissue Processing and Analysis
2.6. Statistics
2.7. Code Availability
3. Results

4. Discussion
Supplementary Materials
Author Contributions
Funding
Institutional Review Board Statement
Informed Consent Statement
Data Availability Statement
Acknowledgments
Conflicts of Interest
References
- Lord, C.; Brugha, T.S.; Charman, T.; Cusack, J.; Dumas, G.; Frazier, T.; Jones, E.J.H.; Jones, R.M.; Pickles, A.; State, M.W.; et al. Autism spectrum disorder. Nat. Rev. Dis. Primer 2020, 6, 5. [Google Scholar] [CrossRef] [PubMed]
- Loomes, R.; Hull, L.; Mandy, W.P.L. What is the male-to-female ratio in autism spectrum disorder? A systematic review and meta-analysis. J. Am. Acad. Child Adolesc. Psychiatry 2017, 56, 466–474. [Google Scholar] [CrossRef] [Green Version]
- Maenner, M.J.; Shaw, K.A.; Bakian, A.V.; Bilder, D.A.; Durkin, M.S.; Esler, A.; Furnier, S.M.; Hallas, L.; Hall-Lande, J.; Hudson, A.; et al. Prevalence and Characteristics of Autism Spectrum Disorder Among Children Aged 8 Years—Autism and Developmental Disabilities Monitoring Network, 11 Sites, United States, 2018. Morb. Mortal. Wkly. Rep. Surveill. Summ. Wash. DC 2021, 70, 1–16. [Google Scholar] [CrossRef]
- Zeidan, J.; Fombonne, E.; Scorah, J.; Ibrahim, A.; Durkin, M.S.; Saxena, S.; Yusuf, A.; Shih, A.; Elsabbagh, M. Global prevalence of autism: A systematic review update. Autism Res. 2022, 15, 778–790. [Google Scholar] [CrossRef] [PubMed]
- James, W.H.; Grech, V. Potential explanations of behavioural and other differences and similarities between males and females with autism spectrum disorder. Early Hum. Dev. 2020, 140, 104863. [Google Scholar] [CrossRef]
- Young, H.; Oreve, M.-J.; Speranza, M. Clinical characteristics and problems diagnosing autism spectrum disorder in girls. Arch. Pediatr. 2018, 25, 399–403. [Google Scholar] [CrossRef]
- Amaral, D.G.; Schumann, C.M.; Nordahl, C.W. Neuroanatomy of autism. Trends Neurosci. 2008, 31, 137–145. [Google Scholar] [CrossRef]
- Bruchhage, M.M.K.; Bucci, M.-P.; Becker, E.B.E. Cerebellar involvement in autism and ADHD. Handb. Clin. Neurol. 2018, 155, 61–72. [Google Scholar] [CrossRef]
- Fatemi, S.H.; Aldinger, K.A.; Ashwood, P.; Bauman, M.L.; Blaha, C.D.; Blatt, G.J.; Chauhan, A.; Chauhan, V.; Dager, S.R.; Dickson, P.E.; et al. Consensus paper: Pathological role of the cerebellum in autism. Cerebellum 2012, 11, 777–807. [Google Scholar] [CrossRef] [Green Version]
- Hampson, D.R.; Blatt, G.J. Autism spectrum disorders and neuropathology of the cerebellum. Front. Neurosci. 2015, 9, 420. [Google Scholar] [CrossRef]
- Mosconi, M.W.; Wang, Z.; Schmitt, L.M.; Tsai, P.; Sweeney, J.A. The role of cerebellar circuitry alterations in the pathophysiology of autism spectrum disorders. Front. Neurosci. 2015, 9, 296. [Google Scholar] [CrossRef] [PubMed] [Green Version]
- Peter, S.; De Zeeuw, C.I.; Boeckers, T.M.; Schmeisser, M.J. Cerebellar and Striatal Pathologies in Mouse Models of Autism Spectrum Disorder. Adv. Anat. Embryol. Cell Biol. 2017, 224, 103–119. [Google Scholar] [CrossRef]
- Wang, S.S.-H.; Kloth, A.D.; Badura, A. The cerebellum, sensitive periods, and autism. Neuron 2014, 83, 518–532. [Google Scholar] [CrossRef] [Green Version]
- Courchesne, E.; Saitoh, O.; Yeung-Courchesne, R.; Press, G.A.; Lincoln, A.J.; Haas, R.H.; Schreibman, L. Abnormality of cerebellar vermian lobules VI and VII in patients with infantile autism: Identification of hypoplastic and hyperplastic subgroups with MR imaging. AJR Am. J. Roentgenol. 1994, 162, 123–130. [Google Scholar] [CrossRef] [PubMed] [Green Version]
- Courchesne, E.; Yeung-Courchesne, R.; Press, G.A.; Hesselink, J.R.; Jernigan, T.L. Hypoplasia of cerebellar vermal lobules VI and VII in autism. N. Engl. J. Med. 1988, 318, 1349–1354. [Google Scholar] [CrossRef] [PubMed] [Green Version]
- Traut, N.; Beggiato, A.; Bourgeron, T.; Delorme, R.; Rondi-Reig, L.; Paradis, A.-L.; Toro, R. Cerebellar Volume in Autism: Literature Meta-analysis and Analysis of the Autism Brain Imaging Data Exchange Cohort. Biol. Psychiatry 2018, 83, 579–588. [Google Scholar] [CrossRef] [Green Version]
- Webb, S.J.; Sparks, B.-F.; Friedman, S.D.; Shaw, D.W.W.; Giedd, J.; Dawson, G.; Dager, S.R. Cerebellar vermal volumes and behavioral correlates in children with autism spectrum disorder. Psychiatry Res. 2009, 172, 61–67. [Google Scholar] [CrossRef] [Green Version]
- Fatemi, S.H.; Halt, A.R.; Realmuto, G.; Earle, J.; Kist, D.A.; Thuras, P.; Merz, A. Purkinje cell size is reduced in cerebellum of patients with autism. Cell. Mol. Neurobiol. 2002, 22, 171–175. [Google Scholar] [CrossRef]
- Skefos, J.; Cummings, C.; Enzer, K.; Holiday, J.; Weed, K.; Levy, E.; Yuce, T.; Kemper, T.; Bauman, M. Regional Alterations in Purkinje Cell Density in Patients with Autism. PLoS ONE 2014, 9, e81255. [Google Scholar] [CrossRef]
- Sudarov, A. Defining the role of cerebellar Purkinje cells in autism spectrum disorders. Cerebellum 2013, 12, 950–955. [Google Scholar] [CrossRef]
- Yip, J.; Soghomonian, J.-J.; Blatt, G.J. Decreased GAD67 mRNA levels in cerebellar Purkinje cells in autism: Pathophysiological implications. Acta Neuropathol. 2007, 113, 559–568. [Google Scholar] [CrossRef] [PubMed]
- Shukla, D.K.; Keehn, B.; Lincoln, A.J.; Müller, R.-A. White matter compromise of callosal and subcortical fiber tracts in children with autism spectrum disorder: A diffusion tensor imaging study. J. Am. Acad. Child Adolesc. Psychiatry 2010, 49, 1269–1278. [Google Scholar] [CrossRef] [Green Version]
- Courchesne, E. Abnormal early brain development in autism. Mol. Psychiatry 2002, 7, S21–S23. [Google Scholar] [CrossRef] [PubMed] [Green Version]
- Stoodley, C.J.; Limperopoulos, C. Structure-function relationships in the developing cerebellum: Evidence from early-life cerebellar injury and neurodevelopmental disorders. Semin. Fetal. Neonatal Med. 2016, 21, 356–364. [Google Scholar] [CrossRef] [PubMed] [Green Version]
- Menashe, I.; Grange, P.; Larsen, E.C.; Banerjee-Basu, S.; Mitra, P.P. Co-expression profiling of autism genes in the mouse brain. PLoS Comput. Biol. 2013, 9, e1003128. [Google Scholar] [CrossRef] [PubMed] [Green Version]
- Bhat, A.N. Motor Impairment Increases in Children with Autism Spectrum Disorder as a Function of Social Communication, Cognitive and Functional Impairment, Repetitive Behavior Severity, and Comorbid Diagnoses: A SPARK Study Report. Autism Res. 2021, 14, 202–219. [Google Scholar] [CrossRef]
- Jaber, M. Autism is (also) a movement disorder. Mov. Disord. 2015, 30, 341. [Google Scholar] [CrossRef]
- Christian, K.M.; Thompson, R.F. Neural substrates of eyeblink conditioning: Acquisition and retention. Learn. Mem. 2003, 10, 427–455. [Google Scholar] [CrossRef] [Green Version]
- Freeman, J.H.; Steinmetz, A.B. Neural circuitry and plasticity mechanisms underlying delay eyeblink conditioning. Learn. Mem. 2011, 18, 666–677. [Google Scholar] [CrossRef] [Green Version]
- Thompson, R.F.; Steinmetz, J.E. The role of the cerebellum in classical conditioning of discrete behavioral responses. Neuroscience 2009, 162, 732–755. [Google Scholar] [CrossRef]
- Oristaglio, J.; Hyman West, S.; Ghaffari, M.; Lech, M.S.; Verma, B.R.; Harvey, J.A.; Welsh, J.P.; Malone, R.P. Children with autism spectrum disorders show abnormal conditioned response timing on delay, but not trace, eyeblink conditioning. Neuroscience 2013, 248, 708–718. [Google Scholar] [CrossRef] [PubMed] [Green Version]
- Sears, L.L.; Finn, P.R.; Steinmetz, J.E. Abnormal classical eye-blink conditioning in autism. J. Autism Dev. Disord. 1994, 24, 737–751. [Google Scholar] [CrossRef] [PubMed]
- Welsh, J.P.; Oristaglio, J.T. Autism and Classical Eyeblink Conditioning: Performance Changes of the Conditioned Response Related to Autism Spectrum Disorder Diagnosis. Front. Psychiatry 2016, 7, 137. [Google Scholar] [CrossRef] [PubMed] [Green Version]
- D’Mello, A.M.; Crocetti, D.; Mostofsky, S.H.; Stoodley, C.J. Cerebellar gray matter and lobular volumes correlate with core autism symptoms. NeuroImage Clin. 2015, 7, 631–639. [Google Scholar] [CrossRef] [PubMed] [Green Version]
- Laidi, C.; Boisgontier, J.; Chakravarty, M.M.; Hotier, S.; d’Albis, M.-A.; Mangin, J.-F.; Devenyi, G.A.; Delorme, R.; Bolognani, F.; Czech, C.; et al. Cerebellar anatomical alterations and attention to eyes in autism. Sci. Rep. 2017, 7, 12008. [Google Scholar] [CrossRef] [PubMed]
- Stoodley, C.J.; D’Mello, A.M.; Ellegood, J.; Jakkamsetti, V.; Liu, P.; Nebel, M.B.; Gibson, J.M.; Kelly, E.; Meng, F.; Cano, C.A. Altered cerebellar connectivity in autism and cerebellar-mediated rescue of autism-related behaviors in mice. Nat. Neurosci. 2017, 20, 1744–1751. [Google Scholar] [CrossRef] [PubMed]
- Crawley, J.N. Translational animal models of autism and neurodevelopmental disorders. Dialogues Clin. Neurosci. 2012, 14, 293–305. [Google Scholar] [CrossRef]
- Thabault, M.; Turpin, V.; Maisterrena, A.; Jaber, M.; Egloff, M.; Galvan, L. Cerebellar and Striatal Implications in Autism Spectrum Disorders: From Clinical Observations to Animal Models. Int. J. Mol. Sci. 2022, 23, 2294. [Google Scholar] [CrossRef]
- Al Sagheer, T.; Haida, O.; Balbous, A.; Francheteau, M.; Matas, E.; Fernagut, P.-O.; Jaber, M. Motor Impairments Correlate with Social Deficits and Restricted Neuronal Loss in an Environmental Model of Autism. Int. J. Neuropsychopharmacol. 2018, 21, 871–882. [Google Scholar] [CrossRef] [Green Version]
- Badura, A.; Verpeut, J.L.; Metzger, J.W.; Pereira, T.D.; Pisano, T.J.; Deverett, B.; Bakshinskaya, D.E.; Wang, S.S.-H. Normal cognitive and social development require posterior cerebellar activity. eLife 2018, 7, e36401. [Google Scholar] [CrossRef]
- Cupolillo, D.; Hoxha, E.; Faralli, A.; De Luca, A.; Rossi, F.; Tempia, F.; Carulli, D. Autistic-Like Traits and Cerebellar Dysfunction in Purkinje Cell PTEN Knock-Out Mice. Neuropsychopharmacology 2016, 41, 1457–1466. [Google Scholar] [CrossRef] [PubMed] [Green Version]
- Gibson, J.M.; Howland, C.P.; Ren, C.; Howland, C.; Vernino, A.; Tsai, P.T. A Critical Period for Development of Cerebellar-Mediated Autism-Relevant Social Behavior. J. Neurosci. 2022, 42, 2804–2823. [Google Scholar] [CrossRef] [PubMed]
- Haida, O.; Al Sagheer, T.; Balbous, A.; Francheteau, M.; Matas, E.; Soria, F.; Fernagut, P.O.; Jaber, M. Sex-dependent behavioral deficits and neuropathology in a maternal immune activation model of autism. Transl. Psychiatry 2019, 9, 124. [Google Scholar] [CrossRef] [Green Version]
- Hoxha, E.; Tonini, R.; Montarolo, F.; Croci, L.; Consalez, G.G.; Tempia, F. Motor dysfunction and cerebellar Purkinje cell firing impairment in Ebf2 null mice. Mol. Cell. Neurosci. 2013, 52, 51–61. [Google Scholar] [CrossRef] [PubMed]
- Kloth, A.D.; Badura, A.; Li, A.; Cherskov, A.; Connolly, S.G.; Giovannucci, A.; Bangash, M.A.; Grasselli, G.; Peñagarikano, O.; Piochon, C.; et al. Cerebellar associative sensory learning defects in five mouse autism models. eLife 2015, 4, e06085. [Google Scholar] [CrossRef]
- Matas, E.; Maisterrena, A.; Thabault, M.; Balado, E.; Francheteau, M.; Balbous, A.; Galvan, L.; Jaber, M. Major motor and gait deficits with sexual dimorphism in a Shank3 mutant mouse model. Mol. Autism 2021, 12, 2. [Google Scholar] [CrossRef]
- Peter, S.; ten Brinke, M.M.; Stedehouder, J.; Reinelt, C.M.; Wu, B.; Zhou, H.; Zhou, K.; Boele, H.-J.; Kushner, S.A.; Lee, M.G.; et al. Dysfunctional cerebellar Purkinje cells contribute to autism-like behaviour in Shank2-deficient mice. Nat. Commun. 2016, 7, 12627. [Google Scholar] [CrossRef] [Green Version]
- Piochon, C.; Kloth, A.D.; Grasselli, G.; Titley, H.K.; Nakayama, H.; Hashimoto, K.; Wan, V.; Simmons, D.H.; Eissa, T.; Nakatani, J.; et al. Cerebellar plasticity and motor learning deficits in a copy-number variation mouse model of autism. Nat. Commun. 2014, 5, 5586. [Google Scholar] [CrossRef] [Green Version]
- Tsai, P.T.; Hull, C.; Chu, Y.; Greene-Colozzi, E.; Sadowski, A.R.; Leech, J.M.; Steinberg, J.; Crawley, J.N.; Regehr, W.G.; Sahin, M. Autistic-like behaviour and cerebellar dysfunction in Purkinje cell Tsc1 mutant mice. Nature 2012, 488, 647–651. [Google Scholar] [CrossRef] [Green Version]
- Wang, R.; Tan, J.; Guo, J.; Zheng, Y.; Han, Q.; So, K.-F.; Yu, J.; Zhang, L. Aberrant Development and Synaptic Transmission of Cerebellar Cortex in a VPA Induced Mouse Autism Model. Front. Cell. Neurosci. 2018, 12, 500. [Google Scholar] [CrossRef]
- Simmons, D.H.; Titley, H.K.; Hansel, C.; Mason, P. Behavioral Tests for Mouse Models of Autism: An Argument for the Inclusion of Cerebellum-Controlled Motor Behaviors. Neuroscience 2021, 462, 303–319. [Google Scholar] [CrossRef] [PubMed]
- de la Torre-Ubieta, L.; Won, H.; Stein, J.L.; Geschwind, D.H. Advancing the understanding of autism disease mechanisms through genetics. Nat. Med. 2016, 22, 345–361. [Google Scholar] [CrossRef] [PubMed] [Green Version]
- Meyza, K.Z.; Blanchard, D.C. The BTBR mouse model of idiopathic autism—Current view on mechanisms. Neurosci. Biobehav. Rev. 2017, 76, 99–110. [Google Scholar] [CrossRef] [PubMed] [Green Version]
- Meyza, K.Z.; Defensor, E.B.; Jensen, A.L.; Corley, M.J.; Pearson, B.L.; Pobbe, R.L.H.; Bolivar, V.J.; Blanchard, D.C.; Blanchard, R.J. The BTBR T+ tf/J mouse model for autism spectrum disorders-in search of biomarkers. Behav. Brain Res. 2013, 251, 25–34. [Google Scholar] [CrossRef] [PubMed] [Green Version]
- Amodeo, D.A.; Jones, J.H.; Sweeney, J.A.; Ragozzino, M.E. Differences in BTBR T+ tf/J and C57BL/6J mice on probabilistic reversal learning and stereotyped behaviors. Behav. Brain Res. 2012, 227, 64–72. [Google Scholar] [CrossRef] [Green Version]
- Chao, O.Y.; Yunger, R.; Yang, Y.-M. Behavioral assessments of BTBR T+Itpr3tf/J mice by tests of object attention and elevated open platform: Implications for an animal model of psychiatric comorbidity in autism. Behav. Brain Res. 2018, 347, 140–147. [Google Scholar] [CrossRef]
- Faraji, J.; Karimi, M.; Lawrence, C.; Mohajerani, M.H.; Metz, G.A.S. Non-diagnostic symptoms in a mouse model of autism in relation to neuroanatomy: The BTBR strain reinvestigated. Transl. Psychiatry 2018, 8, 234. [Google Scholar] [CrossRef] [Green Version]
- McFarlane, H.G.; Kusek, G.K.; Yang, M.; Phoenix, J.L.; Bolivar, V.J.; Crawley, J.N. Autism-like behavioral phenotypes in BTBR T+tf/J mice. Genes Brain Behav. 2008, 7, 152–163. [Google Scholar] [CrossRef]
- McTighe, S.M.; Neal, S.J.; Lin, Q.; Hughes, Z.A.; Smith, D.G. The BTBR mouse model of autism spectrum disorders has learning and attentional impairments and alterations in acetylcholine and kynurenic acid in prefrontal cortex. PLoS ONE 2013, 8, e62189. [Google Scholar] [CrossRef]
- Scattoni, M.L.; Gandhy, S.U.; Ricceri, L.; Crawley, J.N. Unusual repertoire of vocalizations in the BTBR T+tf/J mouse model of autism. PLoS ONE 2008, 3, e3067. [Google Scholar] [CrossRef]
- Amodeo, D.A.; Pahua, A.E.; Zarate, M.; Taylor, J.A.; Peterson, S.; Posadas, R.; Oliver, B.L.; Amodeo, L.R. Differences in the expression of restricted repetitive behaviors in female and male BTBR T + tf/J mice. Behav. Brain Res. 2019, 372, 112028. [Google Scholar] [CrossRef]
- Queen, N.J.; Boardman, A.A.; Patel, R.S.; Siu, J.J.; Mo, X.; Cao, L. Environmental enrichment improves metabolic and behavioral health in the BTBR mouse model of autism. Psychoneuroendocrinology 2020, 111, 104476. [Google Scholar] [CrossRef] [PubMed]
- Ellegood, J.; Anagnostou, E.; Babineau, B.A.; Crawley, J.N.; Lin, L.; Genestine, M.; DiCicco-Bloom, E.; Lai, J.K.Y.; Foster, J.A.; Peñagarikano, O.; et al. Clustering autism: Using neuroanatomical differences in 26 mouse models to gain insight into the heterogeneity. Mol. Psychiatry 2015, 20, 118–125. [Google Scholar] [CrossRef] [PubMed] [Green Version]
- Ellegood, J.; Babineau, B.A.; Henkelman, R.M.; Lerch, J.P.; Crawley, J.N. Neuroanatomical analysis of the BTBR mouse model of autism using magnetic resonance imaging and diffusion tensor imaging. NeuroImage 2013, 70, 288–300. [Google Scholar] [CrossRef] [Green Version]
- Shpyleva, S.; Ivanovsky, S.; de Conti, A.; Melnyk, S.; Tryndyak, V.; Beland, F.A.; James, S.J.; Pogribny, I.P. Cerebellar oxidative DNA damage and altered DNA methylation in the BTBR T+tf/J mouse model of autism and similarities with human post mortem cerebellum. PLoS ONE 2014, 9, e113712. [Google Scholar] [CrossRef] [PubMed] [Green Version]
- Nadeem, A.; Ahmad, S.F.; Al-Harbi, N.O.; Attia, S.M.; Alshammari, M.A.; Alzahrani, K.S.; Bakheet, S.A. Increased oxidative stress in the cerebellum and peripheral immune cells leads to exaggerated autism-like repetitive behavior due to deficiency of antioxidant response in BTBR T + tf/J mice. Prog. Neuropsychopharmacol. Biol. Psychiatry 2019, 89, 245–253. [Google Scholar] [CrossRef]
- Chao, O.Y.; Zhang, H.; Pathak, S.S.; Huston, J.P.; Yang, Y.-M. Functional Convergence of Motor and Social Processes in Lobule IV/V of the Mouse Cerebellum. Cerebellum 2021, 20, 836–852. [Google Scholar] [CrossRef]
- Deacon, R.M.J. Measuring motor coordination in mice. J. Vis. Exp. 2013, 75, e2609. [Google Scholar] [CrossRef]
- Cosgrove, J.A.; Kelly, L.K.; Kiffmeyer, E.A.; Kloth, A.D. Sex-dependent influence of postweaning environmental enrichment in Angelman syndrome model mice. Brain Behav. 2022, 12, e2468. [Google Scholar] [CrossRef]
- Siegel, J.J.; Taylor, W.; Gray, R.; Kalmbach, B.; Zemelman, B.V.; Desai, N.S.; Johnston, D.; Chitwood, R.A. Trace Eyeblink Conditioning in Mice Is Dependent upon the Dorsal Medial Prefrontal Cortex, Cerebellum, and Amygdala: Behavioral Characterization and Functional Circuitry. Eneuro 2015, 2. [Google Scholar] [CrossRef]
- Giovannucci, A.; Pnevmatikakis, E.A.; Deverett, B.; Pereira, T.; Fondriest, J.; Brady, M.J.; Wang, S.S.-H.; Abbas, W.; Parés, P.; Masip, D. Automated gesture tracking in head-fixed mice. J. Neurosci. Methods 2018, 300, 184–195. [Google Scholar] [CrossRef] [PubMed]
- Heiney, S.A.; Wohl, M.P.; Chettih, S.N.; Ruffolo, L.I.; Medina, J.F. Cerebellar-dependent expression of motor learning during eyeblink conditioning in head-fixed mice. J. Neurosci. 2014, 34, 14845–14853. [Google Scholar] [CrossRef] [PubMed] [Green Version]
- Hirono, M.; Watanabe, S.; Karube, F.; Fujiyama, F.; Kawahara, S.; Nagao, S.; Yanagawa, Y.; Misonou, H. Perineuronal Nets in the Deep Cerebellar Nuclei Regulate GABAergic Transmission and Delay Eyeblink Conditioning. J. Neurosci. 2018, 38, 6130–6144. [Google Scholar] [CrossRef] [PubMed] [Green Version]
- Allen Institute for Brain Science. Allen Mouse Brain Atlas [Dataset]. 2004. Available online: http://mouse.brain-map.org (accessed on 5 November 2022).
- Lein, E.S.; Hawrylycz, M.J.; Ao, N.; Ayres, M.; Bensinger, A.; Bernard, A.; Boe, A.F.; Boguski, M.S.; Brockway, K.S.; Byrnes, E.J.; et al. Genome-wide atlas of gene expression in the adult mouse brain. Nature 2007, 445, 168–176. [Google Scholar] [CrossRef]
- Sholl, D.A. The measurable parameters of the cerebral cortex and their significance in its organization. Prog. Neurobiol. 1956, 2, 324–333. [Google Scholar]
- Takehara-Nishiuchi, K. The Anatomy and Physiology of Eyeblink Classical Conditioning. Curr. Top. Behav. Neurosci. 2018, 37, 297–323. [Google Scholar] [CrossRef] [PubMed]
- Bauman, M.L.; Kemper, T.L. Neuroanatomic observations of the brain in autism: A review and future directions. Int. J. Dev. Neurosci. 2005, 23, 183–187. [Google Scholar] [CrossRef] [PubMed]
- Kemper, T.L.; Bauman, M. Neuropathology of infantile autism. J. Neuropathol. Exp. Neurol. 1998, 57, 645–652. [Google Scholar] [CrossRef] [Green Version]
- Whitney, E.R.; Kemper, T.L.; Bauman, M.L.; Rosene, D.L.; Blatt, G.J. Cerebellar Purkinje cells are reduced in a subpopulation of autistic brains: A stereological experiment using calbindin-D28k. Cerebellum 2008, 7, 406–416. [Google Scholar] [CrossRef]
- Whitney, E.R.; Kemper, T.L.; Rosene, D.L.; Bauman, M.L.; Blatt, G.J. Density of cerebellar basket and stellate cells in autism: Evidence for a late developmental loss of Purkinje cells. J. Neurosci. Res. 2009, 87, 2245–2254. [Google Scholar] [CrossRef] [Green Version]
- Xiao, R.; Zhong, H.; Li, X.; Ma, Y.; Zhang, R.; Wang, L.; Zang, Z.; Fan, X. Abnormal Cerebellar Development Is Involved in Dystonia-Like Behaviors and Motor Dysfunction of Autistic BTBR Mice. Front. Cell Dev. Biol. 2020, 8, 231. [Google Scholar] [CrossRef] [PubMed]
- Achilly, N.P.; He, L.-J.; Kim, O.A.; Ohmae, S.; Wojaczynski, G.J.; Lin, T.; Sillitoe, R.V.; Medina, J.F.; Zoghbi, H.Y. Deleting Mecp2 from the cerebellum rather than its neuronal subtypes causes a delay in motor learning in mice. eLife 2021, 10, e64833. [Google Scholar] [CrossRef] [PubMed]
- Koekkoek, S.K.E.; Yamaguchi, K.; Milojkovic, B.A.; Dortland, B.R.; Ruigrok, T.J.H.; Maex, R.; De Graaf, W.; Smit, A.E.; VanderWerf, F.; Bakker, C.E.; et al. Deletion of FMR1 in Purkinje cells enhances parallel fiber LTD, enlarges spines, and attenuates cerebellar eyelid conditioning in Fragile X syndrome. Neuron 2005, 47, 339–352. [Google Scholar] [CrossRef] [PubMed] [Green Version]
- Löwgren, K.; Bååth, R.; Rasmussen, A.; Boele, H.-J.; Koekkoek, S.K.E.; De Zeeuw, C.I.; Hesslow, G. Performance in eyeblink conditioning is age and sex dependent. PLoS ONE 2017, 12, e0177849. [Google Scholar] [CrossRef] [PubMed]
- Wood, G.E.; Shors, T.J. Stress facilitates classical conditioning in males, but impairs classical conditioning in females through activational effects of ovarian hormones. Proc. Natl. Acad. Sci. USA 1998, 95, 4066–4071. [Google Scholar] [CrossRef] [PubMed] [Green Version]
- Oyaga, M.R.; Serra, I.; Kurup, D.; Koekkoek, S.K.E.; Badura, A. Eyeblink conditioning performance and brain-wide C-fos expression in male and female mice. bioRxiv 2022. [Google Scholar] [CrossRef]
- Takahashi, A. Toward Understanding the Sex Differences in the Biological Mechanism of Social Stress in Mouse Models. Front. Psychiatry 2021, 12, 644161. [Google Scholar] [CrossRef]
- Mercer, A.A.; Palarz, K.J.; Tabatadze, N.; Woolley, C.S.; Raman, I.M. Sex differences in cerebellar synaptic transmission and sex-specific responses to autism-linked Gabrb3 mutations in mice. eLife 2016, 5, e07596. [Google Scholar] [CrossRef]
- Reeb-Sutherland, B.C.; Fox, N.A. Eyeblink conditioning: A non-invasive biomarker for neurodevelopmental disorders. J. Autism Dev. Disord. 2015, 45, 376–394. [Google Scholar] [CrossRef]
- DeLorey, T.M.; Sahbaie, P.; Hashemi, E.; Homanics, G.E.; Clark, J.D. Gabrb3 gene deficient mice exhibit impaired social and exploratory behaviors, deficits in non-selective attention and hypoplasia of cerebellar vermal lobules: A potential model of autism spectrum disorder. Behav. Brain Res. 2008, 187, 207–220. [Google Scholar] [CrossRef] [Green Version]
- Piven, J.; Saliba, K.; Bailey, J.; Arndt, S. An MRI study of autism: The cerebellum revisited. Neurology 1997, 49, 546–551. [Google Scholar] [CrossRef] [PubMed]
- Stephenson, D.T.; O’Neill, S.M.; Narayan, S.; Tiwari, A.; Arnold, E.; Samaroo, H.D.; Du, F.; Ring, R.H.; Campbell, B.; Pletcher, M.; et al. Histopathologic characterization of the BTBR mouse model of autistic-like behavior reveals selective changes in neurodevelopmental proteins and adult hippocampal neurogenesis. Mol. Autism 2011, 2, 7. [Google Scholar] [CrossRef] [PubMed] [Green Version]
- van der Heijden, M.E.; Gill, J.S.; Sillitoe, R.V. Abnormal Cerebellar Development in Autism Spectrum Disorders. Dev. Neurosci. 2021, 43, 181–190. [Google Scholar] [CrossRef] [PubMed]
- Phillips, M.; Pozzo-Miller, L. Dendritic spine dysgenesis in autism related disorders. Neurosci. Lett. 2015, 601, 30–40. [Google Scholar] [CrossRef] [PubMed] [Green Version]
- Buckner, R.L. The cerebellum and cognitive function: 25 years of insight from anatomy and neuroimaging. Neuron 2013, 80, 807–815. [Google Scholar] [CrossRef] [Green Version]
- Pierce, K.; Courchesne, E. Evidence for a cerebellar role in reduced exploration and stereotyped behavior in autism. Biol. Psychiatry 2001, 49, 655–664. [Google Scholar] [CrossRef]
- Shoji, H.; Takao, K.; Hattori, S.; Miyakawa, T. Age-related changes in behavior in C57BL/6J mice from young adulthood to middle age. Mol. Brain 2016, 9, 11. [Google Scholar] [CrossRef] [Green Version]
- Vogel, R.W.; Ewers, M.; Ross, C.; Gould, T.J.; Woodruff-Pak, D.S. Age-related impairment in the 250-millisecond delay eyeblink conditioning procedure in C57BL/6 mice. Learn. Mem. 2002, 9, 321–336. [Google Scholar] [CrossRef] [PubMed] [Green Version]
- Kishimoto, Y.; Suzuki, M.; Kawahara, S.; Kirino, Y. Age-dependent impairment of delay and trace eyeblink conditioning. Neuroreport 2001, 12, 3349–3352. [Google Scholar] [CrossRef] [PubMed]
- Beekhof, G.C.; Osorio, C.; White, J.J.; van Zoomeren, S.; van der Stok, H.; Xiong, B.; Nettersheim, I.H.M.S.; Mak, W.A.; Runge, M.; Fiocchi, F.R.; et al. Differential spatiotemporal development of Purkinje cell populations and cerebellar-dependent sensorimotor behaviors. eLife 2021, 10, e63668. [Google Scholar] [CrossRef]
- Freeman, J.H.; Nicholson, D.A.; Muckler, A.S.; Rabinak, C.A.; DiPietro, N.T. Ontogeny of eyeblink conditioned response timing in rats. Behav. Neurosci. 2003, 117, 283–291. [Google Scholar] [CrossRef] [PubMed]
- Schreurs, B.G.; Burhans, L.B.; Smith-Bell, C.A.; Mrowka, S.W.; Wang, D. Ontogeny of trace eyeblink conditioning to shock-shock pairings in the rat pup. Behav. Neurosci. 2013, 127, 114–120. [Google Scholar] [CrossRef] [PubMed] [Green Version]
- Woodruff-Pak, D.S. Stereological estimation of Purkinje neuron number in C57BL/6 mice and its relation to associative learning. Neuroscience 2006, 141, 233–243. [Google Scholar] [CrossRef] [PubMed]
- Woodruff-Pak, D.S.; Foy, M.R.; Akopian, G.G.; Lee, K.H.; Zach, J.; Nguyen, K.P.T.; Comalli, D.M.; Kennard, J.A.; Agelan, A.; Thompson, R.F. Differential effects and rates of normal aging in cerebellum and hippocampus. Proc. Nat. Acad. Sci. USA 2010, 107, 1624–1629. [Google Scholar] [CrossRef] [PubMed] [Green Version]
- Prendergast, B.J.; Onishi, K.G.; Zucker, I. Female mice liberated for inclusion in neuroscience and biomedical research. Neurosci. Biobehav. Rev. 2014, 40, 1–5. [Google Scholar] [CrossRef]
- Albergaria, C.; Silva, N.T.; Pritchett, D.L.; Carey, M.R. Locomotor activity modulates associative learning in the mouse cerebellum. Nat. Neurosci. 2018, 21, 725–735. [Google Scholar] [CrossRef] [PubMed]
- Dalla, C.; Shors, T.J. Sex differences in learning processes of classical and operant conditioning. Phys. Behav. 2009, 97, 229–238. [Google Scholar] [CrossRef] [Green Version]
- Meziane, H.; Ouagazzal, A.M.; Aubert, L.; Wietrzych, M.; Krezel, W. Estrous cycle effects on behavior of C57BL/6J and BALB/cByJ female mice: Implications for phenotyping strategies. Genes Brain Behav. 2007, 6, 192–200. [Google Scholar] [CrossRef]
- Hamson, D.K.; Csupity, A.S.; Gaspar, J.M.; Watson, N.V. Analysis of Foxp2 expression in the cerebellum reveals a possible sex difference. Neuroreport 2009, 20, 611–616. [Google Scholar] [CrossRef] [PubMed]
- Kim, H.; Son, J.; Yoo, H.; Kim, H.; Oh, J.; Han, D.; Hwang, Y.; Kaang, B.-K. Effects of the female estrous cycle on the sexual behaviors and ultrasonic vocalizations of male C57BL/6 and autistic BTBR T+ tf/J mice. Exp. Neurobiol. 2016, 25, 156–162. [Google Scholar] [CrossRef] [PubMed] [Green Version]
- Shansky, R.M.; Woolley, C.S. Considering Sex as a Biological Variable Will Be Valuable for Neuroscience Research. J. Neurosci. 2016, 36, 11817–11822. [Google Scholar] [CrossRef]


| Experiment (Figure) | Male Mice | Female Mice | ||
|---|---|---|---|---|
| C57 | BTBR | C57 | BTBR | |
| Rotarod (Figure 1A,B) | 8 | 8 | 8 | 8 |
| Eyeblink conditioning (Figure 1C,D) | 13 | 12 | 10 | 11 |
| Brain weight (Figure 2A) | 10 | 12 | - | - |
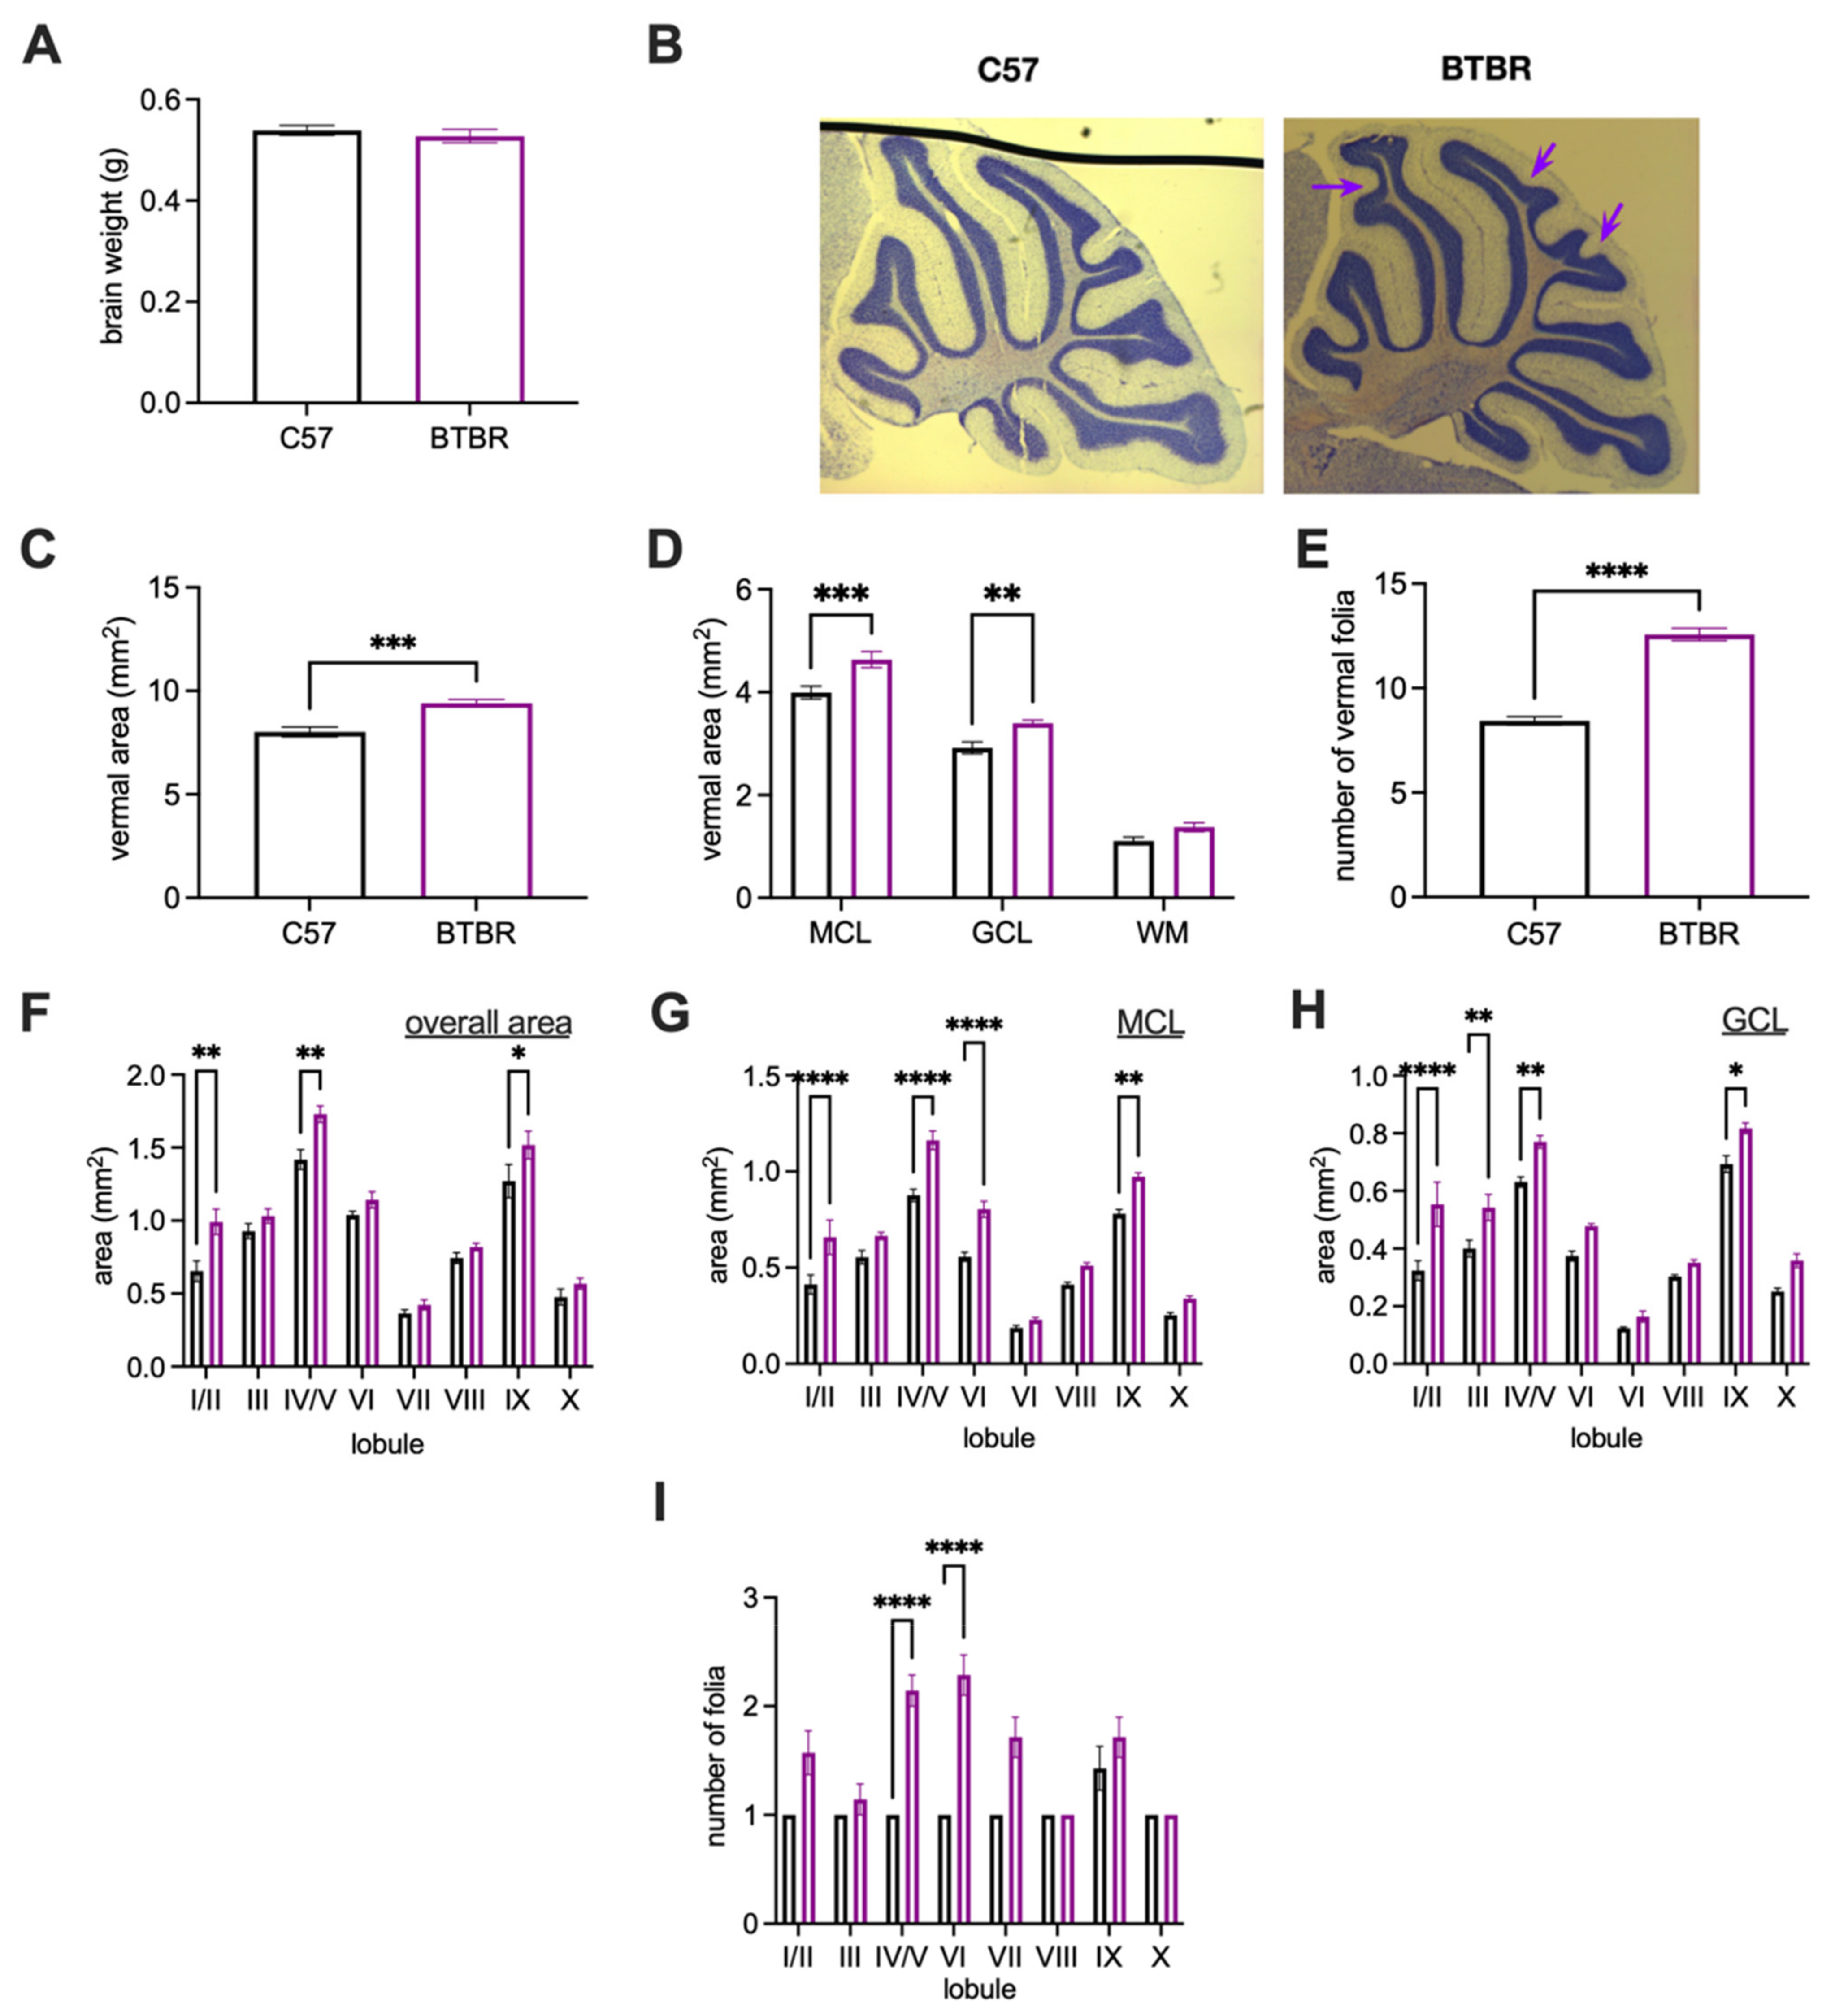
| Vermal anatomy on Nissl-stained tissue (Figure 2C–I) | 8 | 8 | - | - |
| Brain weight (Figure 3A) | - | - | 7 | 10 |
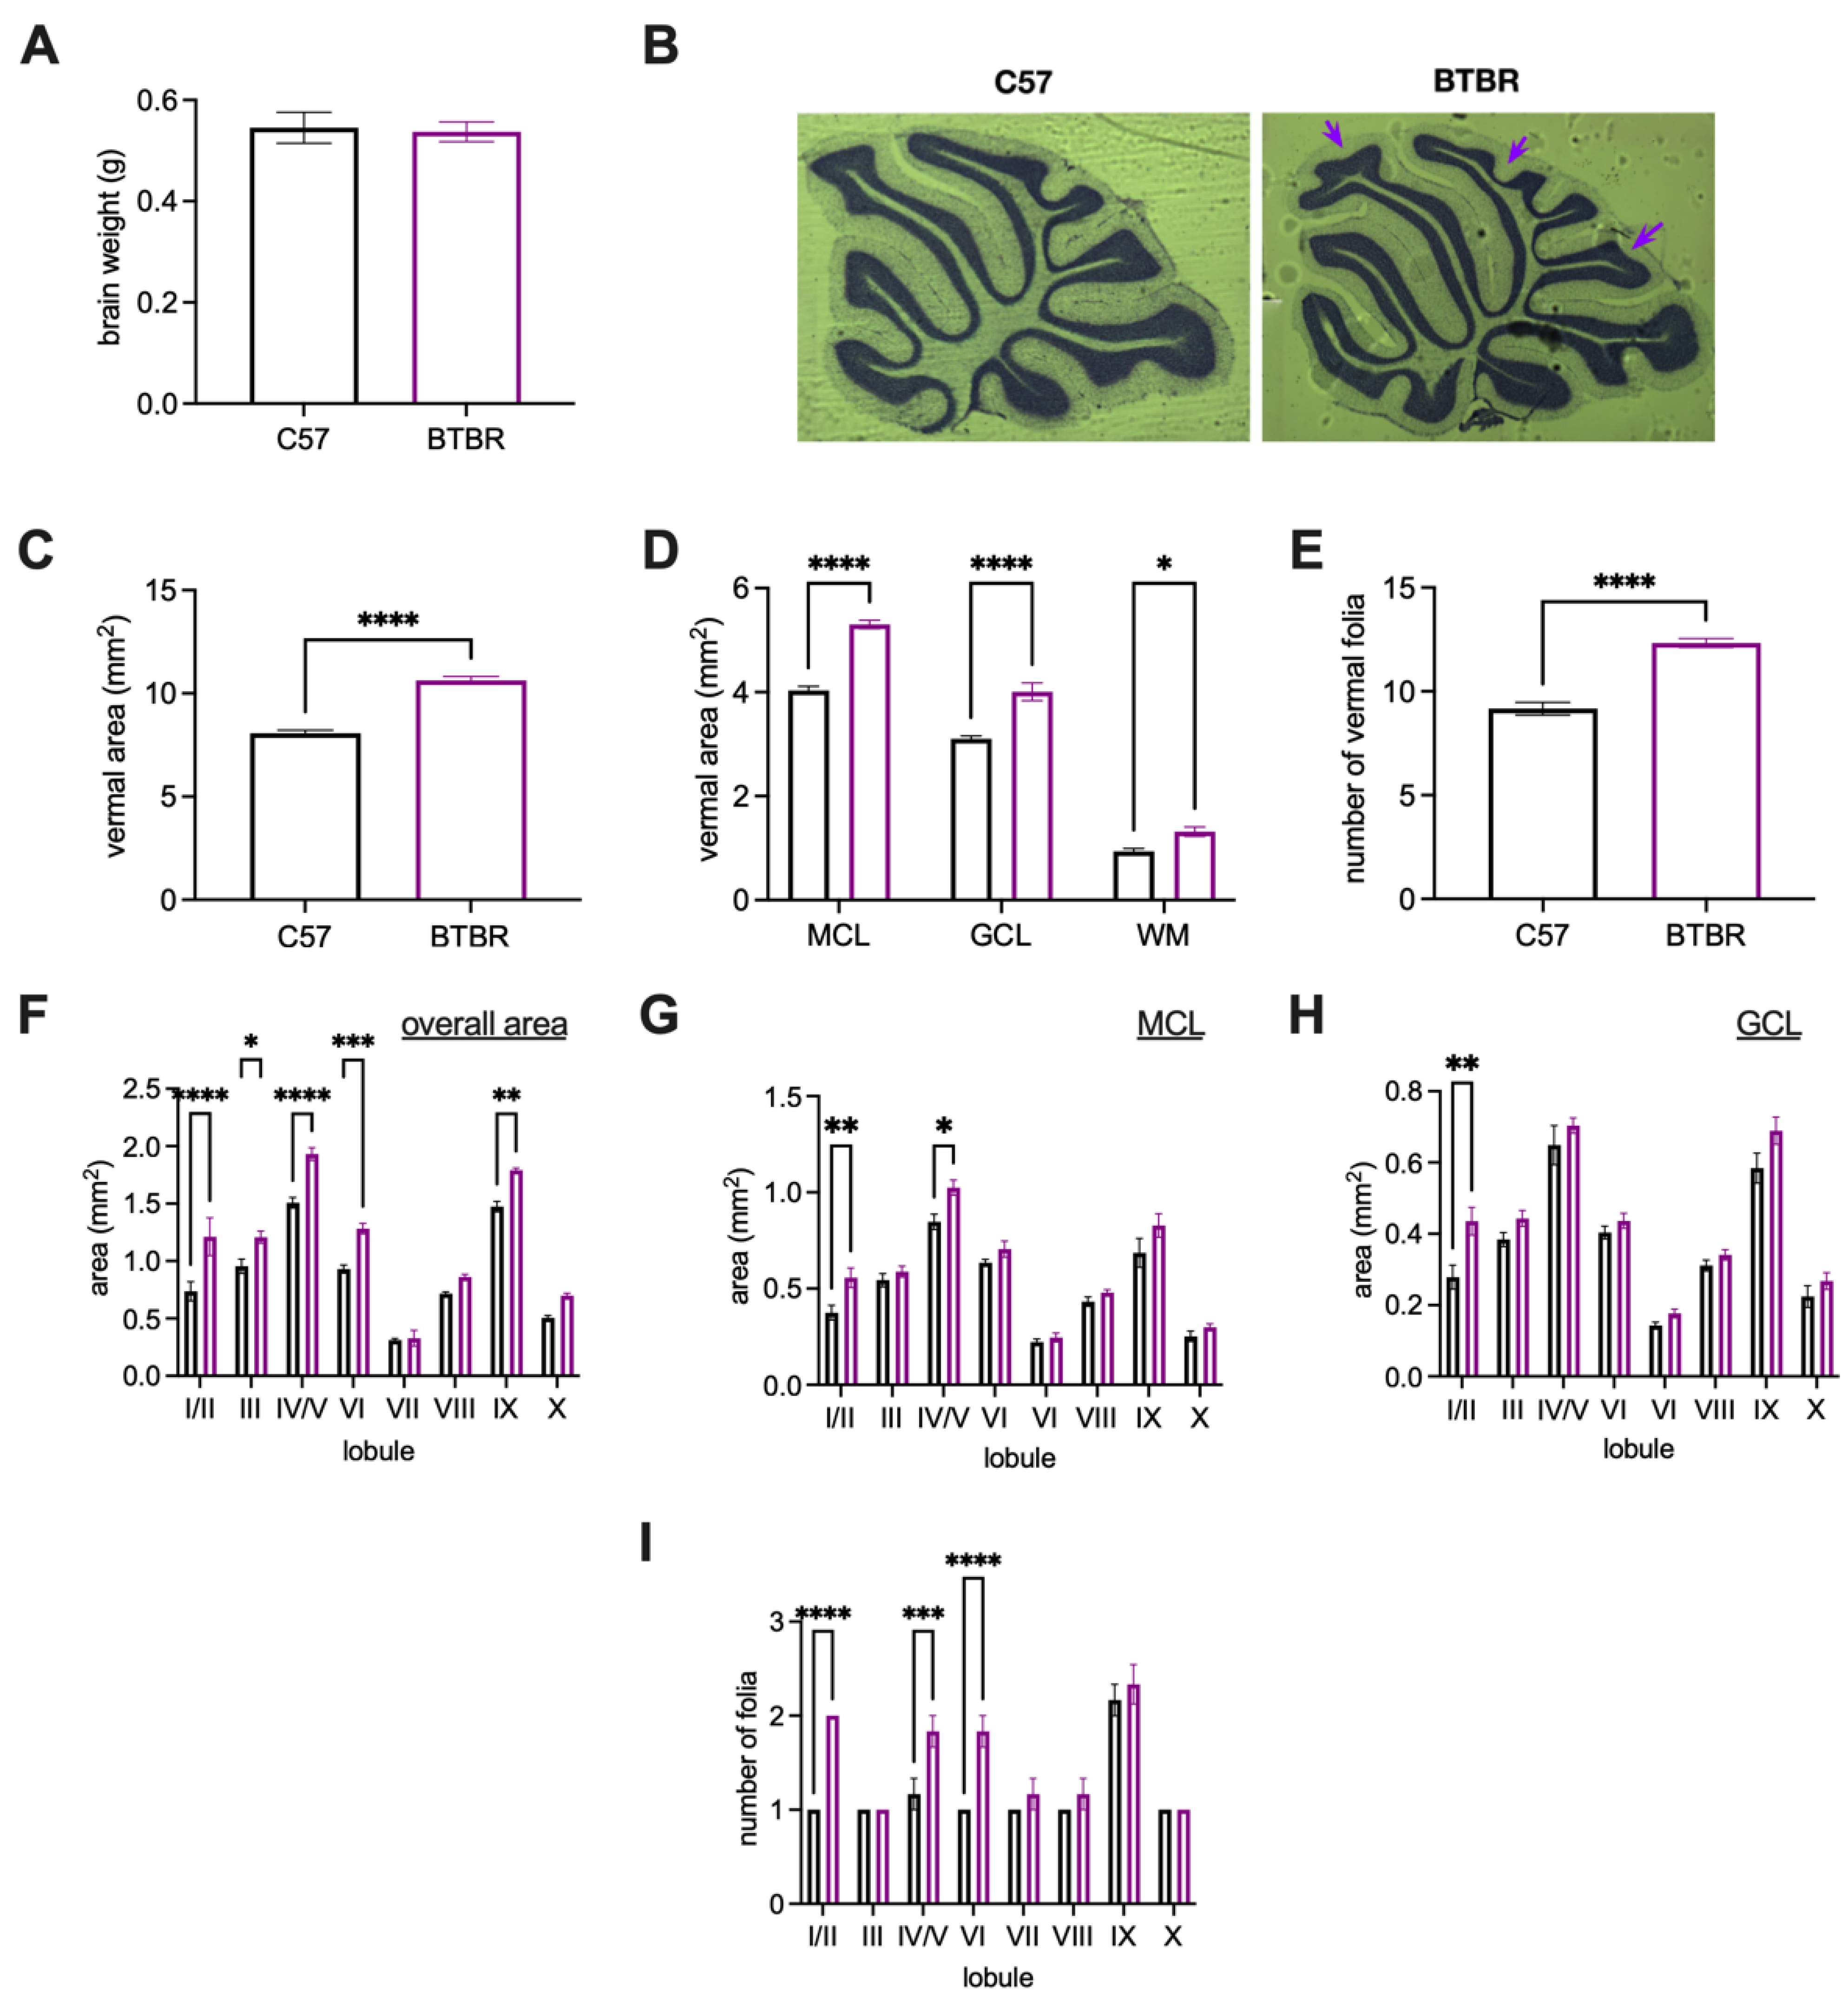
| Vermal anatomy on Nissl-stained tissue (Figure 3C–I) | - | - | 6 | 6 |
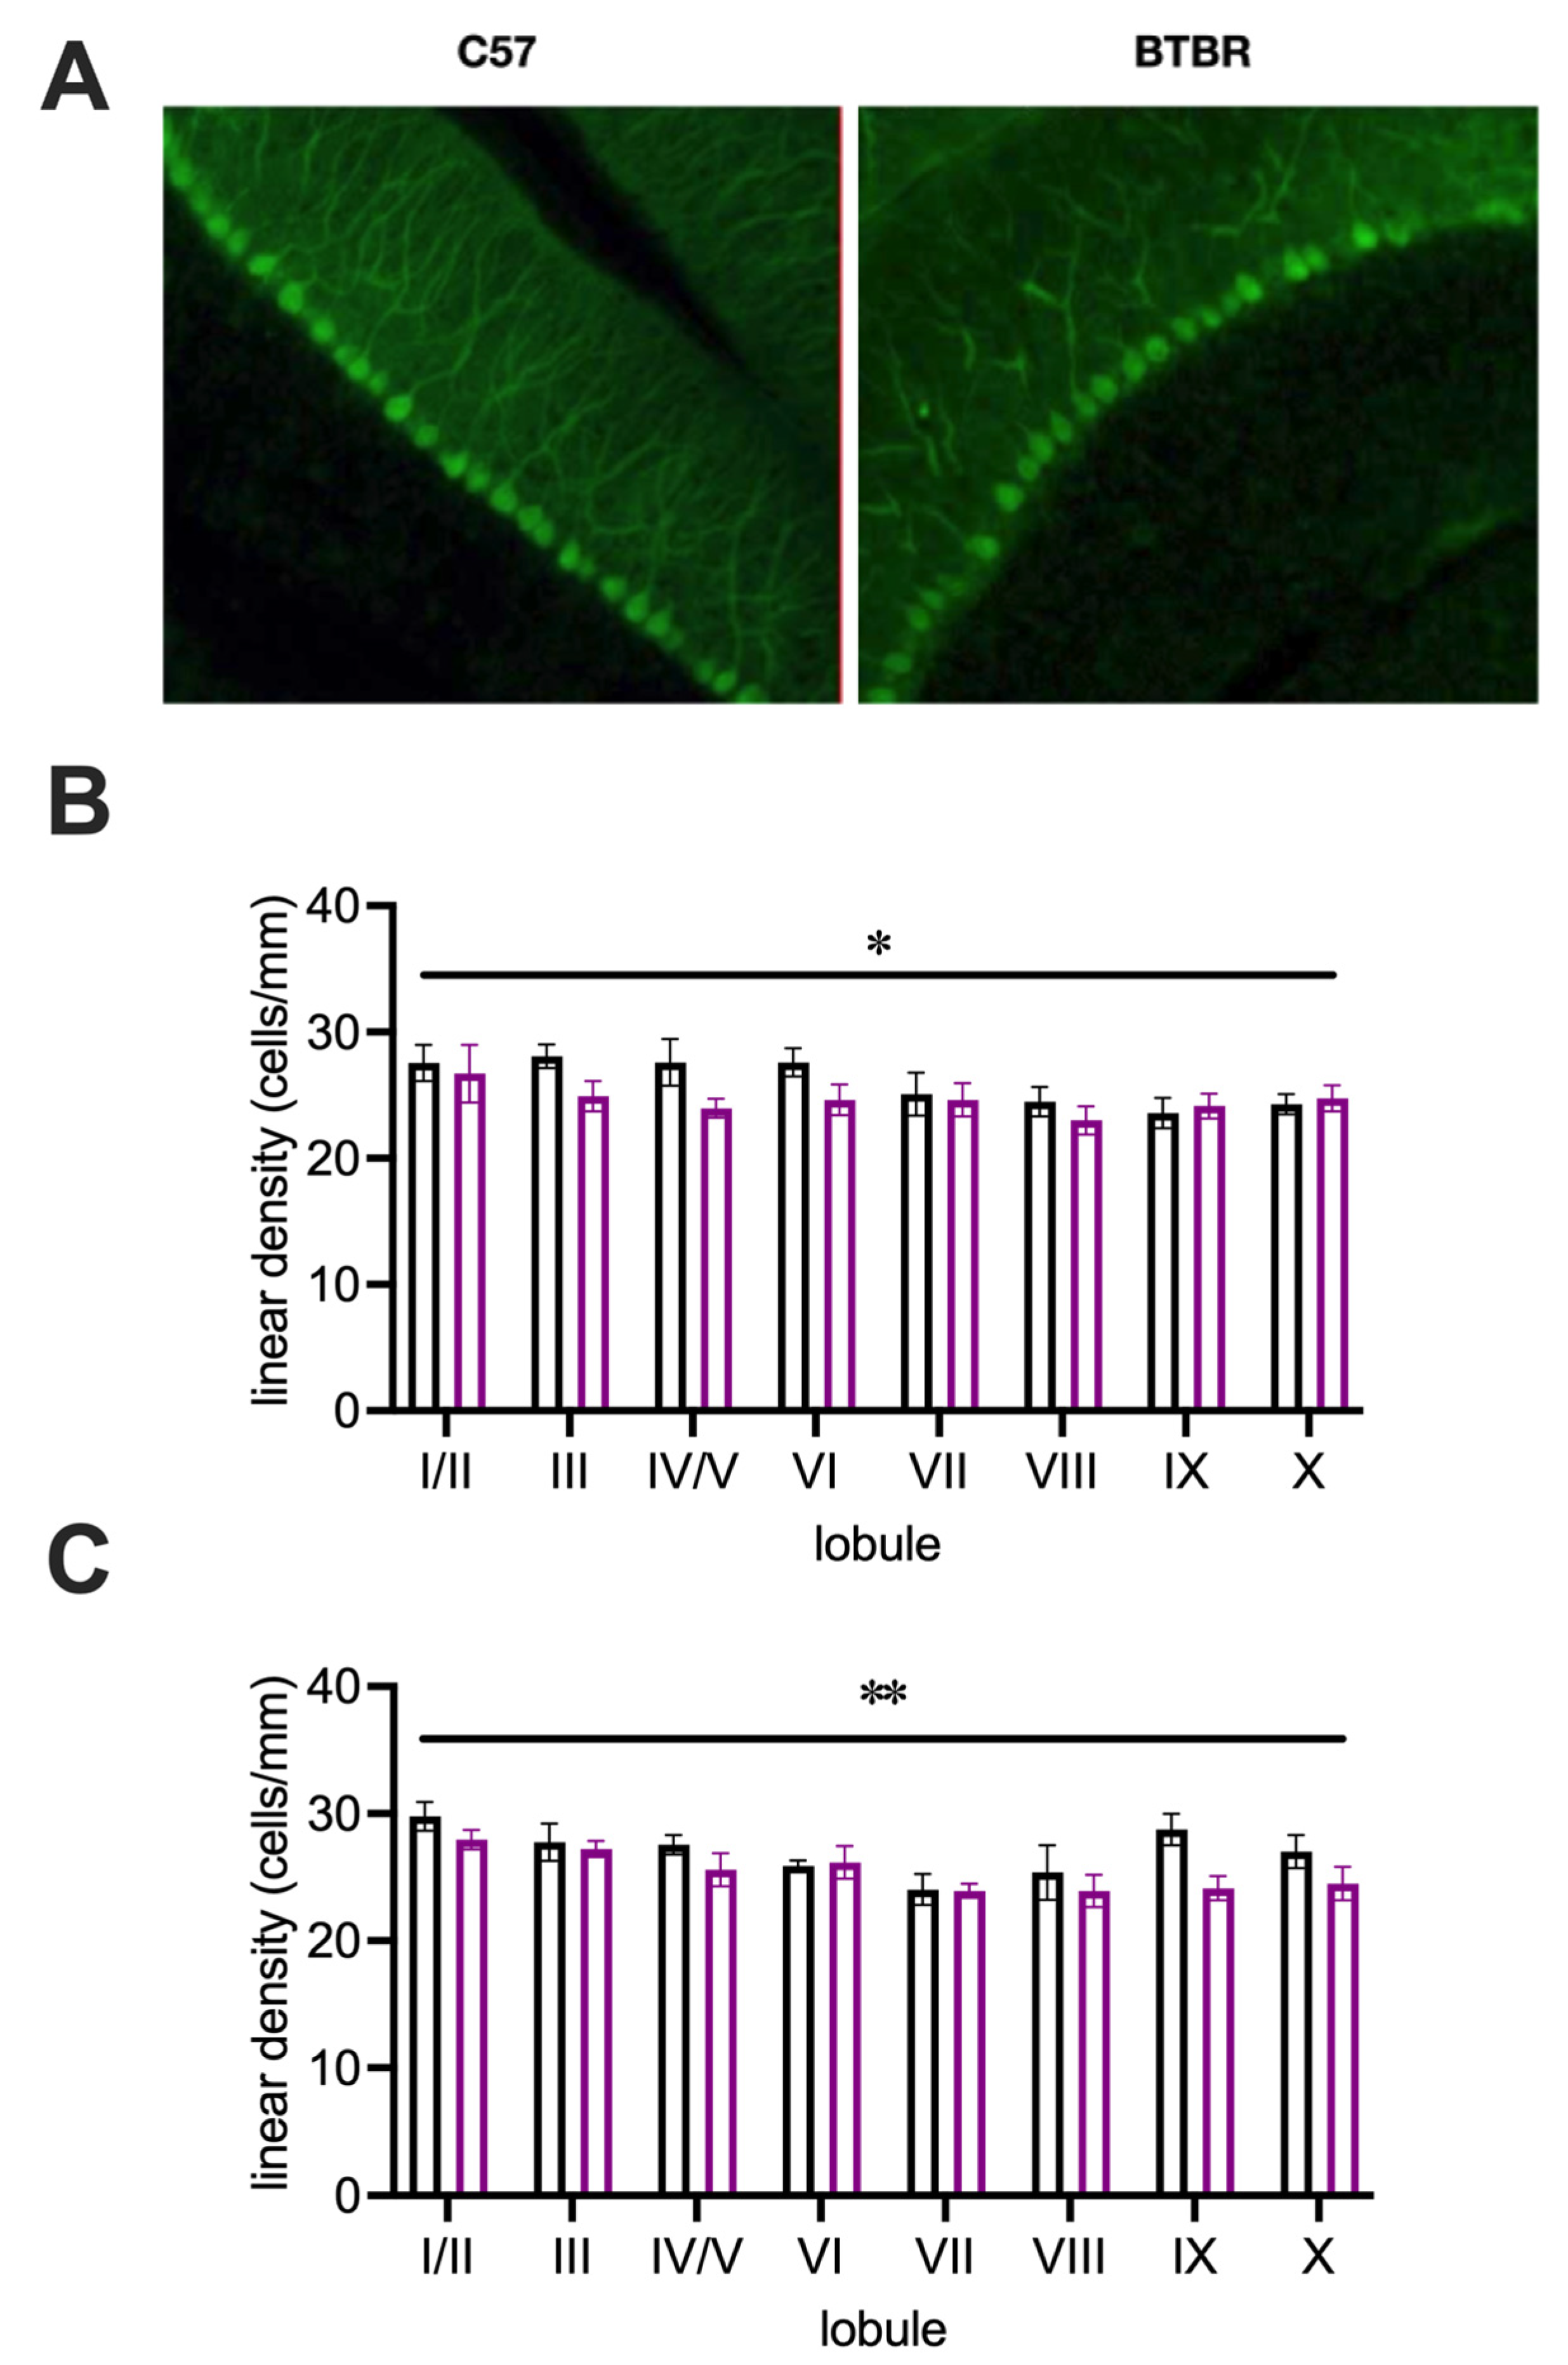
| Purkinje cell density (Figure 4B,C) | 8 | 7 | 6 | 6 |
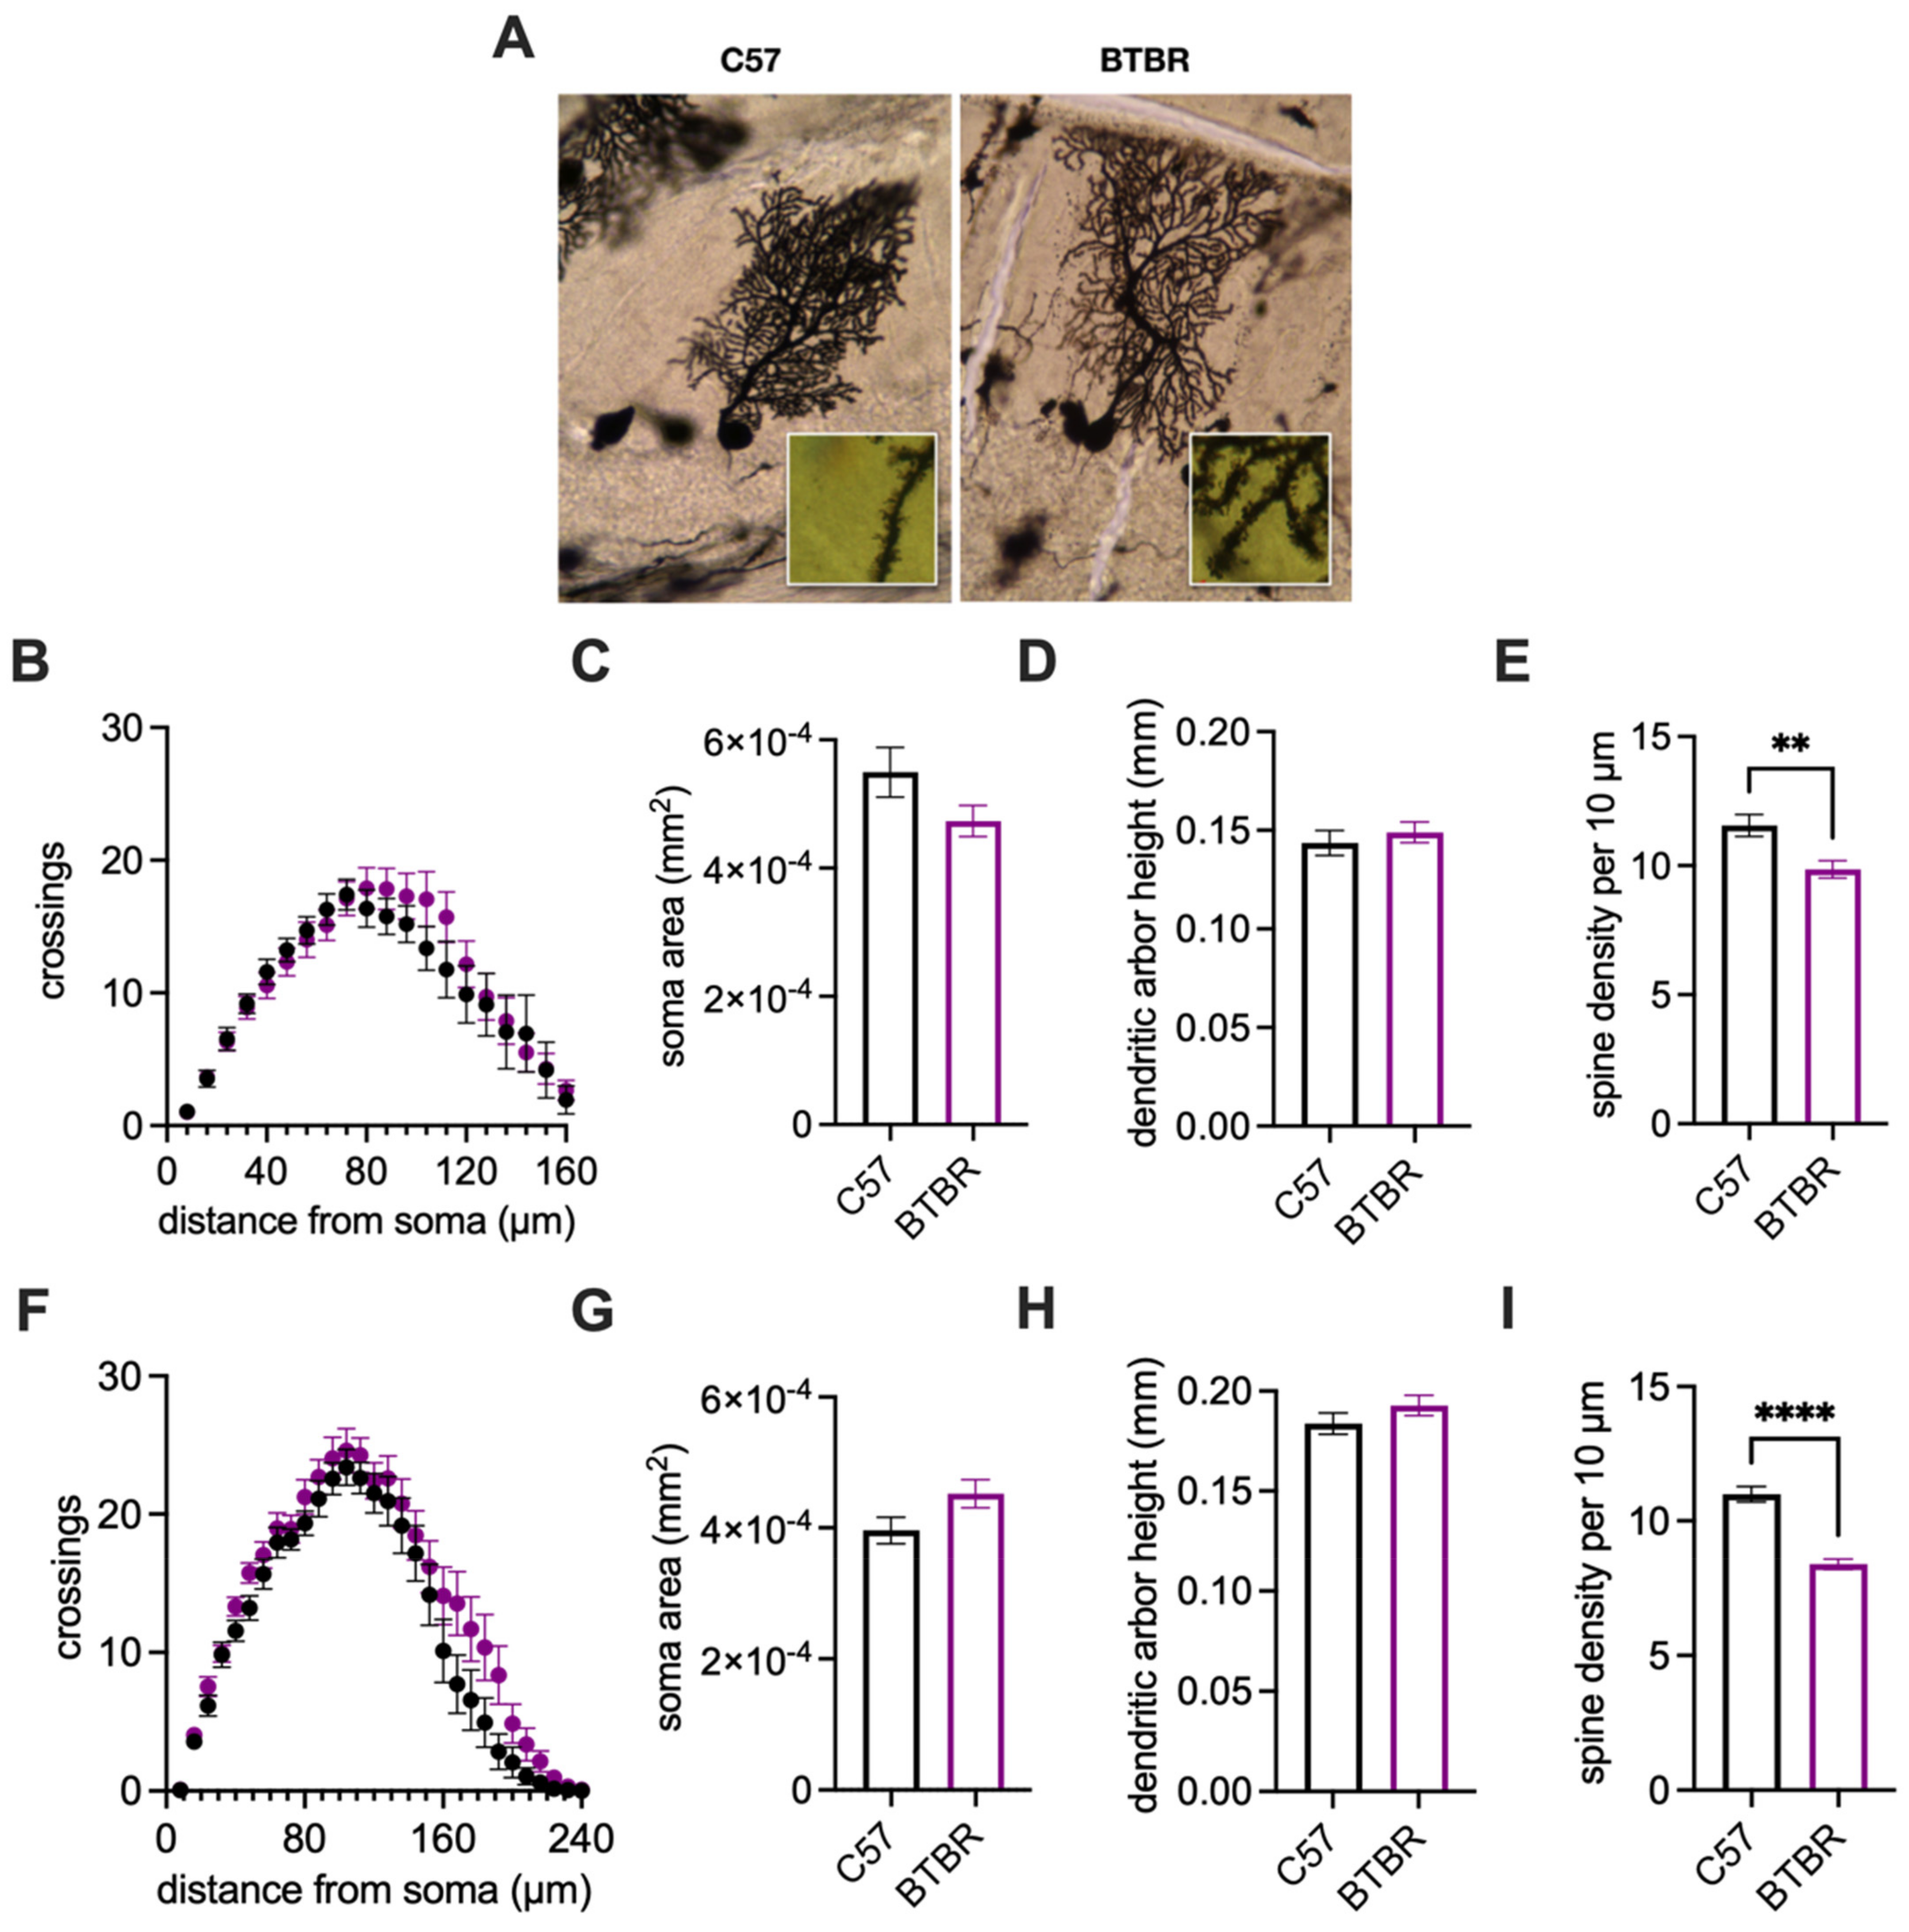
| Golgi–Cox Purkinje cell analysis (Figure 5B–D,F–H) * | 18/6 | 20/7 | 18/5 | 22/6 |
| Golgi–Cox Spine density analysis (Figure 5E,I) * | 27/10 | 25/10 | 15/6 | 15/5 |
Publisher’s Note: MDPI stays neutral with regard to jurisdictional claims in published maps and institutional affiliations. |
© 2022 by the authors. Licensee MDPI, Basel, Switzerland. This article is an open access article distributed under the terms and conditions of the Creative Commons Attribution (CC BY) license (https://creativecommons.org/licenses/by/4.0/).
Share and Cite
Kiffmeyer, E.A.; Cosgrove, J.A.; Siganos, J.K.; Bien, H.E.; Vipond, J.E.; Vogt, K.R.; Kloth, A.D. Deficits in Cerebellum-Dependent Learning and Cerebellar Morphology in Male and Female BTBR Autism Model Mice. NeuroSci 2022, 3, 624-644. https://doi.org/10.3390/neurosci3040045
Kiffmeyer EA, Cosgrove JA, Siganos JK, Bien HE, Vipond JE, Vogt KR, Kloth AD. Deficits in Cerebellum-Dependent Learning and Cerebellar Morphology in Male and Female BTBR Autism Model Mice. NeuroSci. 2022; 3(4):624-644. https://doi.org/10.3390/neurosci3040045
Chicago/Turabian StyleKiffmeyer, Elizabeth A., Jameson A. Cosgrove, Jenna K. Siganos, Heidi E. Bien, Jade E. Vipond, Karisa R. Vogt, and Alexander D. Kloth. 2022. "Deficits in Cerebellum-Dependent Learning and Cerebellar Morphology in Male and Female BTBR Autism Model Mice" NeuroSci 3, no. 4: 624-644. https://doi.org/10.3390/neurosci3040045