Article

Metal Oxide Electrospun Nanofibrous Membranes for Effective Dye Degradation and Sustainable Photocatalysis

by
Veluru Jagadeesh Babu
1,*,
Syed Sulthan Alaudeen Abdul Haroon Rashid
1,2,
Subramanian Sundarrajan
1,* and
Seeram Ramakrishna
1
1
NUS Centre for Nanotechnology and Sustainability, Department of Mechanical Engineering, National University of Singapore, Singapore 117581, Singapore
2
Centre for Advanced Materials and Industrial Chemistry (CAMIC), School of Science, RMIT University, GPO Box 2476, Melbourne, VIC 3001, Australia
*
Authors to whom correspondence should be addressed.
Sustain. Chem. 2023, 4(1), 26-37; https://doi.org/10.3390/suschem4010003
Submission received: 27 June 2022 / Revised: 7 December 2022 / Accepted: 22 December 2022 / Published: 3 January 2023

Abstract

:
The fabrication of metal oxide nanofibers using (titanium (IV) isopropoxide) and (tin (IV) tert-butoxide) of weight ratio 1:1 precursor in presence of poly (vinyl pyrrolidone) as a binder using a well-known electrospinning technique is reported. The average diameter of TiO2, SnO2, and composite TiO2-SnO2 nanofibers were found to be in the range 75–110 nm. The nanofibers were characterized using thermogravimetric analysis (TGA) to understand the polymer evaporation temperature and further analyzed using scanning electron microscopy (SEM) to study the morphology of the nanofibers. The oxidation states of titanium (Ti) and tin (Sn) ions were analyzed using X-ray photoelectron spectroscopy (XPS), indicating that the TiO2 undergoes a change even after loading SnO2. The photocatalytic efficiency of the composite TiO2-SnO2 fibers was investigated to study the degradation capabilities under ultraviolet (UV) light towards industrial polluting dyes such as Alcian Blue, Alizarin Red S, Bilirubin, Brilliant Blue, Bromophenol Blue, and Rhodamine B ITC. Rhodamine B showed a significant degradation rate of about 0.0064 min−1 in comparison to the other dyes.

1. Introduction

Nanostructured metal oxides such as TiO2, SnO2, and ZnO have been widely used in various applications such as sensors, photocatalysis, photovoltaics, and other photoelectric devices [1,2,3,4,5,6,7,8,9,10]. TiO2 and SnO2 are wide band-gap semiconductors that are limited to a small fraction of absorption from the solar spectrum. Various modifications such as doping and surface nitridation were carried out into TiO2 nanofibers (NFs) by electrospinning techniques [1,2,3]. The doping of these ions onto TiO2 has extended the photoresponse of TiO2 to the visible region. Zhang et al. doped vanadium ions into TiO2 NFs which were found to be of anatase phase and incorporated as V4+ or V5+ ions into the crystal lattice of TiO2 NFs. The vanadium-doped TiO2 NFs showed absorption in the visible light region and a higher photodegradation activity towards methylene blue (MB) than undoped TiO2 [11]. Similarly, the Bi-doped TiO2 NFs showed absorption in the visible light region and exhibited an enhanced photodegradation (88.8%) of Rhodamine B, which is due to the photosensitization effect [12]. Surface nitridation treatment using NH3 was reported for TiO2 NFs by L. Li et al., which showed extended visible-light absorption, and the photocatalytic activity of these NFs were found to be 12 times than that of pure TiO2 NFs for the degradation of methylene blue [13]. TiO2 nanoparticles (NPs) were coated onto graphene/carbon composite NFs (CCNFs), which showed enhanced photodegradation behavior towards methylene blue (MB) under visible light irradiation. Graphene acted as an electron acceptor and a photosensitizer, that resulted in an increase in the photodegradation rate and reduced electron–hole pair recombination [14].
Further, to narrow the bandgap and enhance their suitability for the applications in the visible region, a composite material could also be used [15]. The doping of wideband semiconductors such as TiO2 with SnO2 is an optimistic method to narrow down the bandgap. Doping of TiO2 with SnO2 could enhance the active surface area, which is possible due to the intermixing of electronic density states, which can trap photoinduced electrons and holes to facilitate reduction-oxidation-based catalytic effects [16,17]. SnO2 has a comparable bandgap of about 3.4 to 3.8 eV which makes it a compatible dopant to TiO2 and the structural similarity allows them to form hybrid heterojunctions [18]. From the literature, the composite TiO2-SnO2 heterostructures could exhibit an enhanced photocatalytic efficiency in the degradation of Rhodamine B in comparison to other dyes under UV light irradiation with a complicated experimental setup [19,20]. The bicomponent TiO2/SnO2 NFs was fabricated using a side-by-side dual spinneret approach via electrospinning process. These biocomponent structure showed enhanced charge separation of generated electrons and holes (that helps to participate in the overall photocatalytic reaction) and thereby effectively improved the photocatalytic degradation of Rhodamine B when compared to pure TiO2 [21]. Similarly, several authors have reported on a combination of TiO2 and/or SnO2 with other metal oxide nano- structures of having matching band gaps, to cite a few: TiO2/CdO [22], TiO2/SiO2 [23] ZnO/SnO2 NF [24], and N-doped ZnO-SnO2 [25].
In recent years, apart from metal oxides and conventional dye adsorbents such as activated charcoal, electrospun polymer fibers have also been widely studied for their interesting thermal and chemical properties and for applications to adsorb the volatile organic contaminants [26,27,28,29] in air and dyes in water. In this study, inexpensive, simple, and non-toxic composite TiO2-SnO2 nanofibers were prepared using electrospinning under ambient experimental conditions. The materials obtained could be an efficient alternative/solution for multiple applications, as they exhibited good photocatalytic activity. Alcian Blue, Alizarin Red S, Bilirubin, Brilliant Blue, Bromophenol Blue, and Rhodamine B ITC are the widely used dyes in the textile and paper industry, wherein they possess good solubility and photostability in water as well as in ethanol. However, toxicity is the main issue that limits the widespread use of these dyes and causes permanent damage to the environment and health [27]. Hence, a sustainable, efficient, cost-effective, and low environmental impact method is of utmost importance to remove them from the environment as well as to prevent the health damage. Sustainability is very important for both the short term and long term to sustain the eco-system from being damaged and causing harmful effects to humans and animals. The main three pillars of sustainability are economic development, social development, and environmental protection. Thus, this work involves exploring an efficient method to study the photocatalytic properties of the electrospun composite TiO2-SnO2 nanofibers and their degradation of the industrial dyes mentioned above [27,28]. So far, none of the literature available on the comparative study on various dyes, which is reported here. The surface morphology and electronic states of the prepared composite TiO2-SnO2 nanofibers were studied using scanning electron microscope (SEM), and the oxidation states were identified by XPS.

2. Materials and Methods

2.1. Materials

Titanium (IV) isopropoxide (97% Trace metal basis), tin (IV) tert-butoxide (≥99.99% Trace metal basis), poly(vinyl pyrrolidone) (PVP, Mw = 360,000), ethanol (Absolute, ≥99.5%), and acetic acid (≥99.7%) were obtained from Sigma-Aldrich (Steinheim, Germany). All the dyes such as Alcian Blue, Alizarin Red S, Bilirubin, Brilliant Blue, Bromophenol Blue, and Rhodamine B ITC used in this work were obtained from Sigma-Aldrich (Steinheim, Germany). All chemicals were used as obtained without any further purification.

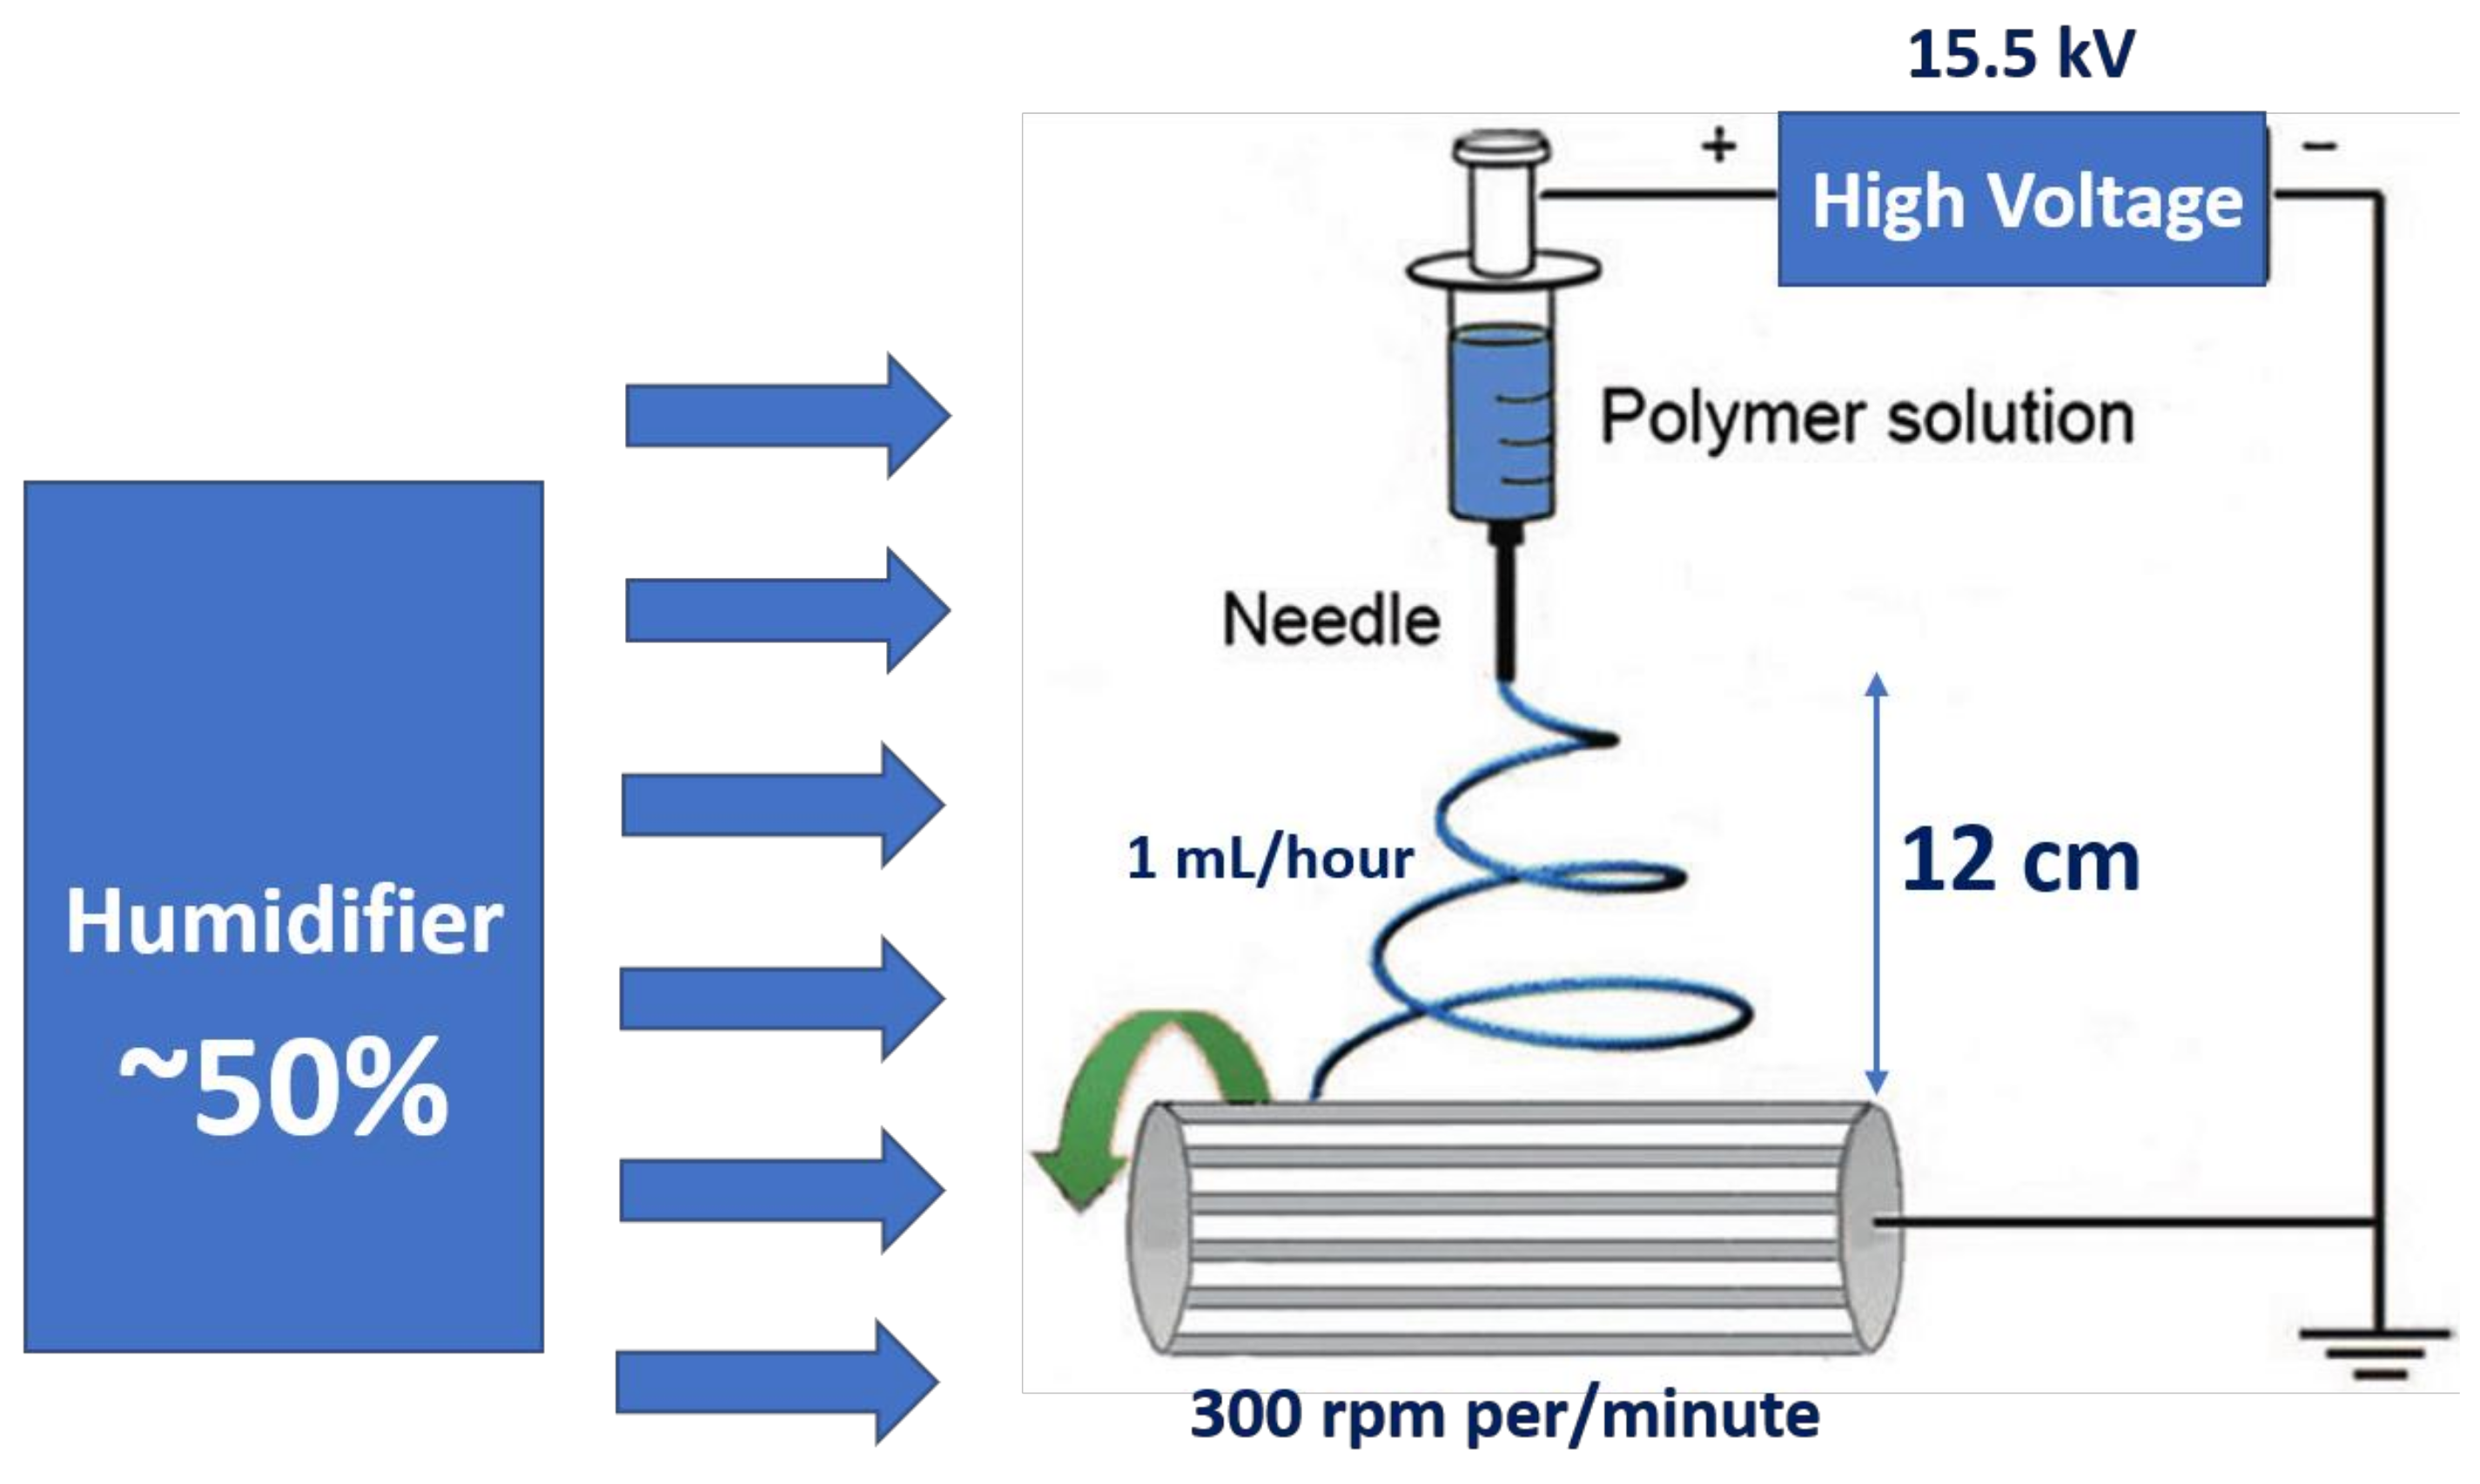
2.2. Methods: Fabrication of Electrospun Nanofiber Membranes

In a typical procedure, 0.284 g of titanium (IV) isopropoxide and 0.411 grams of tin (IV) tert-butoxide are mixed with 10 mL of ethanol and 3 mL of acetic acid and stirred at room temperature for 24 h. Then, the solution is mixed with 1.65 grams of PVP and stirred until the solution turns to sol–gel form. The solution was taken in a 5 mL syringe connected with a needle of having inner diameter of 0.4 mm size. The flow rate of the solution used was 1 mL/hour. A rotating drum at a speed of 300 rpm per/minute is maintained at 12 cm from the electrodes (needle tip and the rotating drum) to collect the electrospun nanofibers. The electrodes are applied with a voltage of 15.5 kV and the humidity of ~50% was maintained inside the electrospinning chamber. Schematic diagram of the preparation TiO2/PVP nanofibers, SnO2/PVP nanofibers, and pure composite TiO2-SnO2 fibers is presented in Figure 1. The as-spun material was collected in the form of a free-standing membrane and was annealed at 575 °C for 3 h with a ramp rate of 5 °C/min in the air atmosphere. It is expected that the continuous fibers will break into different structures during annealing.

2.3. Preparation of Dye Solution

The dye powder of 50 mg is mixed 500 mL of water. Further from the prepared solution, a 5 mL is mixed with 45 mL of distilled water along with 10 grams of the annealed composite TiO2-SnO2 nanofibers and was sonicated for 15 min. All the dyes used for the degradation study such as Alcian Blue, Alizarin Red S mL, Bilirubin, Brilliant Blue, Bromophenol Blue, and Rhodamine B ITC were prepared using the same protocol as mentioned above.

2.4. Characterization

A thermogravimetric analysis (TGA) was carried out using a thermal analyzer (SDT Q600). All the measurements were performed in the air atmosphere with a heating rate of 10 °C·min−1 from room temperature to 700 °C. Surface features of the nanofibers were characterized using a Quanta 200 Scanning Electron Microscope (SEM) instrument from Field Electron and Ion Company (FEI) (Eindhovan, Netherlands) operating voltage between 10–15 kV. The gold coating was performed to increase the conductivity of the samples using JEOL FRC 1200 fine coater (JEOL Ltd., Singapore) before taking SEM images. The java image processing software (Image J1.29 (222 Commands)) was used to measure the fiber diameter. Elemental analysis of the surface was performed by XPS using a Kratos Axis HIS Mono-Al X-ray photoelectron spectrometer (Manchester, UK). The X-ray source was operated at 15 kV, 10 mA, 150 W, the take-off angle of 90° (vertical to sample surface), and the detection depth was not more than 10 nm. The photocatalytic activity of as-prepared samples was measured under UV-light irradiation. In this experiment, 0.5 gm of catalyst was mixed with 50 mL of 20 ppm aqueous dye solution. At room temperature, the reaction mixture was stirred (by using a magnetic stirrer) for half an hour before light irradiation. This was helpful for the formation of adsorption–desorption dye molecules for the equilibrium on the surface of the catalyst. At a specified interval of time (10 min), 5 mL solution was withdrawn, and a quantitative determination of each dye was performed by measuring the intensity of the absorption peak using a UV–Vis spectrophotometer. For ultraviolet-light irradiation, Philips lamp HPL-N (250 W, Singapore) was used as a light source. The UV–Vis spectrophotometer (Shimadzu, Model-UV-3600) was used to measure the absorbance of dye, and it was measured at a wavelength of 464 nm. In each run, distilled water was used for washing the separated photocatalyst.

3. Results and Discussion

3.1. TGA Analysis

The TGA analysis are presented in Figure 2, helps to identify the polymer decomposition temperature. The TGA results demonstrate that the TiO2/PVP nanofibers and the SnO2/PVP nanofibers reached a degradation temperature of 500 °C and continue to saturate with the left-over materials of 29 and 18%, respectively. On the other hand, the composite TiO2-SnO2/PVP composite nanofibers reached a degradation temperature around 300–450 °C and continued to saturate with ample leftover sample of 39% to attain pure composite TiO2-SnO2 fibers. The comparison of these results assures the calcination temperature for these synthesized materials are beyond 500 °C and hence a temperature of 575 °C was chosen.

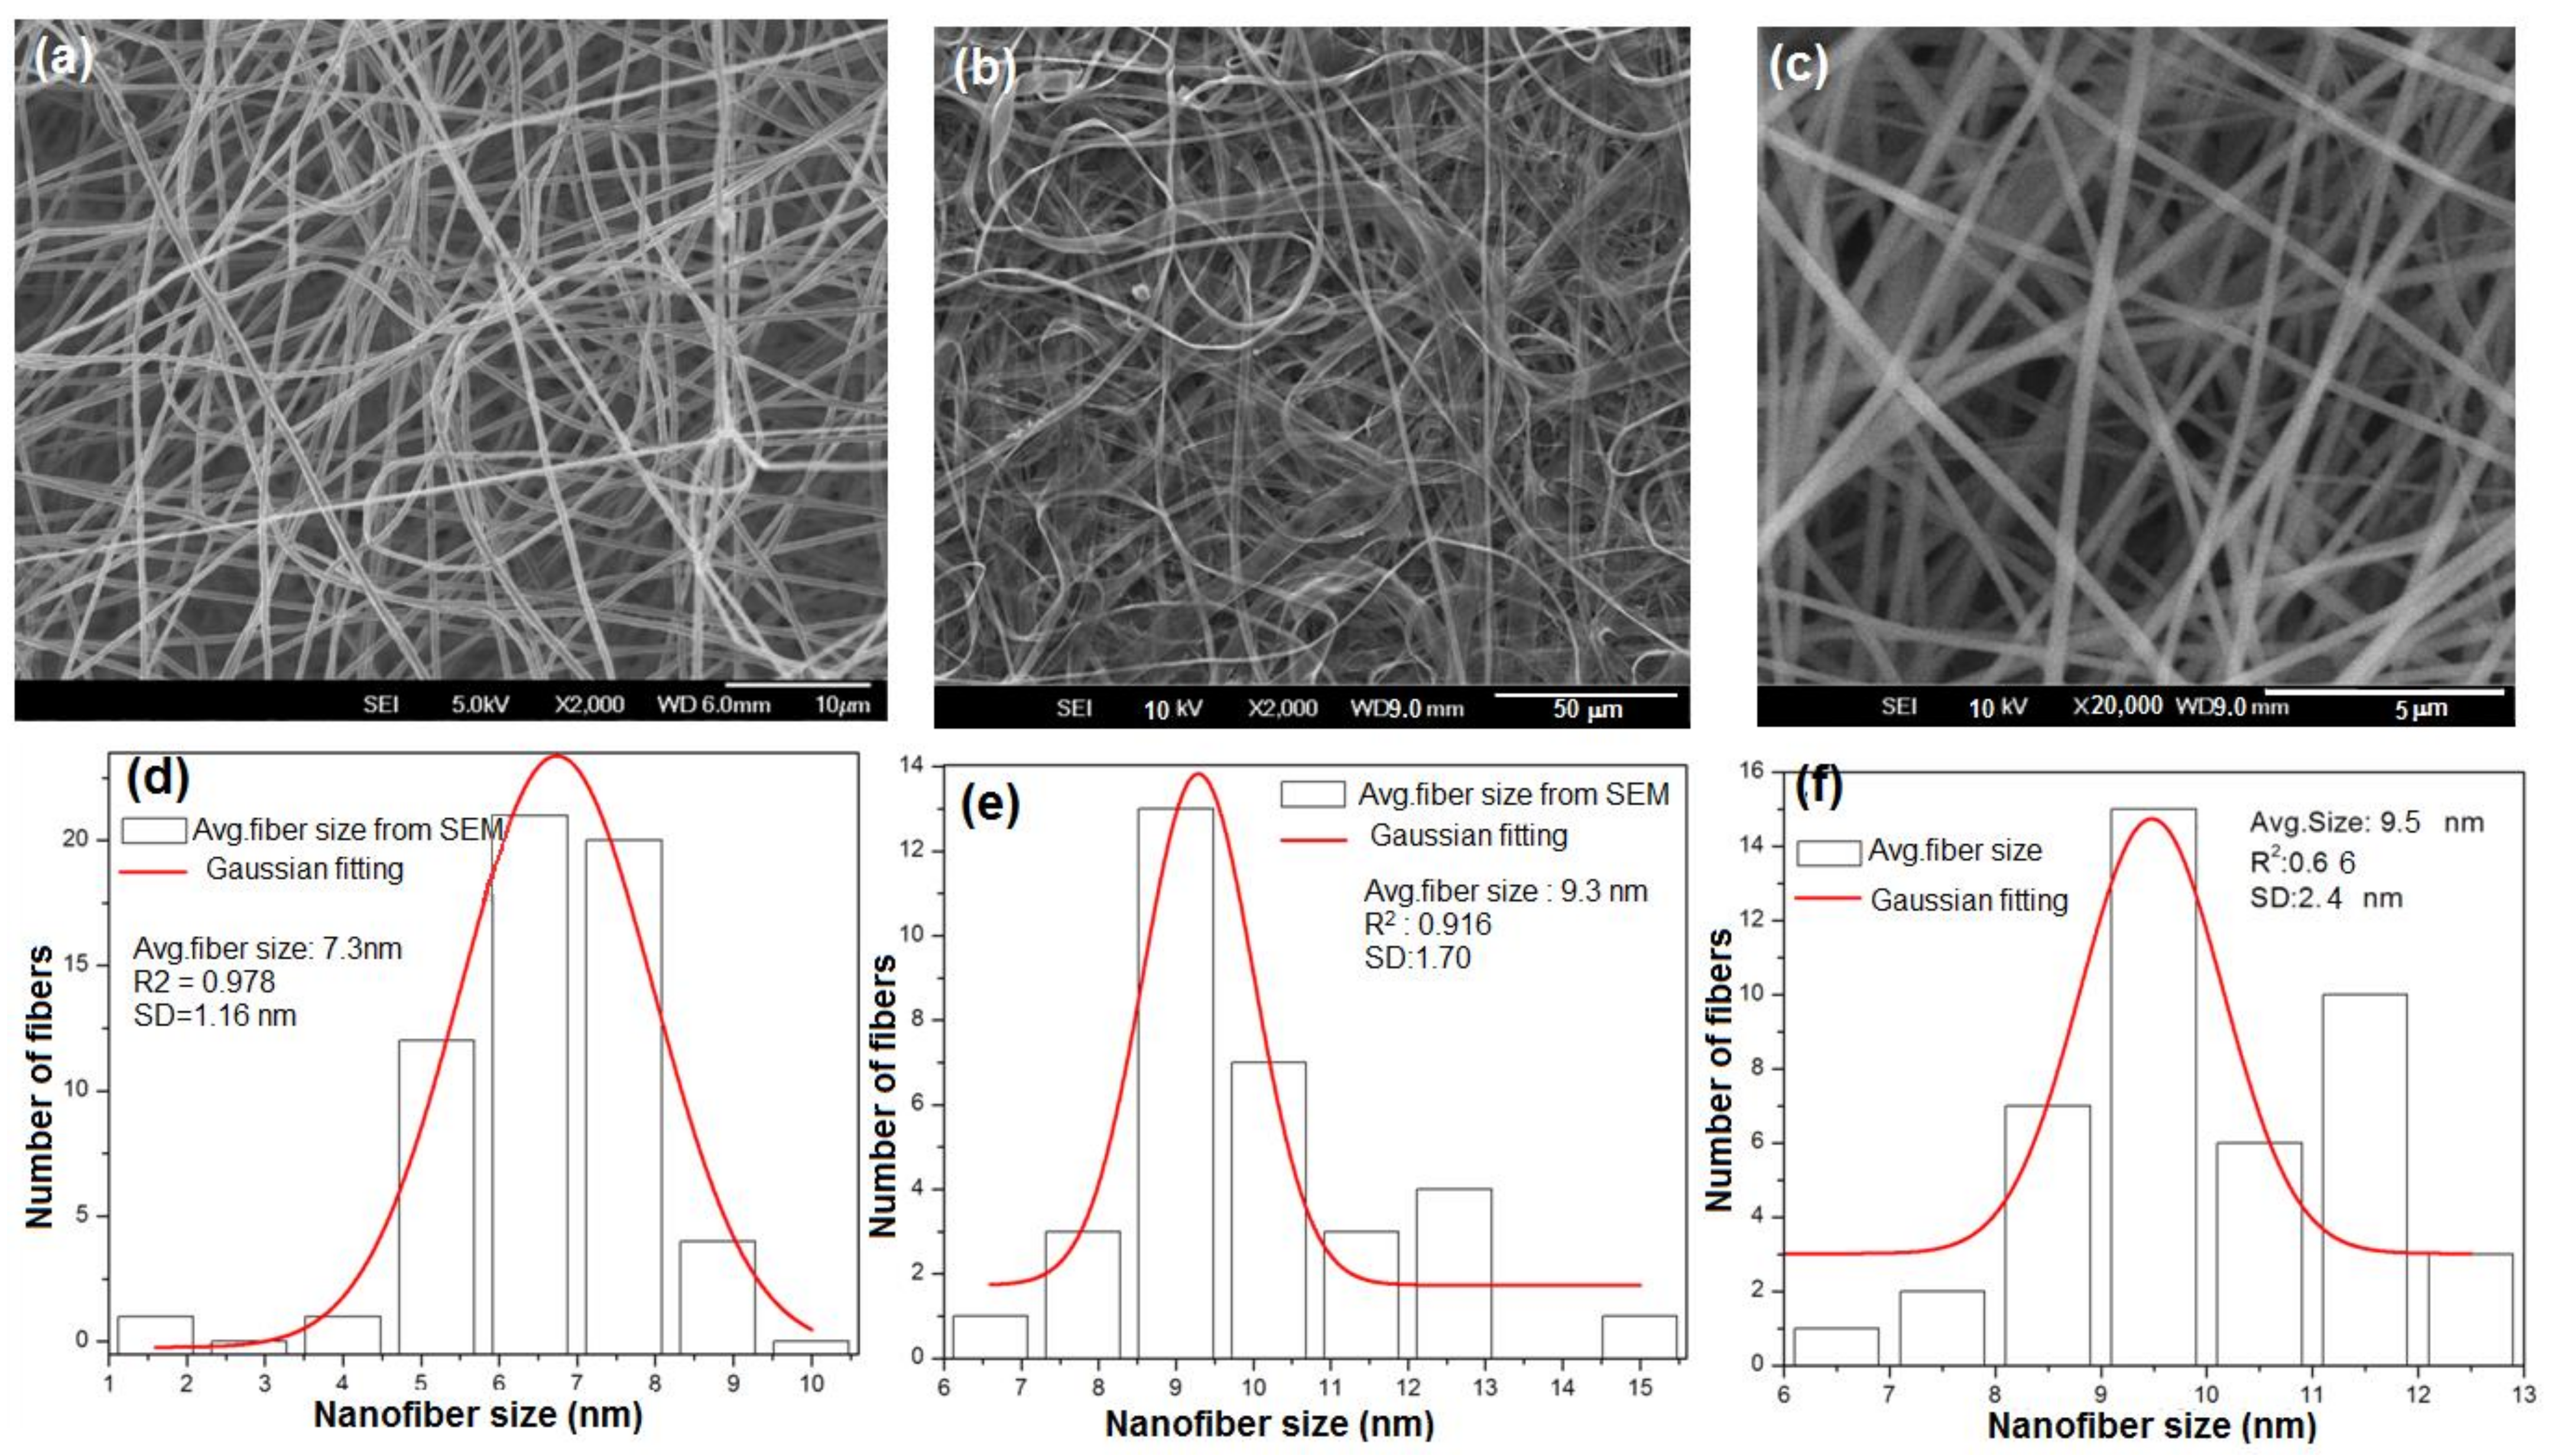
3.2. Surface Morphology of the Nanofibers

The SEM images of the electrospun nanofibers including TiO2 nanofibers, SnO2 nanofibers, and the composite TiO2-SnO2 nanofibers before calcination were smoother, bead-free, and uniform throughout their lengths, which is mainly attributed to the viscosity of the polymer [7,15]. The SEM images after calcination are presented in Figure 3 in which the polymer (PVP) was removed and the fibers of pure metal oxides TiO2 (see Figure 3a), SnO2 (see Figure 3b), and composite TiO2-SnO2 fibers (see Figure 3c) were found. Comparing the morphology of the three electrospun nanofibers, it can be noted that the pure TiO2 and the composite TiO2-SnO2 materials were in fiber form and the SnO2 showed both the fibrous morphology and tube-like structure. The transformation of morphology of SnO2 nanofibers after doping with TiO2 to form the composite TiO2-SnO2, changes to fiber again and the possible mechanism for the transformation in the morphology is discussed in one of our previous studies [1]. While calcinating a composite TiO2-SnO2 the crystallization/dissolution could cause a mechanical stress leading to wrapping which inherently transforms a fiber to a nanofibers shape. The transformation of nanofibers to fiber shape is associated with asymmetrical stress during the thermal treatment, where the excess surface energy results in wrapping or scrolling [30]. This could be the reason for the transformation of the composite TiO2-SnO2 materials to fiber form after doping with TiO2 (see Figure 3c). The average nanofiber diameters (standard deviation values are given as plus or minus) of the as-spun TiO2, SnO2, and TiO2-SnO2 composite fibers were 7.3 ±1.16 nm, 9.3 ± 1.70 nm, and 9.5 ± 2.4 nm, respectively (Figure 3d–f).

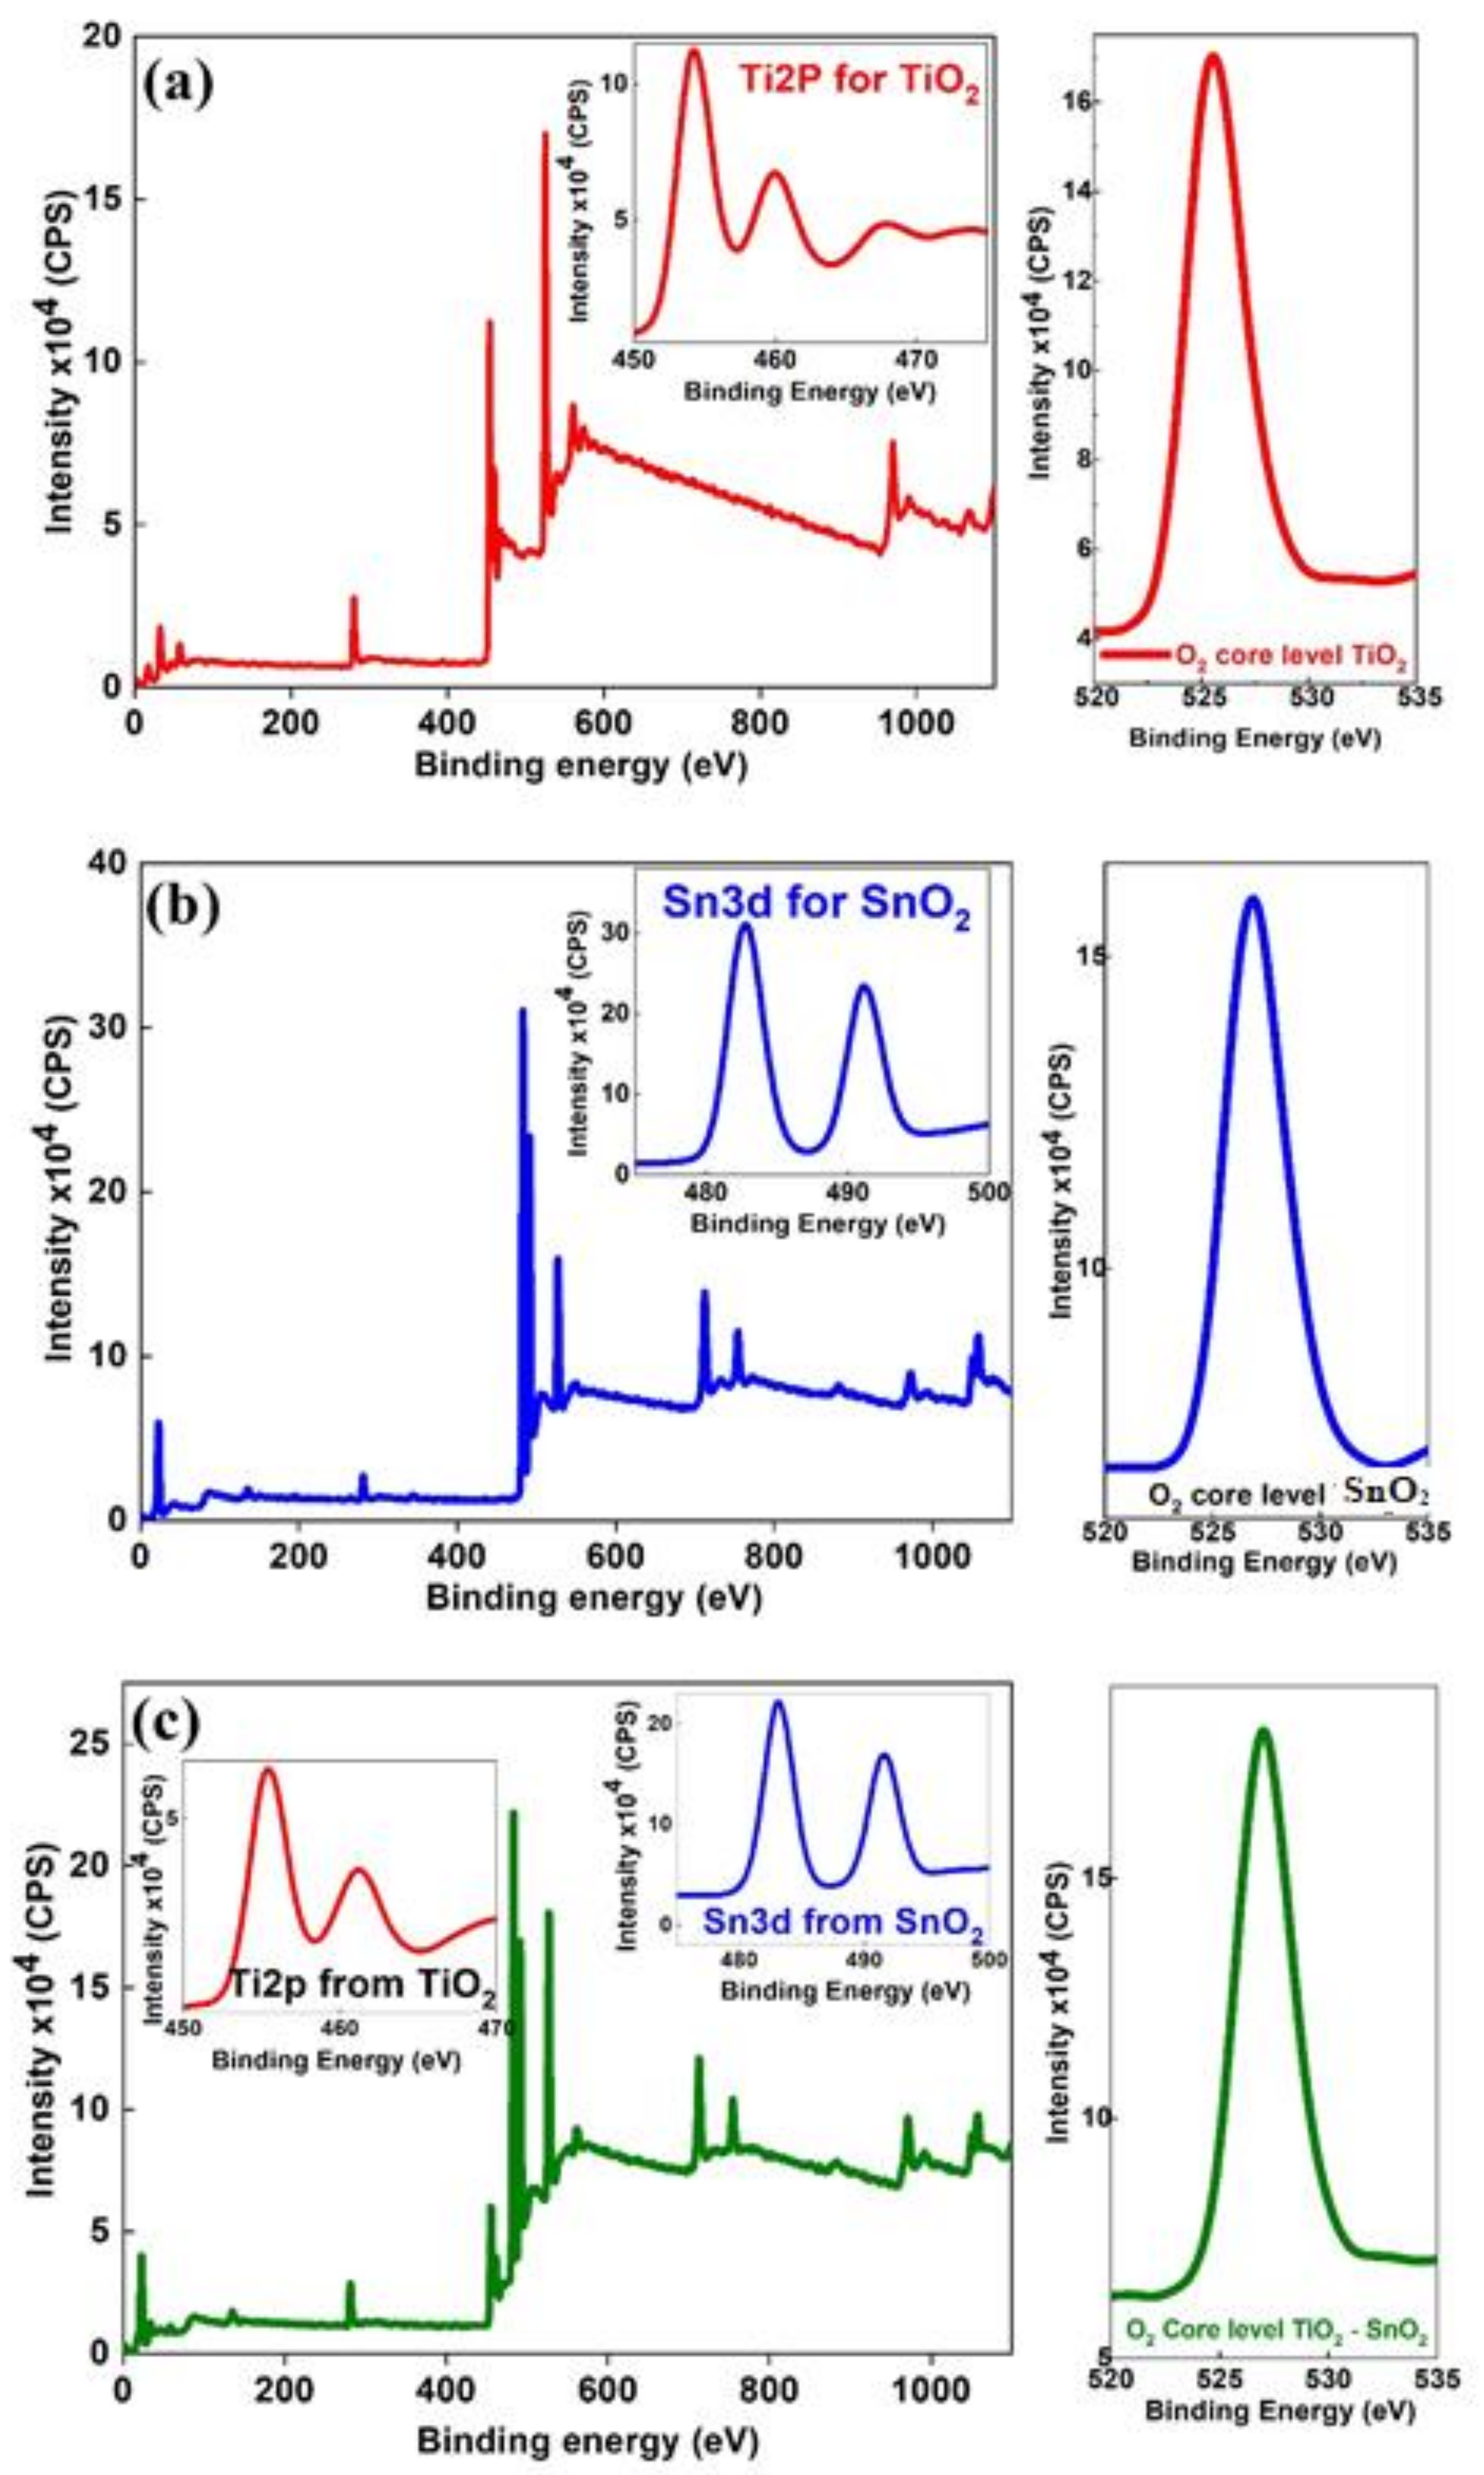
3.3. X-ray Photoelectron Spectroscopy

XPS analysis was performed to identify the chemical states of TiO2, SnO2, and the composite TiO2-SnO2 nanofibers. The Survey spectrum and their individual core levels are presented in their respective spectra in insert image Figure 4. The Ti2p core spectra is presented in the inset of Figure 3a and it comprises of two asymmetrical peaks, i.e., peaks at 454.60 and 459.93 eV are attributable to Ti2p3/2 and Ti2p1/2, respectively, for the TiO2, while the separation between these two peaks (Ti2p3/2 and Ti2p1/2) is about 5.68 eV matching with the standard BE of Ti+4 species. The typical FWHM for each spin-orbit component is also the same, but the Ti2p1/2 component is much broader than the Ti2p3/2 peak. Consequently, the Ti2p1/2 peak is much shorter than expected. A third asymmetrical broad satellite peak is observed at 467.83 eV, and it is 13.28 eV away from Ti2p3/2 peak, which is the characteristic of TiO2 (see Table 1).
Figure 4b represents the survey spectra for Sn 3d and its core-level spectra, composed of Sn3d5/2 (482.81 eV) and Sn3d3/2 (491.18 eV), but there is no change in FWHM values as presented in Table 1 and BE is in close agreement with the literature reported [21]. However, these two peaks are not symmetrical, and they are ascribed to surface-related defects in SnO2. Figure 4c shows the survey spectrum of composite TiO2-SnO2 fibers reveals the oxidation states of Ti and Sn ions. Figure 4c infers that there are three asymmetrical peaks belonging to TiO2 in TiO2-SnO2 like TiO2. However, the peak (Ti2p3/2 and Ti2p1/2) positions are not the same after loading of SnO2. The BE shift of Ti 2p3/2 peak (see Figure 3a) indicates the interaction between TiO2 and SnO2, it confirms the formation of the nanocomposite TiO2-SnO2. This may be due to the encapsulation or oxidation state of Ti+4 in TiO2-SnO2 nanofibers. The second inset of Figure 4c is related to SnO2 after loading TiO2, which ascribes the presence of Sn+4 ions (Sn3d spectrum of) for SnO2, arising from TiO2-SnO2 that is spin-orbit splitting to Sn3d5/2 and Sn3d3/2. The separation between these two peaks is 8.41 eV, indicating that the valance state of Sn is +4.
The O1s core levels also presented in Figure 4a, and it can be observed the O 1s peak at 525.80 eV is attributed to the O2- anions of the crystalline network and it occurred due to the presence of weakly adsorbed species or subsurface low coordinated oxygen ions (O-). The different crystalline structure, crystal size, and surface area of the anatase and rutile components may also affect the adsorption of water molecules and the formation of hydroxyl groups. As shown in Figure 4b, O1s for the SnO2 nanofiber-like structures exhibits a peak at 526.85 eV, which is assigned to oxygen bound to the Sn. Similarly, the O2 core-level for the composite TiO2-SnO2 has a peak at 527.04 eV is ascribed to oxygen (see Figure 4c).

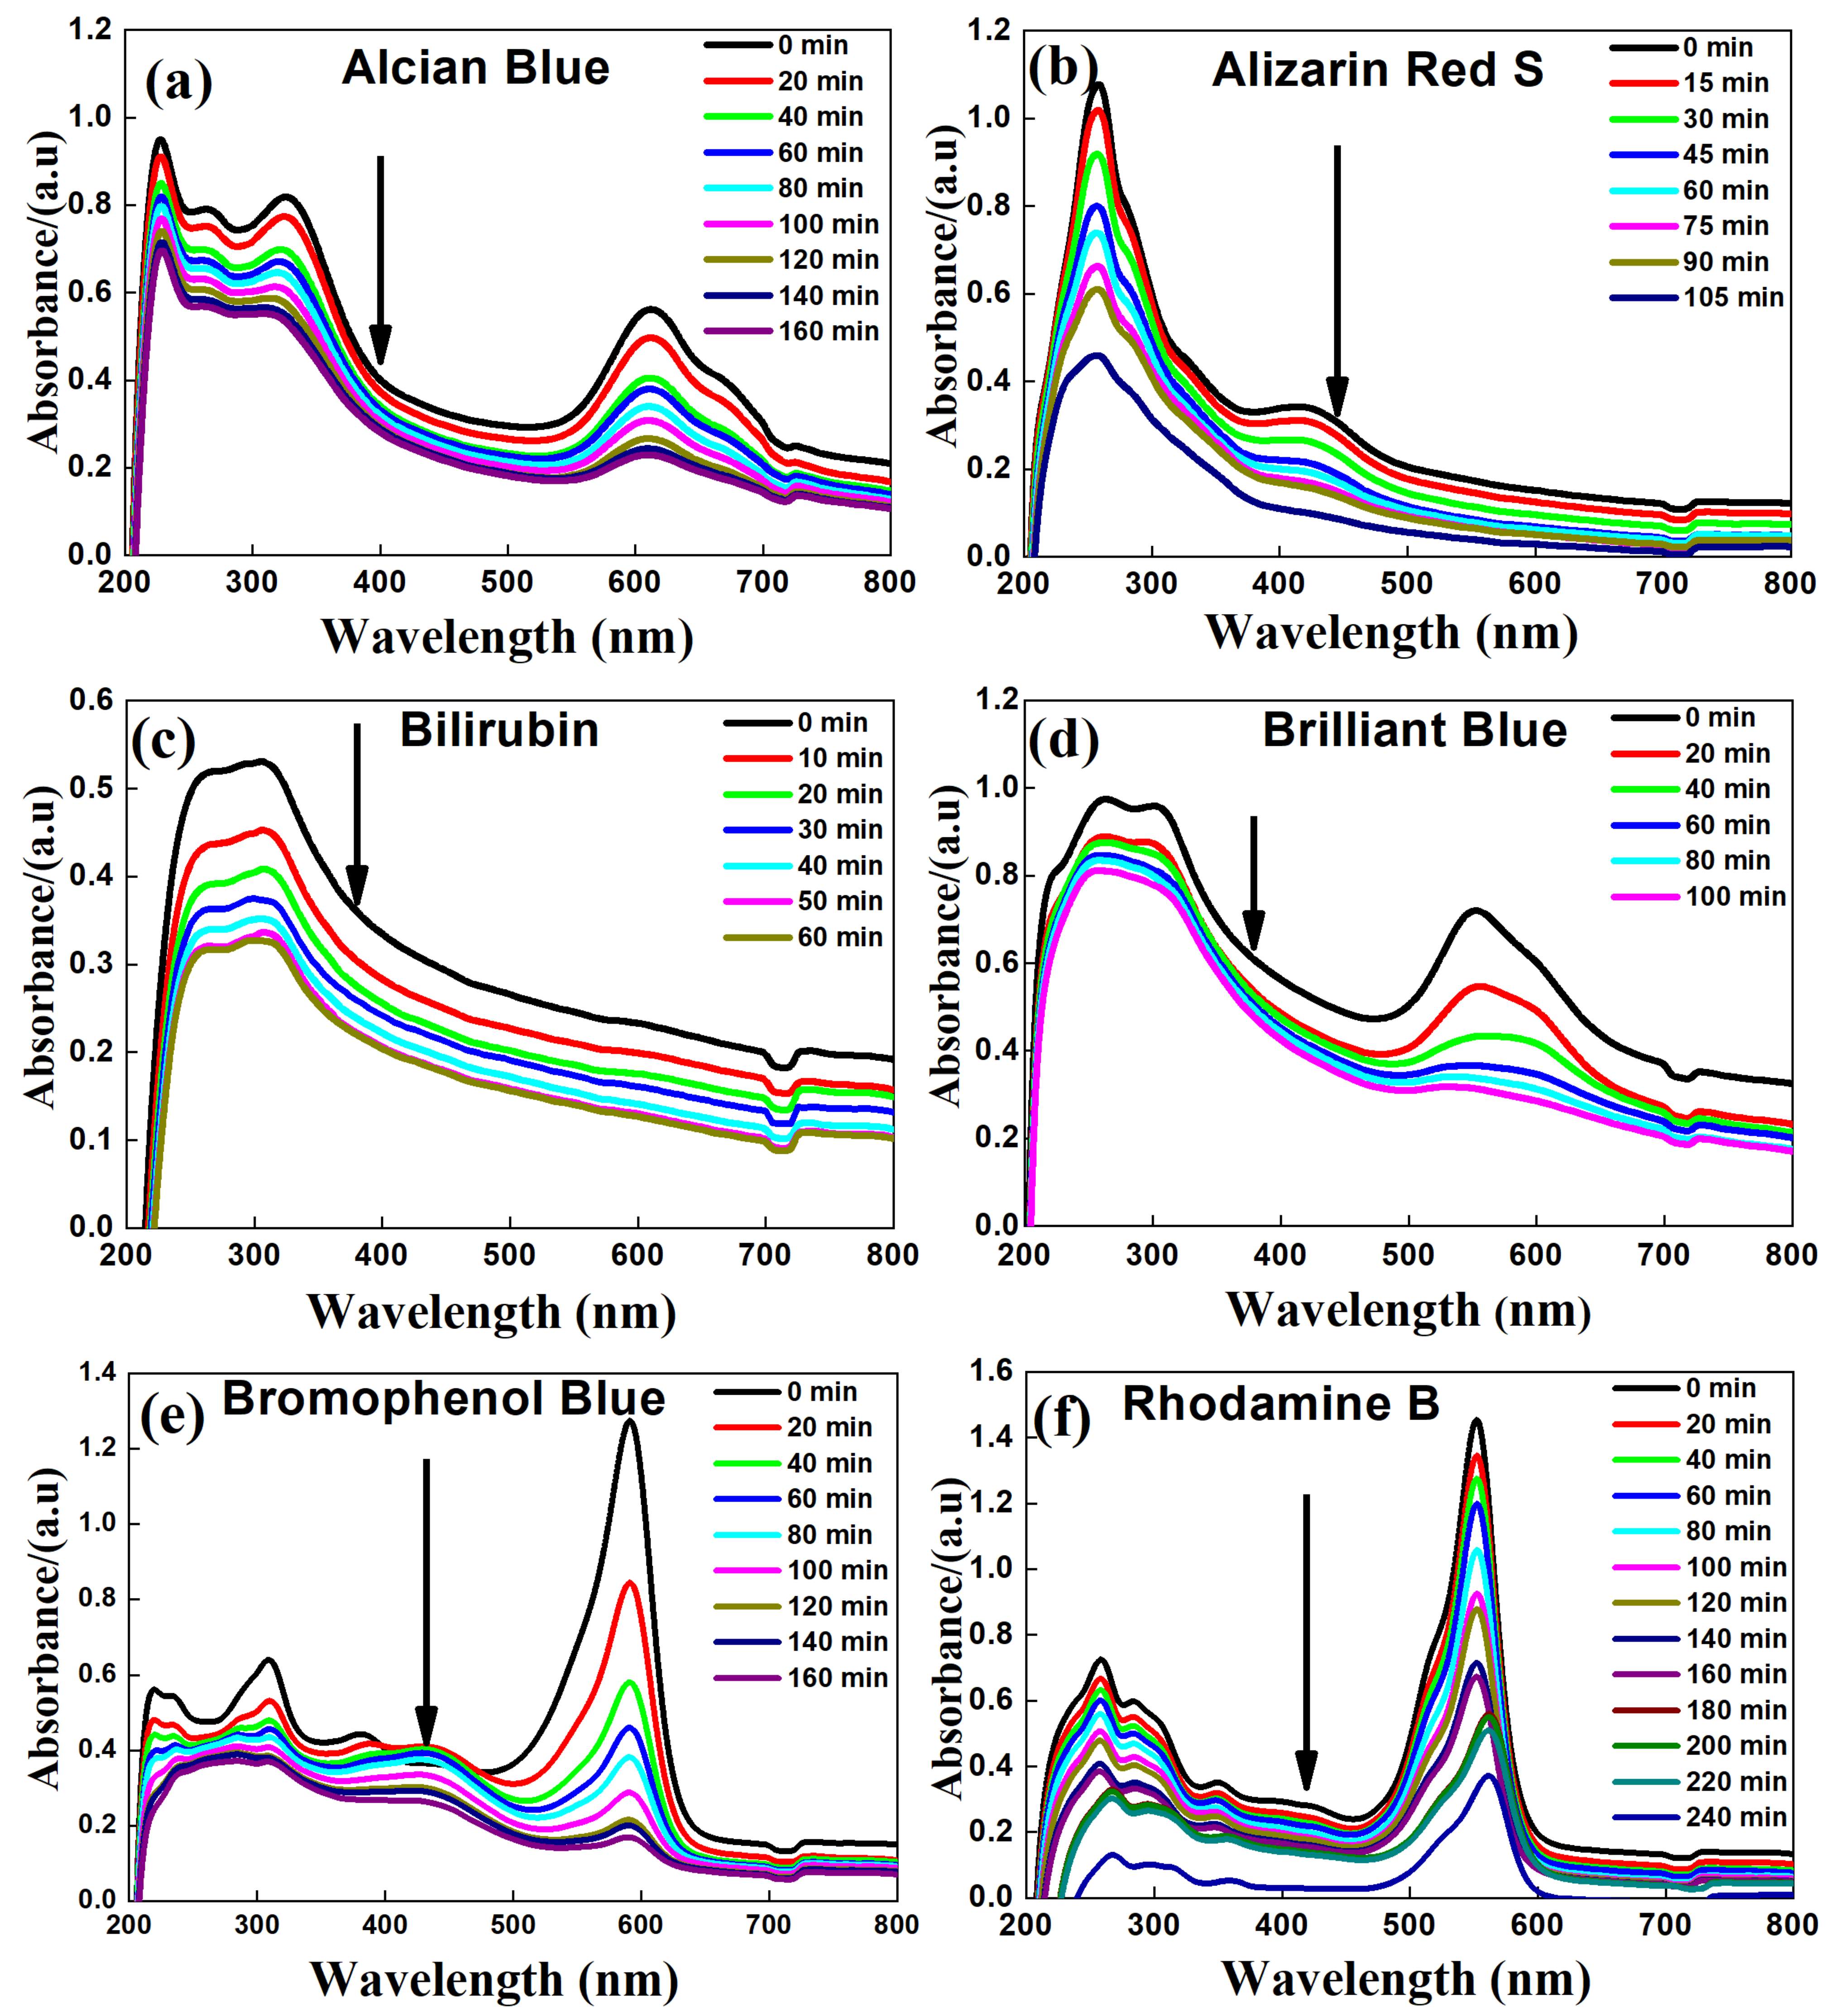
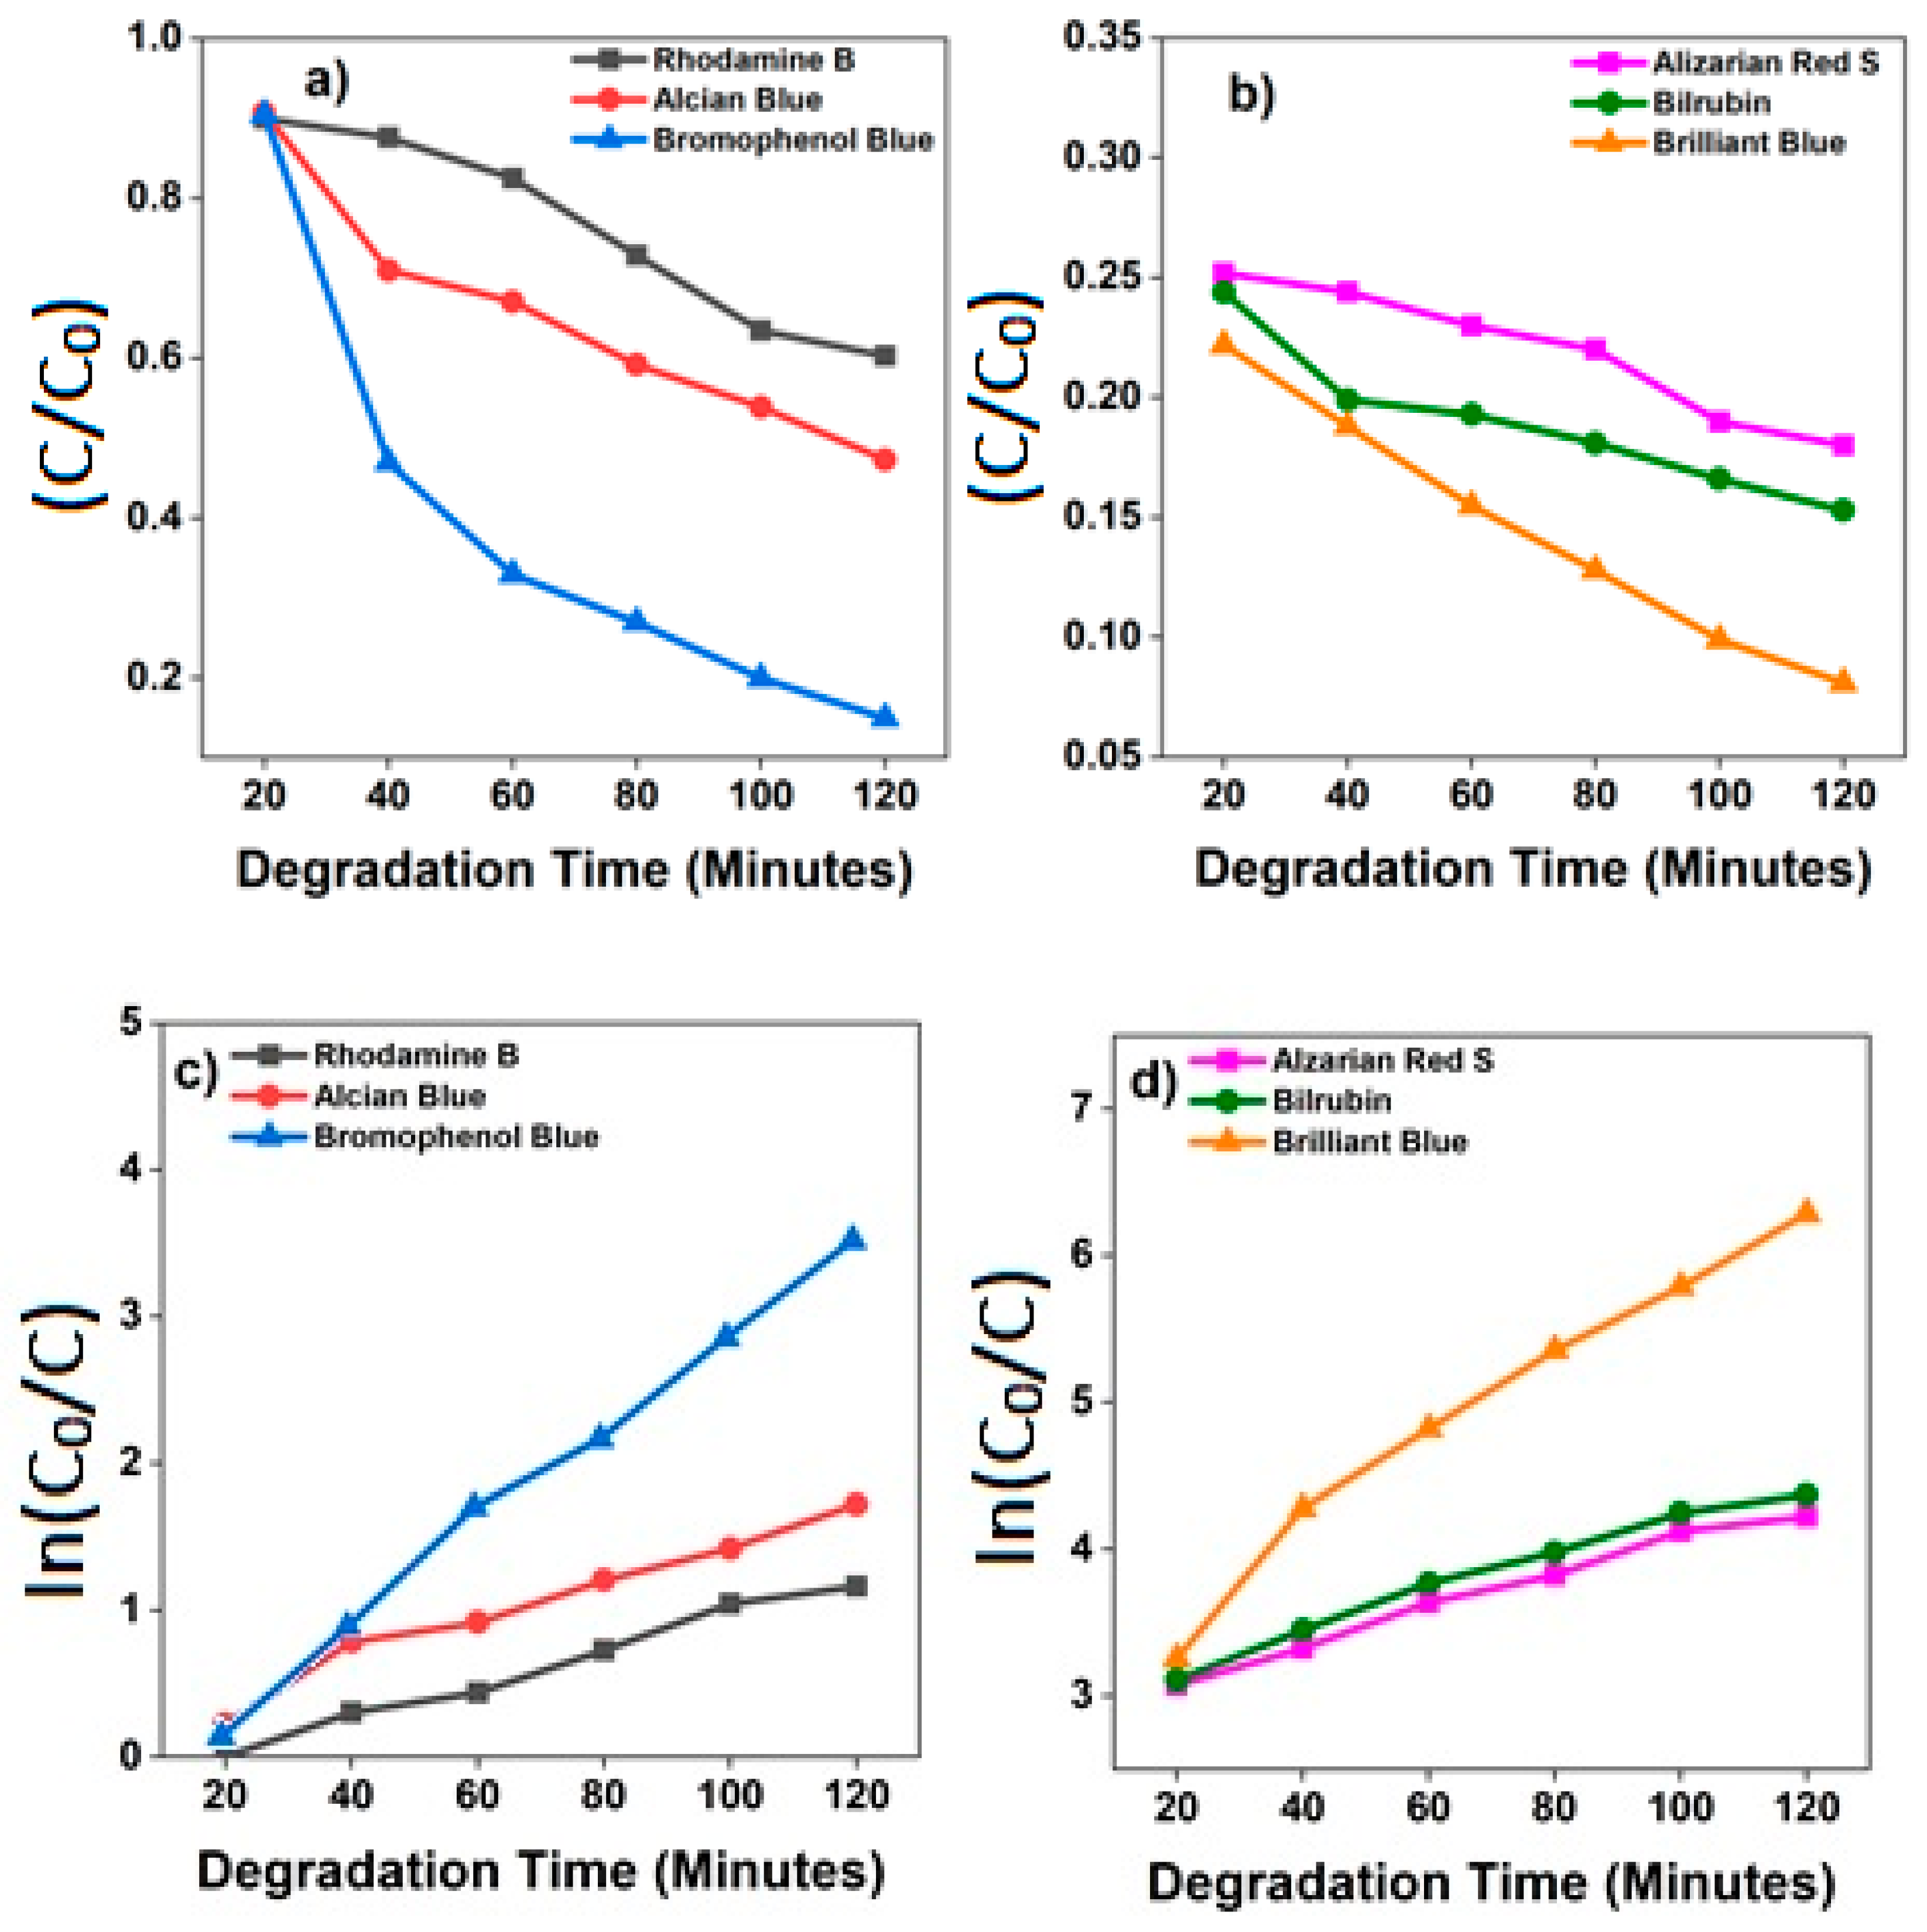
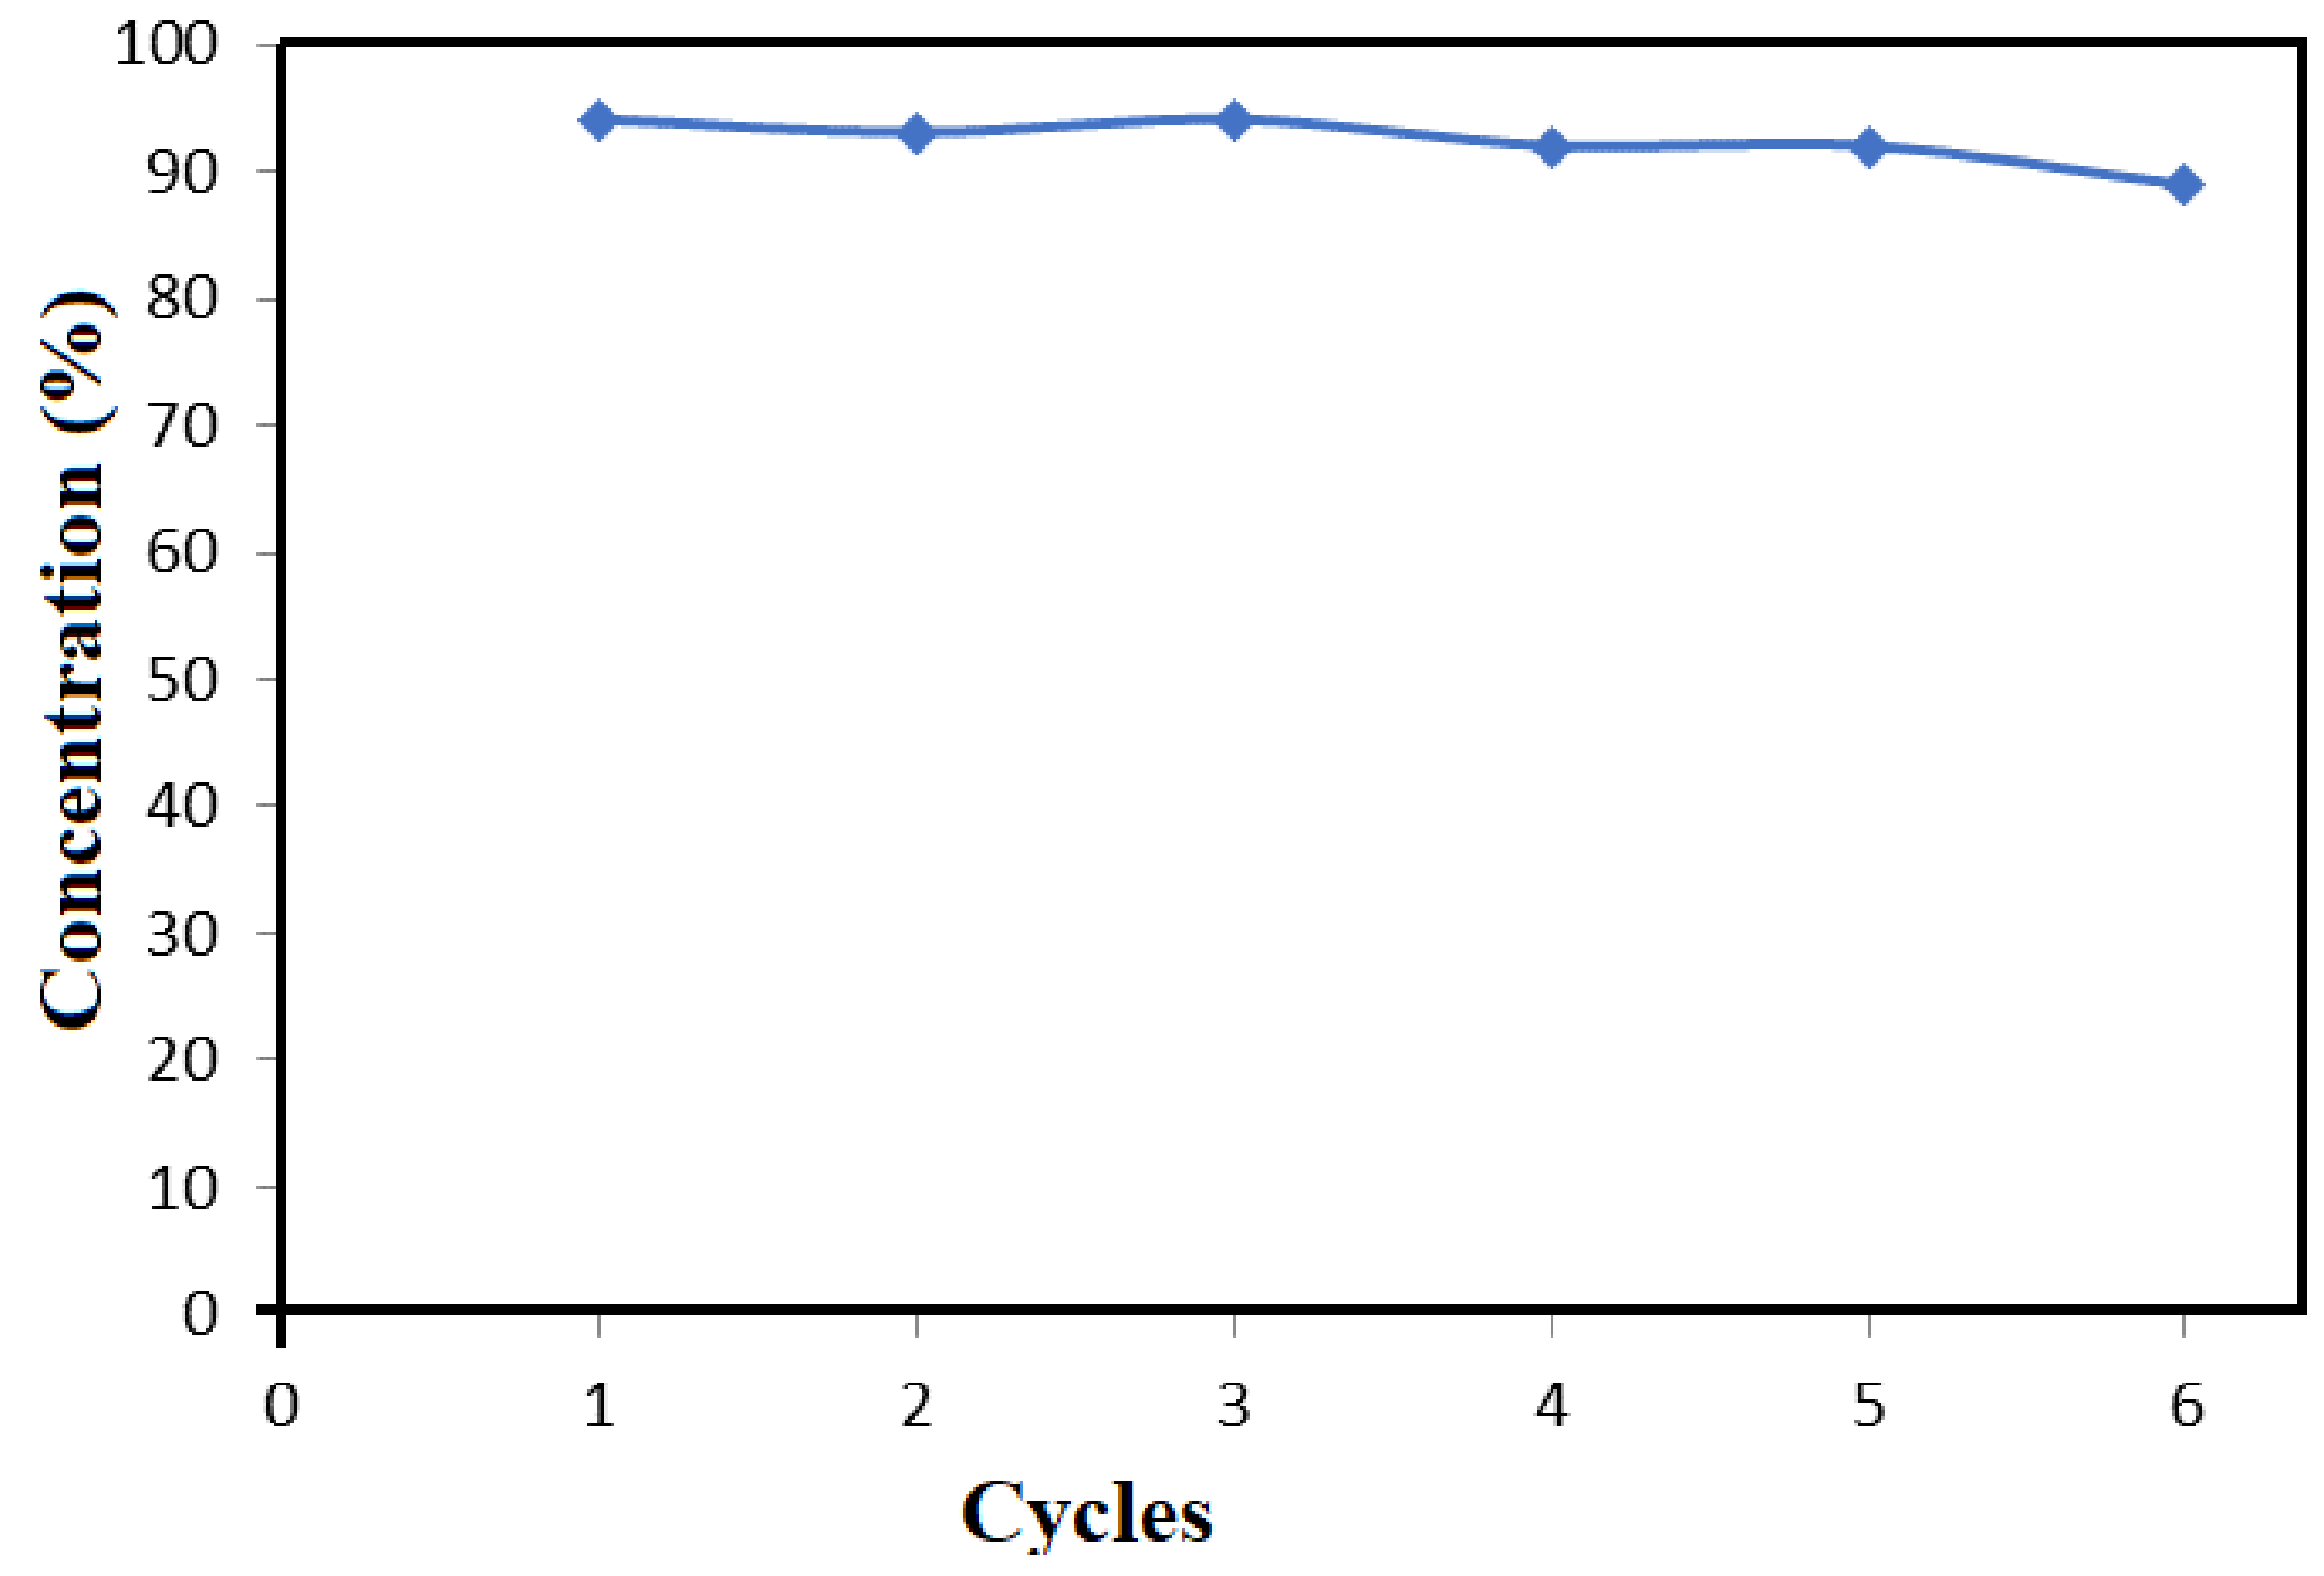
3.4. Dye Degradation and Decolorization

In photocatalysis, metal oxide (MOx) nanofibers were used as sensitizers/catalysts in the presence of light (which induces redox processes) to photodegrade pollutants. In general, MOx upon photo-irradiation with photons of energy (hn ≥ Eg, an electron (eCB) in the valence band (VB) is excited into the conduction band (CB), creating an electron and hole (hVB+) in the valence band. These generated electron–hole pairs are powerful oxidizing and reducing agents (Equations (1) and (5)), which create highly reactive radicals (OHads*, O2*) during photocatalytic reactions (Equations (2)–(4)). These reactive radicals then react with pollutants and degrade them into non-toxic compounds.
MOx + h ν     eCB + hVB +
H 2 O     OH + H +
hVB + + OH aq     OH   aqs *
e CB + O 2     O 2
hVB + + Pollutant     Pollutant *
Pollutant * + ( O 2 ,   OH * )     Degraded   products  
In this study, UV light-assisted (Wavelength ~390 nm) photocatalytic studies were performed on the compositeTiO2-SnO2 nanofibers for different dyes such as Alcian Blue, Alizarin Red S, Bilirubin, Brilliant Blue, Bromophenol Blue, and Rhodamine B ITC. The maximum absorbance of wavelength for corresponding dyes with respect to time was measured and plotted as shown in Figure 5. The spectrum of Alcian Blue, Alizarin Red S, Bilirubin, Brilliant Blue, Bromophenol Blue, Rhodamine B ITC in the UV–Vis region exhibit main bands at 327.7, 420.4, 309.1, 307.8, 310.2, and 349.3 nm, respectively. The absorption values are related to a specific dye in which a decrease in absorption intensity was observed, which is indicative of degradation of the dyes. It was also noticed that the nitrogen double bond (–N=N–) of the azo dyes are the most active sites for degradation of the dyes. This implies that the complete degradation of the dyes (Figure 5a–f) was observed before 3 h (except the Rhodamine B, which was subjected to 4 h of degradation in an optimized condition).
The degradation rate (C0/C, where (C0) is the initial concentration of the dye and (C) is the concentration at a time (t)) of all the dyes with composite TiO2-SnO2 nanofibers-based catalyst was studied for about 3 hours and presented in Figure 6a,b. The degradation rates were identified for Alcian Blue, Alizarin Red S ml, Bilirubin, Brilliant Blue, Bromophenol Blue, and Rhodamine B ITC and found to be 0.0023, 0.0048, 0.0053, 0.0047, 0.0032, and 0.0064 min−1, respectively. From this it can be noticed that the order of dyes degradation is as follows: Alcian Blue, Bromophenol Blue, Bilirubin, Rhodamine B, Brilliant Blue, and Alizarin Red. The degradation of blue dyes is higher when compared to red dyes. It is well known that anionic dyes degrade faster than the cationic dyes, as the surface of the catalyst is positively charged, which could facilitate the easier adsorption of anionic dyes. The electrons produced on the surface of the photocatalyst are effective for the degradation of azo dyes; self-sensitization and decolorization processes were observed by the adsorption of radiation, which causes charges to be transferred from excited state dye molecules to the conduction band, and cationic radicals of dyes molecules will become unstable. In the same manner, the active chemical species formed over the surface of the semiconductor causes the dye molecules to be destabilized.
The first-order rate constants K derived from the plots are shown in Figure 6b and it is inferred that Rhodamine B underwent a catalytic degradation with the aid of composite which made them to exhibit a superior photocatalytic activity in comparison to the other dyes used in the study [31,32].
The average diameters of the fibers are 7.3, 9.3, and 9.5 nm for TiO2, SnO2, and TiO2-SnO2 fibers, respectively (from SEM). The ratio of TiO2 and SnO2 used in this study is about 80% (TiO2) and 20% (SnO2). Considering this ratio 80:20 is the optimum concentration for the dye degradation. To support these results, Deshmukh et al., reported that the crystal sizes of the TiO2 and SnO2 are about 14 and 25 nm [33], respectively. By increasing the SnO2 concentrations in the composite, the crystal sizes were also increased and around 80:20 (TiO2:SnO2) ratio, the band gap of the composite (TiO2-SnO2) decreased and enabled faster dye degradation. In addition to size, surface properties of the composite materials also impact the degradation efficiency. It has been reported already that the effect of pH on degradation efficiency was higher for neutral pH (pH = 7), in comparison with acidic (pH = 4) and alkaline (pH = 10) conditions [34]. In the present work, all the dye’s degradations are very effective which confirms that the solution might have neutral pH conditions.
Figure 7 shows results of the reusability tests for the TiO2-SnO2 composite in the photocatalytic extraction of Brilliant blue dye. As it can be seen from the figure, a high degree of dye removal (94–89%) is observed by the chosen photocatalyst during six cycles wherein reusability slightly decreases by the end of the sixth cycle. The obtained results indicate that good stability and reusability of the tested photocatalyst can be achieved.

4. Conclusions

A sustainable process of electrospinning has been applied to fabricate composite TiO2-SnO2 fibers. This can be applied to remove the toxic dyes from the environment and thus, health related issues can be avoided. This is an inexpensive process, environmentally ecofriendly, and fewer toxic chemicals are involved in its preparation. The fiber morphology was retained after loading of SnO2 into TiO2 and the oxidation states of TiO2 were changed after loading of SnO2. Apart from the oxidation state of Ti−4, lower oxidation states such as Ti−2 and Ti−3 were also observed in the case of TiO2. Composite TiO2-SnO2 exhibited higher degradation rates with Rhodamine B when compared to other dyes. Furthermore, composite TiO2-SnO2 nanofibers showed superior catalytic activity towards Rhodamine B than other dyes.

Author Contributions

The manuscript, figures, and tables were contributed by V.J.B. The research idea, reviewing manuscript, improving quality, and answers to reviewer questions were performed by S.S. Reviewing manuscript and improving overall manuscript quality, and subsequent corrections were performed by V.J.B. and S.S.A.A.H.R. The overall direction and guidance were provided by S.R. All authors have read and agreed to the published version of the manuscript.

Funding

This research received no external funding.

Institutional Review Board Statement

Not applicable.

Informed Consent Statement

Not applicable.

Data Availability Statement

Not applicable.

Acknowledgments

Authors V.J.B., S.S.A.A.H.R., and S.S. contributed equally for this work. V.J.B. and S.S.A.A.H.R. acknowledge S.S. for his valuable scientific inputs and thank S.R. for his valuable suggestions and inputs beyond this manuscript.

Conflicts of Interest

The authors declare no conflict of interest.

References

  1. Babu, V.J.; Vempati, S.; Ramakrishna, S. Reduced recombination and enhanced UV-assisted photocatalysis by highly anisotropic titanates from electrospun TiO2–SiO2 nanofibers. RSC Adv. 2014, 4, 27979–27987. [Google Scholar] [CrossRef]
  2. Darbar, D.; Reddy, M.V.; Sundarrajan, S.; Pattabiraman, R.; Ramakrishna, S.; Chowdari, B.V.R. Anodic electrochemical performances of MgCo2O4 synthesized by oxalate decomposition method and electrospinning technique for Li-ion battery application. Mater. Res. Bull. 2016, 73, 369–376. [Google Scholar] [CrossRef]
  3. Sharma, S.; Naveen, K.P.; Makgwane, R.; Nar Singh, C.; Kumari, K.; Manju, R.; Sanjeev, M. TiO2/SnO2 nano-composite: New insights in synthetic, structural, optical and photocatalytic aspects. Inorg. Chim. Acta 2022, 529, 120640. [Google Scholar] [CrossRef]
  4. Kumar, P.S.; Sundaramurthy, J.; Sundarrajan, S.; Babu, V.J.; Singh, G.; Allakhverdiev, S.I.; Ramakrishna, S. Hierarchical electrospun nanofibers for energy harvesting, production and environmental remediation. Energy Environ. Sci. 2014, 7, 3192–3222. [Google Scholar] [CrossRef]
  5. Merum, S.; Veluru, J.B.; Seeram, R. Functionalized carbon nanotubes in bio-world: Applications, limitations and future directions. Mater. Sci. Eng. B 2017, 223, 43–63. [Google Scholar] [CrossRef]
  6. Rekha, B.; Rajput, S.; Jamble, R.N.; Kale, B. A review on TiO2/SnO2 heterostructures as a photocatalyst for the degradation of dyes and organic pollutants. J. Environ. Manag. 2022, 307, 114533. [Google Scholar]
  7. Ramaseshan, R.; Sundarrajan, S.; Jose, R.; Ramakrishna, S. Nanostructured ceramics by electrospinning. J. Appl. Phys. 2007, 102, 111101. [Google Scholar] [CrossRef]
  8. Sireesha, M.; Jagadeesh Babu, V.; Kranthi Kiran, A.S.; Ramakrishna, S. A review on carbon nanotubes in biosensor devices and their applications in medicine. Nanocomposites 2018, 4, 36–57. [Google Scholar] [CrossRef]
  9. Abdul Haroon Rashid, S.S.A.; Sabri, Y.M.; Kandjani, A.E.; Harrison, C.J.; Canjeevaram Balasubramanyam, R.K.; Della Gaspera, E.; Field, M.R.; Bhargava, S.K.; Tricoli, A.; Wlodarski, W.; et al. Zinc Titanate Nanoarrays with Superior Optoelectrochemical Properties for Chemical Sensing. ACS Appl. Mater. Interfaces 2019, 11, 29255–29267. [Google Scholar] [CrossRef]
  10. Babu, V.J.; Sireesha, M.; Anusha, M.; Sundararajan, S.; Sulthan, S.A.A.H.R.; Senthil, A.K.; Ramakrishna, S. Intelligent Nanomaterials for Wearable and Stretchable Strain Sensor Applications: The Science behind Diverse Mechanisms, Fabrication Methods, and its Real-time Healthcare. Polymers 2022, 14, 2219. [Google Scholar] [CrossRef]
  11. Zhang, Z.; Shao, C.; Zhang, L.; Li, X.; Liu, Y. Electrospun nanofibers of V-doped TiO2 with high photocatalytic activity. J. Colloid Interface Sci. 2010, 351, 57–62. [Google Scholar] [CrossRef]
  12. Xu, J.; Wang, W.; Shang, M.; Gao, E.; Zhang, Z.; Ren, J. Electrospun nanofibers of Bi-doped TiO2 with high photocatalytic activity under visible light irradiation. J. Hazard. Mater. 2011, 196, 426–430. [Google Scholar] [CrossRef]
  13. Kavitha, S.; Jayamani, N.; Barathi, D. Investigation on SnO2/TiO2 nanocomposites and their enhanced photocatalytic properties for the degradation of methylene blue under solar light irradiation. Bull. Mater. Sci. 2021, 44, 26. [Google Scholar] [CrossRef]
  14. Kim, C.H.; Kim, B.-H.; Yang, K.S. TiO2 nanoparticles loaded on graphene/carbon composite nanofibers by electrospinning for increased photocatalysis. Carbon 2012, 50, 2472–2481. [Google Scholar] [CrossRef]
  15. Jagadeesh Babu, V.; Vempati, S.; Ertas, Y.; Uyar, T. Excitation dependent recombination studies on SnO2/TiO2 electrospun nanofibers. RSC Adv. 2015, 5, 66367–66375. [Google Scholar] [CrossRef] [Green Version]
  16. Daghrir, R.; Drogui, P.; Robert, D. Modified TiO2 For Environmental Photocatalytic Applications: A Review. Ind. Eng. Chem. Res. 2013, 52, 3581–3599. [Google Scholar] [CrossRef]
  17. Hunge, Y.M.; Mahadik, M.A.; Patil, V.L.; Pawar, A.R.; Gadakh, S.R.; Moholkar, A.V.; Patil, P.S.; Bhosale, C.H. Visible light assisted photoelectrocatalytic degradation of sugarcane factory wastewater by sprayed CZTS thin films. J. Phys. Chem. Solids 2017, 111, 176–181. [Google Scholar] [CrossRef]
  18. Ponja, S.; Sathasivam, S.; Chadwick, N.; Kafizas, A.; Bawaked, S.M.; Obaid, A.Y.; Al-Thabaiti, S.; Basahel, S.N.; Parkin, I.P.; Carmalt, C.J. Aerosol assisted chemical vapour deposition of hydrophobic TiO2-SnO2 composite film with novel microstructure and enhanced photocatalytic activity. J. Mater. Chem. A 2013, 1, 6271–6278. [Google Scholar] [CrossRef]
  19. De Mendonça, V.R.; Lopes, O.F.; Fregonesi, R.P.; Giraldi, T.R.; Ribeiro, C. TiO2-SnO2 heterostructures applied to dye photodegradation: The relationship between variables of synthesis and photocatalytic performance. Appl. Surf. Sci. 2014, 298, 182–191. [Google Scholar] [CrossRef]
  20. Rajkumar, K.; Vairaselvi, P.; Saravanan, P.; Vinod, V.T.P.; Černík, M.; Rajendra Kumar, R.T. Visible-light-driven SnO2/TiO2 nanotube nanocomposite for textile effluent degradation. RSC Adv. 2015, 5, 20424–20431. [Google Scholar] [CrossRef]
  21. Liu, Z.; Sun, D.D.; Guo, P.; Leckie, P.O. An Efficient Bicomponent TiO2/SnO2 Nanofiber Photocatalyst Fabricated by Electrospinning with a Side-by-Side Dual Spinneret Method. Nano Lett. 2006, 7, 1081–1085. [Google Scholar] [CrossRef] [PubMed]
  22. Kanjwal, M.A.; Barakat, N.A.; Sheikh, F.A.; Kim, H.Y. Electronic characterization and photocatalytic properties of TiO2/CdO electrospun nanofibers. J. Mater. Sci. 2010, 45, 1272–1279. [Google Scholar] [CrossRef]
  23. Jin, M.; Zhang, X.; Emeline, A.V.; Liu, Z.; Tryk, D.A.; Murakami, T.; Fujishima, A. Fibrous TiO2–SiO2 nanocomposite photocatalyst. Chem. Commun. 2006, 43, 4483–4485. [Google Scholar] [CrossRef]
  24. Wang, Z.; Li, Z.; Zhang, H.; Wang, C. Improved photocatalytic activity of mesoporous ZnO–SnO2 coupled nanofibers. Catal. Commun. 2009, 11, 257–260. [Google Scholar] [CrossRef]
  25. Lee, J.S.; Kwon, O.S.; Jang, J. Facile synthesis of SnO2 nanofibers decorated with N-doped ZnO nanonodules for visible light photocatalysts using single-nozzle co-electrospinning. J. Mater. Chem. 2012, 22, 14565–14572. [Google Scholar] [CrossRef]
  26. Gao, J.; Wei, W.; Shi, M.; Han, H.; Lu, J.; Xie, J. A controlled solvethermal approach to synthesize nanocrystalline iron oxide for congo red adsorptive removal from aqueous solutions. J. Mater. Sci. 2016, 51, 4481–4494. [Google Scholar] [CrossRef]
  27. Aarthi, T.; Madras, G. Photocatalytic Degradation of Rhodamine Dyes with Nano-TiO2. Ind. Eng. Chem. Res. 2007, 46, 7–14. [Google Scholar] [CrossRef]
  28. Scholten, E.; Bromberg, L.; Rutledge, G.C.; Hatton, T.A. Electrospun Polyurethane Fibers for Absorption of Volatile Organic Compounds from Air. ACS Appl. Mater. Interfaces 2011, 3, 3902–3909. [Google Scholar] [CrossRef] [Green Version]
  29. Chen, L.; Bromberg, L.; Lee, J.A.; Zhang, H.; Schreuder-Gibson, H.; Gibson, P.; Walker, J.; Hammond, P.T.; Hatton, T.A.; Rutledge, G.C. Multifunctional Electrospun Fabrics via Layer-by-Layer Electrostatic Assembly for Chemical and Biological Protection. Chem. Mater. 2010, 22, 1429–1436. [Google Scholar] [CrossRef]
  30. Zhang, S.; Peng, L.M.; Chen, Q.; Du, G.H.; Dawson, G.; Zhou, W.Z. Formation Mechanism of H2Ti3O7 Nanotubes. Phys. Rev. Lett. 2003, 91, 256103. [Google Scholar] [CrossRef]
  31. Singh, J.; Kumari, P.; Basu, S. Degradation of toxic industrial dyes using SnO2/g-C3N4 nanocomposites: Role of mass ratio on photocatalytic activity. J. Photochem. Photobiol. A Chem. 2019, 371, 136–143. [Google Scholar] [CrossRef]
  32. Morgan, W.E.; Van Wazer, J.R. Binding energy shifts in the x-ray photoelectron spectra of a series of related Group IVa compounds. J. Phys. Chem. 1973, 77, 964–969. [Google Scholar] [CrossRef]
  33. Deshmukh, S.M.; Patil, S.S.; Babar, S.B.; Alshehri, S.; Ghoneim, M.M.; Tamboli, A.M.; Lam, N.H.; Nguyen Truong, T.N.; Kim, C.D.; Tamboli, M.S.; et al. TiO2-SnO2 Nanocomposites for Photocatalytic Environmental Remediation under UV-Light. Metals 2022, 12, 733. [Google Scholar]
  34. Xu, L.; Crawford, K.; Gorman, C.B. Effects of Temperature and pH on the Degradation of Poly(lactic acid) Brushes. Macromolecules 2011, 44, 4777–4782. [Google Scholar] [CrossRef]
Figure 1. Schematic diagram for the preparation of TiO2/PVP nanofibers, SnO2/PVP nanofibers, and pure composite TiO2-SnO2 fibers.
Suschem 04 00003 g001
Figure 2. TGA thermograms of the as-spun nanofibers of (A) TiO2/PVP; (B) SnO2/PVP; and (C) composite TiO2-SnO2/PVP.
Suschem 04 00003 g002
Figure 3. Surface morphology of the nanofibers after calcination at 575 °C (a) TiO2 nanofibers; (b) SnO2 nanofibers; (c) composite TiO2-SnO2 nanofibers; average fiber distribution; (d) TiO2 nanofibers; (e) SnO2 nanofibers; (f) composite TiO2-SnO2 nanofibers.
Suschem 04 00003 g003
Figure 4. (a) XPS survey spectra for TiO2, Ti2p bands, and O2 core levels of TiO2; (b) XPS survey spectra of SnO2, Sn 3d bands, and O2 core levels of SnO2; (c) XPS survey spectra of composite TiO2-SnO2, Ti2p, and Sn3d as composite TiO2-SnO2 fibers and O2 core levels composite TiO2-SnO2.
Suschem 04 00003 g004
Figure 5. Degradation and decolorization of different dyes with composite TiO2-SnO2 nanofiber catalyst (a) Alcian Blue; (b) Alizarin Red S; (c) Bilirubin; (d) Brilliant Blue; (e) Bromophenol Blue; and (f) Rhodamine B.
Suschem 04 00003 g005
Figure 6. (a,b) The rate of the reaction for Alcian Blue, Alizarin Red S, Bilirubin, Brilliant Blue, Bromophenol Blue, and Rhodamine B; (c,d) rate constant evaluation from the linear fitting using equation k = −2.303 × log(C0/C).
Suschem 04 00003 g006
Figure 7. Degree of photocatalytic removal of Brilliant blue in reusability tests with TiO2-SnO2 (dye concentration was about 5 mg per L solution and the reaction time was about 15 min).
Suschem 04 00003 g007
Table 1. Consolidated XPS characteristic peaks of TiO2, SnO2, and composite TiO2-SnO2 nanofibers.
Binding Energy
O1s (eV)FWHMTi2p3/2Ti2p1/2FWHMSn3d3/2Sn3d5/2FWHM
TiO2525.801.23454.60459.93
467.83
1.03
1.97
2.52
SnO2526.851.51 491.18482.811.3
1.3
TiO2-SnO2527.041.53455.48461.26
469.07
1.06
1.87
2.28
491.60483.192.4
2.1
Disclaimer/Publisher’s Note: The statements, opinions and data contained in all publications are solely those of the individual author(s) and contributor(s) and not of MDPI and/or the editor(s). MDPI and/or the editor(s) disclaim responsibility for any injury to people or property resulting from any ideas, methods, instructions or products referred to in the content.

