1. Introduction
Farm mechanization has long been regarded as fundamental in poverty reduction for developing-economy countries. This is largely because the adoption of agricultural technologies targets acceleration for farmers below the poverty line, thereby addressing pro-poor growth. In general, agricultural machinery has been associated with improving soil cultivation, water supply, crop index, reducing loss, and overall improved resource efficiency [
1]. Tractors specifically increase production efficiency by decreasing the time and effort spent on cultivation, sowing, spraying, harvesting, and post-harvesting operations [
2]. Additional benefits beyond immediate farming tasks have also been reported, such as higher income, improved nutrition, lower prices for staple foods, and even employment opportunities for landless individuals [
3,
4]. Boansi et al. [
5] also noted that agricultural mechanization can improve farmers’ adaptability to weather extremes.
Another significant benefit of mechanization is the improvements it provides in the efficiency of agricultural labor [
6], and in turn, minimizing rural out-migration. Farming with little-to-no machinery induces high labor drudgery [
7] and the addition of mechanization can significantly reduce this drudgery [
8]. The physically demanding labor caused by low-mechanization farming has framed farming as unattractive to youth, disproportionately affects women, and is often regarded as a “dirty job” [
7,
9]. These shifts in perception of farming for a living, particularly in the reluctance of younger generations to farm, have led to rural out-migration [
9], particularly where younger generations are moving out of rural areas towards cities. In an interview study with six Sudanese farms, Ahmed and Miller [
10] reported that three of the six farms expressed concerns that their children were considering moving to the city in pursuit of another lifestyle. Rural out-migration has further exasperated labor scarcity, leading to increasing labor costs, which is particularly challenging for cash-constrained smallholder farmers [
11]. Not only does this influence labor costs, but also threatens food security for these countries [
9]. Hence, it is believed that farming machinery can help incentivize younger generations to remain involved in agriculture and rural communities [
12].
Several studies and initiatives have focused on the importance of using farming machinery in various developing economy countries. Biggs et al. [
13] studied mechanization in agricultural and rural development in Bangladesh, India, and Nepal. Similarly, Mottaleb et al. [
14] studied the effects in Bangladesh. Kienzle et al. [
8] compiled reports of efforts across Africa, Asia, South America, and Eastern Europe. Hagos [
15] focused on Ethiopia and Baudron et al. [
7] reported across Eastern and Southern Africa. However, despite these identified benefits and needs, the adoption rates of agricultural technologies remain low in developing economy countries [
4]. Baurdron et al. [
7] emphasize the need for sustainable intensification (i.e., increasing land output without impacting the environment) to achieve food security in Africa, which requires improvements in farmers’ access to machinery.
Prior work has also investigated economic theory in relation to agriculture and economic growth. Mellor [
16] considered individual farmer and socioeconomic impacts, and showed that growth in agricultural productivity leads to increased farm income, improved welfare of farmers, decreased food prices that directly benefit low-income consumers, and increased industrial labor opportunities outside of agriculture [
17]. Further, Barrett et al. [
18] described the Lewis linkages, where increases in agricultural productivity also lead to economic growth in nonagricultural sectors due to the alleviation of labor and capital. Economic improvements in agriculture, compared to other sectors, have shown to be more effective in reducing poverty among the poorest, while economic growth in non-agriculture sectors is more beneficial in resource-rich countries [
19]. Similar economic research in developing Asian economies has shown that economic growth requires significant increases in agricultural labor productivity and production, where increased production also leads to ample and affordable food, an essential for improving quality of life [
20]. Kaya et al. [
21] showed that foreign aid directed at agriculture was more efficient in reducing poverty than aid towards other sectors, such as strategic considerations, humanitarian reasons, and emergency relief, where reductions in poverty are seen through raising the per capita income. Economic analysis has shown individual and macro-level benefits of increased agricultural productivity. However, adoption rates of machinery capable of closing these gaps in productivity potential have not followed and research is needed to demonstrate achievable methods of adoption for individual farmers.
Much of these previous studies have lacked the quantified economic analysis to encourage adopting farming machinery that is viewed as affordable to farmers. Rather, the focus has been on identifying the overall benefits. Hence, this paper seeks to quantify the changes in production across various farms and provide statistical support for these claimed benefits of farming machinery. Specifically, farmers in Sudan Africa were selected as the case study for this research. Sudan has been noted as a country with overall low levels of mechanization, low farming productivity, and high crop yield gaps [
5]. Kirui [
22] surveyed 9597 households across 11 countries in Africa and reported that, on average, only 17.5% had access to tractor-powered machinery, which ranged from less than 10% access in the countries Burkina Faso, Cameroon, Ethiopia, Niger, Senegal, Zambia, and Zimbabwe, to a large jump in access in the more developed countries such as South Africa (71.9%) and Egypt (90.8%). Across all of Africa, 52.4% of the economically active population works in the agriculture sector [
17]. Identifying feasible opportunities to increase the adoption rates of agricultural technology in these lagging countries could have substantial effects on economic growth [
17] and poverty alleviation [
23].
The objective of this paper is to quantify the profitability of farming practices in a case study of farmers in Sudan to identify feasible opportunities to integrate farming machinery, and ultimately move towards improving farming productivity and quality of life. Two farming approaches are evaluated, traditional farming without machinery and farming with machinery. The analysis used in this paper focuses on the comparison of economic values of traditional farming versus comparable mechanized farming to identify if and how the use of agricultural machinery could be adapted to satisfy the needs of farmers in developing economy countries. The following research questions are examined regarding farming across 36 farmers in Sudan, Africa: (1) What are the major influences on farming costs and revenues; (2) How does the use of machinery affect cost, revenue, net-profit, and return on investment.
2. Materials and Methods
A treatment control case study was conducted on farmers in Sudan, Africa during the 2019, 2020, and 2021 farming seasons to identify opportunities and barriers to the feasibility of farming machinery and technology. An analysis was conducted on costs, revenues, net-profits, and return on investment between a set of farmers practicing traditional farming without machinery (control) and a set of farmers practicing farming with machinery (treatment). An individual living in Sudan was hired to travel between the farms, collect data, and for overall coordination in Sudan.
2.1. Participants
There was a total of 36 farms analyzed in this study: 12 in the north, 12 in the east, and 12 in the western regions of Sudan. It is worth noting that this study design serves as a case study, as this sample size does not adequately represent all farms across Sudan. The farms were selected for inclusion because the farmers used traditional farming practices, meaning they did not use modern farming machinery. The farms included in this study were randomly selected and randomly assigned to either the treatment or control group. The research assistant in Sudan traveled to various villages and asked permission from the tribe leaders to recruit farmers from their villages. There was a total of seven different villages included. Only farms that had similar crops within each region, planting/harvesting schedules, and agronomic practices were recruited. Each of the farms were owned and operated by a different family. A total of 30 of the 36 farms, the “without machinery group” (control group), were interviewed about their traditional farming practices in terms of cost, revenue, and net-profits for each of the 2019, 2020, and 2021 farming seasons. The other 6 of the 36 farms, the “with machinery group” (treatment group), were provided farming machinery to use over the 2020 and 2021 farming seasons. These six farms were interviewed before using the machinery during their 2019 farming season, and throughout the 2020 and 2021 seasons about their experience using the machinery for the entire farming process.
2.2. Farming Machinery
All farming machinery was provided to the six farms at no cost to the farmers. Training on how to use the equipment and fuel was also provided to the farmers. The quantity and cost of fuel provided to the farmers were recorded to account for costs and revenues related to farming with machinery. The farming machinery provided to the farmers included a tractor, a cultivator attachment (to prepare soil before planting), a planter attachment (to place seeds in soil), and a harvester attachment (to harvest crops at the end of the season). Due to limitations of funding and equipment availability, only six farms were provided the machinery.
2.3. Interview Questions
All 36 farmers were asked the same interview questions, plus an additional set of questions for the 6 farmers who were provided the farming machinery. There were 22 questions asked to all 36 farmers relating to their traditional farming practices, including farm size, crop types, costs, revenues, equipment used, challenges, optimal machinery design, and their willingness to adopt new farming practices and technology. The additional questions for the six farmers with farming machinery related to their experience using the machinery, such as challenges, benefits, and changes in farming.
2.4. Procedures
All the interview questions were written in English, and then translated into Arabic by one of the members of the research team. The individual living in Sudan who assisted with data collection conducted all the interviews in Arabic via a script he was given. After the interviews, a member of the research team translated the interview responses into English. The interviews were conducted with each farmer individually. All 36 farmers were interviewed the same regarding farming without machinery for the 2019 farming season. Then, the subsequent interviews with the machinery (treatment) group focused on costs, revenues, and experiences using machinery, while the without-machinery (control) interviews focused on costs and revenues. This is described in
Table 1.
2.5. Data Cleaning and Analysis
The analysis of economic values related to farming machinery was conducted based on data for the 2019–2021 farming seasons, based on cost and revenue data provided by the farmers. The farmers provided data in the local currency, the Sudanese pound (SDG) and these values were converted into USD for analysis. Cost was identified as the input in dollars for the season, such as labor, materials, and fuel from preparing the soil to selling produce. Revenue was defined as the amount of money acquired for selling produce for the season. Net-profit was defined as the difference between cost and revenue, also in dollars. Each farmer was asked about their costs and revenues for each season, as well as how large their farm was in acres. To compare values between farms, the costs, revenues, and net-profits were divided by farm size, to compare USD/acre, since all the farms were slightly different sizes. Further, to evaluate the value and efficiency of machinery, Return on Investment (ROI) was also computed, which was defined as the ratio of net-profit to cost, see Equation (1), where a higher ROI corresponds to a better investment. Furthermore, any positive ROI value corresponds to a positive net-profit. For example, an ROI of 100% would indicate the revenue was double the cost (i.e., net-profit equaled cost), an ROI of 0% would indicate the revenue equaled the cost (i.e., net-profit of USD 0).
Data analysis was conducted using Excel and R Studio. Statistical significance was assessed at α = 0.05. t-tests were used to evaluate differences in costs, revenues, and net-profits between the treatment and control groups for 2019—the baseline farming year that all farmers in the study farmed without machinery. An analysis of variance (ANOVA) was used to test for the effects of the farming year and machinery group on net-profits and return on investment for 2019–2021. Post hoc tests using Tukey’s honest significant difference (HSD) were used to further evaluate ANOVA pairwise comparisons.
3. Results
3.1. Farm Characteristics
The farms included in this study each farmed similar crops to the other farms within their region (i.e., north, east, west). Each farm reported growing at least two different crops. The farms in the northern region farmed peanuts, potatoes, and/or wheat; the farms in the east farmed carrots, cucumbers, eggplants, green peppers, okra, potatoes, and/or tomatoes; the farms in the west farmed peanuts, sesame, and/or watermelon seeds. All farmers conducted their planting and harvesting at similar times within the year. None of the farms used modern machinery to farm or sell their product prior to inclusion in the study, but rather used animal and human labor. None of the farmers in our study reported having a vehicle to transport their product; instead, they would either transport their goods via a cart pulled by an animal to sell direct to consumers in the local market or they would sell their product to a broker who would buy everything at once at a reduced price and the broker would sell the product at larger markets.
In the first interview, the farmers were asked if they had to hire laborers over the previous three seasons (i.e., 2017, 2018, 2019) to assist in the farming process, and all 36 farms reported having to hire laborers in each of the past three farming seasons. The two groups (i.e., treatment and control) also reported a similar number of family members working on their farms, where the control group had an average of 7.2 family members working per farm (SD = 7.7, min = 5, max = 11) and the treatment group had an average of 6.8 family members working per farm (SD = 3.6, min = 4, max = 14). The assignment of treatment and control group was randomly assigned to each farm, and the control group farms ended up being slightly smaller in size, where the control group had an average farm size of 39.7 acres (SD = 7.8, min = 25, max = 65) and the treatment group had an average farm size of 78.1 acres (SD = 25.1, min = 56, max = 120). However, a subsequent analysis was conducted on USD/acre for cost, revenue, and net-profit; therefore, it is not expected that this difference will significantly impact our analysis on the impact of machinery.
3.2. Factors Affecting Farming Net-Profits
Each of the 36 farmers were asked an open-ended question about what factors most affected their farming net-profits. There were four factors identified by the farmers, as shown in
Figure 1. Notably, all 36 farmers mentioned the exchange rate as a key factor. Poor access to affordable fuel was also mentioned as a reason they did not use fuel-powered equipment; indicating that efforts to increase farm mechanization also need to address fuel access. Additionally, due to the high manual labor needed to farm without machinery, many traditional farmers hire extra laborers. Often, as reported by 25 of our 36 farmers (69.5%), they cannot find enough laborers to hire, or the laborers are too expensive. As a result, farmers reported not being able to harvest their entire crops on time, causing them to lose part of their crops. Farmers (20 out of 36 or 55.5%) claimed they often have limited-to-no access to farming inputs (e.g., high-quality seeds, fertilizers, pesticides, straw removers) or they are too expensive to buy. As a result, they switch to local alternatives that are less efficient and lead to less output (and profits). For example, many of our farmers reported not being able to afford manufactured fertilizers, so they burn their land to create carbon that fertilizes their land, which is less efficient compared to manufactured fertilizers.
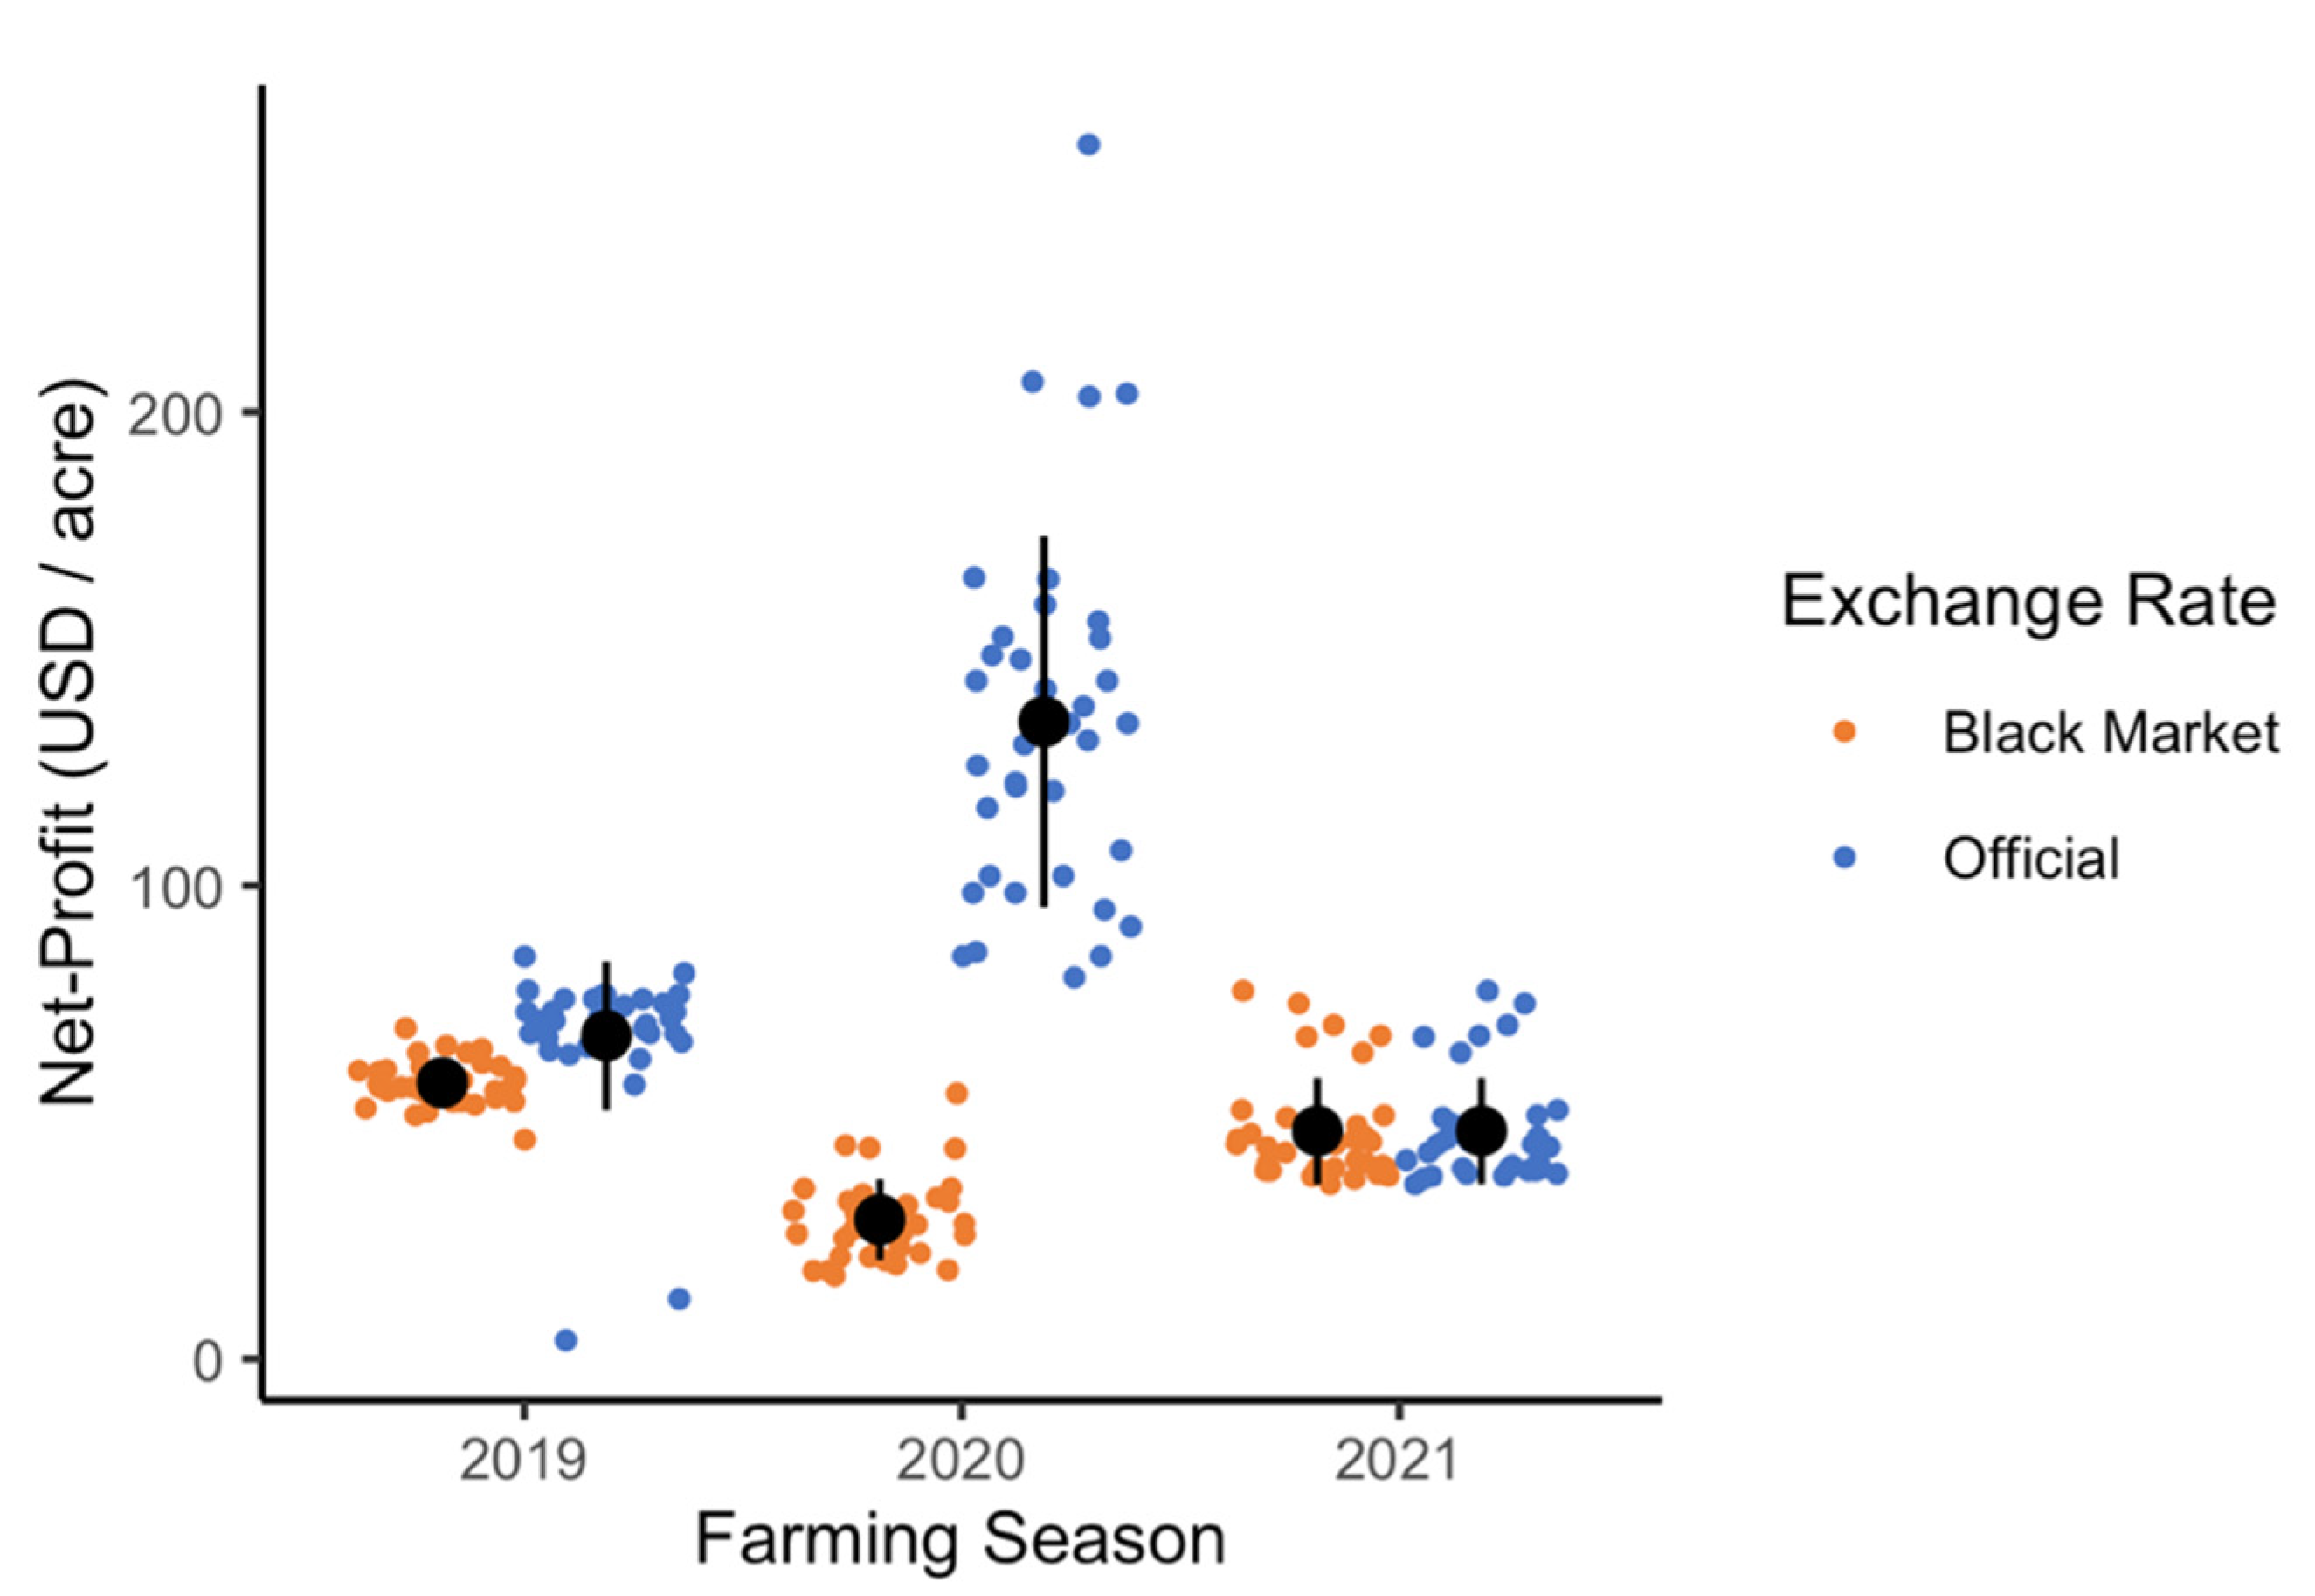
The exchange rate between the local currency (Sudanese Pound, SDG) and US Dollar (USD) has reportedly affected farming practices adversely. Farmers claim that the inconsistency in the value of the SDG often causes unpredictable fluctuations in the costs of inputs and the value of their outputs. In Sudan’s case, there are two exchange rates: the official rate, which the Sudanese government and Sudanese banks use; and the black-market rate, which the farming economy is based on. Traditional farmers buy their farming inputs and sell their products based on this black-market exchange rate because the people who buy/sell the farming inputs/outputs price is based on the black-market rate. As such, the black-market exchange rate was used in this paper instead of the official-market exchange rate because the farmers buy and sell through local merchants, who follow the black-market value of the SDG. The exchange rates over this period are provided in
Table 2.
There is often a large difference in the value of the SDG based on the official and black-market rates and between years. To demonstrate this,
Figure 2 shows the net-profits for all 36 farmers based on the black-market and official exchange rates for each year, where the black-market vs. official values fluctuates from year to year and not consistent with each other. In all subsequent analyses, only the black-market exchange rate is considered.
3.3. Breakdown of Costs
Each farmer was asked to provide cost data for each farming season. They were asked to provide costs in terms of (1) the amount spent on labor and (2) the amount spent on farming inputs and transport. Farming inputs included seeds, fertilizers, insecticides, pesticides, insect traps, and straw removers. Transport included the cost of transporting the farming inputs from the local market back to the farms and transporting the final outputs to the market after harvesting. A summary of this is provided in
Table 3. As a result of using the machinery, none of the farmers in the treatment group needed to hire labor, hence labor costs for this group were USD 0 in 2020 and 2021. Additionally, these estimates for cost do not include fuel to operate the machinery for the treatment group, since the fuel was provided as part of this study, more on fuel costs in the next section.
3.4. Cost of Fuel to Farm with Machinery
As mentioned previously, fuel was provided to the farmers as part of the study. Due to limitations in communication between the research team, farmers, and local Sudanese person hired to assist with data collection, only fuel usage data was reliably recorded in the final farming year (2021) for three of the six farms using machinery.
Table 4 shows the total cost of fuel for the entire 2021 farming season (from preparing the soil through harvesting) for these farms. The average fuel cost to operate the machinery for the entire season was USD 3.65 per acre (standard deviation =
$0.07). The small standard deviation suggests that this small sample size of fuel cost should not be a significant limitation. Since participants did not pay for the fuel to power the tractors, their reported values of farming costs did not include fuel. Hence, we added the price of fuel (USD/acre) to their reported costs (USD/acre) in subsequent analysis to obtain a realistic estimate of farming with machinery costs.
3.5. Costs, Revenues, and Net-Profits between Groups
The 30 participants in the control group provided costs and revenues over the last three farming seasons (2019–2021), which were used to compute net-profit, as shown in
Table 5. The cost of farming increased as the black-market exchange rate increased. However, the revenue did not necessarily follow this pattern, causing fluctuations in net-profit.
The six farmers in the treatment group used the machinery for two farming seasons (2020 and 2021), while 2019 provided data for these farmers not using machinery (i.e., comparable to the control group), see
Table 6.
Analysis using t-tests indicated that there were no significant differences between the 2019 values for the farmers in the control vs. treatment groups for costs, when all farmers were farming without machinery: t (11.12) = 0.98, p = 0.347, μtreatment = 18.87 vs. μcontrol = 19.37; revenues: t (11.30) = 0.88, p = 0.398, μtreatment = 76.59 vs. μcontrol = 77.84; and net-profits: t (11.45) = 0.50, p = 0.628, μtreatment = 57.72 vs. μcontrol = 58.47. As such, this validates that the treatment and control groups have similar baseline values and would likely otherwise experience similar farming seasons in 2020 and 2021 if it was not for the farming machinery provided in this study.
3.6. Net-Profit Benefit of Machinery
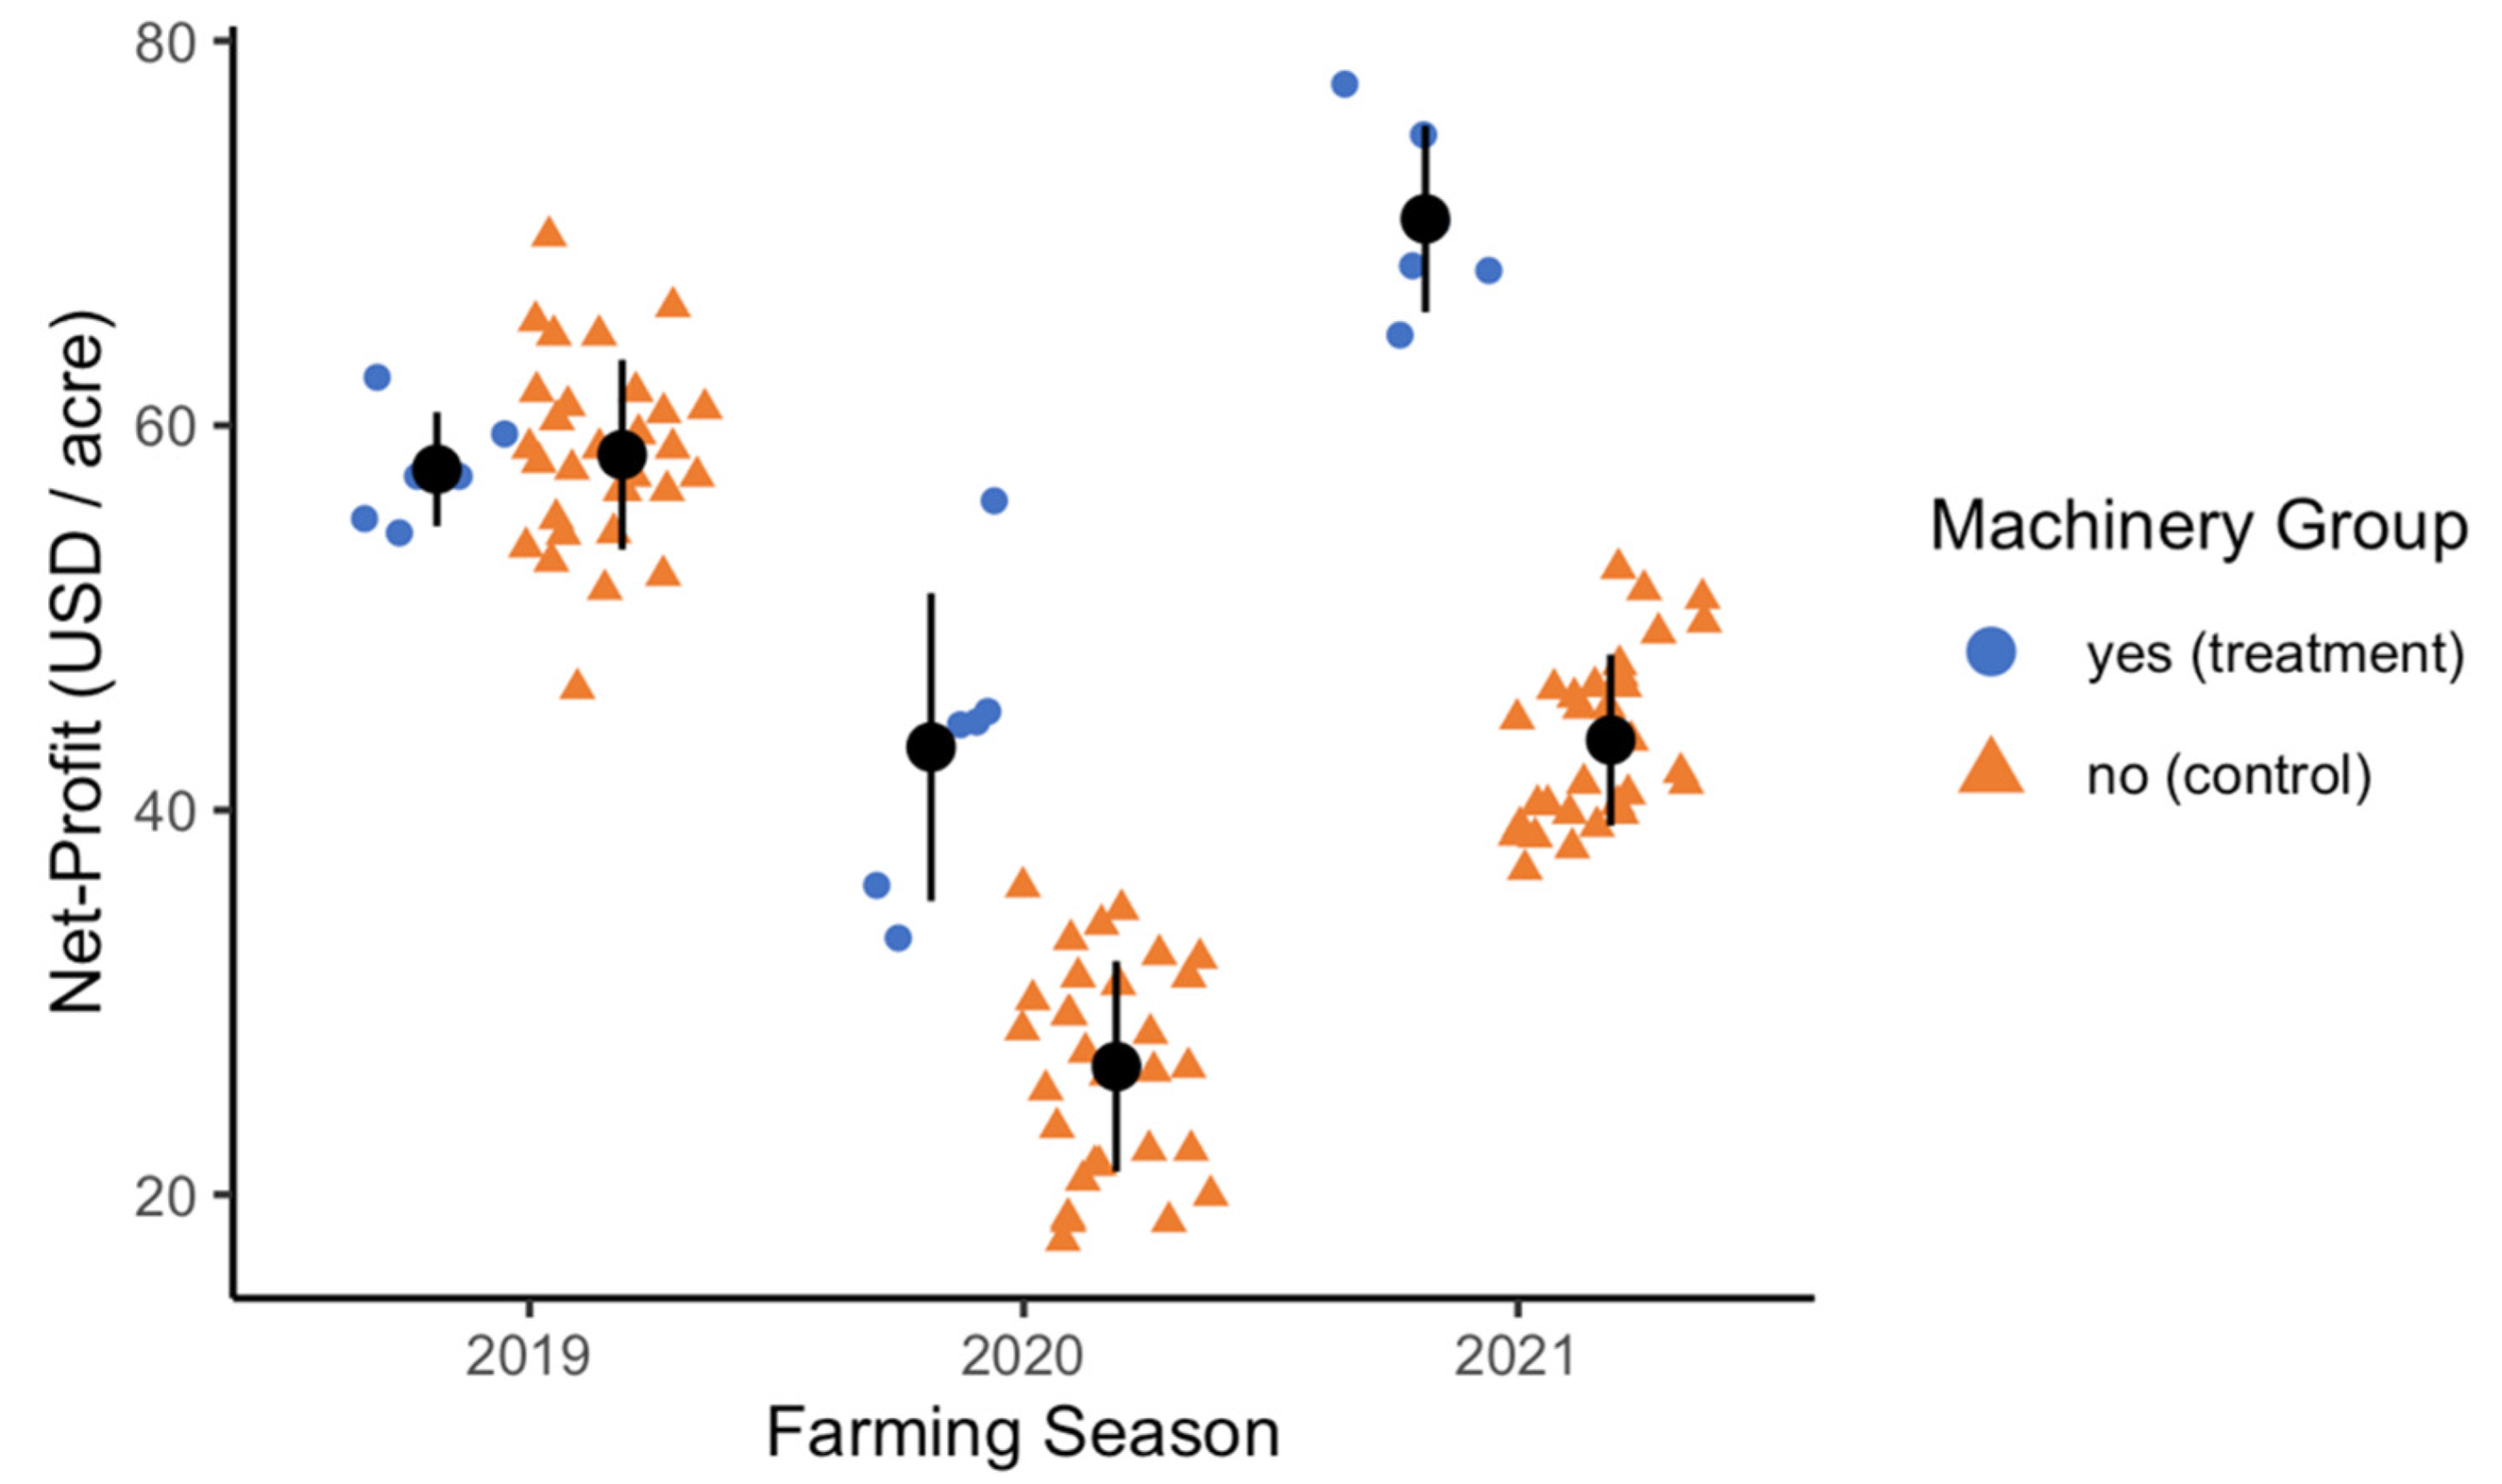
A side-by-side comparison is provided in
Figure 3 of the net-profits in 2019, 2020, and 2021 for the control group and the treatment group farmers. The net-profits are very similar in 2019, when both groups were farming without machinery, but in subsequent years the treatment group consistently has higher net-profit than the control group. The value of the Sudanese pound was the highest in 2019 of the three years, hence why the net-profit appears high in the first year. However, comparison between the groups within each year, rather than across years, is indicative of the effect of machinery.
An ANOVA was performed to compare the effects of the interaction of farming season and machinery group on the net-profits, in USD per acre. There was a significant effect of year [F(2, 102) = 289.86, p < 0.001], machinery group [F(1, 102) = 119.11, p < 0.001] and year by machinery group [F(2, 102) = 38.32, p < 0.001] on net-profit. A Tukey HSD post hoc test indicated a statistically significant difference (p < 0.01) between all pairwise comparisons of the group by year except for two: (1) 2019 control vs. 2019 treatment (p = 0.999), which indicates similarity when both groups were farming without machinery; and (2) 2020 treatment vs. 2021 control, which speaks to the volatility in the value of the SDG. More specifically, the use of machinery was associated with a 62.30% increase in net-profit for the 2020 season (USD 26.66/acre vs. USD 43.27/acre) and a 62.01% increase in net-profit for the 2021 season (USD 43.64/acre vs. USD 70.74/acre).
3.7. Return on Investment (ROI) between Groups
ROI was used to provide an indication of the relative usefulness of mechanized farming practice. However, this analysis does not include the cost of the machinery since it was provided to the farmers. Hence, this ROI analysis is representative of the relative impact of mechanized farming rather than specific to the value of the machinery. Moreover, this would represent the case where the machinery is paid off, borrowed, shared amongst farms, and/or provided by policy initiatives.
Table 7 summarizes the ROI across farming seasons for each group. As shown, the ROI for farming is largely affected by the country’s economy, which is represented by the exchange rate. When the exchange rate was low in 2019 (1 USD = 68 SDG), the average ROI was 304.9% (control) and 306.8% (treatment). However, when the exchange rate increased, indicating less value of the SDG, the average ROI decreased to 133.3% (control group) and 248.9% (treatment group) in 2020 (1 USD = 255.5 SDG) and 161.2% (control group) and 316.4% (treatment group) in 2021 (1 USD = 447 SDG).
Moreover, the treatment group’s ROI was only 0.61% greater than the control group for 2019, which is expected since both groups were farming without machinery in 2019. However, in 2020, the treatment group’s ROI was 86.7% greater than the control group and 96.3% greater in 2021. Despite the fluctuations between years due to the value of the SDG, the treatment group yielded much higher ROIs as compared to the control group for the same year.
3.8. ROI Benefit of Machinery
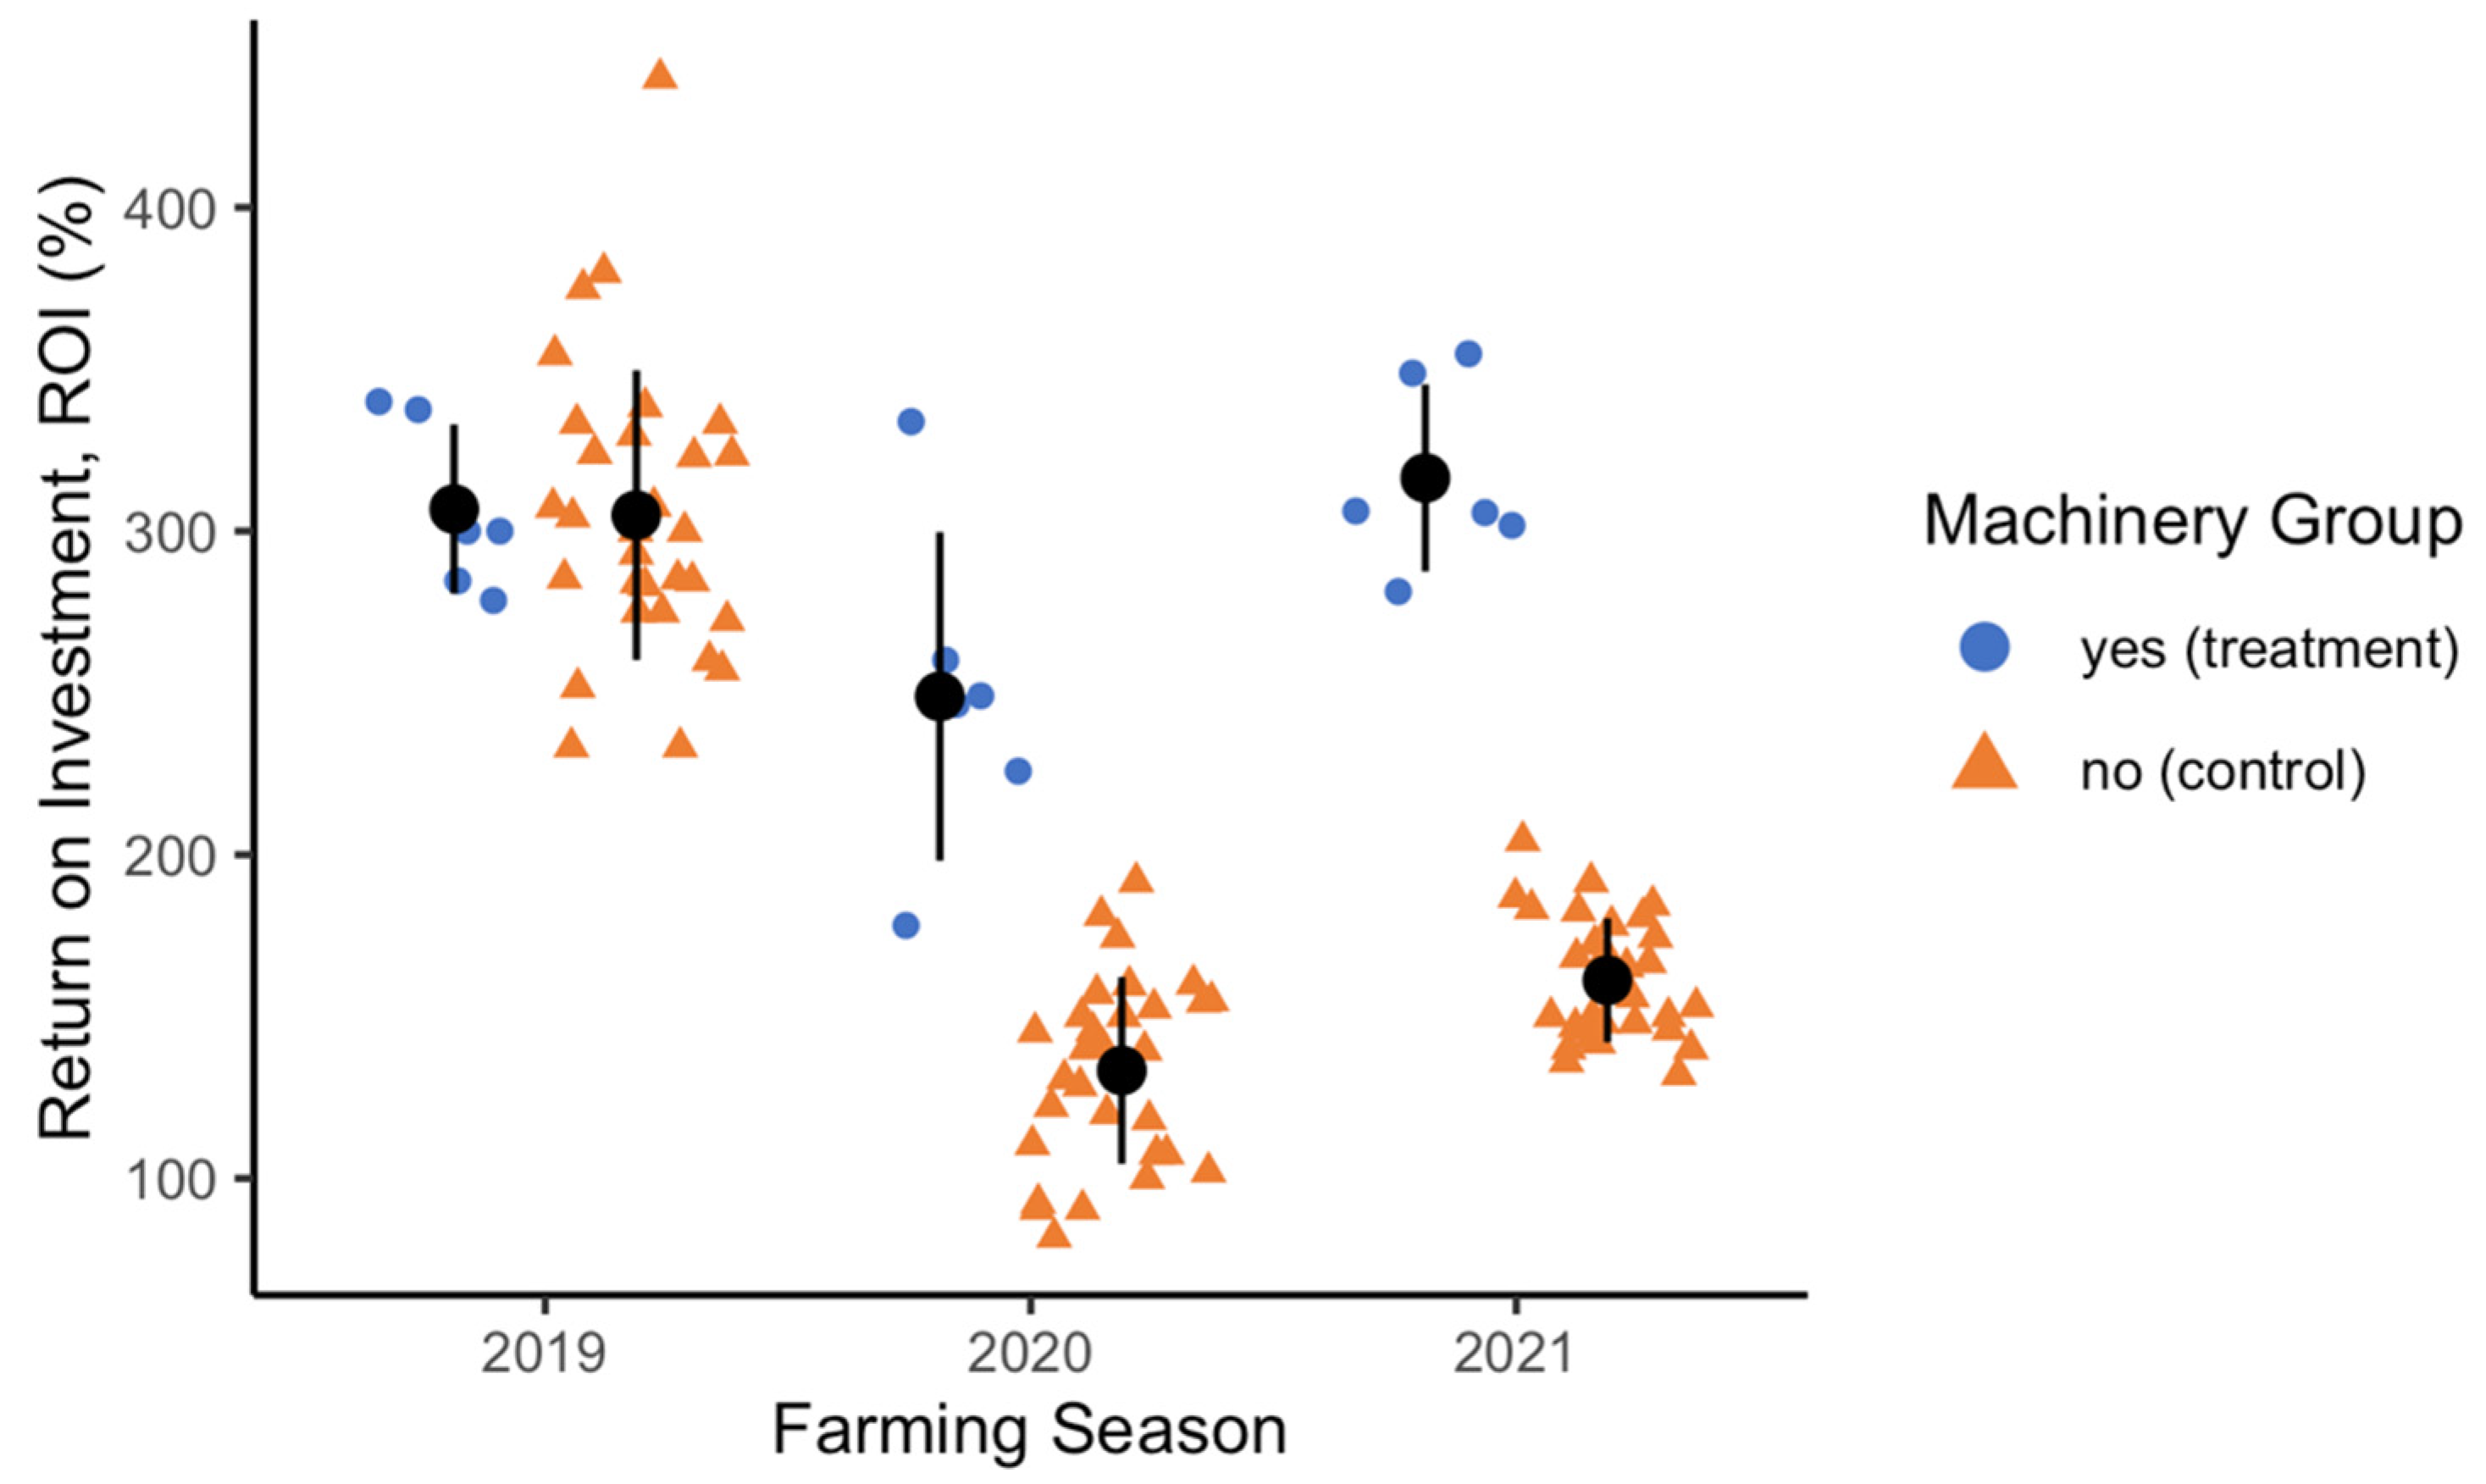
Similar to the net-profit analysis, a comparison of the 2019, 2020, and 2021 ROIs for the treatment and control group farmers is provided in
Figure 4. As before, relatively higher values are expected in 2019 due to the exchange rate. However, within each year there are significant differences between the groups, representing the effect of machinery.
An ANOVA was also used to evaluate the statistical difference in ROI based on the year and machinery group. The results showed a significant effect of year [F(2, 102) = 207.39, p < 0.001], machinery group [F(1, 102) = 111.38, p < 0.001] and year by machinery group [F(2, 102) = 28.48, p < 0.001] on ROI. Further, the results of the post hoc Tukey HSD test indicated no significant difference (p > 0.05) between 2019 control vs. 2019 treatment, and significant difference (p < 0.01) in ROI between 2020 control vs. 2020 treatment and 2021 control vs. 2021 treatment.
4. Discussion
This paper examines the economic feasibility and profitability of using agricultural machinery for a case study in Sudan, Africa. The use of farming machinery has been linked to increased output while decreasing strenuous labor; however, technology adoption requires user acceptance and often traditional farmers are resistant to new, unknown technology. Thirty-six farms across Sudan were randomly recruited for inclusion in this study, to understand their current farming practices and quantify differences between mechanized (N = 6) and non-mechanized (N = 30) farming. The farms were balanced across the different regions in Sudan (north, east, and west), to capture different farming styles, crops, and climate, and ultimately, a range of farming profitability.
A shared challenge identified by all the farmers was the variability in the value of the Sudanese local currency (Sudanese pound, SDG). This was demonstrated in this paper by converting the Sudanese pound to the US dollar (USD), which is more stable and more widely relatable to many readers. However, in the case of Sudan, there are two exchange rates, the official rate followed by the government and banks, and the black-market rate that the local (farming) economy is based on. The black-market value often deviates significantly from the official-market value, as well as from year to year. As a result, the costs, especially of farming inputs, and revenues, particularly the value paid for the product, leads to inconsistency for the farmers. This uncontrolled exchange rate negatively affects the country’s general economy, limiting the country’s ability to support its farmers and other economic sectors. Moreover, tractors are likely imported and paid for at official exchange rates, so it is important to consider how farmers might perceive these different values of the SDG.
Labor shortages and high costs were also identified by most of the farmers as having a significantly negative impact on their farming net-profits. However, farmers using the machinery required significantly fewer human workers throughout the process, which was one of the major causes for the difference between the farming groups’ net-profits and ROIs. Others have reported similar findings, where the use of farming technologies reduces the drudgery of farmers, especially women and children [
11,
24]. Even with the cost of fuel included in the cost of machinery, which we found to add, on average, an extra
$3.65/acre for the entire farming season, mechanized farming provided an advantage.
Financial data for the same three farming seasons, 2019, 2020, and 2021, were gathered for all 36 farms in the study. All the farmers, regardless of machinery group assignment, used traditional farming (i.e., no machinery) in the 2019 season. Since there was no statistically significant difference between the farming groups’ costs, revenues, net-profits, and ROIs for 2019, it is fair to assume that the treatment group would have experienced similar financial values to the control group if they had not had access to the machinery. Hence, the observed differences in 2020 and 2021 that we observed in our study between the two groups is most likely due to mechanized farming practices.
The analysis of the control group for the 2019–2021 farming seasons highlights how farming costs and revenues are largely dependent on the economic measure (i.e., black-market exchange rate), as is evident by the fluctuations in costs and revenues despite the consistent farming practices by this group. The use of farming machinery helped lower costs and increase revenues enough to help overcome many of these deficits. In both 2020 and 2021, the treatment group reported significantly higher net-profits and returns on investment than the control group for each respective year. The net-profit per acre increased by 62.30% in 2020 (USD 43.27/acre vs. USD 26.66/acre) and by 62.01% in 2021 (USD 70.74/acre vs. USD 43.64/acre) for the farmers with machinery compared to those without machinery. The ROI increased by 86.7% in 2020 (248.9% vs. 133.3%) and by 96.3% in 2021 (316.4% vs. 161.2%) for the farmers with machinery compared to those without machinery. Follow-up interviews with the farmers indicated that the machinery helped increase these values by: (1) decreasing space between plants, resulting in an increased farmed area; (2) enabling farmers to harvest their entire crop on time; and (3) increasing soil aeration, leading to better crops.
The financial gains per acre identified in this paper can be used in future work to inform tractor design requirements. The previous literature has advocated for scale-appropriate and affordable machinery for smallholder farmers [
1,
25]. For example, Baudron et al. [
7] suggested small, low-horsepower, two-wheel tractors. Similarly, Paudel et al. [
26] proposed small, 5–7-horsepower, two-wheel tractors, but found on average, farmers’ willingness to pay was 31% less than the price of such a tractor. This paper builds on this previous research by quantifying the monetary improvements realized through farm mechanization, which can be used in modeling purchase plans, outreach to farmers, and setting cost thresholds for equipment. Moreover, the literature has suggested that large farms tend to adopt technology before smallholders, further amplifying inequalities [
18]; hence, identifying feasible solutions for smallholder farmers can reduce inequities induced by broadly encouraging technology adoption.
Most of the farmers in this study were hesitant to adopt new farming practices and technology, fearing that new practices would bring new headaches to the farming process. Therefore, the farmers in the study were provided machinery, fuel, and training at no cost to them. While we were able to estimate the cost of fuel based on three farms, the data were limited. Another limitation is that there are likely to be other costs, such as accessing fuel and servicing the equipment. Hence, future decisions based on the increased net-profits calculated in this study due to mechanized farming should factor in additional costs that might need to be incurred by the farmers for operating and maintaining the machinery, should that fall on the individual farmers. Additionally, future work could use a similar framework to analyze ROI for various tractor designs, by factoring in the cost of various tractors.
5. Conclusions
Overall, this study sought to quantify the financial benefits of utilizing farming machinery for rural, traditional farmers by conducting a case study on 36 farms. More broadly, to identify a means for developing economy countries, such as Sudan, to successfully integrate agricultural machinery into their farming practices, to achieve pro-poor growth. Previous studies have similarly identified efficiency and productivity improvements in farming machinery over manual labor. However, this research uniquely captures the expected, with a range of uncertainty, monetary returns from mechanized farming at the individual farmer level.
All the farmers in this study had similar costs, revenues, and net-profits when farming without machinery. After using machinery to farm, the net-profits were significantly higher than their control counterparts for each comparable year (USD 16.61 per acre more in 2020 and USD 27.10 per acre more in 2021). The average farm in our study was 44.86 acres, hence could equate to, on average, USD 745.14 to USD 1215.74 more per year for an individual farm.
These differences identified in net-profits between farming with and without machinery provide a means to develop purchasing and borrowing models for farms to adopt machinery through economical and quantifiable solutions. For example, the net-profits identified in this research can be used to identify machinery within budget, based on the expected return and life of the machine. A similar framework can be applied in other developing areas to encourage adoption and provide demonstrated and quantifiable gains, such as increased farmer income, improved quality of work life, and reduced labor demands.


