Review

Fifty Years of Fixed Optical Networks Evolution: A Survey of Architectural and Technological Developments in a Layered Approach

by
Dimitris Uzunidis
1,
Michael Logothetis
1,
Alexandros Stavdas
2,
David Hillerkuss
3 and
Ioannis Tomkos
1,*
1
Department of Electrical and Computer Engineering, University of Patras, 26504 Patras, Greece
2
Openlightcomm EU, 10100 Praha, Czech Republic
3
Huawei, 80992 München, Germany
*
Author to whom correspondence should be addressed.
Telecom 2022, 3(4), 619-674; https://doi.org/10.3390/telecom3040035
Submission received: 28 July 2022 / Revised: 25 October 2022 / Accepted: 2 November 2022 / Published: 11 November 2022

Abstract

:
Over the past fifty years, telecommunications has transformed, in an unprecedented manner, the way we live, work and communicate. For telecommunications, fixed networks are the one pillar and wireless networks the other. The wireless networks and their generations have been extensively investigated in the literature; however, the fixed networks lack a consistent exploration of their evolution. For this purpose, our motivation is to present a review of the evolution of fixed networks in a holistic manner, from various different perspectives, which can assist engineers and students to understand, in a better way, how broadband networks developed and the main features of the current networking environment. Specifically, in this review, we aim to shed light on the most important technologies, standards and milestones of the fixed networks from various perspectives, such as the service perspective, the networking perspective (both access and core part) and the physical layer perspective. Our study follows the timeline of the five generations of fixed networks defined by the European Telecommunications Standards Institute (ETSI) F5G group and discusses the key achievements and limitations of each generation for each different infrastructure layer and segment, designating the most important issues for the most widely-adopted technologies and standards. Finally, our analysis helps to reveal the technical challenges that need to be addressed by the fixed telecom network community, such as energy efficiency, capacity scaling, cost-efficiency, etc., while also revealing potential future directions.

1. Introduction

Telecommunications hugely impact important aspects of our lives, such as social and economic activities. Modern telecommunications are the offspring of the second Industrial Revolution, which emerged with the deployment of the Public Switched Telephone Network (PSTN) in the second half of the 19th century. During the past century, the main service that the PSTN could underpin was telephony. Only after the third Industrial Revolution (that marked the dawn of the Internet) with the great advances in electronics and informatics, the introduction of new services could become a reality. Today, we are at the dawn of a new era, the fourth Industrial Revolution, which will fundamentally change the way we live, work, and communicate. Unlike in the previous three, in the fourth revolution era, various processes, such as fixed/wireless communication, computing and sensing, will converge into a single network entity. This transformed network, and especially its access part, will perform simultaneously both as a sensor and as a supercomputer, enabling new ways in which the physical world will be represented through a digital counterpart (i.e., “digital twin”. This digital representation will provide additional features to further optimize network operation [1].
This work aims to examine and review the key technological advances in fixed telecommunication networks over the past 50 years. In particular, the starting point of this survey is 1970 and the ending point is 2020, examining the impact of the third Industrial Revolution on the various layers of the telecommunications ecosystem. The motivation for our work is the lack of a comprehensive overview of the evolution of fixed networking in a concise way that takes into consideration the key enablers, the physical layer advances and limitations, the networking challenges from core to access, as well as the evolution of the offered services. As the wireless networks and their generations have been extensively investigated in the literature, the fixed networks lack a consistent exploration of their evolution over the past 50 years.
Our work follows the F5G timeline of evolution [2] for the five generations of fixed networks. First, each generation is segregated into three layers, namely physical, networking (both core and access part) and service. In this work, the adopted taxonomy of layers is different from the OSI-compliant taxonomy. Next, the key achievements and limitations of each generation and for each different layer are discussed, designating the most important bottlenecks of the most widely adopted technologies and standards. Finally, this analysis helps to reveal the technical challenges posed to the network operators of the fixed telecom industry, such as energy efficiency, capacity scaling, cost-efficiency, etc., revealing potential future directions.
This survey is organized as follows. Section 2 analyzes the layered approach, which is adopted to study the fixed network from various viewpoints. In Section 3, the key services are examined along with their main requirements for each generation, showing that the network development is service driven as the needs from a user’s perspective are always increasing with time. In Section 4, both parts of the network layer, namely access and backbone, are studied. In Section 4.1, the evolution of the various access standards is examined, and next an outlook on future approaches is presented. In Section 4.2, the backbone part of the network is presented, and the main achievements are classified into the five fixed network generations. In Section 5, the advances of the physical layer (both in access and backbone) are categorized and analyzed per generation, along with the most important achievements. In Section 6, the main opportunities and technical challenges for network operators are briefly presented, and potential future directions are discussed. Finally, concluding remarks are found in Section 7.

2. Methodology

This work has adopted the F5G group timeline [2], which defines the time duration of each generation of fixed networks, while a layered approach is adopted in order to examine the first five generations from three different perspectives, namely the app/service perspective, the networking perspective and the physical layer perspective. These layers are dissimilar to the OSI-compliant layers. Our approach is illustrated in Figure 1. The network and physical layer can also be decoupled into two sub-parts: the backbone and access. We chose a layered approach for three reasons. First, a layered analysis reduces the overall complexity as it elegantly categorizes the vast number of existing standards and technologies into a small number of groups. Second, it facilitates engineering in modules, simplifying teaching and learning. Last but not least, it aims to define the main limitations and novelties of each generation from various viewpoints.
Each of the three layers has specified targets in order to serve the final user seamlessly and efficiently. In particular, the physical layer aims to increase the transport capacity and transmission reach. Next, the network layer is responsible for providing increased connectivity and reduced latency in order to attain sufficient quality of service (QoS) and reliability. Finally, the app/service layer is targeting towards maximizing the user’s quality of experience (QoE). Our procedure regarding the five generations is dialectical, as it follows an evolutionary manner; that is, the limitations of each generation are becoming the novelties of the next one. In this way, the burdens of each layer for each generation are becoming more distinguishable. This dialectical analysis reveals that each layer evolved at a different pace, as the evolutionary drivers and the limitations are completely different among the three layers. For example, the app/service layer evolved rapidly after 2005 due to the introduction of video services, the access part of the network layer showed significant advances even from the first generation, while the backbone part of the network layer blossomed after 2000 due to the success of Synchronous Optical NETworking (SONET)/Synchronous Digital Hierarchy (SDH). Finally, the physical layer shows a more balanced evolution over the 50 years (1970–2020) and significant technological advances can be found in all five decades. As a consequence, in the app/service layer and in the network layer, the timeline of the F5G group is followed; however, in the physical layer, a different timeframe is considered in order to designate all the principal milestones, as shown in Figure 1. In the next three sections, we analyze the evolution of the fixed networks from three different perspectives.

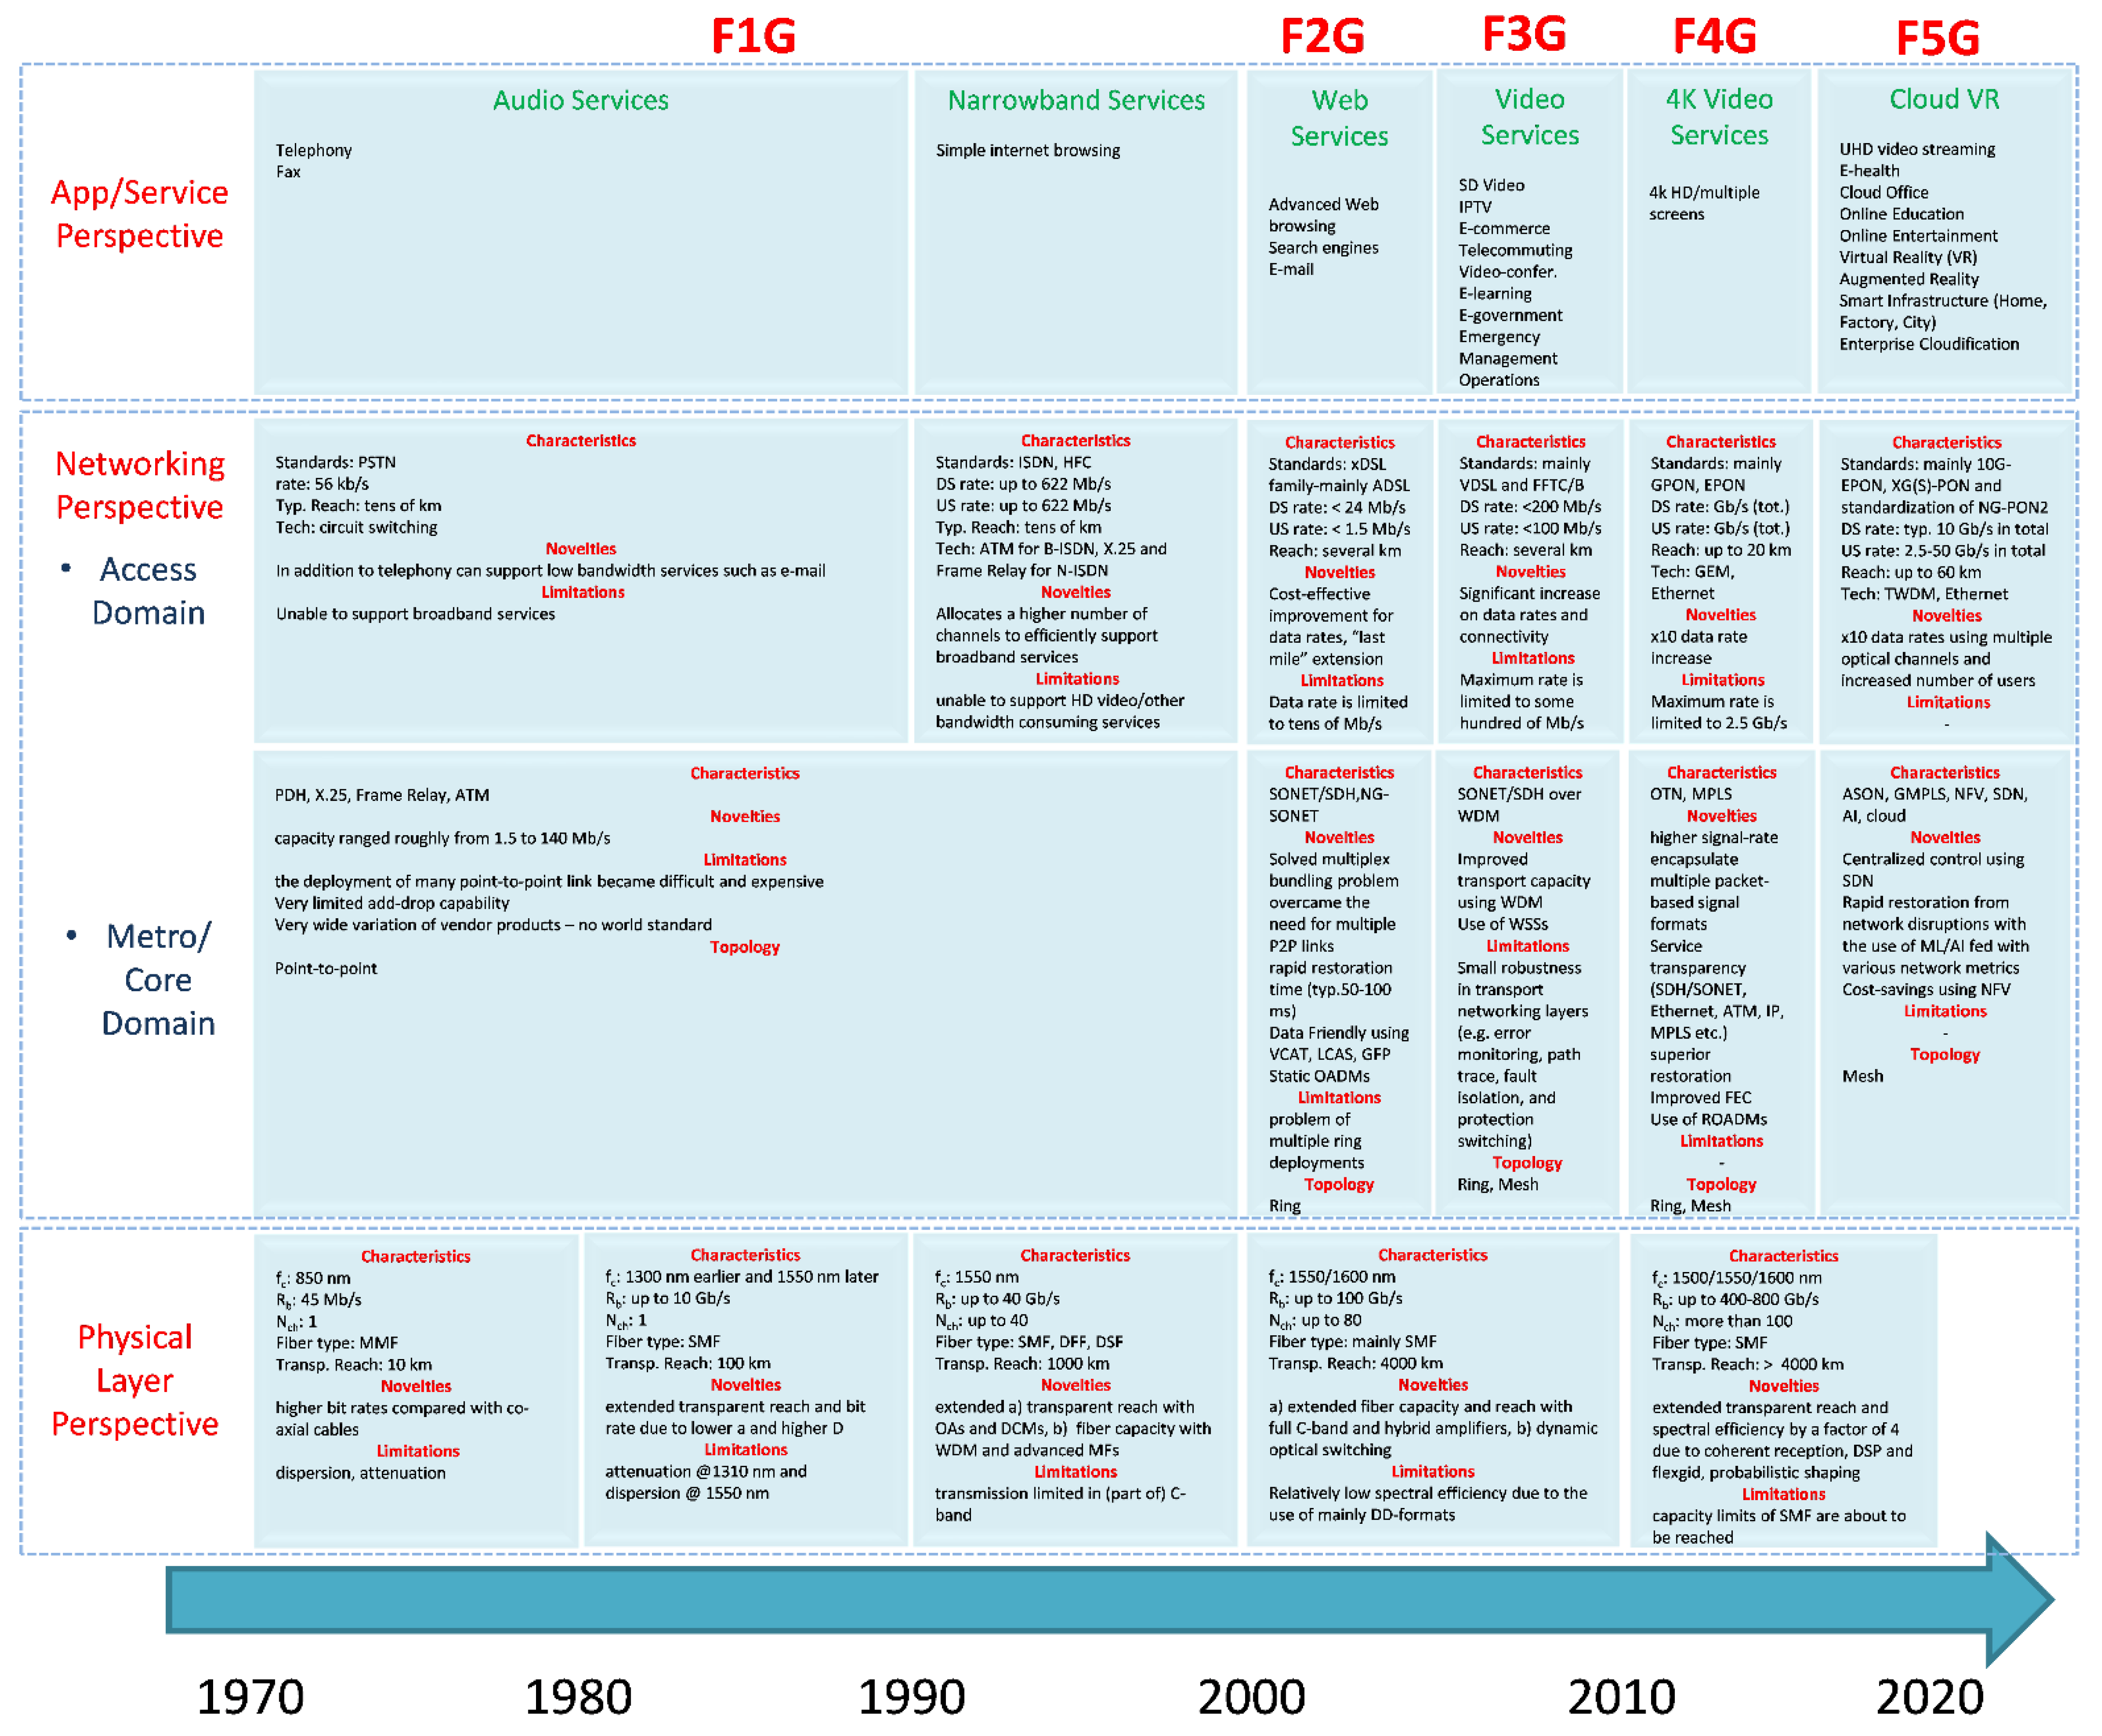
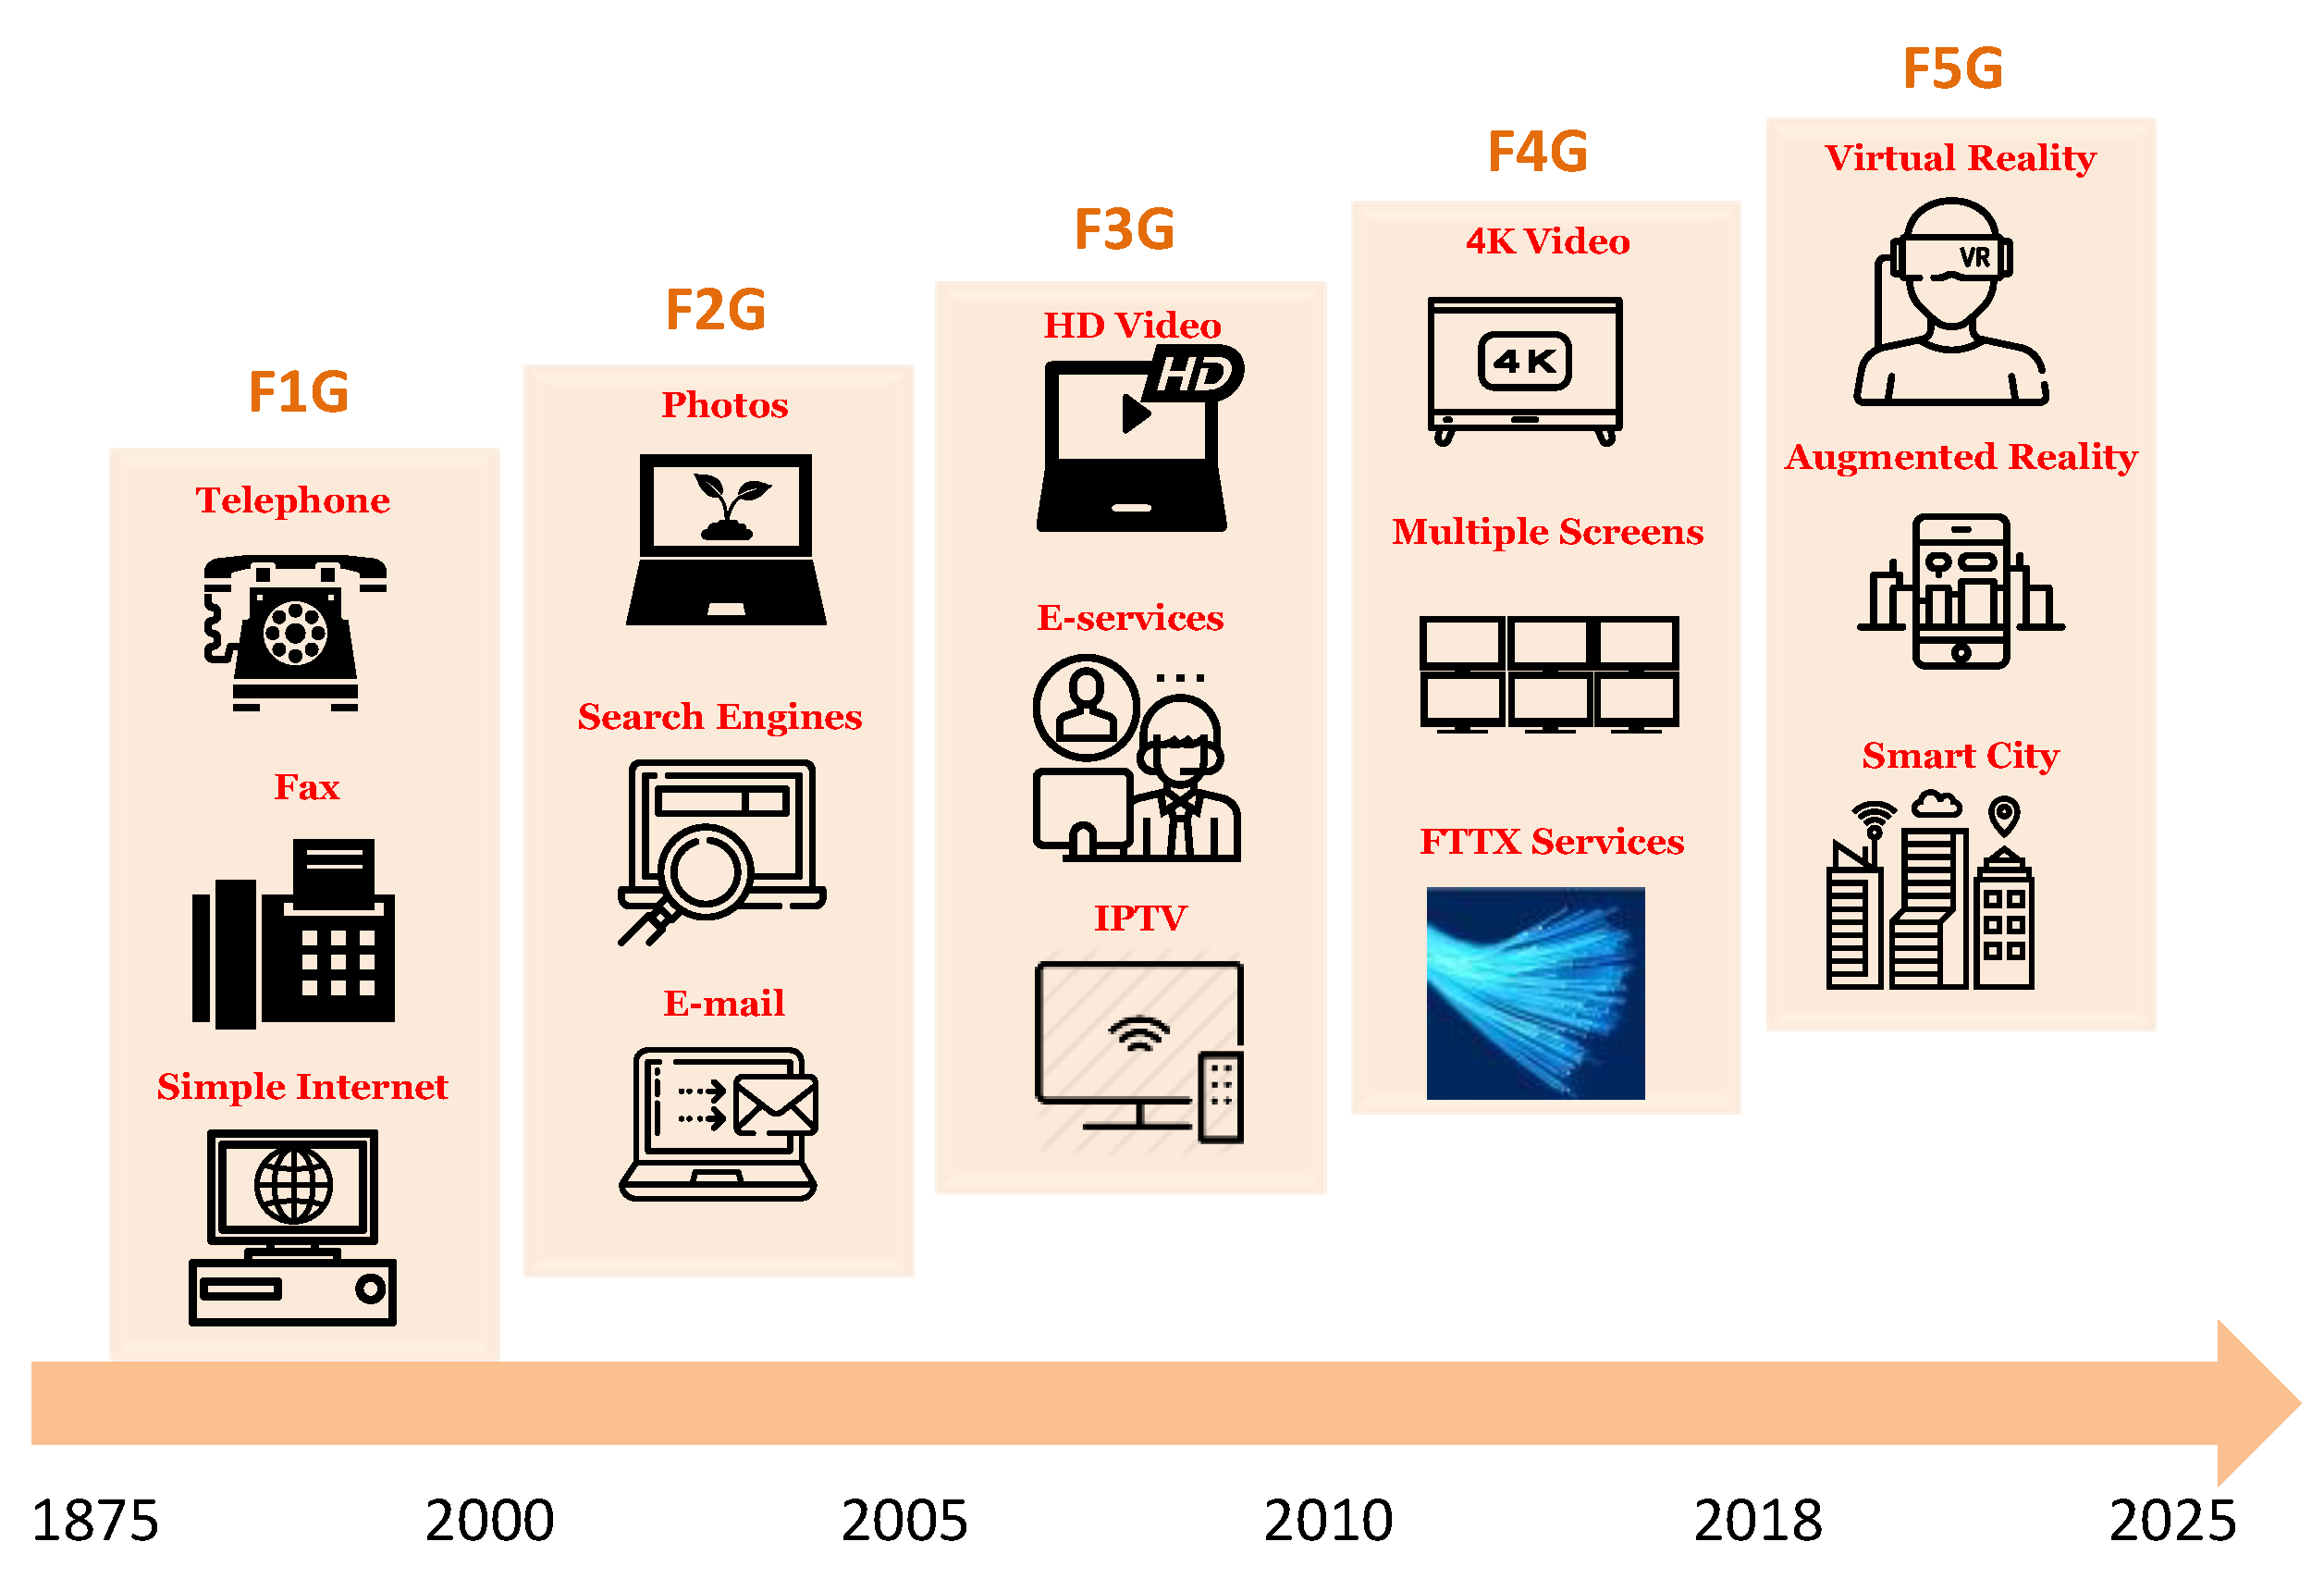
3. Services Layer: From Telephony to Virtual Reality

In this section, we discuss the service types and their requirements for all five fixed network generations in an evolutionary manner. We wish to analyze the needs from a user’s perspective, which is the most critical factor, as he/she will decide if he/she will continue to pay for the service or terminate it. In order to answer positively, it is important for the network/service provider to maximize the user’s overall satisfaction. This satisfaction varies greatly among different service types, and, as a consequence, we try to designate the main factors that affect the end user’s QoE in each generation. To elaborate on this, we first illustrate the most representative services for each generation in Figure 2, and then we discuss their requirements in the following subsection.

3.1. Discussion on the Needs from User’s Perspective

According to the ETSI F5G Group [2], the types of users can be classified into three main categories, namely residential users, business and vertical industries. Each type of user enjoys a different gamut of services, for which the requirements vary. The network/service provider, in order to meet the service requirements, has to ensure sufficient values of key indicators, such as QoS and QoE, over the whole service life cycle. On one hand, QoE has a subjective nature, and apart from the network performance, it depends on the user’s background, expectations, emotional state, etc. On the other hand, QoS directly depends on the number of network and physical layer performance metrics such as bit error rate (BER), latency, jitter, etc.
For residential users, the most important requirement for real time services is low latency, and for non-real time services, is the sufficient data rate. In business services, smart offices and cloud services are the key elements for the F5G development, requiring sufficient bandwidth, security and high availability. For vertical industries, services such as smart cities require high connectivity, availability, security, operational and energy efficiency. Overall, there is a list of various metrics that have to be ensured by the network provider in order to maintain the QoS for this wide range of services in the F5G era, which highlights the indispensable transformation of the whole network ecosystem in the coming years in order to achieve it.
The F5G services, based on their requirements, can be classified into three categories, as illustrated in Figure 3, namely enhanced fixed broadband (eFBB), full fiber connection (FFC) and guaranteed reliable experience (GRE). The eFFB category includes services that require fixed broadband connections with data rates greater than 1 Gb/s per user and per transmission direction. Representative services of this family are ultra-high definition (UHD) video streaming, cloud office and virtual/augmented reality. Next, the FFC category demands full fiber coverage and massive/dense fiber connections. Smart infrastructure (cities, campuses, homes and manufacturing), enterprise cloudification and the interconnection with the 5G network can be incorporated into this family. Further, the GRE model mainly includes services which aim to maximize the user’s QoE, such as online e-learning, online gaming, virtual/augmented reality, real time social networking and e-health. The main metric of interest here is the low latency in order to ensure seamless service operation along with great QoE.
An important challenge for the network providers on the road towards F5G is to sufficiently support services that are located at the intersection of two or three families. For example, data center interconnection requires, concurrently, full fiber connectivity, low latency and a high data rate. Further, UHD live streaming and online virtual and augmented reality require both low latency and sufficient data rates. In our opinion, in F5G as well as en route towards F6G, a significant number of services with multiple key requirements (low latency, great connectivity and high data rate) that have to be met concurrently, will emerge, and a considerable amount or research has to be carried out in the near future in order to define specific roadmaps and guidelines on how to efficiently support them.

3.2. Main Achievements, Key Services and Requirements of Each Generation

A list with the most representative services for each fixed network generation is shown in Table 1. The requirements of this table have been set using a degree of arbitrariness, as a strict definition of their specific values is a very difficult procedure since a service may include: (a) different types of user participation, such as passive or active, e.g., in online learning; (b) different video definitions, such as high or low, e.g., in videoconferencing; and (c) a different number of employed features, e.g., in smart infrastructure. In the rest of this section, we elaborate on the main services and their requirements based on Table 1.
F1G: 1970–2000 (the narrowband-to-wideband era)
The F1G era is dedicated mainly to telephony and fax, which required 64 kb/s data rates and latency of tens of ms. Generic internet browsing also became possible mainly at the end of this era, as significant technological achievements such as IPv4, Ethernet and the OSI reference model were standardized during the 1980s. At first, access to the PSTN infrastructure, along with the use of a modem, allowed the essential elements to connect to the Internet. Later, the introduction of the Integrated Services Digital Network (ISDN) standard, depending on its narrowband or broadband variant, increased the overall data rate, decreasing in this way the overall user’s downloading time.
F2G: 2000–2005 (the wideband era)
The second era provided Mb/s data rates and allowed the users to enter the broadband era (as it was perceived at that time). This generation comprised Internet-centered services, such as web browsing, search engines, e-mail, image downloading and low-resolution video. Overall, a F2G network provider in order to efficiently serve the end users had to offer data rates larger than 1 Mb/s, medium latency at the order of a fraction of a second and high availability, especially in companies that used the World Wide Web for their business purposes. This became possible with the introduction of Asymmetric Digital Subscriber Line (ADSL) technology, which exploited the copper spectrum more efficiently than PSTN and ISDN.
F3G: 2005–2010 (the broadband era)
The third generation of fixed networks introduced a broader range of broadband services targeting a variety of different users: from residential areas to businesses and from universities to government services. The requirements of each service varied, and the network provider had to tailor the network to each category in order to serve multiple heterogeneous services. For example, emergency management services require great network reliability, as their seamless and with low latency operation is mandated. Moreover, telecommuting requires high network availability due to the increased number of working hours. Further, the users of e-services categories such as e-learning, e-government and e-commerce can tolerate a medium latency. Finally, the minimum data rate required to serve F3G services is set to 5–10 Mb/s. The end users accessed these technologies using xDSL standards, where very-high-bitrate DSL (VDSL) was widely commercialized to support the F3G services, while Fiber to the Cabinet/Building (FTTC/B) increased the network connectivity.
F4G: 2010–2018 (the ultra-broadband era)
The fourth era of fixed networks was clearly dedicated to 4K high-definition (HD) video and the use of multiple screens. This became possible with the wide deployment of Fiber to the Home (FTTH). During this era, network development was accelerated in order to underpin 4k HD video and multiple screens, which were used in the 2012 London Olympics. The main deployed standards of the F4G era were GPON and EPON, while 10G-EPON, NG-PON2 and XG(S)-PON were standardized during this generation. The requirements for 4k HD video include a data rate of at least 50 Mb/s, while latency and availability became tolerable.
F5G: 2018–2025 (the gigaband era)
The fifth generation of fixed networks unleashes a new era of services while skyrocketing the overall user’s QoE. This era is characterized by Gb/s data rates, full fiber connectivity and very low latency in order to seamlessly support a whole new set of services. The network providers are challenged to transform their infrastructure in order to provide at least 1 Gb/s data rate, full fiber coverage as well as less than 1 ms latency. The network and service providers that will invest in this transformation will directly profit from the continuously increasing digital economy, which is expected to rise up to USD 23 trillion by 2025 [3]. Each F5G service has its own merits, however, some predictions on their dynamics have been drawn in [3] and are summarized here.
Cloud VR (Virtual Reality) aims for a high user experience exploiting a 360° view starting from movies and games. The use of VR headsets is expected to grow with an annual rate of 66.7%, attaining an approximate number of about 440 million users by 2025.
Smart homes include a wide range of “intelligent” devices exploiting high data rate connections, Internet of Things (IoT), cloud computing and Artificial Intelligence (AI) integrated with HD video in order to offer the ultimate experience to the residential user. The smart home industry is expected to grow by 129% in a five-year period, achieving an overall market value of USD 154 billion.
Online gaming is a well-established market with more than 2 billion players with an annual growth rate of 9.3% from 2017–2021 and with an overall market value of USD 151.9 billion. VR is expected to significantly boost this type of service.
Cloud desktops or virtual PCs expect to transfer the working office environment everywhere. The growth rate within the period 2016–2022 is expected to reach 39.4%.
Safe city belongs to the smart city family and includes video surveillance, aiming to secure both public and private property. The overall market size is expected to reach USD 24.1 billion by the end of 2022.
Enterprise cloudification will accelerate the migration of core services, such as daily office, enterprise resource planning, customer relationship management, etc., to the cloud. It is forecast that 85% of enterprises will be on the cloud by the end of 2025, and the annual growth will exceed 30% by 2022.
Importantly, online education has accelerated during the COVID-19 pandemic, and it is an attractive solution for students as it allows them to learn anything from anywhere. The online education market worldwide is expected to grow between 2017 and 2026 with a compound annual growth rate of 9.5%, attaining a total of USD 398.15 billion.
E-health aims to remotely monitor patients and perform diagnosis, treatment and consultation. A critical requirement that has to be met is reliability in order to accurately diagnose any potentially unpleasant condition instantly. The global market value of e-health is expected to exceed USD 66 billion by 2022, with an annual growth rate in of 22% China.
Smart manufacturing incorporates the interconnection and integration of all devices onto a single platform for monitoring and configuration. The “digital twin” is expected to play a major role here by digitally replicating the whole production line. The most important requirements are reliability and very low latency in order to fully comply with safety regulations. The market size and growth rate predictions for several F5G services, according to [3], are summarized in Table 2.

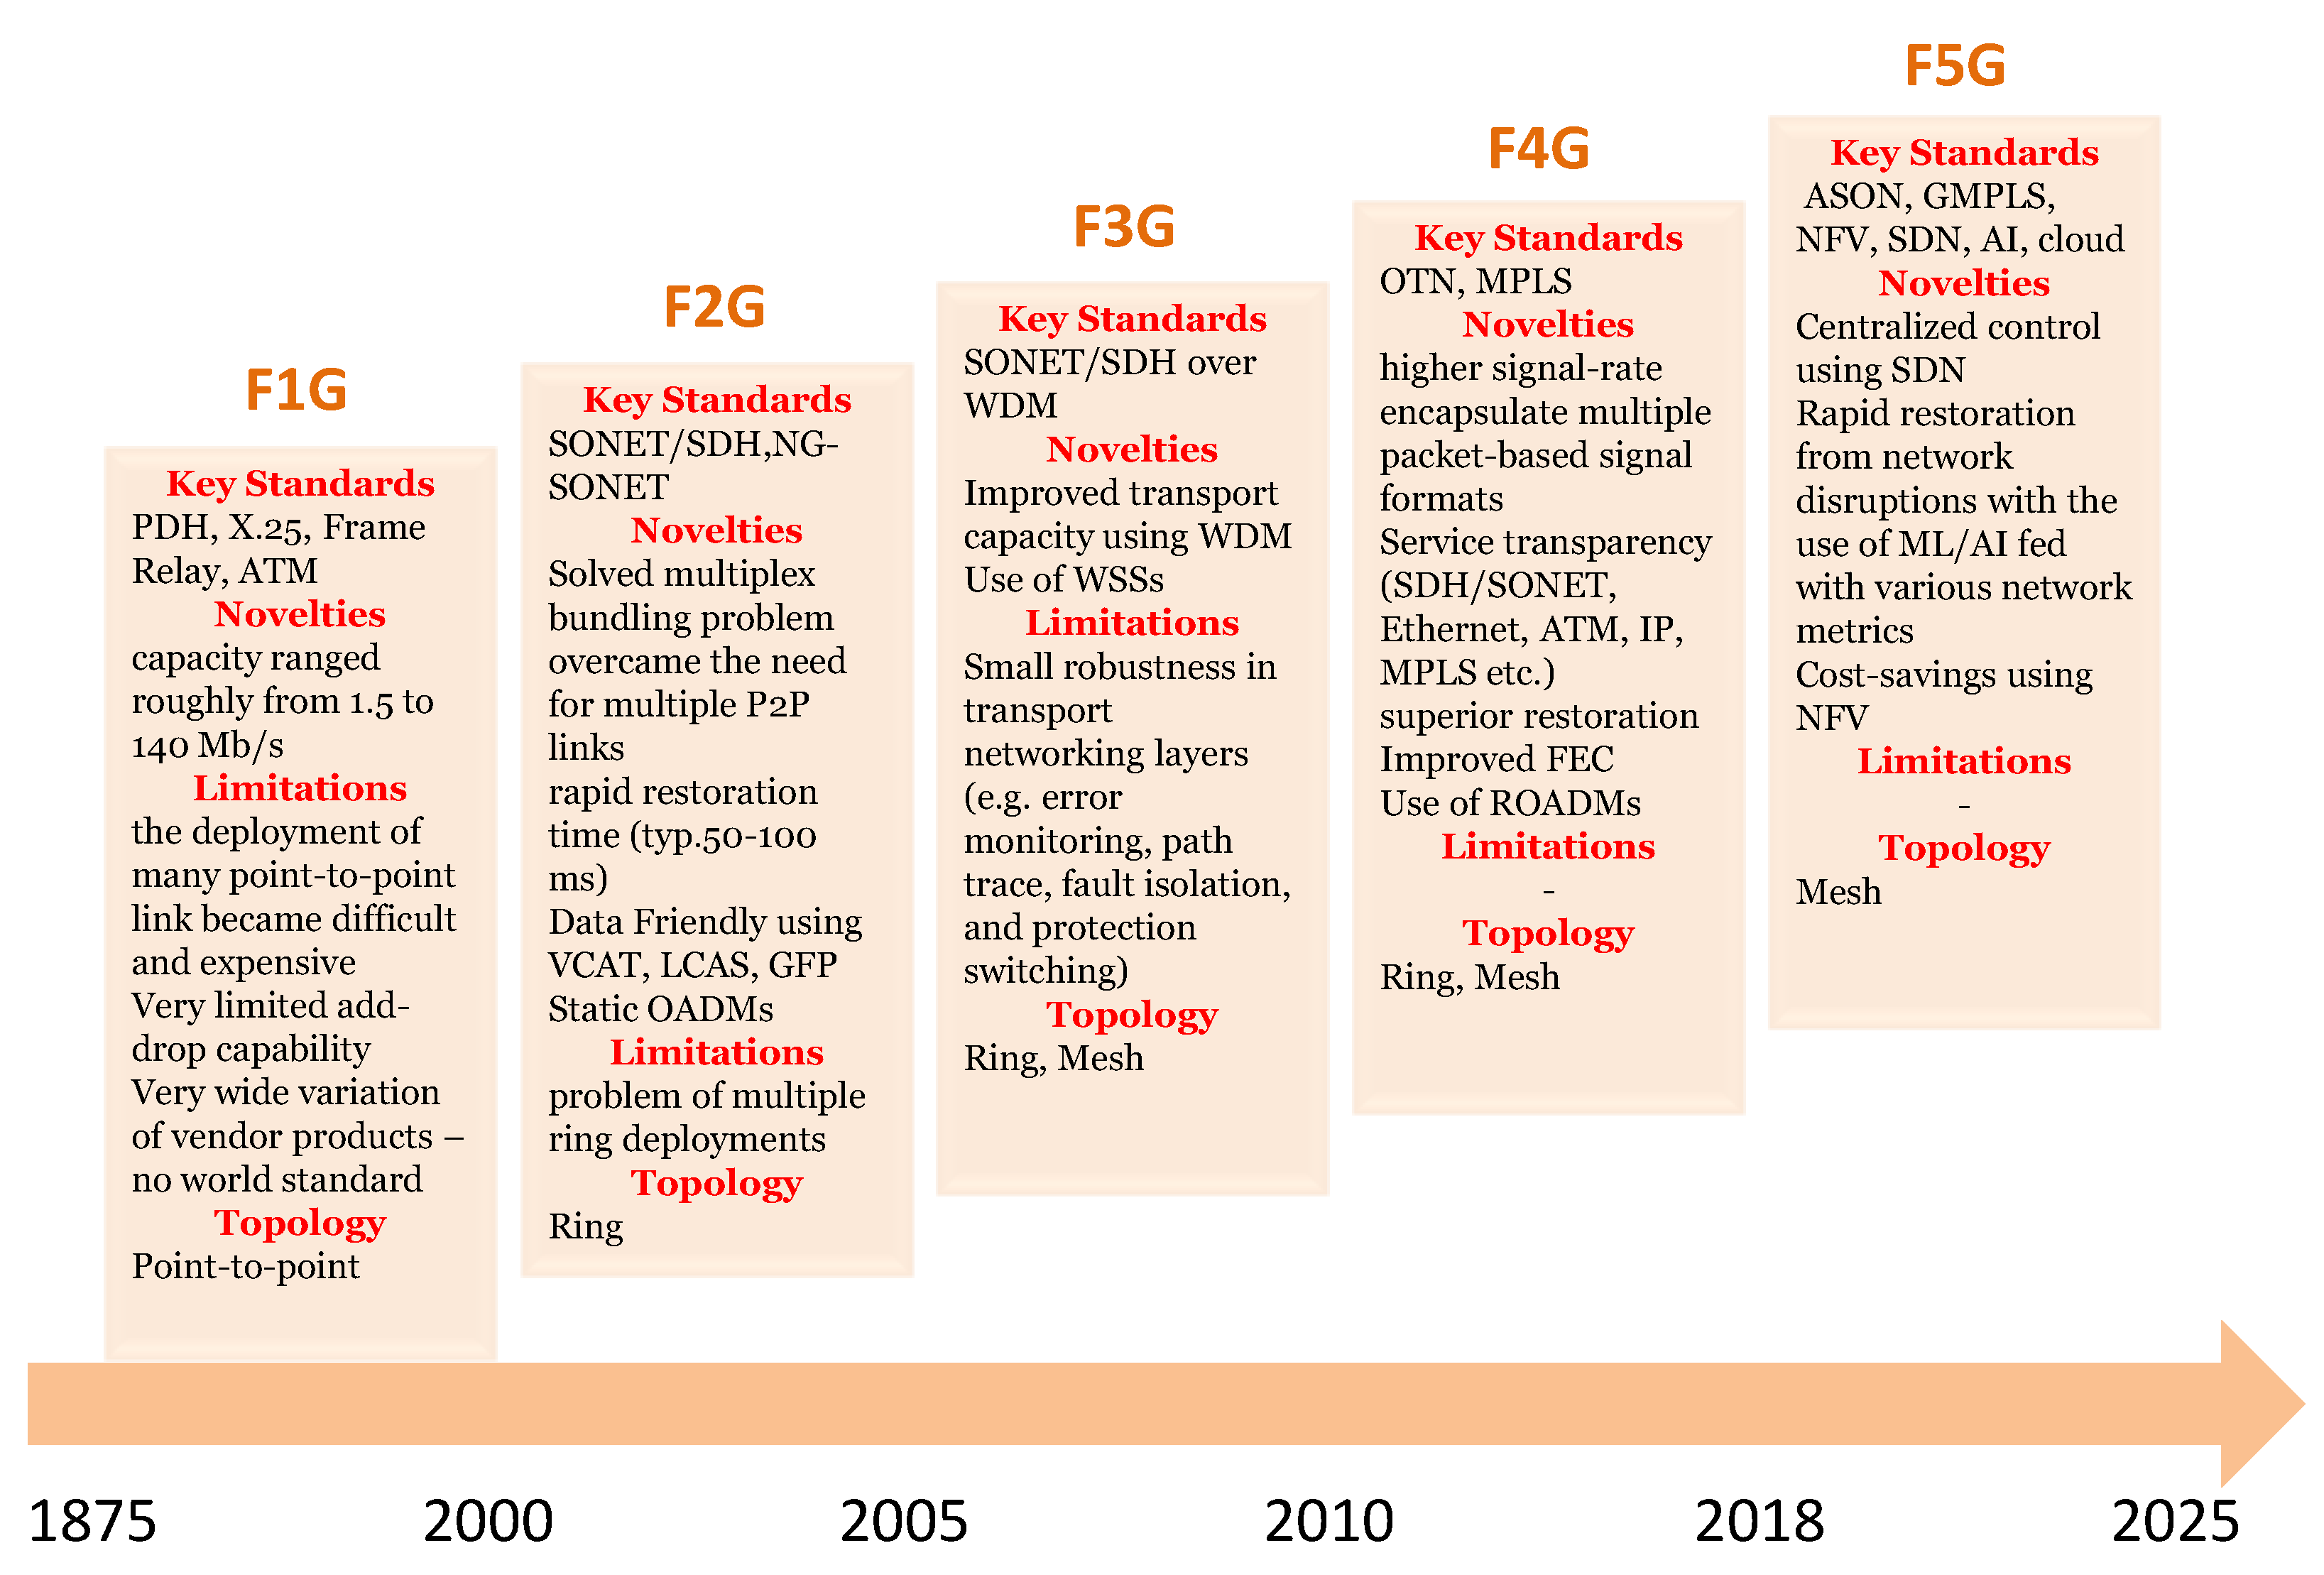
4. Network Layer: The Main Building Block of Fixed Networks

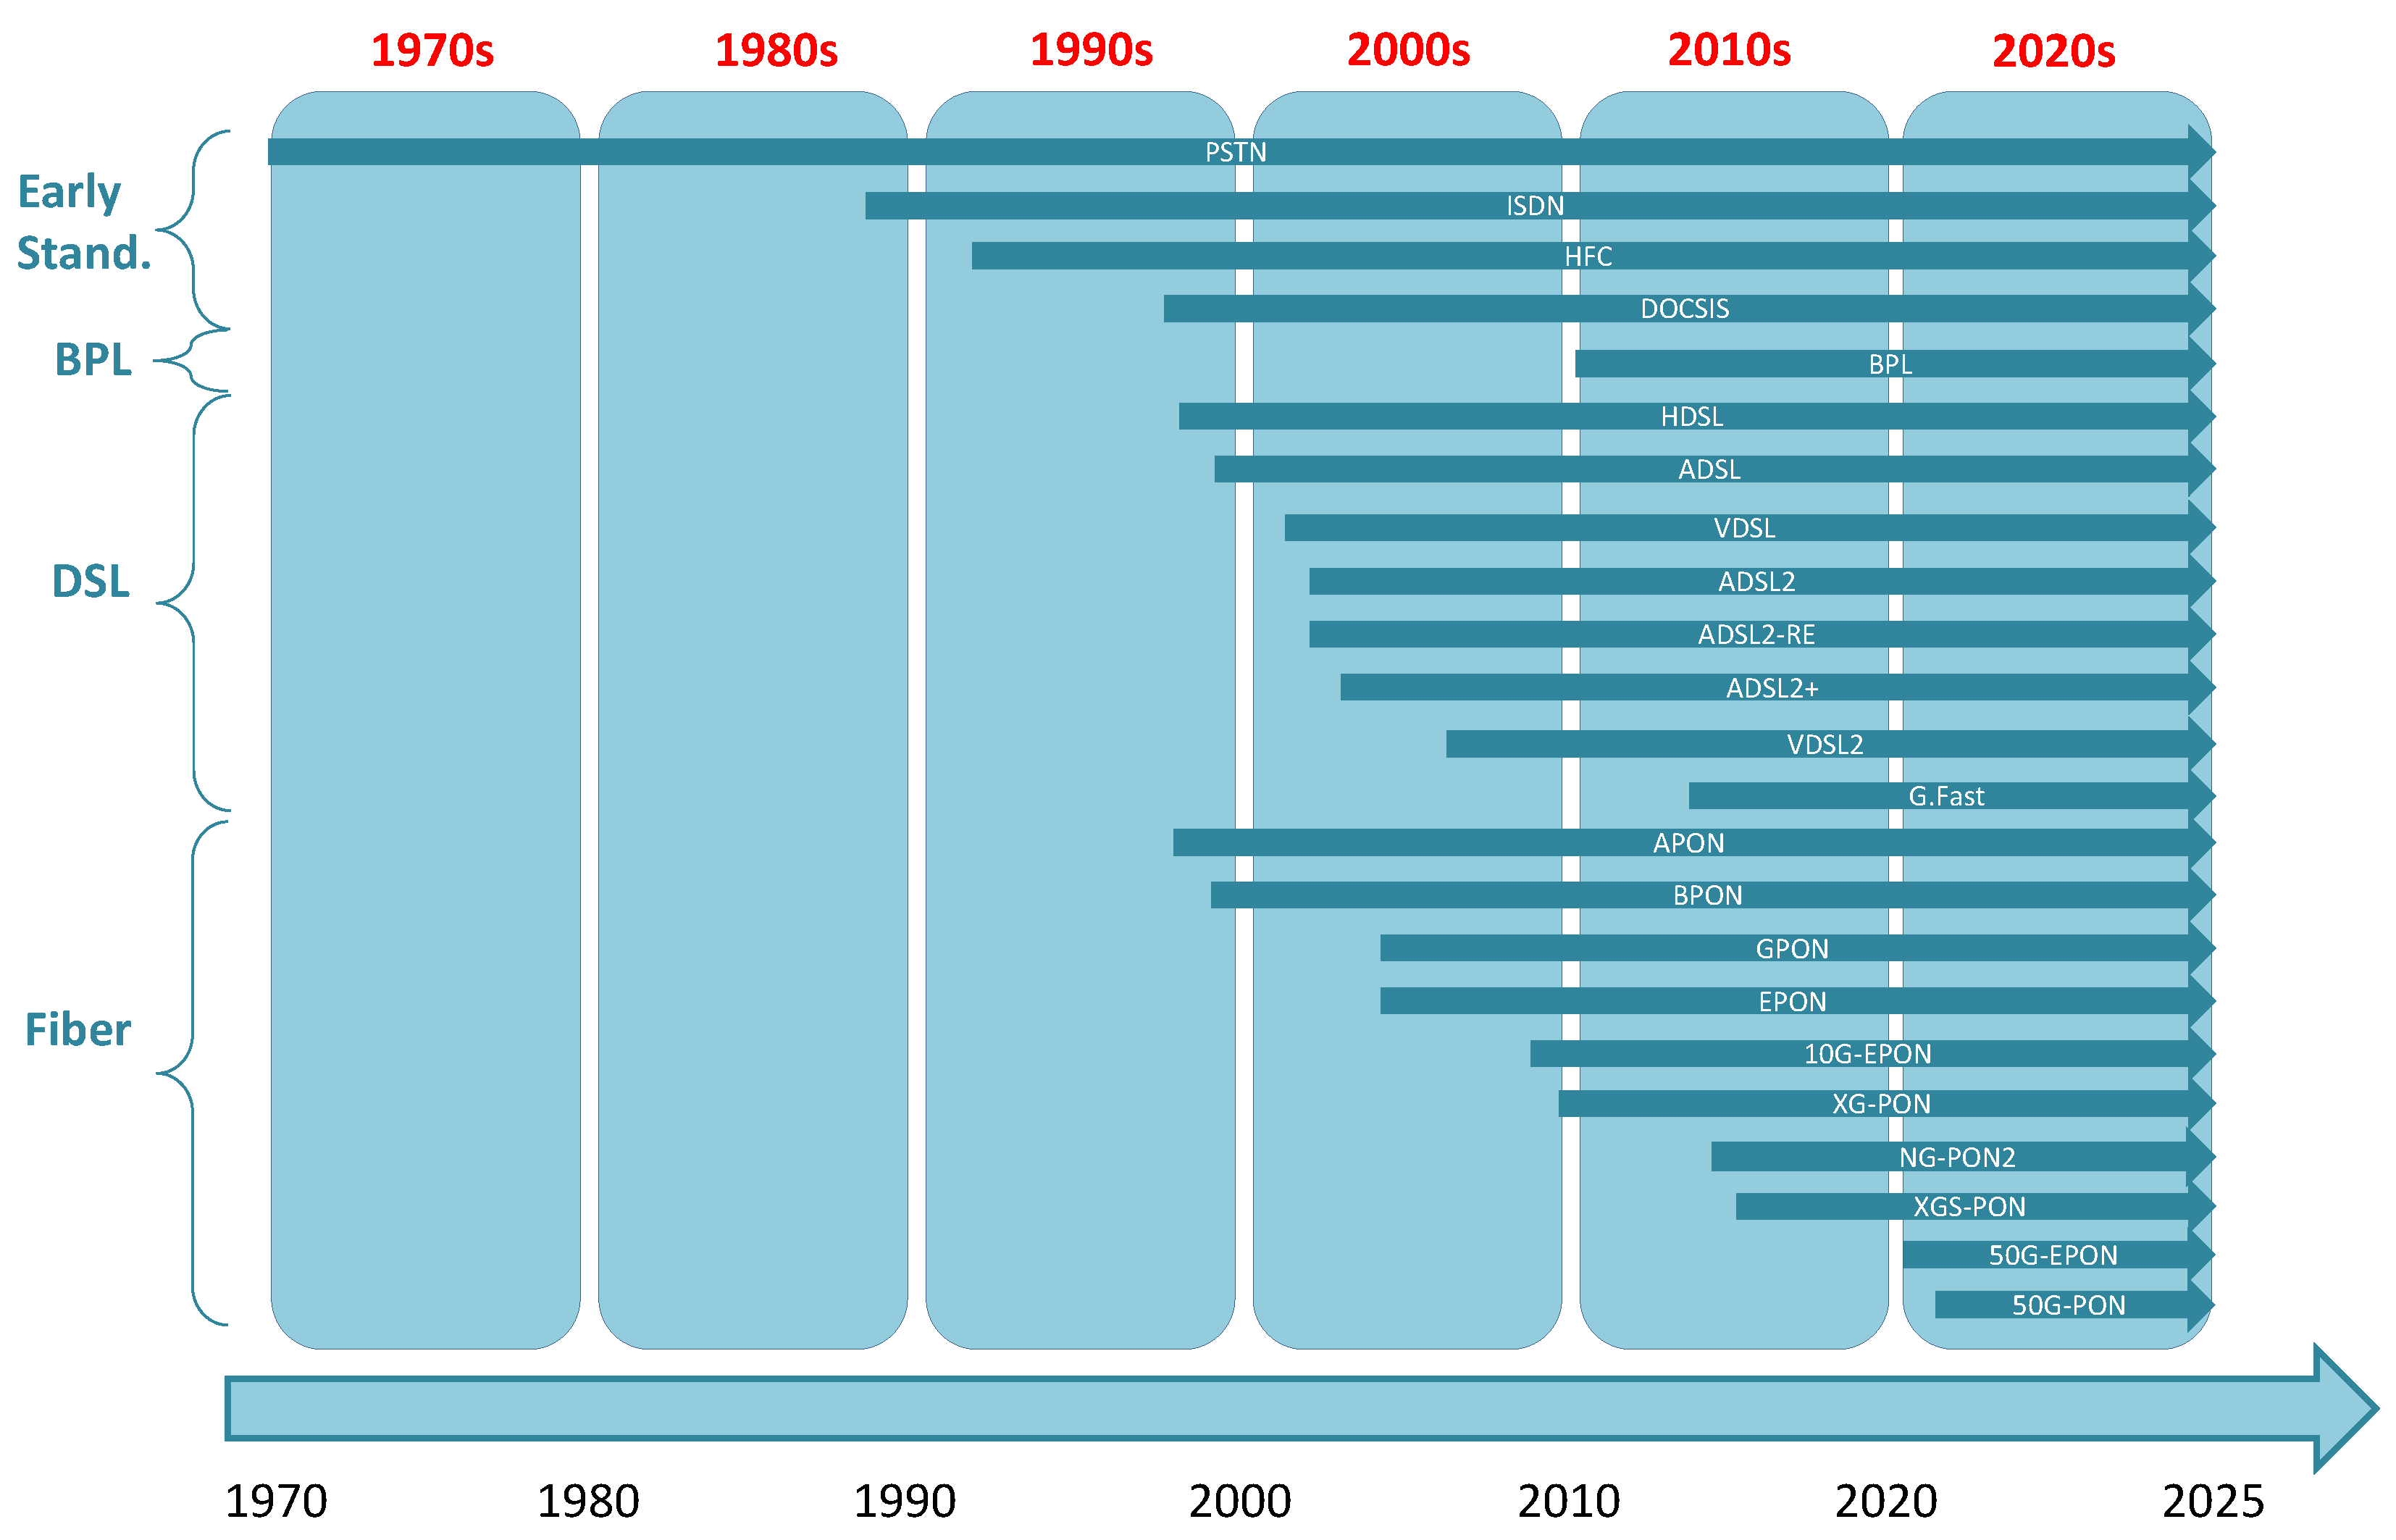
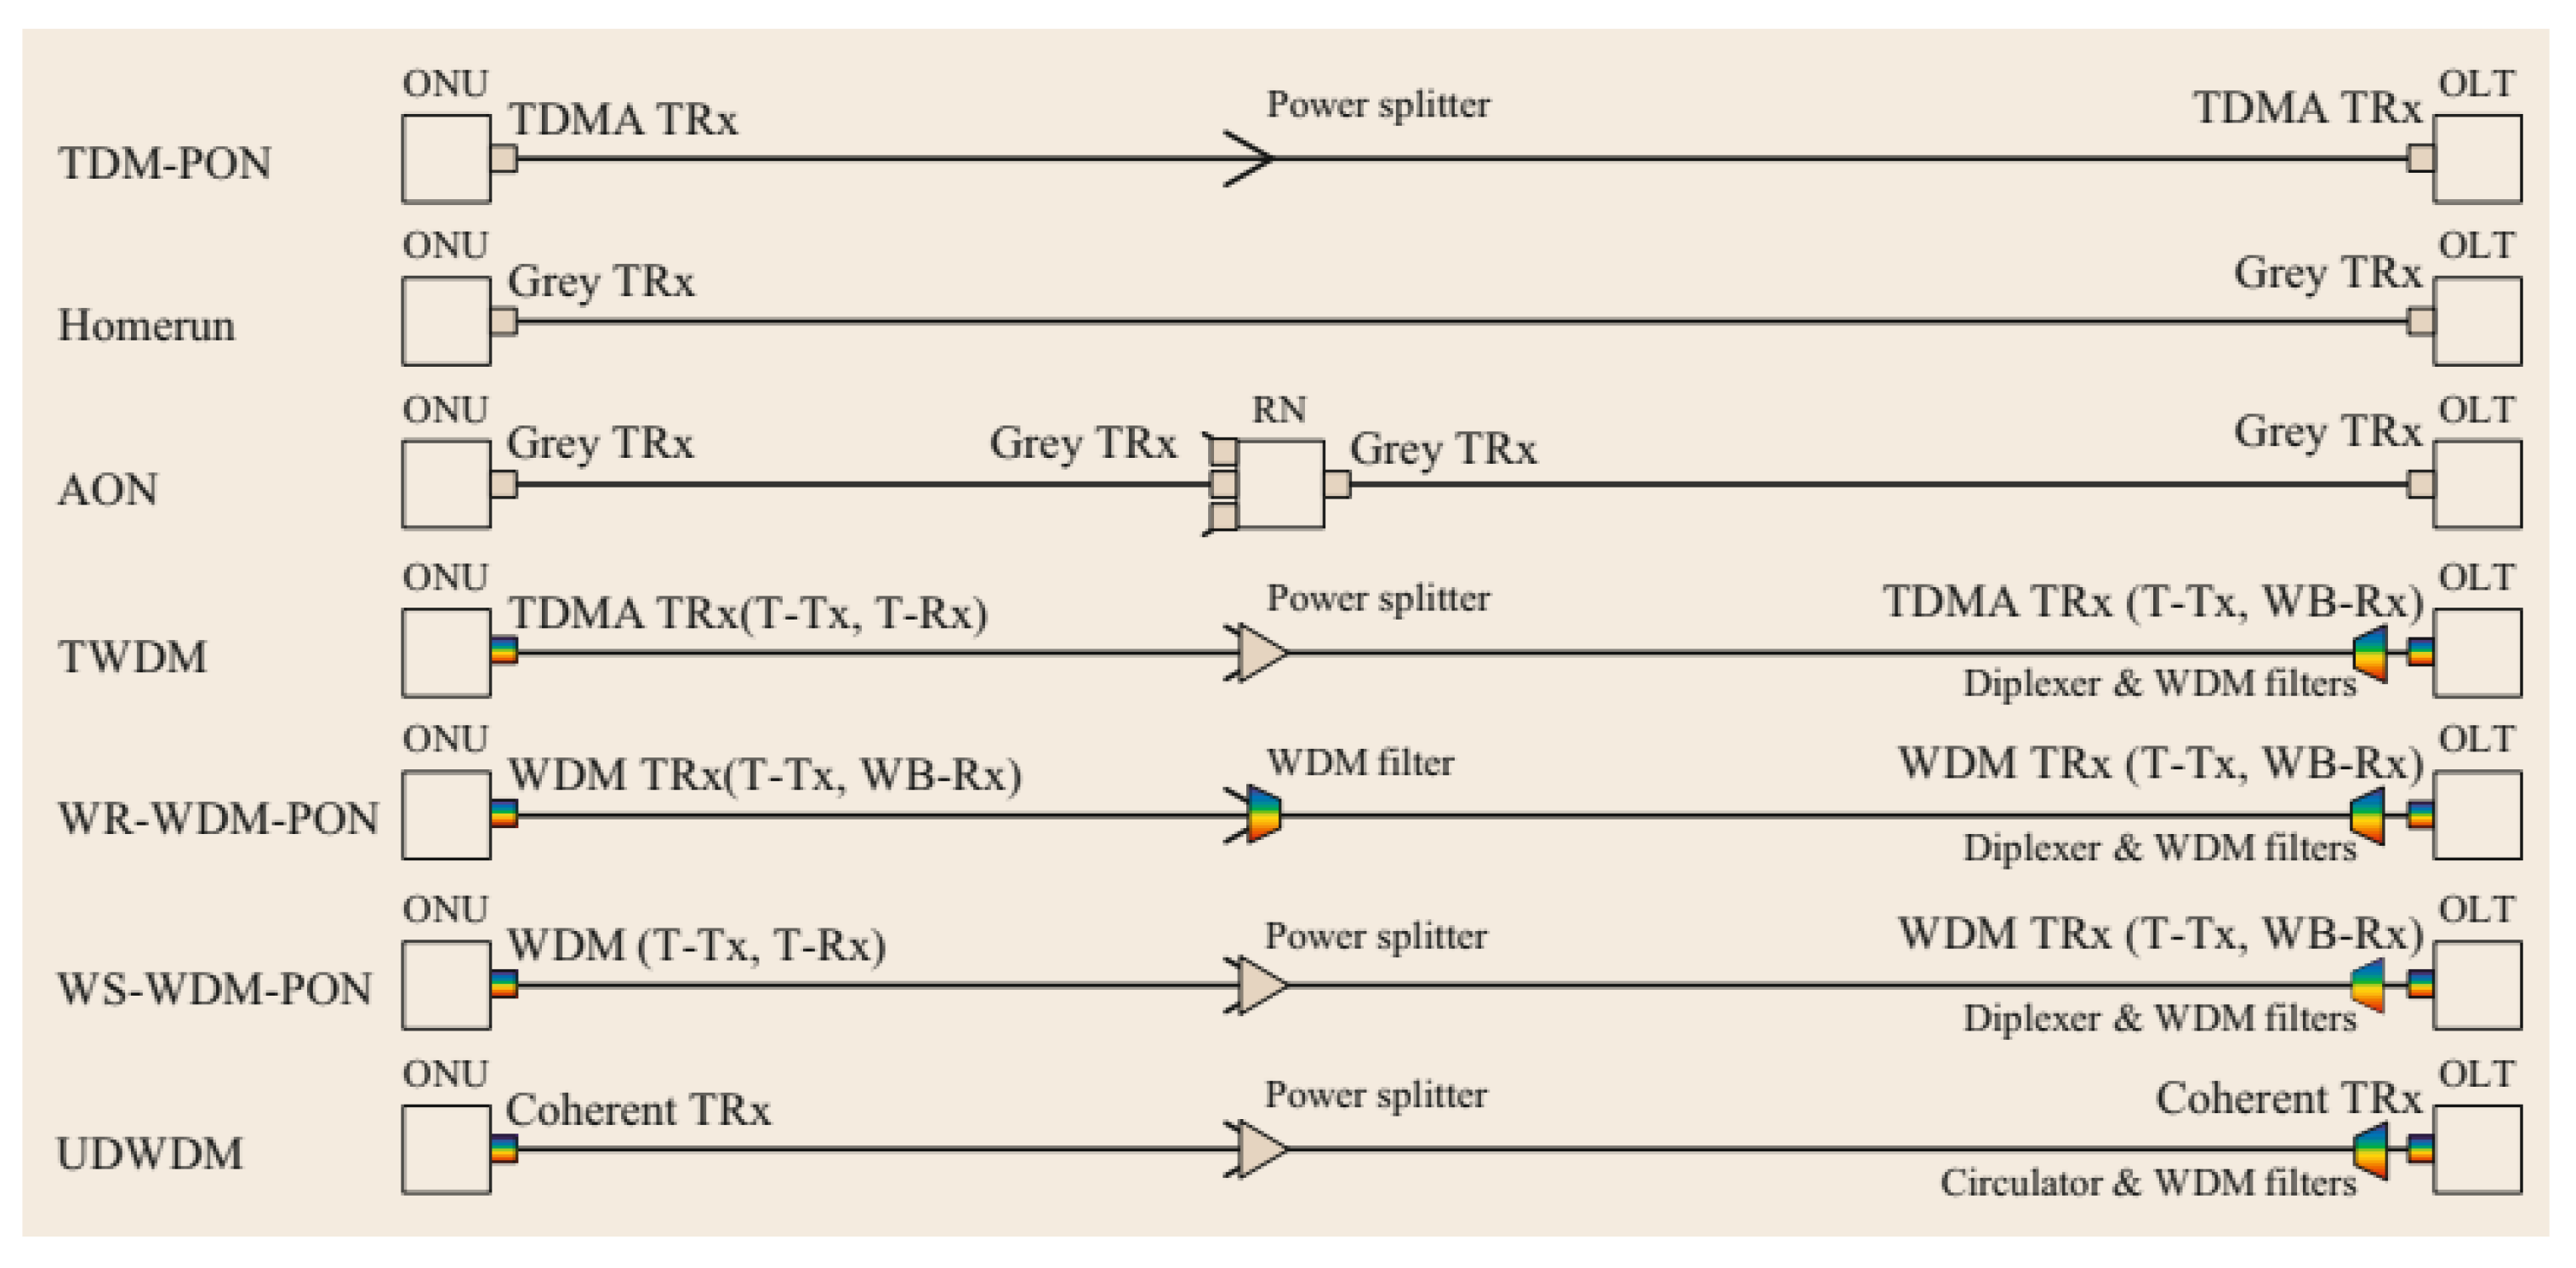
4.1. Five Generations of Access: From PSTN to 50G EPON

Access network is the easiest and least costly part of upgrade compared to (for instance) core, in order to improve QoS and increase the availability to end users. Over the last fifty years, various ways of accessing the network have been proposed, as illustrated in Figure 4, each having its pros and cons. The first generation of fixed networks includes PSTN, ISDN and hybrid fiber-co-axial (HFC) standards to provide access to the end users, while the majority of DSL and passive optical network (PON) technologies were standardized during the second generation. More details regarding copper-based standards (e.g., PSTN, ISDN, HFC, Data Over Cable Service Interface Specification (DOCSIS) and DSL) can be found in Table 3, while a more elaborated picture of the PON family is shown in Table 4. In the rest of this subsection, we elaborate on the access technologies for each of the five fixed network generations.

4.1.1. F1G—1970′s

PSTN: The first generation of fixed-access (F1G) network architecture comprises the use of the Public Switched Telephone Network (PSTN, which appeared in 1875). Thanks to call setup and the fixed bandwidth PSTN requirements, a certain QoS can be guaranteed end-to-end during the entire duration of a connection. Another special characteristic of a circuit switching network as an access technology is the equal share of the transmission link bandwidth among its users. Although circuit switching has the advantage of QoS, it has the disadvantage of ineffective utilization of the link bandwidth (bandwidth is occupied even if it is not used). Of course, the F1G network belongs to the narrowband era, and thus it is unable to support broadband services. An advantage of this F1G network is the access distance of tens of km (typical reach). Needless to say, fiber optic cables (which are incorporated into the contemporary PSTN) were not included in the PSTN of the 1970s.

4.1.2. F1G—1980′s

LAN: A local area network (LAN) is not only a computer network covering a small geographical region, but it also stands for a common link that connects LAN users to the global Internet. LAN has the advantage of serving many more users than PSTN; its disadvantage is the absence of a QoS guarantee. The involved protocols play a key role in both transmission efficiency and the QoS offered to the users. To concentrate on some important “fixed” LAN configurations, in accordance with the utilized data-link layer protocol, the LAN is called Ethernet LAN (IEEE 802.3), token-ring LAN (IEEE 802.5), or FDDI (Fiber Distributed Data Interface) LAN (ANSI X3T9.5) (Figure 5) [4].
ISDN: In ISDN, the network access interface is called the basic rate interface (BRI) and is offered to the user over a twisted pair of copper wires. BRI consists of two “B” (Bearer) channels of 64 kb/s (readily aggregated to one channel of 128 kb/s) and one “D” (Delta or Data) channel of 16 kb/s. Users need to be within a 5.5 km distance of the local ISDN office to have a BRI-line. Although ISDN could offer to the users a higher number of B channels (e.g., six B channels, 384 kb/s, for the videophone service), ISDN was unable to support broadband services such as a HD video service, and became obsolete with the advent of DSL systems.

4.1.3. F1G—1990′s (Wideband Era)

In the 1990s, although backbone networks could provide high-capacity links based on SONET/SDH systems (over 10 Gb/s), access networks were the limiting factor for the provision of broadband services to users, e.g., video on-demand, interactive/video games and video conferencing. Access networks, such as DSL, could provide relatively low bandwidth, especially in the upstream direction (in the order of a few hundred kb/s). Moreover, even if some versions of DSL could provide a higher bandwidth (50 Mb/s) in the downstream direction, the access distance is short enough (up to 6 km, or, in the case of 50 Mb/s, significantly less) [5]. It is worth mentioning that DOCSIS systems used by cable television operators provided not only cable television (CATV—Community Antenna Television) but also internet access over the existing infrastructure of HFC, covering a much longer distance (up to 160 km) and offering a broadband access (up to 1 Gb/s in the downstream direction). However, since these systems have been designed for broadcasting, their use as access networks by allocating bandwidth to users according to demands, it is not the most proper solution for broadband access. Nevertheless, HFC showed that troubleshooting existing access networks could be accomplished by the extensive use of fiber optics, which offer ample bandwidth with very low losses [6].

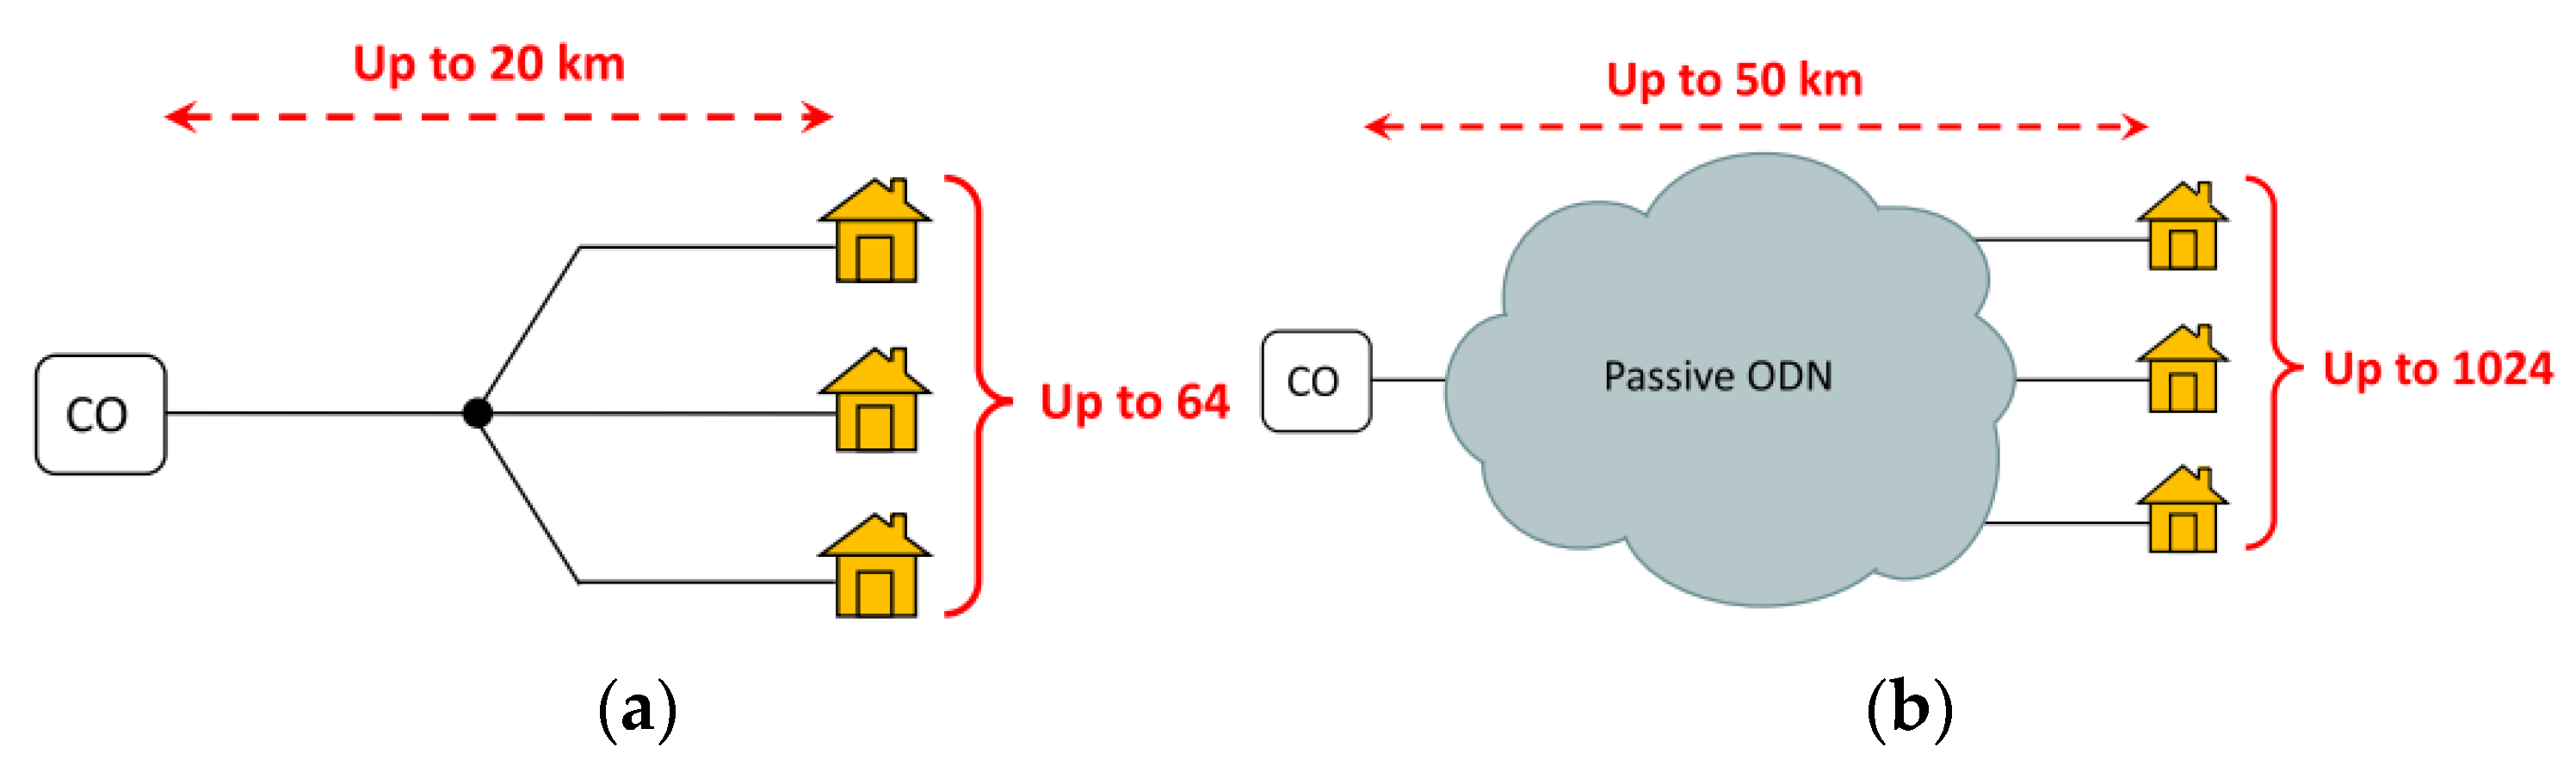
F1G—Optical Access Networks
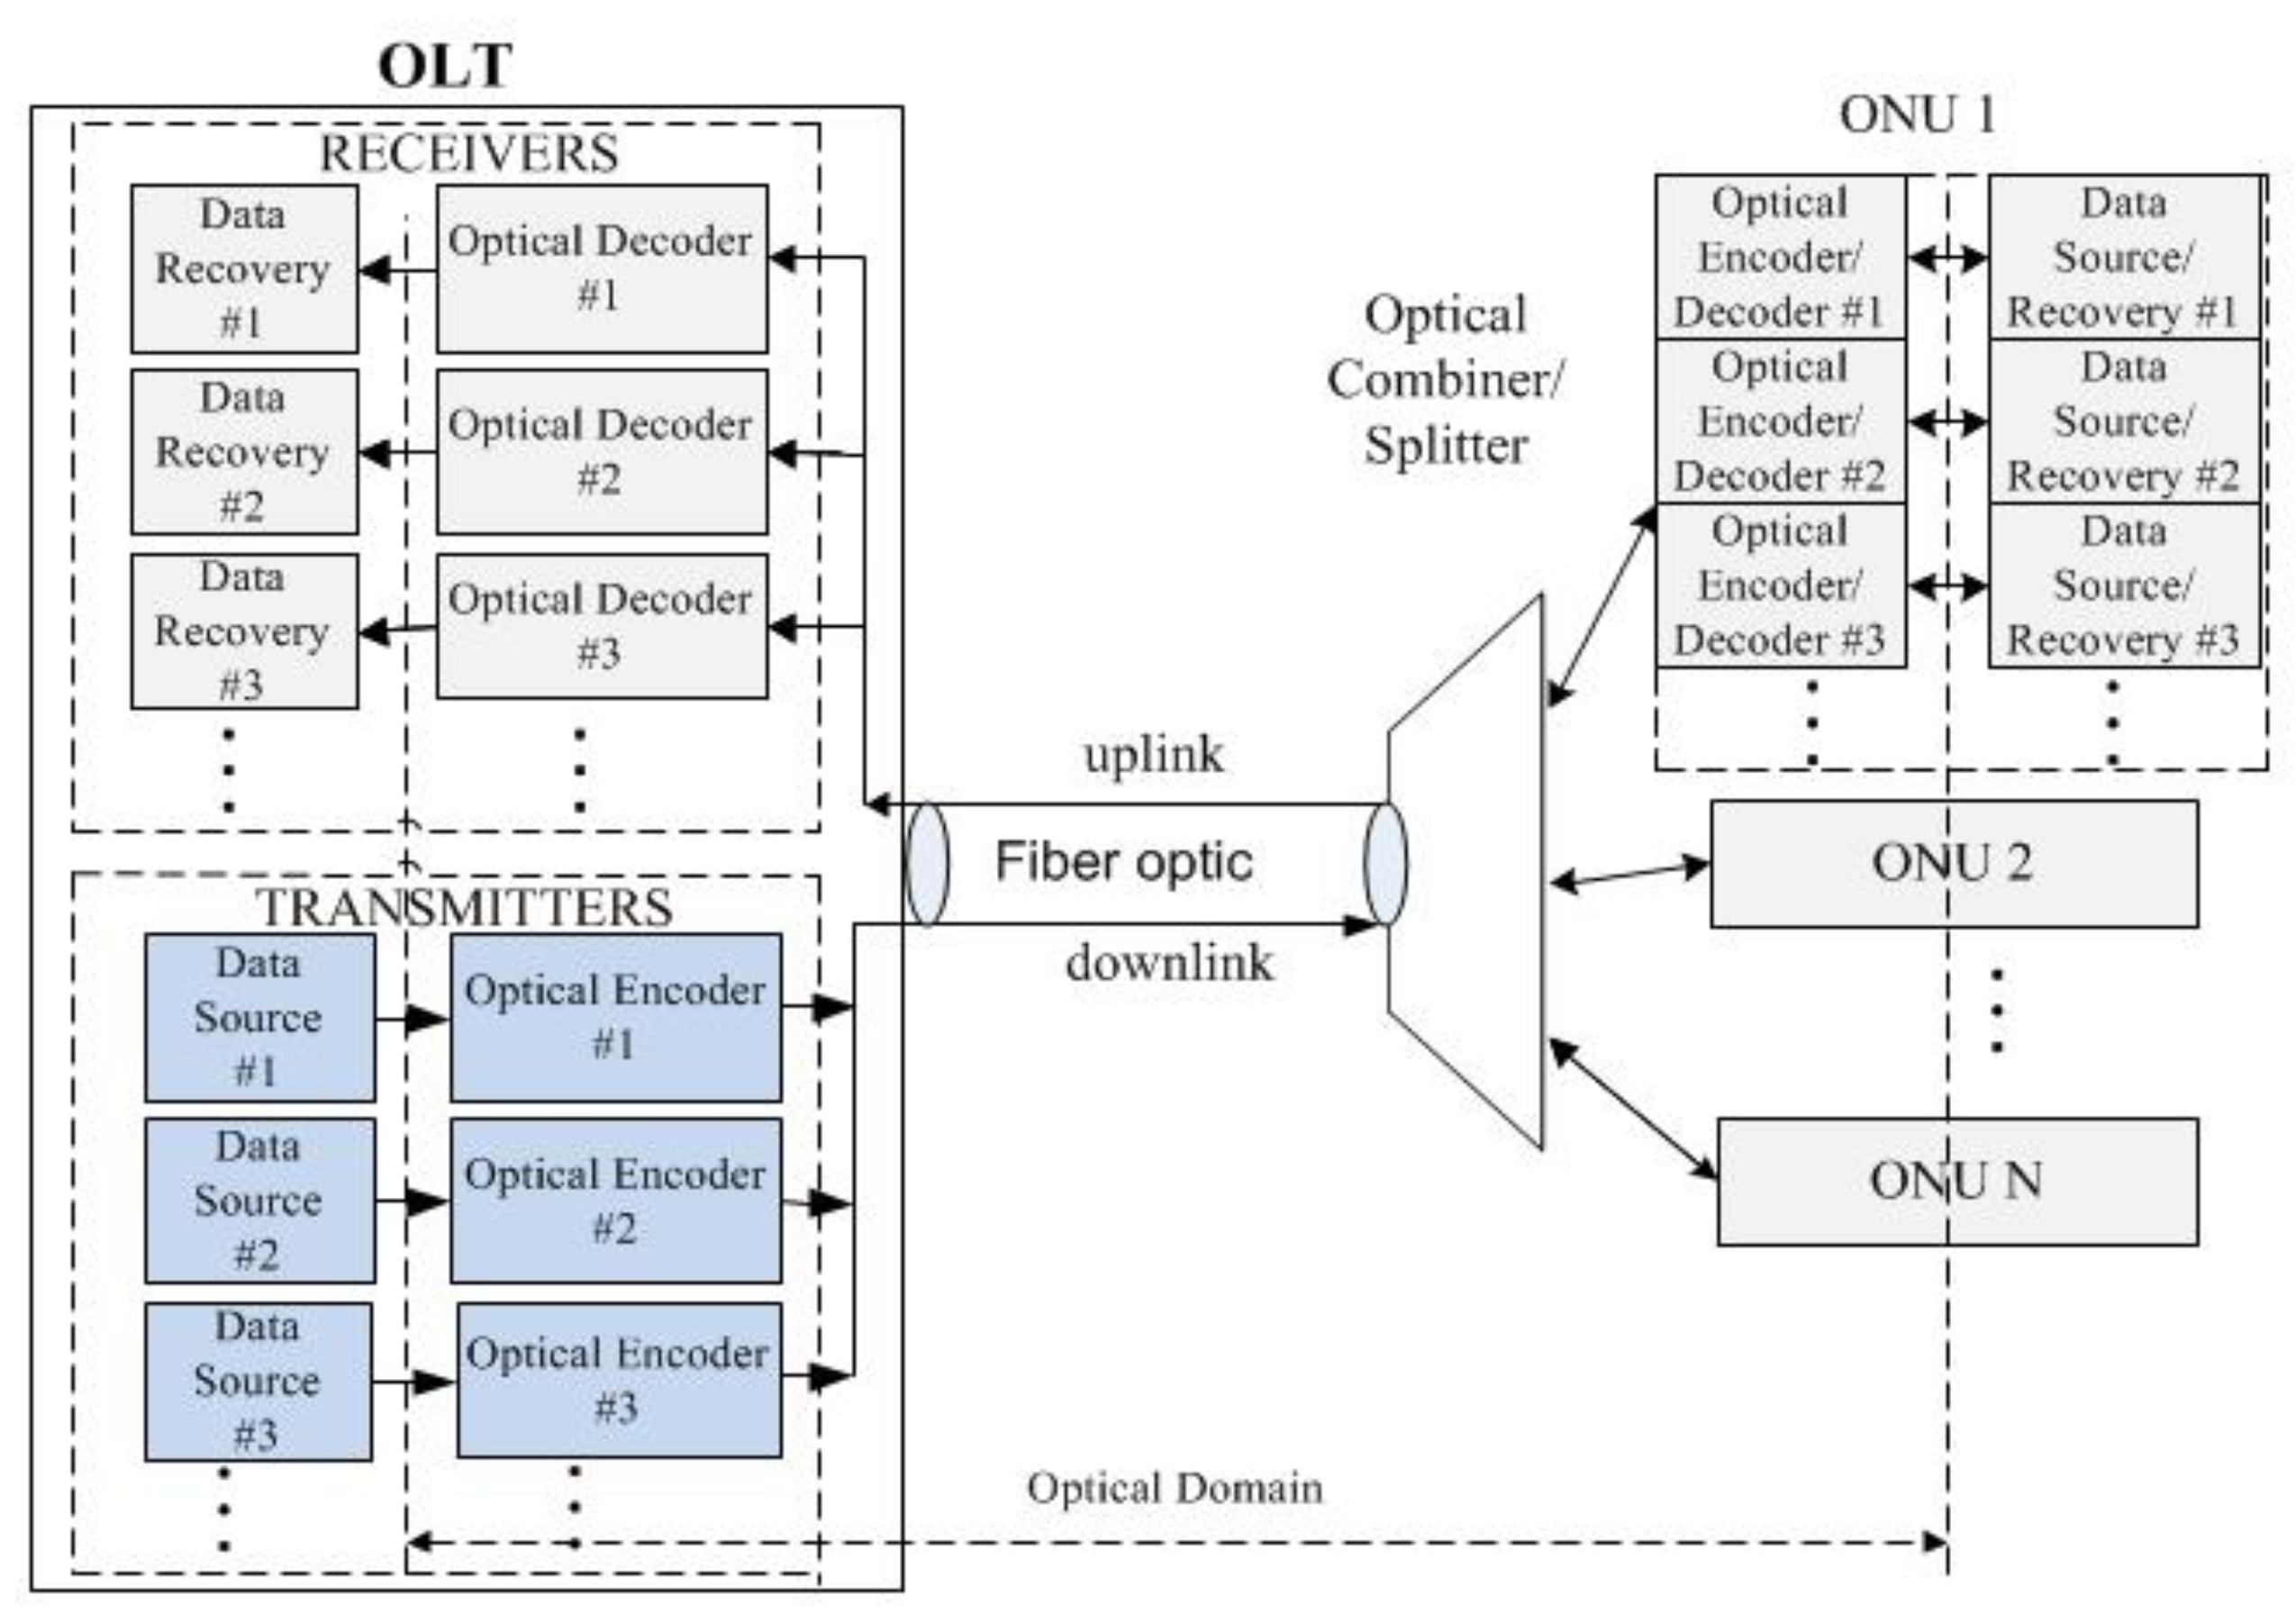
A completely new era of access networks is the optical access network [7]. Their installation should be justified economically, considering the high cost of installing an optical fiber for the user [8]. To this end, the following solutions were adopted: (a) Fiber to the home (FTTH) when the replacement of the existing network seemed necessary, (b) Fiber to the curb (FTTC), or (c) Fiber to the building (FTTB), according to which extent the copper cables should be maintained. Three optical access network architectures were developed [9]: (i) Point-to-point architecture, where the users are connected to the central office (CO) via a dedicated fiber. It has the advantage of a high bandwidth for the user, while the disadvantages are the high cost of installing many FTTH systems and the user’s equipment for the electro-optical signal conversion. Two transceivers per connection are needed (point-to-point). (ii) Active star (point-to-multipoint) architecture, where users are connected to nearby active nodes (hubs) by either copper or fiber cables, or even wirelessly, while the active hub is connected to the CO (and through the CO to the backbone network) by a single optical fiber. The hub comprises one transceiver and is called active just because it needs a power supply. Each user also requires one transceiver. (iii) Passive Optical Network (PON) architecture, like the active star architecture, but the active node is replaced by a passive device, which is a splitter/combiner (depending on the traffic flow direction) or an arrayed waveguide grating (AWG). This is the most popular architecture since the passive device reduces the cost of the entire access network. In PON, the transmission takes place between an optical line terminal (OLT) and the optical network units or terminals (ONUs or ONTs) via the passive device, covering a maximum distance of 50 km with a speed in the order of Gb/s. The OLT belongs to the CO, while the ONU/ONT are located in the user area (ONU at the edge of FTTC or FTTB, while ONT at the edge of FTTH). Communication between PON users is possible only via the OLT.

F1G PONs

The first PON configurations are based on time-division multiplexing (TDM). In TDM-PONs [10], the passive device operates as splitter in the downstream direction, while it operates as a combiner in the upstream direction. TDM-PONs use one transceiver at the OLT for all ONUs/ONTs, which need synchronization with the operating frequency of the OLT. Each ONU/ONT possesses its own transceiver. New users can readily be added to TDM-PONs. Figure 6 illustrates a typical TDM-PON where the PON operation in the uplink is distinguished from that in the downlink [11]. The PON comprises an OLT and (as an example) three ONUs/ONTs, while different wavelengths are used per traffic flow direction. The ONUs/ONTs buffer the data of their users to be transmitted all together (burst) to the OLT at the assigned time slots in the uplink, as shown in the upper part of Figure 6. Due to the different distances between the OLT and the ONUs/ONTs, the OLT optical receiver must be adapted to different received powers and align the different received phases of the bursts (signals). To accomplish them, the transmission overhead from the ONUs/ONTs increases and thus the throughput decreases. On the other hand, the transmission from the OLT down to the ONUs/ONTs is much easier. As it is shown in the lower part of Figure 6, the same frame arrives to all ONUs/ONTs but each ONU/ONT selectively receives its own data based on an address (ONU/ONT id). The following TDM-PON configurations have been standardized by the International Telecommunication Union–Telecommunication Standardization Sector (ITU-T) [12]:
APON/BPON—ITU-T Rec. G.983.x: APON (ATM-PON) is the first PON which was standardized (1998) based on ATM (asynchronous transfer mode) technology because the telecommunications community considered ATM to be the leading technology in backbone networks [10,13,14]. ATM has the advantage of providing QoS guarantees for voice and data transmission services (either broadband or narrowband services). BPON (1999) is an enhanced version of APON, adding dynamic bandwidth allocation. With the advent of APON/BPON, the use of SDH/SONET systems or the legacy access services (e.g., DS1, DS2, E1, E2) could not be justified economically.
Splitting ratio and Maximum reach: In the passive device, the splitting ratio is 1:32 or 1:64. Progress in the field of photon technology allows for the use of passive devices where the splitting ratio reaches 1:128 or even 1:256. Erbium-doped fiber amplifiers (EDFAs) are used to amplify the signals. The passive device is connected to the OLT with a single-mode optical fiber over a maximum distance of 20 km. As each user is at a different distance from the OLT, ONUs should be carefully synchronized to avoid conflicts.
DS/US Rates and wavelengths: In the downstream (DS), the transmission rate was standardized at 155.52 Mb/s or 622.08 Mb/s, making use of a wavelength in the range of 1480–1500 nm; in the upstream (US), the standard transmission rate was 155.52 Mb/s, using the wavelength range of 1260–1360 nm [12]. Moreover, a symmetrical rate between uplink and downlink exists at 622.08 Mb/s. In the link layer, the frame format used in the downlink is different than that in the uplink in the case of different transmission rates. Specifically, in the 155.52 Mb/s downlink, the frame is composed by a concatenation of 56 ATM cells of 53 bytes (the 1st and the 29th ATM cells are PLOAM (Physical Layer Operation Administration and Management) cells. The latter mainly carry messages of transmission opportunities, which are granted by the OLT to the PON-users; that is, the ONU/ONT is informed of the start time and duration of the next uplink frame, which can be used for transmission within the time division multiple access system. In the 622.08 Mb/s downlink, the frame is formulated by concatenating four 155.52 Mb/s frames. In the non-symmetrical uplink of 155.52 Mb/s, the frame format is composed by a concatenation of 53 ATM cells and the addition of 3-bytes overhead in front of each ATM cell. Needless to say, the constant of 125 μs is kept for the duration of a frame in all cases.
QoS: In uplink, QoS provisioning is realized by distinguishing traffic priority classes in each ONU/ONT, according to the service level agreement (SLA). SLA specifies traffic parameters (e.g., lowest bandwidth requirement and jitter) that a user requires from the BPON. The traffic priorities (from high to low) are named: fixed (bandwidth is offered without demand to delay sensitive traffic), assured (bandwidth after demand), non-assured (bandwidth, if available but not guaranteed), and best effort (if remaining uplink bandwidth is available; not guaranteed). Based on SLA, each ONU/ONT performs intra-ONU/ONT scheduling and queue management to define the bandwidth requirement for each traffic class. On the other hand, the OLT, after having received the bandwidth requests from the ONUs/ONTs, decides the allocated bandwidth (according to SLA) and offers transmission opportunities, performing inter-ONU/ONT scheduling.
Security: In the downlink, security is provided through a key exchange process. The ONU/ONT is notified by the OLT (issuing a PLOAM cell) to send the key, and then the OLT employs the advanced encryption standard (AES) mechanism to encrypt the data and send it to the ONU/ONT (the only one that knows the key) [6].

4.1.4. F2G—2000–2005 (Wideband Era)

EPON—IEEE 802.3ah: The tremendous increase of Ethernet traffic due to the wide use of low-cost Ethernet LANs necessitated the deployment of the Ethernet-based PON (EPON) (2004) to convey Ethernet traffic with all the Ethernet features being fully supported [15]. This is because the Ethernet protocol was supplemented by QoS techniques (such as traffic prioritization at the MAC sublayer and virtual LANs) whereby voice, data and video are supported in a reliable way. EPON was rapidly adopted in Asia (first in Japan) and later in Europe. EPONs have the ability to carry variable-length Ethernet frames (packets) up to 1518 bytes, as opposed to the fixed-length packets of BPONs, while they can also carry ATM cells. In EPONs, the reliability of the Ethernet is combined with the advantages of ATM technology in terms of service quality, and therefore EPONs appear as the predominant access networks over BPONs.
Splitting ratio and Maximum reach: The passive device is connected to the OLT with a single-mode optical fiber over a maximum distance of 20 km. The standard splitting ratio is 1:16 or 1:32 (when Reed–Solomon-based Forward Error Control is used) [6], while 1:64 or even 1:128 is possible to support many users over short distances.
DS/US Rates and Wavelengths: Both the downstream and upstream transmission is based on the Ethernet protocol IEEE 802.3, and the rate is 1.25 Gb/s (1 Gb/s data rate, plus 0.25 Gb/s for line encoding 8B/10B). The wavelength ranges of 1480–1500 nm and 1260–1360 nm are used in the downlink and the uplink, respectively [12].
QoS: Packets transmitted by the OLT in the downlink reach all users, but they are only received by users who match the logical link identifier (LLID) [10]. The latter is a field that precedes the header of the Ethernet frame and is defined for each user at the time of “registration” on the PON. Variable length packets are placed in fixed duration frames of 2 μs (typical duration). In the upstream direction, data frames from one user only reach the OLT, thanks to the directional properties of the passive device (optical combiner). That is, in the uplink the behavior of EPONs is similar to that of point-to-point architecture except that simultaneously transmitted frames by different users may collide. Therefore, an additional medium access control (MAC) mechanism is needed for collision avoidance and fair bandwidth allocation of the common link capacity (between the OLT and the passive device). All users should be synchronized and know which time slot is allowed to transmit. Each time slot has the ability to carry several Ethernet frames and can be of either fixed or variable size. When the time slot corresponding to a specific user arrives, data (Ethernet frames) are sent in burst. If there are no data to send, the user sends an empty frame [16]. The assignment of a timeslot to a user can either be static (using TDMA) or dynamic, using a dynamic bandwidth allocation/assignment (DBA) mechanism [17]. Using a DBA mechanism, the PON can support more users (due to efficient bandwidth management), while the users can enjoy enhanced services, requiring variable data rates that cannot be offered reasonably under static bandwidth allocation. The DBA is based on the queue length created by each user to store the data. The role of collecting information about the queue length and assigning timeslots to each user belongs to the OLT. Although this mechanism increases the transmission overhead, it leads to an efficient utilization of the common link capacity [18]. The multi-point control protocol (MPCP) is a MAC layer signaling protocol between the OLT and ONUs/ONTs for inter-ONU scheduling and service class support. MPCP consists of three functions whereby the PON manager/vendor can readily implement the desired DBA scheme [19]:
  • Discovery Processing: PON users are detected and registered. A three-way handshaking takes place: A REGISTER_REQ message is generated by the ONU/ONT, the OLT replies with the REGISTER message, and by the REGISTER_ACK message, the ONU/ONT echoes the registration parameters back to the OLT.
  • Report Handling: ONUs/ONTs generate REPORT messages, whereby they transmit bandwidth requests to the OLT, which processes these requests to proceed with the corresponding bandwidth assignments.
  • Gate Handling: The GATE messages are used by OLT to assign the timeslots in which the users are allowed to transmit. These assignments are based on the bandwidth requirements of the users (REPORT messages).
The first implemented DBA algorithm is the IPACT (interleaved polling with adaptive cycle time) [20], where the OLT polls ONUs/ONTs in a round-robin fashion to assign timeslots. After receiving the REPORT messages from all ONUs/ONTs, the OLT calculates the start and end times of each ONU/ONT (timeslot assignment) and sends them with GATE messages (Figure 7). Then, each ONU/ONT schedules the start and end times of packets in its queues. When an ONU/ONT does not have data to transmit, it will send a REPORT message with zero requirements. In this case, the OLT will calculate a timeslot duration equal to the time required to send only the next REPORT message from that ONU/ONT.
Various methods (services) have been proposed to determine the timeslot duration of each ONU/ONT:
  • Fixed—The OLT ignores the ONU/ONT requirements and always grants the maximum timeslot duration. It results in a transmission of a constant/maximum cycle time. This method/service would be an easy choice in the traffic environment of multiple service-classes [21].
  • Limited—The OLT grants the requested timeslot duration, but no more than a maximum value. This results in a transmission of the shortest cycle time.
  • Gated—The OLT grants the requested timeslot duration without a limitation. That is, each ONU/ONT transmits all data of its queue in one transmission cycle. This results in a significant increase of the transmission cycle time. For this reason, there is a limit to the queue length that each ONU/ONT possesses.
  • Constant credit—The OLT grants the requested timeslot duration plus a constant duration. This fixed quantity is added to include in the next ONU/ONT transmission the data that have reached the ONU/ONT from the time it sent the REPORT message until the beginning of its next transmission.
  • Linear credit—The OLT grants the requested timeslot duration plus a duration which is proportional to the requested one.
  • Elastic—In this service, there is no maximum duration for each timeslot, but a maximum limit on cycle time. If only one ONU/ONT has data to send, it can receive a timeslot duration equal to the sum of the maximum durations of all ONUs/ONTs.
Several variations of the IPACT algorithm have been introduced, which, however, do not support differentiated services [22,23]. Services should be differentiated according to their QoS requirements, such as bandwidth, latency, delay variation (jitter) and packet loss ratio. An effective way to provide differentiated QoS quality assurance to an EPON is to use priority queues. The network traffic is classified into different categories with corresponding QoS priority levels (802.1Q) and for each traffic category, a separate queue is placed in each ONU. The following eight traffic categories (at the link layer) are defined (priorities from high to low—802.1Q) [24]:
  • Network control: Time- and safety-critical traffic of OAM (Operation Administration and Management) network functions (e.g., routing protocol frames)—no user traffic;
  • Internetwork control: No user traffic;
  • Voice: Time-critical traffic with a delay <10 ms (e.g., real-time voice);
  • Video: Time-critical with a delay <10 ms (e.g., real-time video);
  • Controlled load: Loss-sensitive traffic (e.g., streaming multimedia traffic);
  • Excellent effort: Loss-sensitive traffic;
  • Best effort: No time-critical or loss-sensitive traffic (typical Internet traffic);
  • Background traffic.
Data packets from users are routed to the ONU and placed in the corresponding queues depending on the traffic category. If the corresponding queue is full when a high priority packet arrives, then this packet replaces a low priority packet. Moreover, if on arrival of a low priority packet, the corresponding queue is full, this packet is lost. Therefore, DBA algorithms that can provide differentiated QoS support for different types of data traffic are needed. To this end, the DBA algorithms were extended to provide QoS support.
GPON—ITU-T Rec. G.984.x: The ever-increasing bandwidth requirements of the users and the need to support not only the ATM traffic but, mainly, the Internet traffic were the motivation for the development of Gigabit-PON (GPON) (2004) as an expansion of the BPON. GPON concurrently supports and leverages SONET, SDH and Generic Framing Protocol (GFP).
Splitting ratio and Maximum reach: The maximum splitting ratio is 1:128, and the maximum ONU–OLT distance is 20 km.
DS/US Rates and wavelengths: The downlink rates are 1244.16 Mb/s or 2488.32 Mb/s using the spectral region of 1480–1500 nm, while the uplink rates are 155.52, 622.08 and 1244.16 Mb/s in the spectral region of 1260–1360 nm [6,8,10,16]. In addition, the symmetric uplink-downlink rate of 2488.32 Mb/s is used. Moreover, GPON supports both ATM (fixed-length packets) and Ethernet (variable-length packets) traffic by GEM (GPON encapsulation method, ITU-T Rec. G.7041). Using GEM frame fragmentation at the sender, GPON reduces the latency and thus efficiently supports real-time traffic [6,10].
QoS: The GPON frame has a constant duration of 125 μs [16]. The mode of transmission is broadcast (TDM) in the downlink and TDMA in the uplink [10]. Since the distances between the OLT and ONUs/ONTs are dissimilar, coordination is needed in the uplink so that the transmitting frame matches the time of the assigned time slot in the TDMA process. To this end, the OLT communicates with each ONU/ONT and, based on the round-trip time (RTT), determines a delay for each ONU/ONT in reverse order of the RTT so that the propagation delay between the OLT and ONUs/ONTs is equalized. In uplink, a QoS guarantee is provided in a similar way to BPON, based on SLA. An uplink frame includes a burst of time slots, which is called T-CONT (transmission container). A T-CONT contains ATM cells or GEM frames exclusively (not both). Each ONU/ONT assigns traffic flows with the same characteristics to one or more T-CONT types out of five possible T-CONT types. The four types of T-CONTs correspond to four traffic priority classes, while the fifth type corresponds to any other traffic class (based on the available bandwidth and combination of T-CONTs). Each T-CONT must be uniquely identified in the GPON by the so-called Alloc_ID [10]. Based on Alloc_IDs, the uplink bandwidth is dynamically assigned to the users according to the SLA and the applied DBA [25].
Security: Security is also provided in a similar way with BPON; the data transmitted down to ONUs/ONTs are encrypted based on the AES mechanism [6].

4.1.5. F3G—2005–2010 (Broadband Era)

10G EPON—IEEE 802.3av: The move to 10 Gb/s EPON (10G-EPON) (2009) was inevitable, as network operators had already developed EPON and no replacement of legacy equipment was required. The 10G-EPON provides strong confidence in the viability of the EPON investment and is easy to manage. On the other hand, end users could enjoy exciting applications over the Internet [10].
DS/US Rates and wavelengths: The 10G-EPON keeps backwards compatibility with EPON, while the transmission rate both in the downlink and uplink increases at 10 Gb/s. An asymmetric transmission at 10.3125 ≅ 10 Gb/s in the downlink and 1.25 Gb/s (with line encoding 8B/10B) in the uplink is offered. In the downlink, the wavelength ranges of 1480–1500 nm and 1575–1580 nm are used for 1.25 Gb/s and 10 Gb/s transmission, respectively. In the uplink, the wavelength ranges of 1260–1360 nm and 1260–1280 nm are used for 1.25 Gb/s and 10 Gb/s transmission, respectively.
QoS: Error control is supported by Forward Error Correction (FEC) with Reed–Solomon (RS) coding [6]. In 10G-EPON (as in EPON), QoS support is based on MPCP and the DBA algorithm (inherently offers QoS support), which arbitrates the transmission of different users (eight priority levels are considered according to the IEEE 802.1Q standard—six priority levels out of the eight levels are devoted to user traffic) [26].
XG(S)PON—ITU-T Rec. G.987.x: Support for new bandwidth-demanding applications, connecting a larger number of users, better QoS and security were the motivations for 10 Gb/s GPON (10G-GPON).
DS/US Rates and Wavelengths: The 10G-GPON, Romanized as XGPON, was standardized (2010) to offer the transmission rate both in the downlink and uplink at 9.953 ≅ 10 Gb/s (XGS-PON) and asymmetric transmission at 10 Gb/s in the downlink and 2.488 ≅ 2.5 Gb/s in the uplink (XG-PON) [10]. In the downlink and the uplink, the wavelength ranges of 1575–1580 nm and 1260–1280 nm are used, respectively [12]. The XGS-PON was standardized in the year 2016. As in 10G-EPON, error control is supported by FEC with RS coding [26].
QoS: Like GPON, XG(S)PON supports both ATM and Ethernet traffic via XGEM (XG(S)PON encapsulation method). For QoS, the ONU associates different traffic flows with a specific XGEM Port ID (the identifier of the XGEM port to which the frame belongs) [10]. QoS can be granted according to demand and based on the SLA. Moreover, DBA is based on SLA and strictly follows the four priority levels, like GPON.
Security: Security (of the XGEM payload) is provided by the AES-CTR (CounTeR mode) algorithm, which applies a forward cipher with a secret key known only to the OLT and ONU [6,10].

4.1.6. F4G—2010–2018 (Ultra-Broadband Era)

NG-PON2—ITU-T Rec. G.989.x: The 40 Gb/s capable next-generation PON 2 (NG-PON2) was standardized (2015) not only to increase the PON scalability and the transmission rate (at 40 Gb/s), but mainly to offer backward compatibility with the TDM-PONs: GPON, XG-PON, EPON and 10G-EPON. These are achieved through wavelength division multiplexing (WDM) both in the downlink and the uplink [11,27]. Instead of using one wavelength per direction, the use of w (>1) wavelengths increases the transmission rate by w, while the user may have ample bandwidth by getting the entire wavelength bandwidth from the ONU/ONT. In addition, NG-PON2 supports legacy services (such as POTS, T1 and E1) using emulation [28]. Moreover, the introduction of multiple wavelengths made the study of PONs more challenging and attractive. For instance: (a) blocking analysis could be performed in case that the number of available wavelengths in the PON is less than the required number of wavelengths by the ONUs/ONTs [29]; or (b) dynamic wavelength allocation (DWA) among ONUs/ONTs could be introduced for an efficient use of the available wavelengths according to the needs [30], as well as for power saving in PONs (see paragraph 4.1.8., method of “Shutdown Wavelength(s)”). (c) The DWA strongly depends on the characteristics of the offered traffic and therefore several features of traffic could be investigated [31,32].
Needless to say, the cost of such a WDM-PON is high, due to the need to install variable wavelength laser transmitters, so that each ONU/ONT can transmit to any of the wavelengths supported by the network (colorless ONU/ONT). The most promising solution is to reuse the wavelength that is assigned to each user for downstream and upstream transmission. A component of the transmitted signal from the OLT is modulated by each user in the inverse return-to-zero format, while the upstream signal is modulated/amplified by SOAs (semiconductor optical amplifiers) in the return-to-zero format. This solution does not require the installation of optical transmitters for each user; thus, the cost is significantly reduced. An alternative solution is to use low-cost tunable lasers as transmitters (no need for expensive thermoelectric coolers and wave-lockers). In the uplink, tuning is achieved by utilizing the common OLT wave-locker. Nevertheless, tunable receivers are needed at each ONU. Moreover, a self-seeded scheme could be used for the colorless operation, with the severe drawback of limiting the reach of the WDM-PON. Due to the use of different wavelengths per ONU/ONT, a WDM-PON offers substantially better security than a TDM-PON.
The NG-PON2 resulted from the combination of TDM and WDM technologies and is characterized as a TWDM-PON [12,28,33]. The NG-PON2 (Figure 8) is based on a splitter, while in order for an ONU/ONT to select a wavelength, it must use a wavelength filter.
DS/US Rates and Wavelengths: Four to eight TWDM wavelength (channel) pairs are introduced. The data rates of 10 Gb/s and 2.5 Gb/s are symmetrically offered per wavelength, while 10 Gb/s and 2.5 Gb/s are offered per wavelength in the downlink and uplink, respectively. Thus, for eight wavelengths, the maximum rate is 80 Gb/s. The DS wavelengths are in the L-band, with a range of 1596–1603 nm, while the US wavelengths are in the C-band, with a range of 1524–1544 nm (wide band), 1528–1540 nm (reduced band) or 1532–1540 nm (narrow band).
Splitting ratio and Maximum reach: A split ratio of at least 1:256 is assumed, and a minimum ONU–OLT distance of at least 40 km is considered without reach extenders. The high splitting ratio (even through multistage splitting) and the support of a high number of users are a must in order to justify the high system cost. On the other hand, higher splitting ratios and the number of users substantially increase the required power budget between OLT and ONU/ONT, while lasers of higher transmitting power and receivers of higher sensitivity are needed. The specification of the maximum loss budget between OLT and ONU/ONT is 35 dB.
QoS: From the MAC layer point of view and the QoS support perspective, an additional management layer is required for the dynamic assignment of wavelengths. According to Rec. ITU-T G.989.3 (2015)/Amd.1 (11/2016), resource allocation with QoS guarantee in TWDM-PON with dynamic assignment of the wavelengths and dual uplink line rate support are left to the implementor’s discretion (proprietary dynamic wavelength bandwidth allocation—DWBA). For resource allocation with QoS guarantee within an individual TWDM-PON wavelength with a single transmission rate in the uplink, the main traffic parameters are: Fixed bandwidth, Assured bandwidth and Maximum bandwidth. Based on these parameters, traffic flows can be aggregated. In the uplink, an aggregate traffic descriptor is constructed for each T-CONT based on the service specifications of the XGEM Port-ID flows multiplexed onto that T-CONT (four T-CONT types are considered, as in the case of BPON). The recipient of the uplink transmission is represented by an allocation ID (Alloc-ID). For each Alloc-ID, the ONU/ONT receives a transmission opportunity from the OLT, which is determined by a DBA algorithm. To ensure QoS guarantee, the DBA algorithm is based on status reports of the ONUs/ONTs or on traffic monitoring that is performed by the OLT [28].

4.1.7. F5G—2018—Today (Gigaband Era)

50G-EPON—IEEE802.3ca: New reasons for a new PON standard emerge as technology and communication needs evolve. On the one hand, the number of users per fiber must be increased (for economic reasons); on the other hand, more and more users need larger and dedicated bandwidth for several reasons, including wireless fronthaul. Another motivation is to reach these targets at a reasonable cost, lower than the cost of NG-PON2. Given that Internet traffic is ubiquitous, a new EPON standard emerged (2020) at 50 Gb/s (50G-EPON) [11,34].
Splitting ratio and Maximum reach: 50G-EPON offers backward compatibility with EPON and 10G-EPON, having the same minimum splitting ratio of 1:32 and a typical reach of 20 km.
DS/US Rates and Wavelengths: To minimize the system cost in 50G-EPON, ONUs/ONTs need to support only one or two fixed wavelengths (avoiding tunable transceivers). The transmission rate is 50 Gb/s in both downlink and uplink, or 50 Gb/s in downlink and 25 Gb/s or 10 Gb/s in uplink. Moreover, 50G-EPON supports coexistence with GPON (1290–1330 nm upstream) and XG(S)PON: Two downlink wavelength ranges (1356–1360 nm or 1340–1344 nm) and three uplink wavelength ranges (1260–1280 nm, 1290–1310 nm, or 1318–1322 nm) are supported.
QoS: The multi-point MAC control (MPMC) sublayer of the Data Link Layer contains the protocols required to reconcile the 50G-EPON into the Ethernet framework, i.e., allocation of transmission resources, ONU/ONT discovery and registration as well as DBA. To achieve high data rates, the innovative technique of dynamic wavelength channel bonding is applied. The so-called MCRS (Multi-Channel Reconciliation Sublayer) enables data in one MAC instance to be transmitted over multiple signals (envelopes) on multiple MCRS channels. The basic transmission unit, called Envelope Quantum (EQ), is 72 bits (64 bits of data, plus 8 bits). Multiple EQs formulate a frame. Frames are distinguished in full frames and in fragmented frames (such as the IPv4 fragmentation). A transmitted signal is an envelope that contains frames, i.e., EQs. EQs in one envelope are interleaved over multiple MCRS channels to achieve a higher transmission rate.
As far as the transceiver optics are concerned, 25 Gb/s avalanche photodiodes (APD) with non-return-to-zero (NRZ) modulation are adopted for receivers, while the optical modulation amplitude (OMA) minus penalty methodology is adopted for transmitters. A major challenge is the introduction of burst-mode transmission from ONUs/ONTs. To this end, ONUs/ONTs require burst-mode laser diodes with a fast on-off switch and control loop for laser bias current. In addition, burst-mode receivers of high sensitivity are required in both OLT and ONUs/ONTs. The following specifications are given for the 50G-EPON standard: 128 ns maximum values for laser on/off time, 800 ns receiver settling time, and 400 ns clock data recovery time.
50G TDM-PON—ITU-T Rec. G.9804.3: As was anticipated, the ITU-T followed IEEE in extending the transmission rate of PONs to 50 Gb/s [35,36,37]. The ITU-T has announced the 50G TDM PON as an evolution of GPON and XG(S)PON [36].
Splitting ratio and Maximum reach: The passive device is connected to the OLT with a single-mode optical fiber over a distance of 20 km at least (10 km in the case of wireless, latency sensitive applications—for instance, 5G), reaching 60 km with reach extenders. The maximum difference in fiber lengths is set to 40 km. The minimum splitting ratio is 1:256 (using Reed–Solomon-based Forward Error Control).
DS/US Rates and Wavelengths: The 50G TDM PON offers a transmission rate of 49.7664 Gb/s ≅ 50 Gb/s both in the downlink and uplink, and asymmetric transmission at 50 Gb/s in the downlink (wavelength in the range 1340–1344 nm) and 24.8832 ≅ 25 Gb/s in the uplink. Alternatively, the asymmetric transmission in the uplink is 12.4416 ≅ 12.5 Gb/s or 9.95328 ≅ 10 Gb/s; additional asymmetric transmission rates combined under the TDMA scheme are possible. In uplink, the wavelengths are in the ranges 1260–1280 nm (or 1268–1282 nm) and 1290–1310 nm (or 1298–1302 nm).
QoS: The coexistence of 50G TDM PON with the legacy PONs, GPON and XG(S)PON, as well as the 10G EPON is a sine qua non feature. To this end, two methods have been proposed, which differ on the devices included in the OLT [36]: (a) the use of external coexistence elements (CEx) and (b) the use of a multi-PON module (MPM). In the CEx method, the “OLT” of 50G TDM PON comprises different OLTs (e.g., the OLT of legacy PONs and the OLT of 50G TDM PON), which are connected to the corresponding ONU/ONT through an external switching device. In the MPM method, the OLT of 50G TDM PON comprises a WDM, in order to distinguish the different wavelengths of the legacy PONs for each direction (Tx or Rx), as well as of the 50G TDM PON.
As in all TDM PONs, ONUs/ONTs communicate with the OLT based on the TDMA scheme. To this end, a DBA algorithm or an ONU/ONT activation mechanism is needed. By using the so-called coordinated DBA (Co-DBA) algorithm, the OLT can be informed about the transmission requirements of the ONU/ONT in the uplink and allocate the necessary transmission opportunities to the ONU/ONT in advance so that the data delay in the ONU/ONT is as little as possible. By the ONU/ONT activation mechanism (based on T-CONT), the delay among the transmission opportunities of an ONU/ONT is reduced (each T-CONT is allocated up to 16 times within a period of 125 μs). The role of the DBA algorithm or ONU/ONT activation mechanism is upgraded, especially when the 50G TDM PON is used as a fronthaul for wireless communications (e.g., 5G mobile fronthaul).
Compatibility issues between the 50G TDM PON and the legacy PONs need further investigation [36], given that they will support the exclusive bandwidth requirement of multiple operators or services in the future, possibly through a hard slicing (an important feature for the establishment of rigid pipes for PON downlink scheduling). Moreover, the coexistence of PONs with different transmission rates (10 Gb/s, 25 Gb/s, and 50 Gb/s) is problematic, given that the uplink optical power budget of 50G-PON is relatively tight. Finally, a contradiction between performance and cost always exists.

4.1.8. Power Saving in PONs

Since PON is the most promising access technology and is going to be widely deployed, it is worth taking a separate look at possible power-saving techniques, both in order to operate at a low cost and for sustainability reasons. According to Supplement 45 of the ITU-T G-series recommendations (GPON power conservation), three basic modes of operation have been adopted for ONUs/ONTs being in a power-saving state [38,39]:
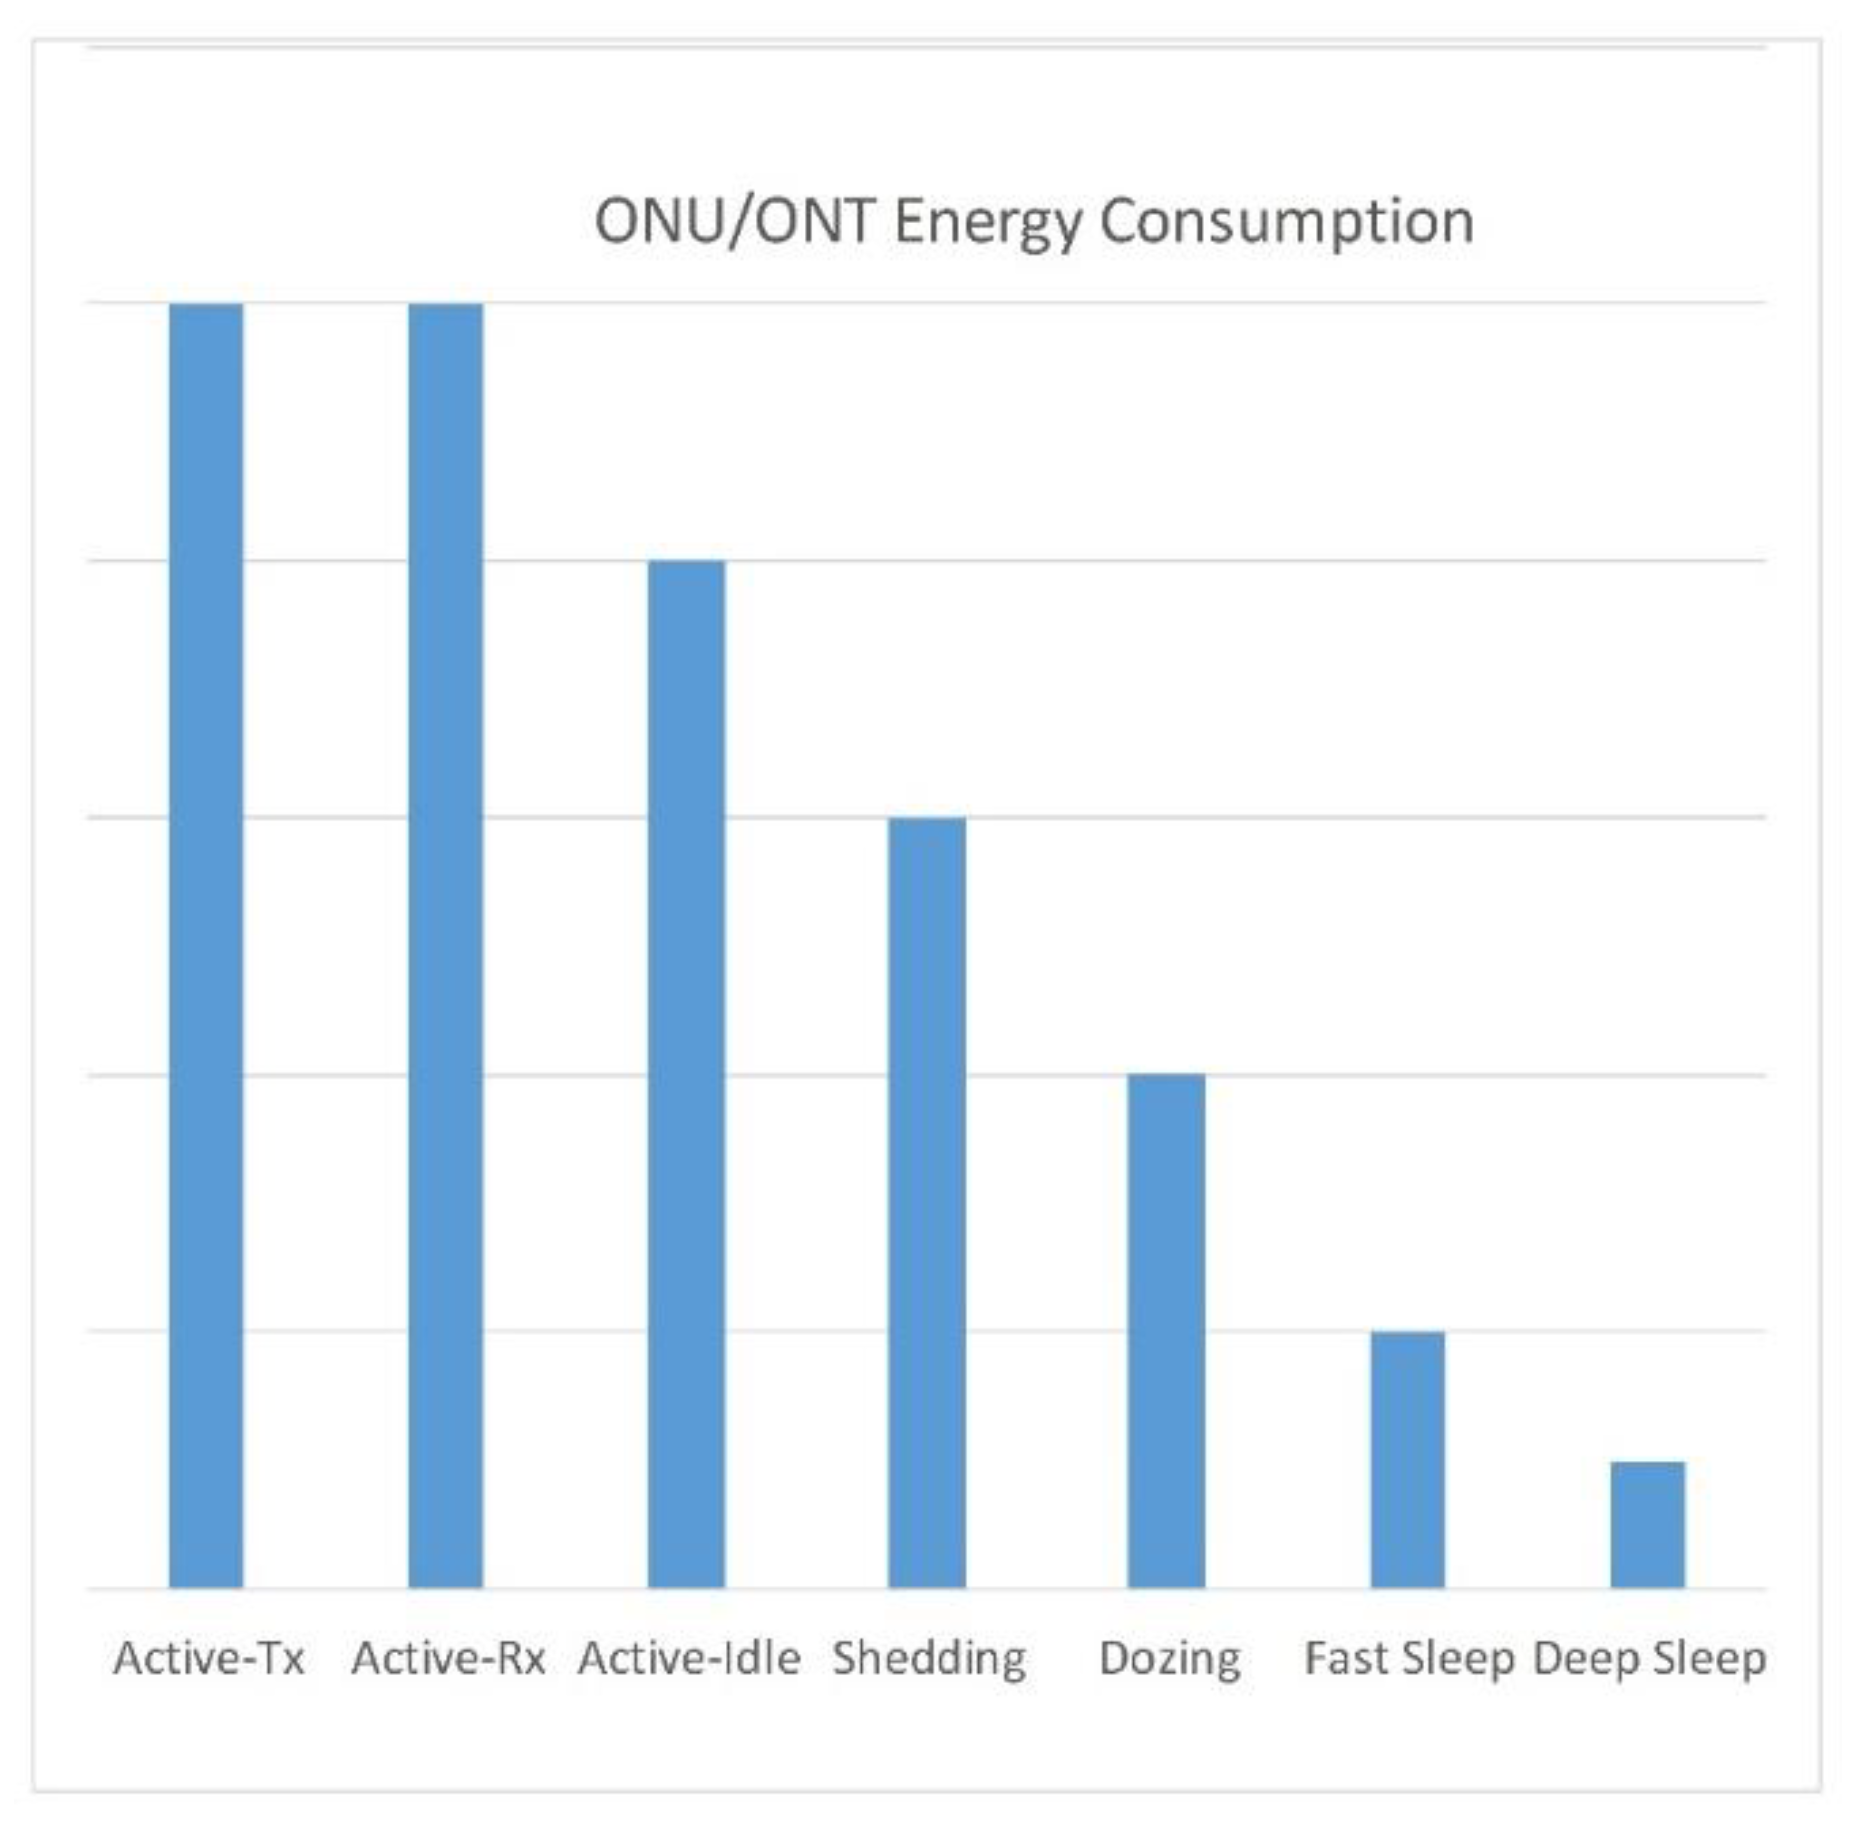
  • ONU/ONT Shedding—Receiver and transmitter operate with a minimum power (even zero) as long as they can maintain a fully operational optical link. (Estimated power savings: up to 60% from full power mode).
  • ONU/ONT Dozing—Transmitter operates at a minimum power (even zero), but the receiver remains continuously on.
  • ONU/ONT Sleeping (estimated power savings: up to 90% from full power mode): (i) Deep Sleep—Transmitter and receiver are switched off for the entire duration of the power save mode. (ii) Fast Sleep—Transmitter and receiver are switched OFF and ON repeatedly during the power save mode.
In addition, three more techniques have been considered for power savings depending on the type of PON:
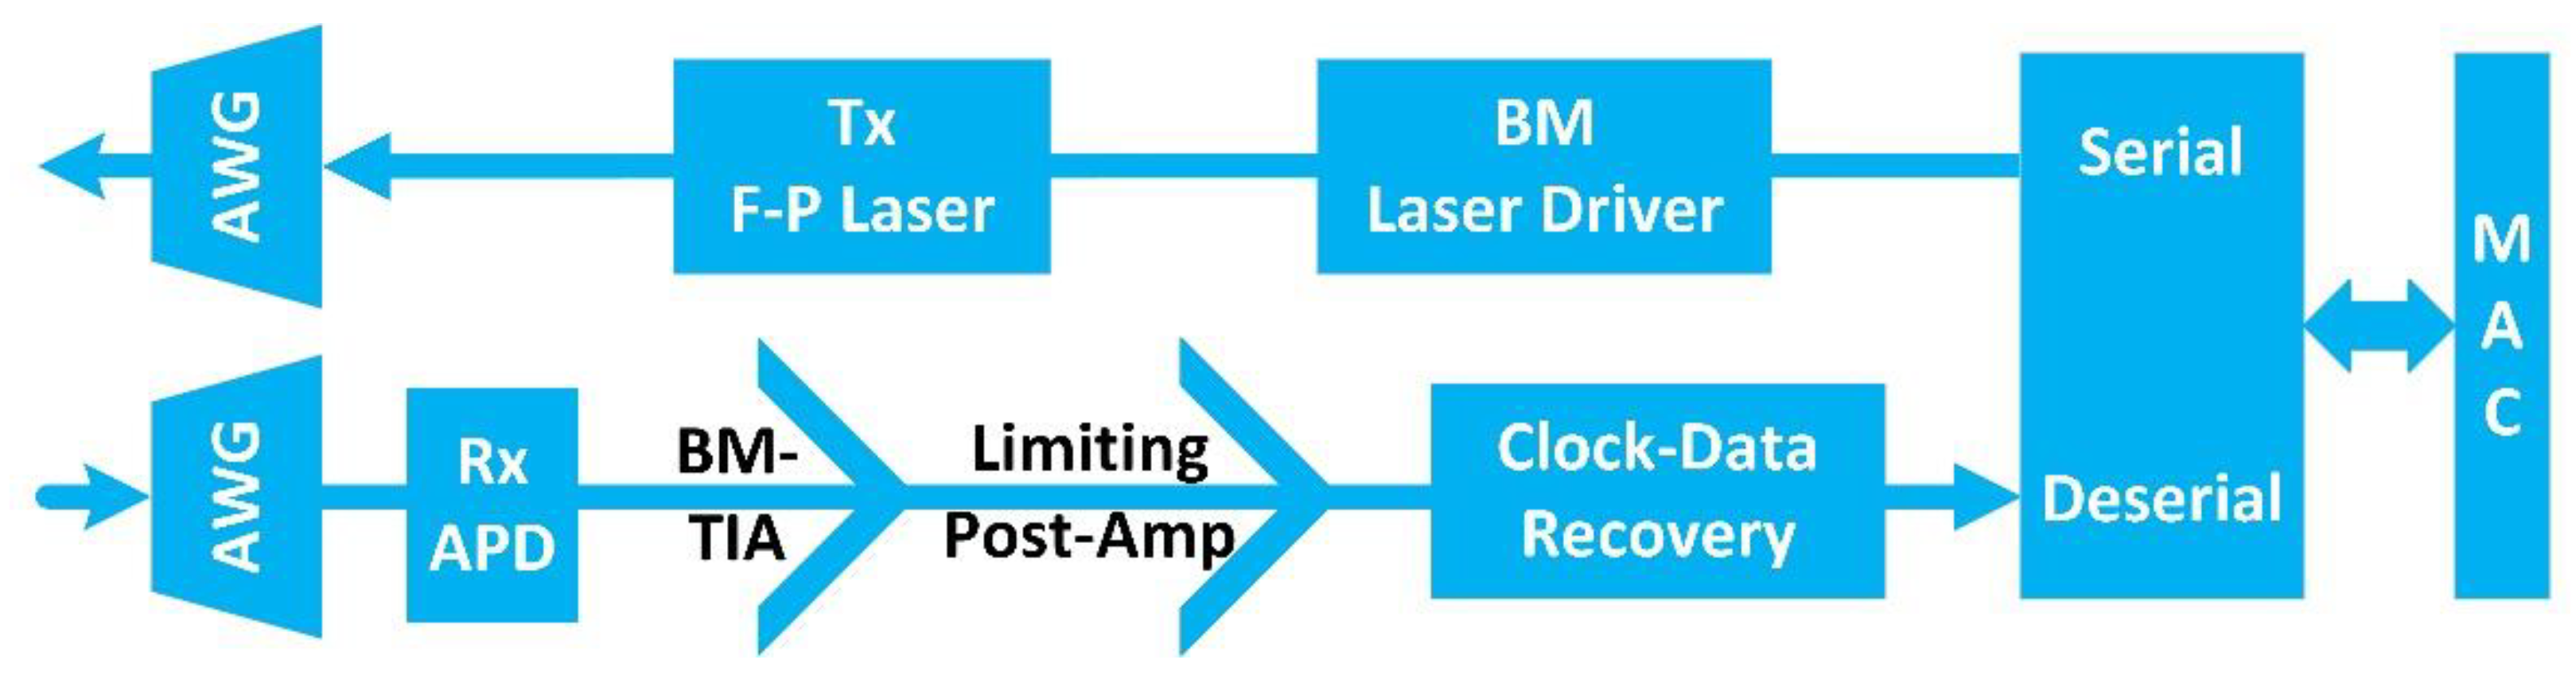
  • Bit-interleaving—In the downstream direction, all users must process all data in order to select their own data, which are usually a small percentage. More precisely, after the clock and data recovery (CDR) stage (Figure 9), all data are aligned and processed (e.g., Forward Error Correction) at a full-rate, and then the own data are selected (to be further processed at a lower user rate). In the “bit-interleaving” PON, the CDR is accompanied by a decimator capable of dropping out all useless data, and thus the own data can be processed immediately after the CDR stage at the lower rate. In this way, the energy consumption at the ONU/ONT is substantially reduced. This method can be applied in addition to the sleep mode of operation [28].
  • Adaptive Link Rate—In PONs such as GPON and 10G-EPON, where a transmission rate can be selected from a set of available rates (i.e., 1 Gb/s, 2.5 Gb/s, and 10 Gb/s), energy consumption can be reduced by selecting the lower possible rate, since the higher the transmission rate, the higher the energy consumption [38].
  • Shutdown Wavelength(s)—The OLT plays a dominant role in PON, not only by scheduling the sending and receiving of data but mainly to synchronize the ONUs/ONTs. Thus, it is not a good practice to restrict the operations of OLT in order to reduce energy consumption. Nevertheless, in the case of NG-PON2, where multiple wavelengths are available, energy can be saved by utilizing a subset of wavelengths while shutting down the rest of the wavelengths [38]. Especially for the NG-PON2 or TWDM-PONs in general, several factors can be combined, and under certain circumstances, PON traffic can achieve energy savings [28].
Power saving is achieved at the expense of system complexity. In power-saving mode, ONU and ONT may lose their connectivity to the physical layer, especially in sleep mode. To hide it from the service level, the complexity of the system must be significantly increased. Software-based techniques employing effective mechanisms can leverage the ONU/ONT capabilities for energy saving, by combining a hybrid cyclic/deep sleep enabled at ONUs/ONTs, a batch-mode transmission at OLT and ONUs/ONTs and a DBA [40]. Figure 10 qualitatively depicts the ONU/ONT energy consumption according to the basic mode of operation, shown in the horizontal axis [38].
An example of the impact of ONU/ONT sleeping mode of operation is shown in Table 5 [39].
As it is shown in Figure 9, a typical OLT or ONU/ONT is equipped with the following components [39,41]:
  • AWG device, as WDM coupler/decoupler.
A Fabry–Perot (F-P) laser as a transmitter (DML/EML lasers in GPON/XG-PON, respectively or uncooled tunable lasers in the case of ONU/ONT).
APD as a receiver (or PIN Diode in GPON).
Burst-mode (BM) laser driver to drive the F-P laser.
Burst-mode trans-impedance amplifier (BM-TIA) to translate and amplify downstream photocurrent into voltage.
Limiting post-amplifier (LP-A) to reshape the output voltage of TIA.
Clock and data recovery (CDR) system.
Serializer/de-serializer (S/Des) of data.
However, several degrees of integration are applicable to these components that produce different energy consumption levels, as is indicated in Table 6 [42].

4.1.9. Summary of PON Standards

In Figure 11, the allocated fiber spectrum of each PON standard is illustrated. A summary on the main characteristics of various PON standards is shown in Table 7.

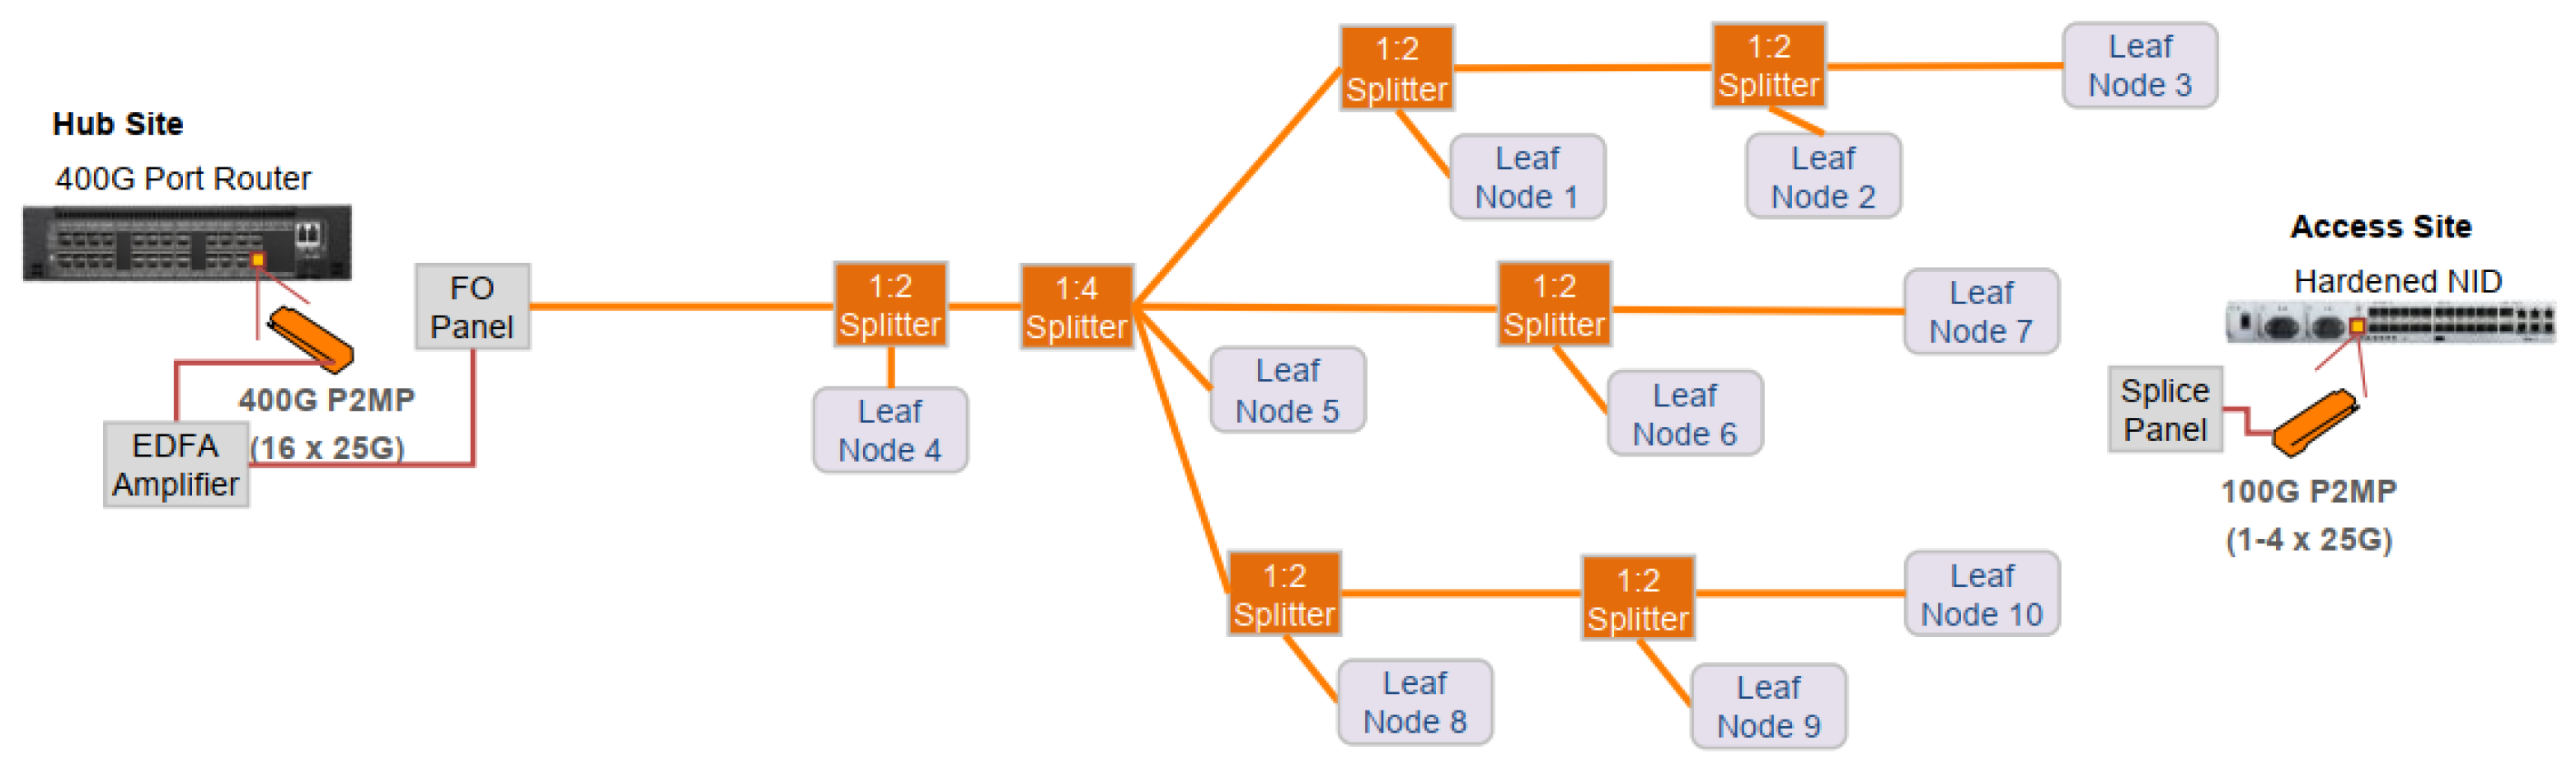
4.1.10. Outlook into Other Approaches for Access

Despite the aforementioned PON standards, various other solutions have been proposed in the literature that incorporate different characteristics and, in many cases, outperform already standardized approaches. In particular, the wish list for a “fresh” PON standard, which will be able to dominate over the deployed ones, includes: cost-effectiveness, higher transportation capacity, greater coverage, higher number of supported users, scalability, flexible resource allocation and low power consumption. As a benchmark against these proposed, however, not-yet-standardized solutions, we use the TDM-PON, which is adopted by various deployed standards such as APON, BPON, GPON, EPON, XG(S)-PON and 10G-EPON. The potential solutions discussed in this section include UD-WDM-PON, Nyquist-WDM-PON, OFDMA-PON, CDMA-PON, coherent-PON, super-PON. The first three PON options have been proposed as an attempt to exploit the remaining available spectrum as efficiently as possible. Next, coherent-PON can increase the overall bit rate through the data transmission, both in amplitude and phase of the carrier signal. Finally, super-PON can increase the transmission distance through the use of optical amplifiers as well as reduce the network costs through central office consolidation.
UD-WDM-PON
The ultra-dense WDM-PON, (UD)-WDM-PON, solution paves the way to the “wavelength-to-the-user” (WTTU) concept that is illustrated in Figure 12 [43,44]. This option shows similar advantages with TDM/WDM-PON in terms of diversity, scalability, higher capacity per user and coexistence with current standards, while it extends the spectral efficiency due to the ultra-dense WDM scheme. (UD)-WDM-PON can be realized with either coherent detection or employing narrow-selectivity filters. In the former case, which is essentially a special case of coherent-PON, a higher power budget can be attained, increasing the overall number of users and the transmission length, but with a significantly greater cost. In the latter case, low-cost components can be used, such as an ultra-dense AWG and direct detection receivers. The main drawback of this case is the significant losses due to the cascadeability of the tunable filters, which cannot achieve very narrow selectivity, extensive tunable range as well as required stability.
Nyquist-WDM-PON
The Nyquist-WDM-PON [45] is a solution which aims to minimize the overall number of transceivers. This is achieved by aggregating multiple transceivers onto a single hub transceiver. The hub transceiver uses coherent technology and multiple combined subcarriers based on the Nyquist criterion into a single optical wavelength, as it is illustrated in Figure 13. In this way, a 100G or a 400G wavelength can be divided into 4 × 25 Gb/s or 16 × 25 Gb/s subcarriers, respectively, or even into a combination of different number of subcarriers and line rates. Using Nyquist-WDM-PON, the network is migrating from point-to-point towards point-to-multipoint architecture, decreasing the overall number of optical interfaces from 2N to N + 1, where N is the number of access nodes. This solution provides significant advantages compared with legacy PON systems. The most important are (a) decreased number of transceivers due to the use of hub transceivers; (b) better routing efficiency, density, and simplicity, as the overall number of ports is significantly reduced; (c) better alignment of CapEx with actual bandwidth requirements, quick adaptation on changing bandwidth demands as well as traffic patterns; and (d) lower OpEx in terms of power consumption, footprint, number of aggregation sites and support. The concept of Nyquist-WDM-PON has been lately commercialized in a version with the name “XR-Optics” [46,47].
OFDM-PON
Orthogonal frequency division multiple access (OFDMA) is a well-established technology in wireless and fixed access systems such as WiMAX, LTE, ADSL and Wi-Fi and can be efficiently utilized in the PON context to provide significant advantages [43,48,49,50]. This technology employs several low bit rate subcarriers to carry different QAM symbols simultaneously and was originally conceived as a modulation method for media to overcome bandwidth limitations (copper, radio). When the scheme is employed to allow for OFDMA, different users are assigned to different OFDM subcarriers. The use of OFDM in optical access networks has been mainly driven by the necessity to increase transmission rates without increasing the bandwidth of optoelectronic transceivers, as opposed to focusing on link optimization. The first advantage of OFDM-PON is the finer granularity compared with TDM-PON, enabled by efficient multiplexing of orthogonal subcarriers, leading to a better spectrum utilization. The second advantage is the elasticity of spectrum allocation for each user. As traffic demands per user may vary with time, an elastic spectrum allocation is very attractive, and the OFDM-PON enables the bandwidth assignment on an as-needed basis. Third, the OFDM is a more spectrally efficient method than, e.g., NRZ. Next, OFDM can be used for both coherent and direct detection schemes. This is important, because when the coherent scheme is adopted, the overall performance can be greatly increased, and on the other hand, when a direct detection (DD) scheme is considered, low-cost components, such as directly modulated lasers (DML), vertical cavity surface emitting lasers (VCSEL) and low-bandwidth electronics along with discrete multi-tone (DMT), can be used, significantly suppressing the overall costs. Finally, OFDMA-PON enables the convergence between wireless and fixed networks, allowing it to manufacture universal components for both uses. Figure 14 illustrates an example of how OFDM-PON enables convergence. The topology consists of the OLT located at the central office (CO) and several ONUs located either at the user (residential or corporate) premises or at wireless base stations (BSs) that are used for providing connectivity to mobile terminals. One single feeder optical fiber from the OLT is used to carry all upstream and downstream signals up to a power splitter, which broadcasts them to multiple network segments. Then, additional power splitters (for FTTH) are used to broadcast the signals to all ONUs of each segment. Alternatively, some of those fibers can directly lead to wireless antennas or switches with DSL interfaces (FTTB case). Therefore, the OLT manages the assignment of traffic to a large number of subcarriers, which travel all along the Optical Distribution Network (ODN), to be demultiplexed only at the user side and vice versa. The subcarriers are grouped to form FDM channels (with several tens or hundreds of subcarriers contained within one channel), each of them used for carrying traffic, possibly by different providers and employing different technologies (e.g., GPON, EPON, but also wireless or copper-based ones). In summary, the CO can generally be thought of as a PON OLT but combining the additional functionalities of a DSLAM or a wireless BS.
Regarding the physical layer performance of Nyquist-WDM-PON and WDM-OFDM-PON, a comparative analysis can be found in [51]. This analysis shows that the physical layer performance is highly depended on the linewidth, which results in significant phase noise. In this work, two phase noise compensation methods were considered, namely, common phase error (CPE) and orthogonal basis expansion (OBE). Nyquist-WDM-PON showed a greater performance compared with WDM-OFDM-PON. This happened as the inter-carrier-interference (ICI) in WDM-OFDM-PON cannot be mitigated by CPE. Next, when OBE is used, WDM-OFDM-PON attains a greater performance than Nyquist-WDM-PON under the two cases, especially when the laser-linewidth is small. WDM-OFDM-PON is vulnerable to phase noise due to the long OFDM symbol period, but with the aid of effective phase noise suppression method, it can attain a lower BER compared with Nyquist-WDM-PON, being a cost-effective solution for access networks.
CDMA-PON
Optical Code Division Multiple Access (OCDMA) exploits the generation, combination and recognition of codes which can be set in the time or in the frequency domain of the optical signal. In the CDMA-PON approach, different codes are used between each pair of ONU and OLT. After the code allocation for the individual users, the data are coded and transmitted into the pulse sequences. As a result, a significantly greater level of security can be achieved using this technology. Another potential advantage of CDM is the combination with TDM and WDM in order to enhance the overall number of supported users [52]. However, its features pose significant constraints on its wide adoption, such as the non-existence of a bandwidth allocation mechanism, the lack of maturity and lack of optical encoders and decoders for this PON technology [48]. Finally, another disadvantage of CDMA-PON is that it is currently constrained by unsolved practical issues such as high insertion losses and phase errors of the optical CDM elements [53]. The principle of operation for the CDMA-PON variant is shown in Figure 15. In this architecture, users connect via an ONU and a 1×N optical combiner/splitter to the OLT. Encoders generate the encoded signals in the OLT in the optical domain, which are transmitted on the same medium to the optical splitter. Encoding and decoding take place in the optical domain, so OCDMA systems can support asynchronous transmission modes without the need for complex electronic devices.
Coherent-PON
Coherent transmission has been widely commercialized for long-haul communications, but in the access domain, it is considered a cost-ineffective solution [54,55]. However, as the traffic demands scale over time, coherent transmission with low-cost modules seems appealing for the near future, as it can greatly increase the number of supported users as their signals can be transparently multiplexed in the optical domain.
Coherent-PON provides a number of well-known advantages. First, the coherent transceivers can attain an increased power budget compared with their DD counterparts, due to the improved receiver sensitivity, directly leading to an increase in both the number of users and the transmission reach. In practice, the increase in power budget using coherent transmission can be higher than the one attained with an APD or with an optical amplifier. Second, the spectral efficiency can scale flexibly due to the use of quadrature amplitude modulation (QAM) shaped signals. The use of a higher-order constellation instead of an increased number of components, directly reduces the overall costs and power consumption. Third, the channel selectivity can be finely tuned by simply adjusting the local oscillator (LO) at the receiver and the electrical filter. Fourth, if digital signal processing (DSP) is employed, the impact of various performance constraints, such as chromatic dispersion, polarization mode dispersion and various component imperfections, can be mitigated concurrently, but with an additional cost, due to the expensive ad hoc application-specific integrated circuits (ASICs) for DSP and coherent optics [52]. These advantages make coherent-PON seem highly attractive for access networks in the near future as it is fully compatible with deployed TDM-PON standards. The operation of a typical coherent transmitter and receiver used to generate and receive a QAM signal, respectively, is illustrated in Figure 16. In practice, simplified coherent reception techniques are proposed that can trade physical layer performance for a lower cost [53].
Super-PON
Super-PON is a PON variant which can exploit WDM, wavelength routing and optical amplification in order to increase the number of users and the distance between OLT and ONU. In a typical PON, the number of end users for a link length of 20 km is limited to about 64. In super-PON, due to the significantly improved power budget, the link length can be increased to 50 km and the number of end users can be increased to 1024 (Figure 17). The reach extension from 20 to 50 km also enables a CO consolidation, which leads to a reduction of the overall number of powered sites and, as a consequence, leads to a decrease of the overall network operational costs. The impact of network consolidation in a network with a 50 km radius is depicted in Figure 18. As is evident, the number of COs, in this case, can be reduced from nine down to only one. For the majority of European cities, this CO reduction can lead to about 25% lower infrastructure building costs compared with XGS-PON [56]. In this direction, super-PON will be defined in ITU-T recommendation G.9807.3.
Exploiting oDAC to exceed 1 Tb/s rate
Integrated photonics can provide more compact and cost-attractive component solutions in the long run. Recently, the direct digital to optical domain (D/O) conversion has been studied as an attempt to replace the electronic digital to analog converter (eDAC) intermediaries [57,58].
EDACs are key conversion interfaces from the digital to the analog domain. In high-speed digital optical transmitters, the D/O translation typically comprises power consuming and costly eDAC-based data conversion, followed by analogue optical modulation. In a conventional optical system, eDACs are used to process multiple inputs of bitstreams in order to create analog multilevel signals. From the viewpoints of performance, energy efficiency, complexity and cost reduction, it would be advantageous to adopt direct D/O conversion and eliminate the eDAC intermediaries. This would be particularly useful in future generations along the roadmap of ultra-high-speed photonic interconnects, as eDAC technology is becoming more expensive, making increasingly challenging to keep scaling up in data rates, while keeping power dissipation at reasonable levels and maintaining the required effective number of bits (ENOB) performance.
Over the last decade, the predominant activity in the oDAC research area has pertained to “serial” structures based on partitioning of the electrodes of the basic Mach–Zehnder modulator (MZM) (Figure 19). The so-called segmented Mach–Zehnder modulator (SEMZM) [57] breaks up the MZM electrodes pair along the two MZM waveguides into multiple (shorter) electrically isolated segments. Each modulation segment amounts to an elementary 1-bit modulation gate driven by a separate binary signal. The summation of the optical phases induced by the array of 1-bit segments along the device generates a multilevel output optical signal.
As an alternative approach, a “parallel’’-based design employing electro-absorption modulators (EAMs) instead of MZMs has been proposed in [59]. The compact size of the EAMs and their ease of integration with silicon photonics make them a really lucrative option. Various works of “multi-parallel” oDAC functionality have been proposed, arraying a pair of 1-bit (OOK) [59] or 2-bit (QPSK) [60,61,62,63] modulation gates in parallel, fed by splitting a common optical source, with their outputs superposed in an optical combiner. The latest and state-of-the-art multi-parallel oDAC structure has been introduced in [57], where the authors have demonstrated an architecture which, with the combination of identical parallel paths and a variable splitter and combiner, is able to generate higher-order m-PAM/m-QAM constellations, suitable for operation with either direct or coherent detection receivers (Figure 20).
The basic goal of a parallel design is to generate optical multilevel PAM signals using only binary driving digital signals. As shown in Figure 20, 1-bit intensity or phase gates are the fundamental building blocks that are required at each one of the oDAC paths. These gates are practically implemented using MZMs that are properly biased and driven by electrical signals [57]. Then, by adding all the optical paths via a variable combiner, one can produce optical signals with different amplitude/phase values (and thus multi-level m-PAM/m-QAM). Moreover, extensive analysis has been performed in [57] to demonstrate the significance of variable, controllable splitting and combine ratios to realize such a design in an operationally efficient way. To be able to achieve proper operation under dynamically changing operational conditions, the authors added control and calibration functionalities to their architecture along the optical paths by utilizing slow phase-modulators. With this type of treatment of the possible mismatches in splitting or combine ratios that can occur through the manufacturing processes or due to temperatures/environmental changes, their design becomes far more robust compared with other works of the literature.
Overall, we can conclude that the discussed optical DAC advantages in the relevant articles available in the literature, point in the direction that the future of digital to analogue conversion at optical transmitters will be mainly relying on optical processing based on photonic integrated circuits in order to break-through the bandwidth and energy efficiency limitations of electronic-DAC-based transmitters. In the next sub-section we analyze the backbone part of fixed networks.

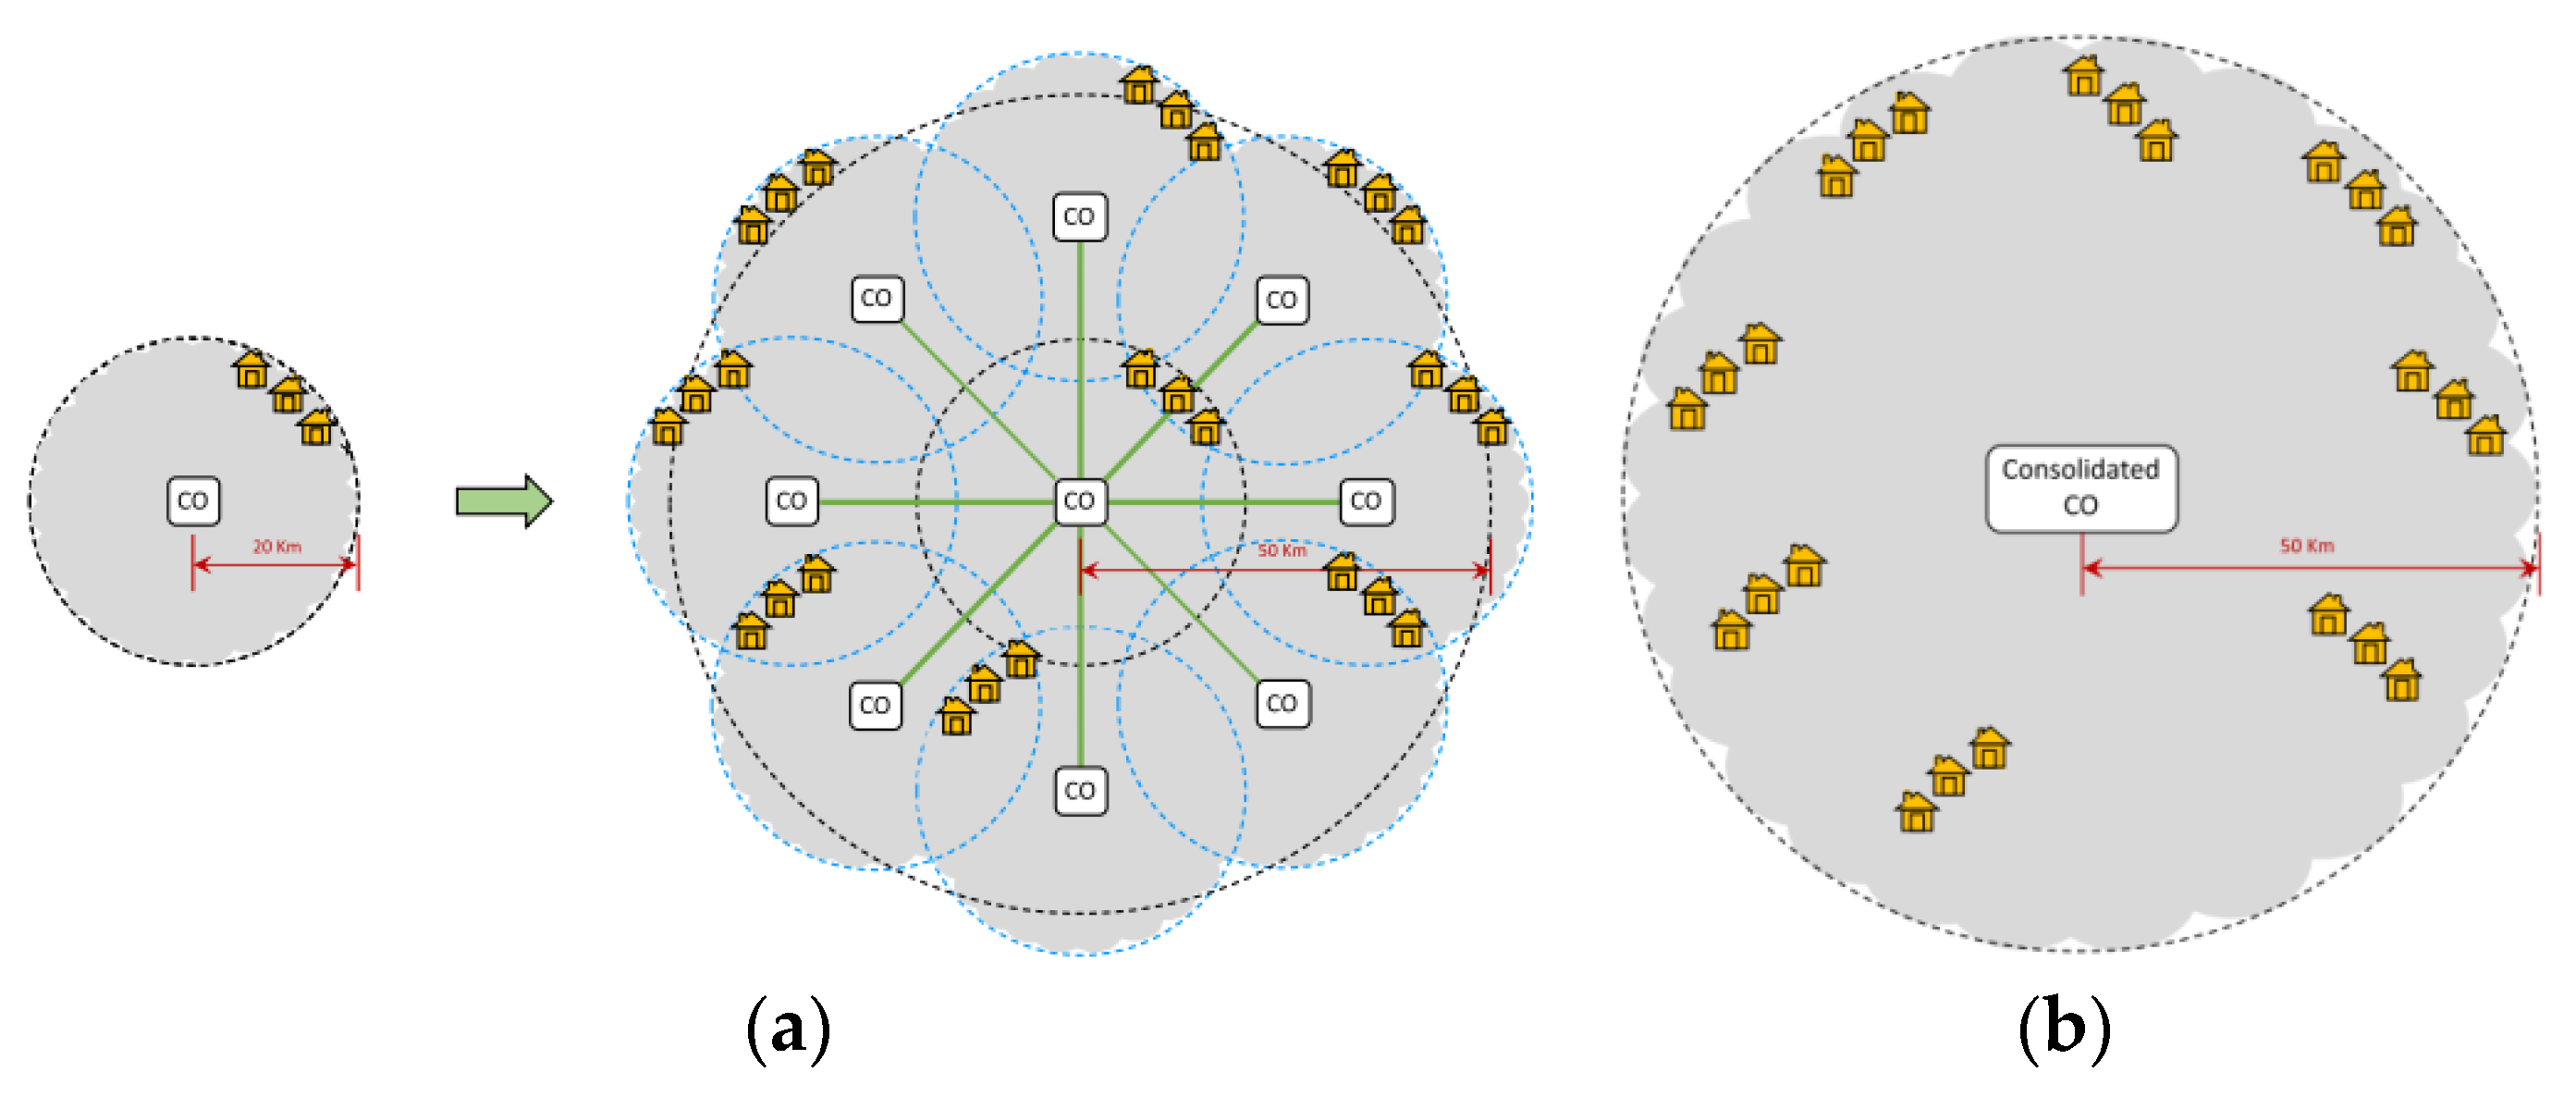
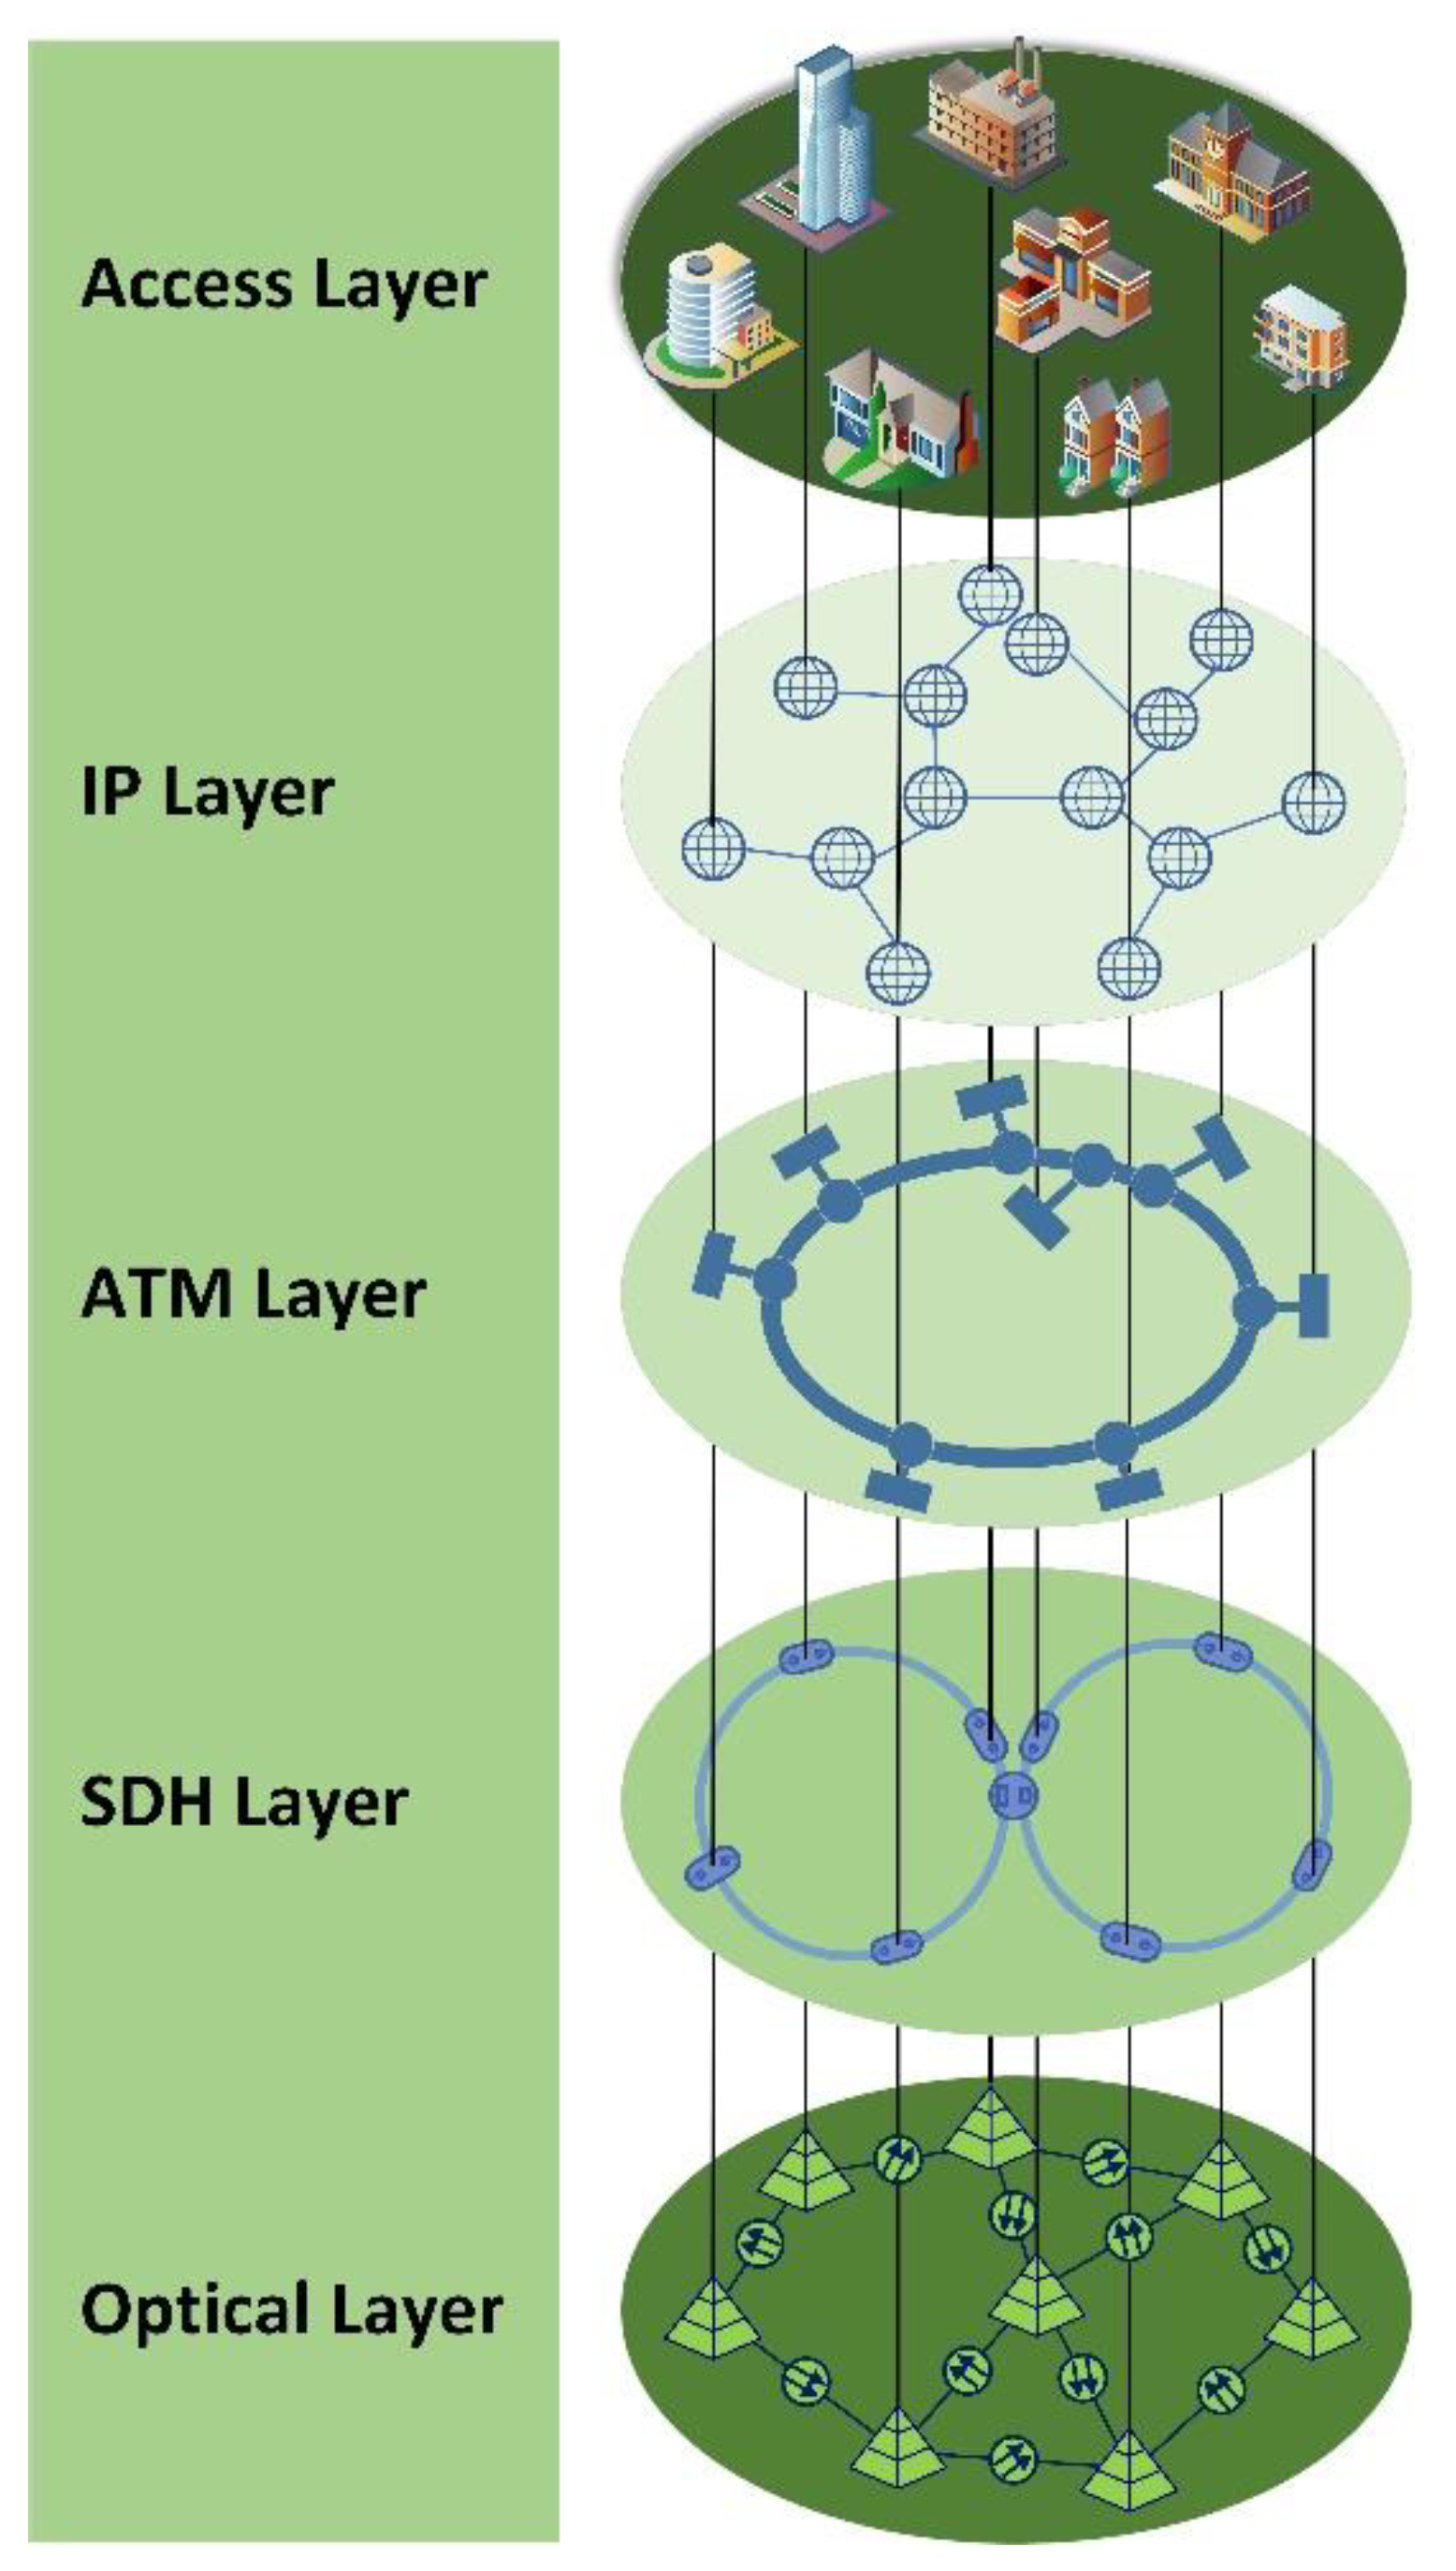
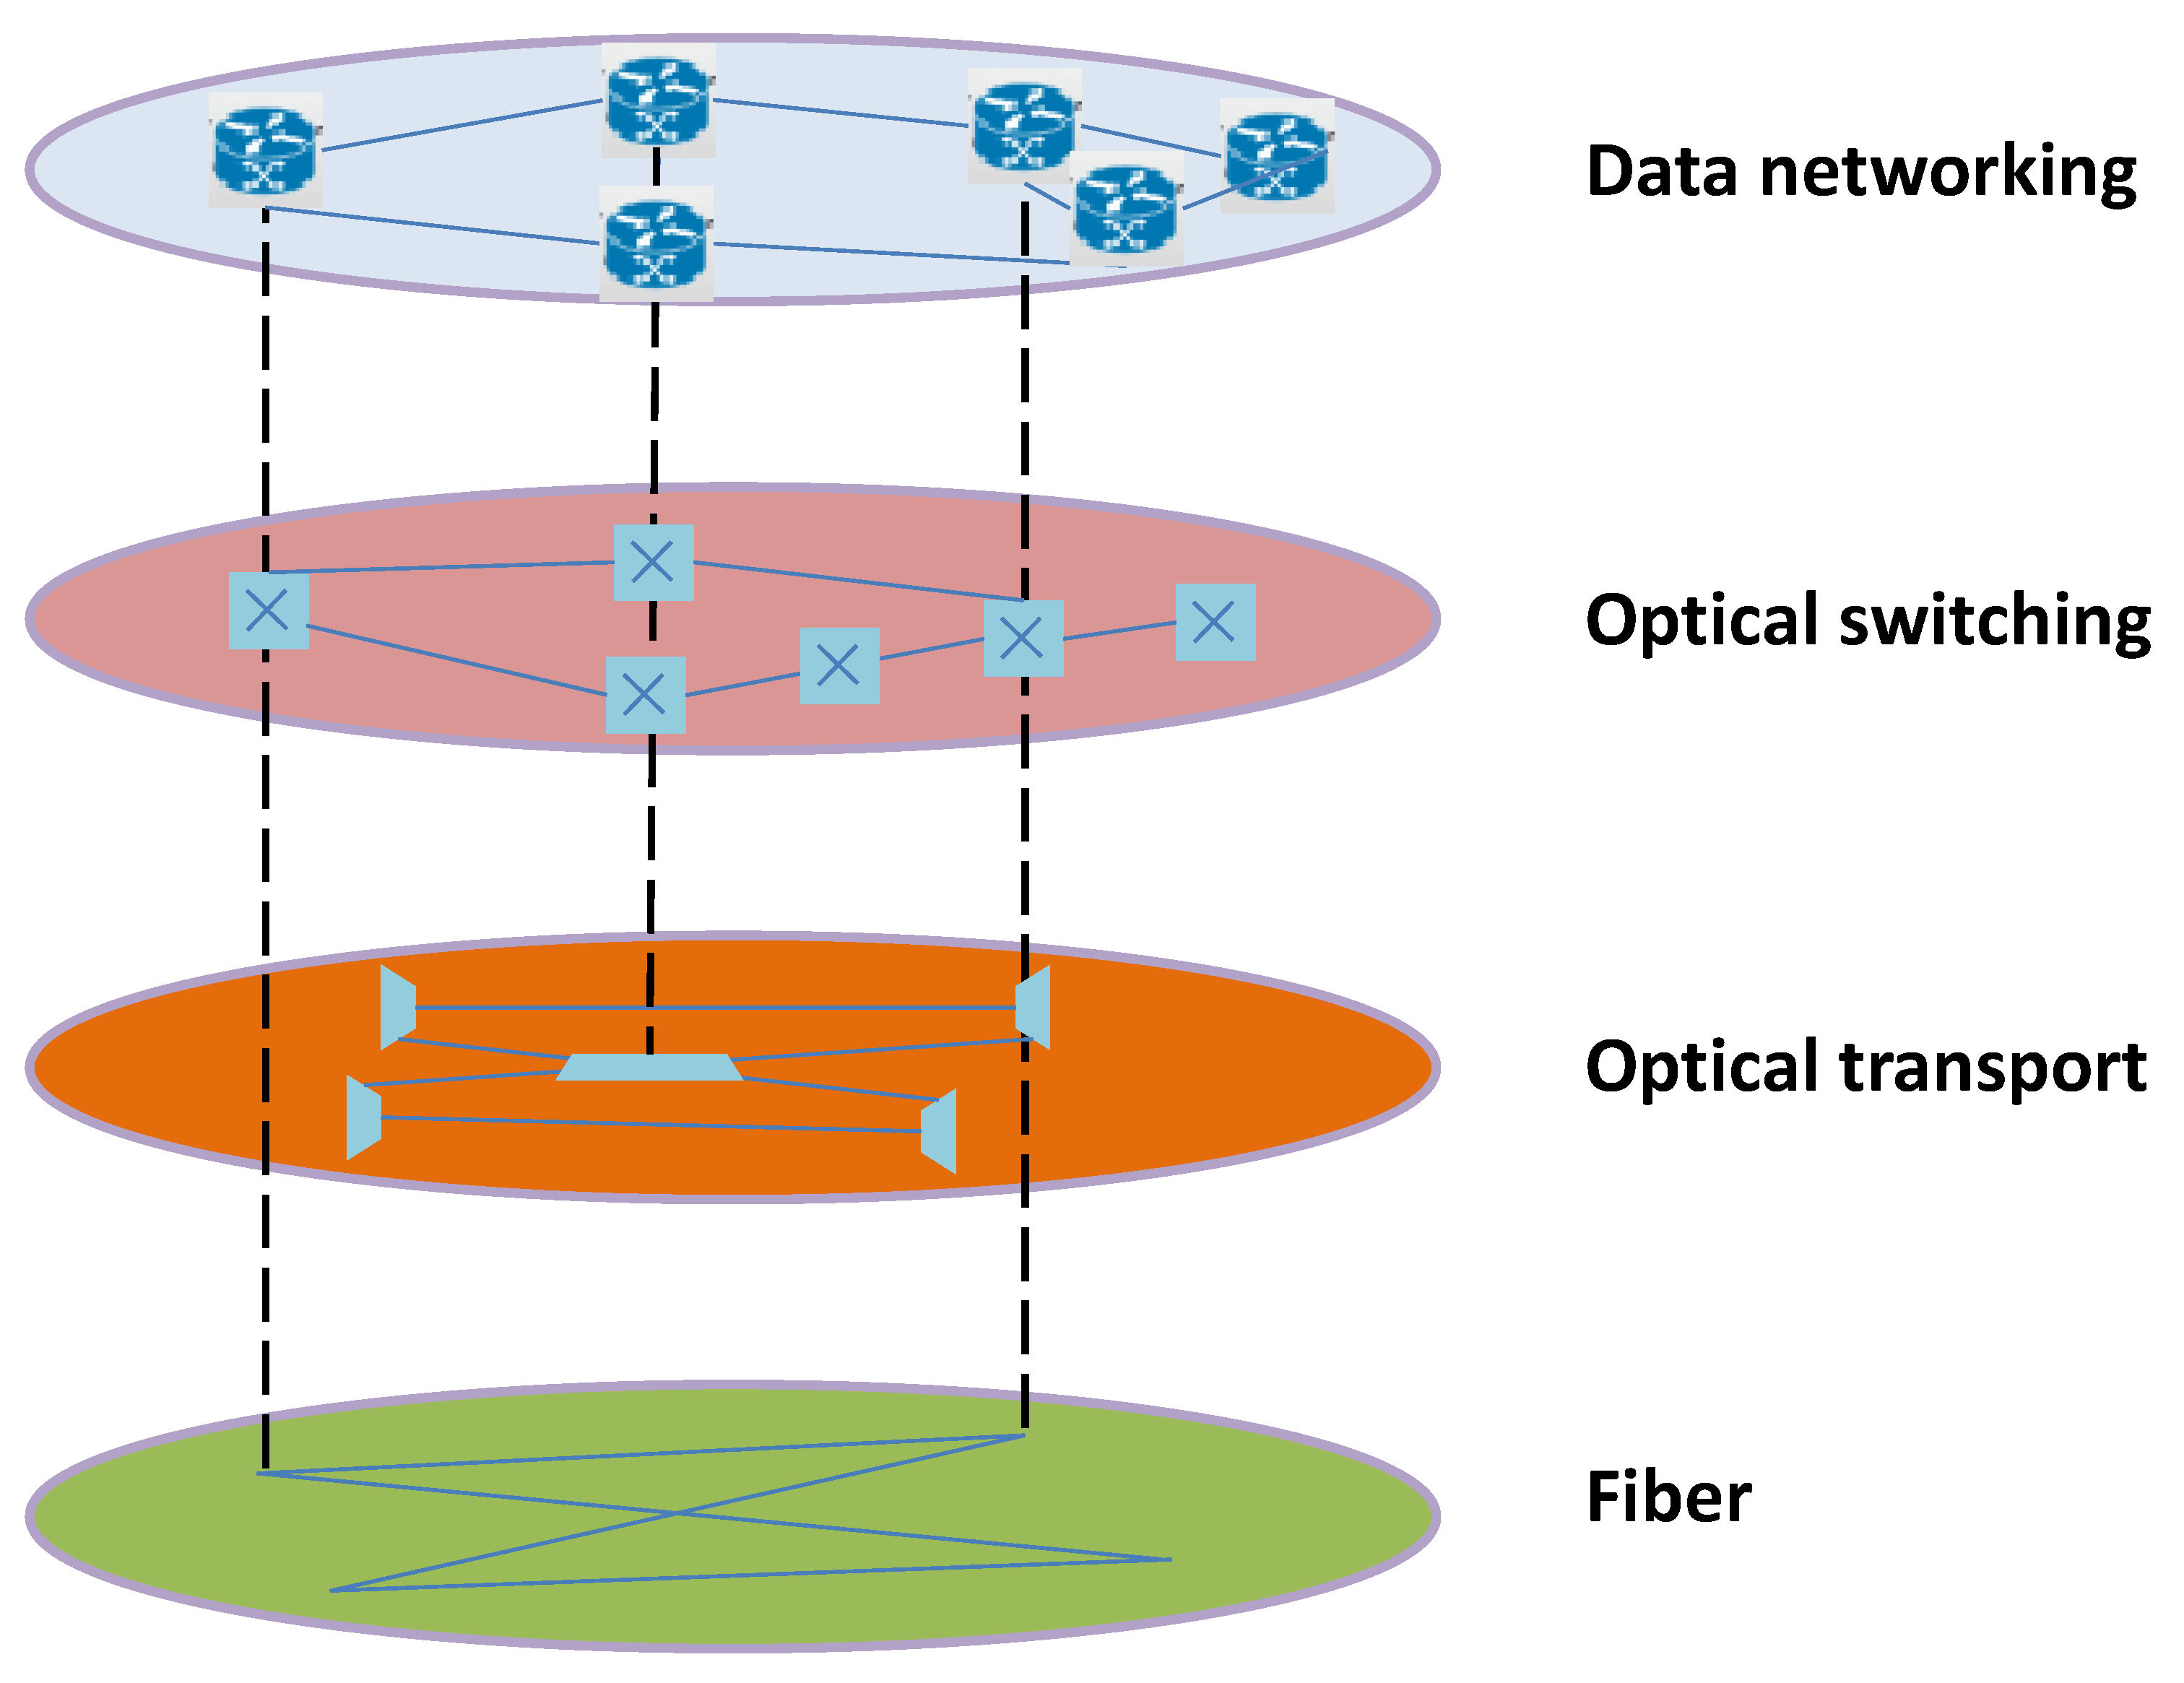
4.2. Five Generations of Backbone Networks: From PDH to OTN/SDN

4.2.1. Intro on the Evolution of Backbone Networks over the Past 50 Years

The advancements in TDM systems, along with the development of sophisticated hardware that was able to perform pulse stuffing and sample incoming channels at a higher rate, made feasible the introduction of plesiochronous digital hierarchy (PDH) systems. The introduction of the PDH system made possible to avoid having TDM mux/demux down to the fundamental rate when a tributary was to be extracted from the aggregate rate channel between two nodes in tandem. This innovation dropped the cost of switching and, hence, of channel transportation. The basis for PDH was a transmission rate of 64 kbps/channel and with TDM, the rates could scale up from 1.544 Mb/s (or 2.048 for E1) to some dozen Mb/s, depending on the available hierarchy of channel multiplexing in the time-domain. It would take, of course, another 25 years before the standardization of the ISDN, which brought digital TDM multiplexing to the consumer side, besides backbone networks. The main standards of the five generations on the backbone part of the network are summarized in Table 8 and will be discussed in the following paragraphs as part of the evolution timeline.
The historical evolution of modern backbone networks is depicted in Figure 21, and it is elaborated in the rest of this section.
The emergence of digital technologies marked the start of the first generation (“F1G”) of backbone networks and had a major impact on the subsequent evolution, as it made possible the use of advanced TDM techniques for circuit-switched networks on the one hand and efficient packet switching for IP networking on the other, while still maintaining copper cables or co-axial cables as the main transmission medium.
Figure 22 shows the timeline for the main standards of the past five generations of fixed networks. The beginning of each arrow marks the year the corresponding transport standards of Table 8 were made publicly available. The proliferation of digital multiplexing and switching techniques increased the attainable capacity and brought co-axial cables to their physical limits in terms of the distance they could transport the high-capacity signals without being irrevocably distorted. This was the point where cables embraced the use of optical fibers as the dominant transmission medium, thus giving way to the rise of the next generation of broadband networks.
The second generation (“F2G”) of backbone networks relied on fiber-optic transmission systems to transport digital signals. The corresponding systems exploited the advances made by synchronous digital systems based on the synchronous optical network (SONET) of the synchronous digital hierarchy transportation systems (SDH) in the early 1990s, which boosted the backbone network capacity to new levels. The implementation of SDH/SONET allowed us to overcome the limitations of PDH in terms of (de)multiplexing complexity. Synchronous networks facilitate the extraction of lower-rate digital tributaries from the multiplexed signal in an effective way, as it is a very powerful technique when multiple point-to-point links are multiplexed into an aggregated form. In addition, this technique made the concept of “robust networking” feasible via exploiting the capabilities of digital add/drop multiplexers and cross-connects, which subsequently enabled the implementation of new network architectures (beyond the point-to-point ones), such as interconnected rings and mesh. Based on the features of those architectures, the backbone networks could perform self-healing operations featuring rapid network restoration times.
In the meantime, the breakthroughs in optical transmission, the deployment of the first cellular mobile networks and the widespread adoption of the packet-switched techniques of data routing, opened new possibilities for the backbone networks.
SONET, relying on optical fiber transmission, set the next generation of digital rates by defining the synchronous transport signal STS-1 rate. The STS-1 data rate was approximately 51.84 Mb/s. This was formed by combining 90 columns in nine rows, 8000 times per second, and 8 bits per octet, with any SONET/SDH frame repeated every 125 microseconds. The asynchronous sub-rate signaling was made feasible via bit stuffing, allowing for the introduction of flexible add/drop multiplexing as well [64]. Each level of the SONET hierarchy terminated its corresponding fields in the SONET payload, as shown in Table 9 [65]. The key novelties of SONET/SDH, as a key technology of F2G era were:
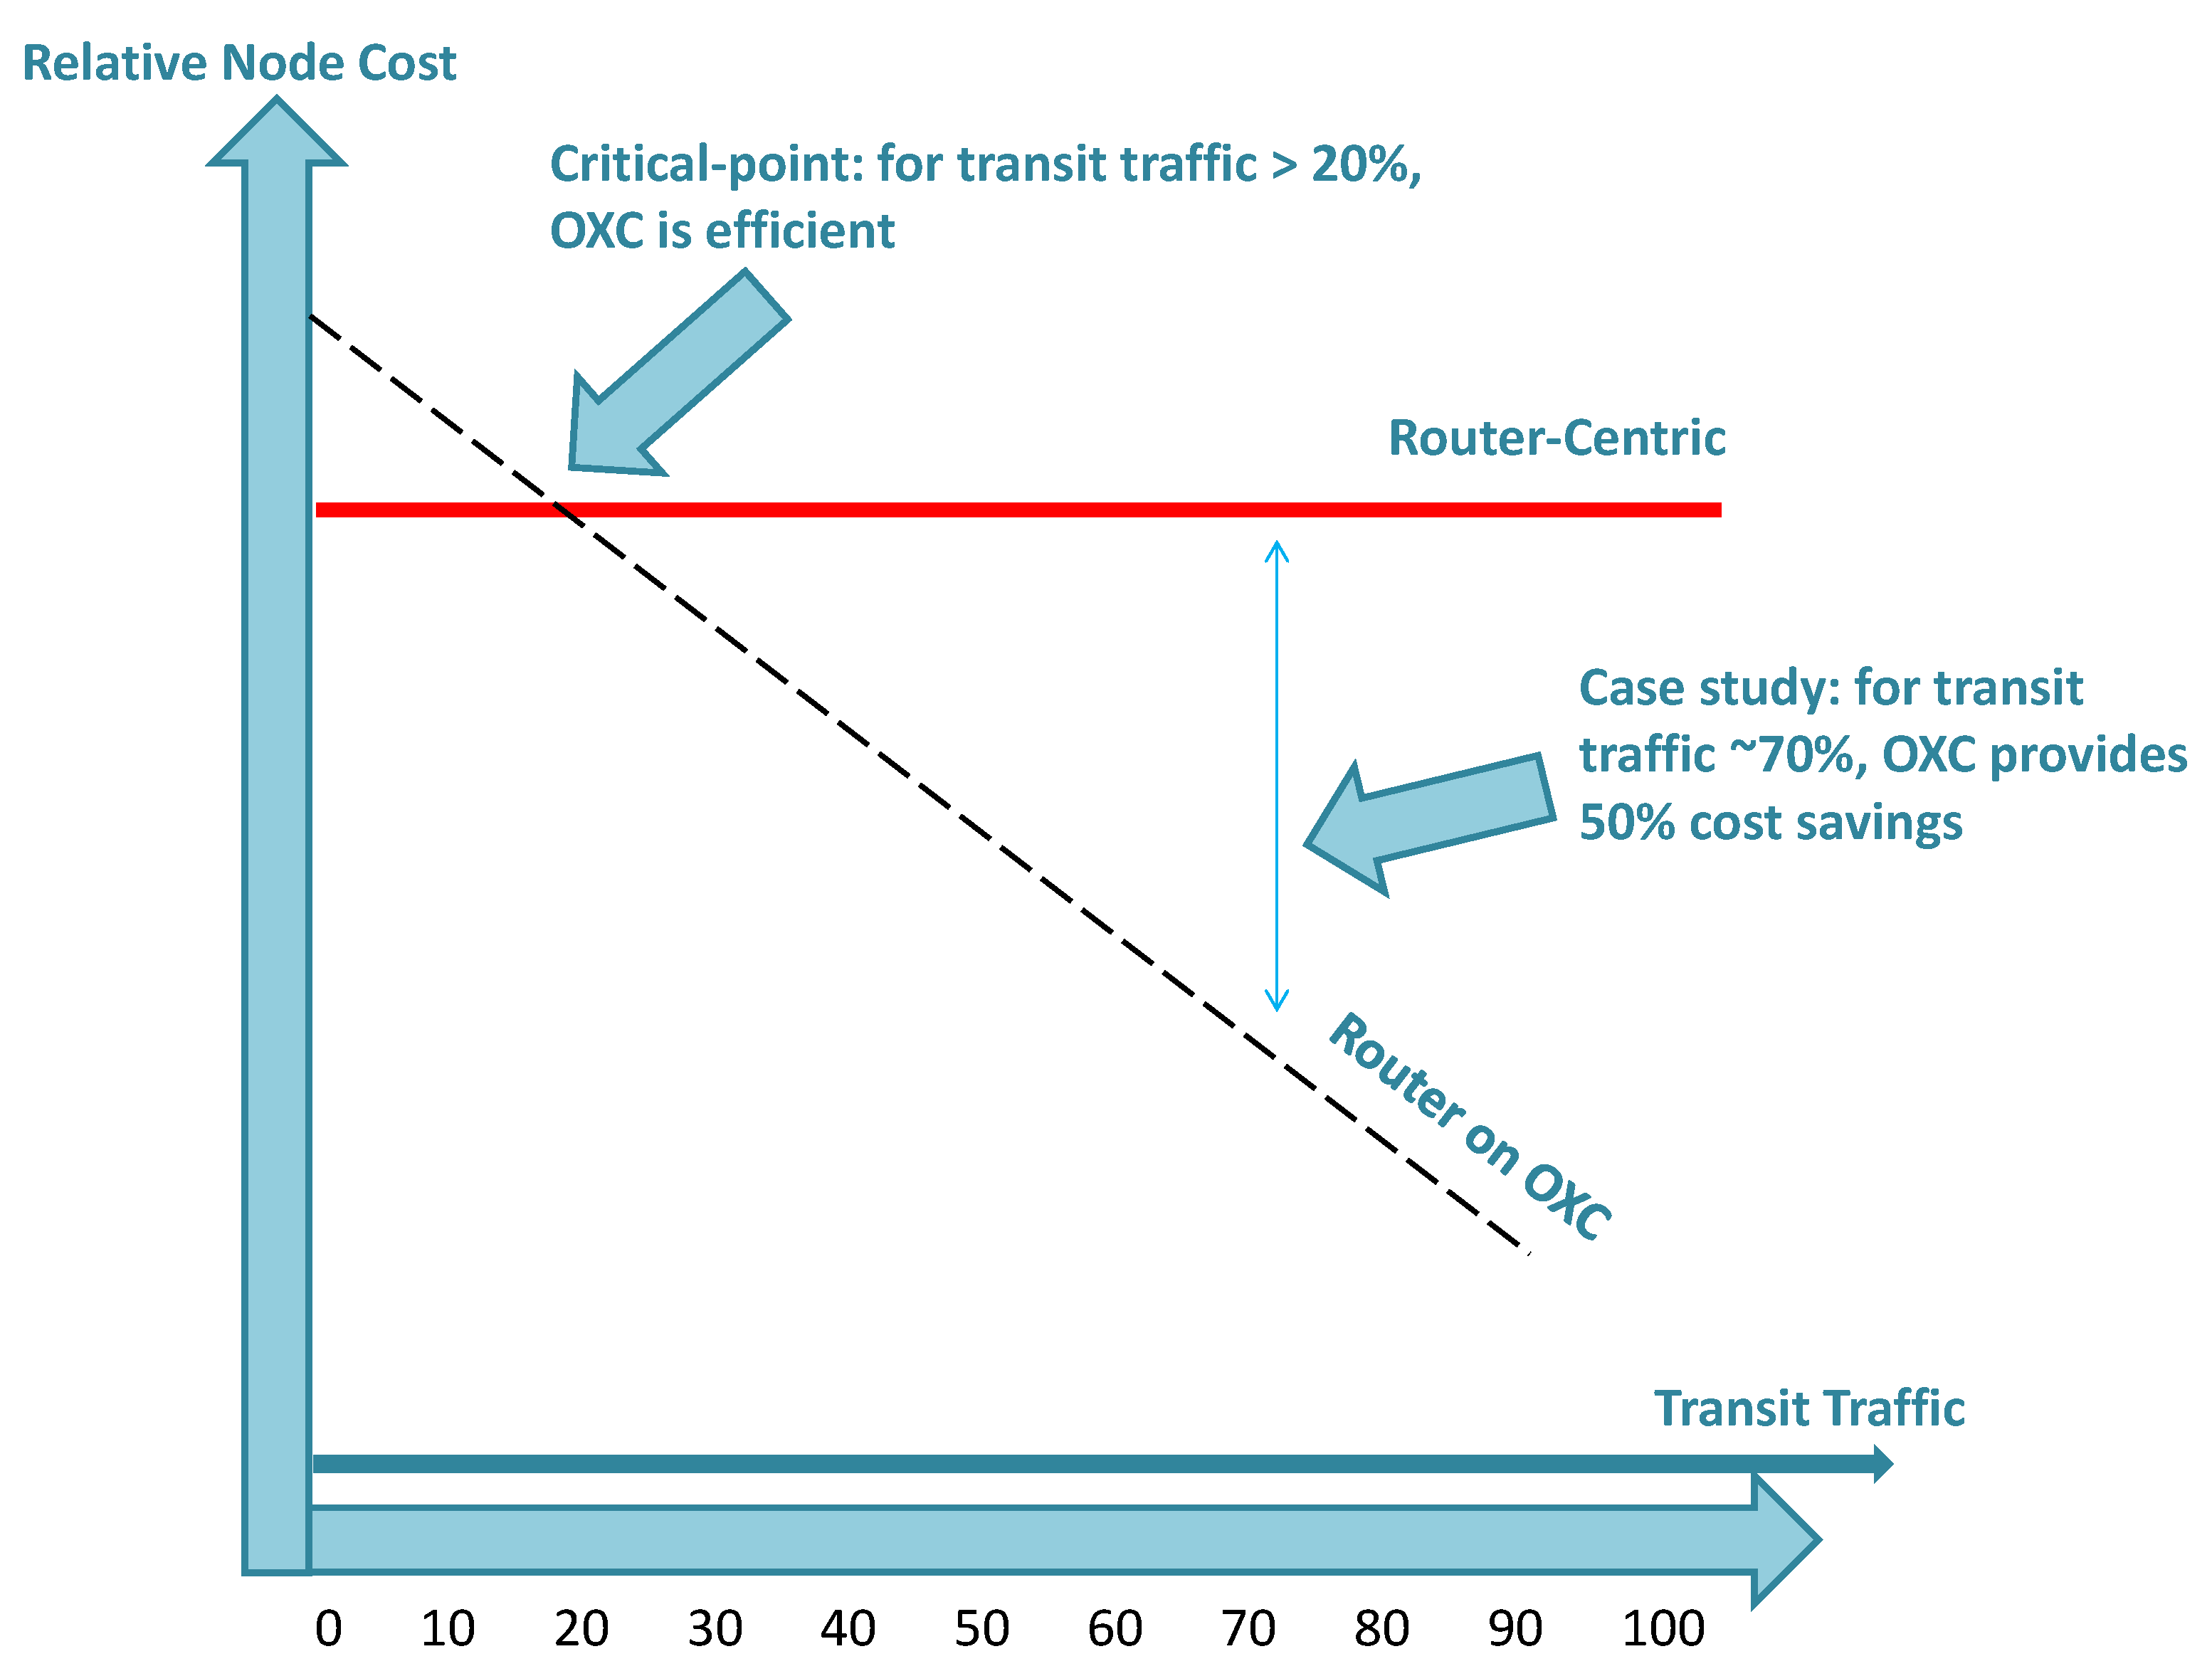
  • Solved multiplex bundling problem;
  • Overcame the need for multiple P2P links;
  • Provided rapid restoration time (typ.50–100 ms);
  • Enabled the use of electronic static ADMs and digital cross-connect (DXC) for traffic switching [66].
Table 9. Details of SONET hierarchy levels.
SectionLinePath
DescriptionA section is a single fiber run that can be terminated by an optical regenerator or a network feature (line or path).One or more portions of a line signal are originated or terminated by line-terminating equipment (LTE).Non-SONET equipment is connected to the SONET network via path-terminating equipment (PTE). The payload is mapped and demapped into the SONET frame at this layer.
AimTo correctly format SONET frames and to convert electrical signals to optical. The section header overhead can be originated, accessed, modified or terminated using section terminating equipment (STE). (An STS-1 frame is nine rows by 90 bytes in size. The section and line header overhead is made up of the first three bytes of each row).On SONET frames, the LTE performs information synchronization and multiplexing. Higher-level SONET signals can be generated by combining several lower-level SONET signals. LTE is exemplified by an Add/Drop Multiplexer (ADM).This layer is responsible for end-to-end data transport. The optical interface layers are arranged in a hierarchical order, with each layer building on the services offered by the layer below. Each layer communicates with peers in the same layer, processes data and then transfers it up or down to the next layer.
Moreover, during the F2G era, the landmark innovation of ATM came along at the higher network layer with the introduction of connection-oriented means to transport packet traffic, via the concept of establishing virtual circuits. In this way, ATM allowed for circuit-switching-based robustness alongside the flexibility of packet-switched segmentation of data traffic. Beyond ATM, other protocols such as frame relay and X.25 found their niche as layer 2/3 techniques to frame/encapsulate high-speed traffic routing for transportation between central offices and mobile switching centers. These technologies were characterized by a variable rate that began at the solid broadband threshold of 1.5/2 Mb/s and went up to theoretically hundreds of Mb/s.
SONET systems offered excellent reliability and network protection. However, they did not quite match the requirements of the evolving backbone networks, since they were using too many costly optical-electrical-optical (O-E-O) conversions and initially single-channel transmission per fiber. Eventually, they evolved to support WDM and new features like virtual concatenation and traffic grooming based on the generic framing protocol. This was the point when the third generation (“F3G”) of backbone networks was introduced. During the early 2000s, several metro system vendors proposed additional data-transfer optimized protocols, like 1G/10G Ethernet and resilient packet rings (RPR), that started dominating the transport market in metropolitan networks in the forthcoming years. Ethernet was already a dominant transport solution in local area networks, and its extension into metropolitan-area networks (MANs) was quite reasonable. RPR was proposed as a MAC protocol designed to optimize bandwidth utilization and facilitate services over a ring network while providing carrier-class required attributes like 50-ms ring-protection switching. It is worth pointing out that the aforementioned transportation methods (i.e., SONET and RPR) are fully compatible with WDM transportation technology, as the latter is operating as a multiplexing overlay method. To encapsulate the zoo of client signals (i.e., SONET, Ethernet, ESCON, fiber channel, ATM, IP, etc.), advanced mapping and multiplexing schemes and new framing procedures are utilized to allow carriers to handle the heterogeneity. The bit rates of the data tributaries accessing the metro-access network varied greatly (e.g., from OC-3 to OC-196 for SONET and from 100 Mb/s to 10 Gb/s for Ethernet traffic). Therefore, network nodes at the edges of the metro network should also be capable of performing traffic aggregation in order to improve the efficiency of the transport network by combining the multiple low-bit-rate signals into a single high-bit-rate wavelength channel. Moreover, the network should be able to support bandwidth provisioning with various levels of granularity.
All these requirements were met with the employment of WDM systems alongside next-generation SONET add/drop multiplexers. Standardized in 1998 with the G.692 standard, WDM brought an undeniable novelty as it skyrocketed the transportation capacity. WDM facilitated the design of systems where multiple signal transmissions occurred over multiple wavelengths over a single fiber, increasing the overall system capacity to a significant degree. Thus, transmission of data streams of 10 Gb/s and later 40 Gb/s was accomplished by multiplexing different wavelength channels over a single fiber. Combined with the emergence of optical amplifiers in the mid-1990s, WDM provided a revolutionary breakthrough in transmission reach x capacity products as well.
The first generation of WDM systems was meant to simply scale the number of SONET/SDH rings using multiple wavelength channels. The network savings that aroused from WDM system offerings could be exploited, in a first approximation, in a reduction of the number of required optical fibers and SONET network overlays that were needed to accommodate the traffic demands. The additional cost of WDM system offerings was related to the use of multiplexers/demultiplexers, amplifiers and devices for signal conditioning management (e.g., variable optical attenuators or dispersion compensating modules). In addition to the higher capacity of a single fiber, WDM systems offered the capability of wavelength routing. Furthermore, SONET ADMs were replaced with Optical Add Drop Multiplexers (OADMs) and Optical Cross Connects (OXCs) that enabled wavelength switching and routing without costly O-E-O conversions, thus bypassing costly and energy-consuming electronic functionalities (a quest that is still on-going). In Figure 23, we summarize the aforementioned discussion, illustrating the evolution of backbone network architectures until the early days of optical networks relying on interconnected WDM rings.
The more advanced WDM transportation systems allowed the introduction of optical switching by means of optical add-drop multiplexers and cross-connects in ring and partially meshed connectivity network topologies. These systems emulate, at the optical layer, some of the functionalities the SDH/SONET systems provide at the digital layer without the scalability and capacity limitations the SDH/SONET digital technology supports. At the same time, ATM features related to efficient traffic handling were made possible with next-generation SONET (NG-SONET) systems, through new functionalities such as “virtual concatenation”, which led to efficient grouping of lower rate bit-streams in a non-standard manner, making higher efficiency available. In addition, time slot inter-changes were made possible, so that switching between different tributaries in data streams became feasible.
Of course, all the aforementioned data processing functionalities of SONET and ATM systems, which allowed transmission of information over optical fibers, required the frequent use of optical-to-electrical (and vice versa) conversions at various points of the network. Furthermore, both the advancements at the optical transport layer and the enhancements of capabilities at the higher network layers made some processing functionalities of the past SDH/SONET and ATM networks redundant. These facts resulted in some major limitations/inefficiencies which were reflected in the layering of digital/optic transport implementation [67], as shown in Figure 24. These limitations include a highly layered, complex network architecture with repetitions of functionalities and numerous O-E-O conversions, resulting in poor network scalability, slow service turn-up, and last but not least, high operational and capital costs for network operators.
The fourth generation (“F4G”) of backbone transport networks was marked by the emergence of advanced optical transport networks (OTNs) which incorporated advanced optical switching features, alongside the multi-protocol label switching (MPLS) approach, which introduced the concept of label switching as a successor of ATM’s “virtual circuit/path identifier” (VCI/VPI) based switching for connection-oriented forwarding of packet-switched traffic.
The compatibility of the emerging F4G OTN automatically switched optical network (ASON) standards with MPLS, allowed for much better handling of network efficiencies of the F3G era and supported superior network capabilities. Overall, the fourth generation achieved:
  • higher signal-rate encapsulate multiple packet-based signal formats;
  • service transparency (SDH/SONET, Ethernet, ATM, IP, MPLS etc.);
  • superior restoration;
  • improved FEC;
  • use of reconfigurable optical add-drop multiplexers (ROADMs).
On the network architecture side, the approach adopted was to use reconfigurable OXCs in a mesh topology, operating on individual wavelengths, where each could transport high-speed signals at OC-48 rates and above. With the use of network-controlled OADMs/OXCs, only add/drop traffic was processed by the IP routers. Optical cross-connects proved efficient in large transit-traffic cases where IP routers connected on OXCs provided cost savings and increased cost/power-consumption efficiencies. This is because OXCs provide router bypassing for transit traffic, limiting the number of digital ports and the amount of cross connection hardware needed to implement efficient routing. Now, the transit traffic is transparently routed through a node, and only the fraction of the traffic that is locally dropped has to go through the digital switch, as shown in Figure 25.
Moreover, in F4G systems, all client signal-related processes took place in the IP/MPLS layer, whereas the required traffic aggregation, switching and traffic restoration in case of failure could be implemented by the optical layer at the line-side.
However, with the introduction of transparent optical networking, besides the huge benefits, some notable drawbacks related to the analogue nature of optical networks arose, due to the limited ability to perform error monitoring, signal quality tracing and fault isolation. Despite these downsides, the optical transport and switching layers emerged as key parts of the backbone networks (as shown in Figure 26), allowing for significant improvements of optical mesh networking [68,69]. Subsequently, IP/MPLS over OTN established the network resilience capabilities that modern data services required [70].
OADMs and OXCs in post-2005 OTN deployments could be reconfigurable (i.e., ROADMs), either by the use of wavelength-selective architecture or by considering a broadcast-and-select architecture. Topologies with higher degrees of connectivity and versatility can be realized using WSSs with port counts N > 2 and allow optical mesh networking. OXCs exploiting 1 × 8 or 1 × 9 WSSs are commercially available, offering up to 8 degrees of connectivity at a given node. The layout for the N-degree ROADM is similar to that of the 2D ROADM, except that the “broadcast” power splitter on the drop path becomes a 1 × N and the “select” WSS on the add path is a N × 1. The WSS based ROADMs provide optimal bandwidth management and support better network resilience in mesh network architectures.
The “current” fifth generation (“F5G”) of backbone networks is based on the innovative generalized multi-protocol label switching (GMPLS) and ASON concepts, while introducing software-defined networking (SDN) and network function virtualization (NFV) capabilities gradually over time at the optical transport networks. In the late 2000s, ITU-T introduced the ASON standard in order to harmonize the control plane in optical networks. In ASON, the network performs management, control and transport from top to bottom. ASON features the connection control interface (CCI) and the network management interface for the transport network (NMI-T) [71]. The novelty of ASON lies in the control plane, which incorporates significant innovative features, such as topology discovery, setup and tear-down of connections, as well as protection and restoration and traffic engineering capabilities. Moreover, the control-plane, the management of network elements is handled by the management-plane via NMI-T and the network management interface handles all network resources for the ASON control plane (NMI-A). The simple network management protocol (SNMP) can be employed; however, additional options are available [72].
The GMPLS architecture provides convergence between the transport and client networks. The aim of this protocol was to reduce design complexity and provide simplicity in implementation. GMPLS can be configured to handle networks with different switching options/solutions (as far as the data plane is concerned) and different means of managing the network (the control and management planes). The GMPLS protocol allocates the resources of the optical transport network as per connectivity requests coming from a client packet-switched network [73].
Another robust technique that characterizes F5G is impairment awareness embedded within the routing and wavelength assignment (IA-RWA) process in optical network design/operation. Physical-layer impairments (PLIs) can be dealt with mainly by two different methods: (a) allowing system margin to withstand the worst-case scenarios caused by various physical layer impairments and/or (b) calculating the impact of these impairments as precisely as possible, with respect to the physical quality of the signals (as measured by e.g., the optical signal to noise plus interference ratio (OSNIR) and eventually the bit-error-rate of a connection). In case (a), sufficient system margin could be set to withstand the interactions of signals at one connection (lightpath) with others supporting other connections, or the signal degradation due to noise accumulation or inter-symbol interference effects resulting from the characteristics of optical components and fibers used across the optical connections (lightpaths) in an optical network. In this case, two different types of margin can be set [64]. The first is the power margin, which is used to compensate the power degradation attributed to a number of physical layer effects, such as a drop in the output power of the transmitters due to aging; the excessive losses of optical components; imperfect channel equalization, etc. The second method is the BER margin, which ignores the actual physical layer effects and sets a higher OSNIR threshold value for a channel to be admissible. In case (b), the optical performance and, as a consequence, the reach of a certain usable wavelength along a given path is calculated depending on the state of the neighboring wavelengths at the time a communication request is sent. The choice between the two methods (a) and (b) can be influenced by how regenerations are performed and by the existence of accurate and time reasonable analytical expressions that calculate the impact of the most catastrophic physical layer effects. If regeneration is allowed in the network, the impact of using a worst-case impairment scenario would most likely require additional, costly regenerations because the device’s optical distance is significantly limited. However, as long as the optical reach (distance at which the signal is transmitted with acceptable quality) remains reasonable, minor changes in distance have little effect on the amount of regeneration needed and, as a consequence, at the total number of regenerators on the network.
The post-2015 backbone network investigations were mostly based on the concept of (flexible) elastic optical networking (EON), as it is illustrated in Figure 27. In EONs, the line-rate of a “sub-channel” allows us to flexibly allocate a portion of the available bandwidth according to the connection’s needs. With single-carrier channels, this is performed by tweaking the symbol rate of the source or by invoking a higher-order modulation format. With multi-carrier channels (such as Nyquist-WDM or optical-OFDM), this is realized either by increasing the bitrate of each individual frequency component/sub-channel or by altering the number of sub-channels while the bitrate per “sub-channel” remains constant.
Network protocols, such as GMPLS in ASON and the path computation feature communication protocol (PCEP) in PCE, and also the OpenFlow protocol in SDN, are examples of network control protocols (NCP) that are used to orchestrate the network operation, while they can also incorporate capabilities for physical layer awareness. The SDN framework can be used to simplify the routing process in (G)MPLS networks, for example, to provide load-balancing of MPLS tunnels by better tracking traffic variations and improving the routing of MPLS LSP tunnels. By adding the actual optical-layer routing information to the IP/MPLS-layer, the SDN framework allows us to find and implement the OSPF loop-free alternate (LFA) and fast reroute (FRR) paths faster and more efficiently. A fast lightpath provisioning (or rerouting) mechanism can be applied using more sophisticated or open network management interfaces to the ROADMs, such as a REST interface with an information model based on the Yang protocol, by reusing the DWDM-layer transponders on an existing lightpath or by using preinstalled spare transponders. Based on SDON concepts, another approach called self-optimizing optical networks (SOON) has been proposed, which combines Machine Learning (ML) technology with SDON to increased optical network intelligence [75]. SOON’s architecture consists of a data layer, a model layer and a policy layer. Each network element, known as a self-optimizing network element (SNE), communicates with the model layer through a management and data interface (MDI).
In parallel with SDN developments, the network functions virtualization (NFV) concept that leverages IT virtualization technologies to virtualize entire classes of network functionalities into building blocks that may connect, or “chain”, together to create and deliver end-to-end communication services, came along. In this context, virtual network functions (VNFs) are chained together, instead of physical network functions (PNFs). Through replacing PNFs with VNFs, networks may be greatly softwarized by running VNFs as program entities on commercial off-the-shelf (COTS) servers (virtual machines; VMs). This “network functionality cloudification” eliminates the need for costly application-specific hardware, which is difficult to manage, leads to “vendor lock-in” situations and is highly rigid/centralized. VNFs, can be deployed almost anywhere in the network, and an operator can negotiate a favorable pricing strategy with the VNF provider, giving the opportunity to build and exploit VNF instances whenever they are needed. VNFs can be generated in data centers, at the network’s edge (e.g., in central offices), or at the network core as middle boxes.

4.2.2. Machine Learning

Machine Learning can aid in fully exploiting all physical layers and resource allocation innovative technologies, which will bear fruit in emerging solutions and services, as they can fine-tune the system performance and calculate metrics employed to increase the smartness (toward intelligence) of the end-to-end system on a network-layer basis [76,77]. In addition, ML can aid in improving the overall accuracy of performance estimations.
More specifically, the ML-based quality of transmission (QoT) estimation problem has received a lot of attention in the recent literature [78,79,80]. Its aim is to aid in ensuring adequate QoT for all network services during their whole service life cycle. Moreover, ML methods can be used in combination with analytical expressions in order to increase the accuracy in cases where analytical expressions are inaccurate, e.g., when the accumulated dispersion is low and the Gaussian noise assumption for the fiber nonlinearity is erroneous [80]. As a consequence, the higher accuracy can directly lead to decreased operational margins, as analyzed in the previous section in the context of IA-RWA, which are set to “compensate” the modeling errors of theoretical methods. This can allow the system to operate at higher modulation formats and/or line-rates, increasing the overall network capacity potential. Finally, ML algorithms can be trained with real data in order to estimate the impact of various PLIs in cases when either there are no known analytical expressions or they are too complex, or even when component dependent sources of performance degradation are present, e.g., due to ageing of components, which cannot be easily incorporated into an analytical formalism.
Further, in the works of [78,79], centralized and distributed ML-based QoT estimation systems have been investigated with the aim of discovering QoT estimation models that are fine-tuned to the complex QoT specifications of each optical network slice. In particular, an SDN-based hybrid architecture comprised of a centralized controller as well as of multiple distributed controllers has been studied. A multiclass classifier is trained at the central controller of the centralized QoT system considering global network knowledge (i.e., according to all QoT requirements).
Further, a collection of binary classifiers is trained in parallel and separately within a system of distributed controllers in the distributed QoT context. Each distributed controller stores information that is only applicable to its own slice sort, which is generated by links that meet the same QoT specifications. As a consequence, each distributed model learns to meet a different QoT requirement. According to results, the distributed approach outperforms the centralized one in modeling accuracy, accuracy per class and training time, particularly as the number of slice types increases.
Further issues of interest and upcoming research concerning the ML-based QoT include:
  • The mathematical formulation of the proposed ML-based QoT estimation methods in order to tailor them to each specific problem.
  • The training of both the centralized and distributed QoT models on new datasets with more trends, while still considering various network loads.
  • The training of both the clustered and distributed QoT models using neural network (NN) topologies with varying numbers of hidden layers and units. Since the unified structure is built on a multiclass classification problem, which is generally more difficult to solve than its binary decompositions (distributed QoT problem), the analysis needs to be conducted on a broader NN topology.
  • The comparison of models and frameworks not only in terms of accuracy and CPU usage, but also in terms of utilization of other resources, e.g., memory utilization, routing and spectrum allocation (RSA).
  • The creation of dynamic multi-slice QoT-aware RSA heuristics that integrate various QoT models from both centralized and distributed systems.
  • The comparative evaluation of network efficiency when multi-slice QoT-aware RSA approach is used versus the traditional single-slice QoT-aware RSA approach.

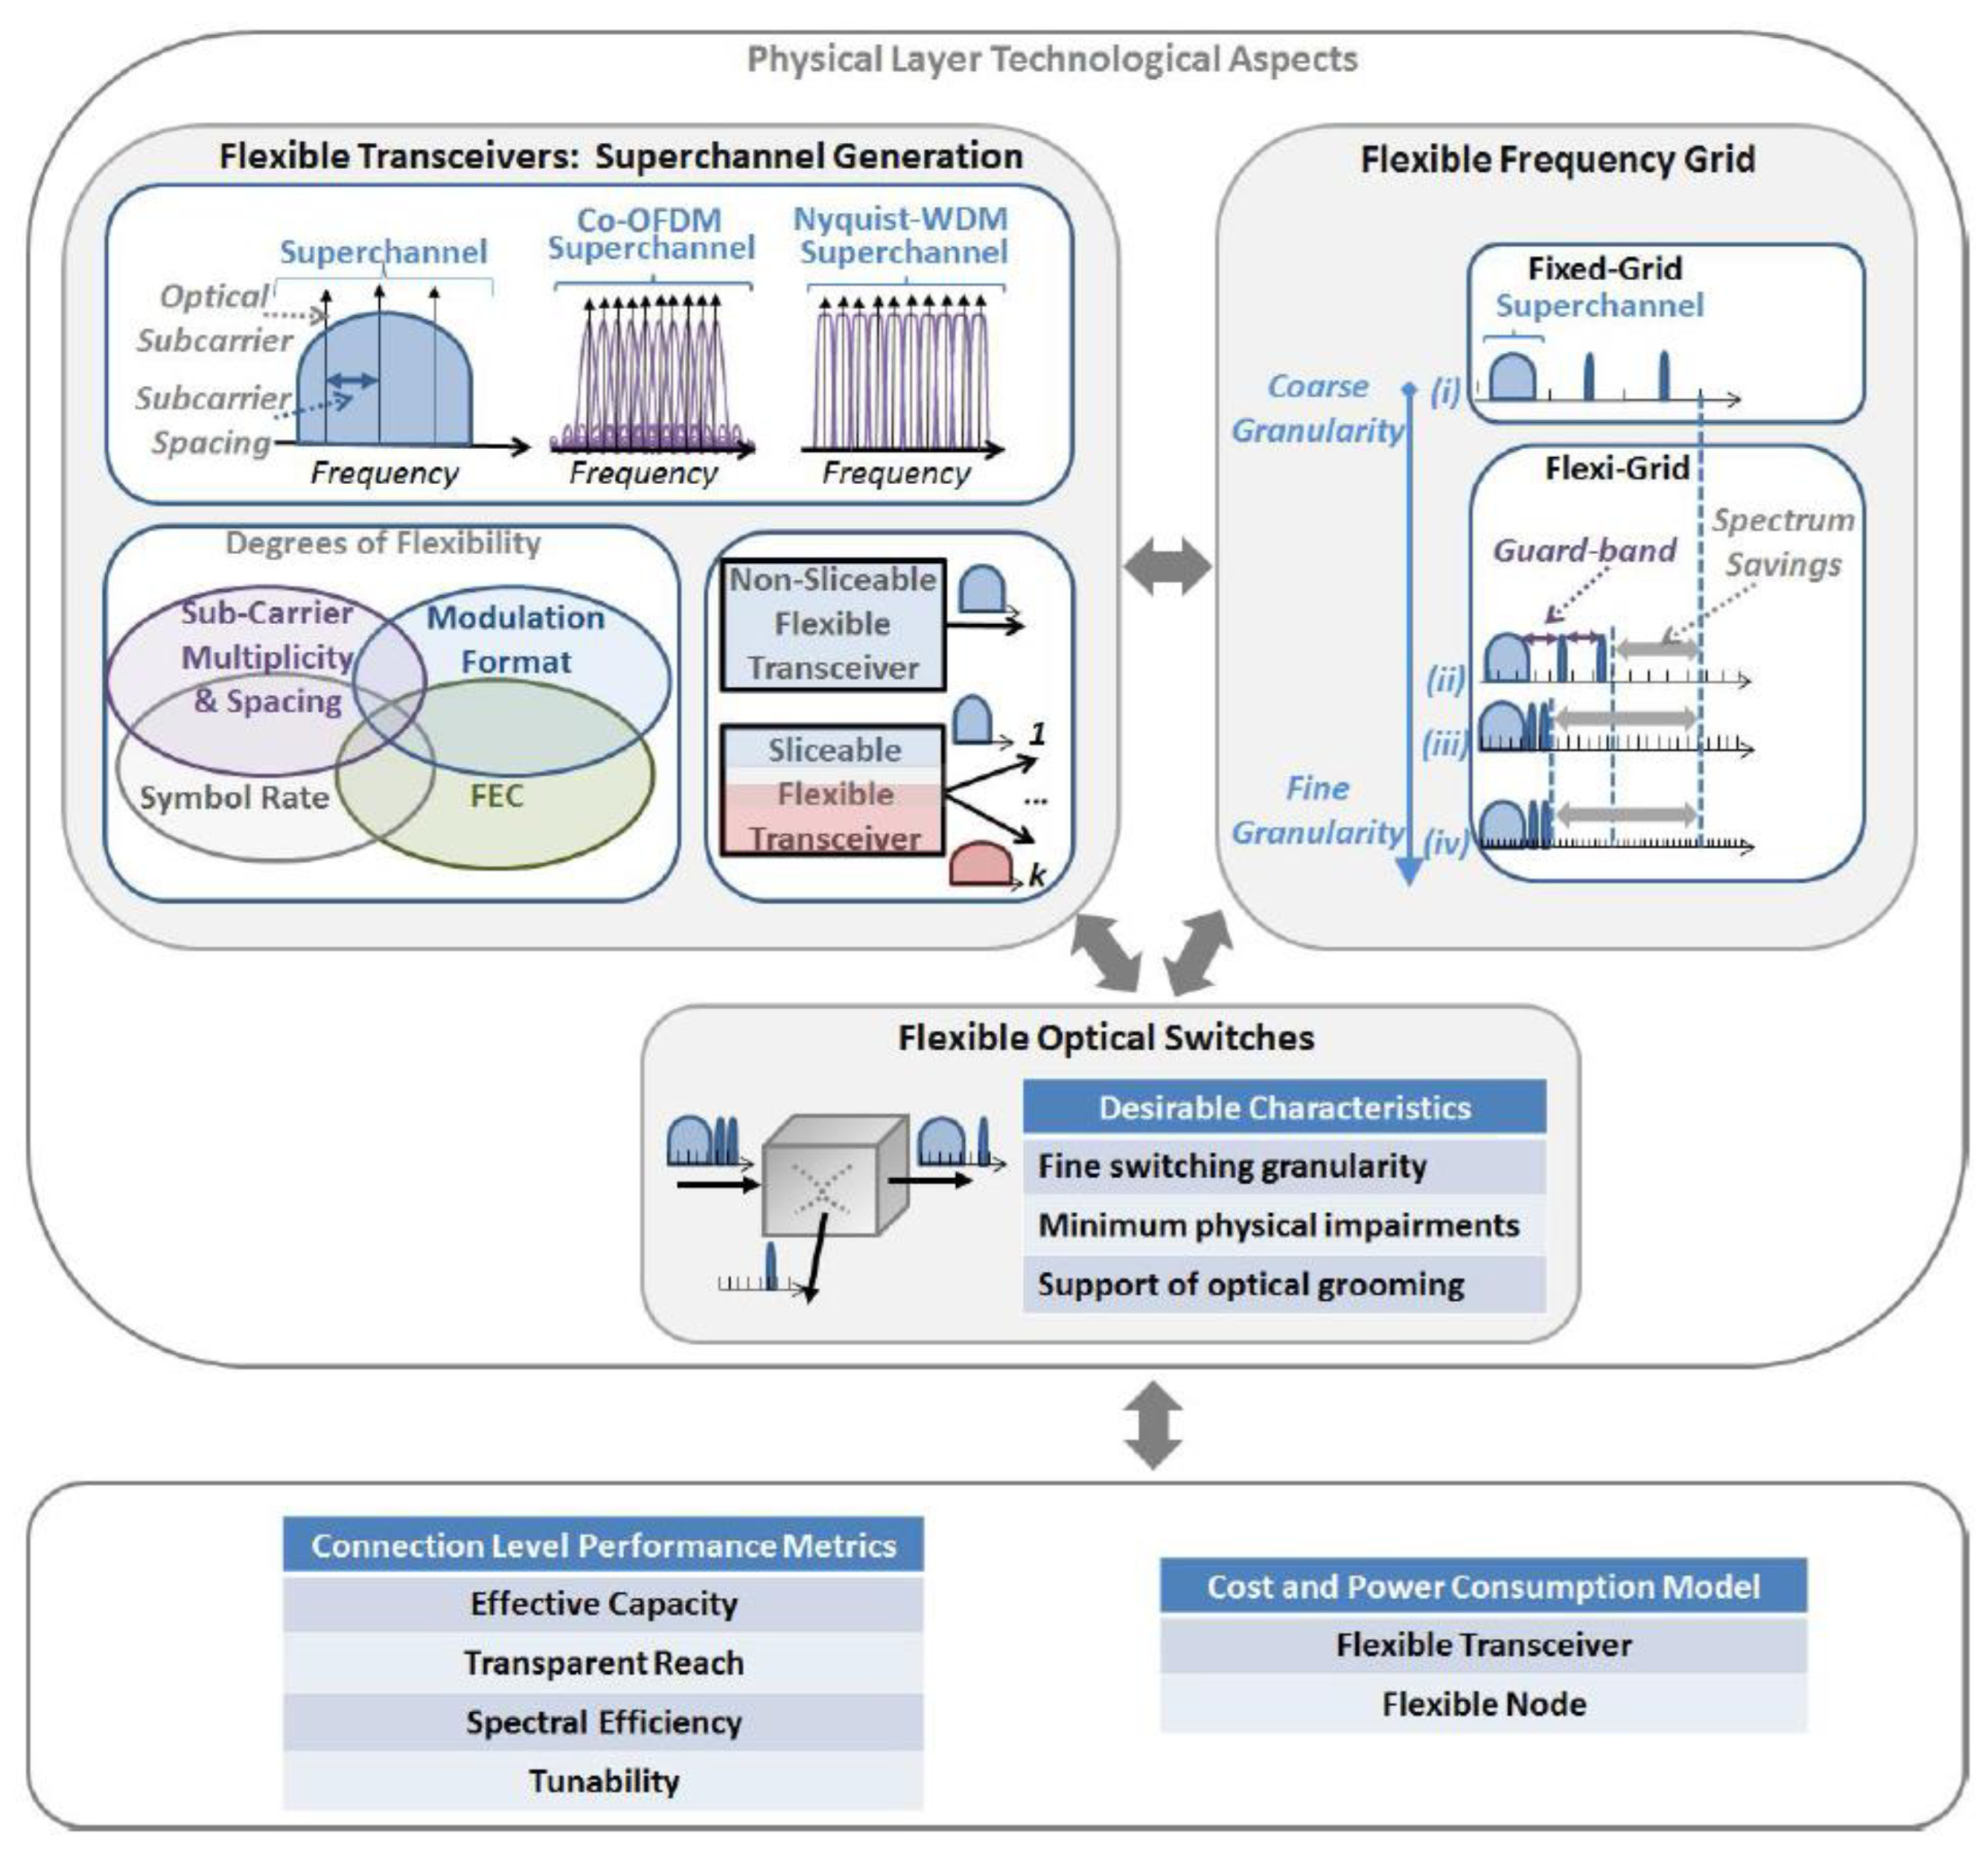
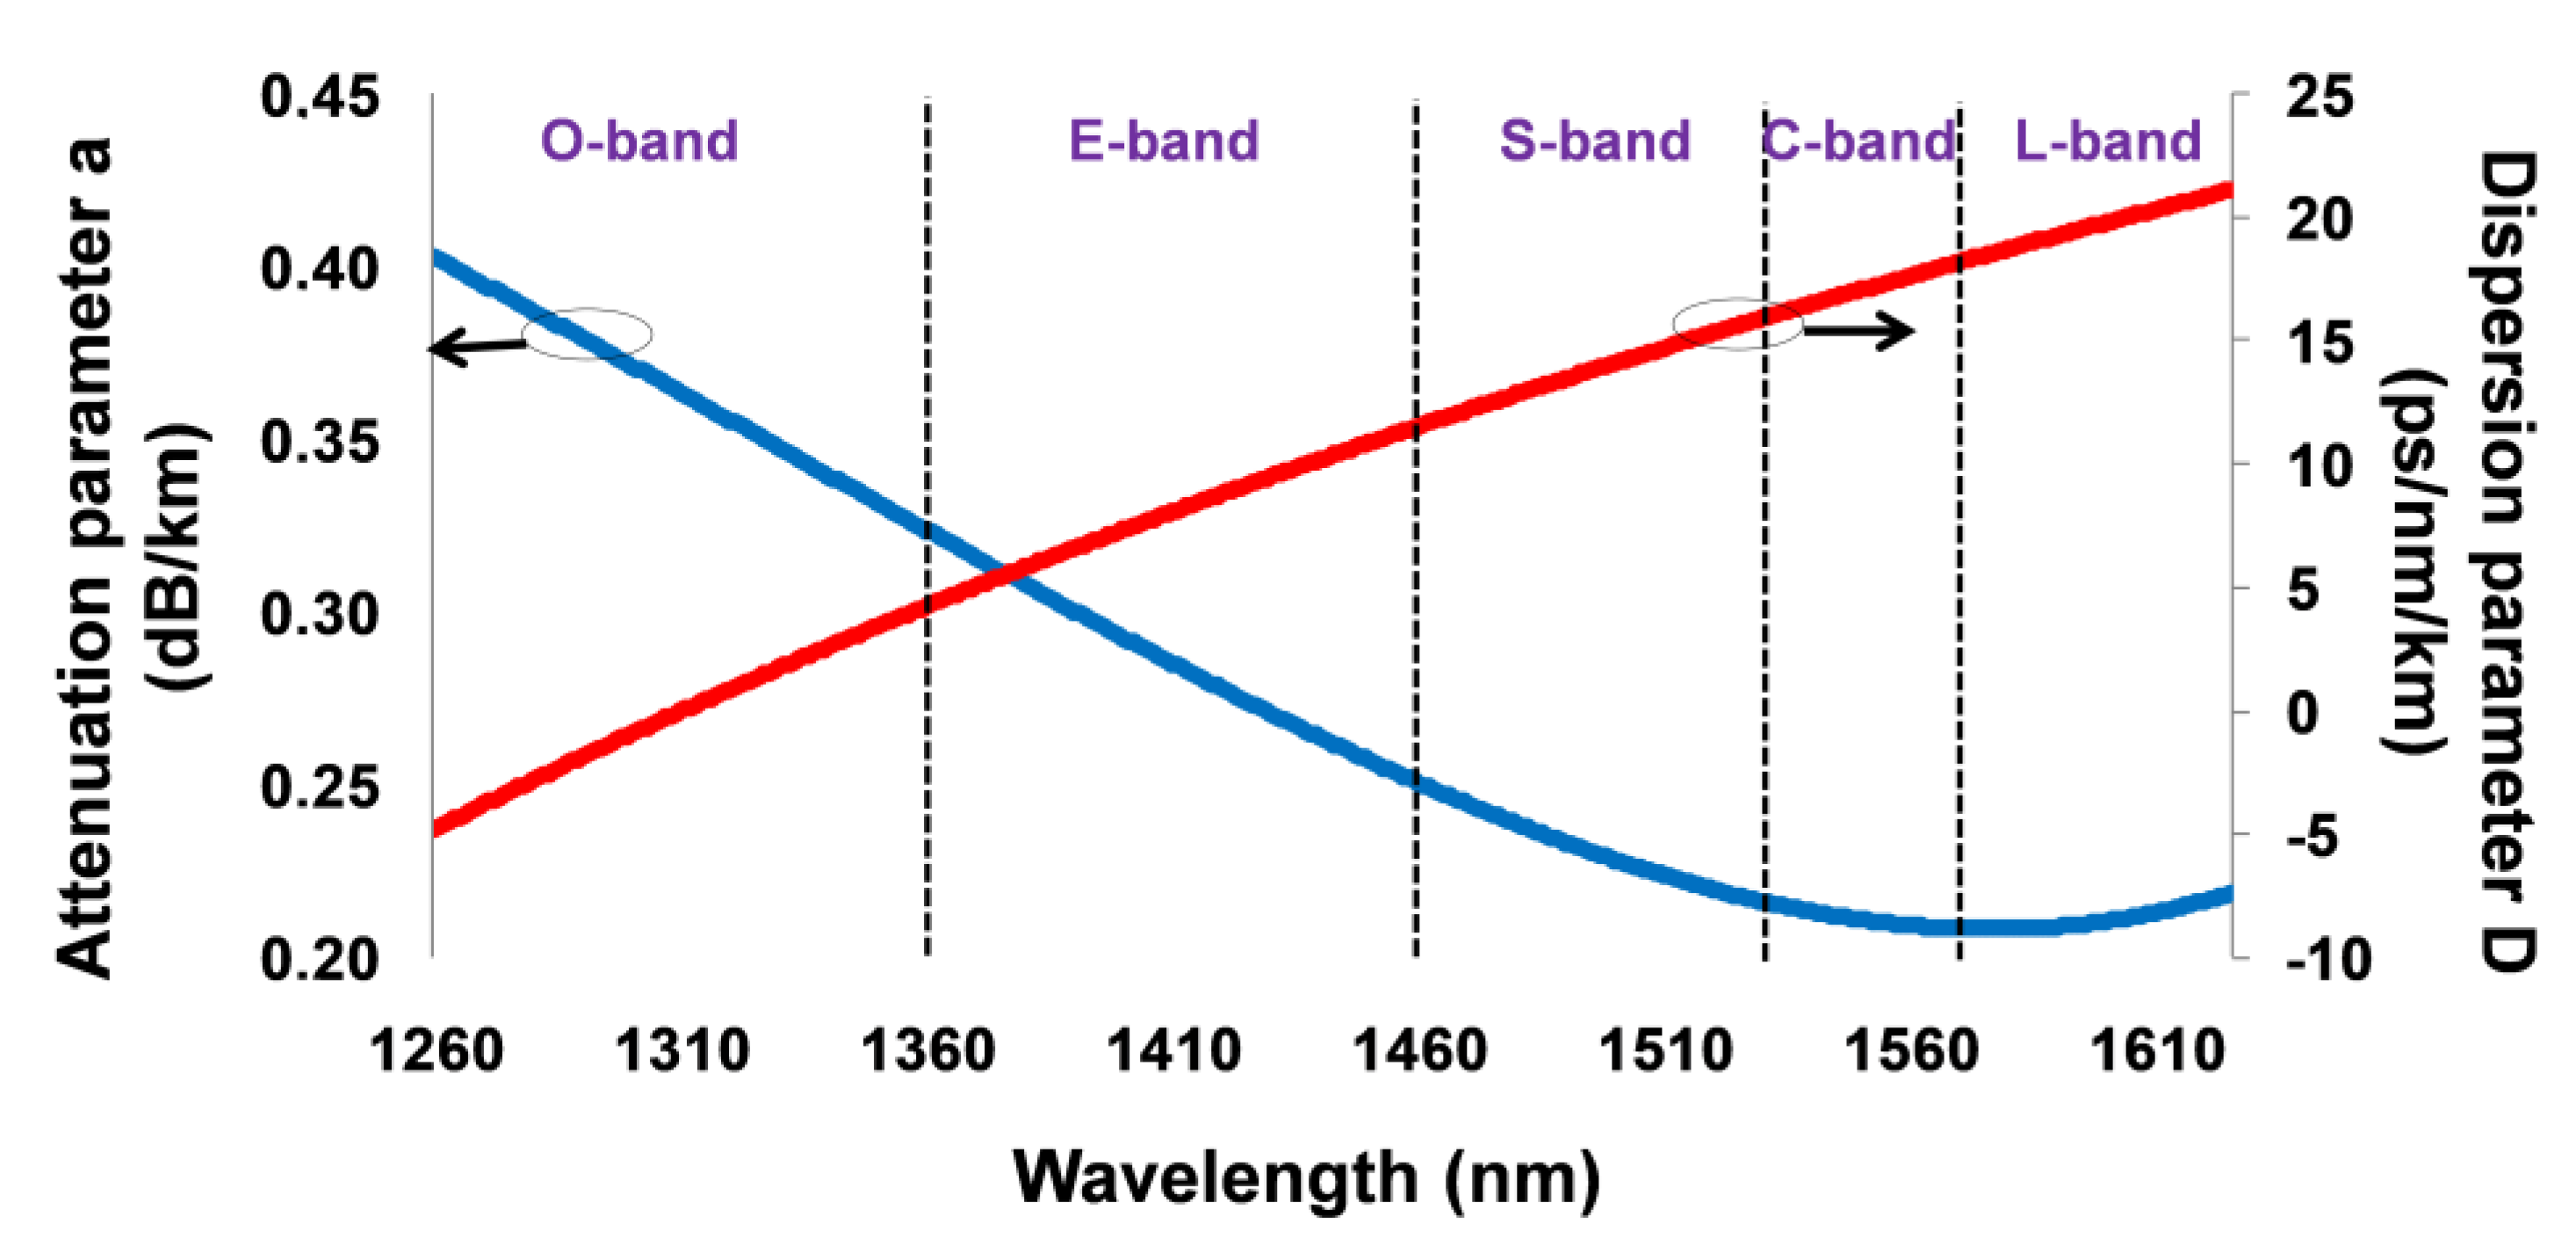
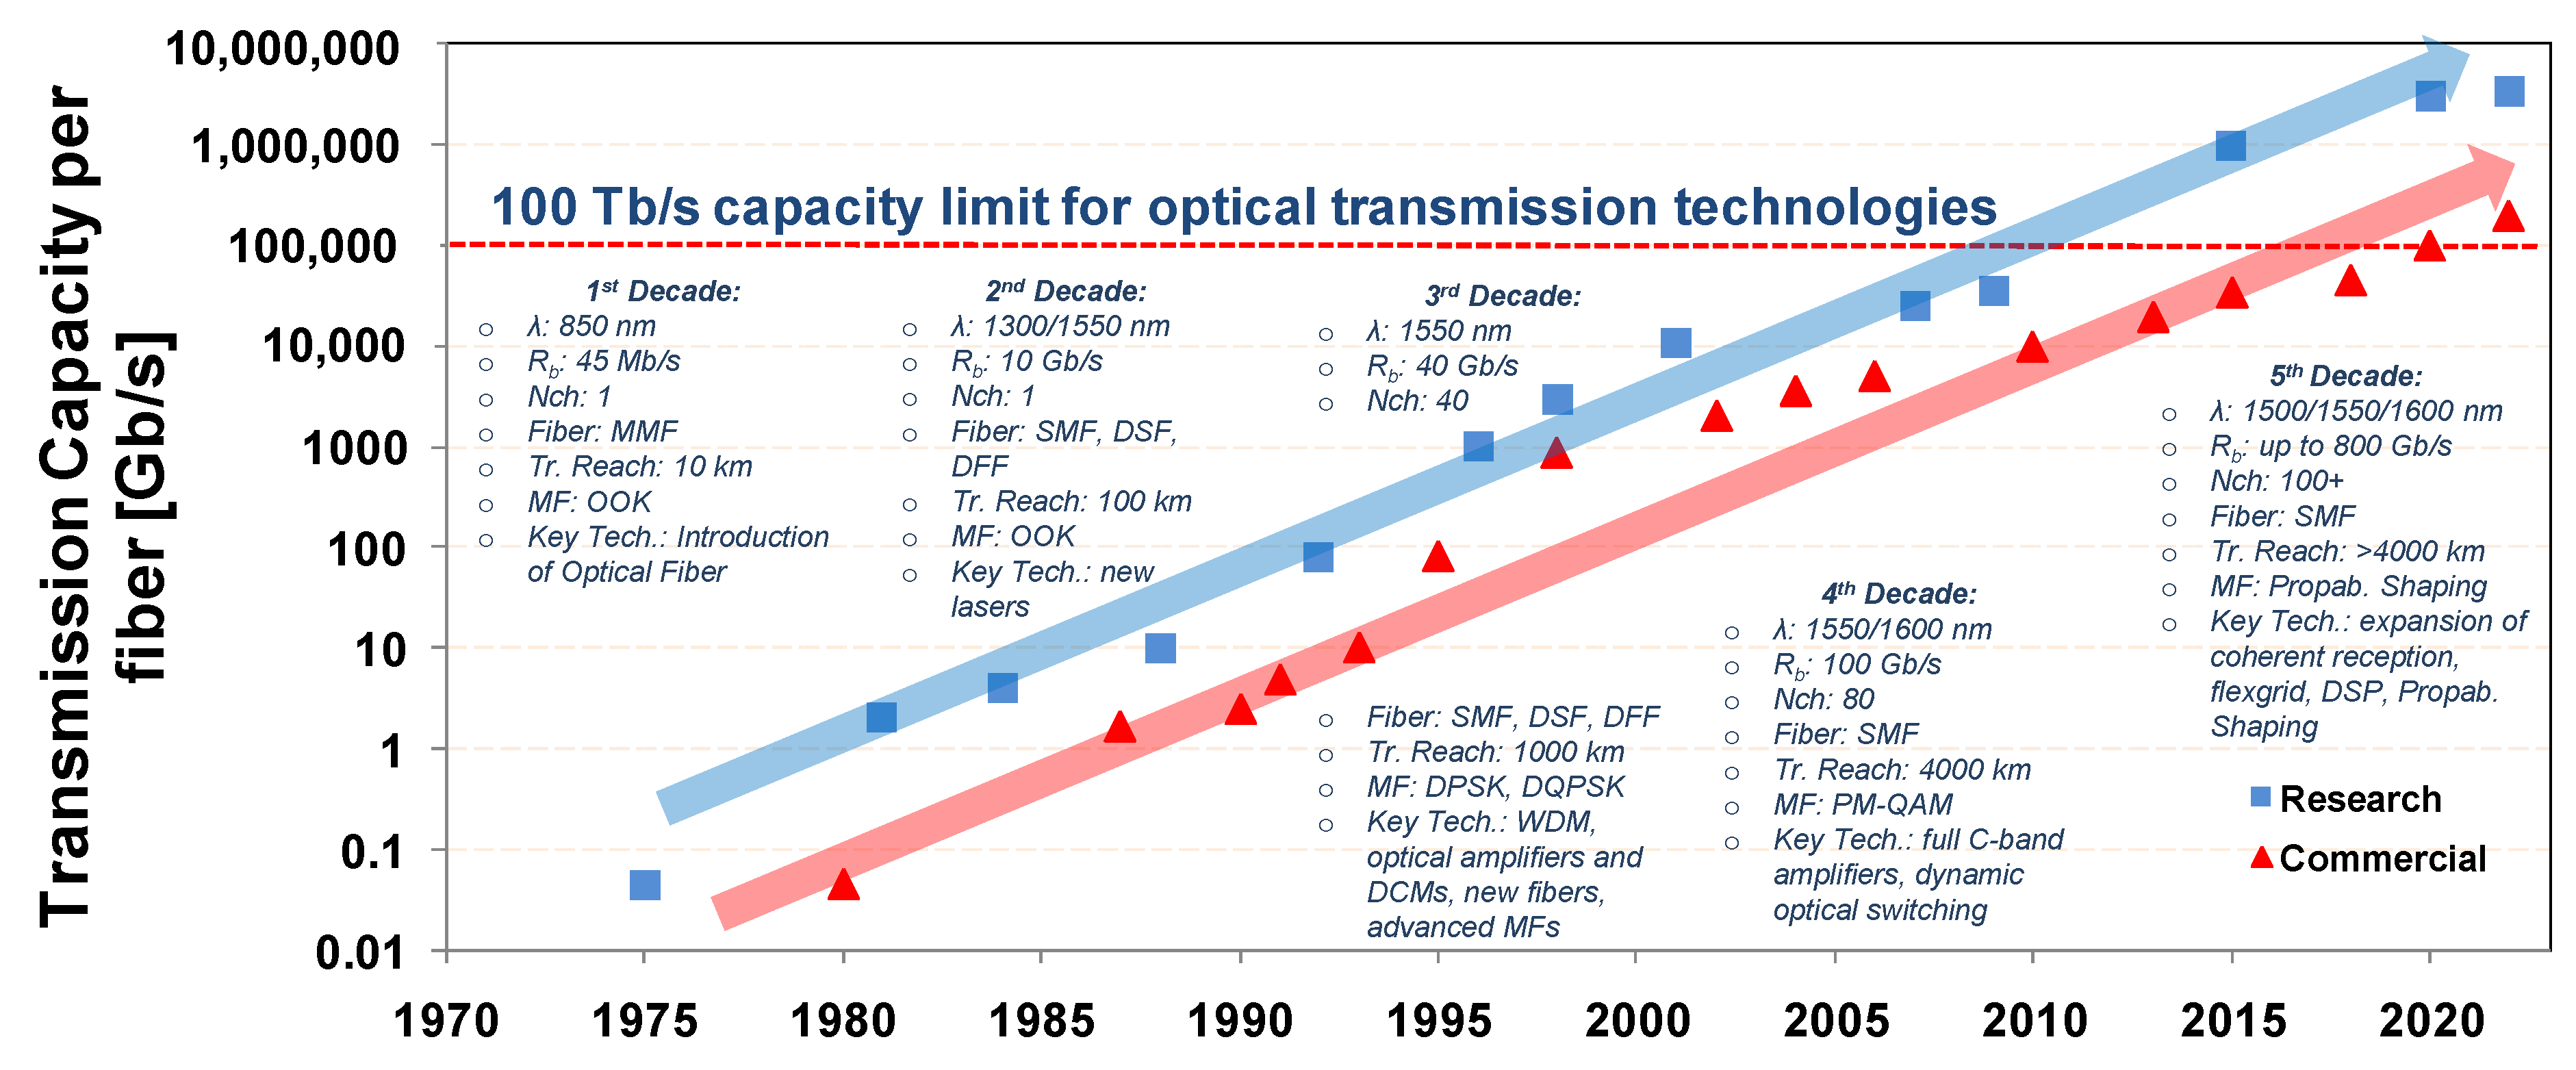
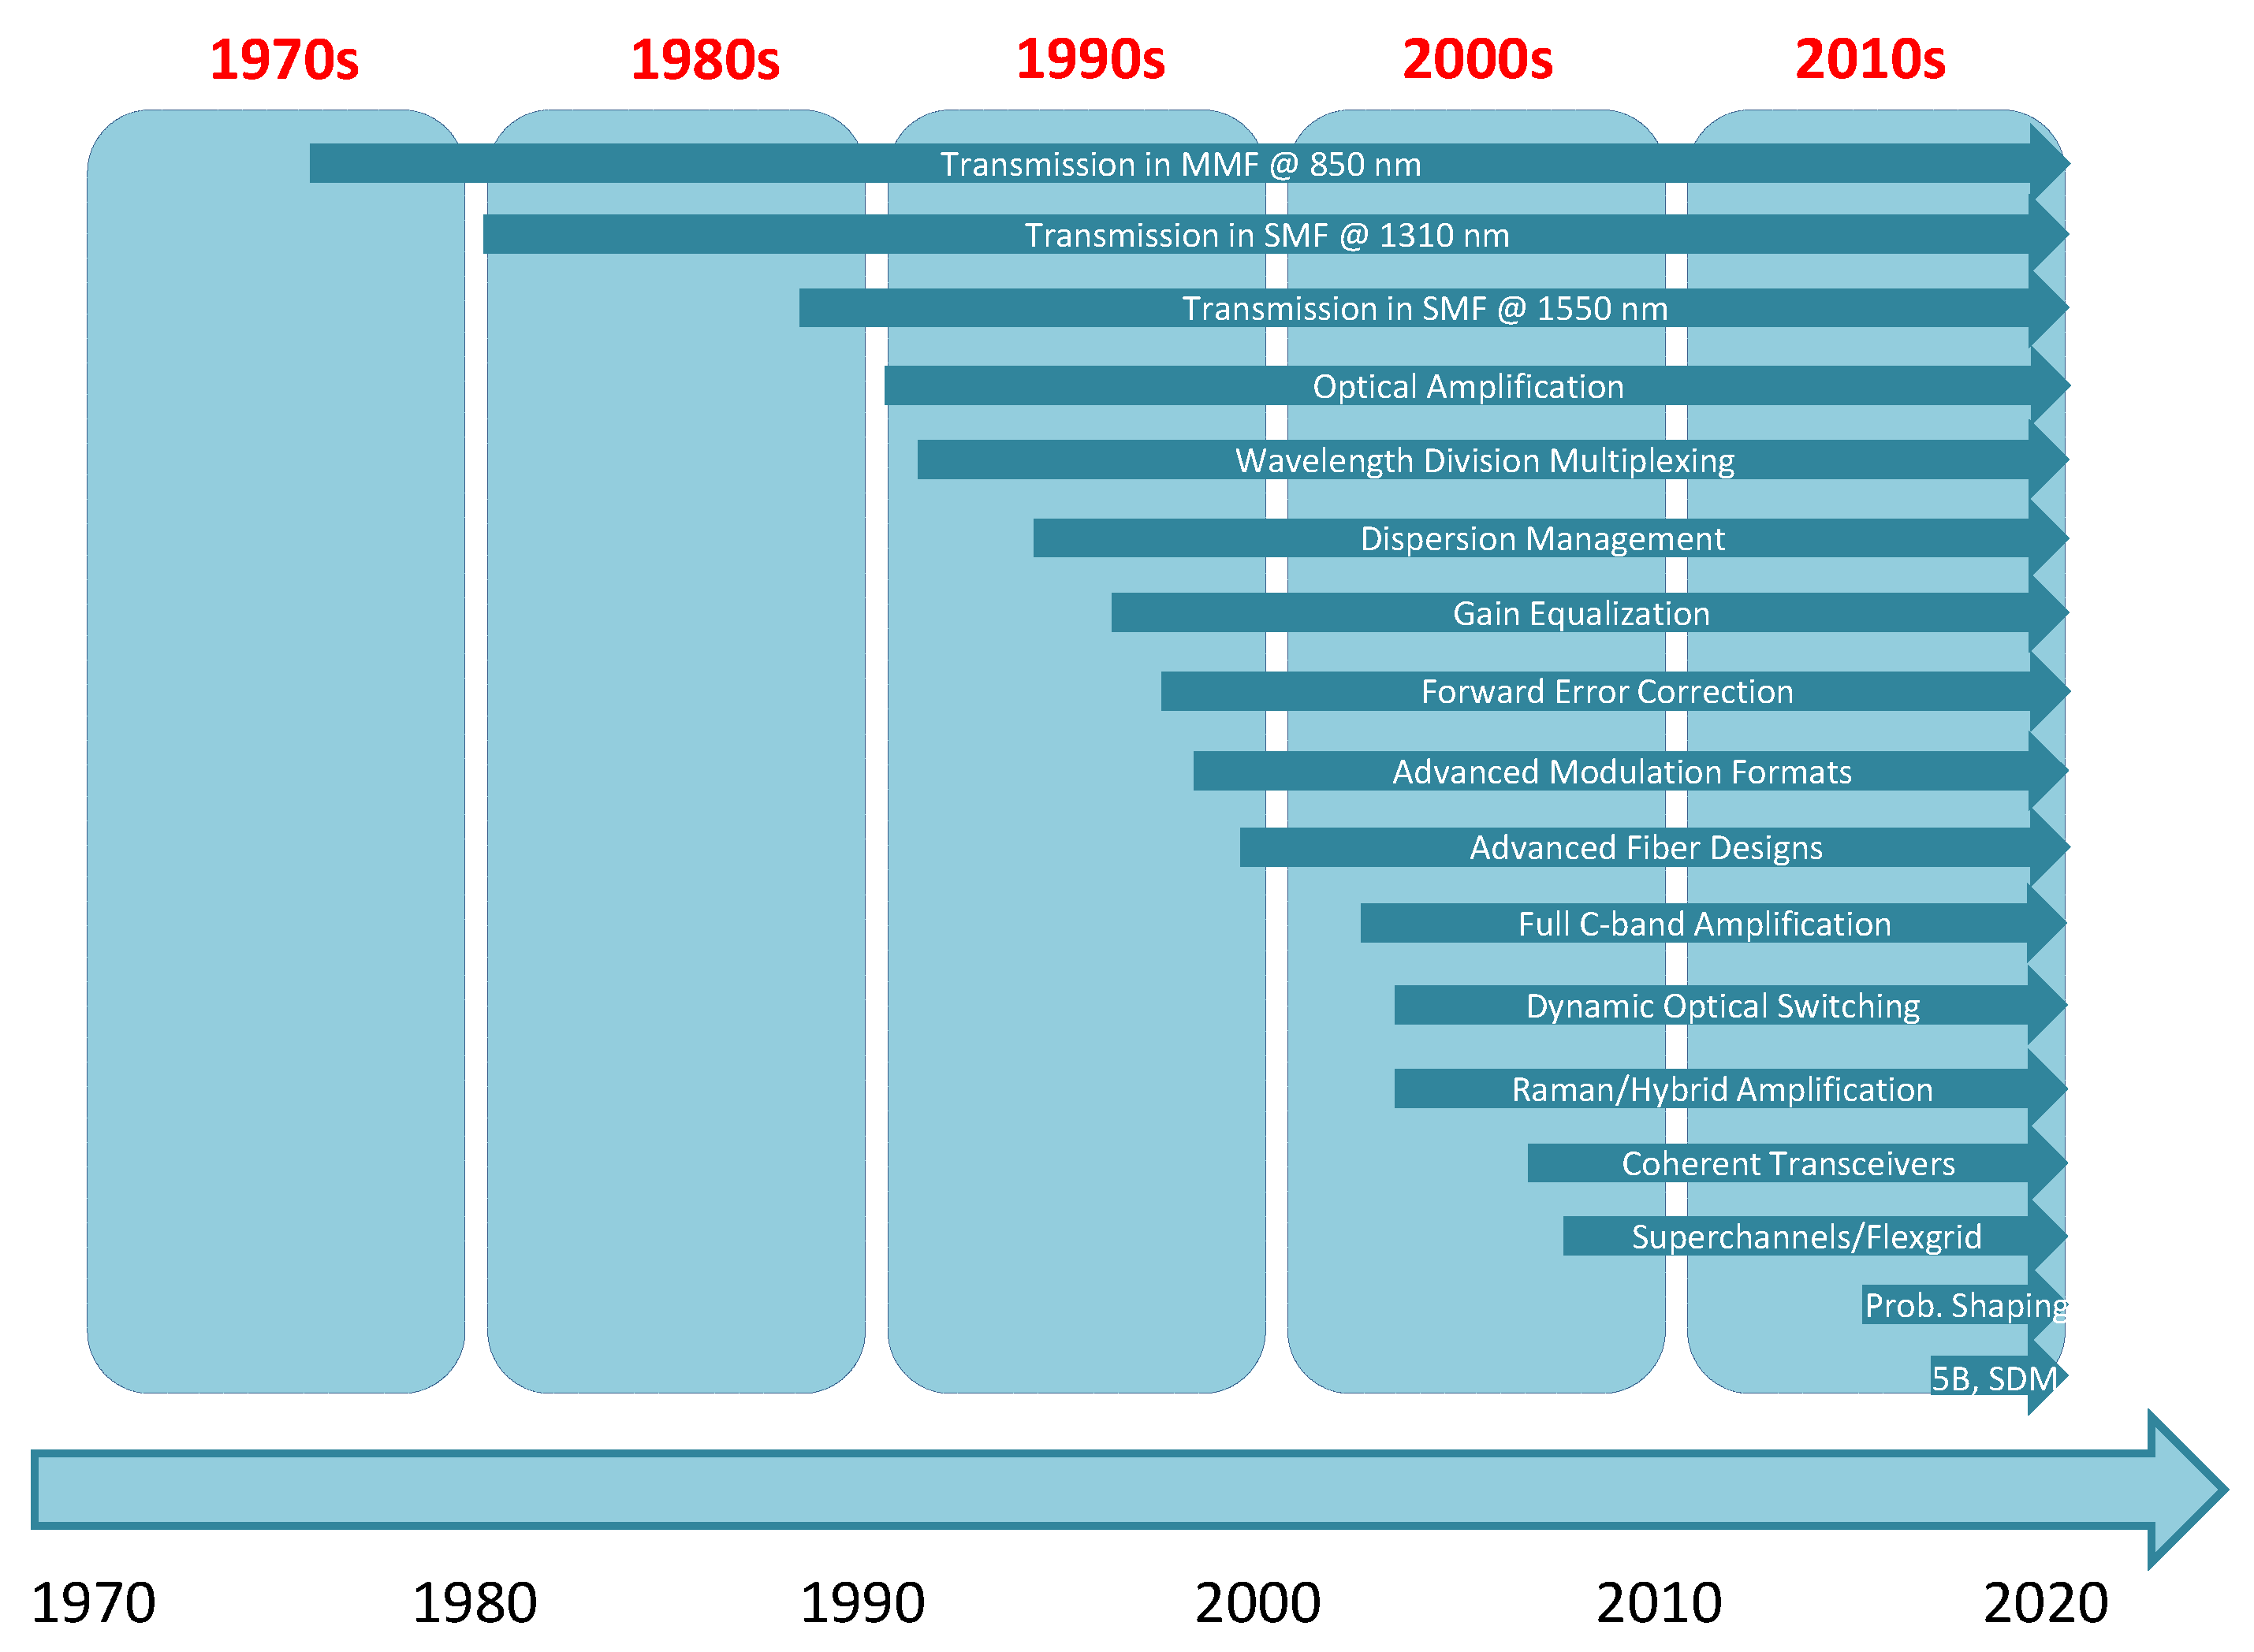
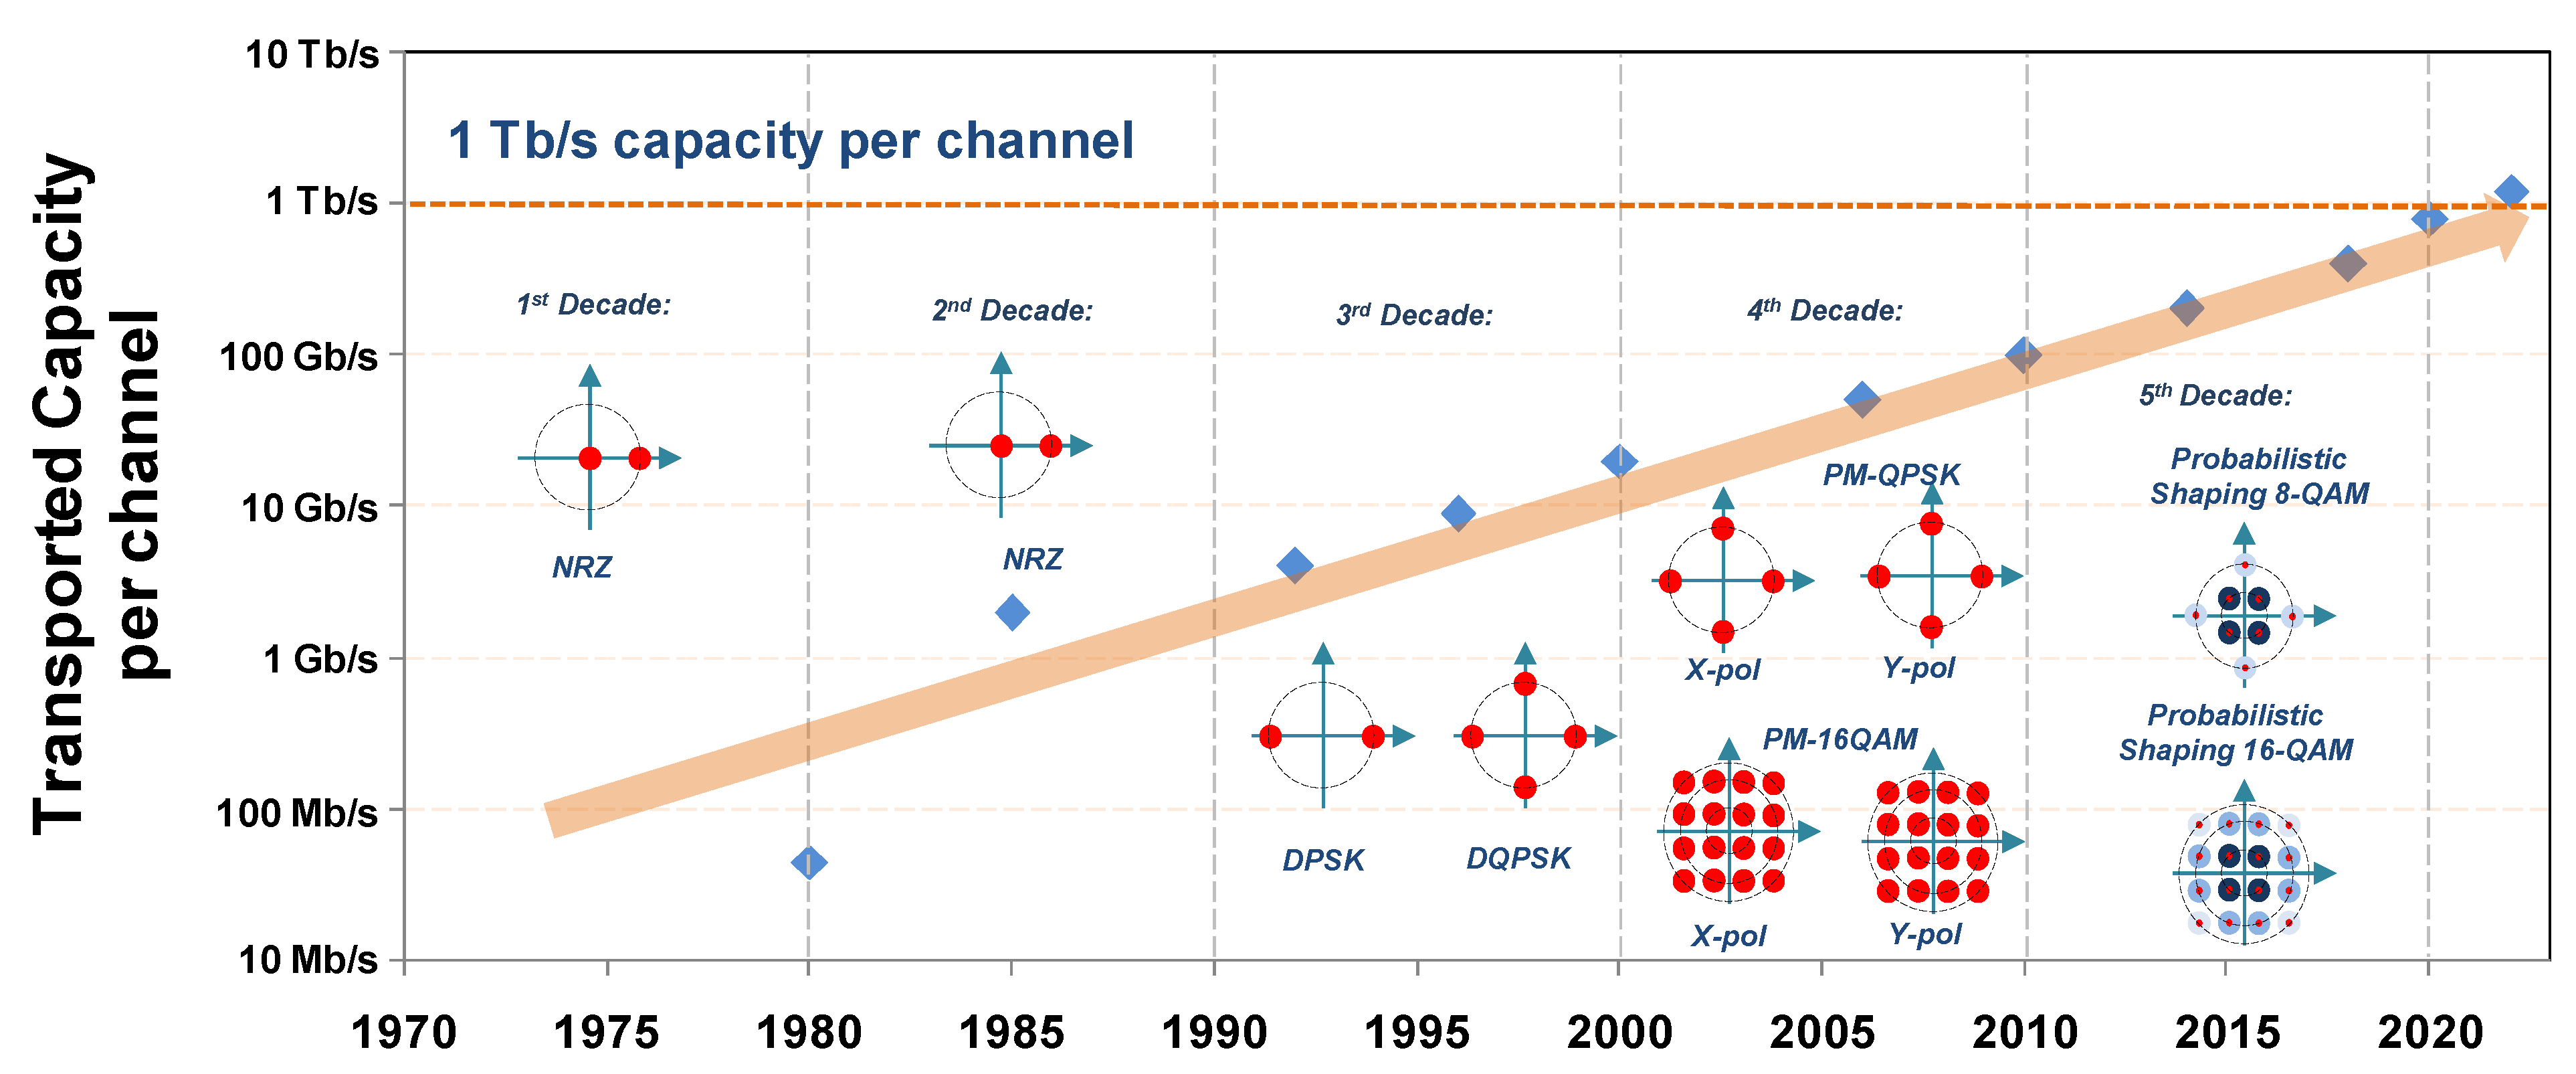
5. Physical Layer: Five Decades of Evolution (from 45 Mb/s to 100+ Tb/s)

5.1. Two Key Factors of Evolution

The main objective of optical transmission is to maximize the capacity (B) times transparent length (L) product. These are the two main factors which mark the passage from a technological era to the next one.
For this purpose, the overall capacity transmitted within a single optical fiber can be increased in three ways: (a) employing a higher number of channels, (b) increasing the line rate per channel, and (c) packing the channels more densely. The first option requires the existence of lasers and amplifiers that can emit and amplify light, respectively, in a number of different wavelengths. The second option requires the use of higher modulation formats that can increase the spectral efficiency or the number of transmitted bits per one symbol and per one Hz. This designates a migration from OOK modulation schemes towards more advanced modulation formats such as differential phase shift keying (DPSK), differential quadrature phase-shift keying (DQPSK), etc., to even polarization multiplexed (PM)-MQAM and probabilistic shaping. During this migration, the cost of the employed transceivers has to be quantified and contrasted with the potential gains on the line rate, as the increase on modulation format comes with an increased cost and system complexity both in the transmitting part, e.g., due to the use of additional MZMs, and in the receiving end, e.g., due to the use of additional components such as PINs, LOs, optical hybrids, etc. The technology that will prevail is based mainly on the metric cost/power consumption per bit that needs to be minimized. Toward this target, oDAC-based transceivers such as those presented in Section 4.1.10 are a very cost-effective option. The third solution allows us to exploit the available spectrum more “wisely”. In particular, it manifests a migration from, e.g., NRZ, which has a sinc-shaped spectrum, towards more spectrum-wise formats, such as coherent-OFDM or Nyquist-WDM. In the latter cases, an almost rectangular-shaped spectrum can be transmitted, allowing, in the ideal case, the channel bandwidth to equal channel spacing and, in this way, increasing the number of transmitted channels.
The second critical factor that can accelerate the network evolution is the transparent length. In order to increase its value, we have to concurrently combat the main physical layer effects, which are fiber attenuation, fiber dispersion, fiber nonlinearity and amplified spontaneous emission (ASE) noise. Fiber attenuation may induce a severe power depletion, which can impact the system’s performance. The overall loss can be mitigated by using optical amplifiers periodically within the link. Next, fiber dispersion leads to a pulse broadening, which, in turn, causes inter-symbol interference (ISI), resulting in unacceptable BER values. The impact of fiber dispersion can be counterbalanced (a) partially, e.g., by using transmission fibers with low local dispersion, such as dispersion shifted fiber (DSF) and dispersion flattened fiber (DFF), or (b) fully, e.g., by using DCMs periodically within the link or employing electronic dispersion compensation by means of DSP modules. Further, fiber nonlinearity and ASE noise are considered antagonistic effects, as in low transmitted power, the ASE noise dominates over fiber nonlinearity whilst in increased optical power, the nonlinearity dominates over the ASE noise. As a consequence, a quest for finding the optical power that maximizes the overall transmission performance is usually a system-vital procedure. A well-known method for finding the optimum power within an optical network can be found in [81].
To better understand the impact of fiber parameters on physical layer performance, Figure 28 illustrates the attenuation and dispersion parameters for the low loss frequencies of a G.652D fiber (α < 0.4 dB/km). As it is evident, the fiber spectrum is segregated into five nominal amplification bands: original (O)-band, extended (E)-band, small (S)-band, conventional (C)-band and long (L)-band. According to Figure 28, the impact of fiber attenuation decreases as the transmitted wavelength increases, attaining a minimum around C-band. This is the main reason that modern optical systems work mainly in C-band, since the number of optical amplification elements can be minimized. Next, we can observe that the dispersion parameter is proportional to the transmitted wavelength, showing a value of zero around 1300 nm. This was an attractive feature for early fiber-optic systems that emitted light in the O-band, overcoming, in this way, the impact of dispersion. In currently deployed systems, the O-band is still exploited for optical access networks, where dispersion compensation modules can be saved in order to reduce the overall network costs.

5.2. Five Decades of Physical Layer Evolution in Backbone

5.2.1. Methodology

The evolution of fixed network generations is service driven, as it is analyzed in the introduction. In particular, it was shown in Figure 1 that the first generation ends at about 2000, whilst the next four generations extend over to 2025. This categorization highlights a significant acceleration after 2000 due to the wide adoption of Internet services, such as video, gaming, etc. However, from the physical layer perspective, noticeable advances can be found in all five decades. For this purpose, we segregate the physical layer evolution in five discrete time intervals (decades), beginning in the 1970s with the first fiber-optic transmission system and ending in 2020 with the 100 Tb/s capacity limitation of current systems. The key evolutionary steps of each time interval are presented using a dialectical procedure; that is, each interval solves the main limitations of its previous one, allowing us to overcome the burdens set on attainable capacity and transparent reach. Moreover, the key advances in each generation are discussed in order to further understand why and how each technological achievement prevailed. A unified overview of the evolution of transported capacity within a single mode fiber for research and commercial systems is illustrated in Figure 29. The most important operational parameters for each decade are also pointed out. We can observe from Figure 29 that research technology is about 8 years ahead of commercially available systems, as it is also shown in [82,83,84]. It is also worth mentioning that the transported capacity has been increased by about 6 orders of magnitude over the past 40 years, which roughly means a doubling every two years. The main driving forces behind this evolution are first the need to increase the channel line rate, mainly due to the advances on modulation format, and second the introduction of WDM, which allowed to transmit multiple channels within a single fiber. A summary of the main technological advances in optical transmission that upscaled the B x L product is shown in Figure 30. In this figure, a degree of arbitrariness on the presented dates is considered as the time between the introduction of each technology and its wide adoption may vary greatly.
Figure 31 describes pictorially the evolution of the commercial line rates for a single channel, starting at 45 Mb/s for the first systems and ending with up to 800 Gb/s for state-of-the-art systems. We can observe that the line rate per channel shows an increase of about four orders of magnitude over the past 40 years, which implies an increase of about 20–25% per year. In the next paragraphs, we detail the main achievements of each decade.

5.2.2. Main Achievements per Generation

First Decade (1970–1980)
The birth of fiber-optic communications is a direct result of the third Industrial Revolution. Fiber communications began officially with the advent of the first laser, which enabled light transmission within the optical fiber over km distances. The first commercial systems became available around 1980, after experimental trials that took place around 1977–1979. These systems were characterized by limited bit rates of about 45 Mb/s and a limited reach of up to 10 km, while they exploited the first transmission window and deployed multimode fiber (MMF) as a transmission medium. Compared with modern communications, the attainable bit rate of the first systems seems incredibly small; however, it opened new horizons in telecommunications, as it expanded the B times L product by about 2–3 orders of magnitude compared with co-axial cables, allowing to transport 700 telephone calls simultaneously within a single telecommunication channel.
Second Decade (1980–1990)
During the 1980s, new lasers were proposed in order to exploit the second and third transmission window whilst SMF was selected over MMF. In this way, the transmission reach could be extended to 100 km, as the impact of SMF’s dispersion was significantly smaller than the impact of MMFs. In particular, the local dispersion parameter of a standard SMF yields around zero in 1300 nm and about 17 ps/nm/km around 1550 nm, making the impact of dispersion insignificant for distances smaller than 100 km for bit rates up to 2.5 Gb/s. With the new developments on electronics, the bit rate was also able to reach 10 Gb/s, making the dispersion an important constraint for the third transmission window. A solution to this problem was the introduction of new fibers, which had appreciably lower local dispersion parameter compared with standard SMF. These fibers were the dispersion flattened fiber and dispersion shifted fiber, which allowed the light propagation to exceed 100 km with sufficient performance.
Third Decade (1990–2000)
The third decade was clearly the era of optical amplification and WDM. WDM allowed for the simultaneous transmission of multiple optical channels within a single optical fiber, allowing to outreach 1 Tb/s. At the same time, advanced modulation formats were proposed that could attain greater spectral efficiency compared to NRZ, most notably DPSK and DQPSK, which could achieve data rates of 40 Gb/s per channel. Moreover, the use of optical amplifiers gave us the opportunity to overcome the attenuation problem effectively. At the same time, the introduction of dispersion compensation mechanisms, such as dispersion compensation fiber (DCF), allowed for the surmounting of the problem of dispersion. As a result, the transparent length could outdistance 1000 km, which is a tenfold increase compared with the previous decade and 100 km.
Fourth Decade (2000–2010)
The fourth decade was the decade of dynamic optical switching, the introduction of coherent communications and full C and L-band amplification. Dynamic optical switches allowed incoming traffic to be forwarded to the proper output links in a dynamic way, bypassing the need for opto-electronic conversion. This all-optical method led to significant cost savings and, at the same time, to a significant decrease in the overall end-to-end delay, allowing the underpinning of time sensitive services. On the other hand, coherent communications allowed for the concurrent exploitation of the amplitude and the phase of the optical carrier through the use of multi-level modulation formats, such as QPSK, 16QAM, etc., in this way exceeding line rates of 100 Gb/s. In addition, coherent receivers eased the use of DSP modules, and now the dispersion problem could be solved more efficiently compared with DCFs, which inevitably allowed an amount of residual dispersion. Finally, the use of full-band optical amplifiers, such as EDFAs, gave the opportunity to concurrently restore the power of multiple channels, allowing not only to decrease the overall cost per bit but also to attain a transported capacity of up to 10 Tb/s, which could be transmitted transparently beyond 4000 km.
Fifth Decade (2010–2020)
The fifth decade further expanded the usability of DSP components, introducing algorithms that were able to counterbalance, even partially, the impact of various performance constraints, such as dispersion, polarization mode dispersion, nonlinearity, etc. At the same time, the flexible spectrum exploitation significantly increased the spectral efficiency compared with the 50 GHz fixed grid. In addition, the probabilistic shaping was designated as another key advance of this decade, which could attain higher performance compared with PM-QAM equivalents. Finally, the advances on optical amplifiers, allowed to exploit multiple amplification bands such as O, S, C and L and to transmit more than 100 channels within a single fiber, achieving an overall rate of up to 100 Tb/s, which is marked as the capacity limit for modern commercially available fiber-optic communication systems. The limitations and key advances for the five decades are summarized in Table 10.

5.3. Physical Layer Evolution in Access

The physical layer requirements for the access part of the network are relaxed compared with the backbone due to the limited distance. The fiber attenuation and dispersion are insignificant constraints here, as the distance of the access domain is typically smaller than 10 km. The key target of access is to increase the offered bit rate in order to support the ever-increasing bandwidth hungry services. For this purpose, various architectural designs can be projected, as shown in Figure 32, featuring different physical layer characteristics. For example, TDM-PON has a limited power budget compared with the active optical network (AON) due to the lack of optical amplification. This can limit the attainable number of users due to the lower number of splits. The power budget is a critical metric as it can define the maximum number of users, since after each power split, the number of users can be doubled, but the optical power is depleted by a factor of two at the splitter egress. The power budget can also determine the attainable transparent length. The attainable length and the number of users are antagonistic parameters due to their dependence on the power budget, and as a consequence they cannot be maximized concurrently. In particular, network engineers need to sacrifice reach when the number of users is large, e.g., in dense urban areas, or the number of serviced users, when the network topology is extended, e.g., in rural areas.
The main physical layer parameters for the various PON standards are shown in Table 4. As is evident, the maximum reach has been increased over time, from 10 km from the first standard to 60 km from the XG(S)-PON, in an attempt to support more distant users. The maximum number of users is also increased from 32 (or 5 power splits) to up to 256 (or 8 power splits). This happens due to the increased power budget, which could be achieved with later standards such as XG(S)-PON. The attainable rate has also increased by more than 50 times in less than two decades, from 622 Mb/s with A/BPON to 40 Gb/s with NG-PON2. This is a result of the advances in the transceiver operational parameters, such as modulation format, operational wavelength, etc., as is also shown in Figure 29, Figure 30 and Figure 31. Comparing Table 4 with Figure 29 and Figure 31, we can observe that the attainable bit rate of each PON standard is significantly lower compared with the capability of the corresponding commercially available technology. This is attributed to the fact that state-of-the-art technology, e.g., PM-QPSK, is cost-ineffective for access applications, and as a consequence, direct detection technology is qualified for access.

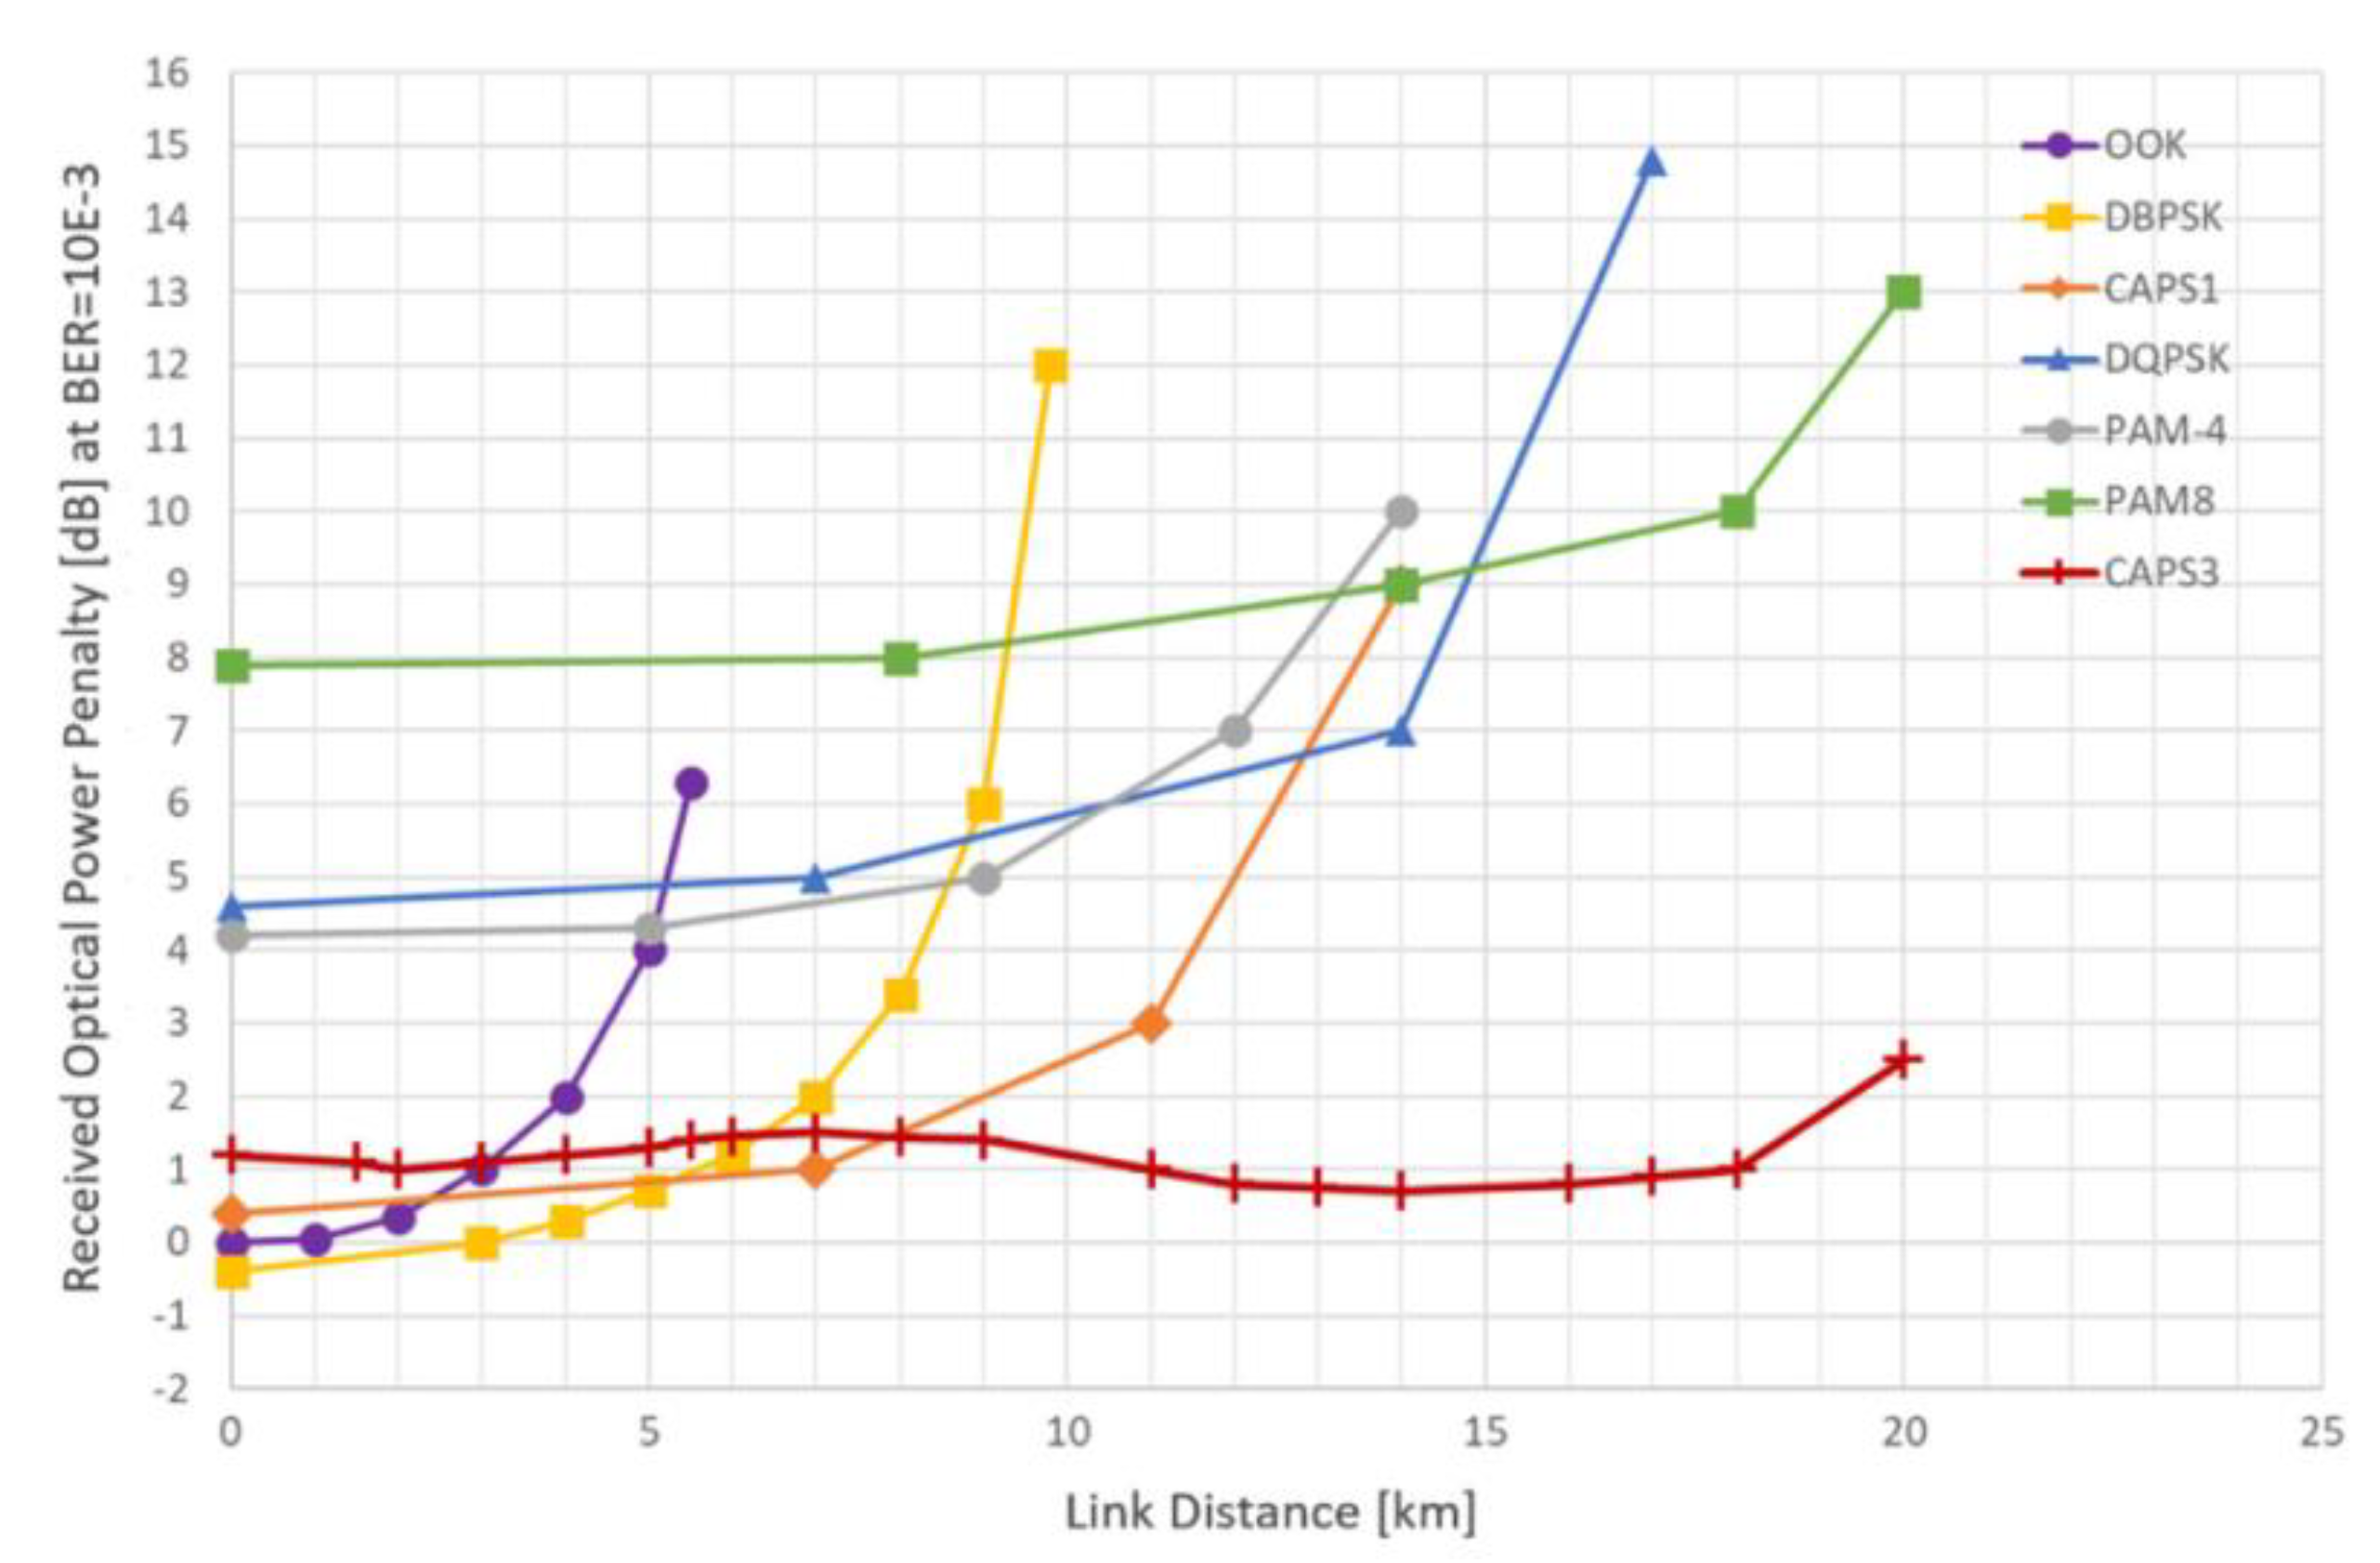
5.3.1. Candidate Modulation Formats for Access

The designation of the most cost-wise modulation format for the access domain is a complex problem. This happens as on one hand, NRZ, which is one of the less costly solutions, has a limited receiver sensitivity for a given bit-rate, and on the other hand, modulation formats such as PAM4, PAM8, electrical Duobinary (EDB) and DQPSK may provide a better receiver sensitivity, allowing for a greater transmission reach and/or number or users, but at a higher cost. Figure 33 illustrates a comparison of the power penalty vs fiber length for various modulation formats [87]. As a reference in order to estimate the power penalty, an OOK back-to-back system is considered. The bit rate is 50 Gb/s and the target BER is set at 10−3 as FEC is employed. The main transmission impairments are fiber attenuation and dispersion. As expected, the power penalty for the OOK increases rapidly after 5 km, being the most physical layer degraded modulation format. Differential binary phase shift keying (DBPSK) performs slightly better than OOK, mainly due to the increased tolerance on dispersion. Next, PAM4 and PAM8 start with an increased power penalty compared with OOK due to the larger number of symbols; however, after 7 km, they outperform OOK. The large power penalty of PAM8 at the beginning of transmission makes this modulation format ineffective for practical links. Further, DQPSK shows a small increase in performance compared with PAM4. Finally, combined amplitude phase shift (CAPS), which is very similar to optical duobinary, qualifies as the best candidate for access networks spanning more than 10 km, mainly due to its high tolerance to chromatic dispersion.
Coherent systems are a capable solution that can increase the data rate as well as the link distance. However, coherent systems, such as the ones discussed in Section 5.2, which were considered for core and long-haul transmission, are cost-ineffective solutions for access. For this reason, novel low-complexity coherent systems have to be introduced gradually in fiber-based short-haul networks in order to meet the capacity demands due to fixed/wireless network convergence (and intra-DCI), such as what happened at the backbone counterpart segments of the network, where a gradual phase of migration from direct detection systems to coherent ones was considered. To achieve this target, the P2MP transmission via XR-optics, shown in Figure 13, can be employed in order to minimize the number of end-points or the direct digital to optical domain (D/O) conversion, which can replace the electronic digital to analog converter (eDAC) intermediaries, increasing the overall cost-effectiveness.
Another possible cost-effective solution for access is the simplified coherent reception proposed in [88]. In this case, the detection scheme is based on a 3 × 3 fiber coupler 120 optical hybrid with 25G APD, cutting in half the overall costs compared with a fully coherent receiver. As it is shown in Table 11, the APD and the simplified coherent receivers can provide significant gains of 8–19 dB in terms of power budget, depending on the modulation format. This gain makes them very good candidates for longer networks and/or systems with a larger number of users, where a significant number of power splits is required. In order to weigh the gain-cost potential, a relative cost comparison among various modulation formats is shown in Figure 34. The assumption that the cost of a 10G system equals 1 has been used. As it is evident, when the data rate migrates from 10G to 25G, the cost is increased mainly due to the higher costs associated with the 25G APD compared with the 10G APD. Next, when advancing from 25G to 50G, a large increase in cost should be considered, mainly due to the electro-absorption modulated laser–semiconductor optical amplifier that is used in the transmitter part, along with EDB detection and possibly even using an optical pre-amplified receiver when PAM4 is employed. Finally, a full coherent 100G system seems too costly for access, whilst a simplified coherent system can be a good candidate since it balances the cost with the significantly increased power budget, as is shown in Figure 34.

5.3.2. State-of-the-Art Technology in Optical Transceivers

Representative commercially available transceivers for data center interconnection and access applications, along with their physical layer characteristics, are shown in Table 12. Various options of pluggable transceivers are illustrated in this table, each tailored to a different bit rate and transmission reach. Such pluggable modules with rates of 100G and beyond are attractive, as they can provide decreased power consumption while they require a smaller space compared with their lower rate counterparts. In addition, individual ports of a network element can be plugged with any needed type of transceiver.
From Table 12, we can observe that the vast majority of transceivers focus mainly on O and C-band and, to a lesser extent, to parts of S and L-band. This is expected, as the more mature technology is focusing on the second and third transmission windows, where fiber dispersion and attenuation are minimized, respectively, resulting in cheaper components due to their mass production. However, the vast majority of the low-loss fiber spectrum, that is more than half of the O, S and L bands, and the whole spectrum of E and U-band, remain untapped. This designates a strong need to accelerate toward manufacturing cost-effective transceivers for these wavelengths in order to increase the number of supported users within a single fiber. This is especially important for cases with limited fiber availability when network operators have to pay a rent to a government body/agency in order to exploit fiber resources.
Next, power consumption is an important issue, as its minimization directly leads to lower OpEx costs. Further, in PON links where optical amplification is not considered, a candidate cost-effective solution is the direct digital to optical domain (D/O) conversion instead of using the eDAC intermediaries [57,58]. The main purpose of eDACs is to drive multilevel analog signals into the optical modulators; however, in the context of ultra-high-speed photonic interconnects, eDAC technology is increasingly expensive and is becoming increasingly difficult to keep scaling up the data rate. In this way, direct D/O conversion can provide significant advantages in terms of performance, energy efficiency, complexity and cost reduction.
In overall, we can conclude that the “wish-list” for next generation transceivers includes lower power consumption, higher power budget, flexibility in terms of transmission wavelength and reach, via a low-cost platform.

6. Technical Challenges and Future Directions

Our analysis has revealed that the passage to the F5G era poses significant challenges for the network operators, as a new ecosystem needs to emerge in order to support the new services and applications. In this section, we delineate the main technical challenges and future directions for the fixed telecom industry, which are: energy efficiency, capacity scaling, data security/integrity of communications, dense connectivity, low-cost manufacture of integrated optical components and cost-efficient, finely tuned optical switching. Addressing each technical challenge in a cost-effective way generates an opportunity for further investigation and, hopefully, product commercialization.

6.1. Technical Challenges

Energy efficiency constitutes a major challenge for network operators, as it can minimize the operational expenditures of network providers, as well as lower the environmental impacts by minimizing carbon emissions. As the majority of the energy is consumed by the ONUs in the FTTH context [39], novel transceivers have to be introduced. A cost-effective solution to this challenge is the exploitation of D/O conversion instead of using the eDAC. This solution incorporates a low-cost coherent transceiver that is tailored to access domains, as the DSP module is extracted, providing significant gains in terms of power efficiency and cost.
Capacity scaling is another major challenge, as it can offer high capacity to the end users in a flexible and scalable manner. This challenge is not trivial to solve, as the current fiber transmission technology has reached the nominal plateau of 100 Tb/s per fiber; however, in real links, the transportation capacity is significantly lower, as mainly the C and lesser the L-band are engaged. The exploitation of amplification bands beyond C and L is an efficient solution that can provide greater connectivity and/or greater capacity as extra channels are transmitted [90,91,92,93,94]. In particular, the low loss fiber amplification bands such as O, E, S, C and L can be exploited in order to support transportation capacity significantly greater than 200 Tb/s for long-haul transmission and higher than 450 Tb/s for data center interconnections [95,96]. In order to realize a MB system, a significant amount of research has to be carried out both at a network and component levels, in order to develop novel and cost-effective optical amplifiers, transceivers, etc. Another possible solution is space division multiplexing (SDM), which is mainly based on bundles of SMF fibers and can directly lead to an increased overall transportation capacity [92,97,98].
Optical communication modules are severely under-integrated, providing a low channel count (four or eight per module), in profound contrast to the high level of integration reached in switching ASICs capable of handling hundreds of +50 Gb/s lanes. This limits the number of modules that can be hosted on switch faceplates (faceplate density) and poses limitations in bandwidth and power consumption due to electronic SERDES (serializers/deserializers) that are present between the switching ASICS and the faceplate-mounted optical modules. The elimination of multiple power-hungry and costly electronic DACs by introducing all-optical counterparts will bring down the required cost and power savings at the digital part of the switches, assisting also at the increase of faceplate densities. An oDAC is essentially an optical multilevel constellation generator (e.g., a source of optical PAM4 or PAM8 in one-dimension (1D) or optical QAM constellations in 2D). Unlike conventional eDAC + modulator optical transmitter structures, oDACs should be driven right from the digital input bitstream (preferably generated by state-of-the-art CMOS at low voltage swings) without internally resorting to intermediary electrical multilevel signals, thus eliminating the problematic ultra-high-speed eDACs. As a consequence, oDACs are expected to play a major role in the next generation of optical communications systems as they enable the generation of the highest capacity signals while being the most energy efficient for supporting Tb/s interconnections.
Fiber remote sensing based on coherent optical frequency domain reflectometry (COFDR) is a novel family of optical sensors that can attain ranges of various km, allowing to monitor in real-time and continuously critical parameters such as temperature, acoustics/vibrations, strain, etc. over the entire length of an optical fiber. An OFDR-based distributed fiber optic sensor with a linewidth squeezed optical source and an optically-amplified-recirculating phase gate in its emitting side, can be superior compared with current SoTA fiber-optic sensors due to (a) the ultra-coherent source, (b) the ultra-fast modulators and PDs and (c) the 100 Gbaud electronics. These advantages can result in a resolution of less than 10 mm and a range of up to 10 km, making COFDR the ideal technology for the next generation of sensors.
Central office re-architected as a datacenter (CORD) is a relatively new access architecture, designated mainly over the last five years, aiming to bring new concepts, such as NFV, SDN and cloud datacenters, closer to the end users. The main advantages of this approach are reduced latency due to the faster delivery of services, higher efficiency of network resources due to the virtualization procedure and OPEX advantages due to cloud automation and lights-out operation. However, high maintenance costs, as well as the cost of the transformation of the central office into a datacenter are the main drawbacks of this approach. This concept needs further investigation in order to quantify the relative costs and gains from this transformation; however, as emerging F5G-F6G services require very low latency, the CORD approach seems very attractive.

6.2. Future Directions

Based on the technical challenges, we can summarize the future directions for the network providers in Table 13. More details on the vision for the future evolution of broadband optical networks will be provided in a follow-up article.

7. Conclusions

Optical networks have experienced tremendous growth over the past few decades and have moved beyond traditional applications, through undersea, terrestrial and submarine networks, to become the infrastructure of choice in new networks segments, such as 5G fronthaul and datacenter networks. The anticipated advancements over the next years, beyond the revolution that coherent systems based on DSP have enabled, will be based increasingly on the capabilities of photonic integrated circuit platforms and new approaches for optical signal processing and switching based on the unique properties of light. Those advancements will lead to a higher network capacity with reduced cost and energy consumption per bit transmitted/processed. The examination of the main advantages and drawbacks of these key elements will need to be addressed in the F6G, which will be the next era of optical networks and is expected to integrate various technologies, such as communication, sensing, computational functionalities and AI, into a single network entity.
In this complex environment, the current article aims to serve as a comprehensive overview for the evolution of fixed networking, shedding light on the key enablers from various perspectives, such as the physical layer advances and limitations, the networking challenges from core to access as well as the evolution of the offered services. The motivation for this work is the fact that fixed networks lack consistent exploration of their evolution over the past 50 years. For this purpose, this survey article aims to assist engineers and students of the telecom industry to understand, in a better way, (a) how broadband networks emerged and developed as a result of the third Industrial evolution; and (b) the main features of the current networking environment, in order to be prepared for the “intelligent” future, which will be marked by advancements of the fourth Industrial Revolution.

Author Contributions

All authors have contributed to the conceptualization, methodology approach development, editing, writing and reviewing of the article. All authors have read and agreed to the published version of the manuscript.

Funding

This research received no external funding.

Data Availability Statement

The data discussed in this article have been referenced at the corresponding points.

Acknowledgments

The authors would like to acknowledge the assistance of Konstantinos Moschopoulos for the review of the manuscript.

Conflicts of Interest

The authors declare no conflict of interest.

References and note

  1. Wild, T.; Braun, V.; Viswanathan, H. Joint Design of Communication and Sensing for Beyond 5G and 6G Systems. IEEE Access 2021, 9, 30845–30857. [Google Scholar] [CrossRef]
  2. ETSI GR F5G Standard 1 (2020): V1; Network, Fifth Generation Fixed. “F5G Generation Definition Release# 1.
  3. Broadband Development Alliance. Gigabit Broadband Network Business Scenarios. White Paper 2019. [Google Scholar]
  4. Meinel, C.; Harald, S. Internetworking: Technological Foundations and Applications; Springer Science & Business Media: Berlin/Heidelberg, Germany, 2013. [Google Scholar]
  5. Kramer, G.; Pesavento, G. Ethernet Passive Optical Network (EPON): Building a Next-Generation Optical Access Network. IEEE Commun. Mag. 2002, 40, 66–73. [Google Scholar] [CrossRef] [Green Version]
  6. Weinstein, S.; Luo, Y.; Wang, T. The ComSoc Guide to Passive Optical Networks—Enhancing the Last Mile Access; John &Wiley & Sons: Hoboken, NJ, USA; IEEE: Piscataway, NJ, USA, 2012. [Google Scholar]
  7. Skubic, B.; Wosinska, L. Introduction to Optical Access Networks. In Handbook of Optical Networks; Mukherjee, B., Tomkos, I., Tornatore, M., Winzer, P., Zhao, Y., Eds.; Springer: Cham, Switzerland, 2020. [Google Scholar]
  8. Frigo, N.J.; Iannone, P.P.; Reichmann, K.C. A view of fiber to the home economics. IEEE Commun. Mag. 2004, 42, S16–S23. [Google Scholar] [CrossRef]
  9. Koonen, T. Fiber to the Home/Fiber to the Premises: What, Where, and When? Proc. IEEE 2006, 94, 911–934. [Google Scholar] [CrossRef]
  10. Kani, J.; van Veen, D. Current TDM-PON Technologies (Standard, Physical Layer, Access Control, Advanced Functions). In Handbook of Optical Networks; Mukherjee, B., Tomkos, I., Tornatore, M., Winzer, P., Zhao, Y., Eds.; Springer: Cham, Switzerland, 2020. [Google Scholar]
  11. Lam, C.F.; Yin, S. Evolution of Fiber Access Networks. Optical Fiber Telecommunications VII; Academic Press: New York, NY, USA, 2020; pp. 827–865. [Google Scholar]
  12. Wey, J.S. The Outlook for PON Standardization: A Tutorial. J. Light. Technol. 2020, 38, 31–42. [Google Scholar] [CrossRef]
  13. Sierens, C.; Mestdagh, D.; Van Der Plas, G.; Vandewege, J.; Depovere, G.; Debie, P. Subcarrier multiple access for passive optical networks and comparison to other multiple access techniques. Proc. IEEE Globecom 1991, 1, 619–623. [Google Scholar]
  14. Ueda, H.; Okada, K.; Ford, B.; Mahony, G.; Hornung, S.; Faulkner, D.; Abiven, J.; Durel, S.; Ballart, R.; Erickson, J. Deployment status and common technical specifications for a B-PON system. IEEE Commun. Mag. 2001, 39, 134–141. [Google Scholar] [CrossRef]
  15. Chae, C.-J.; Wong, E.; Tucker, R.S. Optical CSMA/CD Media Access Scheme for Ethernet Over Passive Optical Network. IEEEPhotonics Technol. Lett. 2002, 14, 711–713. [Google Scholar] [CrossRef]
  16. Effenberger, F.; Cleary, D.; Haran, O.; Kramer, G.; Li, R.D.; Oron, M.; Pfeiffer, T. An Introduction to PON Technologies. IEEE Commun. Mag. 2007, 45, S17–S25. [Google Scholar] [CrossRef]
  17. McGarry, M.P.; Maier, M.; Reisslein, M. Ethernet PONs: A survey of dynamic bandwidth allocation (DBA) algorithms. IEEE Commun. Mag. 2004, 42, S8–S15. [Google Scholar] [CrossRef]
  18. Kramer, G.; Mukherjee, B.; Dixit, S.; Ye, Y.; Hirth, R. Supporting Differentiated Classes in Ethernet Passive Optical Networks. J. Opt. Netw. 2002, 1, 280–298. [Google Scholar]
  19. Zheng, J.; Mouftah, H.T. Media Access Control for Ethernet Passive Optical Networks: An Overview. IEEE Commun. Mag. 2005, 43, 145–150. [Google Scholar] [CrossRef]
  20. Kramer, G.; Mukherjee, B.; Pesavento, G. IPACT: A Dynamic Protocol for an Ethernet PON (EPON). IEEE Commun. Mag. 2002, 40, 74–80. [Google Scholar] [CrossRef] [Green Version]
  21. Logothetis, M.D.; Moscholios, I.D.; Boucouvalas, A.C.; Vardakas, J.S. Delay Performance of WDM-EPON for Multi-dimensional Traffic under the IPACT Fixed Service and the Multi-Point Control Protocol. In Proceedings of the 2nd European Teletraffic Seminar (ETS), Blekinge Institute of Technology, Karlskrona, Sweden, 30 September–2 October 2013. [Google Scholar]
  22. Gumaste, A.; Chlamtac, I. A Protocol to Implement Ethernet Over PON. In Proceedings of the IEEE International Conference on Communications, 2003. ICC’03, Anchorage, AK, USA, 11–15 May 2003; Volume 2, pp. 1345–1349. [Google Scholar]
  23. Lannoo, b.; Verslegers, L.; Colle, D.; Pickavet, M.; Gagnaire, M.; Demeester, P. Analytical model for the IPACT dynamic bandwidth allocation algorithm for EPONs. J. Opt. Netw. 2007, 6, 677–688. [Google Scholar] [CrossRef] [Green Version]
  24. IEEE Std 802.1 Q-1998; IEEE 802.1 Working Group. Local and Metropolitan Area Networks-Virtual Bridged Local Area Networks. IEEE: Piscataway, NJ, USA, 1999.
  25. Thangappan, T.; Therese, B.; Suvarnamma, A.; Swapna, G.S. Review on dynamic bandwidth allocation of GPON and EPON. J. Electron. Sci. Technol. 2020, 18, 100044. [Google Scholar] [CrossRef]
  26. Konstadinidis, C.; Sarigiannidis, P.; Chatzimisios, P.; Raptis, P.; Lagkas, T.D. A Multilayer Comparative Study of XG-PON and 10G-EPON Standards. In Proceedings of the 9th South East European Doctoral Student Conference (DSC2014), Thessaloniki, Greece, 25–26 September 2014; pp. 286–298, ISBN 978-960-9416-07-8. [Google Scholar] [CrossRef]
  27. Banerjee, A.; Park, Y.; Clarke, F.; Song, H.; Yang, S.; Kramer, G.; Kim, K.; Mukherjee, B. Wavelength-division-multiplexed passive optical network (WDM-PON) technologies for broadband access: A review. J. Opt. Netw. 2005, 4, 737–758. [Google Scholar] [CrossRef]
  28. Prat, J.; Valcarenghi, L. Emerging PON Technologies. In Handbook of Optical Networks; Mukherjee, B., Tomkos, I., Tornatore, M., Winzer, P., Zhao, Y., Eds.; Springer: Cham, Switzerland, 2020. [Google Scholar]
  29. Vardakas, J.S.; Vassilakis, V.G.; Logothetis, M.D. Blocking Analysis in Hybrid TDM-WDM Passive Optical Networks. In Proceedings of the 5th International Working Conference on Performance Modelling and Evaluation of Heterogeneous Networks (HET-NETs ‘08), Karlskrona, Sweden, 18–20 February 2008. [Google Scholar]
  30. Vardakas, J.S.; Moscholios, I.D.; Logothetis, M.D.; Stylianakis, V.G. An Analytical Approach for Dynamic Wavelength Allocation in WDM-TDMA PONs Servicing ON-OFF Traffic. IEEE/OSA J. Opt. Commun. Netw. 2011, 3, 347–358. [Google Scholar] [CrossRef]
  31. Moscholios, I.D.; Logothetis, M.D.; Stylianakis, V.G.; Vardakas, J.S. The Priority Wavelength Release Protocol for Dynamic Wavelength Allocation in WDM-TDMA PONs Supporting Random and Quasi-Random Bursty Traffic. In Proceedings of the 18th European Conference on Networks and Optical Communications, NOC 2013, Graz, Austria, 10–12 July 2013. [Google Scholar]
  32. Logothetis, M.D.; Vardakas, J.S.; Moscholios, I.D. Performance Evaluation of a Dynamic Wavelength Allocation Protocol in WDM-TDM PONs Servicing Pareto ON–OFF Traffic. In Proceedings of the 16th International Conference on Transparent Optical Networks (ICTON), Graz, Austria, 6–10 July 2014. [Google Scholar]
  33. ITU-T Rec. G.989.1: 40 Gigabit-capable passive optical networks (NG-PON2): General requirements (ITU-T, Geneva 2013).
  34. Knittle, C. IEEE 50 Gb/s EPON (50G-EPON). In Proceedings of the 2020 Optical Fiber Communications Conference and Exhibition (OFC), San Diego, CA, USA, 8–12 March2020; pp. 1–3. [Google Scholar]
  35. Zhang, D.; Liu, D.; Wu, X.; Nesset, D. Progress of ITU-T higher speed passive optical network (50G-PON) standardization. J. Opt. Commun. Netw. 2020, 12, D99. [Google Scholar] [CrossRef]
  36. White Paper on 50G-PON Technology, by ZTE. Available online: https://res-www.zte.com.cn/mediares/zte/Files/PDF/white_book/White_Paper_on_50G-PON_Technology_20201210_EN.pdf?la=en (accessed on 30 October 2022).
  37. ITU-T Rec. G.9804.3: 50-Gigabit-Capable Passive Optical Networks (50G-PON), 9/21. Available online: https://www.itu.int/rec/T-REC-G.9804.3(accessed on 30 October 2022).
  38. Dhaini, A.R.; Ho, P.-H.; Shen, G. Toward Green Next-Generation Passive Optical Networks. IEEE Commun. Mag. 2011, 49, 94–101. [Google Scholar] [CrossRef]
  39. Dixit, A.; Lambert, S.; Lannoo, B.; Colle, D.; Pickavet, M.; Demeester, P. Towards energy efficiency in optical access networks [Invited]. In Proceedings of the 2013 IEEE International Conference on Advanced Networks and Telecommunications Systems (ANTS), Kattankulathur, India, 15–18 December 2013; pp. 1–6. [Google Scholar] [CrossRef]
  40. Khalili, H.; Rincón, D.; Sallent, S.; Piney, J.R. An Energy-Efficient Distributed Dynamic Bandwidth Allocation Algorithm for Passive Optical Access Networks. Sustainability 2020, 12, 2264. [Google Scholar] [CrossRef]
  41. Aleksic, S. Energy Efficiency of Electronic and Optical Network Elements. IEEE J. Sel. Top. Quantum Electron. 2011, 17, 296–308. [Google Scholar] [CrossRef]
  42. Valcarenghi, L.; Van, D.P.; Raponi, P.G.; Castoldi, P.; Campelo, D.R.; Wong, S.-W.; Yen, S.-H.; Kazovsky, L.G.; Yamashita, S. Energy Efficiency in Passive Optical Networks: Where, When, and How? IEEE Netw. 2012, 26, 61–68. [Google Scholar] [CrossRef]
  43. Shaddad, R.; Mohammad, A.; Al-Gailani, S.; Al-Hetar, A.; Elmagzoub, M. A survey on access technologies for broadband optical and wireless networks. J. Netw. Comput. Appl. 2014, 41, 459–472. [Google Scholar] [CrossRef]
  44. Prat, J. Technologies for Cost-Effective udWDM-PONs. J. Light. Technol. 2016, 34, 783–791. [Google Scholar] [CrossRef] [Green Version]
  45. Reis, J.D.; Ferreira, R.M.; Rossi, S.M.; Suzigan, G.J.; Pinto, T.M.; Shahpari, A.; Teixeira, A.L.; Gonzalez, N.G.; Oliveira, J.R.F. Bidirectional coherent WDM-PON performance with real-time Nyquist 16QAM transmitter. In Proceedings of the 2015 Optical Fiber Communications Conference and Exhibition (OFC), Los Angeles, CA, USA, 24 March 2015. [Google Scholar]
  46. Available online: https://www.infinera.com/innovation/xr-optics (accessed on 30 October 2022).
  47. Open XR Concept Introductory White Paper. Open XR Forum, January 2022.
  48. Horvath, T.; Munster, P.; Oujezsky, V.; Bao, N.-H. Passive optical networks progress: A tutorial. Electronics 2020, 9, 1081. [Google Scholar] [CrossRef]
  49. Kanonakis, K.; Cvijetic, N.; Tomkos, I.; Wang, T. Dynamic Software-Defined Resource Optimization in Next-Generation Optical Access Enabled by OFDMA-Based Meta-MAC Provisioning. J. Light. Technol. 2013, 31, 2296–2306. [Google Scholar] [CrossRef]
  50. Kanonakis, K.; Tomkos, I.; Pfeiffer, T.; Prat, J.; Kourtessis, P. ACCORDANCE: A novel OFDMA-PON paradigm for ultra-high capacity converged wireline-wireless access networks. In Proceedings of the 2010 12th International Conference on Transparent Optical Networks, Munich, Germany, 27 June–1 July 2010. [Google Scholar]
  51. Xu, Z.; Tan, Z.; Yang, C. Research on Performances of Coherent Nyquist-WDM-PON and WDM-OFDM-PON Using Effective Phase Noise Suppression Methods. In Proceedings of the 2016 Asia Communications and Photonics Conference (ACP), Wuhan, China, 2–5 November 2016. [Google Scholar]
  52. Pfeiffer, T.; Kissing, J.; Elbers, J.P.; Deppisch, B.; Witte, M.; Schmuck, H.; Voges, E. Coarse WDM/CDM/TDM concept for optical packet transmission in metropolitan and access networks supporting 400 channels at 2.5 Gb/s peak rate. J. Light. Technol. 2000, 18, 1928. [Google Scholar] [CrossRef]
  53. Mukherjee, B.; Tomkos, I.; Tornatore, M.; Winzer, P.; Zhao, Y. (Eds.) Handbook of Optical Networks; Springer Nature: Berlin/Heidelberg, Germany, 2020. [Google Scholar]
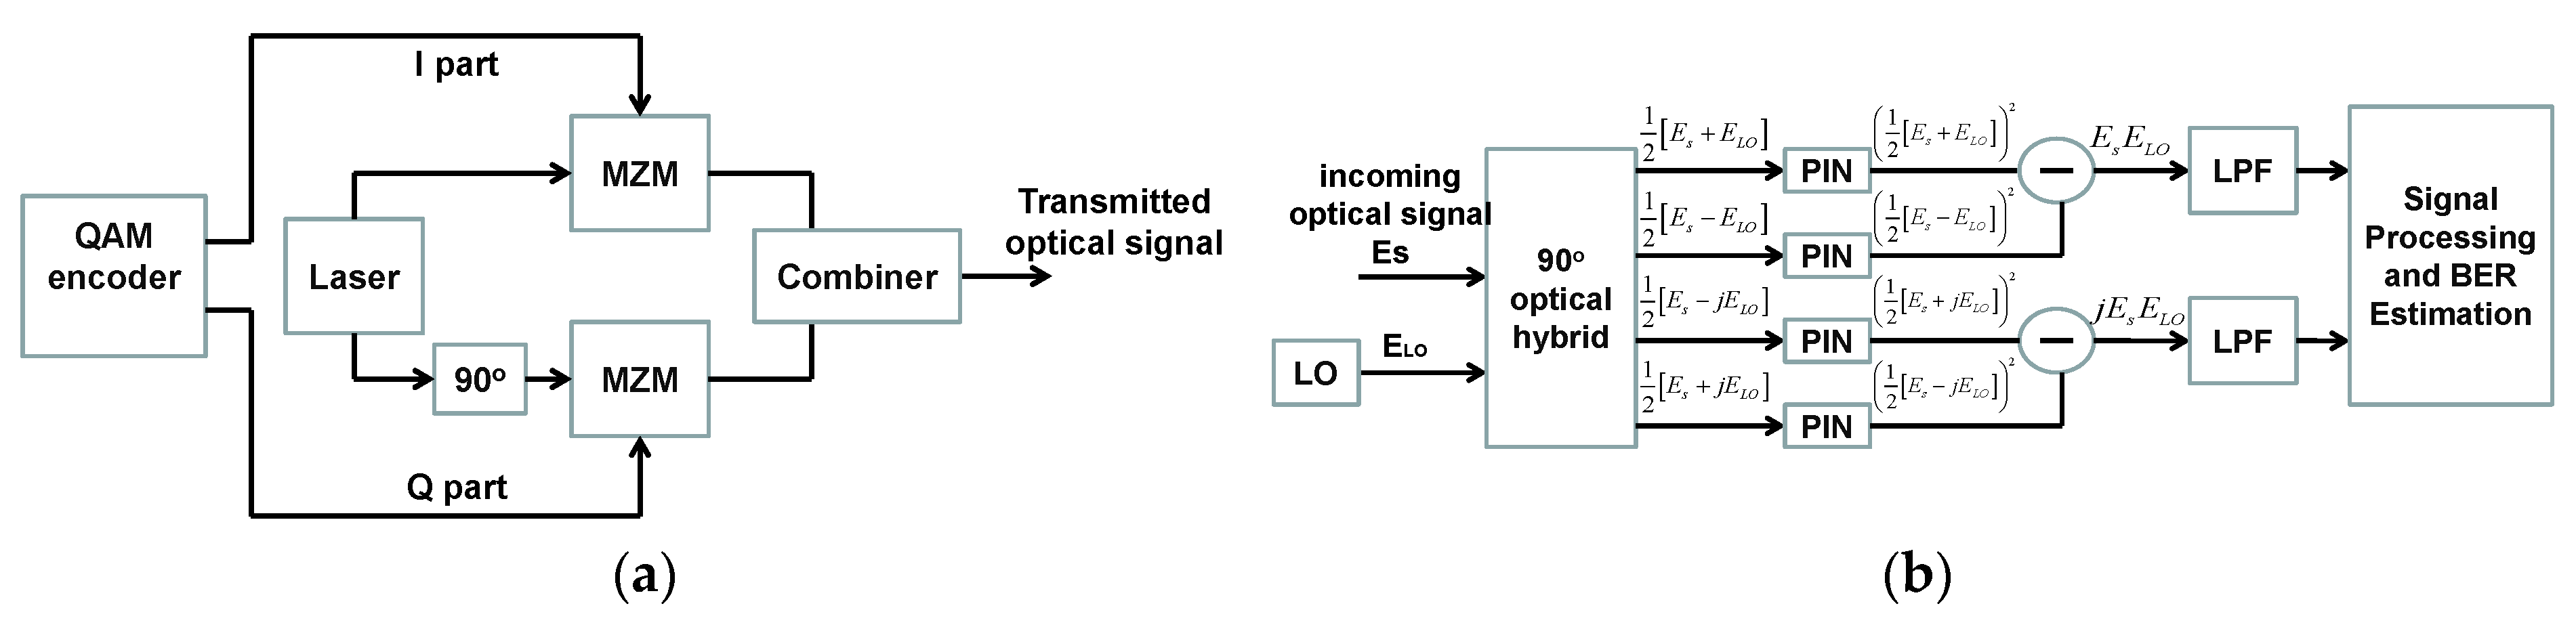
  54. Shahpari, A.; Ferreira, R.M.; Luis, R.S.; Vujicic, Z.; Guiomar, F.P.; Reis, J.D.; Teixeira, A.L. Coherent Access: A Review. J. Light. Technol. 2017, 35, 1050–1058. [Google Scholar] [CrossRef] [Green Version]
  55. Houtsma, V.; Mahadevan, A.; Kaneda, N.; van Veen, D. Transceiver technologies for passive optical networks: Past, present, and future [Invited Tutorial]. IEEE/OSA J. Opt. Commun. Netw. 2021, 13, A44–A55. [Google Scholar] [CrossRef]
  56. DeSanti, C.; Du, L.; Guarin, J.; Bone, J.; Lam, C.F. Super-PON: An evolution for access networks [Invited]. IEEE/OSA J. Opt. Commun. Netw. 2020, 12, D66–D77. [Google Scholar] [CrossRef]
  57. Nazarathy, M.; Tomkos, I. Accurate Power-Efficient Format Scalable Multi-Parallel Optical Digital-to-Analogue Conversion. Photonics 2021, 8, 38. [Google Scholar] [CrossRef]
  58. Nazarathy, M.; Tomkos, I. ‘Perfect’ PAM4 serial digital-optical conversion. IEEE Photonics Technol. Lett. 2021, 33, 475–478. [Google Scholar] [CrossRef]
  59. Verbist, J.; Verplaetse, M.; Lambrecht, J.; Srivinasan, S.A.; De Heyn, P.; De Keulenaer, T.; Pierco, R.; Vyncke, A.; Absil, P.; Yin, X.; et al. 100 Gb/s DAC-less and DSP-free transmitters using GeSi EAMs for short-reach optical interconnects. In Proceedings of the 2018 Optical Fiber Communications Conference and Exposition, OFC 2018-Proceedings, San Diego, CA, USA, 11–15 March 2018; pp. 1–3. [Google Scholar]
  60. Yamazaki, H.; Yamada, T.; Goh, T.; Mino, S. Multilevel optical modulator with PLC and LiNbO3 hybrid integrated circuit. In Proceedings of the OFC 2011, Los Angeles, CA, USA, 6–10 March 2011. [Google Scholar]
  61. Sano, A.; Kobayashi, T.; Ishihara, K.; Masuda, H.; Yamamoto, S.; Mori, K.; Yamazaki, E.; Yoshida, E.; Miyamoto, Y.; Yamada, T.; et al. 240-Gb/s polarization-multiplexed 64-QAM modulation and blind detection using PLC-LN hybrid integrated modulator and digital coherent receiver. In Proceedings of the European Conference on Optical Communication, Vienna, Austria, 20–24 September 2009; Volume 2009 (Suppl. 1), p. 2. [Google Scholar]
  62. Yamazaki, H.; Yamada, T.; Goh, T.; Kaneko, A. PDM-QPSK modulator with a hybrid configuration of silica PLCs and LiNbO3 phase modulators. J. Light. Technol. 2011, 29, 721–727. [Google Scholar] [CrossRef]
  63. Yamazaki, H.; Yamada, T.; Goh, T.; Kaneko, A. 64QAM Modulator with a Hybrid Configuration of Silica PLCs and LiNbO3 Phase Modulators for 100-Gb/s Applications Hiroshi. In Proceedings of the ECOC 2009, Vienna, Austria, 20–24 September 2009. paper 2.2.1. [Google Scholar]
  64. Alexandros, S. Core and Metro Networks; John Wiley & Sons: Hoboken, NJ, USA, 2010. [Google Scholar]
  65. Available online: https://www.cisco.com/en/US/docs/optical/15000r5_0/15327/reference/guide/2750topl.html (accessed on 30 October 2022).
  66. Iannone, E.; Sabella, R. Optical path technologies: A comparison among different cross-connect architectures. J. Light. Technol. 1996, 14, 2184–2196. [Google Scholar] [CrossRef]
  67. Ahuja, S.S.; Korkmaz, T.; Krunz, M. Minimizing the differential delay for virtually concatenated Ethernet over SONET systems. In Proceedings of the 13th International Conference on Computer Communications and Networks (IEEE Cat. No. 04EX969), Chicago, IL, USA, 11–13 October 2004; IEEE: Piscataway, NJ, USA, 2004. [Google Scholar]
  68. Labourdette, J.-F.; Bouillet, E.; Ramamurthy, R.; Akyamac, A. Fast approximate dimensioning and performance analysis of mesh optical networks. IEEE/ACM Trans. Netw. 2005, 13, 906–917. [Google Scholar] [CrossRef]
  69. Vasilyev, M.; Tomkos, I.; Mehendale, M.; Rhee, J.-K.; Kobyakov, A.; Ajgaonkar, M.; Tsuda, S.; Sharma, M. Transparent Ultra-Long-Haul DWDM Networks with “Broadcast-and-Select” OADM/OXC Architecture. J. Light. Technol. 2003, 21, 2661. [Google Scholar] [CrossRef]
  70. Awduche, D. MPLS and traffic engineering in IP networks. IEEE Commun. Mag. 1999, 37, 42–47. [Google Scholar] [CrossRef] [Green Version]
  71. ITU-T Recommendation. G.8080/Y.1304, Architecture for the Automatically Switched Optical Networks, November 2001, and Amendment 1, March 2003.
  72. Jajszczyk, A. The ASON approach to the control plane for optical networks. In Proceedings of the 2004 6th International Conference on Transparent Optical Networks (IEEE Cat. No. 04EX804); IEEE: Piscataway, NJ, USA, 2004; Volume 1. [Google Scholar]
  73. Cisco Segmented Generalized Multiprotocol Label Switching for the IP Next-Generation Network.
  74. Tomkos, I.; Azodolmolky, S.; Sole-Pareta, J.; Careglio, D.; Palkopoulou, E. A tutorial on the flexible optical networking paradigm: State of the art, trends, and research challenges. Proc. IEEE 2014, 102, 1317–1337. [Google Scholar] [CrossRef]
  75. Zhao, Y.; Yan, B.; Liu, D.; He, Y.; Wang, D.; Zhang, J. SOON: Self-optimizing optical networks with machine learning. Opt. Express 2018, 26, 28713–28726. [Google Scholar] [CrossRef]
  76. Uzunidis, D.; Karkazis, P.; Roussou, C.; Patrikakis, C.; Leligou, H.C. Intelligent Performance Prediction: The Use Case of a Hadoop Cluster. Electronics 2021, 10, 2690. [Google Scholar] [CrossRef]
  77. Uzunidis, D.; Karkazis, P.; Leligou, H.C. Machine Learning Resource Optimization Enabled by Cross Layer Monitoring. In Proceedings of the 13th International Symposium on Communication Systems Networks and Digital Signal Processing (CSNDSP), Porto, Portugal, 20–22 July 2022. [Google Scholar]
  78. Panayiotou, T.; Savvas, G.; Tomkos, I.; Ellinas, G. Centralized and distributed machine learning-based QoT estimation for sliceable optical networks. In Proceedings of the 2019 IEEE Global Communications Conference (GLOBECOM), Big Island, HI, USA, 9–13 December 2019; IEEE: Piscataway, NJ, USA; pp. 1–7. [Google Scholar]
  79. Panayiotou, T.; Savva, G.; Tomkos, I.; Ellinas, G. Decentralizing machine-learning-based QoT estimation for sliceable optical networks. J. Opt. Commun. Netw. 2020, 12, 146–162. [Google Scholar] [CrossRef] [Green Version]
  80. Uzunidis, D.; Stavdas, A.; Kasnesis, P.; Patrikakis, C.; Lord, A. Enhancing Closed-Form Based Physical Layer Performance Estimations in EONs via Machine Learning Techniques. In Proceedings of the 2021 European Conference on Optical Communication (ECOC), Bordeaux, France, 13–16 September 2021. [Google Scholar]
  81. Poggiolini, P.; Bosco, G.; Carena, A.; Cigliutti, R.; Curri, V.; Forghieri, F.; Pastorelli, R.; Piciaccia, S. The LOGON strategy for low-complexity control plane implementation in new-generation flexible networks. In Proceedings of the 2013 Optical Fiber Communication Conference and Exposition and the National Fiber Optic Engineers Conference (OFC/NFOEC), Anaheim, CA, USA, 17–21 March 2013; IEEE: Piscataway, NJ, USA, 2013. [Google Scholar]
  82. Essiambre, R.-J.; Kramer, G.; Winzer, P.J.; Foschini, G.J.; Goebel, B. Capacity Limits of Optical Fiber Networks. J. Light. Technol. 2010, 28, 662–701. [Google Scholar] [CrossRef]
  83. Winzer, P.J.; Neilson, D.T. From Scaling Disparities to Integrated Parallelism: A Decathlon for a Decade. J. Light. Technol. 2017, 35, 1099–1115. [Google Scholar] [CrossRef]
  84. Winzer, P.J.; Neilson, D.T.; Chraplyvy, A.R. Fiber-optic transmission and networking: The previous 20 and the next 20 years [Invited]. Opt. Express 2018, 26, 24190–24239. [Google Scholar] [CrossRef]
  85. Liu, X. Evolution of Fiber-Optic Transmission and Networking toward the 5G Era. Iscience 2019, 22, 489–506. [Google Scholar] [CrossRef] [Green Version]
  86. Agrell, E.; Karlsson, M.; Chraplyvy, A.R.; Richardson, D.J.; Krummrich, P.M.; Winzer, P.; Roberts, K.; Fischer, J.K.; Savory, S.J.; Eggleton, B.J.; et al. Roadmap of optical communications. J. Opt. 2016, 18, 063002. [Google Scholar] [CrossRef]
  87. Sabella, R.; Iovanna, P.; Bottari, G.; Cavaliere, F. Optical transport for Industry 4.0 [Invited]. IEEE/OSA J. Opt. Commun. Netw. 2020, 12, 264–276. [Google Scholar] [CrossRef]
  88. van Veen, D.; Houtsma, V. Strategies for economical next-generation 50 G and 100 G passive optical networks [Invited]. IEEE/OSA J. Opt. Commun. Netw. 2020, 12, A95–A103. [Google Scholar] [CrossRef]
  89. Uzunidis, D.; Apostolopoulou, F.; Pagiatakis, G.; Stavdas, A. Analysis of Available Components and Performance Estimation of Optical Multi-Band Systems. Eng 2021, 2, 531–543. [Google Scholar] [CrossRef]
  90. Uzunidis, D.; Matrakidis, C.; Stavdas, A.; Pagiatakis, G. On the Attainable Transparent Length of Multiband Optical Systems Employing Rare—Earth Doped Fiber Amplifiers. In Proceedings of the 1st International Conference on Electrical, Biomedical and Nuclear Engineering Technologies (ElectriTek), Surabaya, Indonesia, 8–9 October 2020. [Google Scholar]
  91. Uzunidis, D.; Matrakidis, C.; Stavdas, A.; Lord, A. Power Optimization Strategy for Multi-Band Optical Systems. In Proceedings of the European Conference of Optical Communications, ECOC’ 20, Brussels, Belgium, 6–10 December 2020. [Google Scholar]
  92. Uzunidis, D.; Kosmatos, E.; Matrakidis, C.; Stavdas, A.; Lord, A. Strategies for Upgrading an Operator’s Backbone Network beyond the C-Band: Towards Multi-Band Optical Networks. IEEE Photonics J. 2021, 13, 1–18. [Google Scholar] [CrossRef]
  93. Uzunidis, D.; Matrakidis, C.; Kosmatos, E.; Stavdas, A.; Petropoulos, P.; Lord, A. Connectivity Challenges in E, S, C and L Optical Multi-Band Systems. In Proceedings of the 2021 European Conference on Optical Communication (ECOC), Bordeaux, France, 13–16 September 2021; pp. 1–4. [Google Scholar] [CrossRef]
  94. Uzunidis, D.; Matrakidis, C.; Kosmatos, E.; Stavdas, A.; Lord, A. On the benefits of power optimization in the S, C and L-band optical transmission systems. Comput. Netw. 2022, 211, 108958. [Google Scholar] [CrossRef]
  95. Ferrari, A.; Napoli, A.; Fischer, J.K.; da Costa, N.M.S.; D’Amico, A.; Pedro, J.; Forysiak, W.; Pincemin, E.; Lord, A.; Stavdas, A.; et al. Assessment on the Achievable Throughput of Multi-Band ITU-T G.652.D Fiber Transmission Systems. J. Light. Technol. 2020, 38, 4279–4291. [Google Scholar] [CrossRef]
  96. Nikolaou, K.F.; Uzunidis, D.; Stavdas, A.; Pagiatakis, G. Quantifying the Impact of Physical Layer Effects in an Optical Multi-Band System. In Proceedings of the 29th Telecommunications Forum TELFOR 2021, Belgrade, Serbia, 23–24 November 2021. [Google Scholar]
  97. Papapavlou, C.; Paximadis, K.; Uzunidis, D.; Tomkos, I. Toward SDM-Based Submarine Optical Networks: A Review of Their Evolution and Upcoming Trends. Telecom 2022, 3, 234–280. [Google Scholar] [CrossRef]
  98. For the creation of several figures included in this article, the authors used icons from www.flaticon.com.
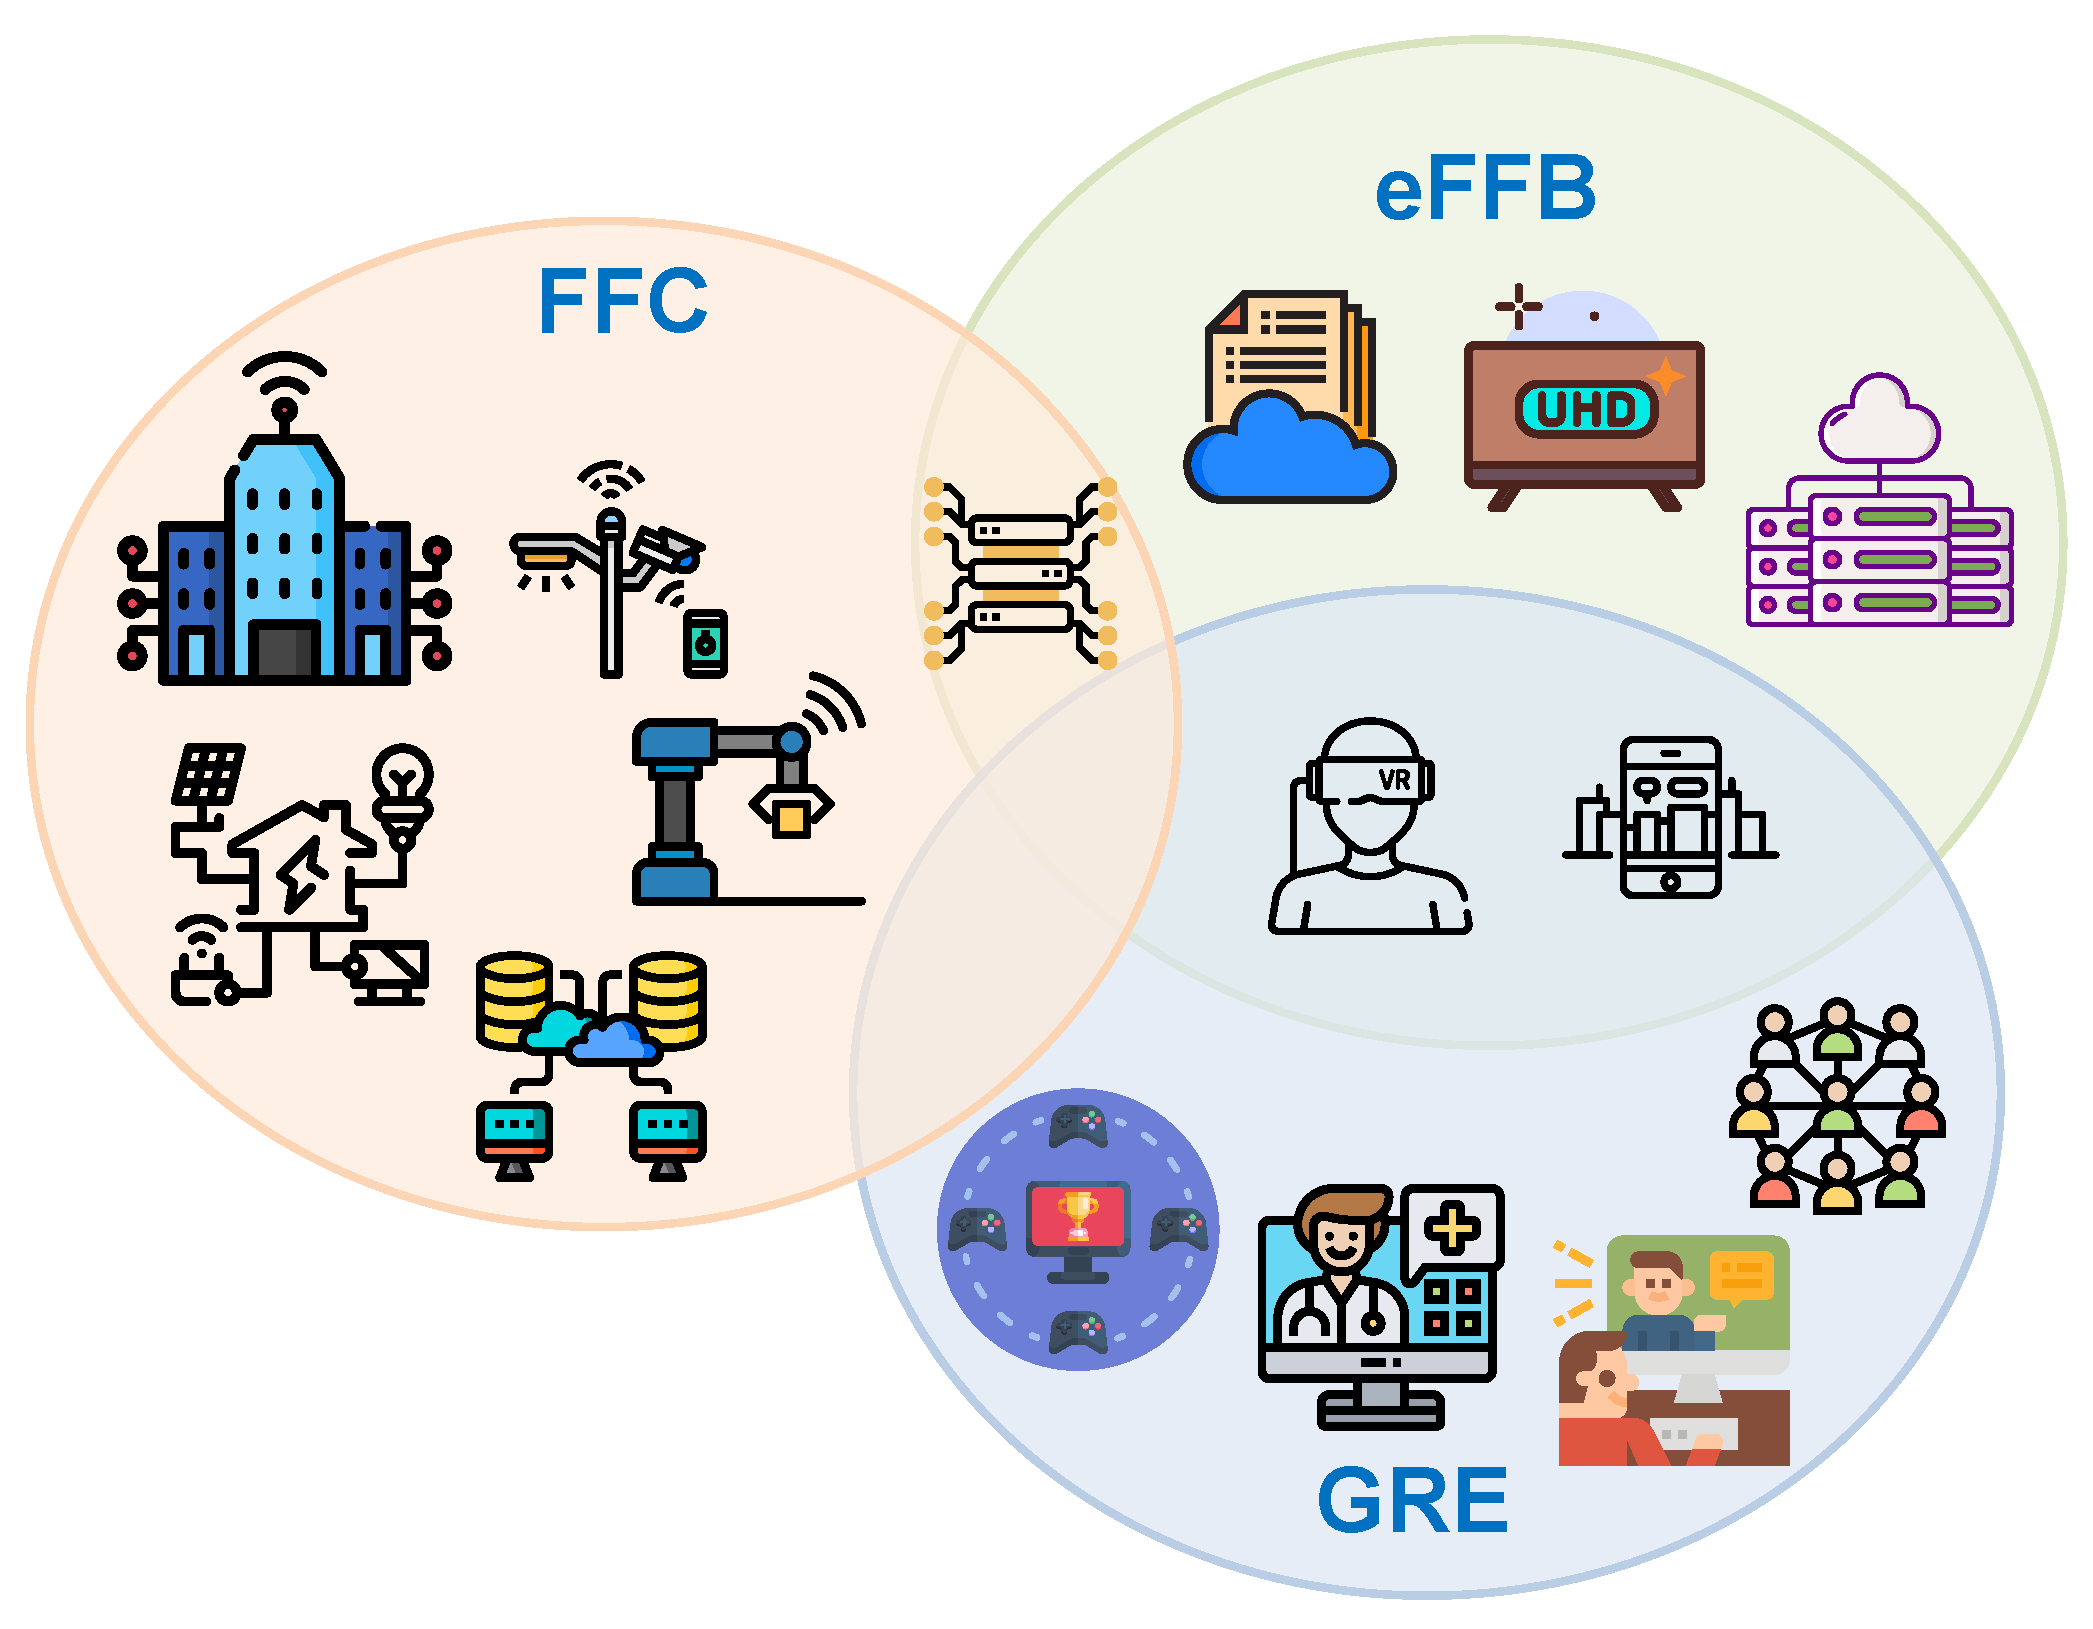
Figure 1. Layered analysis of the first five generations of fixed networks (F1G to F5G).
Telecom 03 00035 g001
Figure 2. Representative services over the five fixed network generations.
Telecom 03 00035 g002
Figure 3. Representative services for the three F5G service families.
Telecom 03 00035 g003
Figure 4. Most important deployed access standards over the past 50 years.
Telecom 03 00035 g004
Figure 5. LAN types: ETHERNET LAN, TOKEN RING LAN and FDDI LAN.
Telecom 03 00035 g005
Figure 6. The uplink and downlink frame of a TDM-PON.
Telecom 03 00035 g006
Figure 7. Example of REPORT and GATE messages to define ONU-timeslot durations.
Telecom 03 00035 g007
Figure 8. The NG-PON2 architecture as in [33]; IF (interface), CG (channel group), CP (channel pair), CEx (instance of co-existence element), HE (head end), WM (wavelength multiplexer).
Telecom 03 00035 g008
Figure 9. Typical OLT/ONU/ONT block diagram of TWDM-PON.
Telecom 03 00035 g009
Figure 10. ONU/ONT Energy Consumption (basic modes) in arbitrary units.
Telecom 03 00035 g010
Figure 11. The wavelength chart of PONs (The deep red parts of the axes, uplink—downlink, denote occupied wavelengths).
Telecom 03 00035 g011
Figure 12. Architecture of a UD-WDM-PON [44].
Telecom 03 00035 g012
Figure 13. Network architecture of a Nyquist-WDM-PON [47].
Telecom 03 00035 g013
Figure 14. An architectural example of OFDM-PON along with its proposed meta-MAC scheme for dynamic resource provisioning [49].
Telecom 03 00035 g014
Figure 15. OCDMA-PON architecture.
Telecom 03 00035 g015
Figure 16. Illustration of (a) transmitter and (b) receiver employed for coherent transmission.
Telecom 03 00035 g016
Figure 17. Scalability and reach of (a) typical PON and (b) super-PON [56].
Telecom 03 00035 g017
Figure 18. Architecture used to cover an access network with a 50 km radius using (a) typical PON and (b) super-PON [56].
Telecom 03 00035 g018
Figure 19. Segmented MZM (SEMZM) seven segments of the oDAC architecture-optimized thermometer weighted DAC structure for generation of pulse amplitude modulation (PAM)8 [57].
Telecom 03 00035 g019
Figure 20. Parallel architecture proposed in [57].
Telecom 03 00035 g020
Figure 21. Timeline of five generations of backbone network standards.
Telecom 03 00035 g021
Figure 22. The evolution of backbone (metro/core) transport network standards.
Telecom 03 00035 g022
Figure 23. Evolution of transport network architectures from single channel SONET systems to WDM based networks supporting various transport protocols.
Telecom 03 00035 g023
Figure 24. F3G network layered architecture.
Telecom 03 00035 g024
Figure 25. Improvement of performance versus transit traffic.
Telecom 03 00035 g025
Figure 26. Data networking over all-optical infrastructure (IP over optical networks).
Telecom 03 00035 g026
Figure 27. Elastic (flexible) optical networks [74].
Telecom 03 00035 g027
Figure 28. Attenuation and dispersion parameter of a G.652D fiber.
Telecom 03 00035 g028
Figure 29. Evolution of transported capacity within a single mode fiber over the last 50 years (based on [82,83,84]).
Telecom 03 00035 g029
Figure 30. Overview of the key technological advances which allowed to increase the B × L product in optical transmission.
Telecom 03 00035 g030
Figure 31. Evolution of transported capacity per single channel for commercially available systems over the last 50 years (based on [82,83,84,85,86]).
Telecom 03 00035 g031
Figure 32. Architectural illustration of various access variants [53].
Telecom 03 00035 g032
Figure 33. Power penalty of various modulation formats versus link distance [87].
Telecom 03 00035 g033
Figure 34. Comparison of various modulation formats in terms of cost [88].
Telecom 03 00035 g034
Table 1. Classification of services and their requirements using the F1G-F5G scheme. eFBB: Enhanced Fiber Broadband, FFC: Full Fiber Connection, GRE: Guaranteed Reliable Experience, NB: Narrowband, WB: Wideband, BB: Broadband, UBB: Ultra Broadband, GB: Gigaband.
Service RequirementsService Type
BR/ServiceService TypeTypical BRLatencyReliabilityAvailabilityeFBBFFCGRE
F1G (NB Era)64 kB/sTelephony, Fax64 kB/sL-L
F2G (WB Era)2 Mb/sPhotos, SD Video>1 Mb/sM-L
Web Browsing>1 Mb/sM-M
Search Engines>1 Mb/sM-L
E-mail>1 Mb/sM-L
F3G (BB Era)20 Mb/sIPTV>10 Mb/sL-M
E-commerce>5 Mb/sM-L
Telecommuting>5 Mb/sL-H
Videoconferencing>10 Mb/sL-L
E-learning>5 Mb/sM-L
E-Government>10 Mb/sM-L
Emergency Management Operations>10 Mb/sLHL
F4G (UBB Era)100 Mb/s4k HD/multiple screens>50 Mb/sL-L
F5G (GB Era)1 Gb/sUHD video streaming>100 Mb/sL-Lx x
E-health>200 Mb/sLHH x
Cloud Office>50 Mb/sL-Lx
Online Education>500 Mb/sL-M x
Online Entertainment (Gaming, Social Networking)>300 Mb/sL-H x
Virtual Reality (VR)>200 Mb/sL-Mx x
Augmented Reality>200 Mb/sL-Mx x
Smart Infrastructure (Home, Factory, City)>300 Mb/sLHH x
Enterprise Cloudification>100 Mb/sL-H x
Table 2. Economic predictions for critical F5G services [3].
Use CaseAnnual Growth Rate (%)Market Size (USD Billions)
Cloud VR66.7292 (2025)
Smart Home129 (in total between 2019–2023)154 (2023)
Gaming9.3174 (2021)
Social Networking45 (in total between 2017–2022)57 (2022)
Cloud Desktop39.4 (compound annual rate between 2016–2022)2.58 (2022 in China)
Safe City7.524.1 (2022)
Enterprise Cloudification30103.5 (2022)
Online Education9.5 (compound annual rate between 2017–2026)400 (2026)
E-health2239.2 (2023)
Table 3. Details of various copper-based access standards.
YearNameStandardDS RateUS RateMaximum Reach
1875PSTN-up to 64 kb/s--
1988N-ISDNI.seriesup to 2 Mb/s--
1988B-ISDNI.seriesup to 622 Mb/sup to 622 Mb/s-
1992HFC-40 Mb/s9 Mb/s25 km
1997DOCSISJ.112, J.122, J.22240 Mb/s10 Mb/s-
1998HDSLG991.11.5 Mb/s1.5 Mb/s4 km
1999ADSLG992.17 Mb/s800 kb/s4–6 km
2002ADSL2G992.38 Mb/s1 Mb/s2 km
2003ADSL2+G992.524 Mb/s1 Mb/s1 km
2002ADSL2-REG992.38 Mb/s1 Mb/s7 km
-SDSL-1.5 Mb/s1.5 Mb/s3–6 km
2001VDSLG993.152 Mb/s2.3 Mb/s1.5 km
2006VDSL2G993.2200 Mb/s100 Mb/s2.2 km
2014G.FastG.9700, G.9701up to 1 Gb/sup to 1 Gb/s0.5 km
Table 4. Details of various fiber-based access standards.
YearNameStandardDS/US RateNumber of λs per DirectionMaximum ReachTechnology/Traffic ModeSplitting Ratio
1998APONG983.x622/155 Mb/s110 kmATM1:32
1999BPONG983.x622/155 Mb/s120 kmATM1:32
2004GPONG984.x2.5/1.25 Gb/s120 kmGEM1:128
2004EPON802.3ah1.25/1.25 Gb/s120 kmEthernet1:128
200910G-EPON802.3av10/10 Gb/s140 kmEthernet1:128
2010XG-PONG987.x10/2.5 Gb/s160 kmTWDM1:256
2015NG-PON2G989.x40/40 Gb/sup to 840 kmTWDM1:256
2016XGS-PONG9807.x10/10 Gb/s160 kmTWDM1:256
202050G-EPON802.3ca50/50 Gb/sup to 220 kmEthernet1:128
202150G-TDM-PONG.9804.x:50/50,25,12.5 Gb/s160 kmTDMA1:256
Table 5. A power consumption example which shows the impact of sleep mode.
PON (Downlink/Uplink)Max Power BudgetSplit Ratio for 100 Mb/s, User Activity 10%Split Ratio for
1 Gb/s, User Activity 50%
OLT-Transceiver Power
Consumption
ONU/ONT-Transceiver
Always ONFast/Deep Sleep
GPON(2.5G/1.25G)28 dB1:641:83.8 W3.2 W0.6 W/0.1 W
XGPON(10G/2.5G)35 dB1:2561:3212.0 W5.6 W1.2 W/0.1 W
NG-PON2(10G/10G)28 dB1:641:12813.0 W6.3 W1.2 W/0.1 W
Table 6. Power consumption [mW] of ONU/ONT without—with component integration 1.
GPONEPON10G-EPONXG-PON
APD2.62.62.62.62.62.62.62.62.62.62.05
TIA83.483.483.483.483.483.483.483.4123123123
LP-A126410126610121410121610145350154
CDR520790545910356356
S/Des560560550550NANANA
Total129210561002696130210461117696NANANA
1 Cells in color denote integration. For example, the red color denotes the integration of LP-A and CDR components.
Table 7. A PON Comparison.
EraPONMotivation for PONQoS SupportSecurity
F1G
(Narrowband-to- Wideband Era)
APON/
BPON
ATM: Promising technology for broadband
High complexity and cost of legacy access systems (SDH/SONET)
SLA
four traffic classes (priorities from high to low): fixed, assured, non-assured, best Effort
AES encryption
F2G
(Wideband Era)
EPONIncrease of Internet traffic
Low-cost Ethernet-LANs
Need to fully support of all Ethernet features
802.1Q eight traffic classes (priorities from high to low): network control, internetwork control, voice (delay <10 ms), video (delay <100 ms), excellent effort, best effort, backgroundUnspecified
GPONIncreasing bandwidth requirements of the users
Expansion of BPON to support Internet traffic too
Support and leverage of SDH/SONET systems and Generic Framing Protocol
SLA
5T-CONTs (priorities from high to low): fixed, assured, non-assured, best effort, other (T-CONT combination)
AES encryption
F3G
(Broadband Era)
10G EPONViability of operators’ investment on EPON. No replacement of legacy equipment
Easy management
New exciting applications over Internet to users
802.1Q eight traffic classes (priorities from high to low): network control, internetwork control, voice (delay <10 ms), video (delay <100 ms), excellent effort, best effort, backgroundUnspecified
XG(S)PONSupport of new bandwidth-demanding applications
Connecting a larger number of users
Better QoS
Better security
SLA
Five T-CONTs (priorities from high to low): fixed, assured, non-assured, best effort, other (T-CONT combination)
AES-CTR encryption
F4G
(Ultra-
Broadband Era)
NG-PON2Increase the PON scalability
Increase of transmission rate to end-user
Backward compatibility with all TDM-PONs
Support of legacy services using emulation
Applied through DBA
four T-CONTs (priorities from high to low): fixed, assured, non-assured, best effort
Proprietary DWBA for TWDM-EPON QoS
High security due to multiple wavelengths
F5G
(Gigaband
Era)
50G-EPONUbiquitous Internet traffic
To increase the number of users per fiber
Users not only need larger bandwidth but also dedicated bandwidth (due to wireless fronthaul)
Lower cost than NG-PON2
Backward compatibility with EPON and 10G-EPON
Coexistence with GPON and XG(S)PON
802.1Q eight traffic classes (priorities from high to low): network control, Internet work control, voice (delay < 10 ms), video (delay <100 ms), excellent effort, best effort, backgroundAES-CTR encryption
50G TDM PONUbiquitous Internet traffic
To increase the number of users per fiber
Users not only need larger bandwidth but also dedicated bandwidth (due to wireless fronthaul)
Lower cost per user
Backward compatibility with GPON and XG(S)PON
Coexistence with 10G-EPON
Applied through Co-DBA
ONU/ONT activation mechanism
four T-CONTs (priorities from high to low): fixed, assured, non-assured, best effort
AES-CTR encryption
Table 8. Timeline of backbone protocols and standards.
YearNameStandard
1976X.25Standardized by CCITT in the Orange Book
1981IPv4RFC 791
1983EthernetIEEE 802.3 family
1984OSI reference modelISO 7498
1988Frame RelayI.122, I.441
1988PDHG.702, G.703, G.705
1991ATMI.362, I.363
Late 1990sSONET/SDHMultiple ITU, ETSI and ANSI standards (https://www.itu.int/ITU-T/studygroups/_COM15/otn/SDH-rec.html) such as G.707, G.708
1998WDM over SDHG.692
1998IPv6RFC 2460
2001OTNMultiple, such as G.709, G.798, G.872,
2001MPLSRFC 3031
Early 2000sASONMultiple ITU standards (https://www.itu.int/itudoc/gs/promo/tsb/80686.pdf) and RFC 6827
2003, 2004GMPLSRFC 3471, 3945
Table 10. Summary of the key advances and limitations in the physical layer for each decade.
NoveltiesLimitationsKey Technology
1st Decade (1970–1980)increased capacity compared with co-axial cablesmainly attenuation introduction of fiber-optics for transmission
2nd Decade (1980–1990)extended rates to up to 10 Gb/sattenuation @ 1310 nm, dispersion @ 1550 nm,
single channel only
lasers for 2nd–3rd transmission windows
3rd Decade (1990–2000)extended transparent length and capacitytransmission limited in part of C-bandoptical amplifiers and DCMs, WDM, new fibers, advanced MFs
4th Decade (2000–2010)extended number of channels, use of dynamic optical switcheslimited spectral efficiencydynamic optical switching, full C-band amplification, coherent detection
5th Decade (2010–2020)extended reach and spectral efficiencycapacity crunch of 100 Tb/sexpansion of coherent systems, DSP, flexgrid, constellation shaping
Table 11. Receiver sensitivity and the resulting coherent gain for various modulation formats for 25 and 50G. A BER value of 10−2 is considered [88].
ModulationCoherent GainCoherent Receiver Sensitivity (dBm)APD Receiver Sensitivity (dBm)
25G NRZ19−38−30
25G PAM-414.5−28.9
50G EDB15−29.3−25
50G PAM-48−20.3−21
Table 12. Details of commercially available transceivers [89].
TypeBandLine RateDistanceOutput PowerSensitivity
CFP8 TransceiverO400 Gb/s<2 kmN/AN/A
CFP4/CFP2TransceiverO100 Gb/s<10 kmN/AN/A
200G and 400G
Coherent Transceiver CFP2-DCO
C400 Gb/sN/A>−10 dBm−30/>−20 dBm
100G Coherent
Transceiver CFP-DCO
C100 Gb/sN/A>−5 dBm>−28 dBm
400G QSFP-DCO
Coherent Transceiver
C400 Gb/s<120 km−10 dBm>−12 dBm
400G Transceiver
DD-QSFP-DCO
C400 Gb/s<120 km−10 dBm>−12 dBm
16G-CWDM SFP+ Transceiver L16 Gb/s<40 km>−1 dBm−16 dBm
XFP TransceiverO10 Gb/s<40 km>−5 dBm−16 dBm
SFP TransceiverO, S1 Gb/s<40 km>−6 dBm−23 dBm
Table 13. Summary of the main technical challenges and the proposed future directions.
ChallengeFuture Direction
Low-cost transceiversexploitation of direct digital to optical domain (D/O) conversion instead of using electronic digital to analog converters (eDAC). DSP modules can also be removed
Capacity scalingtransmitting light in amplification bands beyond C as well as using bundles of SMFs. This can result in a 10 times capacity increase and connectivity
Power consumption introduction of oDACs while eliminating multiple power-hungry and costly electronic DACs
Remote sensingemploying OFDR-based distributed fiber optic sensors with a linewidth squeezed optical source and optically-amplified-recirculating phase gates
NFV and SDN introductiontransformation of the central office into a datacenter (CORD) can provide significant gains in terms of latency in order to support F6G services
Publisher’s Note: MDPI stays neutral with regard to jurisdictional claims in published maps and institutional affiliations.

