Article

Modeling the Coal Tar Pitch Primary Carbonization Process

by
Mahnaz Soltani Hosseini
and
Patrice Chartrand
*
Centre for Research in Computational Thermochemistry (CRCT), Department of Chemical Engineering, Polytechnique Montreal, C.P. 6079, Succursale “Downtown”, Montreal, QC H3C 3A7, Canada
*
Author to whom correspondence should be addressed.
Fuels 2022, 3(4), 698-729; https://doi.org/10.3390/fuels3040042
Submission received: 9 September 2022 / Revised: 6 October 2022 / Accepted: 15 November 2022 / Published: 26 November 2022

Abstract

:
The properties of the carbon materials obtained as the final product of coal tar pitch carbonization process are a consequence of the type of chemical and physical phenomena occurring through the process. A new simplified approach for modeling of the primary carbonization is presented to provide the semi-quantitative knowledge about the process useful for improving the efficiency of the industries that deal with this process. The proposed approach is based on defining thermodynamic and kinetic equations simply representing numerous phenomena happening during primary carbonization. Partial pressures of emitted volatiles in a simple pitch system are studied. The model enables estimating the mass and enthalpy changes of pitch through thermal treatment consistent with experimental data for mass losses of pitch heat treated up to 550 °C. Application of the model to describe molecular weight distribution changes of pitch during primary carbonization is demonstrated, showing a good agreement between the presented results and the investigations reported by Greinke. For the first time, the effect of important parameters in pitch carbonization, such as the heating rate of the pitch and the carrier gas flow rate, on the emission rate of volatiles is successfully modeled. The present model is well able to estimate the energy requirement for thermal treatment of pitch up to 350 °C.

1. Introduction

Pitches are widely used for the manufacture of carbon materials (CM) to produce different types of carbon-based electrodes with their own specific applications [1,2,3,4,5,6,7,8,9,10,11,12,13,14,15,16,17,18,19,20,21,22,23,24,25]. The graphite type electrodes are used in electric-arc furnaces [2,3,23] and current collectors [8,21,24], and in pitch-based fibers [1,12,13,22,25] while prebaked carbon electrodes are utilized in aluminum smelting industries [4,7,9,10,11,15,17,18,19]. The property and quality of CM are determined based on the properties of pitches and the conditions of the carbonization process to transform the initial pitch to desired products [6,14].
Pitches contain different monomers, oligomers and polymers of polycyclic aromatic hydrocarbons (PAH) and heterocyclic compounds. They have different properties depending on the source from which they are obtained [26,27]. During carbonization, pitch is transformed to infusible coke due to physical and chemical changes happening through the process [26]. Vaporization of the volatile compound constituents of pitch is the most significant physical change occurring in the early stage of the carbonization process and results in raising the average molecular weight of the residual pitch. With further heat treatment of the pitch and thermal oligomerization and irreversible polymerization of the monomer compounds, the size of the aromatic molecules grows. Release of gaseous hydrogen and methane also takes place throughout the carbonization process, with these gaseous products being dominant in the 500–1100 °C range [26,28,29].
The carbonization process is energy-intensive and the most costly stage of the electrode manufacturing process used in the above mentioned industries and significantly affect the final product quality. Meanwhile, the amount of gas emitted through this process is considerable [30]. Therefore, particular attention must be paid to optimization of the energy consumption and minimization of gas emissions, as well as producing a desired quality product [30]. Current knowledge of the carbonization process is qualitative in most aspects [31,32,33,34,35,36,37,38,39,40,41,42,43,44,45,46,47,48,49,50]. Over the years, a large number of investigations with the aid of characterization techniques such as mass spectroscopy, Raman spectroscopy, thermal analysis and electron and nuclear magnetic resonance have resulted in a vast knowledge about fundamentals of the carbonization process [32,36,37,38,39,44,45,46]. Franklin, as one of the first investigators in this research field [44,45], and later Oberlin and Bonnamy [36,37,38,39] have reviewed the fundamentals of carbonization process. Brooks and Tylor [40,41,42] have made great efforts to enhance understanding of the nematic liquid formation stage during thermal treatment of aromatic compounds. The chemistry of carbonization has been investigated for many years by Lewis and Marsh [26,31,32,33,34,35,43]. Greinke and Singer [47,48,49,50] continued the work of Lewis using gel permission chromatography (GPC) to quantify the molecular weight distribution of coexisting phases during pitch carbonization as a function of treatment time, gaining fundamental insights into the changing phase relationship during transformation processes. However, a deeper understanding of the vaporization and polymerization reactions occurring during the carbonization process, quantitatively, will improve the CM production processes and allow the development of new pitch-based materials.
The aim of the present work is to propose a new approach to describe and to model physical and chemical changes occurring during primary carbonization of coal tar pitch (CTP). The developed model can provide the semi-quantitative knowledge required for the estimation of mass and enthalpy changes occurring during CTP carbonization as well as the amount and composition of the released gases. Estimation of such quantities would be useful for the above mentioned industries in order to operate with higher productivity. Indeed, gaining knowledge of the carbonization process aimed at optimizing the production process of both graphite and prebaked electrodes used in electric-arc furnaces, electric motor brushes, sealing materials, carbon bearings, current collectors, pitch-based fibers, and aluminum smelting will result in achieving higher efficiency in these industries. Due to complexity of the process, our proposed approach is based on using prototype reactants and reactions that can represent the most important internal phenomena happening through the primary carbonization process; we reduce to a minimum the required time-dependent variables (such as considering only a heating rate). The important target variables studied in the present work are the mass of the residue pitch and the composition and heating value of volatile species.
The proposed model has to be calibrated using available experimental data indicating mass and molecular weight distribution changes of CTP occurring during the heat treatment process. Few experimental data are available in the literature, and we utilized the experimental data set of Bouchard et al. [28] where mass loss of volatile matters during CTP carbonization has been presented in the thesis, coupled with molecular weight distribution changes during primary carbonization of CTP presented by Greinke [47] in order to perform the required calibration. In the present work, Bouchard’s data will be utilized for calibration of the model with the expectation that the proposed approach will be versatile enough to be applied to other sets of experimental data in future works. The present work also neglects the role of impurities such as sulfur, nitrogen and oxygen.

2. Materials and Methods

Coal tar pitch (CTP) is a complex mixture of polycyclic aromatic hydrocarbon (PAH) and heterocyclic compounds, which composition will be evolving during carbonization. CTP carbonization can be considered as divided in two types of processes [26,32,35,51]. The first process is the volatilization of light PAHs from the pitch and a slight polymerization of PAH compounds and thermal cracking reactions, and the second process involves the condensation of aromatic rings giving rise to polyaromatic compounds of higher molecular mass [14] which is accompanied by evaporation of low MW PAHs. Hydrogen is removed largely in the form of H2 and CH4 throughout the whole process.
Considering both processes through mass balance, thermodynamic and kinetic equations can provide a semi-quantitative description useful for the simulation and optimization of primary carbonization processes to obtain CM with good properties while keeping the energy consumption, environmental emissions and costs to acceptable values. Due to the complex nature of pitches and the complicated physical and chemical changes happening through carbonization process, the challenge is to simplify the modeling approach by a careful selection of constitutive species while keeping it representative of the major characteristics of the system.
The methodology used in the present work to develop a model aimed at semi-quantitative description of CTP primary carbonization is summarized in the following line diagram:
Fuels 03 00042 i001

2.1. Overview of General Steps of Primary Carbonization Process

Primary carbonization has been extensively reviewed starting with Franklin [44,45] as the pioneer in these studies followed by the review works of Oberlin and Bonnamy [36,37,38,39]. Primary carbonization refers to transformation of an initial precursor carbon to mesophase and ultimately a brittle solid state material, semi-coke, and reaches its penultimate stage at approximately 400–600 °C (the exact temperature of completion depending on the precursor composition and other factors) [52]. Mesophase and semi-coke are the intermediate discotic nematic liquid crystals and solid phases, appearing after the softening and distillation of the starting CTP materials (as the initial precursor carbon) at around 350 °C. They are composed of mostly fully condensed high molecular weight polycyclic aromatic hydrocarbon (PAH) molecules. The formation of mesophase permits the spatial rearrangement of the molecules favoring oligomerization and polymerization needed for semi-coke formation.
In order to develop a semi-quantitative model of internal phenomena occurring during primary carbonization, the general steps describing the major observed changes must be defined.
The tendency of molecular components of CTP vary extensively to form a mesophase. Namely, it can be regarded as relatively large and disc-like molecules corresponding to mesogen molecules with tendency to liquid crystal formation and small or non-disc-like molecules to non-mesogen molecules [53,54].
Vaporization of low molecular weight compounds and thermal cracking of side chains from aromatic rings are the most significant physical changes occurring during heat treatment of CTP before reaching the temperature range of mesophase and semi-coke formation (350–500 °C) [39,53,55]. Removing of the volatiles resulting in a pitch solution rich in mesogen molecules is a key factor controlling both the conversion to mesophase and subsequently semi-coke [40,53]. The mesophase formation is the result of oligomerization and polymerization reactions of reactive species of pitch to create higher molecular weight compounds satisfying the molecular structural types for liquid crystal formation [26,56].
Greinke studied the kinetics of polymerization reactions occurring during mesophase formation [47]. According to his research, the mesophase is formed as a consequence of the reaction between molecules with MW between 300 and 700. He applied gel permission chromatography (GPC) to investigate the mesophase constituents. He observed that it contains polymerized molecules with molecular weight greater than 1000 but less than 2000 MW. This result indicates that the rate of reactions involving of molecules with 1000 MW and larger is very low. Indeed, the fluidity of mesophase is a consequence of these low reaction rates.
As the temperature reaches around 450 °C, the reaction between PAHs with high molecular weight proceeds further [47]. Irreversible polymerization reactions of PAHs with 700–1200 MW accompanied by dehydrogenation processes result in build up of the initial aromatic planes of semi-coke. However, Greinke’s investigations showed a significant change in the kinetics of reactions in the solid phase when semi-coke formation starts [47].
Continuing the heat treatment of semi-coke beyond 500 °C ends up in the formation of carbon materials. However, primary carbonization refers to heat treatment of pitches up to around 550 °C corresponding to the early stages of coke formation.
Hydrogen and methane are removed throughout the whole process due to dehydrogenation and scission of aliphatic chains from aromatic rings [29,34].
Consequently, the proposed model to simulate simple heat treatments of an initial CTP material (containing mostly PAH compounds with different molecular weights in the range of the molecular weight distribution of commercial CTPs) from room temperature to the semi-coke formation temperature will be divided into three simplified steps with respect to critical phenomena happening through the process: (1) vaporization of the low MW PAHs below 350 °C (assuming no polymerization reactions in this temperature range, for simplification purposes); (2) mesophase formation between 350–450 °C with thermal polymerization, dehydrogenation and cracking reactions taking place; and (3) semi-coke (and early steps of coke) formation occurring in the temperature range from 450 to 550 °C.

2.2. Simplified Approach for Modeling of Internal Phenomena Occurring in Coal Tar Pitch Primary Carbonization

CTP is a complex material containing from hundreds to thousands of different monomers, oligomers and polymers (mostly PAHs based) with a variety of molecular weights [57]. During primary carbonization, CTP is transformed into infusible coke via numerous complicated physical and chemical reactions. Hence, modeling of such a complex system and reactions to simulate all the phenomena, physical and chemical changes, happening through the above mentioned process is not possible and crude simplifications are needed, which will be discussed in the following sections.

2.2.1. Selection of a Set of Representative PAH Compounds Appearing during CTP Primary Carbonization

As shown in Figure 1, coal tar pitch mostly consists of different monomers, oligomers and polymers of PAH compounds with a variety range of molecular weights, typically from 200 to 2000 [26,57]. For simplification purposes in our modeling approach, it is decided at this point not to consider impurities (sulfur, nitrogen and oxygen) and other non-PAH compounds (heterocyclic compounds) that can be usually found in CTP.
In order to simplify such a complex material, some criteria have been defined as follows. The criteria for selection of a set of representative PAHs are based on: either typical molecular weight distribution (MWD) or characteristic values of CTP; the information about key components which participate in vaporization and polymerization reactions occurring in the primary carbonization process (Section 2.1); the possibility of cracking of side chains from aromatic rings; and formation of methane and hydrogen due to polymerization reactions taking place during heat treatment of pitch.
The selected set of representative PAHs has to include molecules with MWs satisfying typical MWD of CTP (Figure 1) and/or characteristic values of CTP, e.g., α-fraction and β-fraction of resin. The most frequent CTP characterization method is analysis of group composition of CTP fractions, based on partition of pitches according to solubility of their compounds in organic solvents. On this basis, one can distinguish between [9]: α-fraction of resin or quinoline-insolubles (QI) and β-fraction of resin which is the difference between toluene-insolubles (TI) and quinoline-insolubles (QI). Three major constituents in CTP, i.e., TS, QI and (TI-QI), are related to fractions with molecular weight less than 1000, larger than 3000 and between 1000 and 3000, respectively [58]. Another important characteristic value of CTP which is affected by MWD is the softening point (SP). According to information reported by Radenovic [9] and Shoko et al. [59], the SP of CTP is affected by the QI value. Hence, it is expected that the CTP with a determined PAH population with a satisfactory balance of the α and β fractions, will result in a reasonable SP.
With respect to the first two curves of Figure 2 (as the results of kinetic studies of Greinke [47]), the selected set of representative PAHs has to include at least one PAH with MW less than 400 since these volatile compounds are available in pitch and distilled out during the first steps of the heat treatment process. Meanwhile, it is well-known that carbonization of CTP has been a concern regarding health, safety and environment because of the emission of low molecular weight, toxic and carcinogenic PAHs [60,61,62,63]. Thus, at least one of these PAHs must be considered in the set of representative PAHs used in the process modeling, in order to provide the prerequisite for prediction of the presence of the toxic PAHs in the vapor phase. In the present work, chrysene, categorized as a highly genotoxic PAH compound [62,63], has been selected.
Considering changes in the MW distribution during the mesophase formation step (350–450 °C) as discussed in Section 2.1 and shown in Figure 2, some PAHs with MW between 300 and 700 are considered for the set of representative PAHs as reactants of oligomerization reactions.
Comparing the curves of Figure 3 (which shows the molecular weight distribution in the semi-coke formation step (450–500 °C) of the carbonization process [47]), one can observe a very slow, but apparently equal, reactivity of molecules with MW between 700 and 1200 in this step. The polymerization of pitch molecules with MW greater than 1000 results in the build-up of the 2000 MW species and larger.
These large molecular weights are considered in our model to be related to the molecular weight of the initial aromatic planes of single crystallite structure which are expected to appear in this step. Ouzilleau et al. [64] presented a size-dependent thermodynamic model for coke crystallites valid for temperature range from 300 K to 2500 K. In their model, the Gibbs energy of coke crystallites is modulated by simple variables (as average La, and Lc) related to an idealized crystallite (Figure 4). The large molecular weight aromatic planes at the semi-coke formation step would correspond to an idealized crystallite structure with n ≈ 5 (or 6), n being the number of aromatic rings on one idealized hexagonal layer as defined in Ouzilleau’s model.
Greinke has not studied the thermal polymerization kinetics of pitch molecules during coke formation (beyond 500 °C). However, it is well known that further irreversible polymerization and dehydrogenation reactions occur with further heat treatment of CTP (up to 550 °C in the present work) as part of the coke formation step. It results in a continual growth in aromatic molecular size up to 4600 MW species. This is equivalent to the idealized crystallite structure with n ≈ 7 (or 8) in Ouzilleau’s model.
It is assumed in our model that the source of methane emissions during the carbonization process is the cracking of side chains in the structure of some aromatic compounds. Hence, PAH compounds with side chains are considered as other key components (tetra-methyl-coronene is proposed in this work) in the set of representative PAHs. During the primary carbonization process, methane and hydrogen are evolved through complex chemical reactions in which numerous PAHs participate as reactants [26,28,29]. In our simplified model, these reactions are limited to a few reactions based on our choice of a set of representative PAHs.
For the purpose of simplification, oligomers and polymers of PAH compounds in selected set of PAHs are limited to the oligomers of coronene and tetra-methyl-coronene monomers whose molecular weight can satisfy the typical MWD of CTP shown in Figure 1.
The selected set of representative PAHs is listed in Table 1, together with methane and hydrogen. Its range of MW should represent typical MWD and characteristic values of CTP. It also provides the required reactants and products for the vaporization and polymerization reactions (either in residual pitch or in the emitted gaseous mixture as low PAHs, methane and hydrogen) for modeling of the primary carbonization process.

2.2.2. Estimation of Volatile PAHs Emission during CTP Heat Treatment

In the first step of the primary carbonization defined above (Section 2.1), below 350 °C, low MW PAHs are vaporized and removed from the condensed residue. The model simulates the primary carbonization of a fixed mass of CTP being heat treated under a fixed flow of inert gas in the equivalent of a plug-flow reactor subjected to a constant heating rate. The quantity of emitted volatile PAHs in this step at a given temperature can be estimated using the estimated partial pressure of each compound in an ideal gas mixture based on Dalton’s law and the estimated chemical activity of these compounds in the condensed mixture. Effective partial pressure of each compound in an ideal gas mixture (Equation (1-b)) is determined by adding a coefficient ( ϕ i ) in Dalton’s law (Equation (1-a)). This coefficient ϕ i represents the saturation level of the gas mixture by the compound i.
P i = n i n T   .   P t o t
P i - e f f e c t i v e = ϕ i .   n i n T   .   P t o t
α i = P i P i 0 ( T )
In these equations, n i is number of moles of volatilized component i in the gas mixture,   n T is the total number of moles of gas, P i is the partial pressure of component i, P t o t is the total pressure, P i 0 ( T ) is the vapor pressure of compound i in a pure state at temperature T and α i is the chemical activity of compounds i in the condensed pitch, which is assumed to be a mechanical mixture of a high viscosity isotropic+mesotropic solutions. The chemical activity of compound i in the pitch of a known composition at a given temperature (either isotropic liquid phase or iso-meso phases assumed in equilibrium) is determined by the chemical potentials of species i derived from the Gibbs free energy of the pitch system [65,66]. Using Equations (3) and (4):
μ i i s o = ( G n i ) T , P i s o = R T l n α i i s o
μ i m e s o = ( G n i ) T , P m e s o = R T l n α i m e s o
ϕ i s in Equation (1-b) become the model parameters which are determined using measured values of volatiles of low MW PAHs at the given temperature. They should lie in the range 0 < ϕ i ≤ 1 and will be discussed in Section 2.2.4.
The computation of   P i 0 ( T ) , the vapor pressures of all species i at a given temperature T, can be performed using our critical evaluation of the thermodynamic properties of PAH compounds [67] or from other vapor pressure functions available in the literature. In the present work, the FactSageTM Thermochemical Software(version 7.2) [68,69] with the data base of ref. [67] is used to compute the vapor pressures.

2.2.3. Defining Prototype Chemical Reactions as a Reduced Description of the Mesophase and Semi-Coke Formation Steps

In the second step of our model, as the temperature of the CTP reaches approximately 350 °C, the low molecular weight compounds have been mostly removed from the condensed system, and the nucleation of mesophase spheres starts due to numerous thermal polymerization reactions between the more reactive PAH compounds. In order to construct a model for estimating the mass and enthalpy changes of the residual pitch, some prototype reactions are defined. According to the kinetic studies of Greinke [47], polymerization reactions involving PAH species between 300–700 MW, the more reactive molecules, are responsible for mesophase formation. In this step, it is necessary to have an idea of the MWD changes in the pitch residue (as shown in Figure 2), to select the range of molecular weights of products in the proposed prototype reactions. For example, as seen in this figure, progressing the mesophase formation results in decreasing the population of PAHs with MW 300 and 600 and increasing that of 900 MW molecules. With respect to the selected set of PAHs in Section 2.2.1, one can postulate that the following reaction can be used to replace most reactions that are really taking place in CTP for this discussed change of MWD:
C24H12(iso/meso) + C48H20(iso/meso) = C72H28(iso/meso) + 2H2(g)
The Gibbs free energy change of this prototype reaction at a given temperature in the temperature range of mesophase formation step (350 °C and higher) can be calculated using our critical evaluation of the thermodynamic properties of PAH compounds [67]. This reaction has a negative standard Gibbs energy change (∆G°) which indicates that it occurs spontaneously under standard condition (here we can assume P(H2) is high). Equations (6)–(8) are other examples of the proposed prototype reactions, consuming 300 MW, 592 MW and 892 MW PAHs to produce 892 MW, 1180 MW and 1484 MW molecules:
3C24H12(iso/meso) = C72H28(iso/meso) + 4H2(g)
C48H20(iso/meso) + C72H28(iso/meso) = C120H32(iso/meso) + 8H2(g)
2C48H20(iso/meso) = C96H28(iso/meso) + 6H2(g)
Table 2 presents reactants and products of some proposed prototype reactions of this type with negative standard Gibbs energy change occurring in the mesophase formation step.
Some other reactions with negative standard Gibbs free energy change (presented in Table 2) are proposed in this step which are responsible for light PAHs production and methane formation due to thermally induced bond cleavage of naphthenic rings or scission of aliphatic side chains from aromatic rings, respectively. Some examples of these types of reactions are as follows:
C28H20(iso/meso) + 4H2(g) = C24H12(iso/meso) + 4CH4(g)
C48H20(iso/meso) + 2H2(g) = 2C24H12(iso/meso)
Hydrogen and methane as well as any low MW PAHs produced in this step are removed from the system.
In the next step of modeling, occurring in the temperature range between 450 and 550 °C, polymerization reactions involving species with MW between 700–1200 are taking place. The measured changes in MWD shown in Figure 3 are used to propose prototype reactions occurring in this step, as a replacement for the myriad of all reactions really occurring. Equations (11) and (12) (having negative standard Gibbs energy change) can be some examples of these type of reactions regarding the decrease in population of 900 to 1200 MW molecules and the increase in population of 1800 to 2000 MW molecules as seen in Figure 3.
2C72H28(iso/meso) = C144H36(semi-coke) + 10H2(g)
C72H28(iso/meso) + C96H28(iso/meso) = C168H36(semi-coke) + 10H2(g)
Beyond 500 °C (up to 550 °C in this work), some prototype polymerization reactions may be defined, resulting in larger molecules with MW about 4600 equivalent to n ≈ 7 (or 8) and initiation of coke formation:
2C176H48(semi-coke) = C352H76(coke) + 10H2(g)
2C192H40(semi-coke) = C384H60(coke) + 10H2(g)
Defined prototype reactions in this work which are responsible for semi-coke and coke formation in CTP heat treatment are summarized in Table 3. This table includes some cracking reactions which also take place in this step of the process, producing light PAHs and small amount of methane.
The degree of advancement of all proposed prototype reactions between 350–450 °C and 450–550 °C offers model parameters which can be combined with experimental values of condensable and non-condensable volatile matter, as will be discussed in Section 2.2.4.

2.2.4. Estimation of the Model Parameters

ϕ i s, the empirical coefficients in Equation (1-b) and the degree of advancement of the prototype reactions proposed in the previous section are the model parameters which need to be fixed by fitting the experimental data (Bouchard [28] in our case). The procedure for the estimation of these model parameters is based on defining a simple system which can well describe all the internal phenomena in CTP primary carbonization process.
A small initial mass of CTP ( m 0 ) containing PAHs with a typical characterization of CTP as shown in Figure 1 is selected as the sample which undergoes the carbonization process. The model assumes this sample is heat treated at a constant heating rate ( Q ˙ ) from room temperature to 550 °C, which is our final temperature for CTP primary carbonization process, in agreement with data in the literature. An inert gas, like Ar, with a constant flow rate ( V ˙ A r ) is passed through the system during the heat treatment to carry the emitted gas out. We will show later the impacts of small, average or large values of this flow rate (normalized by the initial mass).
The following measurements are needed to provide the required information for the estimation of the above mentioned model parameters. Mass loss of the sample due to volatilization of light compounds has to be detected using either Thermal Gravimetric Analysis (TGA) during the heat treatment or by weighting the sample at some critical temperatures after starting the chemical reactions. These temperatures are limited to 350 °C (start of mesophase formation), 450 °C (semi-coke formation) and 550 °C (coke formation) which are defined based on the concept of the carbonization process and general steps explained in Section 2.1. At these temperatures, the emitted gas mixture composition has to be analyzed utilizing gas chromatography (GC) and mass spectrometry (MS) after cooling and separation into the condensable part (e.g., low MW PAHS) and non-condensable part (mostly hydrogen and methane).
ϕ i s, as the model parameters, are determined using the measured value of volatile PAHs emitted during pitch heat treatment. The MWD of pitch residue in different steps of CTP heat treatment (either in mesophase or in semi-coke formation steps) investigated by Greinke (shown in Figure 2 and Figure 3) as well as values measured in Bouchard’s experiments for the amount of emitted condensable (e.g., low MW PAHs) and non-condensable gases (e.g., methane and hydrogen) are utilized to determine the degree of advancement of the prototype reactions. However, these are limited to 350, 450 and 550 °C, the important temperatures associated with the three defined steps in our model.

2.3. Mass and Energy Balance through the Process

With respect to general steps occurring during heat treatment of CTP [26,47,53,56], as the temperature of the pitch reaches around 350 °C, the low MW PAHs are non-mesogen molecules with no tendency to form mesophase (with respect to their clearing temperature) have been removed from the pitch. (Clearing temperature is the temperature upon heating at which liquid crystal reverts to an isotropic liquid.) The pitch is rich in reactive mesogen molecules at this temperature which build up the higher molecular weight compounds in such a manner as to satisfy the average molecular structural requirements for mesophase formation. This temperature has been fixed at 350 °C in the present work and mass and energy balances are computed in different ways, below and above this temperature. Actually, 350 °C becomes like a threshold temperature.
A hypothetical reactor design, shown in Figure 5, is used to compute, for a given iteration, the mass and energy balances in the temperature range 25–350 °C. The border of the system under study, mass and energy flows are shown in the figure as dashed, red solid and blue solid lines, respectively. The temperature difference between the two iterations ( Δ T = T j + 1   T j )   in the mass and energy balance calculations is fixed equal to 5 °C, which is relatively low compared to the temperature difference of the whole step (i.e., 325 °C). The pitch at a given temperature,   T j , (from the previous iteration) enters into the system and undergoes a carbonization process. Heat treatment of the pitch changes the temperature of the system by   Δ T and vaporization of low MW PAHs is taking place (assuming neither polymerization nor thermal cracking reactions are occurring in this temperature range of the process). It is assumed that all the generated gaseous species due to volatilization are removed from the system through the carrier gas to be burnt and there is not any retention of gas inside the reactor. There will be also no gas in the reactor input flow except carrier gas at 25 °C and 1atm for the next iteration.
Applying the mass conservation law over the system between 25–350 °C results in Equation (15-a):
( n i p i t c h ) T j + 1   + ( n i g a s ) T j + 1 +     ( n A r g a s ) T j + 1 =   ( n i p i t c h ) T j + ( n Ar g a s ) 25 ° C
where T j + 1 =   T j + Δ T is the temperature of the pitch and gas after increase, i = 1, 2, …N represents the species in the system excluding argon at any given temperature either in pitch or in gas (N is number of the species listed in Table 1), n i p i t c h is the number of moles of compound i in the pitch (either in isotropic liquid or in mesophase), and n i g a s is the number of moles of volatile compound i in the gas mixture at any given temperature, which can be estimated in each iteration by following the procedure described in Section 2.2.2. n A r g a s in both sides of Equation (15-a) will be cancelled out since it is assumed that there is not any retention of gas inside the reactor for the next iteration.
Above the threshold temperature (350 °C in this work) during mesophase and semi-coke formation, i.e., between 350–450 °C and 450–550 °C, polymerization and thermal cracking reactions listed in Table 2 and Table 3 as well as volatilization of low MW PAHs are taking place. It is assumed that there is no gas in the reactor input flow except carrier gas at 25 °C and 1atm since all the generated gaseous species due to either volatilization or polymerization and thermal cracking reactions are pushed out of the system by the carrier gas. The mass conservation law is applied over the system in these steps considering one iteration of 100 °C as presented in Equation (15-b). The criteria for choosing a 100 °C step in the calculations is the lack of required experimental data for determining the degree of advancement of chemical reactions in intermediate steps.
( n i p i t c h ) 450 ° C ( 550 ° C ) ( n i g a s ) 450 ° C ( 550 ° C ) + ( n A r g a s ) 450 ° C ( 550 ° C ) = ( n i p i t c h ) 350 ° C ( 450 ° C ) + ( n A r g a s ) 25 ° C + ν i [ R 1 ] ξ [ R 1 ] + ν i [ R 2 ] ξ [ R 2 ] + + ν i [ R n ] ξ [ R n ]  
In this equation n i gas is the number of moles of volatile compound i either in condensable gas, i.e., low MW PAHs, or in non-condensable gas, i.e., methane and hydrogen at any given temperature, ν i [ R n ]   represents the stoichiometric number of each compound (i = 1,2,…N, either PAH compound or generated gas, i.e., methane and hydrogen, due to chemical reactions, listed in Table 1) in each defined prototype reaction in Table 2 and Table 3, and ξ [ R n ] is the degree of advancement of those reactions between 350–450 °C (or 450–550 °C) as the model parameters, determined in Section 2.2.4.
Each term in the mass balance equations either below or above 350 °C are summarized in Table 4.
The First Law of thermodynamic for an open system is formulated as follows:
Q + W = Δ H + Δ E k i n + Δ E p o t  
where Q denotes the quantity of energy supplied to the system as heat, W denotes the amount of non-PV work done by the surrounding on the system, Δ H ,   Δ E k i n   and Δ E p o t are the change in the enthalpy, kinetic energy and potential energy of the system, respectively.
The required energy for increasing the temperature of the above defined system (Figure 5), from   T j to   T j + 1 , can be estimated by applying Equation (16), neglecting the two last terms in this equation and considering no non-PV work done on the system:
Q = i ( H i p i t c h ) T j + 1   + i ( H i g a s ) T j + 1   + ( H A r g a s ) T j + 1   i ( H i p i t c h ) T j   ( H Ar g a s ) 25 ° C
where H i p i t c h   is the total enthalpy of compound i in the pitch (either in isotropic liquid or in mesophase), H i g a s is the total enthalpy of volatile compound i either in condensable gas, i.e., low MW PAHs, or in non-condensable gas, i.e., methane and hydrogen at any given temperature and H A r g a s is the total enthalpy of argon at any given temperature and 1 atm. Enthalpy terms of the species in Equation (17) are determined using the obtained results from mass balance calculations, below and above the fixed threshold temperature, 350 °C (Table 5). The total enthalpy of argon in Equation (17) can be estimated using the molar enthalpy of pure argon at any given temperature and 1 atm and the number of moles of argon, which is dependent on the values of the carrier gas flow rate ( V ˙ A r ) and heating rate ( Q ˙ ) fixed in Section 2.2.4.
In Table 5, h i 0   are reference molar enthalpy for the pure components as isotropic liquid (either in iso or in mesophase), gas or semi-coke (coke), Δ h m i x   is the molar enthalpy of mixing of compounds in pitch as a solution and h o r i e n t is the enthalpy contribution of orientational free energy of mesophase [65,66]. The FactSageTM Thermochemical Software [68,69] with the data base of ref. [67], as described in Section 2.2.2, is used to compute the enthalpies of species i at any given temperature T, h i 0 ( T ) .
Thermodynamic theory for PAH solutions first proposed by Hu and Hurt [65] and improved in our previous work [66] is applied to calculate the enthalpy of mixing and orientation enthalpy terms for the isotropic phase and mesophase. The thermodynamic model for idealized coke crystallite developed by Ouzilleau et al. [64] can be utilized for estimation of the enthalpy of semi-coke (or coke) species.

2.4. Integrating the Model Equations for Estimation of Mass and Enthalpy Changes through the Primary Carbonization Process

A small mass of pitch with known composition ( n i p i t c h ) T 0 at room temperature   T 0 is considered as the initial conditions of the system in the following calculations. As most CTP is obtained during a quenching procedure of liquid by-product in a coke oven (see ref. [37,70] for more detail) from 400 °C to room temperature, we assume here that the state of the pitch at To is a glassy isotropic liquid. This assumption is reasonable since there is no evidence for the existence of crystal structure in CTP according to the XRD experiment results [71,72]. Considering the above defined threshold temperature of 350 °C, the calculation procedure for mass and enthalpy changes through CTP heat treatment is divided in two parts, below and above threshold temperature.
Calculations below 350 °C
Starting from room temperature, the number of moles of each compound in the pitch after increasing the temperature of the system by   Δ T , ( n i p i t c h ) T j + 1 , is determined using Equations (1)–(4) and (15-a). It was previously assumed that there is no chemical reaction occurring during these first steps of the process and only vaporization is taking place. The amount of the each volatile compound in the gas mixture, ( n i g a s ) T j + 1 , is determined by applying Equations (1)–(4) to each compound with respect to the model parameters ( ϕ i s) and the way to estimate it was noted in Section 2.2.4. However, combining Equations (1)–(4) yields X equations for X unknowns, the number of moles of X volatile compounds in the gas mixture. Solving these equations, numerically, results in amount of volatile PAHs at the given temperature. Summation over the amount of all species in the system at the given temperature results in total moles of the pitch ( n T p i t c h ) in that temperature:
n T p i t c h T j + 1 = i n i p i t c h T j + 1  
The result for the mass changes of the system due to increasing the temperature by   Δ T and the energy balance on the system (Equation (17) and Table 5) are applied to estimate the required energy for increasing the temperature of the pitch from   T j to   T j + 1 .
Calculations above 350 °C
Regarding the defined prototype reactions in Section 2.2.3, in the temperature range between 350 °C and 550 °C, when the mesophase, semi-coke and coke formations start, some new high MW and low MW PAHs, hydrogen and methane are produced due to thermal polymerization and cracking reactions. The degree of advancement of these reactions, which have been already determined as the model parameters in Section 2.2.4, controls the amount of the mass losses of either condensable (low MW PAHs) or non-condensable (hydrogen and methane) compounds through the process. However, the estimations of mass losses after 350 °C are limited to interval temperatures, 350–450 °C and 450–550 °C, since the degree of advancements of the reactions are limited in these ranges of temperature (Section 2.2.4). The degree of advancement of the defined prototype reactions (Equations (5)–(14) and Table 2 and Table 3) are used to determine the third term and later on right side of molar balance equation (Equation (15-b)) in order to estimate the mass of each species in the residual pitch after increasing the temperature of the system by   Δ T .
The obtained results for mass changes of residue pitch and amount of species removed from the pitch in mesophase and semi-coke (initial coke) formation steps (350–450 °C and 450–550 °C) as well as the defined energy balance in these temperature ranges (Equation (17) and Table 5) are applied to estimate the required energy for raising the temperature of the pitch from 350 to 450 °C and 450 to 550 °C, respectively.

3. Results and Discussion

Regarding the significance of the type of physical and chemical changes occurring during CTP primary carbonization on the properties of the final product of the process, i.e., carbon materials, the thermodynamic-kinetic model proposed in Section 2 was applied to perform quantitative analysis of these phenomena. In order to make a general investigation of the volatile matter emission rate through CTP heat treatment, a simplified system containing typical low, medium and high molecular weight PAHs available in CTP analyzed by Zhang et al. [57] was modeled. The variation of the evaporation rate of low MW molecules with temperature and the composition of the system was studied. Observations of mass losses during heat treatment of CTP from the thermo-gravimetric analysis (TGA) of Bouchard et al. [28] was modeled. A sensitivity analysis was performed to investigate the ability of the model to estimate the effect of some important parameters in the carbonization process on the quantity of emitted volatile matter. The variation of mass losses of low MW PAHs occurring during the process with heating rate, carrier gas flow rate, and saturation level of emitted gaseous species as real and internal variables of the model, respectively, were evaluated. The molecular weight distribution changes through mesophase and semi-coke formation steps of the carbonization process were calculated and consistent with Greinke’s investigation [47]. The energy required to increase the temperature of the pitch sample in Bouchard’s experiment from room temperature to 350 °C, which results in estimated mass losses in this temperature range, was calculated. Estimation of the enthalpy changes of pitch (with the aim of energy requirement analysis) through the carbonization process in the temperature range beyond 350 °C needs further research.

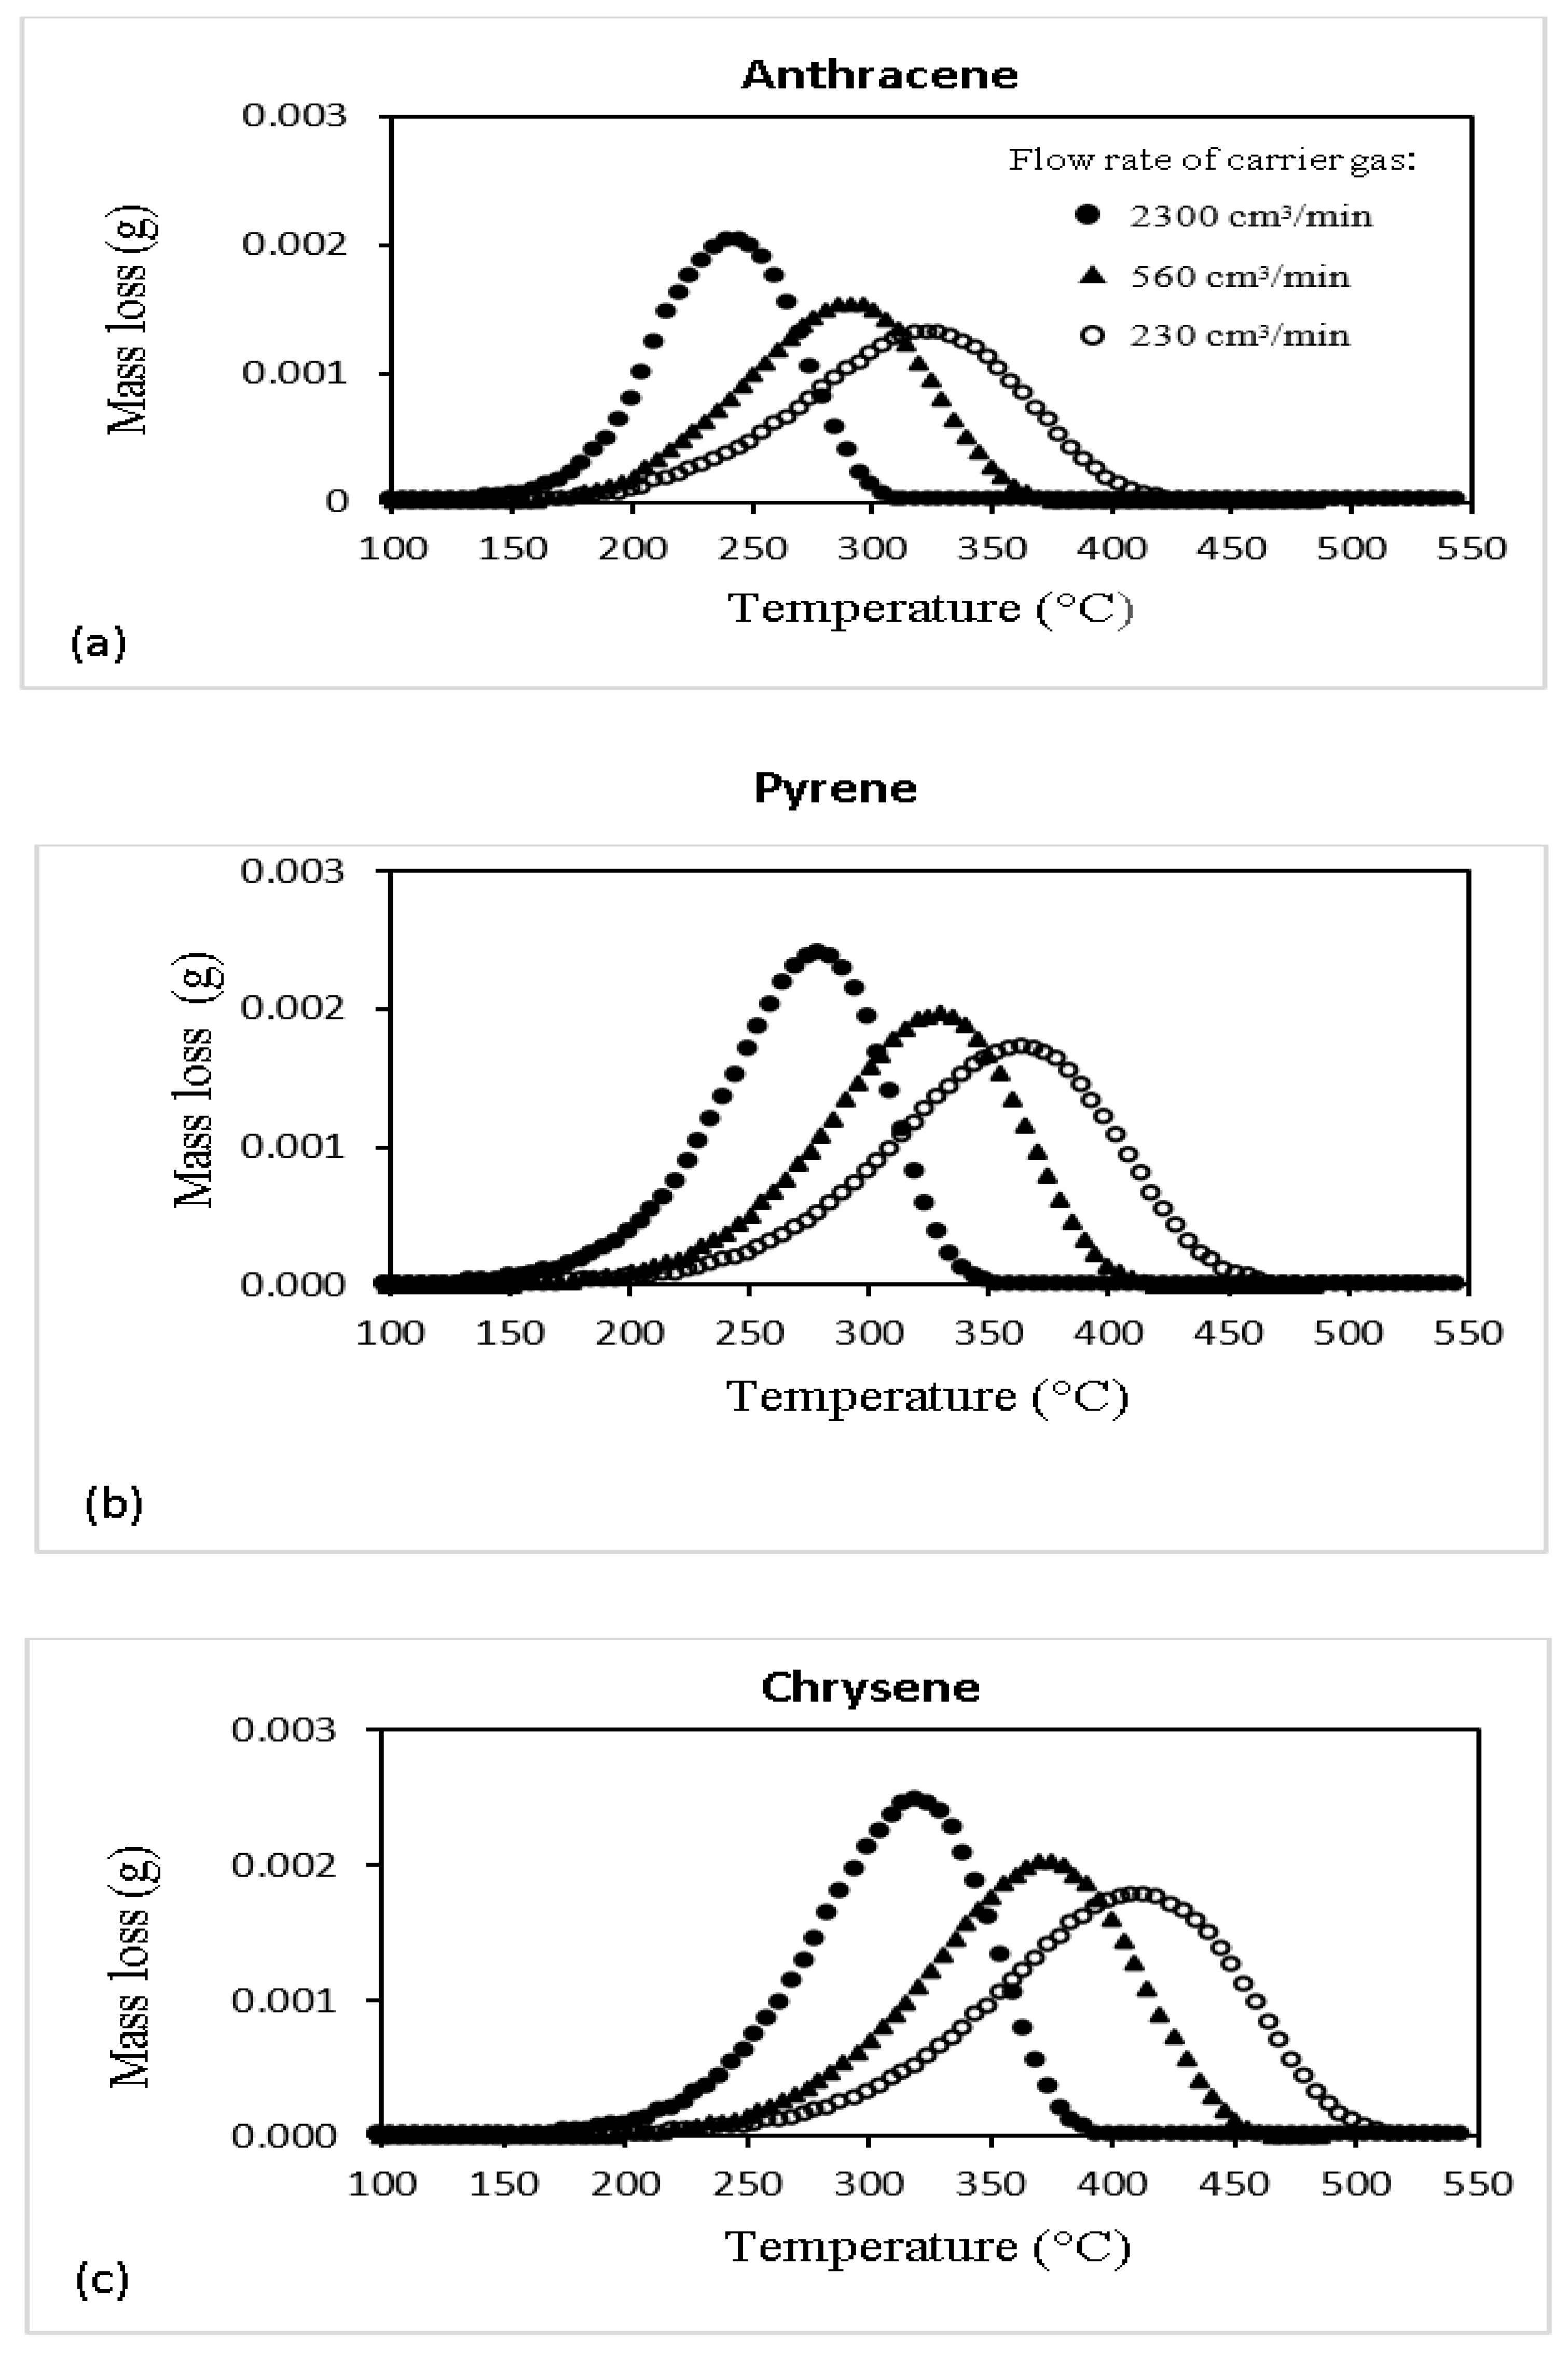
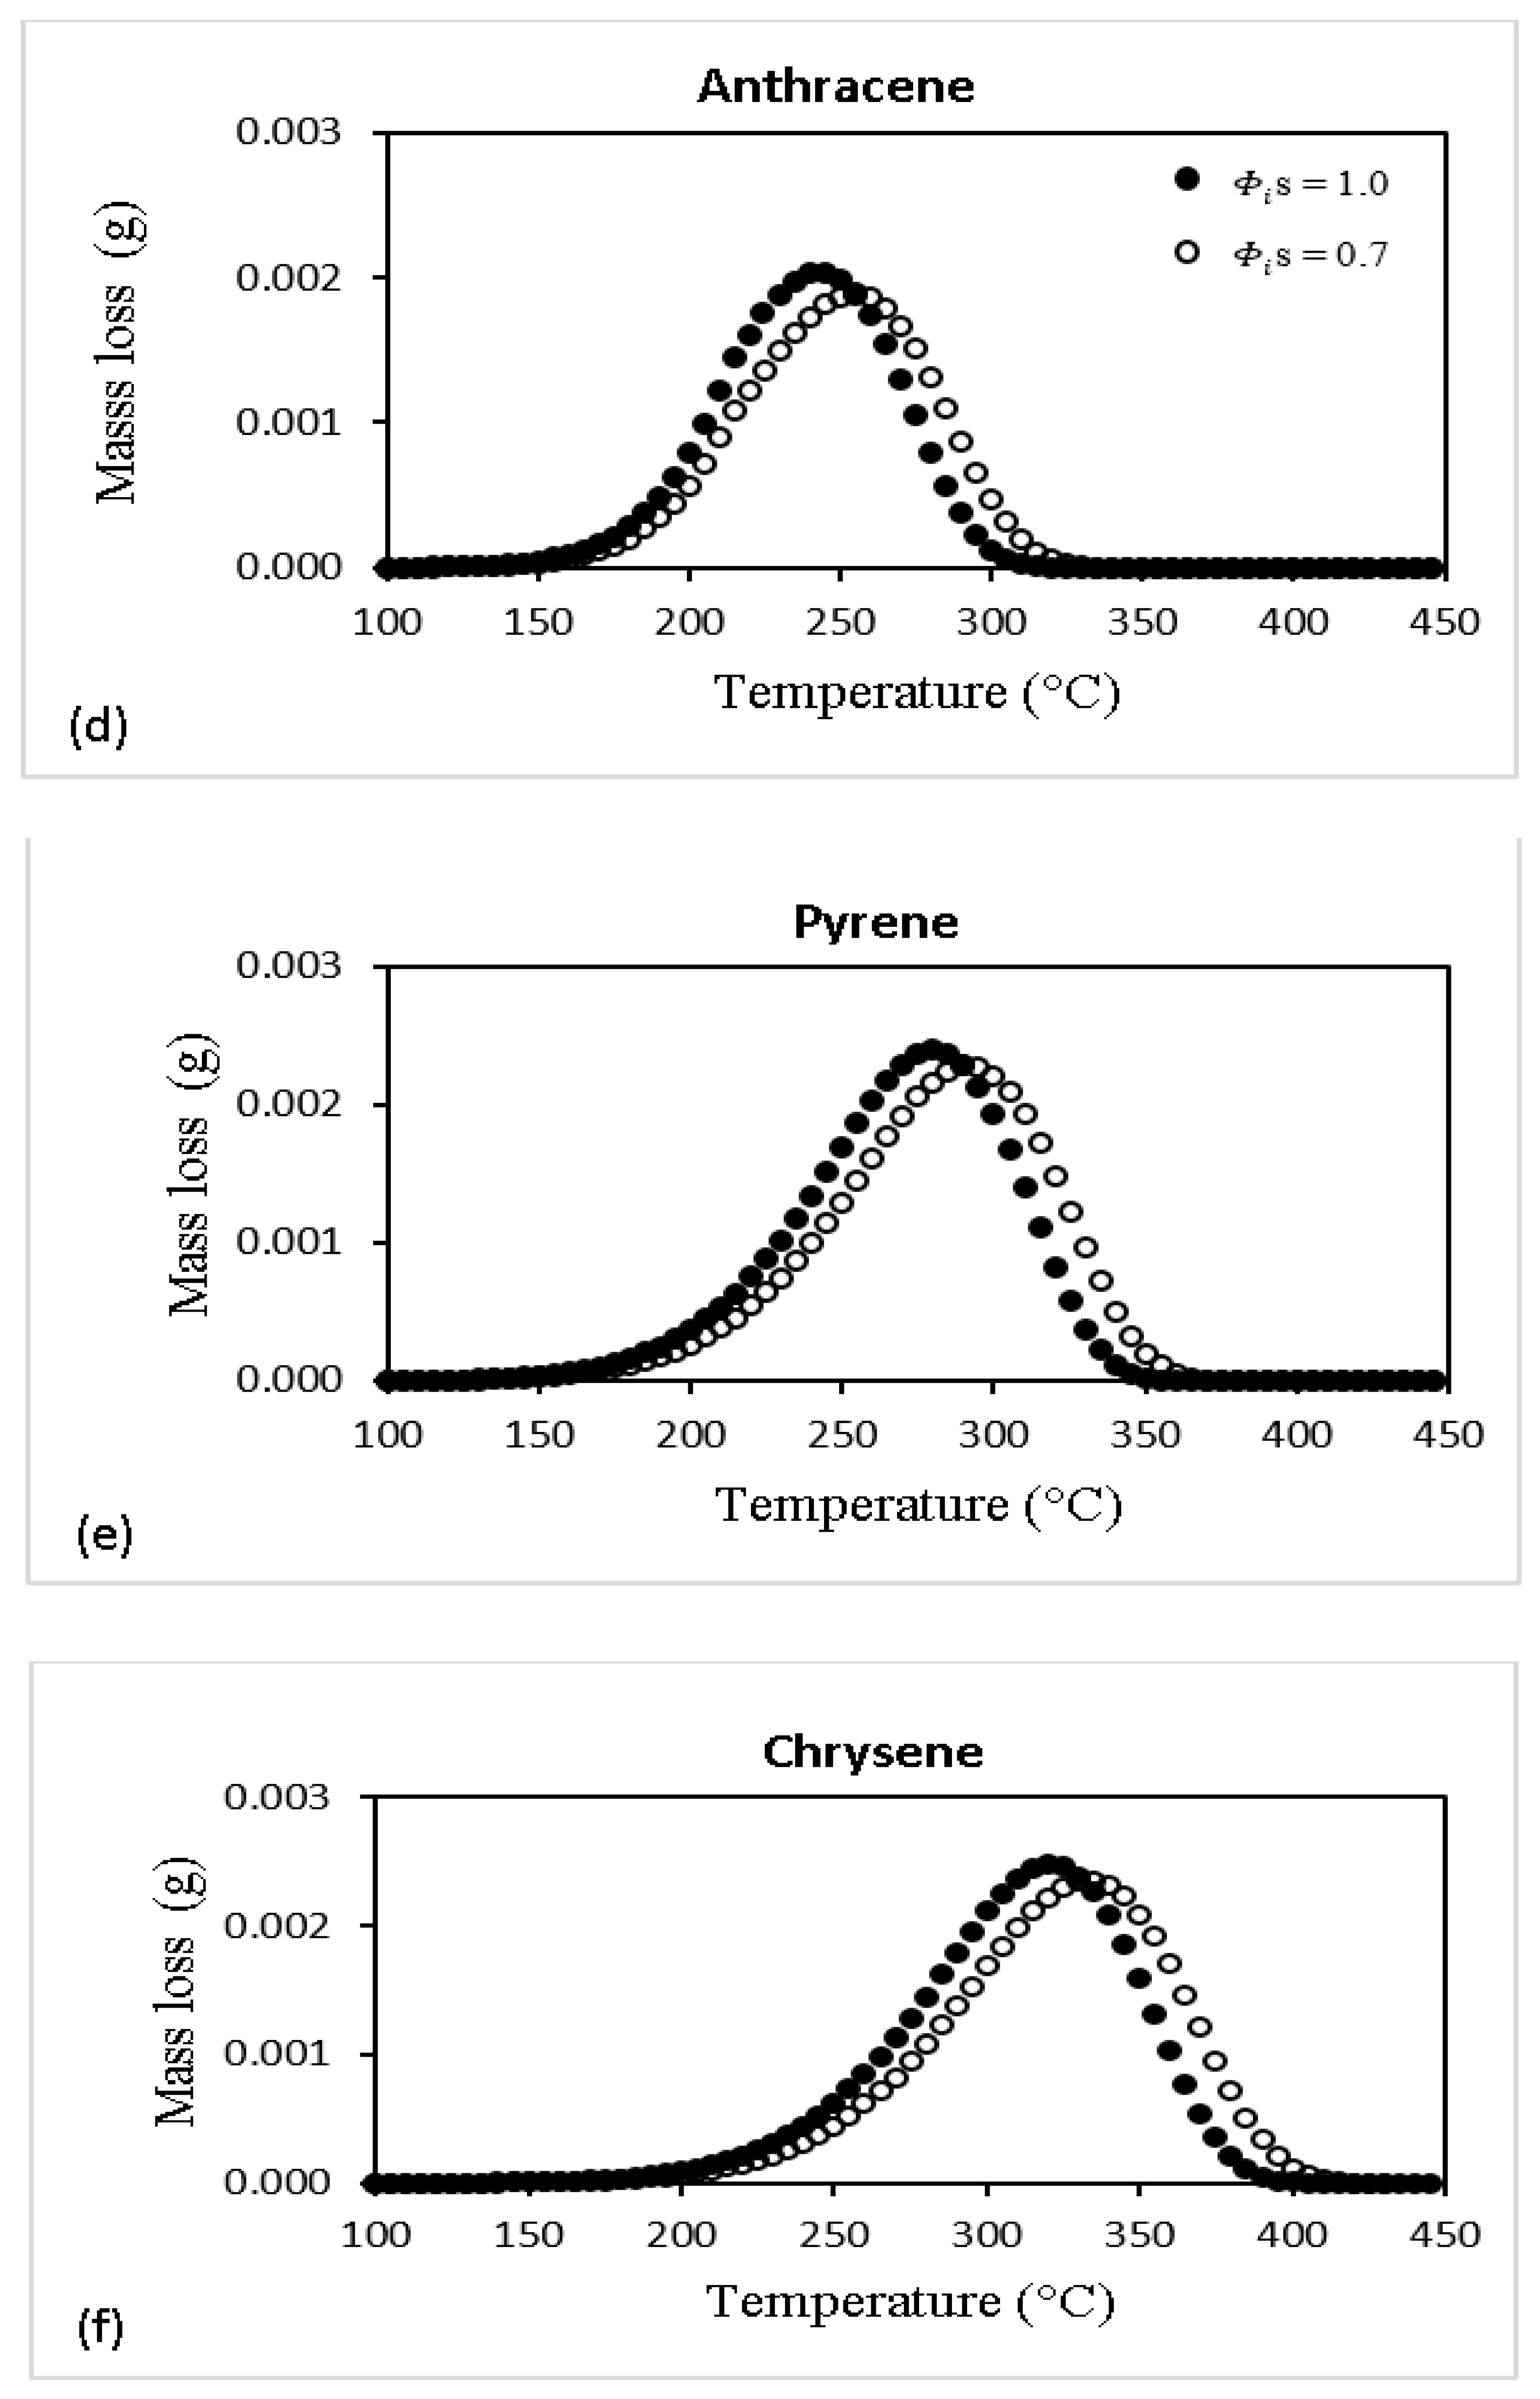
3.1. General Prediction of Gas Emission Rate during Heat Treatment of Coal Tar Pitch (below 350 °C)

With respect to the typical molecular weight distribution of coal tar pitch shown in Figure 1, a simplified pitch system containing a low molecular weight PAH, anthracene (MW: 178 g/mole), and some medium and high molecular weight PAHs (i.e., bi-coronene, tri-coronene and tetra-coronene) with MW 596, 892 and 1180 g/mole, respectively, is selected to be studied in this section. In order to simplify the studies, a binary phase diagram exhibiting the thermodynamic behavior of this pitch system (Figure 6) is generated by applying the proposed thermodynamic approach from our previous work [66].
The partial pressure of anthracene in the pitch system in the temperature range of 25–350 °C (either in one-phase or two-phase region) can be estimated by following the procedure explained in Section 2.2.2 and Section 2.4, assuming a near-equilibrium state during a given ΔT iteration. Indeed, calculating the chemical activity of anthracene in the above defined pitch solution (as a mixture of PAH compounds) using the approach developed in our previous work [66] with the aid of Equation (2) permits creation of the iso-partial- pressure lines of anthracene in Figure 6. These lines are the indicators of the emission rate of low molecular weight compounds in the system. The dashed lines and dash-dotted lines represent the iso-partial pressure of anthracene in single isotropic liquid, two-phase and metastable single-phase regions, respectively.
As seen in the figure, the partial pressure of low MW compounds through the constant temperature process will decrease if the system under study has a single isotropic liquid phase and will be the same when the system contains two phases in equilibrium, even though in this case the amount of the volatile compound decreases with increasing time. It takes more time to evaporate a same amount of this compound from the single isotropic phase system in an isothermal process, and the same is true in a heating process if the high viscosity isotropic liquid is maintained rather than an equilibrated high MW mesophase with a low MW isotropic liquid. This figure can be used to study the volatile PAHs emissions aspects of CTP heat treatment from room temperature to 350 °C (623K) when significant amount of the low MW PAHs are formed. According to the mass spectrum of typical CTP shown in Figure 1, there is a small amount of low MW PAH compounds, such as anthracene, in CTP containing PAHs with different molecular weights. Hence, the starting point of this study will be on the right side (anthracene-lean region) of Figure 6. A zoom view of the anthracene-lean region of Figure 6 is shown in Figure 7.
Meanwhile, it is considered that the assumed quenched structure of CTP at 25 °C (discussed in Section 2.4) is retained until 350 °C and the iso-meso equilibrium in pitch is kinetically prohibited in our model below 350 °C. Therefore, partial pressure changes of anthracene during heat treatment of CTP are evaluated by following the dash-dotted lines in Figure 6 in the anthracene-lean region which will be very different with the partial pressure of anthracene in a two-phase system. As the temperature of CTP increases and the evaporation of anthracene is progressing, CTP contains less anthracene. A schematic of composition changes in pitch with an initial mass of 50 g, which undergoes thermal treatment (by applying the heating rate of 50 °C/h and passing the carrier gas with flow rate of 560 cm3/min), is shown as a red solid line in Figure 7. As seen in the figure, this composition change results in substantial changes in the partial pressure of anthracene.

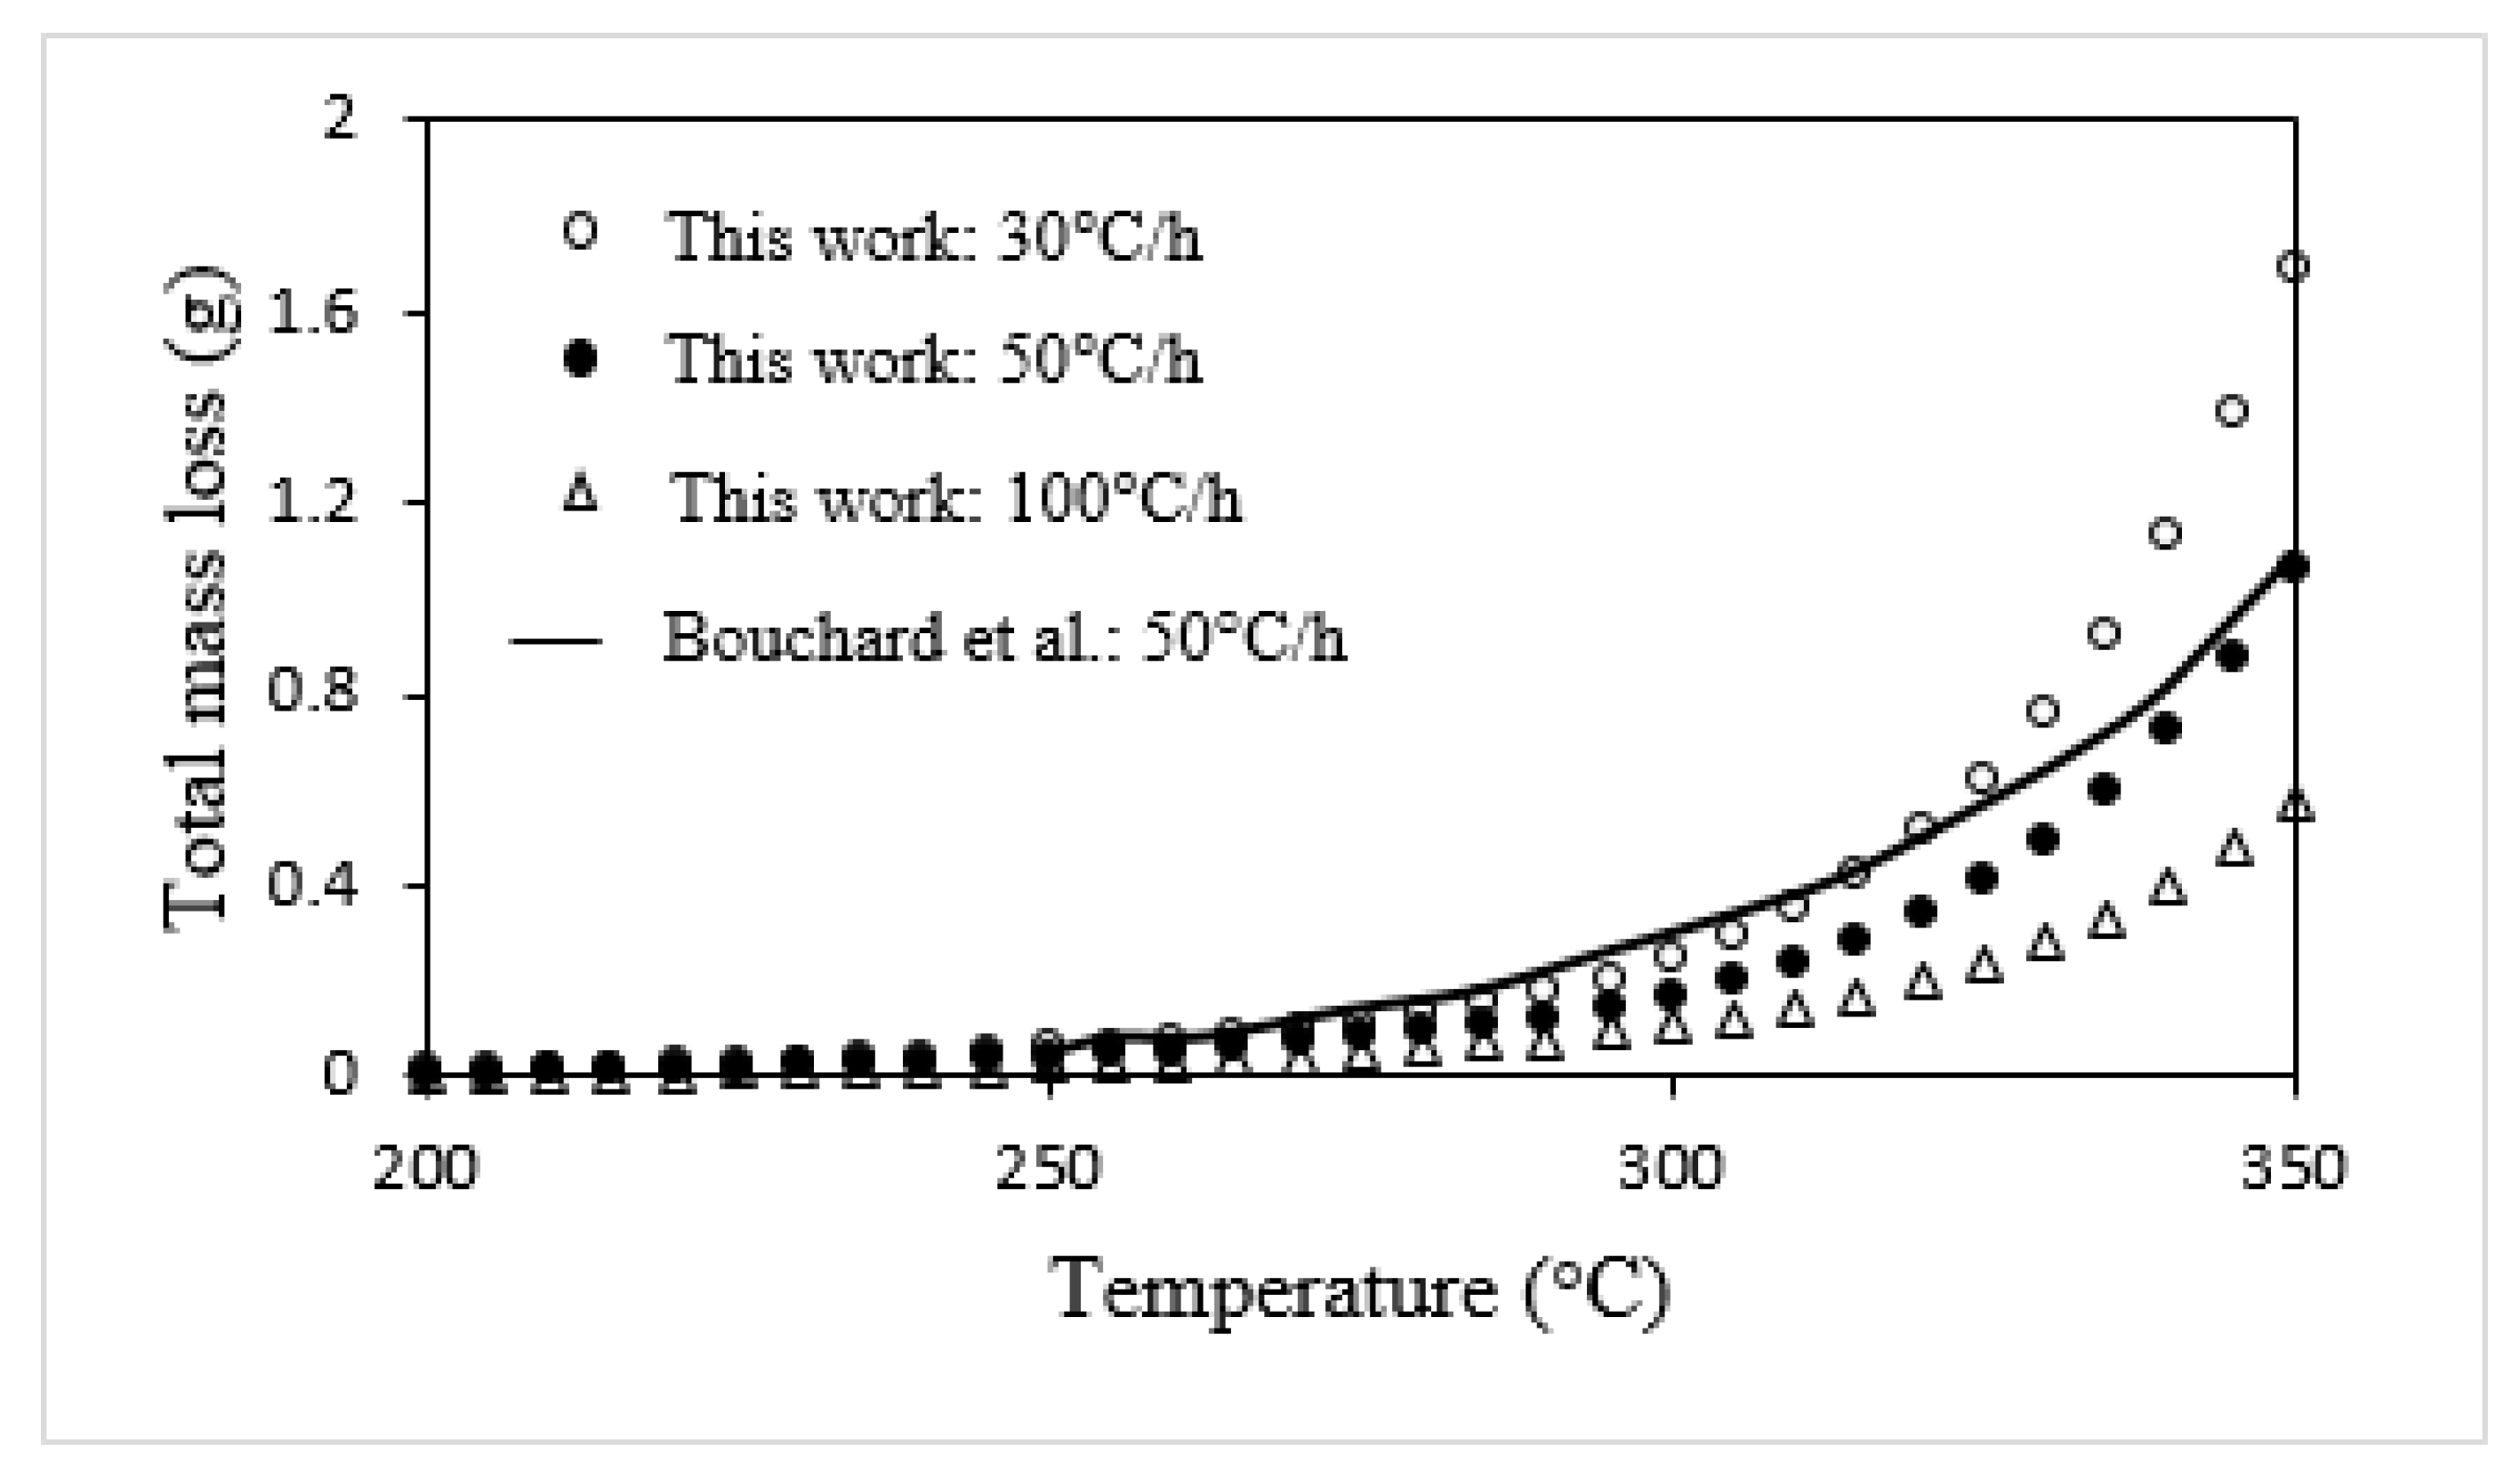
3.2. Application to Bouchard’s Experiments

Bouchard et al. [28] designed several experiments to study the mass loss of the pitches when they goes under the carbonization process. They measured and analyzed the condensable and non-condensable parts of the gaseous mixture released through the CTP heat treatment.
A 50 g mass of pitch containing PAHs from Table 1 is considered as the sample to be studied in this work. The type and quantity of PAHs in the sample (shown in Table 6) are chosen with respect to the MWD of the typical CTP analyzed and reported by Zhang (Figure 1). The criteria for choosing the 50 g mass of pitch is Bouchard’s experiments which were performed for this quantity of pitch. The heating rate of the CTP and the flow rate of the carrier gas in our calculations are fixed with respect to operating conditions of Bouchard’s experiments, at 50 °C/h and 2300 cm3/h (at 25 °C and 1atm), respectively.

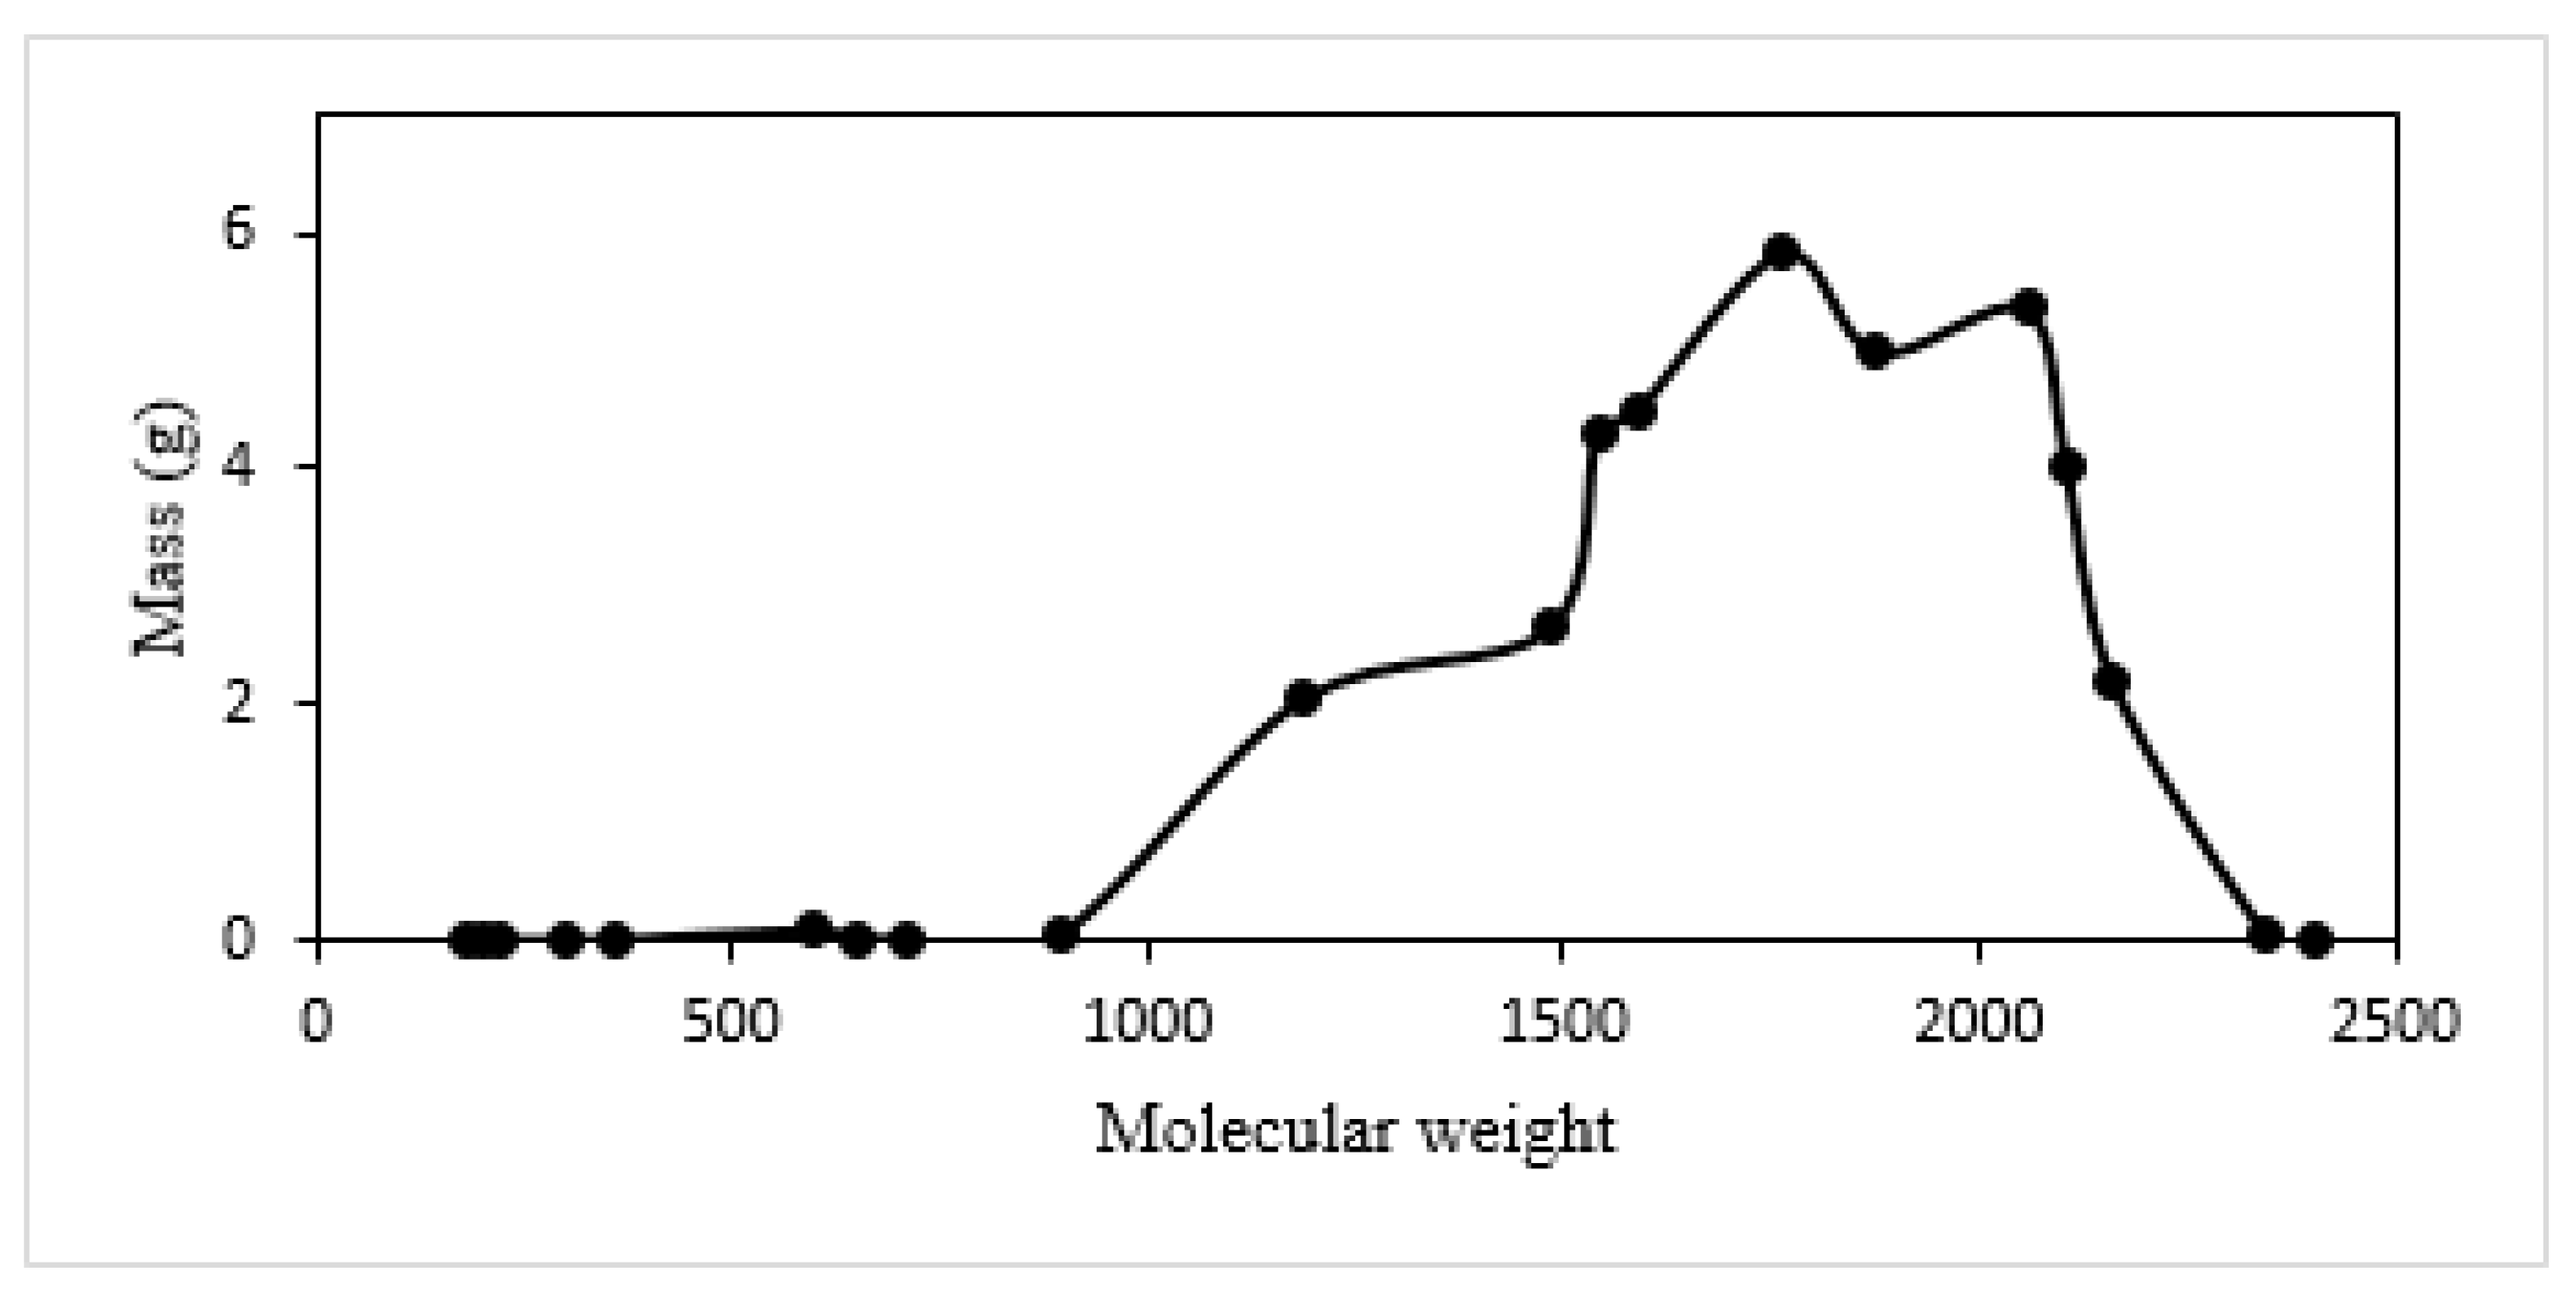
3.2.1. Estimation of Mass Changes of CTP (during Heat Treatment)

The calculations in this section are based on our choice of the threshold temperature of 350 °C (fixed in this work, Section 2.3) for the starting point of mesophase spheres formation. However, the model has the flexibility to be used with another threshold temperature (in the range of 300–400 °C) based on own experimental data.
The total amount of emitted volatile PAHs in the first step of heat treatment (25 to 350 °C) was estimated applying the proposed approach described in Section 2.2.2 and Section 2.4 (considering ∆T = 5 °C in the calculations). Experimental data for total mass loss during this step of the process obtained by Bouchard et al. [28] is utilized to determine the model parameters ( Δ i s ), as described in Section 2.2.4. A strength of the proposed model is that the emission of volatile compounds is predictable even at low temperatures. By setting the reasonable values of the saturation level coefficients for all volatile species (in this case equal to 1), the model can estimate the trend of the total amount of PAHs lost with temperature which has good agreement with observation of Bouchard et al. in their experiments (Figure 8).
As shown in Figure 8, the heating rate affects the residence time of pitch at each temperature and consequently on emission of volatile matter. However, a sensitivity analysis will be helpful to study (in detail) the effect of heating rate as well as flow rate of carrier gas on the mass loss of volatile matters during CTP heat treatment and will be discussed as follows.
In this section, mass losses of each volatile PAH compound has been estimated every 5 °C (between 25 and 350 °C) assuming full equilibrium (by setting ϕ i s for all volatile species equal to 1 in Equation (1-b)) at every temperature interval and with no constraints for diffusion of volatile matter to the carrier gas.
The carrier gas flow rate affects the evaporation rate of each volatile PAH, with significant volatility. As seen in Figure 9a–c, with a higher carrier gas flow rate, the total mass losses of volatile compounds take place in a more narrow and lower range of temerature. Changes of pitch composition due to evaporation of anthracene occuring during thermal treatment of the pitch sample, which is assumed to be single-phase isotropic liquid in temperature range of 25–350 °C, in different flow rates of carrier gas are shown on zoom view of the anthracene-lean region, Figure 7. As shown in Figure 10, the evaporation paths of anthracene are affected by the flow rate of the carrier gas: the higher the flow rate of carrier gas, the higher is the evaporation rate of anthracene.
In order to evaluate the heating rate effect on mass losses, the calculations for estimation of changes in mass loss of each volatile PAH with temperature have been performed for two different heating rates, 50 and 100 °C/h. As shown in Figure 11a–c, as the heating rate decreases, release of volatile matter is taking place at lower temperatures. On the other hand, when the heat treatment of CTP is performed with a higher heating rate, the system is further away from the equilibrium state. Thus, consideration has to be given to an optimal heating rate for CTP carbonization. In an industrial case, researchers found that the heating rate in an anode baking furnace in the aluminum industry should not exceed 10 to 14 °C/h between 200 and 600 °C [73,74].
Changing the ϕ i s values for each volatile species, as the extremely simple kinetic model parameter, to less than 1 (in the previous calculations) enables us to estimate the behavior of a system with conditions closer to the equilibrium state (Figure 11d–f). These figures show the variation of mass loss of three volatile compounds (e.g., anthracene, pyrene and chrysene) with temperature by setting two different values of ϕ i s (0.7 or 1) but equal for all volatile species in each calculation.
The next step of CTP primary carbonization (350–450 °C), where the mesophase formation starts, has been modeled based on the procedure defined in Section 2.2.3 by arranging the prototype oligomerization reactions between available reactive PAHs and thermal cracking reactions listed in Table 2.
The degree of advancement of prototype reactions as model parameters are determined by following the explanations in Section 2.2.4 and using available experimental data (obtained by Bouchard [28]) for the amount of condensable (volatile PAH) and non-condensable (H2 and CH4) matter released in this range of temperature. In the present work, these model parameters has been only determined for carbonization treatment with 50 °C/h heating rate, given the limited range of Bouchard’s experiments. Calculations of the amount of volatile matters emitted from the 50 g mass coal tar pitch sample during the mesophase formation step of heat treatment as well as the MWD of the pitch residue, shown in Figure 12 and Figure 13, respectively, are comparable with the experimental data of Bouchard and the trend of MWD changes in the investigations by Greinke [47] (seen in Figure 2).
Modeling of semi-coke and coke formation steps (450–550 °C) is performed by arranging the prototype polymerization reactions proposed in Table 3. The values as measured by Bouchard for the amount of released condensable (volatile PAH) and non-condensable (H2 and CH4) matter in this range of temperature are used as the criteria to fit the reaction rates and model parameters in this step. The calculated mass loss either by volatilization of produced low MW PAHs due to thermal cracking or emission of hydrogen and methane through dehydrogenation reactions and thermal cleavage of side chains from aromatic rings are shown in Figure 14. The calculated MWD of CTP at the end of semi-coke formation as shown in Figure 15 is consistent with that obtained by Greinke [47]. Figure 16 shows MWD at 550 °C when the initial plane of coke is built up.
It is important to point out that the proposed model can be applied to estimate the mass loss of CTP during the primary carbonization by using any available set of experimental data, not necessarily Bouchard’s data, to calibrate the model and following the overall procedure defined above (with some changes in certain aspects of the model).

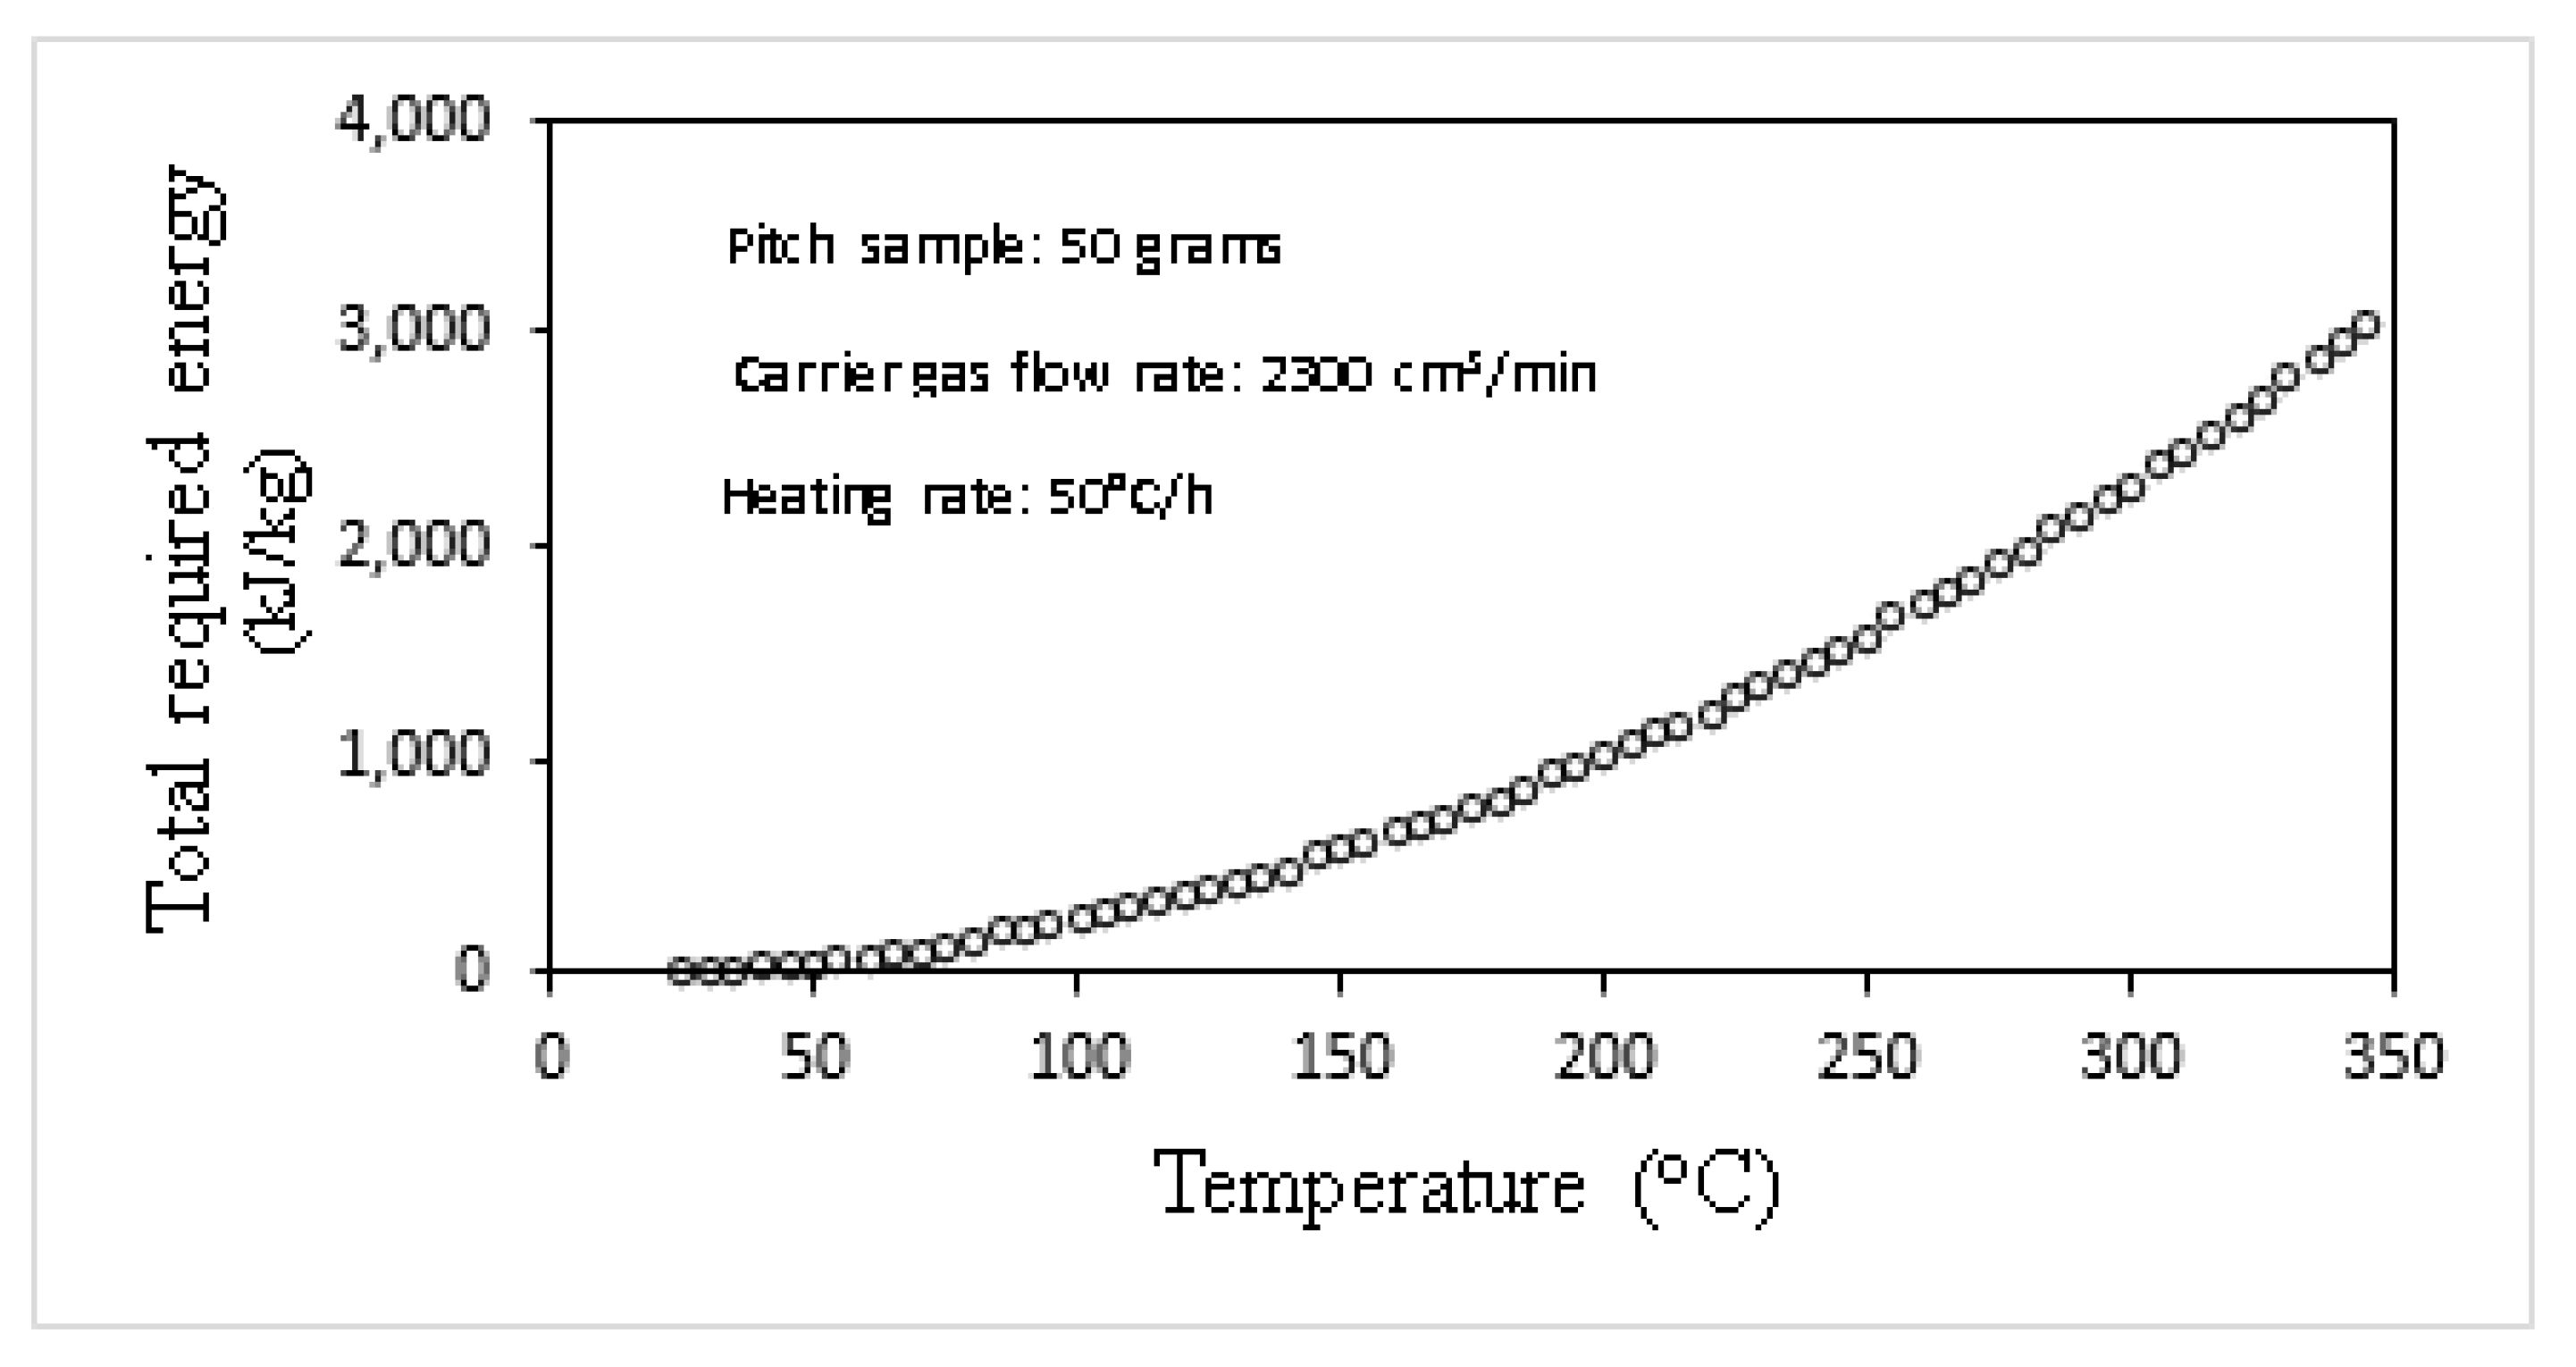
3.2.2. Estimation of Energy Requirement of Different Steps of CTP Primary Carbonization

The energy required in the first step of CTP heat treatment (25 to 350 °C) can be calculated by following the procedure explained in Section 2.3 and Section 2.4 . This energy is required both to increase the temperature of pitch to any given temperature and to match the mass changes at that temperature estimated in Section 3.2.2. Starting with a 50 g sample of CTP (MWD shown in Table 6) at room temperature, calculated total required energy at any given temperature in the range of 25–350 °C is presented in Figure 17. The results obtained in Section 3.2.1 for mass changes of CTP with temperature (every 5 °C) have been used in this calculation.
Calculation of required energy in next steps of CTP heat treatment (beyond 350 °C) needs the estimation of the enthalpies of large PAHs oligomer species and semi-coke crystallite appearing during mesophase and semi-coke formation steps, respectively, which are associated with following constraints:
In the present work, estimation of the enthalpies of any PAHs is based on critical assessment presented in our previous work [67]. In this reference, due to the lack of experimental data, the application of the developed model to estimate the thermodynamic properties of PAH oligomers has only been justified for a limited number of PAH oligomers.
As was proposed in Section 2.3, the enthalpy of semi-coke crystallite (needed for the required energy calculation in semi-coke formation step in temperature range 450–550 °C) can be estimated by applying the model developed for coke by Ouzilleau et al. In their model, perfectly parallel planes (shown in Figure 4) with enthalpy of stacking of zero are assumed in Gibbs energy calculations. However, some issues have to be taken into account in switching from the formalism of estimation of enthalpy of the large planes of oligomer PAHs (established in ref. [67]) in mesophase formation step to Ouzilleau’s formalism for enthalpy estimation of the idealized crystallite structure in the semi-coke formation step. In other words, transforming such a large plane of high MW PAH oligomers to idealized semi-coke crystallite (satisfying Ouzilleau’s model) requires energies to bring them to the configuration shown in Figure 4 and to parallelize them.
However, in the present work, calculation of the required energy for the CTP primary carbonization process above 350 °C, where the model faces the limitations mentioned above, has not been presented and is left for future works.

4. Conclusions

For the first time, mass and energy changes of coal tar pitch occurring during the primary carbonization process can be estimated by applying the present thermodynamic-kinetic model. Model estimations on mass losses of CTP in different steps of primary carbonization, i.e., vaporization, mesophase and semi-coke formation steps, are in good agreement with corresponding experimental data. An innovation of the current work is that it can predict the emission of volatile compounds even at low temperatures. The proposed model is able to evaluate the partial pressure changes of emitted low MW PAHs during heat treatment of the typical CTP. For the first time, molecular weight distribution changes of residual pitch through thermal treatment (up to 550 °C) of CTP are estimated using a thermodynamic-kinetic model, proposed in this work, and are consistent with those found experimentally by utilizing gel permission chromatography techniques. The strength and innovation of the present work for theoretical evaluation of the effect of the important parameters during carbonization of pitch, such as the heating rate of the pitch and the flow rate of the carrier gas, on the emission rate of volatile matter has been demonstrated. The present model was applied to calculate the enthalpy changes of coal tar pitch (with the aim of process energy requirement calculations) in early stages of the primary carbonization process, below 350 °C. Comments were offered on the complexity of estimating the enthalpy changes of residual pitch during mesophase and semi-coke formation as part of CTP carbonization, above 350 °C.
Clearly, due to the complex nature of CTP and the primary carbonization process, some hypotheses and simplifications were needed to make the modelling of the process possible, which resulted in a certain number of limitations and weaknesses in the present model as follows:
The first limitation relates to neglecting the role played by impurities, such as sulfur, nitrogen, and oxygen, as well as non-PAHs (heterocyclic compounds) which are usually found in CTP, in the carbonization process. It has been well established that the intermediate and final products of the primary carbonization, i.e., mesophase and semi-coke, are composed of polyaromatic molecules mutually cross-linked by a medium composed of carbon functions containing heteroatoms (e.g., sulfur and oxygen) which enter the process through impurities and (or) heterocyclic compounds in the pitches [37]. Indeed, in the present model the effect of the ratio of cross-linking heteroatoms (e.g., sulfur, nitrogen and oxygen) to hydrogen atoms of precursor carbon materials (CTP in this work) on the efficiency of the primary carbonization and the quality of the final product was ignored by neglecting the presence of the impurities and heterocyclic compounds in coal tar pitch. Hence, one aspect that will be treated in future work is development of a more appropriate model to predict the physical and chemical evolutions occurring during primary carbonization of any source of CTP containing heteroatoms.
In the mass and energy balance calculations, the temperature of the condensed pitch was assumed to become equal and uniform in all directions instantaneously at each iteration after increasing the temperature of the pitch by a heat treatment. This assumption is not compatible with what really happens in industrial processes. Thus, it is recommended to improve the predictive capacity of the present model by considering adequate heat transfer equations for the calculation of temperature gradients in condensed pitch.
Only one set of experimental data (Bouchard’s experiments) was found in the literature to calibrate the model. Although the model developed seems to be versatile enough to reproduce the experimental data for the heat treatment of different types of CTP in different operating conditions, it is recommended to design and run a certain number of experiments reporting the changes of both the mass of pitch residue and the composition of volatile species throughout CTP primary carbonization in order to extend the application of the proposed model to predict different experimental data sets.
The paucity of experimental data made it difficult to assess the uncertainties associated with the process energy requirement calculations in the 25–350 °C temperature range. Performing some CTP heat treatment experiments in order to generate a data set including energy consumption of different steps of the primary carbonization process for model justification purposes is recommended.
The discussion in Section 3.2.2 presented the weakness of the present model as regards estimation of the enthalpy changes of residual pitch during the mesophase and semi-coke formation steps of the primary carbonization process. Hence, another important aspect of future work is to extend the present model so that it can be applied to calculate the required energy for heat treatment of CTP beyond 350 °C.
In the longer term, the developed thermodynamic-kinetic model will serve as the basis for future work to simulate any industrial process (such as anode baking, cathode production, and ramming paste processes in aluminum industries) in which primary carbonization is involved.

Author Contributions

Conceptualization, M.S.H. and P.C.; methodology, M.S.H.; software, M.S.H.; validation, M.S.H. and P.C.; formal analysis, M.S.H. and P.C.; investigation, M.S.H.; resources, P.C.; data curation, M.S.H.; writing—original draft preparation, M.S.H.; writing—review and editing, P.C.; supervision, P.C.; project administration, P.C.; funding acquisition, P.C. All authors have read and agreed to the published version of the manuscript.

Funding

This research was funded by the Natural Sciences and Engineering Research Council of Canada, Grant NSERC CRDPJ-469982-14 with Alcoa, Constellium, Hydro Aluminium and Rio Tinto.

Data Availability Statement

Not applicable.

Acknowledgments

This project was supported by the Natural Sciences and Engineering Research Council of Canada, Alcoa, Hydro Aluminium, Rio Tinto and Constellium.

Conflicts of Interest

The authors declare no conflict of interest.

References

  1. Banerjee, C.; Chandaliya, V.K.; Dash, P.S. Recent advancement in coal tar pitch-based carbon fiber precursor development and fiber manufacturing process. J. Anal. Appl. Pyrolysis 2021, 158, 105272. [Google Scholar] [CrossRef]
  2. Barbouche, M.; Hajji, M.; Ezzaouia, H. Electric arc furnace design and construction for metallurgical and semiconductor research. Int. J. Adv. Manuf. Technol. 2016, 82, 997–1006. [Google Scholar] [CrossRef]
  3. Chen, Z.; Ma, W.; Li, S.; Wu, J.; Wei, K.; Yu, Z.; Ding, W. Influence of carbon material on the production process of different electric arc furnaces. J. Clean. Prod. 2018, 174, 17–25. [Google Scholar] [CrossRef]
  4. Edwards, L. The history and future challenges of calcined petroleum coke production and use in aluminum smelting. JOM 2015, 67, 308–321. [Google Scholar] [CrossRef] [Green Version]
  5. Fitzer, E. The future of carbon-carbon composites. Carbon 1987, 25, 163–190. [Google Scholar] [CrossRef]
  6. García, R.; Crespo, J.L.; Martin, S.C.; Snape, C.E.; Moinelo, S.R. Development of mesophase from a low-temperature coal tar pitch. Energy Fuels 2003, 17, 291–301. [Google Scholar] [CrossRef]
  7. Gasik, M.M.; Gasik, M.I. Smelting of Aluminum. In Handbook of Aluminum; Marcel Dekker, Inc.: New York, NY, USA, 2003; pp. 47–79. [Google Scholar]
  8. Jin, S.; Jiang, Y.; Ji, H.; Yu, Y. Advanced 3D current collectors for lithium-based batteries. Adv. Mater. 2018, 30, 1802014. [Google Scholar] [CrossRef]
  9. Radenovic, A. Properties of carbon anode components for aluminium production. NAFATA 2012, 63, 111–114. [Google Scholar]
  10. Kvande, H. The aluminum smelting process. J. Occup. Environ. Med. 2014, 56 (Suppl. 5), S2. [Google Scholar] [CrossRef] [Green Version]
  11. Kvande, H.; Drabløs, P.A. The aluminum smelting process and innovative alternative technologies. J. Occup. Environ. Med. 2014, 56 (Suppl. 5), S23. [Google Scholar] [CrossRef] [Green Version]
  12. Lavin, J.G. Chemical reactions in the stabilization of mesophase pitch-based carbon fiber. Carbon 1992, 30, 351–357. [Google Scholar] [CrossRef]
  13. Liu, J.; Chen, X.; Liang, D.; Xie, Q. Development of pitch-based carbon fibers: A review. Energy Sources Part A Recovery Util. Environ. Eff. 2020, 1–21. [Google Scholar] [CrossRef]
  14. Martín, Y.; García, R.; Keating, P.; Snape, C.E.; Moinelo, S.R. A study of the polymerization and condensation reactions during the heat treatment of pitches under gas-blowing conditions. Energy Fuels 2000, 14, 380–392. [Google Scholar] [CrossRef]
  15. Reverdy, M.; Potocnik, V. History of Inventions and innovations for aluminum production. In TMS 2020 149th Annual Meeting & Exhibition Supplemental Proceedings; Springer: Cham, Switzerland, 2020. [Google Scholar]
  16. Song, C.; Schobert, H.H. Opportunities for developing specialty chemicals and advanced materials from coals. Fuel Process. Technol. 1993, 34, 157–196. [Google Scholar] [CrossRef]
  17. Tabereaux, A.T.; Peterson, R.D. Aluminum production. In Treatise on Process Metallurgy; Elsevier: Amsterdam, The Netherlands, 2014; pp. 839–917. [Google Scholar]
  18. Tajik, A.R.; Shamim, T.; Al-Rub, R.K.A.; Zaidani, M. Performance analysis of a horizontal anode baking furnace for aluminum production. In Proceedings of the ICTEA: International Conference on Thermal Engineering, Muscat, Oman, 26–28 February 2017. [Google Scholar]
  19. Tajik, A.R.; Shamim, T.; Ghoniem, A.F.; Abu Al-Rub, R.K. The impact of critical operational parameters on the performance of the aluminum anode baking furnace. J. Energy Resour. Technol. 2021, 143, 062103. [Google Scholar] [CrossRef]
  20. Vohler, O. Carbon and graphite in future markets. Erdöl Kohle Erdgas Petrochem. 1986, 39, 561. [Google Scholar]
  21. Wang, Y.; Chen, K. Low-cost, lightweight electrodes based on carbon fibers as current collectors for aluminum-ion batteries. J. Electroanal. Chem. 2019, 849, 113374. [Google Scholar] [CrossRef]
  22. Wazir, A.H.; Kakakhel, L. Preparation and characterization of pitch-based carbon fibers. New Carbon Mater. 2009, 24, 83–88. [Google Scholar] [CrossRef]
  23. Wilson, W.S.; Guichelaar, P.J. Electric arc furnace processes. In Carbide, Nitride and Boride Materials Synthesis and Processing; Springer: Dordrecht, Germany, 1997; pp. 131–136. [Google Scholar]
  24. Winter, M.; Wrodnigg, G.H.; Besenhard, J.O.; Biberacher, W.; Novák, P. Dilatometric investigations of graphite electrodes in nonaqueous lithium battery electrolytes. J. Electrochem. Soc. 2000, 147, 2427. [Google Scholar] [CrossRef]
  25. Zhu, J.; Park, S.W.; Joh, H.I.; Kim, H.C.; Lee, S. Preparation and characterization of isotropic pitch-based carbon fiber. Carbon Lett. 2013, 14, 94–98. [Google Scholar] [CrossRef] [Green Version]
  26. Lewis, I. Chemistry of pitch carbonization. Fuel 1987, 66, 1527–1531. [Google Scholar] [CrossRef]
  27. Lewis, I.; Singer, L. Carbonization of aromatic hydrocarbons. [18 refs]. Am. Chem. Soc. Div. Fuel Chem. Prepr. 1969, 13, 86–100. [Google Scholar]
  28. Bouchard, N. Pyrolyse de Divers Brais Utilisés Dans la Technologie Söderberg et Analyse des Matières Volatiles; Université du Québec à Chicoutimi: Quebec, QC, Canada, 1998. [Google Scholar] [CrossRef]
  29. Dumont, M.; Dourges, M.A.; Bourrat, X.; Pailler, R.; Naslain, R.; Babot, O.; Birot, M.; Pillot, J.P. Carbonization behaviour of modified synthetic mesophase pitches. Carbon 2005, 43, 2277–2284. [Google Scholar] [CrossRef]
  30. Oumarou, N.; Kocaefe, D.; Kocaefe, Y.; Morais, B. Transient process model of open anode baking furnace. Appl. Therm. Eng. 2016, 107, 1253–1260. [Google Scholar] [CrossRef]
  31. Lewis, I. Thermal polymerization of aromatic hydrocarbons. Carbon 1980, 18, 191–196. [Google Scholar] [CrossRef]
  32. Lewis, I. Chemistry of carbonization. Carbon 1982, 20, 519–529. [Google Scholar] [CrossRef]
  33. Lewis, I. Chemistry and development of mesophase in pitch. J. Chim. Phys. 1984, 81, 751–758. [Google Scholar] [CrossRef]
  34. Lewis, I.; Singer, L. Carbonization of Aromatic Hydrocarbons. In Abstracts of Papers of the American Chemical Society; American Chemical Society: Washington, DC, USA, 1969; p. 20036. [Google Scholar]
  35. Lewis, I.; Singer, L. Thermal Conversion of Polynuclear Aromatic Compounds to Carbon. In Advances in Chemistry; ACS Publications: Washington, DC, USA, 1988. [Google Scholar]
  36. Oberlin, A. Carbonization and graphitization. Carbon 1984, 22, 521–541. [Google Scholar] [CrossRef]
  37. Oberlin, A.; Bonnamy, S. Colloidal and Supramolecular Aspects. Chem. Phys. Carbon 1999, 26, 1. [Google Scholar]
  38. Oberlin, A.; Bonnamy, S. Carbonization and graphitization. In Graphite and Precursors; CRC Press: Boca Raton, FL, USA, 2001; pp. 199–220. [Google Scholar]
  39. Oshida, K.; Bonnamy, S. Primary carbonization of an anisotropic ‘mesophase’pitch compared to conventional isotropic pitch. Carbon 2002, 40, 2699–2711. [Google Scholar] [CrossRef]
  40. Brooks, J.; Taylor, G. The formation of graphitizing carbons from the liquid phase. Carbon 1965, 3, 185–193. [Google Scholar] [CrossRef]
  41. Brooks, J.D.; Taylor, G. The formation of some graphitizing carbons. Chem. Phys. Carbon 1968, 4, 243–286. [Google Scholar]
  42. Taylor, G. Development of optical properties of coke during carbonization. Fuel 1961, 40, 465–472. [Google Scholar]
  43. Marsh, H. Carbonization and liquid-crystal (mesophase) development: Part 1. The significance of the mesophase during carbonization of coking coals. Fuel 1973, 52, 205–212. [Google Scholar] [CrossRef]
  44. Franklin, R.E. The structure of graphitic carbons. Acta Crystallogr. 1951, 4, 253–261. [Google Scholar] [CrossRef]
  45. Franklin, R.E. Crystallite growth in graphitizing and non-graphitizing carbons. Proc. R. Soc. London Ser. A Math. Phys. Sci. 1951, 209, 196–218. [Google Scholar]
  46. Cottinet, D.; Couderc, P.; Saint Romain, J.L.; Dhamelincourt, P. Raman microprobe study of heat-treated pitches. Carbon 1988, 26, 339–344. [Google Scholar] [CrossRef]
  47. Greinke, R. Kinetics of petroleum pitch polymerization by gel permeation chromatography. Carbon 1986, 24, 677–686. [Google Scholar] [CrossRef]
  48. Greinke, R. Early Stages of Petroleum Pitch Carbonization—Kinetics and Mechanisms. Chem. Phys. Carbon 1994, 24, 1. [Google Scholar]
  49. Greinke, R.; Lewis, I. Carbonization of naphthalene and dimethylnaphthalene. Carbon 1984, 22, 305–314. [Google Scholar] [CrossRef]
  50. Greinke, R.; Singer, L. Constitution of coexisting phases in mesophase pitch during heat treatment: Mechanism of mesophase formation. Carbon 1988, 26, 665–670. [Google Scholar] [CrossRef]
  51. Tillmanns, H. Carbonization and coke characterization. In ACS Symposium Series; American Chemical Society: Washington, DC, USA, 1986. [Google Scholar] [CrossRef]
  52. Ouzilleau, P.; Gheribi, A.E.; Chartrand, P.; Soucy, G.; Monthioux, M. Why some carbons may or may not graphitize? The point of view of thermodynamics. Carbon 2019, 149, 419–435. [Google Scholar] [CrossRef]
  53. Riggs, D.; Diefendorf, R. A phase diagram for pitches. Carbon 1980, 80, 326–329. [Google Scholar]
  54. Shishido, M.; Inomata, H.; Arai, K.; Saito, S. Application of liquid crystal theory to the estimation of mesophase pitch phase transition behavior. Carbon 1997, 35, 797–799. [Google Scholar] [CrossRef]
  55. Ragan, S.; Marsh, H. Science and technology of graphite manufacture. J. Mater. Sci. 1983, 18, 3161–3176. [Google Scholar] [CrossRef]
  56. Gray, G.W.; Winsor, P.A. Liquid Crystals & Plastic Crystals; Ellis Horwood Ltd.: Chichester, UK, 1974; Volume 1, p. 314. [Google Scholar]
  57. Zhang, W.; Andersson, J.T.; Räder, H.J.; Müllen, K. Molecular characterization of large polycyclic aromatic hydrocarbons in solid petroleum pitch and coal tar pitch by high resolution MALDI ToF MS and insights from ion mobility separation. Carbon 2015, 95, 672–680. [Google Scholar] [CrossRef]
  58. Lauzon-Gauthier, J. Multivariate Latent Variable Modelling of the Pre-Baked Anode Manufacturing Process Used in Alu-minum Smelting. Master’s Thesis, Laval University, Québec City, QC, Canada, 2011. [Google Scholar]
  59. Shoko, L.; Beukes, J.P.; Strydom, C.A.; Larsen, B.; Lindstad, L. Predicting the toluene-and quinoline insoluble contents of coal tar pitches used as binders in Söderberg electrodes. Int. J. Miner. Process. 2015, 144, 46–49. [Google Scholar] [CrossRef]
  60. Guo, Y.; Wu, K.; Huo, X.; Xu, X. International Perspectives: Sources, Distribution, and Toxicity of Polycyclic Aromatic Hydrocarbons. J. Environ. Health 2011, 73, 22–25. [Google Scholar]
  61. Farant, J.-P.; Gariépy, M. Relationship between benzo [a] pyrene and individual polycyclic aromatic hydrocarbons in a Söderberg primary aluminum smelter. Am. Ind. Hyg. Assoc. J. 1998, 59, 758–765. [Google Scholar] [CrossRef]
  62. Zhou, Y.M.; Tian, L.; Xie, G.; Li, R.X.; Yu, X.H. A New Ecofriendly Cold Ramming Paste for the Aluminum Electrolysis Cell. In Advanced Materials Research; Trans Tech Publications Ltd.: Bäch, Switzerland, 2012. [Google Scholar] [CrossRef]
  63. Allard, B.; Paulus, R.; Billat, G. A new ramming paste with improved potlining working conditions. In Light Metals 2011; Springer: Cham, Switzerland, 2011; pp. 1091–1096. [Google Scholar]
  64. Ouzilleau, P.; Gheribi, A.E.; Erikson, G.; Lindberg, D.K.; Chartrand, P. A size-dependent thermodynamic model for coke crystallites: The carbon–hydrogen system up to 2500 K. Carbon 2015, 85, 99–118. [Google Scholar] [CrossRef]
  65. Hu, Y.; Hurt, R.H. Thermodynamics of carbonaceous mesophase: II. General theory for nonideal solutions. Carbon 2001, 39, 887–896. [Google Scholar] [CrossRef]
  66. Hosseini, M.S.; Chartrand, P. Thermodynamics and phase relationship of carbonaceous mesophase appearing during coal tar pitch carbonization. Fuel 2020, 275, 117899. [Google Scholar] [CrossRef]
  67. Hosseini, M.S.; Chartrand, P. Critical assessment of thermodynamic properties of important polycyclic aromatic hydrocarbon compounds (PAHs) in coal tar pitch at typical temperature ranges of the carbonization process. Calphad 2021, 74, 102278. [Google Scholar] [CrossRef]
  68. Bale, C.W.; Bélisle, E.; Chartrand, P.; Decterov, S.A.; Eriksson, G.; Hack, K.; Jung, I.-H.; Kang, Y.-B.; Melançon, J.; Pelton, A.D.; et al. FactSage thermochemical software and databases—Recent developments. Calphad 2009, 33, 295–311. [Google Scholar] [CrossRef]
  69. Bale, C.W.; Chartrand, P.; Degterov, S.A.; Eriksson, G.; Hack, K.; Mahfoud, R.B.; Melançon, J.; Pelton, A.D.; Petersen, S. FactSage thermochemical software and databases. Calphad 2002, 26, 189–228. [Google Scholar] [CrossRef]
  70. About Coal Tar and Polycyclic Aromatic Hydrocarbons (PAHs). Available online: http://www.truthaboutcoaltar.com/aboutcoaltar.html (accessed on 1 July 2020).
  71. Shoko, L. Effects of the Chemical Composition of Coal Tar Pitch on Dimensional Changes during Graphitization. Doctoral Thesis, North-West University, Potchefstroom, South Africa, 2014. [Google Scholar]
  72. Kuznetsov, P.N.; Kamenskiy, E.S.; Kuznetsova, L.I. Comparative study of the properties of the coal extractive and commercial pitches. Energy Fuels 2017, 31, 5402–5410. [Google Scholar] [CrossRef]
  73. Chamam, Y.; Kocaefe, D.; Kocaefe, Y.; Bhattacharyay, D.; Morais, B. Effect of heating rate during baking on the properties of carbon anodes used in aluminum industry. In Light Metals 2016; Springer: Cham, Switzerland, 2016; pp. 947–951. [Google Scholar]
  74. Fischer, W.K.; Keller, F.; Perruchoud, R.C.; Oderbolz, S. Baking parameters and the resulting anode quality. Light Metals 1993, 1993, 683–689. [Google Scholar]
Figure 1. Mass spectra (MS) of a sample of coal tar pitch; permitted from ref. [57].
Fuels 03 00042 g001
Figure 2. Molecular weight distribution of pitch during volatilization and mesophase formation steps; permitted from ref. [47].
Fuels 03 00042 g002
Figure 3. Molecular weight distribution of pitch during semi-coke formation; permitted from ref. [47].
Fuels 03 00042 g003
Figure 4. Idealized crystallite representation used in the coke model developped by Ouzileau et al. (a) idealized ‘‘hexagonal’’ plane with n = 4 showing the positions of the C 4 3 sites (Red hexagons), the C 5 4 sites (Blue hexagons) and the C 6 6 sites (Gray hexagons); (b) crystallite size La, Daa and n parameters; (c) crystallite height Lc and d002 from the stacking of m planes; permitted from ref. [64].
Fuels 03 00042 g004
Figure 5. Hypothetical reactor design used to compute the mass and energy balances at every iteration in our model. Dashed line: border of the system, blue lines: mass flows; red lines: heat flows.
Fuels 03 00042 g005
Figure 6. Binary phase diagram of anthracene and a mixture of representative PAHs, which do not contain anthracene, indicating partial pressure of low MW compound. Dashed lines: iso-partial-pressure (bar) of anthracene; dash-dotted lines: metastable iso-partial-pressure (bar) of anthracene.
Fuels 03 00042 g006
Figure 7. Zoom view of the anthracene-lean region of Figure 6. Red solid line: evaporation path of anthracene during heat treatment of a 50 g pitch sample (heating rate: 50 °C/h and carrier gas flow rate: 2300 cm3/min).
Fuels 03 00042 g007
Figure 8. Effect of heating rate on total mass loss during heat treatment of a 50 g mass pitch in temperature range below 350 °C. Solid line: experimental data obtained by Bouchard et al. [28] at 50 °C/h; points: predictions in this work (using ϕ i s : 1 and carrier gas flow rate: 2300 cm3/min).
Fuels 03 00042 g008
Figure 9. Estimated mass loss of (a) anthracene, (b) pyrene and (c) chrysene versus temperature for different carrier gas flow rates. Solid circle: 2300 cm3/min, solid triangle: 560 cm3/min, empty circle: 230 cm3/min (heating rate: 50 °C/h and ϕ i s : 1 ).
Fuels 03 00042 g009
Figure 10. Effect of carrier gas flow rate on anthracene evaporation path during heat treatment of a 50 g pitch sample (assumed as one-phase glassy isotropic liquid); Solid circle: 2300 cm3/min, solid triangle: 560 cm3/min; empty circle: 230 cm3/min (heating rate: 50 °C/h and ϕ i s : 1 ) .
Fuels 03 00042 g010
Figure 11. Estimated mass loss of anthracene, pyrene and chrysene versus temperature for different heating rates at carrier gas flow rate of 2300 cm3/min and ϕ i s = 1 (ac) and with different values of ϕ i s parameters at a heating rate of 50 °C/h, carrier gas flow rate of 2300 cm3/min (df).
Fuels 03 00042 g011aFuels 03 00042 g011b
Figure 12. Calculated released volatile matters from a 50 g coal tar pitch heat treated from Tamb to 450 °C with heating rate of 50 °C/h (Experimental data obtaine from work of Bouchard et al in ref. [28]).
Fuels 03 00042 g012
Figure 13. Calculated molecular weight distribution of the residue of a 50 g mass coal tar pitch at the end of the mesophase formation step of the carbonization process with heating rate of 50 °C/h.
Fuels 03 00042 g013
Figure 14. Calculated released volatile matters from a 50 g coal tar pitch in temperature range of Tamb–550 °C during carbonization process with heating rate of 50 °C/h (Experimental data obtaine from work of Bouchard et al in ref. [28]).
Fuels 03 00042 g014
Figure 15. Calculated molecular weight distribution of the residue of a 50 g mass coal tar pitch at the end of semi-coke formation step of carbonization process with heating rate of 50 °C/h.
Fuels 03 00042 g015
Figure 16. Calculated molecular weight distribution of the residue of a 50 g mass coal tar pitch during coke formation step (where the temperature is about 550 °C) of carbonization process with heating rate of 50 °C/h.
Fuels 03 00042 g016
Figure 17. Total required energy in first step of carbonization (25–350 °C) of a 50 g CTP sample (using ϕ i s: 1, heating rate: 50 °C/h and carrier gas flow rate: 2300cm3/min).
Fuels 03 00042 g017
Table 1. Selected set of representative PAH compounds in the present work.
Specie No.NameChemical FormulaMW
1HydrogenH22
2MethaneCH416
3AnthraceneC14H10178
4PyreneC16H10200
5ChryseneC18H12220
6CoroneneC24H12300
7Tetra-methyl-coroneneC28H20356
8Bi-coroneneC48H20596
9Tri-coroneneC72H28892
10Tetra-coroneneC96H361188
11Penta-coroneneC120H441484
12Penta.tmc *C128H521588
13Hexa-coroneneC144H361764
14Hexa-tmc *C152H521876
15Hepta-coroneneC168H362052
16Hepta-tmc *C176H482160
17Octa-coroneneC192H402344
18Deca-coroneneC240H482928
1912-coroneneC288H523508
2012-tmc *C304H843732
2114-coroneneC336H524084
2214-tmc *C352H764300
2316-coroneneC384H604668
* tmc: tetra-methyl-coronene.
Table 2. Proposed prototype oligomerization reactions in mesophase formation step of carbonization process.
ReactionType of ReactionChemical Reaction
R1Oligomerization/Polymerization2C24H12 = C48H20 + 2H2
R2Oligomerization/Polymerization3C24H12 = C72H28 + 4H2
R3Oligomerization/Polymerization2C48H20 = C96H36 + 2H2
R4Oligomerization/PolymerizationC24H12 + C48H20 = C72H28 + 2H2
R5Oligomerization/PolymerizationC48H20 + C72H28 = C120H44 + 2H2
R6Oligomerization/Polymerization2C28H20 = C56H36 + 2H2
R7Oligomerization/PolymerizationC56H36 + C72H28 = C128H52 + 6H2
R8Oligomerization/PolymerizationC56H36 + C72H28 = C120H52 + 6H2
R9CrackingC28H20 + 4H2 = C24H12 + 4CH4
R10CrackingC56H36 + 8H2 = C48H20 + 8CH4
R11CrackingC48H20 + 2H2 = 2C24H12
R12CrackingC56H36 + 2H2 = 2C28H20
Table 3. Proposed prototype polymerization reactions in semi-coke/coke formation step of carbonization process.
ReactionType of ReactionChemical Reaction
R1Oligomerization/Polymerization2C72H28 = C144H36 + 10H2
R2Oligomerization/PolymerizationC48H20 + C96H36 = C144H36 + 6H2
R3Oligomerization/PolymerizationC72H28 + C96H36 = C168H36 + 14H2
R4Oligomerization/PolymerizationC56H36 + C96H36 = C152H52 + 10H2
R5Oligomerization/PolymerizationC56H36 + C120H44 = C176H48 + 16H2
R6Oligomerization/Polymerization2C96H36 = C192H40 + 16H2
R7Oligomerization/Polymerization2C120H44 = C240H48 + 20H2
R8Oligomerization/Polymerization2C144H36 = C288H52 + 10H2
R9Oligomerization/Polymerization2C152H52 = C304H60 + 10H2
R10Oligomerization/Polymerization2C168H36 = C336H52 + 10H2
R11Oligomerization/Polymerization2C176H48 = C352H76 + 10H2
R12Oligomerization/Polymerization2C192H40 = C384H60 + 10H2
R13CrackingC48H20 + 2H2 = 2C24H12
R14CrackingC56H36 + 2H2 = 2C28H20
R15CrackingC56H36 + 8H2 = C48H20 + 8CH4
Table 4. Definition of different terms in Equations (15-a) and (15-b).
Temperature Range ( n i p i t c h ) T j ( n i p i t c h ) T j + 1 ( n i g a s ) T j + 1
25–350 °C0, i = 1,2
( n i i s o ) T j , i = 3,4,…N
0, i = 1,2
( n i i s o ) T j + 1 , i = 3,4,…N
0, i = 1,2, and 8, 9,…N
( n i g a s ) T j + 1 , i = 3,4,…,7
350–450 °C0, i = 1,2,…5
( n i i s o ) 350 , i = 6,7,…N
0, i = 1,2,…7
( n i m e s o ) 450 , i = 8,9,…N
0, i = 8,9,…N
( n i g a s ) 450 , i = 1,2,…,7
450–550 °C0, i = 1, 2,…7
( n i m e s o ) 450 , i = 8,9,…N
0, i = 1,2,…7
( n i s e m i c o k e ) 550 , i = 8,9,…N
0, i = 8, 9,…N
( n i g a s ) 550 , i = 1,2,…,7
Table 5. Definition of different terms in Equations (17).
Temperature Range H T j p i t c h H T j + 1 p i t c h H T j + 1 g a s
25–350 °C i ( n i h i 0 ) T j + ( n T Δ h m i x ) T j i s o
(i = 3,4,…N)
i ( n i h i 0 ) T j + 1 + ( n T Δ h m i x ) T j + 1 i s o
(i = 3,4,…N)
i ( n i h i 0 ) T j + 1 g a s  
(i = 3,4,…,7)
350–450 °C i ( n i h i 0 ) 350 + ( n T Δ h m i x ) 350   i s o
(i = 6,7,…N)
i ( n i h i 0 ) 450 + ( n T Δ h m i x ) 450 + ( n T h o r i e n t ) 450   m e s o
(i = 8,9,…N)
i ( n i h i 0 ) 450 g a s
(i = 1,2,…,7)
450–550 °C i ( n i h i 0 ) 450 + ( n T Δ h m i x ) 450 + ( n T h o r i e n t ) 450   m e s o    
(i = 8,9,…N)
i ( n i h i 0 ) 550   s e m i c o k e
(i = 8,9,…N)
i ( n i h i 0 ) 550 g a s
(i = 1,2,…,7)
Table 6. Mass distribution of a 50 g pitch sample at room temperature subjected to the calculations in the present work.
NameChemical FormulaMWMass (g)
AnthraceneC14H101780.03
PyreneC16H102000.04
ChryseneC18H122200.044
CoroneneC24H123009
Tetra-methyl-coroneneC28H2035627
Bi-coroneneC48H2059610
Tri-coroneneC72H288923
Tetra-coroneneC96H2811800.886
Publisher’s Note: MDPI stays neutral with regard to jurisdictional claims in published maps and institutional affiliations.

