Article

Investigating the Effect of Volatiles on Sub-23 nm Particle Number Measurements for a Downsized GDI Engine with a Catalytic Stripper and Digital Filtering

by
Sebastian A. Pfau
,
Ephraim Haffner-Staton
,
Antonino La Rocca
* and
Alasdair Cairns
Department of Mechanical Materials and Manufacturing Engineering, University of Nottingham, Nottingham NG7 2RD, UK
*
Author to whom correspondence should be addressed.
Fuels 2022, 3(4), 682-697; https://doi.org/10.3390/fuels3040041
Submission received: 24 August 2022 / Revised: 20 October 2022 / Accepted: 15 November 2022 / Published: 21 November 2022

Abstract

:
Recent efforts of both researchers and regulators regarding particulate emissions have focused on the contribution and presence of sub-23 nm particulates. Despite being previously excluded from emissions legislation with the particle measurement programme (PMP), the latest regulatory proposals suggest lowering the cut-off sizes for counting efficiencies and the use of catalytic strippers to include solid particles in this size range. This work investigated particulate emissions of a 1.0 L gasoline direct injection (GDI) engine using a differential mobility spectrometer (DMS) in combination with a catalytic stripper. Direct comparison of measurements taken with and without the catalytic stripper reveals that the catalytic stripper noticeably reduced variability in sub-23 nm particle concentration measurements. A significant portion of particles in this size regime remained (58–92%), suggesting a non-volatile nature for these particles. Digital filtering functions for imposing defined counting efficiencies were assessed with datasets acquired with the catalytic stripper; i.e., particle size distributions (PSDs) with removed volatiles. An updated filtering function for counting efficiency thresholds of d65 = 10 nm and d90 = 15 nm showed an increase in particulate numbers between 1.5% and up to 11.2%, compared to the closest previous digital filtering function. However, this increase is highly dependent on the underlying PSD. For a matrix of operating conditions (1250 to 2250 rpm and fast-idle to 40 Nm brake torque), the highest emissions occurred at fast-idle 1250 rpm with 1 . 93   ×   10 8   # / cm 3 using the updated filtering function and catalytic stripper. This setup showed an increase in particulate number of +27% to +390% over the test matrix when compared to DMS measurements without the catalytic stripper and applied counting efficiency thresholds of d50 = 23 nm and d90 = 41.

Graphical Abstract

1. Introduction

Particulate emissions have become an omnipresent topic in recent years. A 2016 report by the World Health Organization (WHO) identified ambient air pollution as the single biggest environmental risk to human health [1]. In particular, particulate matter (PM) is known to be associated with respiratory and cardiovascular disease [2,3], where particulate size is an important consideration. In regard to the environment, atmospheric soot is considered second only to CO2 in terms of radiative forcing effects [4], and contributes to snow-ice melting via deposition in polar regions [5]. The reduction of black carbon emissions is a key target for the abatement of climate change, as the short-lived nature of atmospheric soot in comparison to gaseous species such as CO2 means benefits may be much more quickly realised [6].
Soot is a commonly observed by-product of the combustion of hydrocarbon (HC) fuel in internal combustion engines. While water and CO2 are the only products of complete combustion, non-stoichiometric fuel-air mixtures inevitably arise within the combustion chamber either by accident or by design [7]. A lack of oxygen during combustion tends to arise locally due to inadequate mixing of the charge, or by the presence of liquid fuel droplets/films in the cylinder [8]. Production of soot has long been known for diesel engines but was traditionally insignificant for older gasoline engines. In the past, gasoline engines made use of carburetors or port-fuel injectors (PFI) to ensure homogeneous mixing of fuel and air prior to injection, but modern gasoline engines tend to use DI systems. The transition from PFI to DI technology was strongly motivated by the goal to reduce CO2 emissions. Gasoline direct injection (GDI) engines offer improved efficiencies, as throttling losses can be eliminated by stratified lean-burn operation and volumetric efficiency can be increased due to charge cooling effects [9]. However, GDI engines suffer from elevated levels of particulate emissions, as the direct injection of fuel into the cylinder allows less time for vaporisation and mixing with air [10,11]. As such, particle emissions from gasoline engines have become a growing concern in recent years.
In the European region, limits on PM were initially introduced with the Euro 1 standard at 140 mg/km [12] and these limits were gradually lowered to 5 mg/km with Euro 5(a)/6(a) [13]. Due to limitations in the resolution of particle mass measurements by gravimetric means below 5 mg/km [14], particle number (PN) limits were introduced with Euro 5b/6b [15] to continue the systematic increase in stringency needed to drive improvement in the quality of vehicle emissions. Prior to the incorporation of PN measurements into the Euro regulations, the particle measurement programme (PMP) was developed by the Joint Research Council (JRC) of the European Commission to standardise the measurement of exhaust PN [16,17]. Repeatability issues with particulate measurements for exhaust gas often stem from artefacts due to volatile species, which can be attributed to the nucleation mode of exhaust PM [18]. The PMP addresses this issue by prescribing a volatile particle remover (VPR) as a conditioning system for the exhaust gas sample. Moreover, particles below 23 nm are excluded by prescribing counting efficiencies for the particle number counter (PNC). Specifically, the efficiencies are 50% of particles counted at 23 nm and over 90% of particles counted at 41 nm [17]. These thresholds are also referred to as d50 and d90, respectively. All particles that are counted with this protocol are considered solid, thus providing the solid particle number (SPN) as a standardised metric to which the PN limit of the regulations is applied. Due to the effective size cut-off at 23 nm, the resulting total number of particles is also referred to as SPN23.
Research activities in recent years have increasingly focused on sub-23 nm particulate emissions. An early literature review by Giechaskiel et al. [19] from 2014 identified solid core particles in the nucleation mode of diesel engines and gasoline engines (both PFI and GDI). The review paper included initial experiments by the JRC that found the excluded fraction by the PMP to be 30–40%. However, these findings were deemed insufficient to support a change of the legislation due to other sources of error and variability, and generally low emission level below the regulated 6   ×   10 11 #/km, even with sub-23 nm particulates included. However, a more recent review paper from 2019 by some of the same authors identified a general tendency of high sub-23 nm particulate emissions for otherwise low PN emission level conditions [20]. It was further stressed that research findings suggest that the sub-23 nm fraction is often above 50% even without correction for particulate losses, which would increase this proportion further. During the 52nd PMP session in January 2020, new counting efficiencies of d65 = 10 nm and d90 = 15 nm were discussed [21]. Emission levels with this lowered detection threshold are referred to as SPN10. The final report on the development of a regulatory amendment [22] included both the counting efficiencies of the 52nd PMP session and a sampling setup comprising a catalytic stripper. These proposals are backed up by ongoing research efforts into the measurement of sub-23 nm emissions, notably the three EU-funded projects DownToTen, PEMs4Nano, and SUREAL-23 [23]. A comprehensive summary and outline of recent regulatory progress can be found in [24]. A new approach to exhaust particulate measurements was recently discussed by Giechaskiel et al. [25]. A change the SPN approach to a total particle emissions metric could capture both the solid and volatile fraction in the exhaust gas; however, the authors state that the details and understanding of underlying processes are not yet sufficient for a regulatory realisation of such an approach.
The PMP, as described above, includes a PNC for the detection of particulates. Commercially, CPCs are commonly used for this part. These are calibrated to defined counting efficiencies and count all particles accordingly. Consequently, the instrument provides a total particle number (TPN) over a given period, e.g., one drive cycle. Further insight beyond the TPN is often of interest for research purposes. Laboratory instruments based on the principle of electrical mobility are commonly used to obtain particle size distributions (PSDs) [26]. The full PSD can provide additional information on the nature of emitted particulates, often summarised in the geometric mean diameter (GMD) as an additional metric. However, further post-processing is required to obtain metrics comparable to the legislated SPN23 number. One option for this is the fitting of lognormal functions to the modes in the PSD. Braisher et al. [27] found data from a DMS500 to be similar to PMP-compliant measurements if only the accumulation mode fit was considered, despite the lack of a VPR in their setup. However, this approach is unsuitable for future sub-23 nm measurements due to the distinct separation of nucleation and accumulation modes [28].
An alternative method was proposed by Leach [29]: counting efficiencies could be applied to the PSD during post-processing with digital filtering functions. For the original function based on PMP counting efficiencies for SPN23, i.e., d50 = 23 nm and d90 = 41 nm, this approach was found to provide more representative results than using the extracted accumulation mode. In contrast to the lognormal fitting, the filtering functions provide a tool to implement a software VPR continuously across specified size ranges. The function was based on the structure of a Wiebe function, a zero-dimensional or energy balance model for the mass fraction burned of engines. The digital filtering function was proposed as shown in Equation (1), where dp is particle diameter.
f ( d p ) = { 1 e x p [ 3.54 ( d p 14 40 ) 1.09 ] ,     d p 14 0 ,     d p < 14
The function was successfully used in subsequent studies by Leach et al. [30,31,32]. Moreover, two modified filters have been proposed by Leach et al. [33] in 2019 with counting efficiency pairs of d50 = 10 nm/d90 = 23 nm and d50 = 10 nm/d90 = 15 nm, based JRC research activities leading up to 2018 [34] and a PEMs4Nano report in 2017 [35], respectively. The function based on d50 = 10 nm/d90 = 15 nm was described as shown in Equation (2).
f ( d p ) = { 1 e x p [ 4 ( d p 4 14.7 ) 1.96 ] ,     d p 4 0 ,     d p < 4
In light of continued work towards updated regulations, a filter was recently modified by Pfau et al. [28] for the proposed SPN10 efficiencies d65 = 10 nm/d90 = 15 nm, with a filter shape similar to the original SPN23-inspired filter. The equation for this filtering function is shown in Equation (3).
f ( d p ) = { 1 e x p [ 5 ( d p 5 20 ) 1.12 ] ,     d p 5 0 ,     d p < 5
Implementing this equation covers one half of the proposed PMP update; i.e., the lowered counting efficiencies. However, to date, the other half of the proposed measurement setup, i.e., a catalytic stripper for sample gas conditioning, has not been tested with this approach. While the implications of an absent VPR with a DMS500 might not have been significant for the PN level with SPN23-inspired efficiencies, this situation could likely be different for the PN level with SPN10-inspired efficiencies.
The scope of this paper is to establish the effect that a catalytic stripper has on the particulate measurements of a GDI engine. For this purpose, DMS500 measurements will be compared that were acquired with and without a catalytic stripper. Moreover, emphasis is further placed on sub-23 nm particulates as these are strongly affected by volatile compounds in the exhaust gas. Inspired by the setup of regulatory PMP systems—comprising a PNC with defined counting efficiencies in addition to using a VPR—digital filtering functions are used to impose specified counting efficiencies on the DMS500 measurements.

2. Experimental Section
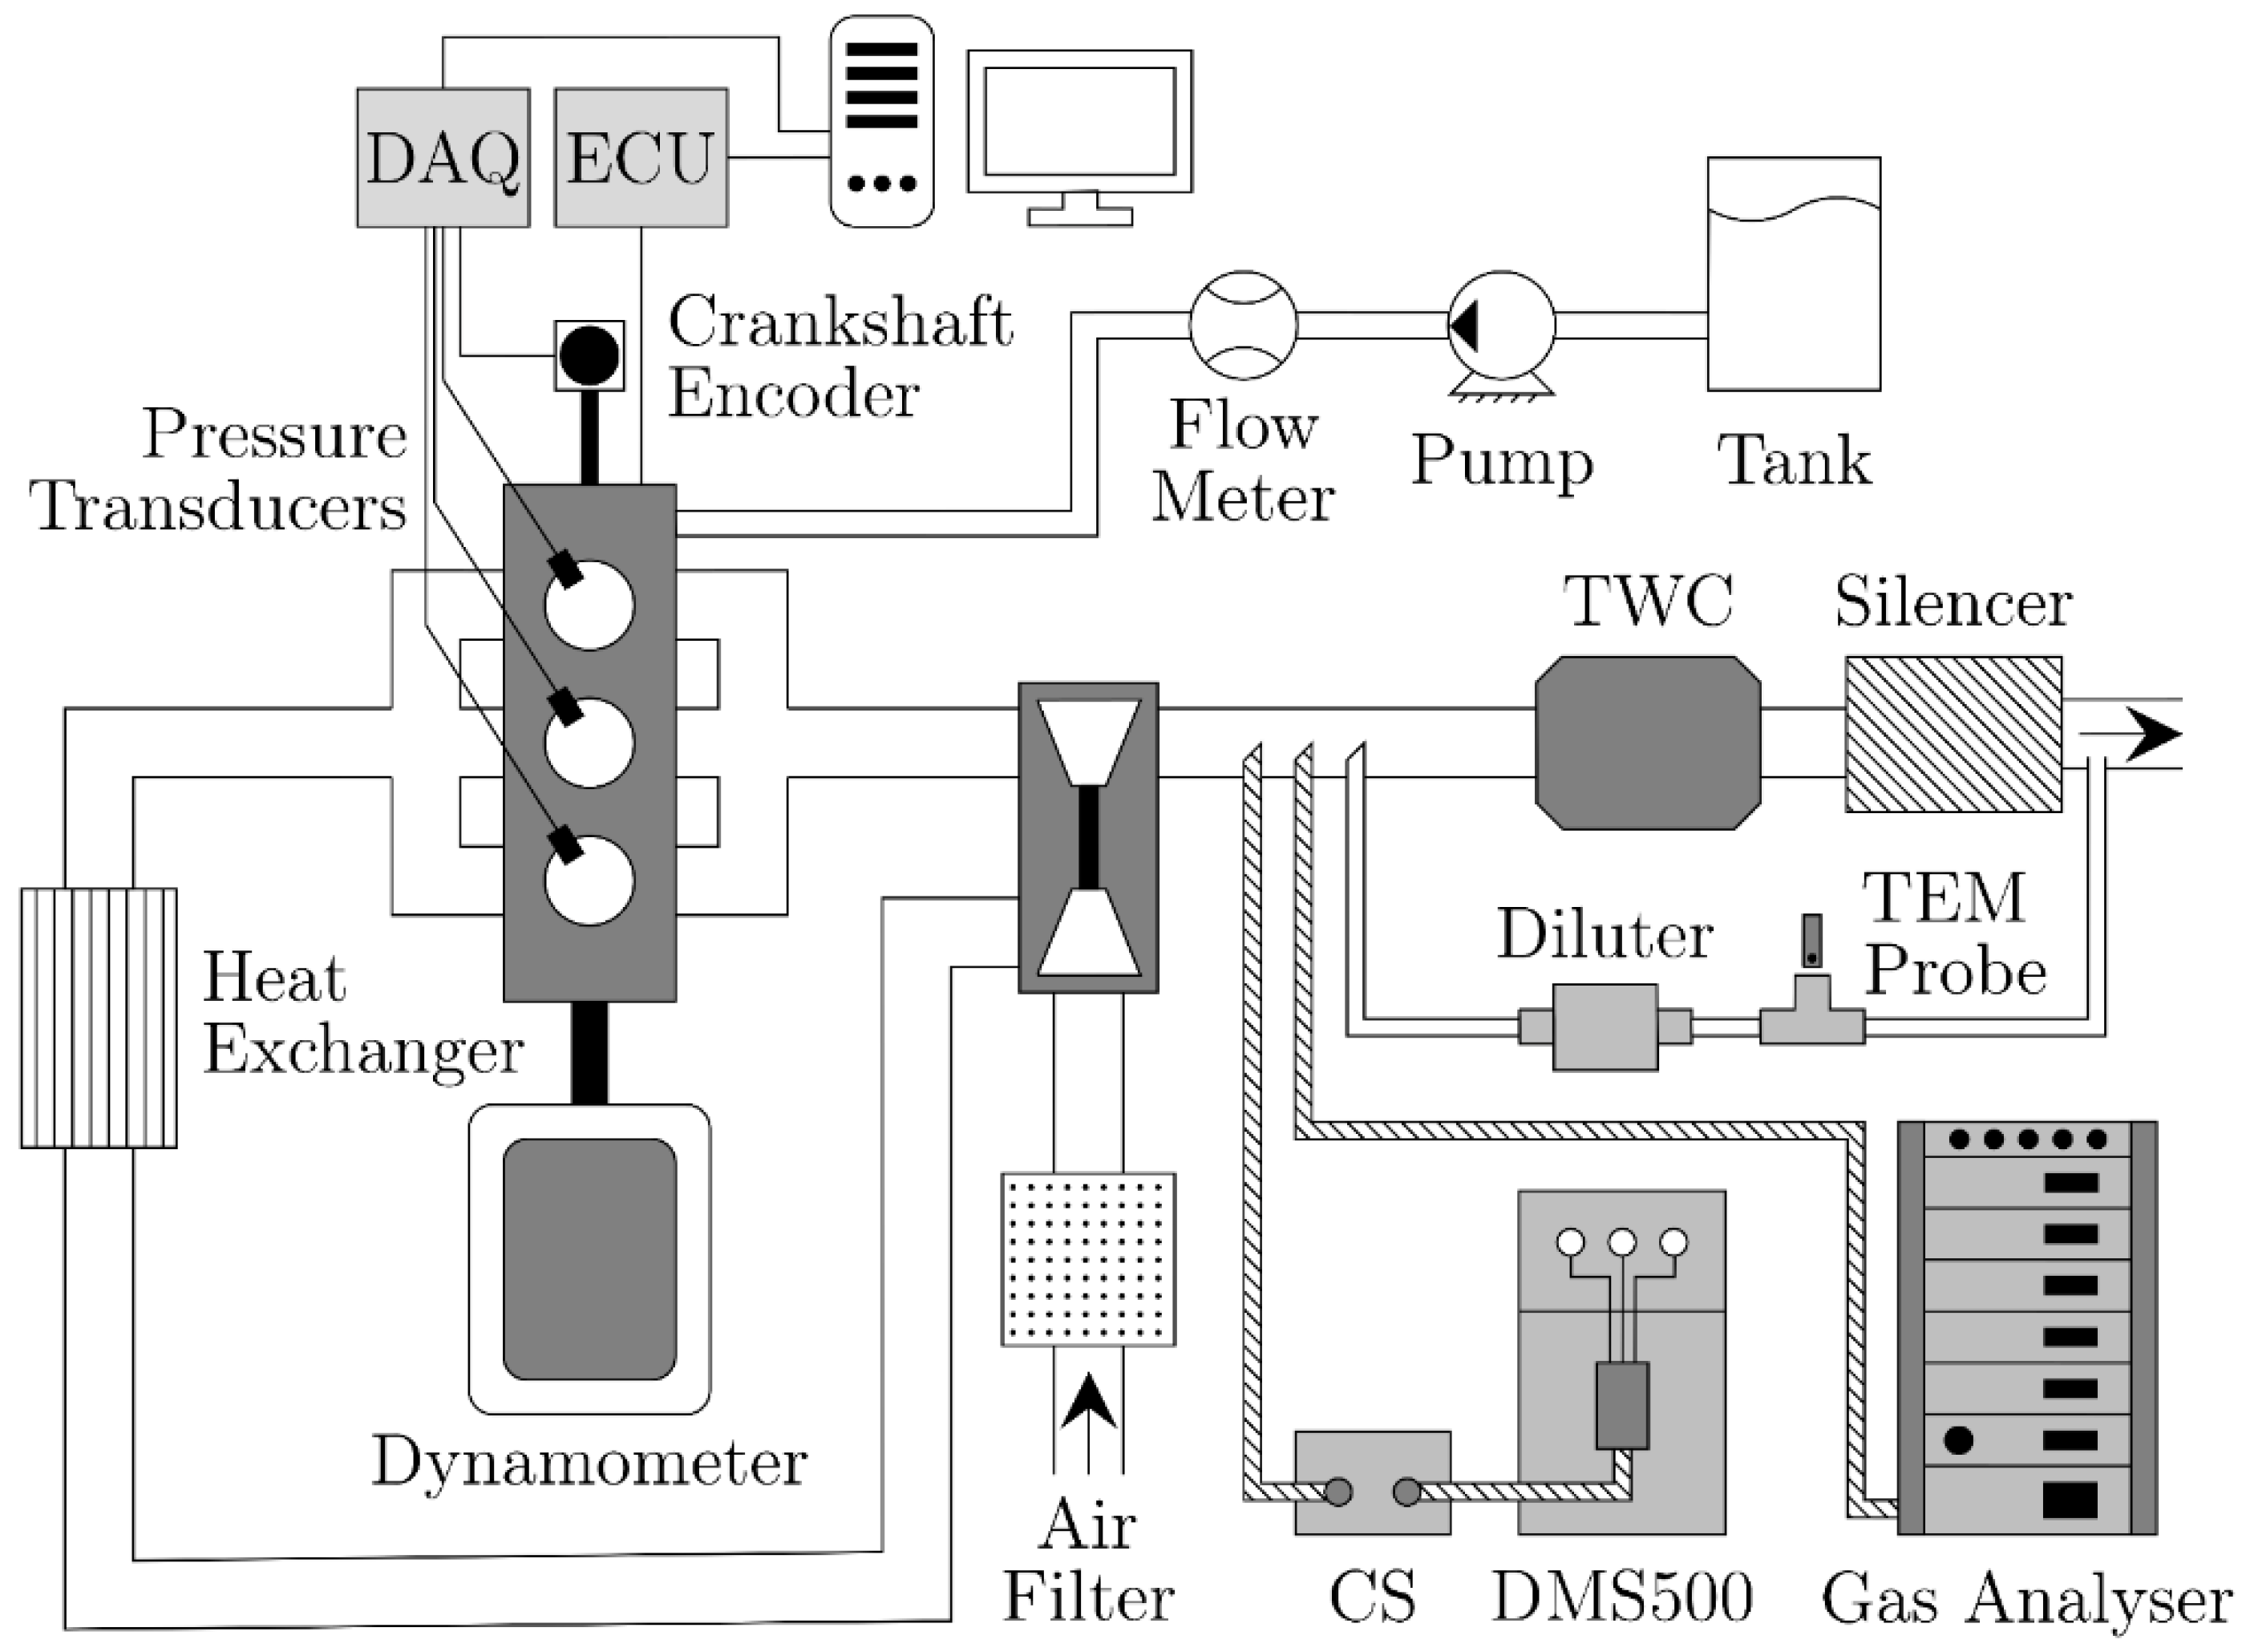
2.1. Engine Setup

A 1.0 L three-cylinder GDI engine was used for the experimental work of this study. The specifications of the engine are presented in Table 1. The experimental test setup is visualised in Figure 1. The engine was operated on a testbed with a Froude Consine EC38 TA Eddy-Current dynamometer (rated capacity of 154 kW) connected to the engine’s power take-off shaft. Operating parameters such as injection and spark timing were controlled by a Bosch MED17 engine control unit (ECU) with mapping as per manufacturer calibration. Further details on the engine test setup can be found in a previous publication [28]. Specifications of the test fuel are included in Table 2.
A test matrix with a total of 15 steady-state operating conditions was investigated: five speeds from 1250 to 2250 rpm in steps of 250 rpm, each with three loads from 0 to 40 Nm in steps of 20 Nm. These conditions were derived from a worldwide harmonized light vehicles test cycle (WLTC) simulation; and further information on this as well as the engine mapping can be found in [36]. The test matrix was assessed three times on different days of engine testing to ensure repeatability of the measurements. Prior to assessing any operating conditions, the engine was conditioned upon starting by running with 20 Nm at 1750 rpm until engine oil reached 85 °C.

2.2. Gas Analyser

The concentration of unburned hydrocarbons (HC) in the exhaust gas was measured by a Signal 3000 HM gas analyser. The exhaust gas was sampled with a heated line (190 °C). The sample gas was initially passed through a Signal Pre Filter module 352 to remove particulates and protect subsequent instrumentation from damage and contamination. The sample gas stream was further preconditioned in a Signal 340 distribution oven.

2.3. Particulate Measurement

Particulate measurements were acquired with a Cambustion DMS500. The temperatures of the sampling block and the 5 m heated sampling line were both set to 191 °C. The instrument was operated in 1000 nm mode; i.e., providing a measurement range of 5–1000 nm. The primary dilution was fixed at 5:1. The secondary dilution stage was bypassed for most conditions; i.e., set to 1:1. Only for the fast-idling conditions at 1250 rpm and 1500 rpm was a secondary dilution of 12–250 used to achieve acceptable signal strength. A catalytic stripper from Cambustion was included as VPR for some measurements, placed in-line between the heated sampling line and the DMS. The catalytic stripper provides a nominal removal efficiency of above 99% for 30 nm tetracontane. The temperatures of the heater and cooler of the catalytic stripper were set to 410 °C and 80 °C, respectively. Measurements were acquired over a window of 180 s with a sampling frequency of 0.5 Hz. The 95% confidence intervals were calculated for each of these measurement windows. A penetration efficiency model was applied to account for particle losses in the heated sampling line and the catalytic stripper (see Figure 2). This model was provided by Cambustion and is based on the work of Kumar et al. [37].
Moreover, processing of the obtained PSDs included the application of digital filtering functions to model counting efficiencies, as described above. For measurements without the catalytic stripper (w/o CS), PMP SPN23 efficiencies of d50 = 23 nm and d90 = 41 nm were applied with Equation (1), i.e., SPN23-inspired function by Leach [29]. For measurements with the catalytic stripper (w CS), the proposed PMP SPN10 efficiencies of d65 = 10 nm and d90 > 15 nm were applied with Equation (2), i.e., the SPN10-inspired function by Pfau et al. [28].

3. Results and Discussion

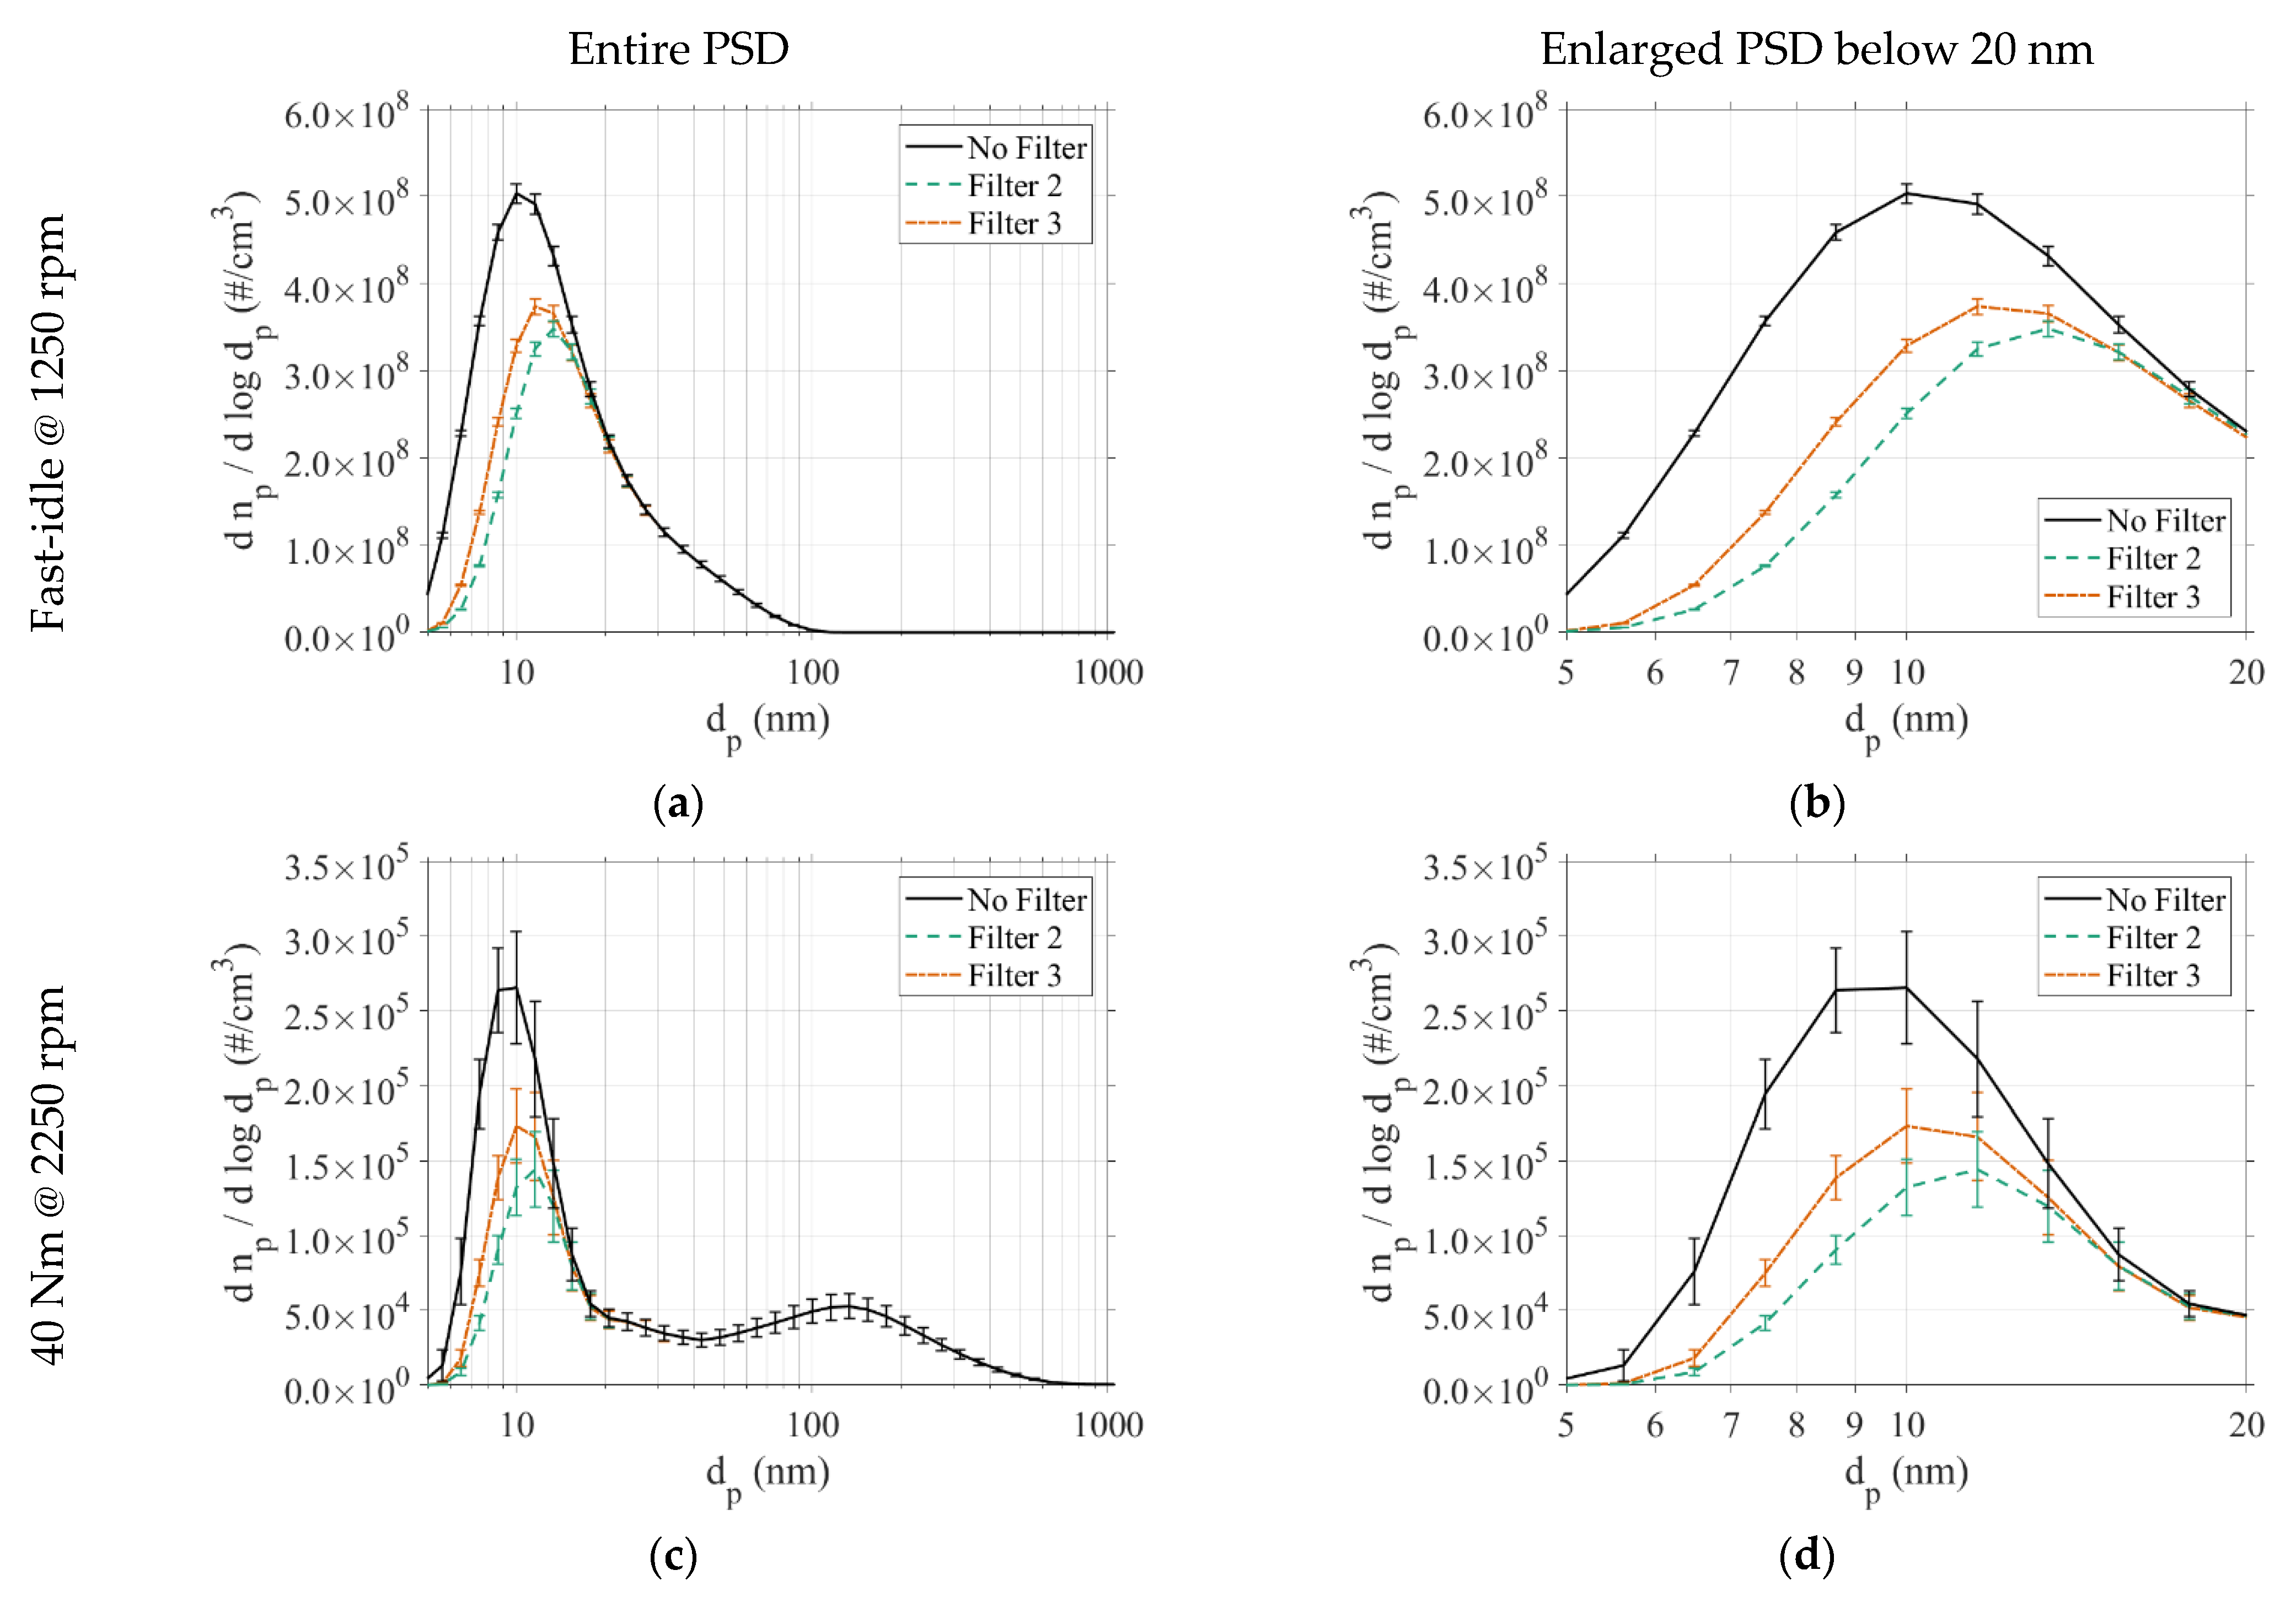
3.1. Digital Filtering Functions for Sub-23 nm Measurements

Different mathematical functions have been proposed to date for the sub-23 nm processing of DMS particulate emission measurements [28,33]. However, none of the studies on this matter to date have used a sample gas conditioning setup that prevents volatile artefacts; i.e., catalytic strippers have not been used. To determine the extent to which digital filtering functions can affect the particulate number, two operating conditions are investigated in detail in the following: fast-idle at 1250 rpm and 40 Nm load at 2250 rpm. These conditions are the low and high endpoints of the test matrix, and were chosen because notable differences in their TPN and GMD could be observed (cf. Section 3.3), indicating underlying differences in their PSDs. Two of the filters mentioned above have been applied, described above as Equations (2) and (3), proposed by Leach et al. [33] and Pfau et al. [28], respectively. These are in the following, labelled as Filter 2 and Filter 3, respectively. As both functions incorporate d90 counting efficiencies at 15 nm, their counting efficiencies approach 100% at 20 nm.
For the fast-idle 1250 rpm condition, the 95% confidence intervals overlap marginally down to 13 nm (see Figure 3a,b). Below this point, apparent differences between the two filters can be observed beyond the certainty level of the confidence intervals. Consequently, the PN > 10 (i.e., particulate number above 10 nm with the respective counting efficiencies) changes from 1 . 73 × 10 8   # / cm 3 with Filter 2 to 1 . 93 × 10 8   # / cm 3 as Filter 3 is applied, i.e., an increase of 11.2%. This change stems from a 15.6% increase in sub-23 nm emissions. The PN > 10 difference is less pronounced for the 2250 rpm condition with 40 Nm, increasing only 1.5% (see Figure 3c,d). The change in the sub-23 nm emissions is +22.1%, however, with partially overlapping 95% confidence intervals. Due to the second mode at 133 nm and a consequently higher fraction of larger particles, the overall particulate number is less affected. These observations highlight that the identified sub-23 nm emissions can vary considerably between different filtering functions. The higher the fraction of sub-23 nm particulates of the overall emissions, i.e., the lower the GMD, the greater the effect of changing from Filter 2 to Filter 3. This confirms the findings of a previous study by Pfau et al. [28] conducted without a catalytic stripper.

3.2. Impact of Catalytic Stripper

Another area of interest is the effect of a catalytic stripper on the observed PSD, as this is included in the proposals for an updated PMP SPN10 measurements [22]. The initial PMP encompasses evaporation tube and counting efficiencies of d50 at 23 nm and d90 at 41 nm. The latter are modelled for DMS measurements without the catalytic stripper by applying the digital filtering function Equation (1) (Filter 1 or F1). The resulting particle distributions are also referred to as “F1-PN > 23” in the following. Likewise, Equation (3) (Filter 3 or F3) is applied to DMS measurements acquired while using the catalytic stripper to assess sub-23 nm emissions by using SPN10-proposed counting efficiencies d65 at 10 nm and d90 at 15 nm. These measurements are then also referred to as “F3-PN > 10”.
Firstly, the impact of using a catalytic stripper is assessed. The same two conditions as in the previous Section 3.1 are also used here, with the unfiltered but loss-corrected PSDs with and without catalytic stripper, shown in the left column of Figure 4. For the fast-idle 1250 rpm condition, an overall reduction in particle concentrations can be observed. The mode remains roughly at the same size position; however, its peak is reduced from 7 . 37 × 10 8   # / cm 3 to 5 . 03 × 10 8   # / cm 3 . In contrast, the PSD for the 40 Nm condition at 2250 rpm without catalytic stripper exhibits a nucleation-type mode that is not only reduced in its concentration level from 4 . 46 × 10 5   # / cm 3 to 2 . 65 × 10 5   # / cm 3 , but also shifted its peak position from 6.5 nm to 10 nm by implementing sampling with a catalytic stripper. While particle number concentrations for the 1250 rpm condition are reduced in the 30 nm to 100 nm range as well, there does not appear to be a similar reduction for the 2250 rpm condition. This is somewhat in line with the findings by Duca et al. [38] that it was mostly the smallest particles in the range of 10–32 nm that were most affected by the CS, due to a larger volatile fraction these are carrying. Beyond the size of the volatile fraction, it could also be hypothesised that different volatile species are emitted at the two operating conditions here, thus explaining the observed differences. The types emitted at the 1250 rpm condition would be considered to have more of an effect at particulate sizes of 30 nm to 100 nm compared with the types at the 2250 rpm condition, impacting predominantly the size classes below 10 nm. An alternative hypothesis could be that the behaviour and mechanisms differ based on the total particle concentration levels, with the smallest particulates below 10 nm quickly adsorbed by larger particulates at higher concentrations. This would also explain the difference in the range of 30 nm to 100 nm when the catalytic stripper is employed. Future work should aim to characterise the volatile species emitted, thereby providing further insight into which of the two proposed explanations is more accurate.
The 95% confidence intervals as included in the plots are generally reduced with the inclusion of the catalytic stripper in the measurement setup. This is most noticeable for the 2250 rpm condition for which the 95% confidence intervals are noticeably larger, especially in the measurements without the catalytic stripper and for sub-23 nm sizes. The higher variability could be explained by the lower particle concentration level. Despite the reduced sampling frequency of 0.5 Hz and prolonged sampling duration of 180 s, more noise for measurements was experienced, leading to the larger confidence intervals. The confidence intervals are reduced more considerably for the 2250 rpm conditions compared with the 1250 rpm condition when the catalytic stripper is then employed. This could indicate that a larger fraction of volatiles is present in the exhaust gas at the higher-speed condition. By removing these volatiles, the catalytic stripper appeared to be effective in reducing the variability. Assessing the repeatability of the DMS500 in this arrangement was beyond the scope of this study; however, a study by Bokor et al. [39] found the repeatability to be 5.3% for the PN measurements, and 3.1% for the respective GMD. More in-depth investigations can be carried out as follow-up to this study, to capture the impact that the catalytic stripper could have on the robustness of acquired data.
The right column of Figure 4 shows the PSDs with the respective digital filtering functions applied. For the PSDs acquired with the catalytic stripper, implementing the SPN10-inspired digital filtering function (Equation (3)) leads to a reduction in the concentration level of the mode around 10 nm, with a slight shift towards larger particle sizes as described in the previous Section 3.1. The implications of filtering the PSD acquired without catalytic stripper for F1-PN > 23 is more profound, as it effectively removes most of the observed particles below 23 nm. As is apparent from Equation (1), no particles below 14 nm are counted. For the fast-idle condition at 1250 rpm (w/o CS), this processing step reduces the height of the mode by 80%—from 7 . 37 × 10 8   # / cm 3 to 1 . 47 × 10 8   # / cm 3 —and shifts the peak position from 10 nm to around 25 nm. Moreover, the shape of the mode is broader compared to the sharper peak in the unfiltered PSD. For the 2250 rpm condition (w/o CS), applying Filter 1 removes the lower mode entirely. The peak at 133 nm becomes the predominant mode, with an extended shoulder towards smaller particle sizes. Only a minimal peak remaining at just at around 20 nm with a particle concentration of 55% of the larger particle size mode: 3 . 10 × 10 4   # / cm 3 compared to 5 . 64 × 10 4   # / cm 3 . This analysis of the PSD for two test conditions highlights the considerable implications that a change to smaller counting efficiencies. Sub-23 nm particles were more prominently represented in the particulate number with the lowered counting efficiency positions. A more extensive test matrix is discussed in the following section to better understand the influence of operating conditions.

3.3. Particulate Emissions across the Test Matrix

The particulate emissions measurements, for some conditions, showed overall high levels of noise, despite a reduced sampling frequency of 0.5 Hz and a prolonged sampling duration of 180 s. Specifically, this variability limitation was observed for the conditions at 2000 rpm and 2250 rpm with 20 Nm (w + w/o CS) and with 40 Nm (w CS), as well as 1750 rpm with 20 Nm (w CS). The following discussion of results uses the TPN as a metric for unfiltered data and denotes the particle count for the data sets with digital filtering functions as F3-PN > 10 and F1-PN > 23. However, it should be pointed out that these differ from the metrics described in the PMP with similar terminology, denoted as # / km emitted from vehicles over a test cycle, rather than # / cm 3 measured here.
The contour plots of the various particulate number metrics exhibit an overall trend of high particulate number levels towards the fast-idle 1250 rpm condition (see Figure 5). The highest cumulative number can be observed for TPN (w/o CS) with 4 . 21 × 10 8   # / cm 3 and the lowest for F1-PN > 23 with 8 . 25 × 10 7   # / cm 3 . The F3-PN > 10 at this point is 1 . 93 × 10 8   # / cm 3 . The PN generally decreases for higher speeds and loads; however, some exceptions can be observed for the measurements without the catalytic stripper. At the fast-idle condition at 2000 rpm, the PN is elevated when measurements are taken without the catalytic stripper. This can be seen in the (only) particle-loss corrected contour plot as a shoulder of the respective contour lines (see Figure 5a), and is even more noticeable in the F1-PN > 23 plot as a distinct peak (see Figure 5b). Moreover, both TPN (w/o CS) and F1-PN > 23 increase for the highest two speeds, with the highest load of 40 Nm. While not as noticeable for the two metrics derived from the measurements with the catalytic stripper, the lowest PN across the test matrix can be found at the 20 Nm load conditions at 2000 rpm and 2250 rpm for all four plots. The number of particulates generally increases when comparing F3-PN > 10 with F1-PN > 23, from as low as +27% at 1250 rpm with 40 Nm up to an almost four-fold +390% at 1750 rpm with 20 Nm. A decrease could only be observed for the fast-idling condition at 2000 rpm, with −73%. The change is generally more pronounced for the fast-idling conditions with +182% on average compared to +162% and +60% for the 20 Nm and 40 Nm load conditions, respectively.
In a study by Di Iorio et al. [40] using a Dekati DEED PMP-compliant conditioning system in combination with a TSI EEPS measurement device, the PN could generally be observed to decrease with increasing engine load. The particulate emissions level increased by around an order of magnitude when the engine speed was increased from 2000 rpm to 4000 rpm. Moreover, the sub-23 nm fraction was higher for 2000 rpm. These findings were confirmed in another study by Catapano et al. [41] using the same setup configuration. While a decrease in PN level with increasing load could be observed here as well, it should be noted that the load level here is overall lower compared to the engine load assessed in the aforementioned studies. Likewise, the engine speeds assessed here are lower, but also cover an area that was not assessed in either study.
Additional information on the emitted particulates can be obtained from the GMD. This metric provides a more feasible way to summarise the size profile for larger data sets than comparing individual PSDs. In the following, the term GMD is used similar to TPN, while F3-GMD > 10 and F1-GMD > 23 are the corresponding metrics to F3-PN > 10 and F1-PN > 23, respectively, with the same processing approach.
Similarities can be observed between the contour plots for GMD (w CS), F3-GMD > 10, and F1-GMD > 23 (see Figure 6). The highest values for these three plots are located at the upper end of the test matrix in terms of speed and load. From there, the GMD decreases predominantly with engine load, while the effect of the engine speed on this metric is less clear. Overall, the level of the F1-GMD > 23 is noticeably above the other GMD-metrics, as is apparent by the colour bar of the contour plot ranging from 0–80 nm, rather than 0–40 nm as for the other plots. The largest size of 89.9 nm for F1-GMD > 23 occurs at 2250 rpm with 40 Nm load, with the smallest size of 25.3 nm at fast-idling 2250 rpm. Similarly, the largest size for F3-GMD > 10 occurs at 2000 rpm with 40 Nm load, with 32 nm and the smallest size at fast-idling 2000 rpm with 13.7 nm.
The change in GMD derived from unfiltered to filtered PSDs is relatively homogeneous for measurements acquired with the catalytic stripper. No drastic changes in the shape of the contour plot can be observed, but rather an average increase of 20% from GMD (w CS) to F3-GMD > 10. An entirely different observation can be made for the metrics derived from data acquired without the catalytic stripper. The contour plot for GMD (w/o CS) exhibits high points at 1250 rpm with 40 Nm and fast-idling 2000 rpm with GMDs of 20.3 nm and 21 nm, respectively. The lowest points are at fast-idling 1500 rpm and 2000 rpm with 40 Nm, with GMDs of 9.2 nm and 11.5 nm, respectively. This observation could be interpreted as some volatile artefacts affecting the PSD shape. The noticeable shift in the contour plots would, in such a case, be the exclusion of said artefacts by the digital filtering, working as intended. Additional support for this hypothesis is the similarity between the F1-GMD > 23 plot with the GMD (w CS) and F3-GMD > 10 plots, i.e., those with assumed removal of volatiles. For the present test matrix, the shift from F1-GMD > 23 to F3-GMD > 10 effectively lowers the size thresholds, including particles of smaller diameters, without altering the underlying trends of speed and load.
In light of the regulatory size threshold, information on the size distribution could also be presented as sub-23 nm fractions of the PN (see Figure 7). This alternative to the GMD metric reveals that most emitted particles for the assessed operating conditions fall in the size range below 23 nm. The overall range of sub-23 nm fractions is similar between measurements without and with the catalytic stripper, with 52–93% and 58–92%, respectively. The F3-PN > 10 retains the majority of these particles and exhibits a range of 49–88% for this fraction. It should be noted that while the F1-PN > 23 removes most particles below 23 nm, still up to 35% of particles included in this metric are smaller than 23 nm. The trends and changes with engine speed and load are similar to the observations made for the GMD metrics above. However, the representation as sub-23 nm fraction highlights the proportion of particles below 23 nm in the exhaust gas more comprehensibly.
There is little coverage of engine testbed experiments in the literature that focus on sub-23 nm emissions. For example, some recent studies by Di Iorio et al. [40] and Catapano et al. [41] found higher fractions of particulates below 23 nm for a 2000 rpm operating condition compared to a 4000 rpm condition; more data can be found for exhaust measurements for vehicle testing drive cycles. Giechaskiel et al. [19] reported that 30% to 40% of particulates were excluded with the PMP that focuses on emissions above 23 nm. A larger scale study by Giechaskiel et al. [42] from 2020 found sub-23 nm fractions to be between 25% and 50%. Catapano et al. [43] found the sub-23 nm fraction to be between 20% and just over 40% for WLTC testing, with higher fractions for the medium and high phases. The fractions observed here are considerably higher than previously reported. This could be due to the nature of the experiments; i.e., steady-state operating conditions with an engine on a testbed rather than dynamic drive cycles with vehicles. However, it should further be investigated whether the measurement equipment could play a role in this.
As any volatile species are derived from either the hydrocarbon fuel or some species of the lubricating oil formulation, information on the total unburned hydrocarbons (THC) emissions can beneficial. The measured concentrations are displayed in Figure 8 as a methane-equivalent parts-per-million fraction. The highest THC concentration was observed for fast-idle at 1250 rpm with 4174 ppm, while the lowest value was recorded for 40 Nm load at 2250 rpm with 997 ppm. The contour plot for the investigated test matrix exhibits similarities in the underlying distribution shape to the plots for the particulate number emissions (see Figure 5). As the observation remains the same with and without the catalytic stripper, it can be assumed that the increase in PN stems from an elevated number of solid particulates rather than volatile artefacts. Consequently, a shift toward a smaller GMD would be expected. However, the GMD plots do not exhibit any apparent correlation with the THC emissions. A possible explanation for this could be that in addition to additional small particulates being formed, existing particles grow in size so as to balance the overall GMD. As for the PN, comparing the GMD of measurements with and without the catalytic stripper points to a solid nature of this particle growth, rather than stemming from volatile condensates. Notably, the PN spike at fast-idle 2000 rpm without catalytic stripper is not corresponding to a spike in THC. This would suggest that the species causing this spike are volatiles that are removable by the catalytic stripper, but are not hydrocarbons detectable by the THC analyser.

4. Conclusions

Particulate emissions of a 1.0 L GDI engine were measured for a test matrix of 15 operating conditions. Measurements were conducted with a DMS that was operated with and without a catalytic stripper. Moreover, different digital filtering functions were applied to implement specified counting efficiencie;, e.g., d50 = 23 nm/d90 = 41 nm as inspired by SPN23 of the established PMP, and d65 = 10 nm/d90 = 15 nm as included in the latest regulatory proposals for SPN10. The findings can be summarised in five groups:
-
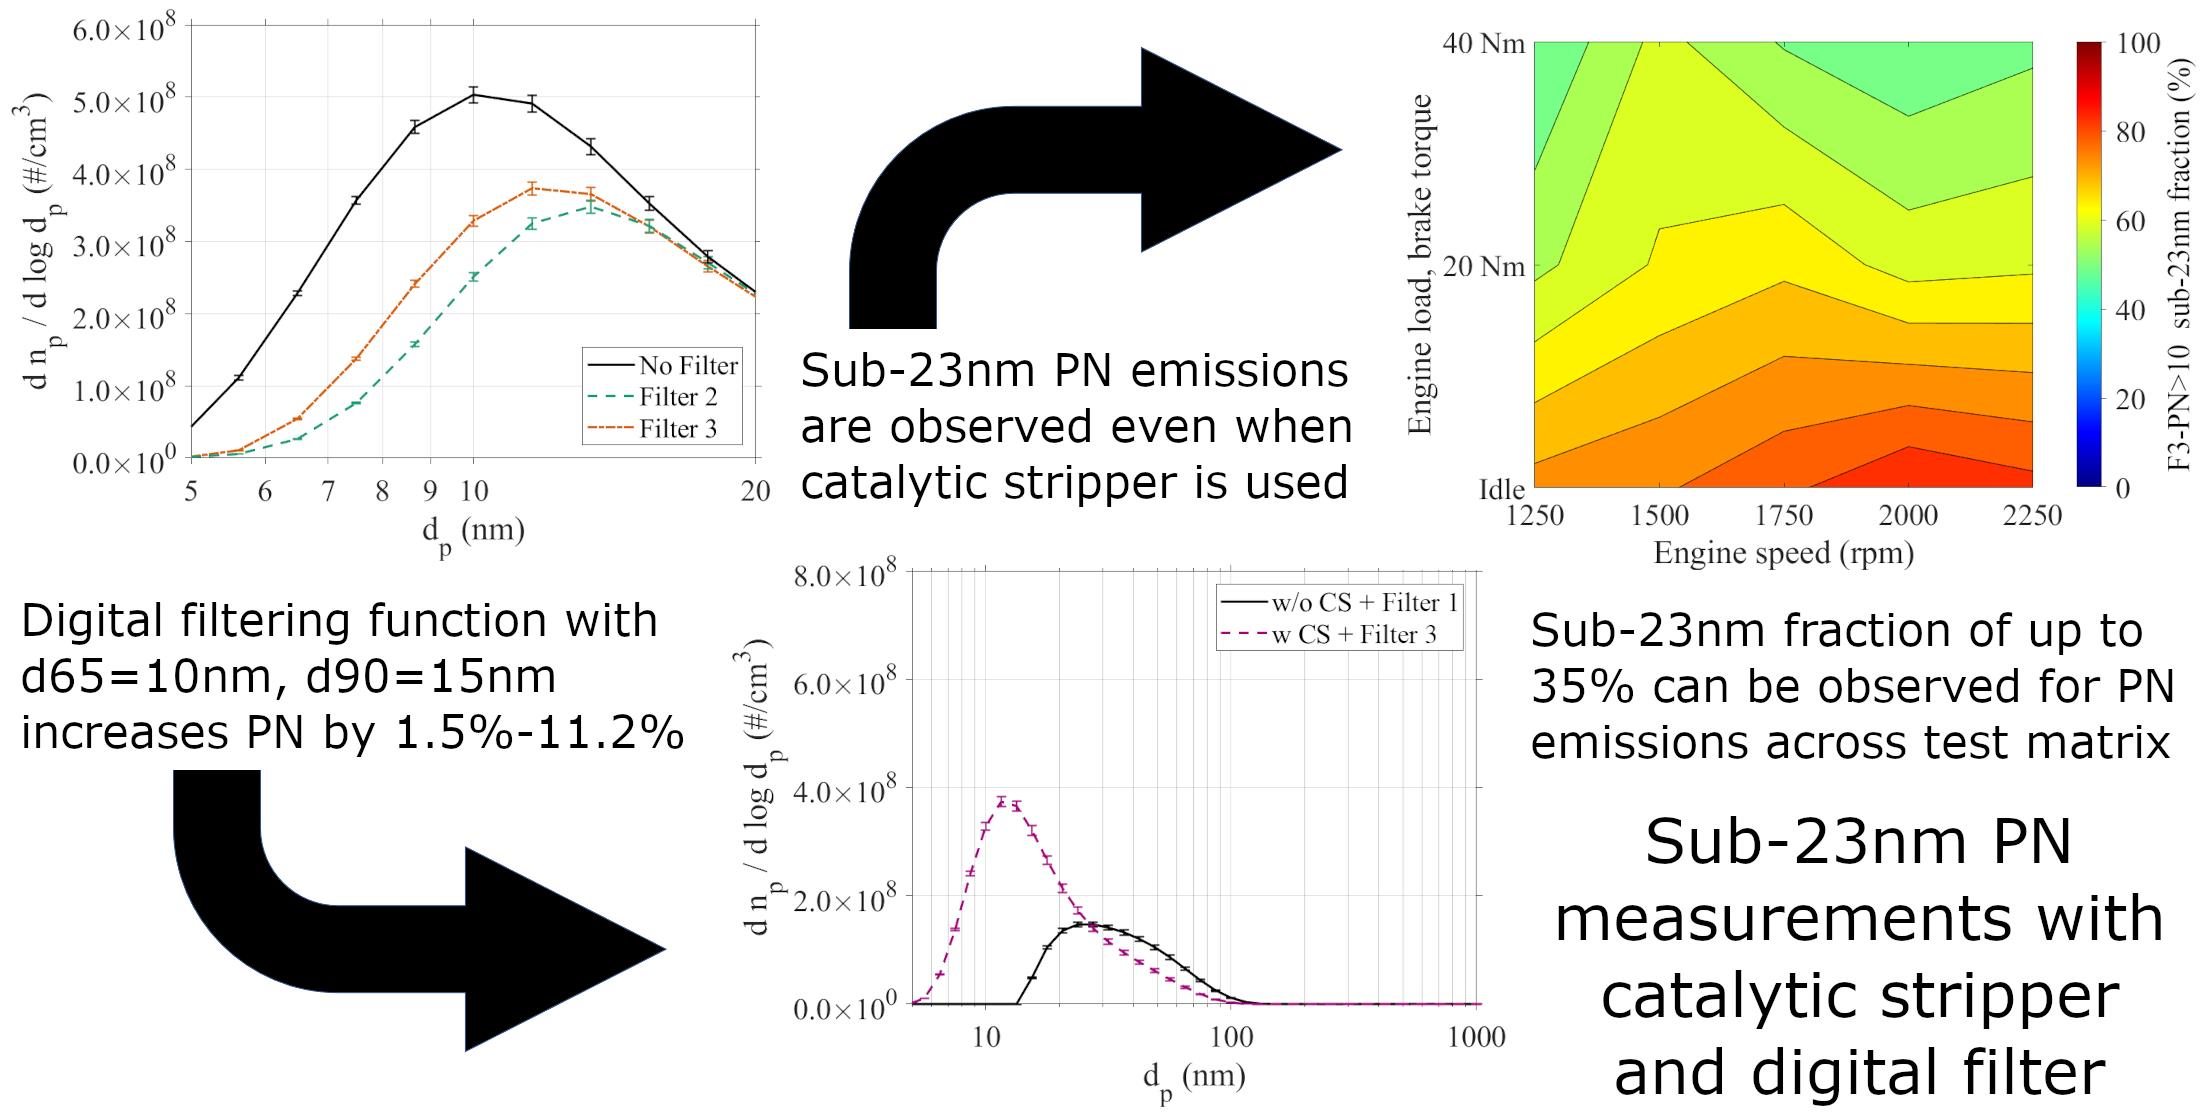
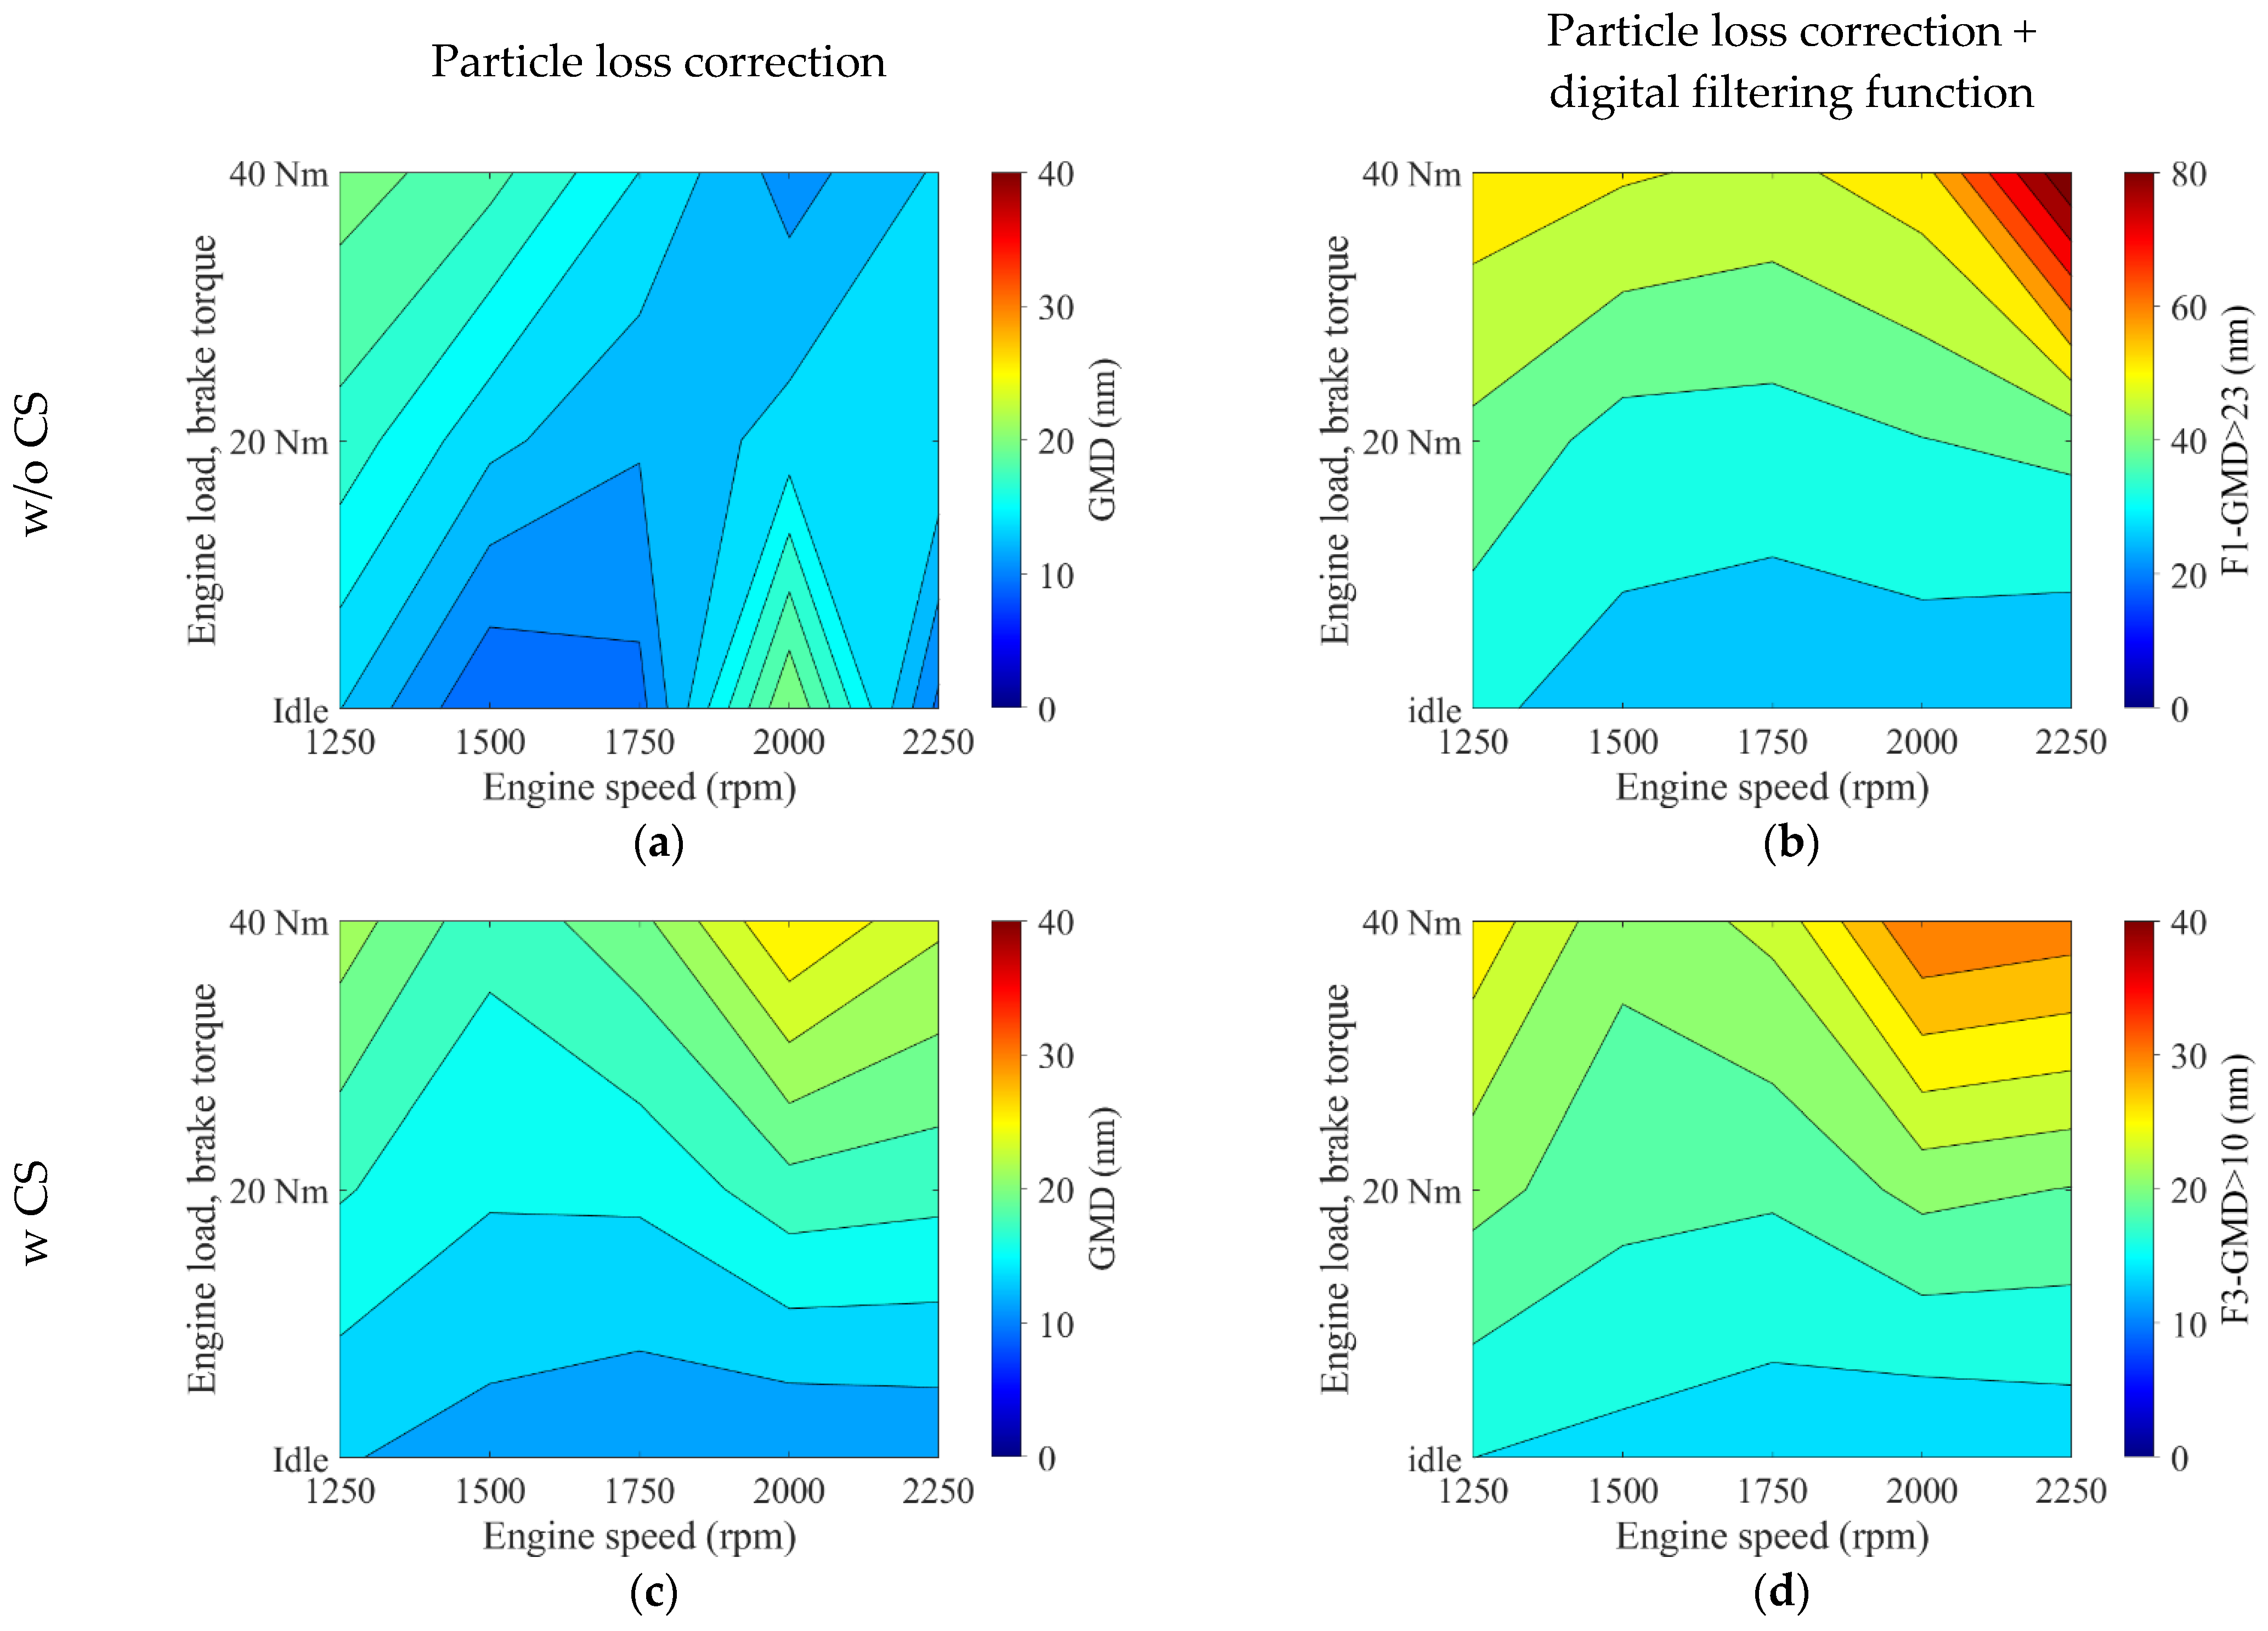
An updated filtering function for SPN10-inspired counting efficiencies was applied to measurements acquired while using a catalytic stripper. The results show an increase of up to 11.2% for PN > 10 compared with the closest previous sub-23 nm digital filtering function. However, this increase is highly dependent on the underlying PSD, with conditions of a smaller GMD exhibiting a greater shift. These observations confirm the findings of a previous study in which the function was proposed based on DMS measurements without a catalytic stripper.
-
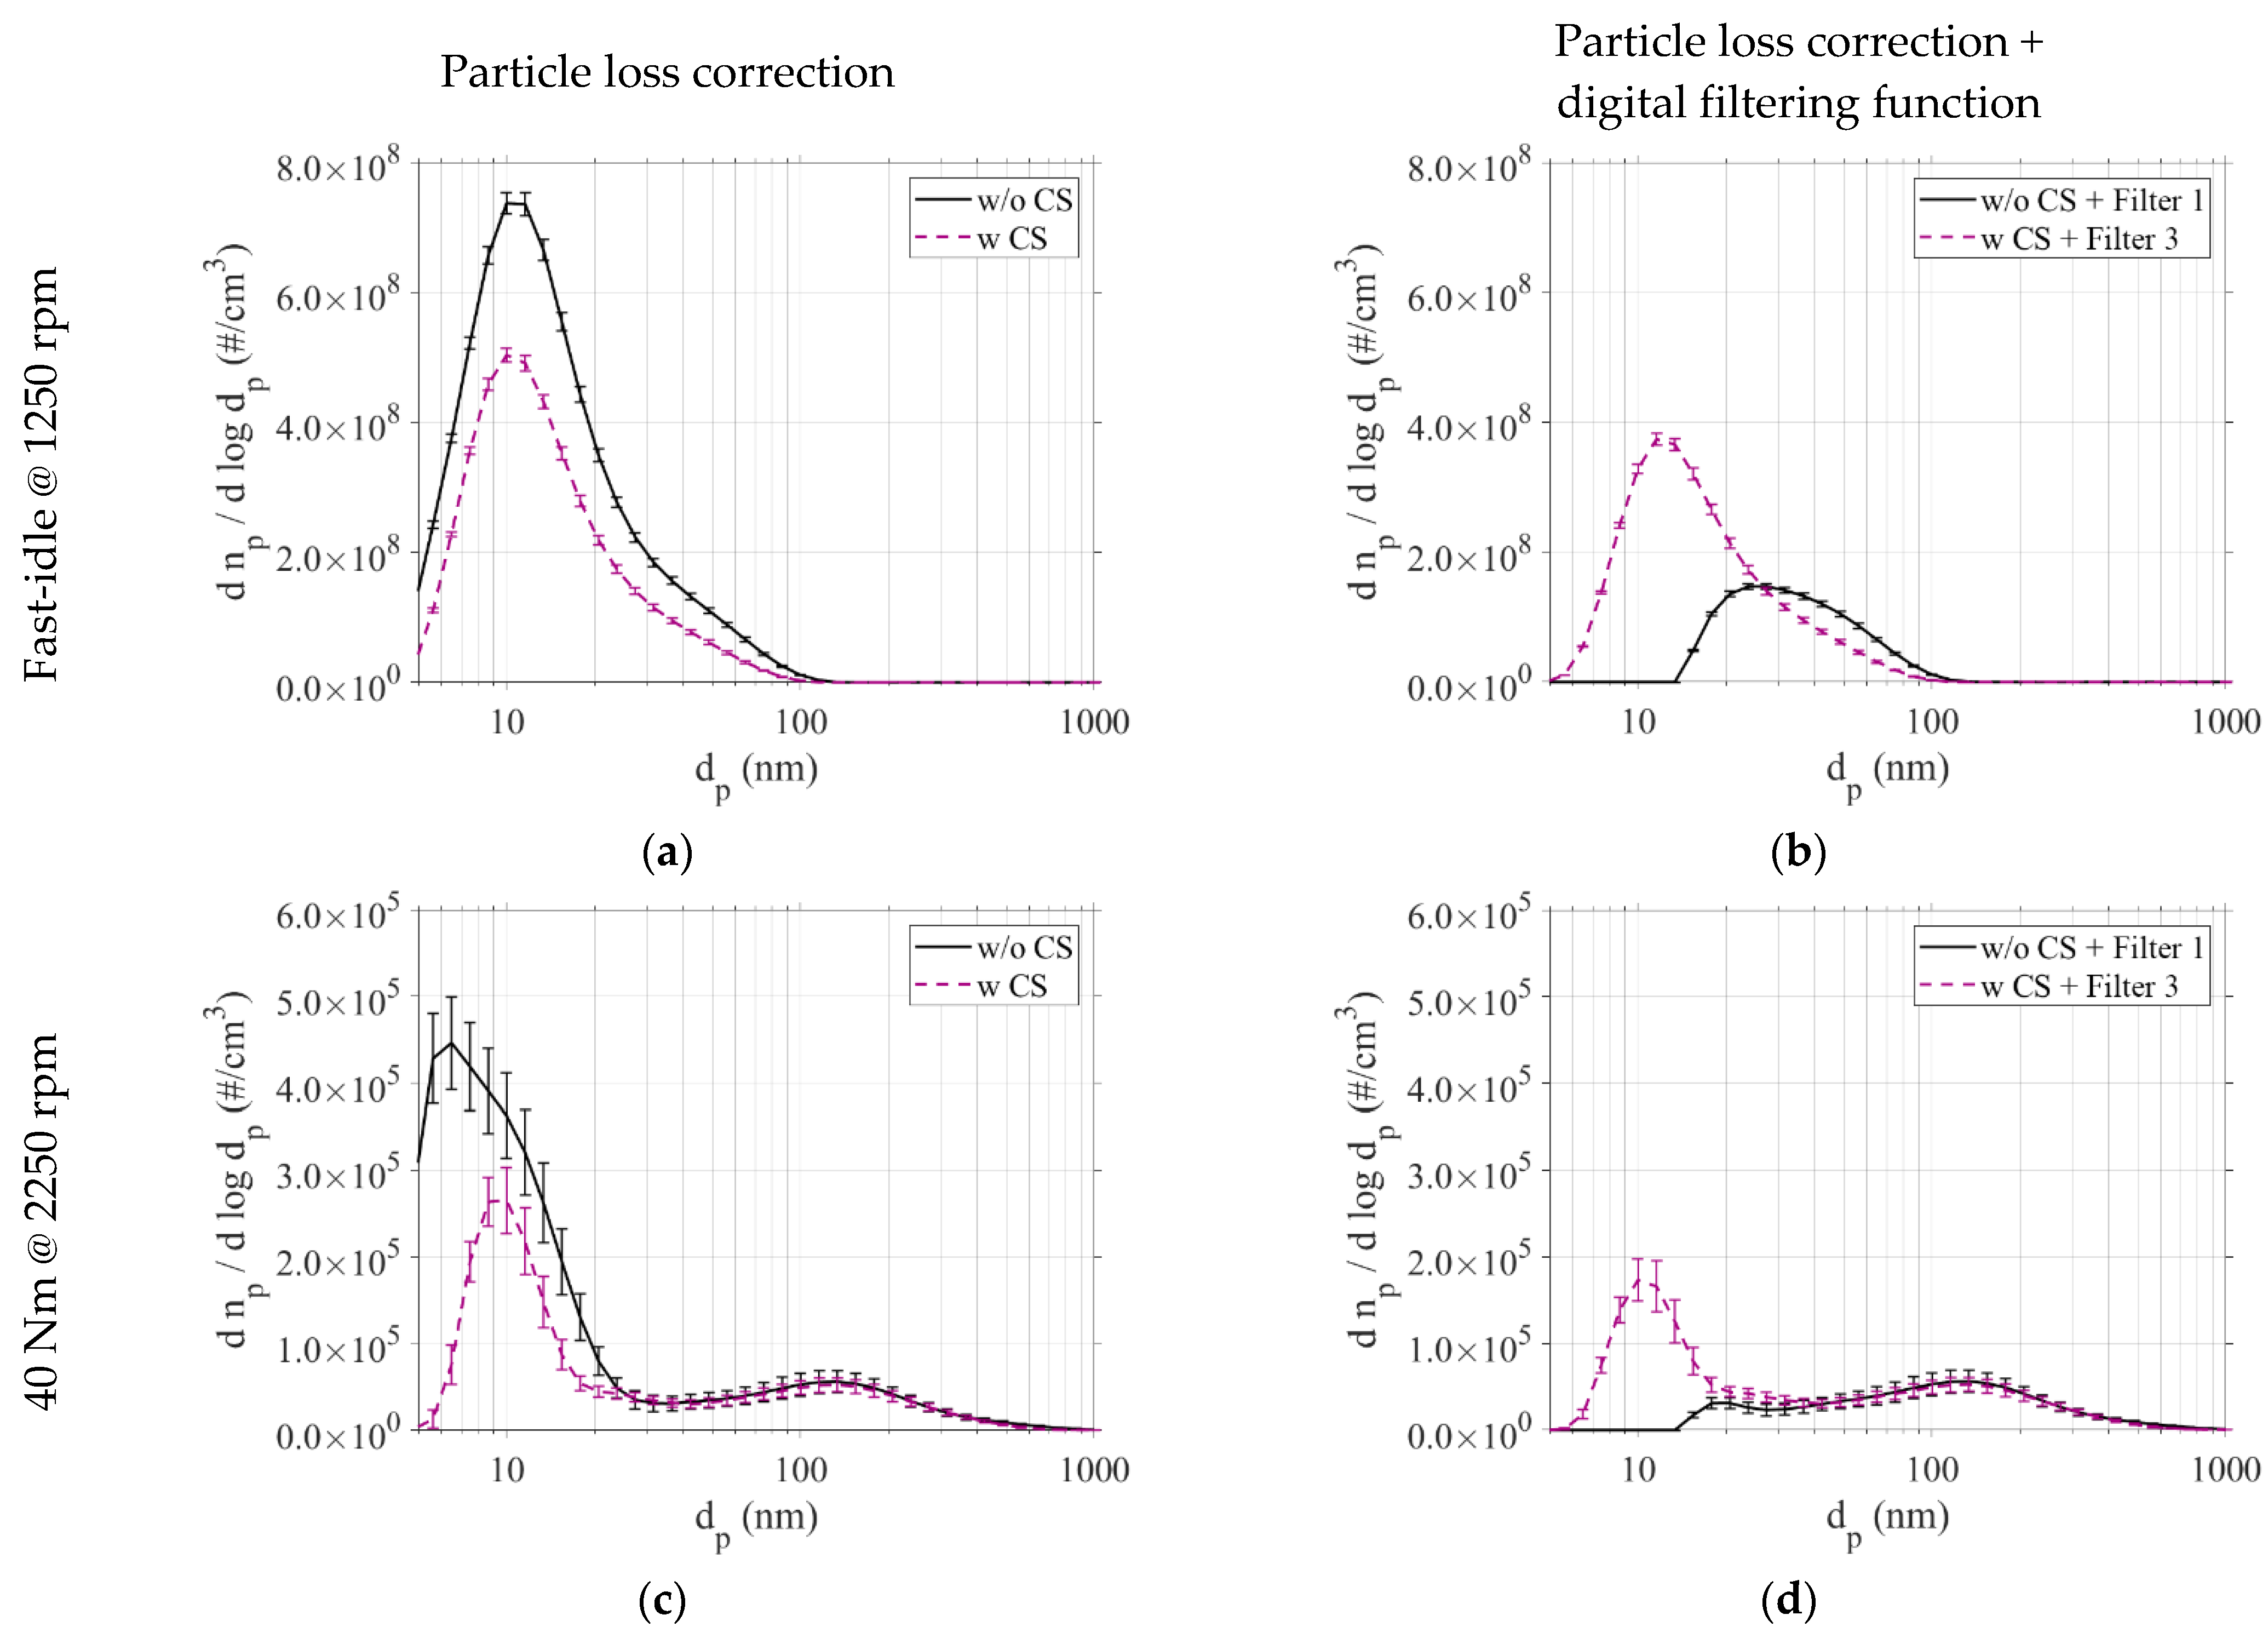
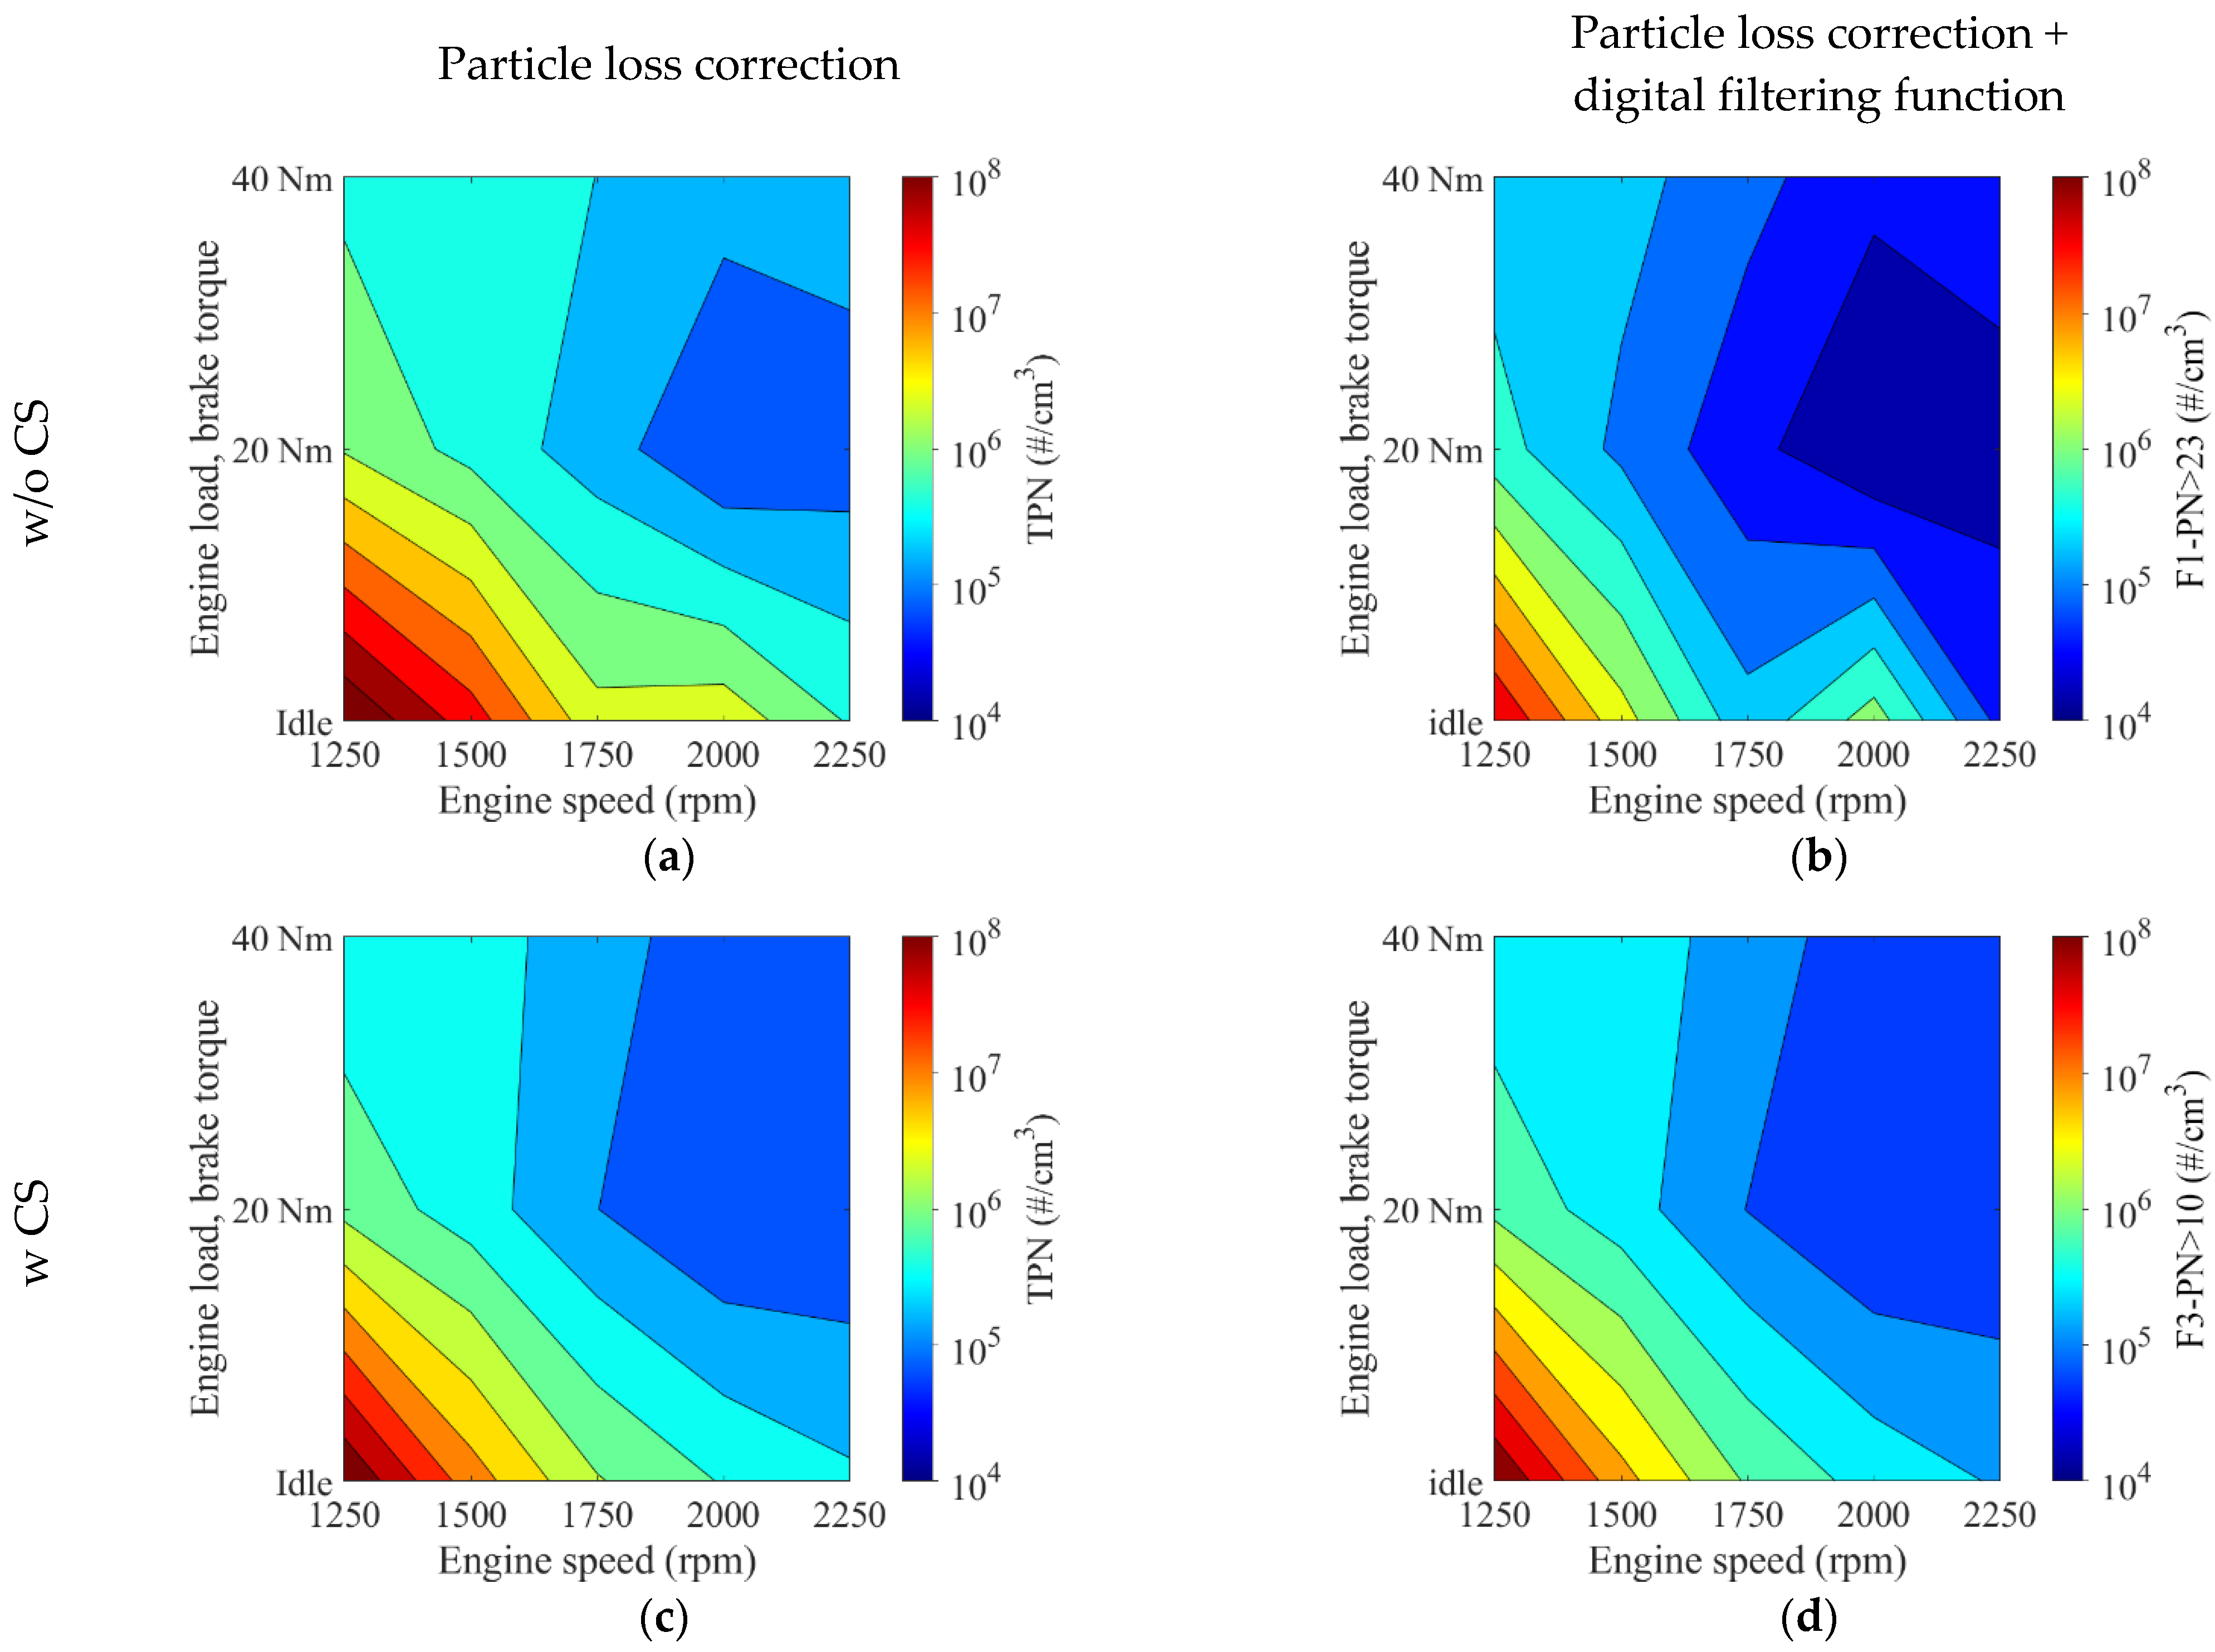
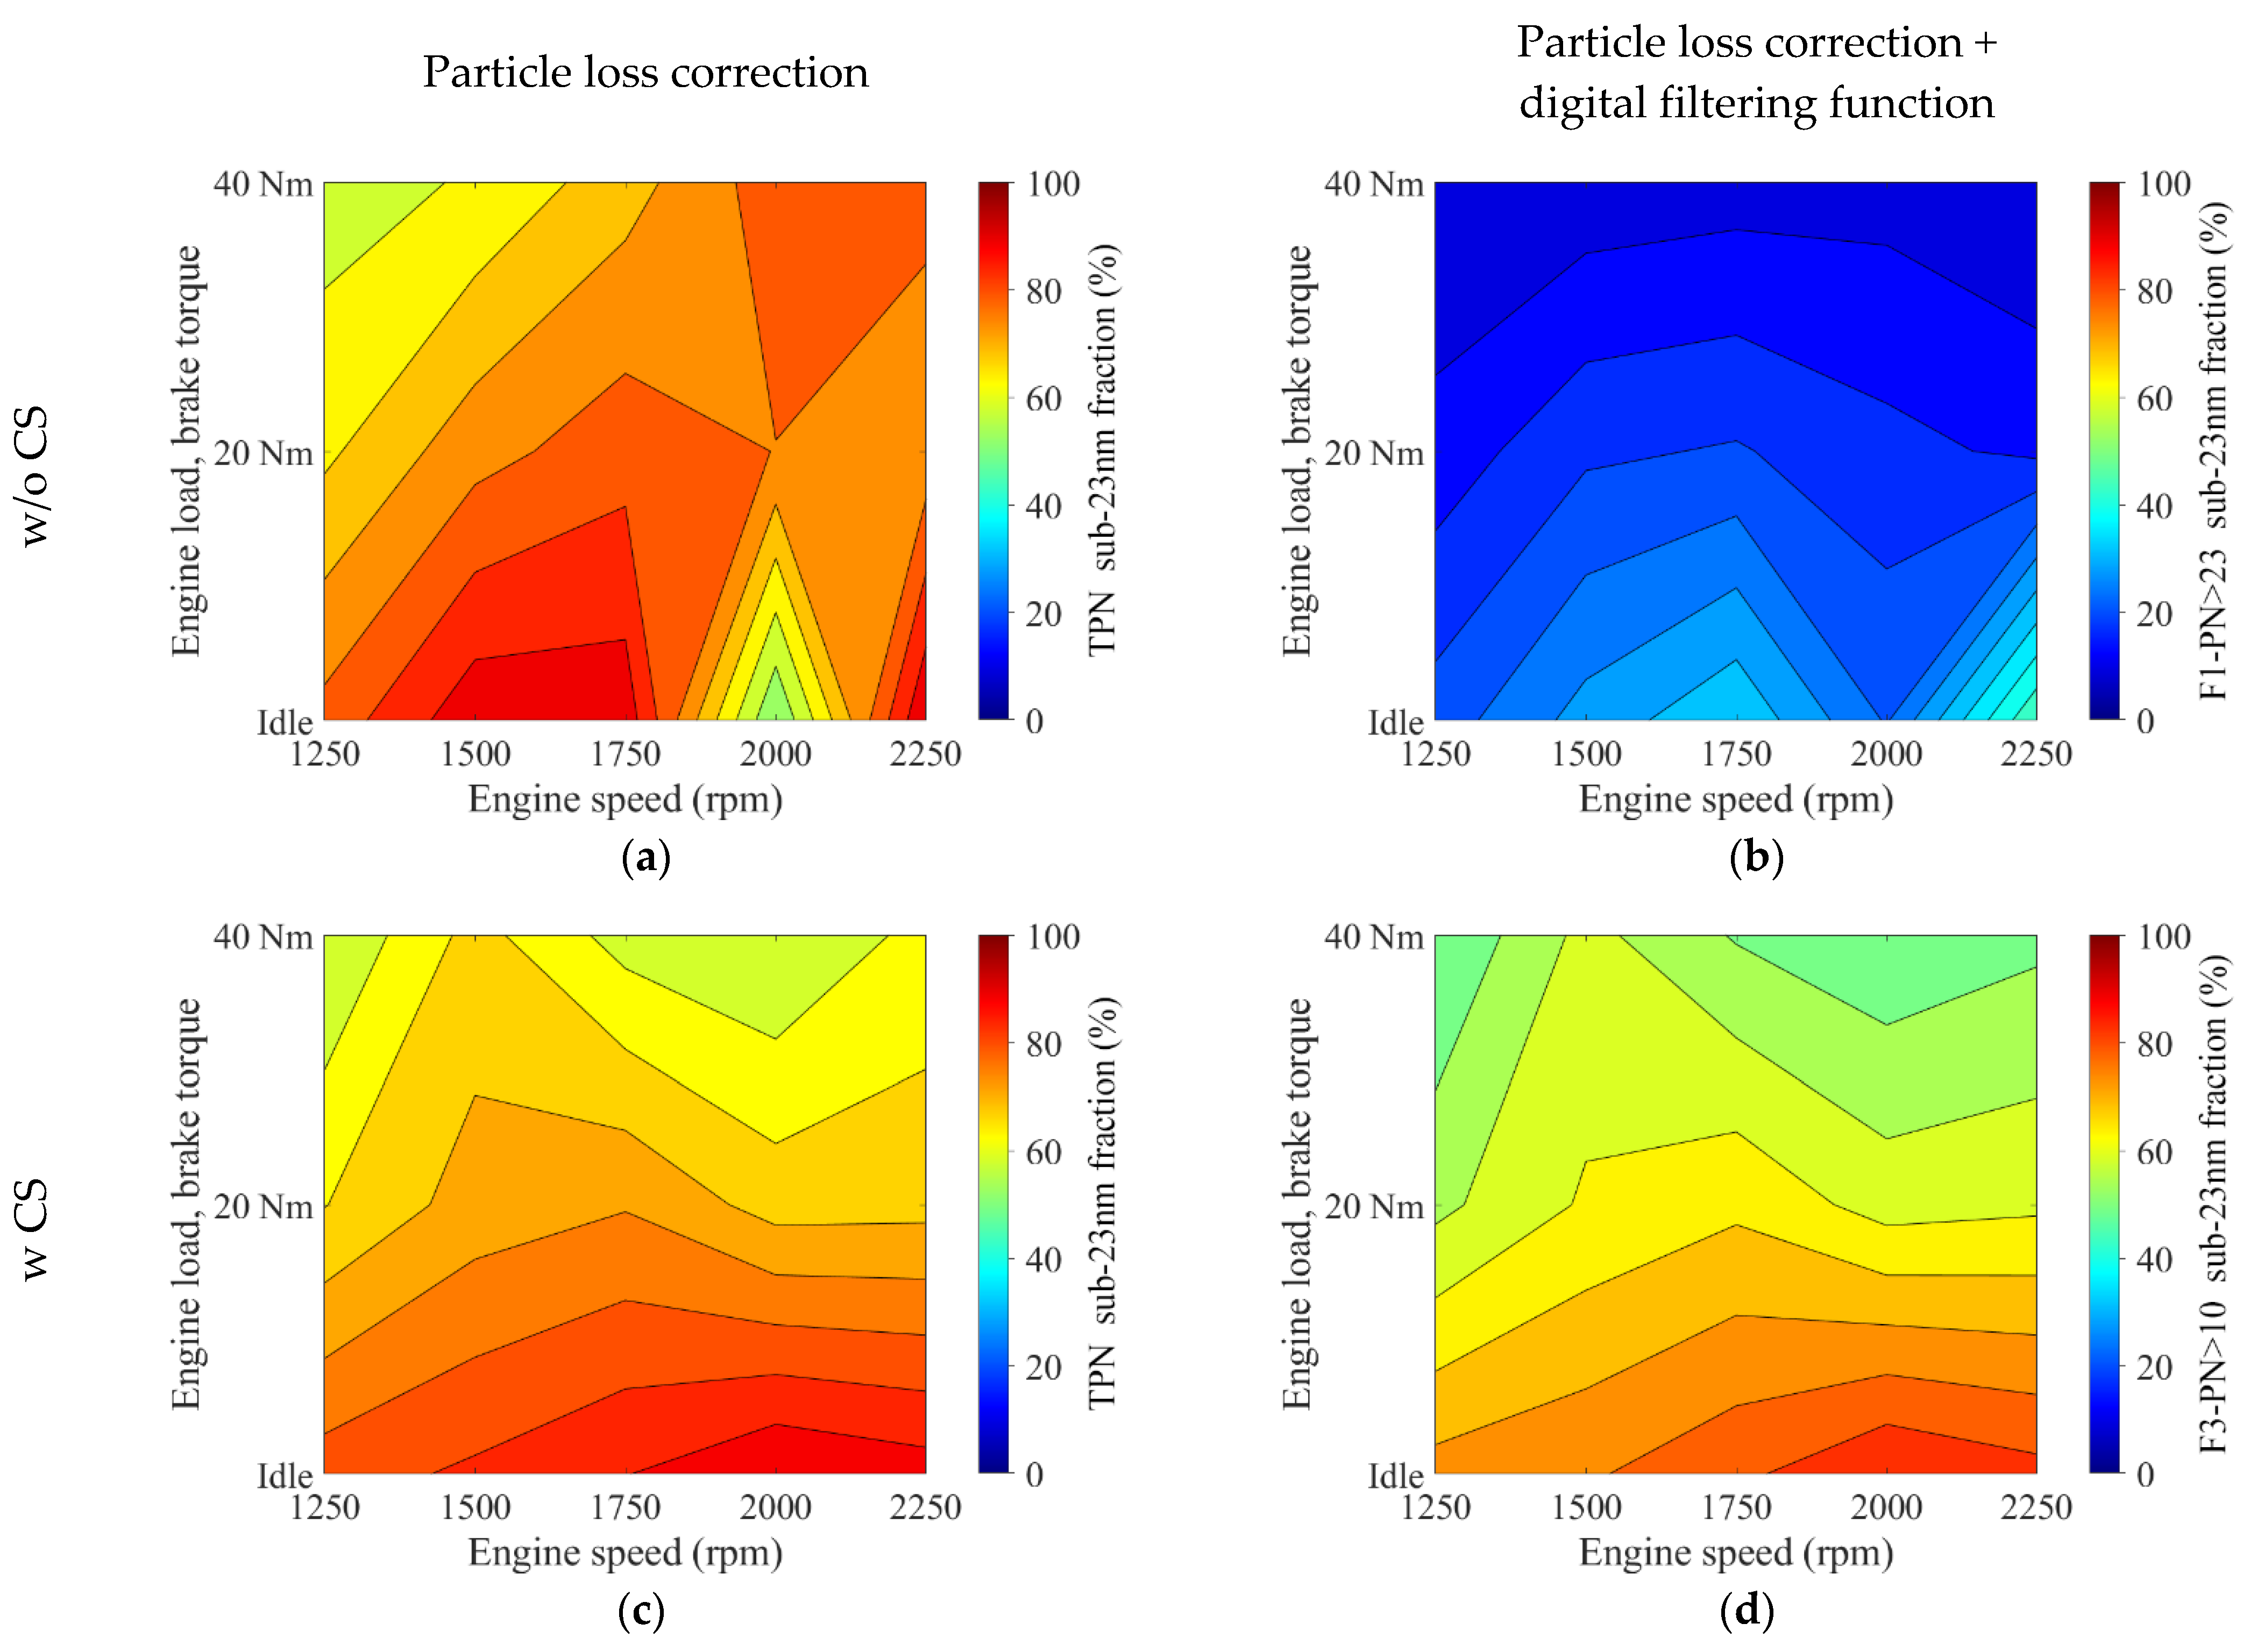
Directly comparing measurements with and without a catalytic stripper reveals that the catalytic stripper noticeably reduced variability in sub-23 nm particle concentration measurements. A significant portion of particles in this size regime remained that, thus, are assumed to be non-volatile solid particles. The shift from d50 = 23 nm/d90 = 41 nm digital filtering without the catalytic stripper (F1-PN > 23) to d65 = 10 nm/d90 = 15 nm digital filtering with the catalytic stripper (F3-PN > 10) leads to a considerable difference in the resulting PSD.
-
The measurements of the test matrix showed the highest PN emissions for fast-idle at 1250 rpm, regardless of using a catalytic stripper or the used digital filtering function. Specifically, the value doubled from F1-PN > 23 with 8 . 25 × 10 7   # / cm 3 to F3-PN > 10 of 1 . 93 × 10 8   # / cm 3 . The number of particulates generally increases when comparing the F3-PN > 10 with the F1-PN > 23, from as low as +27% at 1250 rpm with 40 Nm up to an almost four-fold +390% at 1750 rpm with 20 Nm.
-
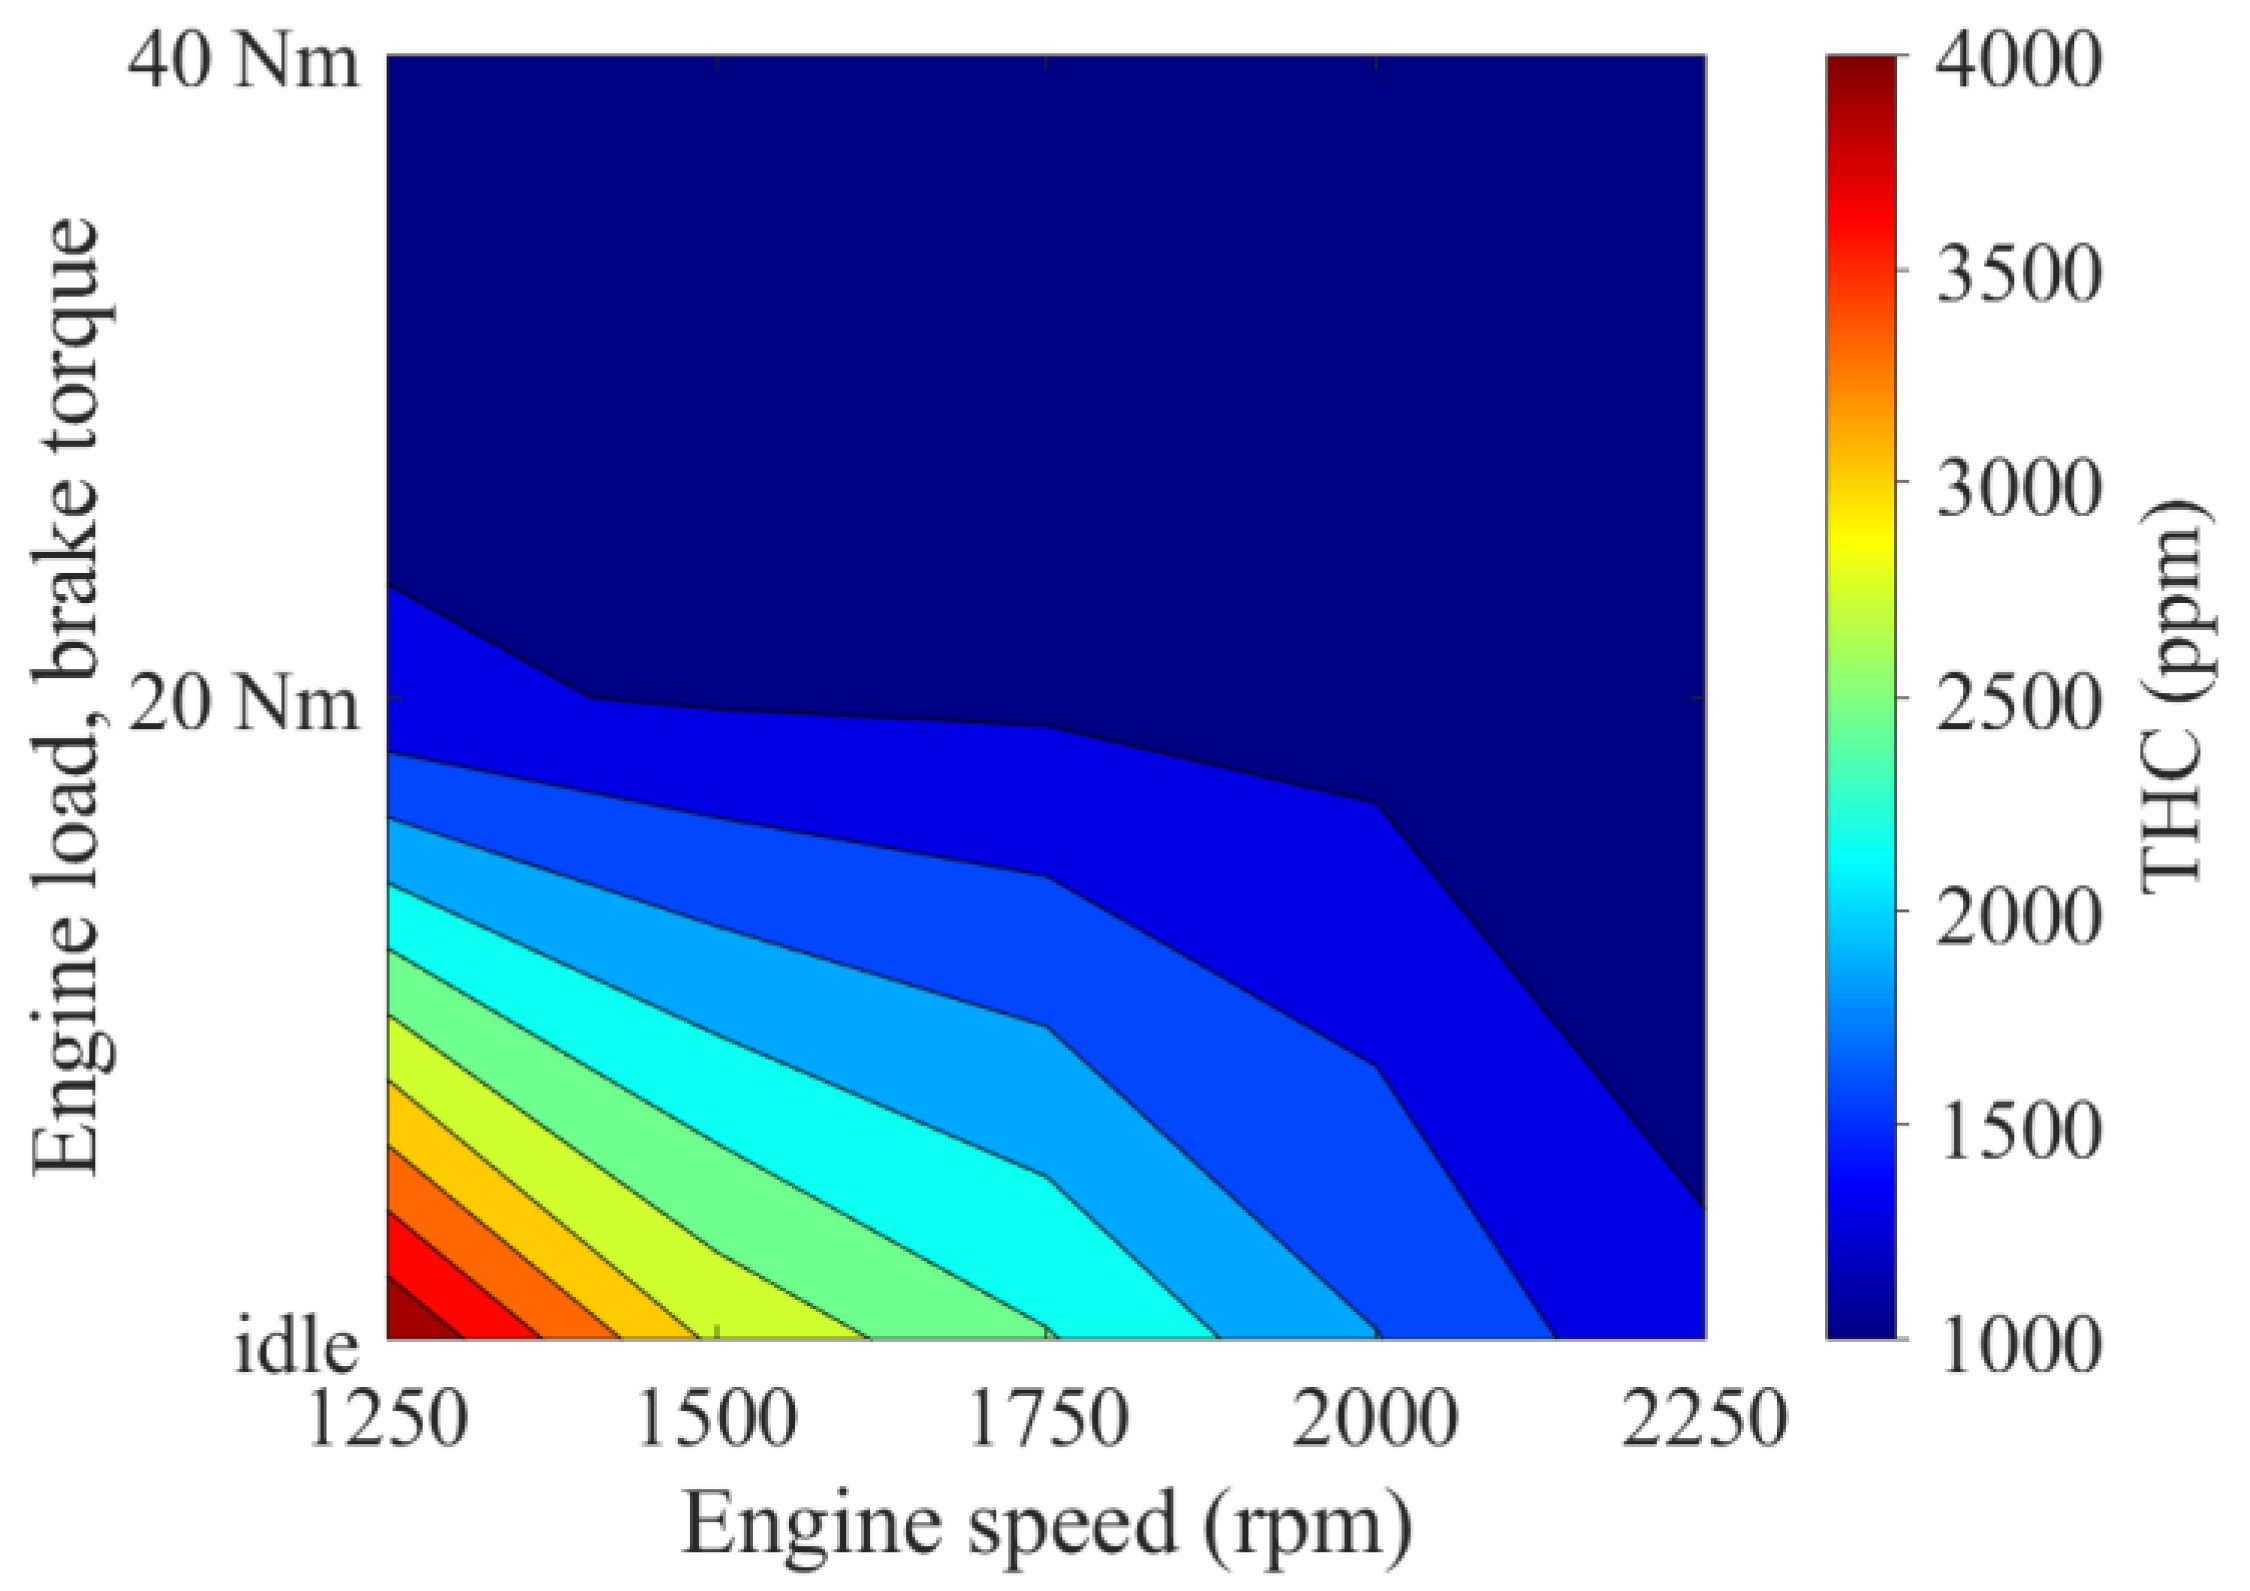
Investigation of engine metrics revealed a similar trend between PN and THC emissions. The remaining included metrics; exhaust gas temperature, spark timing, 50% MFB position, injection timing, and pressure, could not conclusively explain the observed patterns in the PN and GMD measurements.
Future work can comprise the investigation of transient operating conditions, as well as detailed tests into the role of engine parameters to determine their individual contribution towards sub-23 nm emissions. Moreover, investigations can further focus on measurements post three-way catalyst, and potentially also particulate filters. Validating measurement results from the DMS500 with a catalytic stripper and SPN10-inspired digital filtering function against a PMP SPN10 compliant measurement system is needed to show the comparability of these measurement approaches and allow for the direct comparisons of data sets. With a view on challenges in the market, the influence of various fuel formulations and lubricating oil chemistry would be of interest as well. Additional information can further be obtained by chemical analysis of the sub-23 nm particulates, or exhaust condensates that would also capture all volatiles species, if present.

Author Contributions

Conceptualization, S.A.P.; Methodology, S.A.P.; Software, S.A.P.; Investigation, S.A.P. and E.H.-S.; Data Curation, S.A.P.; Formal analysis, S.A.P.; Validation, S.A.P.; Visualization, S.A.P.; Writing—Original Draft, S.A.P. and E.H.-S.; Writing—review & editing S.A.P., E.H.-S., A.L.R. and A.C.; Supervision, A.L.R.; Funding acquisition, A.L.R. All authors have read and agreed to the published version of the manuscript.

Funding

This work was supported by the Engineering and Physical Sciences Research Council through the scholarship provided by EPSRC Thematic Programme in Low-Dimensional Materials and Interfaces for Sebastian Pfau [grant number EP/N50970X/1]. The authors further thank Lubrizol Limited for funding and supply of the fuel.

Data Availability Statement

The data presented in this study are available in the article.

Acknowledgments

The authors thank John Lane and Nigel Sykes for technical support with the engine setup.

Conflicts of Interest

The authors declare no conflict of interest.

References

  1. World Health Organization. Ambient Air Pollution: A Global Assessment of Exposure and Burden of Disease; World Health Organization: Geneva, Switzerland, 2016; ISBN 9789241511353.
  2. U.S. Environmental Protection Agency Health and Environmental Effects of Particulate Matter (PM). 2021. Available online: https://www.epa.gov/pm-pollution/health-and-environmental-effects-particulate-matter-pm (accessed on 11 July 2021).
  3. Jansen, K.L.; Larson, T.V.; Koenig, J.Q.; Mar, T.F.; Fields, C.; Stewart, J.; Lippmann, M. Associations between health effects and particulate matter and black carbon in subjects with respiratory disease. Environ. Health Perspect. 2005, 113, 1741–1746. [Google Scholar] [CrossRef] [PubMed]
  4. Bond, T.C.; Doherty, S.J.; Fahey, D.W.; Forster, P.M.; Berntsen, T.; DeAngelo, B.J.; Flanner, M.G.; Ghan, S.; Kärcher, B.; Koch, D.; et al. Bounding the role of black carbon in the climate system: A scientific assessment. J. Geophys. Res. Atmos. 2013, 118, 5380–5552. [Google Scholar] [CrossRef]
  5. Shindell, D.; Kuylenstierna, J.C.I.; Vignati, E.; van Dingenen, R.; Amann, M.; Klimont, Z.; Anenberg, S.C.; Muller, N.; Janssens-Maenhout, G.; Raes, F.; et al. Simultaneously mitigating near-term climate change and improving human health and food security. Science 2012, 335, 183–189. [Google Scholar] [CrossRef] [PubMed] [Green Version]
  6. European Environment Agency Exceedance of Air Quality Standards in Urban Areas. 2019. Available online: https://www.eea.europa.eu/data-and-maps/indicators/exceedance-of-air-quality-limit-3/assessment-5 (accessed on 11 July 2021).
  7. La Rocca, A.; Bonatesta, F.; Fay, M.W.; Campanella, F. Characterisation of soot in oil from a gasoline direct injection engine using transmission electron microscopy. Tribol. Int. 2015, 86, 77–84. [Google Scholar] [CrossRef]
  8. Maricq, M.M.; Podsiadlik, D.H.; Brehob, D.D.; Haghgooie, M. Particulate emissions from a direct-injection spark-ignition (DISI) engine 1999-01-1530. SAE Tech. Pap. 1999. [Google Scholar] [CrossRef]
  9. Zhao, H. (Ed.) Advanced Direct Injection Combustion Engine Technologies and Development: Diesel Engines; Woodhead Publishing: Cambridge, UK, 2009; ISBN 9781845697440. [Google Scholar]
  10. Piock, W.; Hoffmann, G.; Berndorfer, A.; Salemi, P.; Fusshoeller, B. Strategies towards meeting future particulate matter emission requirements in homogeneous gasoline direct injection engines. SAE Int. J. Engines 2011, 4, 1455–1468. [Google Scholar] [CrossRef] [Green Version]
  11. Peckham, M.S.; Finch, A.; Campbell, B.; Price, P.; Davies, M.T. Study of particle number emissions from a turbocharged gasoline direct injection (GDI) Engine including data from a fast-response particle size spectrometer 2011-01-1224. SAE Tech. Pap. 2011. [Google Scholar] [CrossRef]
  12. European Union. Council Directive 91/441/EEC of 26 June 1991 amending Directive 70/220/EEC on the approximation of the laws of the Member States relating to measures to be taken against air pollution by emissions from motor vehicles. Off. J. Eur. Communities 1991, L242, 1–106. [Google Scholar]
  13. European Union. Regulation (EC) No 715/2007 of the European Parliament and of the Council of 20 June 2007 on type approval of motor vehicles with respect to emissions from light passenger and commercial vehicles (Euro 5 and Euro 6) [...]. Off. J. Eur. Union 2007, L171, 1–16. [Google Scholar]
  14. Burtscher, H. Physical characterization of particulate emissions from diesel engines: A review. J. Aerosol Sci. 2005, 36, 896–932. [Google Scholar] [CrossRef]
  15. European Union. Commission Regulation (EC) No 692/2008 of 18 July 2008 implementing and amending Regulation (EC) No 715/2007 of the European Parliament and of the Council on type-approval of motor vehicles with respect to emissions [...]. Off. J. Eur. Union 2008, L199, 1–136. [Google Scholar]
  16. Andersson, J.; Giechaskiel, B.; Muñoz-Bueno, R.; Sandbach, E.; Dilara, P. Particle Measurement Programme (PMP) Light-Duty Inter-Laboratory Correlation Exercise (ILCE_LD) Final Report; European Commission: Ispra, Italy, 2007.
  17. Giechaskiel, B.; Dilara, P.; Andersson, J. Particle measurement programme (PMP) light-duty inter-laboratory exercise: Repeatability and reproducibility of the particle number method. Aerosol Sci. Technol. 2008, 42, 528–543. [Google Scholar] [CrossRef]
  18. Martini, G.; Giechaskiel, B.; Dilara, P. Future European emission standards for vehicles: The importance of the UN-ECE particle measurement programme. Biomarkers 2009, 14, 29–33. [Google Scholar] [CrossRef] [PubMed]
  19. Giechaskiel, B.; Manfredi, U.; Martini, G. Engine exhaust solid sub-23 nm particles: I. Literature survey. SAE Int. J. Fuels Lubr. 2014, 7, 950–964. [Google Scholar] [CrossRef]
  20. Giechaskiel, B.; Joshi, A.; Ntziachristos, L.; Dilara, P. European regulatory framework and particulate matter emissions of gasoline light-duty vehicles: A review. Catalysts 2019, 9, 586. [Google Scholar] [CrossRef] [Green Version]
  21. United Nations Economic Commission for Europe PMP 52th Session [sic]. 2020. Available online: https://wiki.unece.org/display/trans/PMP+52th+Session (accessed on 11 July 2021).
  22. United Nations Economic Commission for Europe Final Report on the Development of Amendment 6 to Global Technical Regulation No. 15 on Worldwide Harmonized Light Vehicles Test Procedures (WLTP), Informal document GRPE-81-15. 2020. Available online: https://unece.org/DAM/trans/doc/2020/wp29grpe/GRPE-81-15e.pdf (accessed on 11 July 2021).
  23. Samaras, Z.; Rieker, M.; Papaioannou, E.; van Dorp, W.F.; Kousoulidou, M.; Ntziachristos, L.; Andersson, J.; Bergmann, A.; Hausberger, S.; Keskinen, J.; et al. Perspectives for regulating 10 nm particle number emissions based on novel measurement methodologies. J. Aerosol Sci. 2022, 162, 105957. [Google Scholar] [CrossRef]
  24. Giechaskiel, B.; Melas, A.; Martini, G.; Dilara, P. Overview of vehicle exhaust particle number regulations. Processes 2021, 9, 2216. [Google Scholar] [CrossRef]
  25. Giechaskiel, B.; Melas, A.; Martini, G.; Dilara, P.; Ntziachristos, L. Revisiting total particle number measurements for vehicle exhaust regulations. Atmosphere 2022, 13, 155. [Google Scholar] [CrossRef]
  26. Kulkarni, P.; Baron, P.A.; Willeke, K. (Eds.) Aerosol Measurement: Principles, Techniques, and Applications, 3rd ed.; John Wiley & Sons: Hoboken, NJ, USA, 2011; ISBN 9781118001684. [Google Scholar]
  27. Braisher, M.; Stone, R.; Price, P. Particle number emissions from a range of European vehicles 2010-01-0786. SAE Tech. Pap. 2010. [Google Scholar] [CrossRef]
  28. Pfau, S.A.; Haffner-Staton, E.; La Rocca, A. Measurement of sub-23 nm particulate emissions from GDI engines: A comparison of processing methods 2021-01-0626. SAE Tech. Pap. 2021. [Google Scholar] [CrossRef]
  29. Leach, F.C.P. Particulate Emissions from Gasoline Direct Injection Engines. Ph.D. Thesis, University of Oxford, Oxford, UK, 2014. [Google Scholar]
  30. Leach, F.; Stone, R.; Richardson, D.; Lewis, A.; Akehurst, S.; Turner, J.; Remmert, S.; Campbell, S.; Cracknell, R.F. Particulate emissions from a highly boosted gasoline direct injection engine. Int. J. Engine Res. 2018, 19, 347–359. [Google Scholar] [CrossRef]
  31. Leach, F.C.P.; Stone, R.; Richardson, D.; Turner, J.W.G.; Lewis, A.; Akehurst, S.; Remmert, S.; Campbell, S.; Cracknell, R. The effect of oxygenate fuels on PN emissions from a highly boosted GDI engine. Fuel 2018, 225, 277–286. [Google Scholar] [CrossRef]
  32. Leach, F.C.P.; Stone, R.; Richardson, D.; Lewis, A.G.J.; Akehurst, S.; Turner, J.W.G.; Shankar, V.; Chahal, J.; Cracknell, R.F.; Aradi, A. The effect of fuel composition on particulate emissions from a highly boosted GDI engine—An evaluation of three particulate indices. Fuel 2019, 252, 598–611. [Google Scholar] [CrossRef]
  33. Leach, F.; Lewis, A.; Akehurst, S.; Turner, J.; Richardson, D. Sub-23 nm particulate emissions from a highly boosted GDI engine 2019-24-0153. SAE Tech. Pap. 2019. [Google Scholar] [CrossRef] [Green Version]
  34. Giechaskiel, B.; Lähde, T.; Suarez-Bertoa, R.; Clairotte, M.; Grigoratos, T.; Zardini, A.; Perujo, A.; Martini, G. Particle number measurements in the European legislation and future JRC activities. Combust. Engines 2018, 174, 3–16. [Google Scholar] [CrossRef]
  35. Horn, H.G. PEMs4Nano Report: Calibrated CPC with D50 <= 10 nm for Laboratory Use—Together with the Documented Calibration Procedure. 2017. Available online: https://www.pems4nano.eu/download/public_reports/reports_of_project_results_deliverables/PEMs4Nano-D2.05-Calibrated-CPC-with-D50-10nm-for-PEMS-use-PU-2018-03-30.pdf (accessed on 11 July 2021).
  36. Pfau, S.A. Nanoscale Characterisation of Soot Particulates from Gasoline Direct Injection Engines. Ph.D. Thesis, University of Nottingham, Nottingham, UK, 2021. [Google Scholar]
  37. Kumar, P.; Fennell, P.; Symonds, J.; Britter, R. Treatment of losses of ultrafine aerosol particles in long sampling tubes during ambient measurements. Atmos. Environ. 2008, 42, 8819–8826. [Google Scholar] [CrossRef] [Green Version]
  38. Duca, D.; Rahman, M.; Carpentier, Y.; Pirim, C.; Boies, A.; Focsa, C. Chemical characterization of size-selected nanoparticles emitted by a gasoline direct injection engine: Impact of a catalytic stripper. Fuel 2021, 294, 120317. [Google Scholar] [CrossRef]
  39. Bokor, C.; Rohani, B.; Humphries, C.; Morrey, D.; Bonatesta, F. Investigating the impact of gasoline composition on PN in GDI engines using an improved measurement method. Int. J. Engine Res. 2021, 22, 3391–3406. [Google Scholar] [CrossRef]
  40. Di Iorio, S.; Catapano, F.; Magno, A.; Sementa, P.; Vaglieco, B.M. Investigation on sub-23 nm particles and their volatile organic fraction (VOF) in PFI/DI spark ignition engine fueled with gasoline, ethanol and a 30 %v/v ethanol blend. J. Aerosol Sci. 2021, 153, 105723. [Google Scholar] [CrossRef]
  41. Catapano, F.; Di Iorio, S.; Magno, A.; Vaglieco, B.M. Effect of fuel quality on combustion evolution and particle emissions from PFI and GDI engines fueled with gasoline, ethanol and blend, with focus on 10–23 nm particles. Energy 2022, 239, 122198. [Google Scholar] [CrossRef]
  42. Giechaskiel, B.; Woodburn, J.; Szczotka, A.; Bielaczyc, P. Particulate matter (PM) emissions of Euro 5 and Euro 6 vehicles using systems with evaporation tube or catalytic stripper and 23 nm or 10 nm counters 2020-01-2203. SAE Tech. Pap. 2020. [Google Scholar] [CrossRef]
  43. Catapano, F.; Di Iorio, S.; Magno, A.; Sementa, P.; Vaglieco, B.M. Effect of ethanol blends, E10, E25 and E85 on sub-23 nm particle emissions and their volatile fraction at exhaust of a high-performance GDI engine over the WLTC. Fuel 2022, 327, 125184. [Google Scholar] [CrossRef]
Figure 1. Schematic of the engine test setup with connected measurement instruments.
Fuels 03 00041 g001
Figure 2. Correction model for penetration efficiencies of particles to the DMS after transfer through the heated sampling line (HSL) and after combined HSL plus catalytic stripper (CS). Model provided by Cambustion.
Fuels 03 00041 g002
Figure 3. Particle size distributions (PSDs) for DMS measurements with the catalytic stripper and applied particle loss correction, for fast-idle operation at 1250 rpm (a,b) and 40 Nm at 2250 rpm (c,d). The subfigures (b,d) show enlarged PSD sections below 20 nm of (a,c), respectively. Filter 2: d50 = 10 nm, d90 = 15 nm. Filter 3: d65 = 10 nm, d90 = 15 nm. Error bars indicate 95% confidence intervals.
Fuels 03 00041 g003
Figure 4. Particle size distributions (PSDs) for DMS measurements with and without catalytic stripper (CS), for fast-idle operation at 1250 rpm (a,b) and 40 Nm at 2250 rpm (c,d). The PSDs in subfigures (a,c) have been particle loss corrected. The PSDs in subfigures (b,d) have been digitally filtered in addition to the particle loss correction. For the digital filtering, Equation (1) was applied for Filter 1 (i.e., F1-PN > 23) and Equation (3) for Filter 3 (i.e., F3-PN > 10). Error bars indicate 95% confidence intervals.
Fuels 03 00041 g004
Figure 5. Total particle number (TPN) by engine speed and load for DMS measurements with and without catalytic stripper (CS) in subfigures (c,d) and (a,b), respectively. The data displayed in subfigures (a,c) has been particle loss corrected. The data displayed in subfigures (b,d) has been digitally filtered in addition to the particle loss correction. For the digital filtering, Equation (1) was applied for F1-PN > 23 and Equation (3) for F3-PN > 10.
Fuels 03 00041 g005
Figure 6. Geometric mean diameter (GMD) by engine speed and load for DMS measurements with and without catalytic stripper (CS) in subfigures (c,d) and (a,b), respectively. The data displayed in subfigures (a,c) has been particle loss corrected. The data displayed in subfigures (b,d) has been digitally filtered in addition to the particle loss correction. For the digital filtering, Equation (1) was applied for F1-GMD > 23 and Equation (3) for F3-GMD > 10.
Fuels 03 00041 g006
Figure 7. Fraction of sub-23 nm particles by engine speed and load for DMS measurements with and without catalytic stripper (CS) in subfigures (c,d) and (a,b), respectively. The data displayed in subfigures (a,c) has been particle loss corrected. The data displayed in subfigures (b,d) has been digitally filtered in addition to the particle loss correction. For the digital filtering, Equation (1) was applied for F1-PN > 23 and Equation (3) for F3-PN > 10.
Fuels 03 00041 g007
Figure 8. Total unburned hydrocarbons (THC) emissions by engine speed and load.
Fuels 03 00041 g008
Table 1. Specifications of the three-cylinder GDI engine.
ParameterValue
Max. Power92 kW @ 6000 rpm
Max. Torque170 Nm @ 1400–4500 rpm
Bore71.9 mm
Stroke82.0 mm
Total Capacity999 cm3
Compression Ratio10.5:1
Injector5-hole solenoid
Max. Injection Pressure200 bar (common rail)
Table 2. Specification of the test fuel.
ParameterValue
RON98.4
MON87.1
DVPE62.7 kPa
FBP198.3 °C
Ethanol0%
Sulfur3.4 mg/kg
Publisher’s Note: MDPI stays neutral with regard to jurisdictional claims in published maps and institutional affiliations.

