Article

Modelling of Low-Voltage Varistors’ Responses under Slow-Front Overvoltages

1
Department of Electrical and Electronic Engineering Technology, University of Johannesburg, Johannesburg P.O. Box 17011, South Africa
2
School of Electronic and Electrical Engineering, Leeds University, Leeds LS2 9JT, UK
*
Authors to whom correspondence should be addressed.
Electron. Mater. 2023, 4(2), 62-79; https://doi.org/10.3390/electronicmat4020006
Submission received: 20 March 2023 / Revised: 4 May 2023 / Accepted: 5 May 2023 / Published: 9 May 2023
(This article belongs to the Special Issue Metal Oxide Semiconductors for Electronic Applications)

Abstract

:
In this study, commercially low-voltage MOVs are exposed to switching surges to analyse and model the relationship between the number of surges and the MOV grain barrier height response. Repeated slow-front overvoltage transients are used to degrade the protective qualities of metal oxide surge arrester devices, affecting their reliability and stability. A total of 360 MOVs with similar specifications from three different manufacturers are degraded under switching surges at a constant temperature of 60 °C. The reference voltage and C-V characteristics of MOVs are measured before and after the degradation process to analyse the MOVs’ conditions. Grain barrier heights are determined from the C-V characteristics curve. An F-statistical analysis is then applied to analyse the effects of number of surges on the grain barrier height. The T-test is used to assess the statistical difference between the tested groups. Linear regression analysis is then applied to model the relationship between the number of surges and MOV grain barrier height. The results obtained show that the number of surges has a significant impact on grain barrier height. MOV grain barrier height is found to decrease as the number of surges applied increases. Regression models obtained for the tested MOV groups across all three manufacturers agree and indicate that the reduction in grain barrier height results from an increased number of surges. Regression coefficients of a developed model indicate that for one surge applied, the MOV grain barrier height decreases by 0.024, 0.055, and 0.033 eV/cm for manufacturers X, Y, and Z, respectively. Therefore, there is a linear relationship between grain barrier height and the number of applied switching surges.

1. Introduction

Surge voltages occur in power systems and electronic circuits when there is a sudden increase in a system voltage that exceeds the desired operating voltage. These may result from electrostatic discharges, switching surges, and lightning surges. Switching surges consist of relatively high-amplitude surges with slower rise times than lightning surges. These types of surges usually result from the switching of solid-state circuit breakers for system fault clearing and inductive loads, converters, and resonant circuits [1,2,3]. The literature reveals that 50–70% of system overvoltages are caused by the internal switching of devices, as explained above. The switching surges resulting from capacitor banks cause inrush currents, stresses on the switching devices, and overvoltages on the system. Inrush currents result from uncharged capacitor banks drawing currents close to the fault current [4,5]. The widespread usage of converters and resonant circuits in low-voltage electrical systems makes switching surges unavoidable operational occurrences [6]. As a result of switching surges, the insulation breakdown strength of electrical and electronic equipment could be damaged, thus exposing them to catastrophic failure [2,3,4,5,6]. Therefore, to ensure the reliability and long-term stability of electrical and electronic components, protection from switching surges is essential. Metal oxide varistor (MOV) arresters are often used in electrical and electronic circuits for protection against overvoltages [7,8]. MOV arresters are designed to clamp both fast- and slow-front transient overvoltages to a safe voltage level lower than the basic insulation level (BIL) of the electrical equipment under surge protection. However, research carried out in this field shows that these overvoltage protection units often experience degradation and eventual failure as a result of a combination of factors, such as continuous AC and DC conduction, temperature, and the repeated discharge of high-magnitude surge currents [9,10,11,12,13,14]. Therefore, a condition assessment of MOV arresters is essential for the early detection of degradation. Condition assessments may focus on the analysis of electrical properties (V-I characteristics, leakage current, nonlinear coefficient, return voltage measurements, voltage decay, and C-V characteristics) as well as on the physical properties (grain boundaries and grain sizes) before and after specific test conditions [15,16,17,18,19,20]. Since these surge protection devices are quite popular and have proven to be effective in electronic systems, more attention should be directed to the understanding of MOV response to switching surges in order to assess its reliability under the aforementioned conditions. Currently, no comprehensive model describing the mechanism of the induced MOV degradation under slow-front surges at the microstructure level is available. MOV grain barrier height is the most important part of the microstructure, operating as an insulation layer between grain sizes. A reduction in the grain barrier height causes MOV grain size to increase and become more conductive, thus reducing the protection quality of MOVs. Therefore, condition monitoring of MOV grain barrier height is essential as it may serve as an indicator of the degradation rate under service. In this experimental work, MOVs are subjected to slow-front surges in order to assess the impact of the number of surges discharged through on the grain barrier height. The tests are performed based on the number of applied surges before MOV failure. The analysis of variance (ANOVA) is applied on the data obtained to validate whether or not the number of surges has some influence on the barrier height. The t-test is also employed to evaluate the significance of the difference between groups exposed to a set number of surges applied. The relationship between the number of switching surges and the change in grain barrier height under slow-front overvoltages is modelled using linear regression. Regression coefficients of a developed model indicate that for a one surge applied there is a decrease in MOV grain barrier height by 0.024, 0.055, and 0.033 eV/cm for manufacturers X, Y, and Z, respectively. The percentage change of the reference voltage is also monitored under each number of applied surges to validate the degradation of these devices. Results obtained from the ANOVA statistical test shows that the applied number of surges has a significant impact on the change in grain barrier height, and the t-test also showed a significant difference between the groups. The findings reveal a definitive and quantifiable relationship between the MOV’s degradation due to switching surges and the reduction in its grain barrier height, thereby demonstrating the suitability of the latter as a degradation indicator.

2. Review of Surge Degradation

The surge degradation of MOV arresters has been discussed in the literature. This has been mostly focused on lightning or fast-front surges:
Khanmiri [12] investigated the effect of degradation on the energy absorption capability (EAC) of low-voltage MOVs and found that the EAC of low-voltage MOVs decreases with degradation due to surges. Wang [16] analysed the deterioration characteristics of low-voltage MOVs under accelerated aging tests; 8/20 μs lightning impulse currents were applied on the MOVs, the current analyser was then developed to analyse the total and third harmonic currents of these MOVs under lightning current impulses and a continuous power frequency of 220 V. The results obtained indicate that MOVs deteriorate much faster, the reference voltage showed a decreasing trend with the increase in the total leakage current, resistive current, and third harmonic current. The work is related to the work carried out in [10,12,15], showing a decreasing trend in the reference voltages and an increase in leakage currents after applied lightning current impulses. Zhang [17] examined the effect of a multiple lightning waveform on the aging of Zinc Oxide Varistors (ZnO). MOVs were degraded under different numbers of impulses and pulse intervals. The relationship between the average ZnO temperature rise, pulse interval, and impact time is established. Energy absorption and heat transfer modelling are used for analysing the aging rate of MOVs under lightning strikes. It is reported that ZnO’s temperature rises higher and ages at a faster rate as a greater number of pulses are applied at smaller pulse intervals. The results obtained indicate that the energy sustained by a single current pulse has a nonlinear relationship with the energy sustained under multiple pulses at the same amplitude. However, ZnO subjected to multiple impulses degrades faster and ultimately yields an irreversible structural destruction.
Varistors’ electrical properties are greatly controlled by grain–boundary interface states in the microstructure. In the early 1980s, researchers discovered that the electrical properties of an MOV are fundamentally dependent on its microstructure and applied stress conditions [18,19]. The microstructure of MOVs consists of ZnO grains that are separated by thin layers in between them called intergranular layers, with grain sizes and thicknesses that act as insulating barriers which divide the grain boundaries of grain sizes [8,20]. The V-I characteristics of the ZnO bulk result from all the responses collected on the grains and grain boundaries, and it is for this reason that the high nonlinearity of these devices is independent of all the chemical processes but grain conduction [20,21]. Researchers in this field indicated that when degradation occurs, the grain sizes increase and therefore the grain barrier height decreases [12,22,23]. Li et al. [12] studied the effect of ac degradation of high-voltage-gradient ZnO varistors doped with Bi 2 O 3 and found that degradation affects the ZnO grain size. The Bi 2 O 3 additive has a key role in the reduction in double Schottky barrier height, which is attributed to the increases in ZnO grain size. Plata [22] studied the degradation of ZnO-based surge arrestors under field conditions, SEM was used to analyse the microstructure. It is reported that impulse/lightning surge degradation has a greater effect on the microstructure compared to electro-thermal degradation. The work further reported that Bi 2 O 3 along the grain boundaries has an influence on the Schottky barrier height. Zhao [23] investigated the effect of sintering temperatures on ZnO varistors’ microstructure and electrical properties when doped with Ga 2 O 3 ; he reported that the average grain size increases as the sintering temperature increases, and the calculated barrier height shows a decreasing trend. Eda [24] used thermally stimulated current to observe MOV degradation under DC bias to understand the changes occurring within the ZnO barriers of varistors. He reported that changes in the bias-voltage dependency of the capacitance were certainly due to some transformation within the double Schottky barrier. Modine [25] studied the fast response of ZnO varistors and reported that electron and hole trapping effects at the grain boundary region were related to a drop in the barriers at the grain boundaries and to the electrical device’s history. Donor density and the barrier height of ZnO Bi 2 O 3 varistor samples are calculated by a 1/C2-V plot in [26,27,28]. This survey indicates that although switching or slow-front surges are more common, little attention has been afforded to the mechanism of MOV degradation under these surges or to the impact of the number of surges on the setting on of degradation.

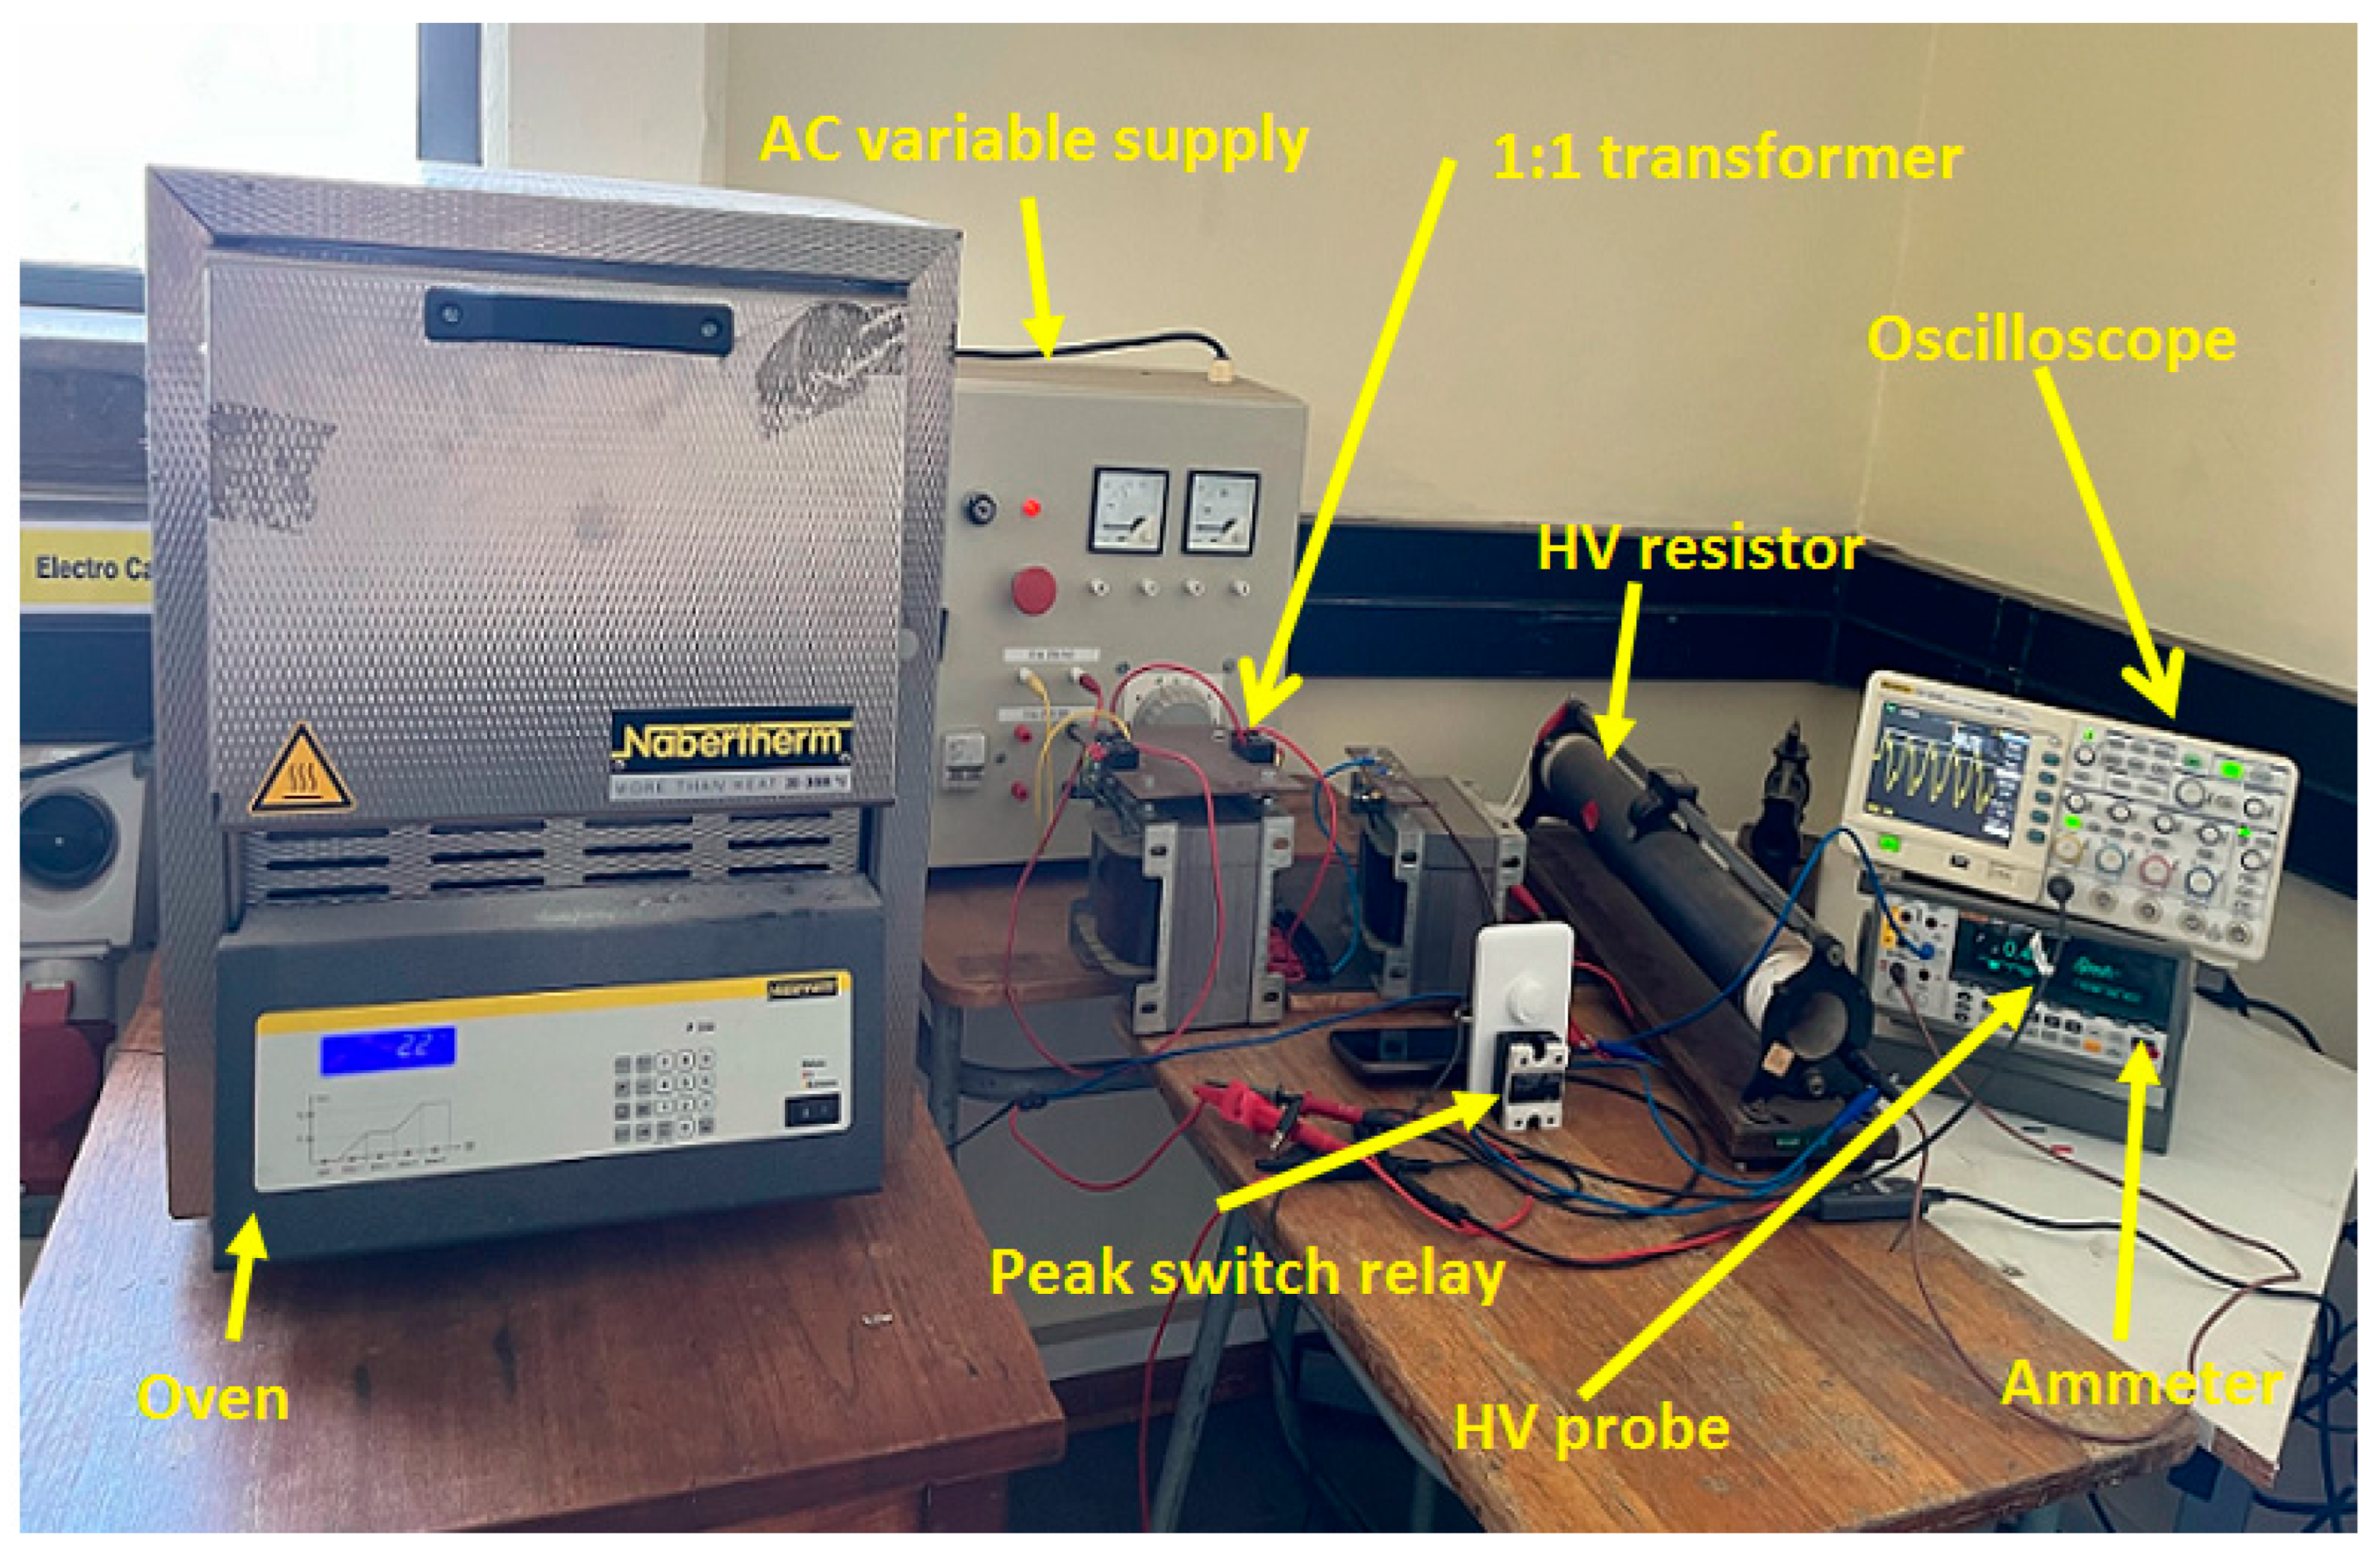
3. Experimental Work

3.1. Degradation of MOVs under Slow Front AC Switching Surges

For the purpose of this work, 360 commercially sourced low-voltage varistors from three different manufacturers (120 per manufacturer) of similar electrical characteristics and specifications were subjected to induced switching surges. MOV-based arresters used were of 20 mm diameter, with a reference voltage of 200 V ± 10% and maximum continuous operating voltages of 130 Vac and 170 Vdc. These MOSAs were subjected to switching surges that conform to the standard waveform (20 μs < Tp ≤ 5000 μs and T2 ≤ 20 ms with a maximum peak voltage of 4 p.u.) stipulated in the IEEE C62.41.1-2002, IEEE Std C62.42.0-2016, and the IEC 60071-4:2014 [29,30]. A 50 Hz AC voltage source was used to supply a continuous voltage to the MOV placed in a heat chamber at 60 °C. The Nabertherm P330 heat chamber set at 60 °C was used for the purpose of simulating the real operating condition of arresters dedicated to surge protection in induction motors operating at 60–65 °C. A voltage source was set at 0.8   V 1 m A a c , and a peak switch relay was used to generate switching surges on each peak of the supply voltage. The peak was set at the maximum clamping voltage of 340 V and the parallel connection of MOV clamped the voltage to a value of between 228 and 248 V. Thirty arrester samples were subjected to a different number of surges that were computed in terms of time (12, 24, 36, and 48 h) applied continuously. In accordance with the standards, every 20 ms the system saw two voltage surges on both positive and negative half-cycles. The chosen times for the experiment (12, 24, 36, and 48 h) were used to determine the number of surges. This was determined to be 4.32, 8.64, 12.96, and 17.28 million surges, respectively. The number of surges were calculated by Equation (1) below.
Number   of   surges = No   of   hours × 60 × 60 × 2 20 × 10 3
The MTD 7 timer was used to synchronize the heat chamber and the supply voltage and also to switch off at the end of the experimental set time. To avoid thermal transient before the test time, the timer was set to switch on the supply voltage after 30 min. The clamping voltage was monitored using a 2-channel TDS 1001B Tektronix digital scope and voltage across the varistor was measured using MTD 250 1 × 3 channel data logger. The experimental setup is shown in Figure 1 below.
To verify the degradation of these MOVs, the reference voltage of each sample was measured before and after surge degradation. A DC supply source was used to pass through a current of 1 mA and the voltage across the MOV was measured and recorded. Reference voltage percentage change was then calculated using Equation (2):
% Δ V 1   m A = ( V ¯ 1 m A b V ¯ 1 m A a V ¯ 1   m A   b ) × 100
where % Δ V 1   m A is the percentage change in reference voltage of a sample after imposed AC switching surges, V ¯ 1 m A b and V ¯ 1 m A a are the measured reference voltage before and after application of switching surges, respectively.

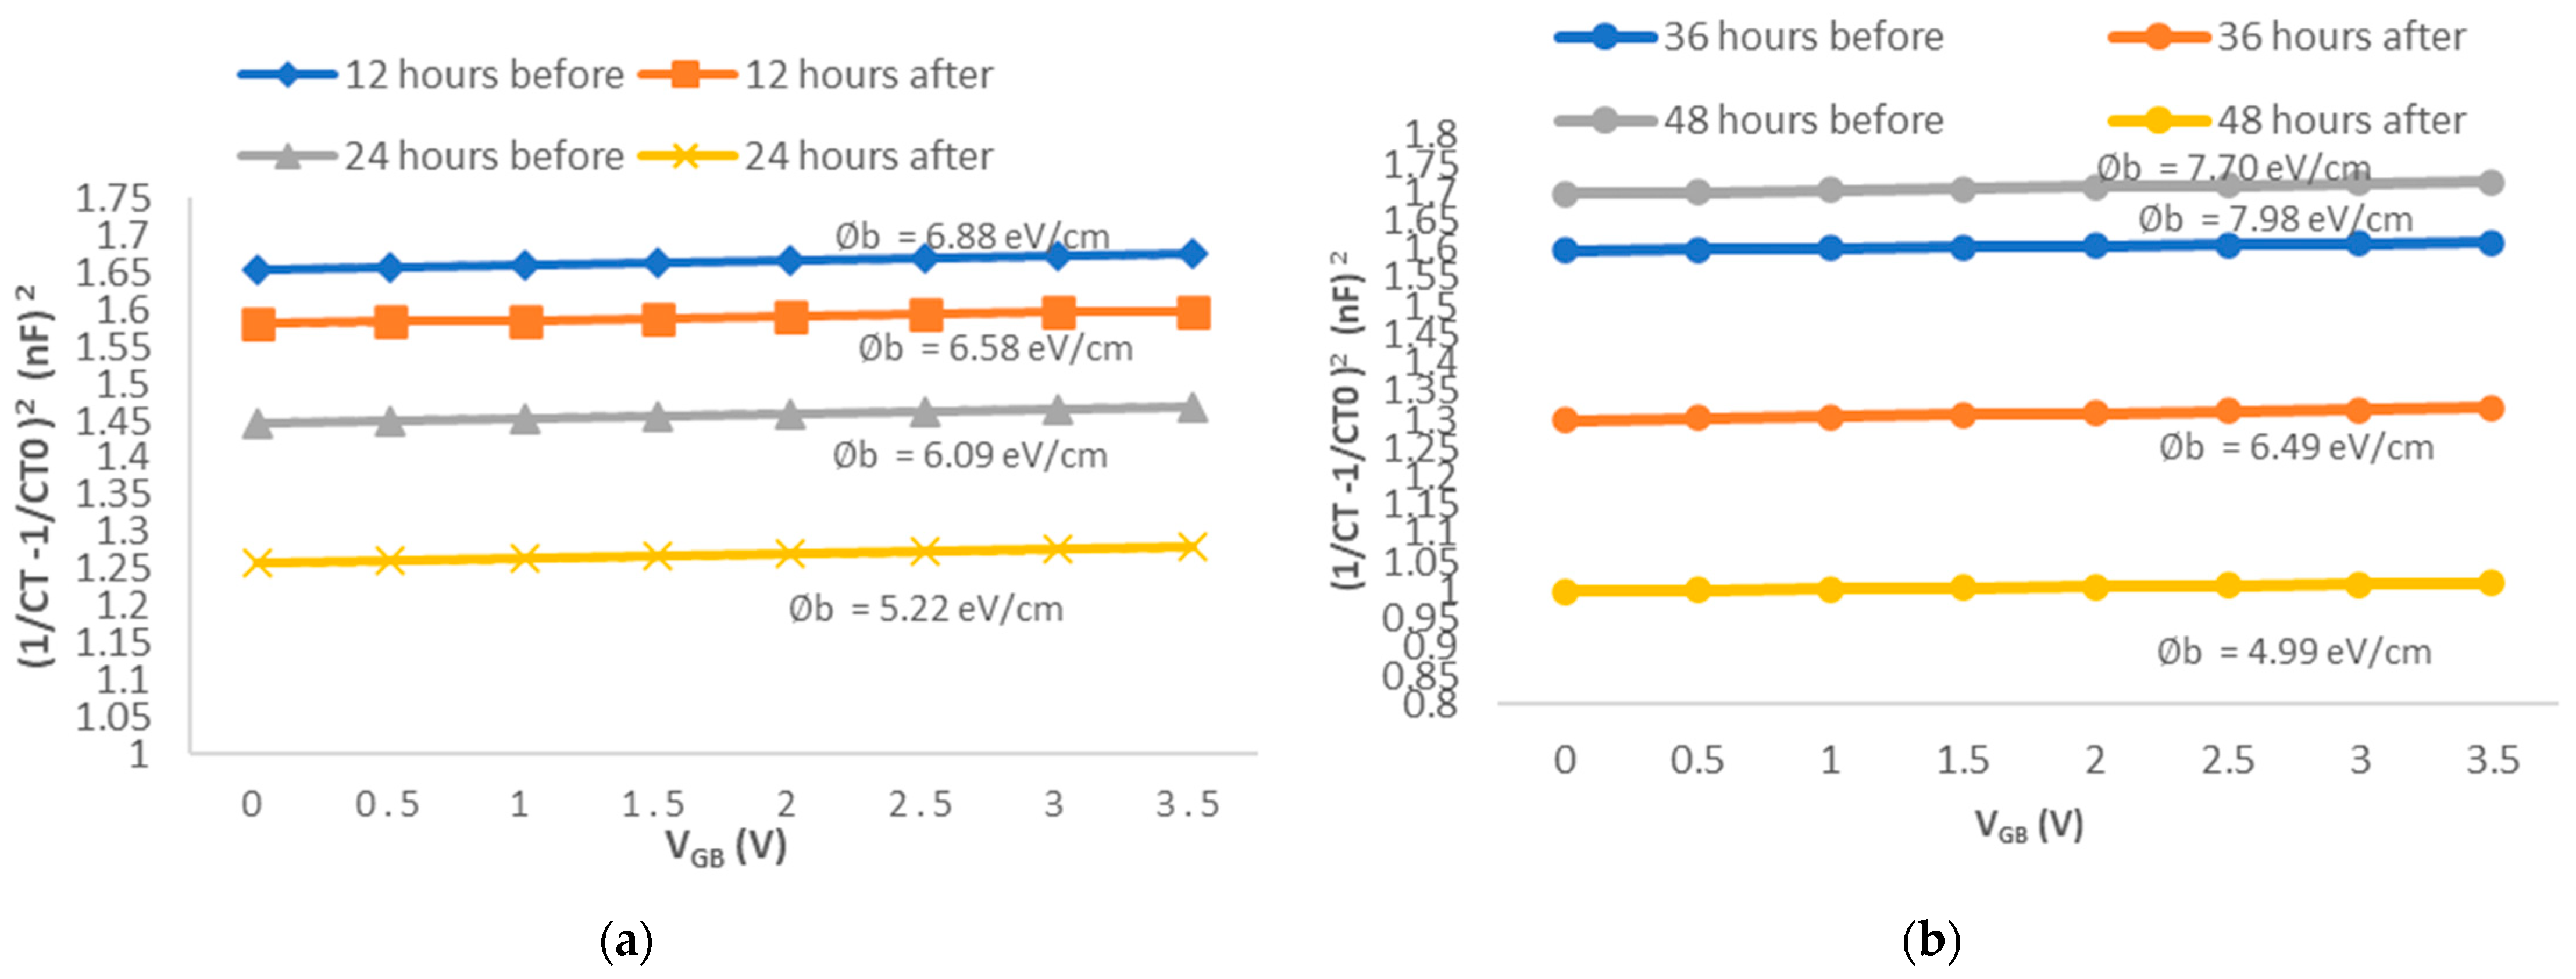
3.2. C-V Measurement and Barrier Height Calculation

C-V characteristics were measured using LCR meter BK 894 with an internal variable DC bias. The test was performed at room temperature and the meter was set at a frequency of 1 kHz. The 1 / C T 2 V g b curve was drawn and the grain barrier height was then calculated by applying Equation (3) [24,25].
( 1 C 1 2 C 0 ) 2 = 2 ( q ε s N d ) ( φ b + V g b )
where C and C 0 are the capacitance per unit of the grain boundary area corresponding to applied DC bias voltages of barrier grain voltage ( V g b ) and zero, respectively, q is the electron charge, N d is the donor concentration, ε s is the electric permittivity of ZnO, and V g b is the voltage applied to each grain boundary and is determined to be from 0 to 3.8 V [26,27]. The per unit grain boundary capacitance (C) of an ultimate ZnO block model was estimated by Equation (4) below [26,28]:
C = C T N S
where C T is the terminal capacitance, N is the estimated number of grain boundaries across the ceramic material between two electrodes, and S is the electrode area. Equations (3) and (4) were then combined to form Equation (5) in order to draw the 1 / C T 2 V g b curve.
( 1 C T 1 2 C T 0 ) 2 = 2 N 2 q ε s N d S 2   ( b V g b )
The barrier height was then calculated by dividing the intercept by the slope using a relationship b = b / k .

3.3. Effects of Number of Surges on the Grain Height Response

The effects of number of surges on the MOV grain height response was assessed by applying the F-statistical test (ANOVA). An f-statistical analysis is a method that allows valuation of the comparative significance of different factors that affect the system’s performance. The rejection and validation of the null hypothesis is based on comparing the statistical F-calculated value with the critical value from the distribution table [29,30]. Based on the obtained values, the statistical test will be able to validate if the number of applied surges has a significant impact on the grain height changes. The test is assessed on the confidence level of 95% and therefore the p-value of 0.05 is used. ANOVA statistical analysis assumes that the data tested must be from the same normal distribution, therefore prior to applying ANOVA the data were tested using D’Agostino–Pearson ( K 2 ) normality test [31,32]. The following hypotheses were used to assess the normality distribution.
  • H 0 (Null hypothesis): ZnO grain heights of tested samples are from the same normal population distribution. Therefore, the calculated probability (p)-value at 95% confidence should be greater than the critical value α = 0.05.
p > 0.05 means the data are normally distributed.
2.
H a (Alternate hypothesis): ZnO grain heights of tested samples are from non-normal population distribution. Therefore, the calculated probability (p)-value at 95% confidence should be less than the critical value α = 0.05.
p < 0.05 means the data are NOT normally distributed.
The value of K 2 was determined by adding the square values of skewness and kurtosis values as presented by Equation (6) below [31,32].
K 2 = F k 3 2 + F k 4 2
where K 2 is the D’Agostino–Pearson statistic that is equal to a chi-squared distribution value, F k 3 is the skewness statistic value, and F k 4 is the kurtosis statistic value. The skewness and kurtosis statistics were determined using Equations (7) and (8) below.
F k 3 = c . I n ( Y α + [ ( Y α ) 2 + 1 ] 1 2 )
where c is constant and other parameters were determined by Equations (8)–(12).
c = 1 I n   W
W = ( 1 + 2 ( g 1 ) 1 ) 1 / 2
g = 3 [ ( n 2 + 27 n 70 ) ( n + 1 ) ( n + 3 ) ] ( n 2 ) ( n + 3 ) ( n + 9 )
Y = K 3 × ( n + 1 ) ( n + 3 ) 6 ( n 2 )
α = 2 W 2 1
where n is the number of tested samples, Y is the skewness variance, K 3 is the skewness and was calculated by Equation (13) below.
K 3 = ( m 1 m ¯ ) 3 S 3
where m ¯ is the mean and S is the standard deviation.
The statistic kurtosis ( F k 4 ) was determined by Equation (14) below and other parameters of the equation are shown by Equations (14)–(18).
F k 4 = ( 1 2 9 A ) D 2 / 9 A
A = 6 + 8 B [ 2 B + 1 + 4 B ]
B = 6 ( n 2 5 n + 2 ) ( n + 7 ) ( n + 9 ) × 6 ( n + 3 ) ( n + 5 ) n ( n 2 ) ( n 3 )
where B is the kurtosis third standardized.
D = 1 2 / A 1 + x 2 / ( A 4 ) 3
x = k u r t o s i s E ( k u r t o s i s ) V a r ( k u r t o s i s )
where x is the standardized version of k u r t o s i s , E ( k u r t o s i s ) is the k u r t o s i s mean, and V a r ( k u r t o s i s ) is k u r t o s i s variance. The parameters were calculated using Equations (19)–(21).
k u r t o s i s = ( x 1 x ¯ ) 4 S 4
E ( k u r t o s i s ) = 3 ( n 1 ) n + 1
V a r ( k u r t o s i s ) = 24 n ( n 2 ) ( n 3 ) ( n + 1 ) 2 ( n + 3 ) ( n + 5 )
The normality test was executed in each group of number of surges applied (30 samples per each set number of surges). If a sample fell out (outliers) of the group normality, it was discarded and another sample was degraded under a similar condition so that the F statistic test could be applied. On completion of normality test and samples following the distribution, ANOVA was applied to assess if the number of surges has a significant impact on MOV grain barrier height response. The test was based on comparing the F-statistic to the critical value obtained on the distribution table. The following hypotheses were formulated in order to reject or validate the impact of number of surges:
  • Null hypothesis: the MOV varistor grain barrier height group mean of the samples degraded under different numbers of surges must be equal:
    μ 12 = μ 24 = μ 36 = μ 48
  • Alternate hypothesis: one of the MOV varistor grain barrier height group means of samples degraded under different numbers of surges are not equal:
    μ 12 μ 24 μ 36 μ 48
  • Statistical test: null hypothesis is rejected if
    F c a l c u l a t e d > F c r i t i c a l
As indicated above, F statistical analysis test compares the calculated F value with the critical value, the following steps and formulas are used to compute an F-statistic value [29,30]:
  • Calculate the sum of squares among the groups.
  • Calculate sum of squares within the groups.
  • Calculate the mean square values among and within groups.
  • Then, compute the F statistic value.
S S A = i = 1 c n i ( m ¯ i m ¯ ) 2
where S S A is the sum of squares among the groups, c is the group’s number, n i is the ith sample size of the group, m ¯ i is group i sample mean, and m ¯ is the mean of all tested data.
S S W = j = 1 c i = 1 c n j ( m j i m ¯ ) 2
where S S W is the sum of squares within the groups, w i j ¯ the jth observation in group i .
M S A = S S A g 1
M S W = S S W n g
where M S A is the mean square among groups, M S W is the mean square within groups, g is number of groups, and n is total number of observations. The F value is determined by the relationship represented by Equation (25) below:
F c a l c u l a t e d = M S A M S W
The test was performed at a confidence level of 95%, therefore a null hypothesis is rejected or validated at a significance value of α = 0.05 . F statistical analysis only assesses if the group means are different, however it does not show which group is different from another. In this work, Tukey’s Honest Significant Difference (HSD) test was applied to assess which group means of samples degraded under different numbers of surges were significantly different [33,34]. The test is based on calculating the honestly significant difference between groups by using q 0.05 distribution. The test is also assessed at a confidence level of 95%. The (HSD) value is compared with the t critical value, if the HSD value is greater than the t critical value the results show that the groups are significantly different. The HSD value is calculated using Equation (27) below [33,34].
H S D = q 0.05 × M S A n
where q 0.05 is the value from the q range statistic table at confidence level of α = 0.05 , M S A is the within-group mean squares, and n is the total number of observations in each group.

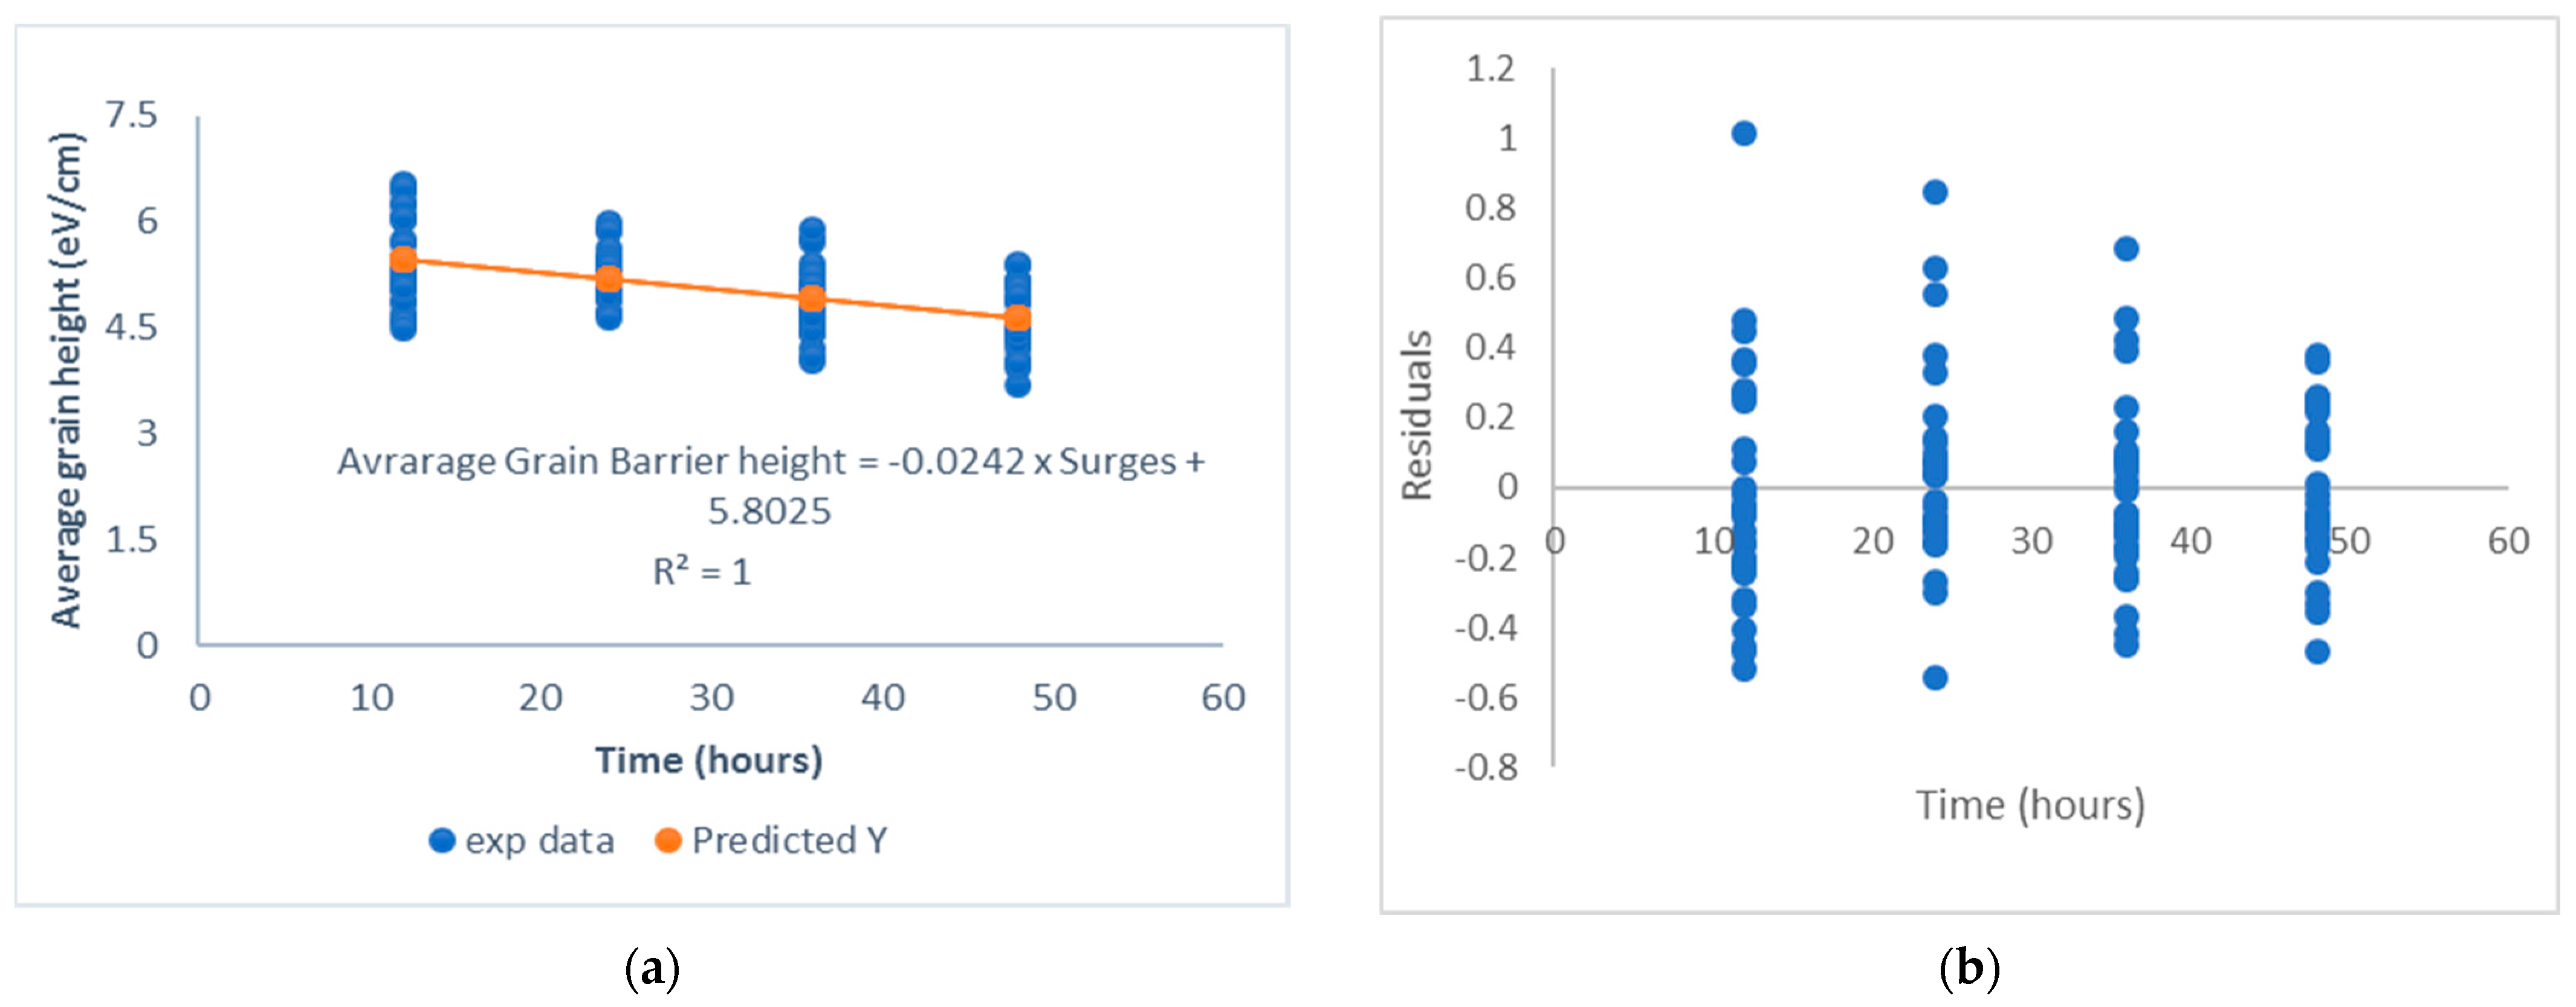
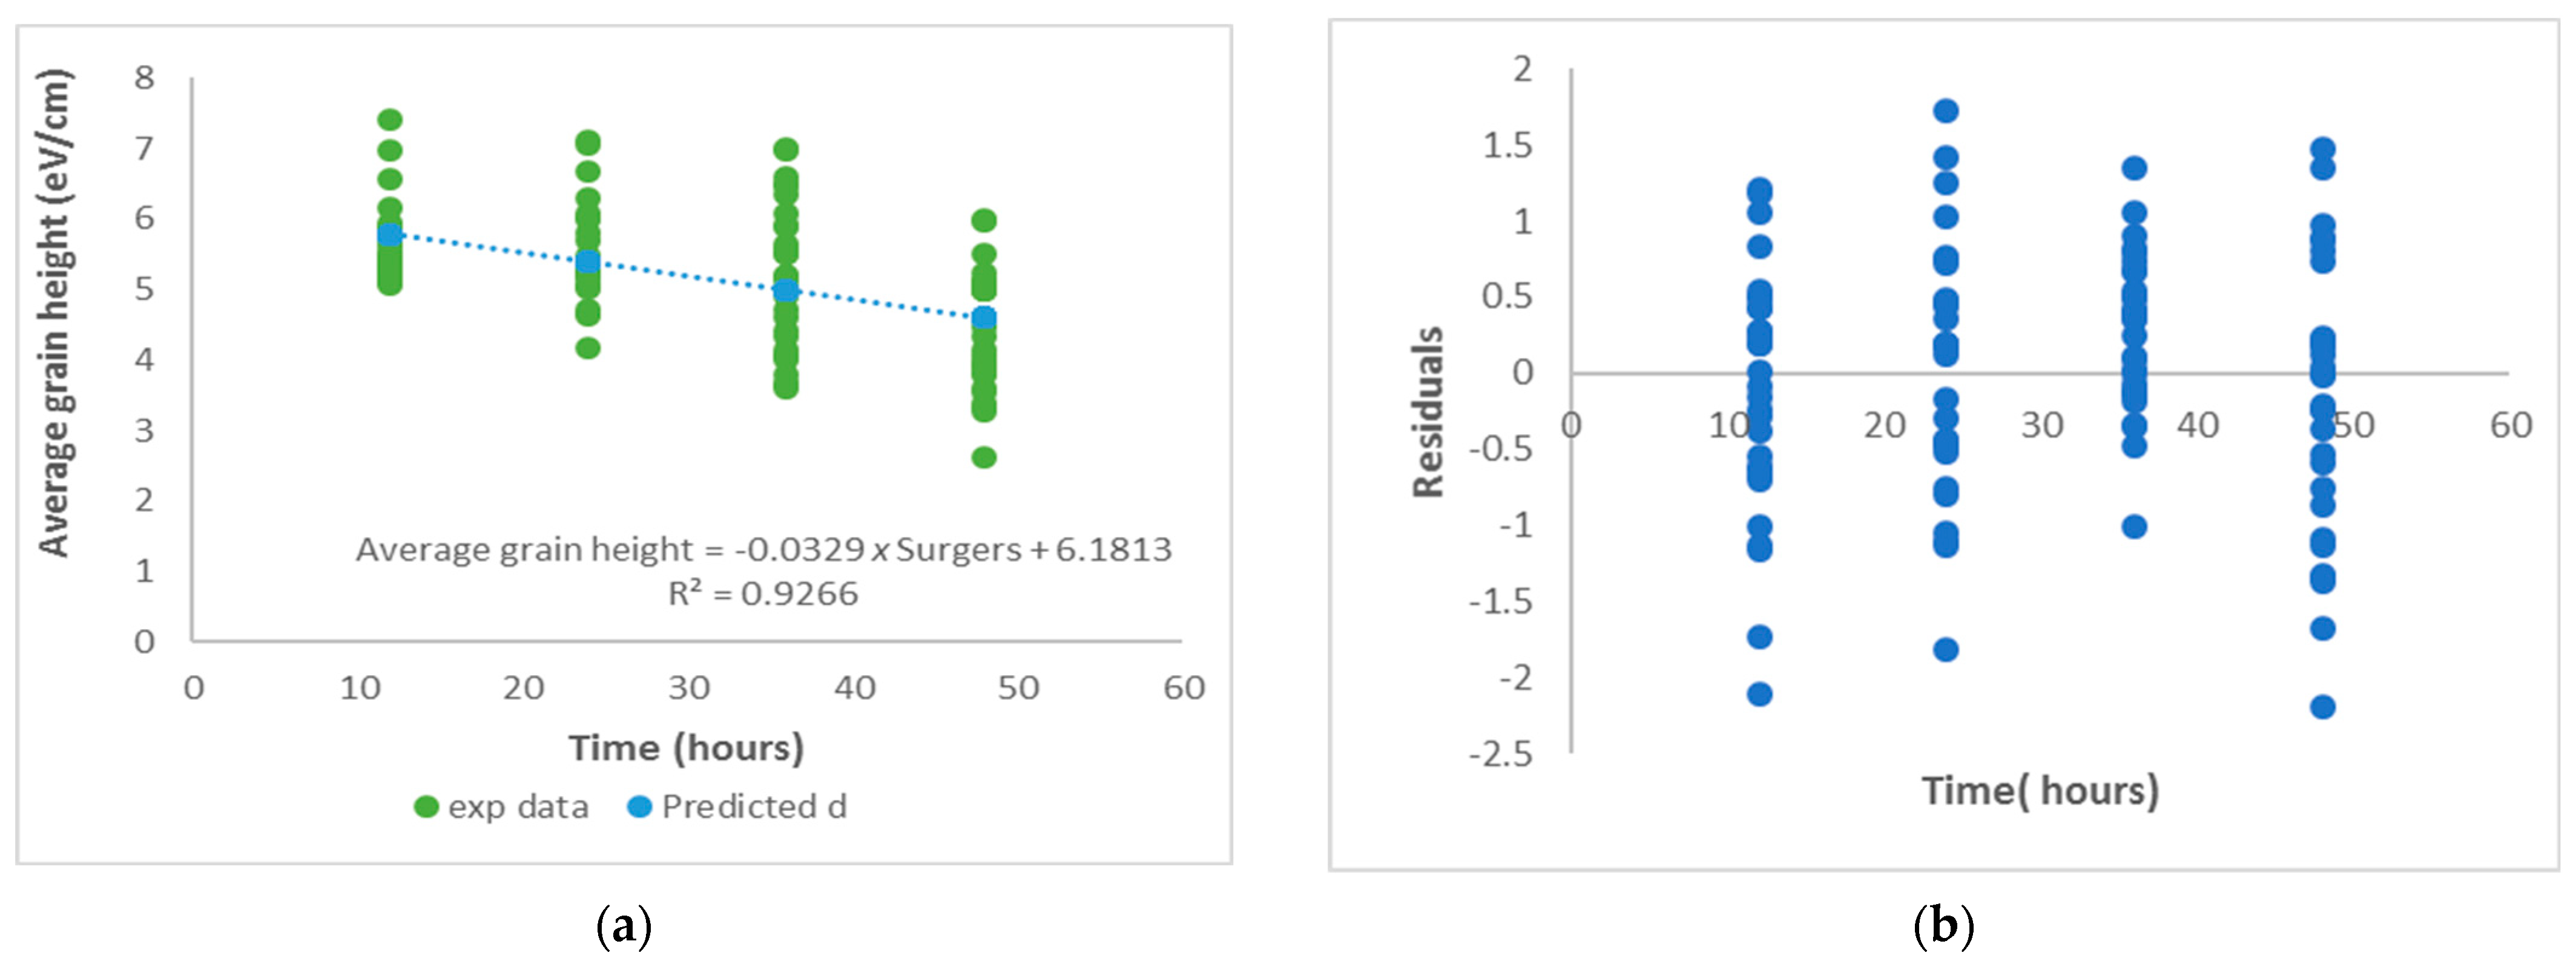
3.4. Modelling of Grain Barrier Height Response Using Regression Analysis

Linear regression is a mathematical test used for calculating and computing the relationship between dependent and independent variables [35]. The method is applied by researchers to measure the predicted effects and model the relationship by evaluating data and establishing if the relationship between variables is linear. In this work, simple linear regression was employed to model the statistical relationship between number of surges (treatments) and grain barrier height response (binary outcome). The relationship was established by determining regression coefficients ( β 0 ,   β 1 ). Equation (28) below was used to determine the relationship between the two mentioned variables:
Y i = β 0 + β 1 d i + ϵ
where Y i is the MOV average grain barrier height, β 0 is the intercept, β 1 is the slope, d i is number of applied surges, and ϵ is the error term which is assumed to follow normal distribution having a mean equal to zero. The modified equation with error term equal to zero is presented by Equation (29).
Y i ^ = β ^ 0 + β ^ 1 d i
where Y i ^ is the cMOV grain barrier height predicted mean value, β 0 ^ is the predicted y intercept value, and β 1 ^ is the predicted slope value of the model. The slope and the intercept were calculated using the following equation:
β 1 = i = 1 n ( d i d ¯ ) ( y i y ¯ ) i = 1 n ( d j d ¯ ) 2
β 0 = y ¯ b 1 × d ¯
Residuals were used to assess the fitness of the model obtained for each manufacturer. This was performed by calculating the residual error term using Equation (32). The residual plots were also assessed to validate if the model fit well. The model is said to be fit if the residuals are randomly scattered around zero.
ϵ i = Y i Y ^
where Y i is the experimental data obtained and Y ^ is the model-predicted value.
Hypothesis testing is also used to assess if the estimated regression coefficients accept any statistical significance [36,37]. This is performed by comparing the t statistic with the t critical value. The p-value is also assessed in relation to the significance level value α = 0.05 . The following hypotheses were formulated:
  • H 0 (Null hypothesis): β 1 = 0 , there is no linear relationship between the number of surges and the average grain barrier height response, and therefore the grain barrier height is independent of the number of surges.
  • H A (Alternate hypothesis): β 1 0 , there is a linear relationship between the number of surges and the average grain barrier height, and therefore the grain barrier height changes are caused by the applied number of surges.
  • Statistical test: null hypothesis is rejected if
    t s t a t i s t i c > t c r i t i c a l
The t statistic is calculated using Equation (33) below.
t s t a t i s t i c = β ^ 1 β 1 s β 1 ^
where β ^ 1 is the average estimated slope value, β 1 is the true slope value, and s β 1 ^ is the regression coefficient standard error.

4. Results and Analysis

4.1. Degradation Analysis

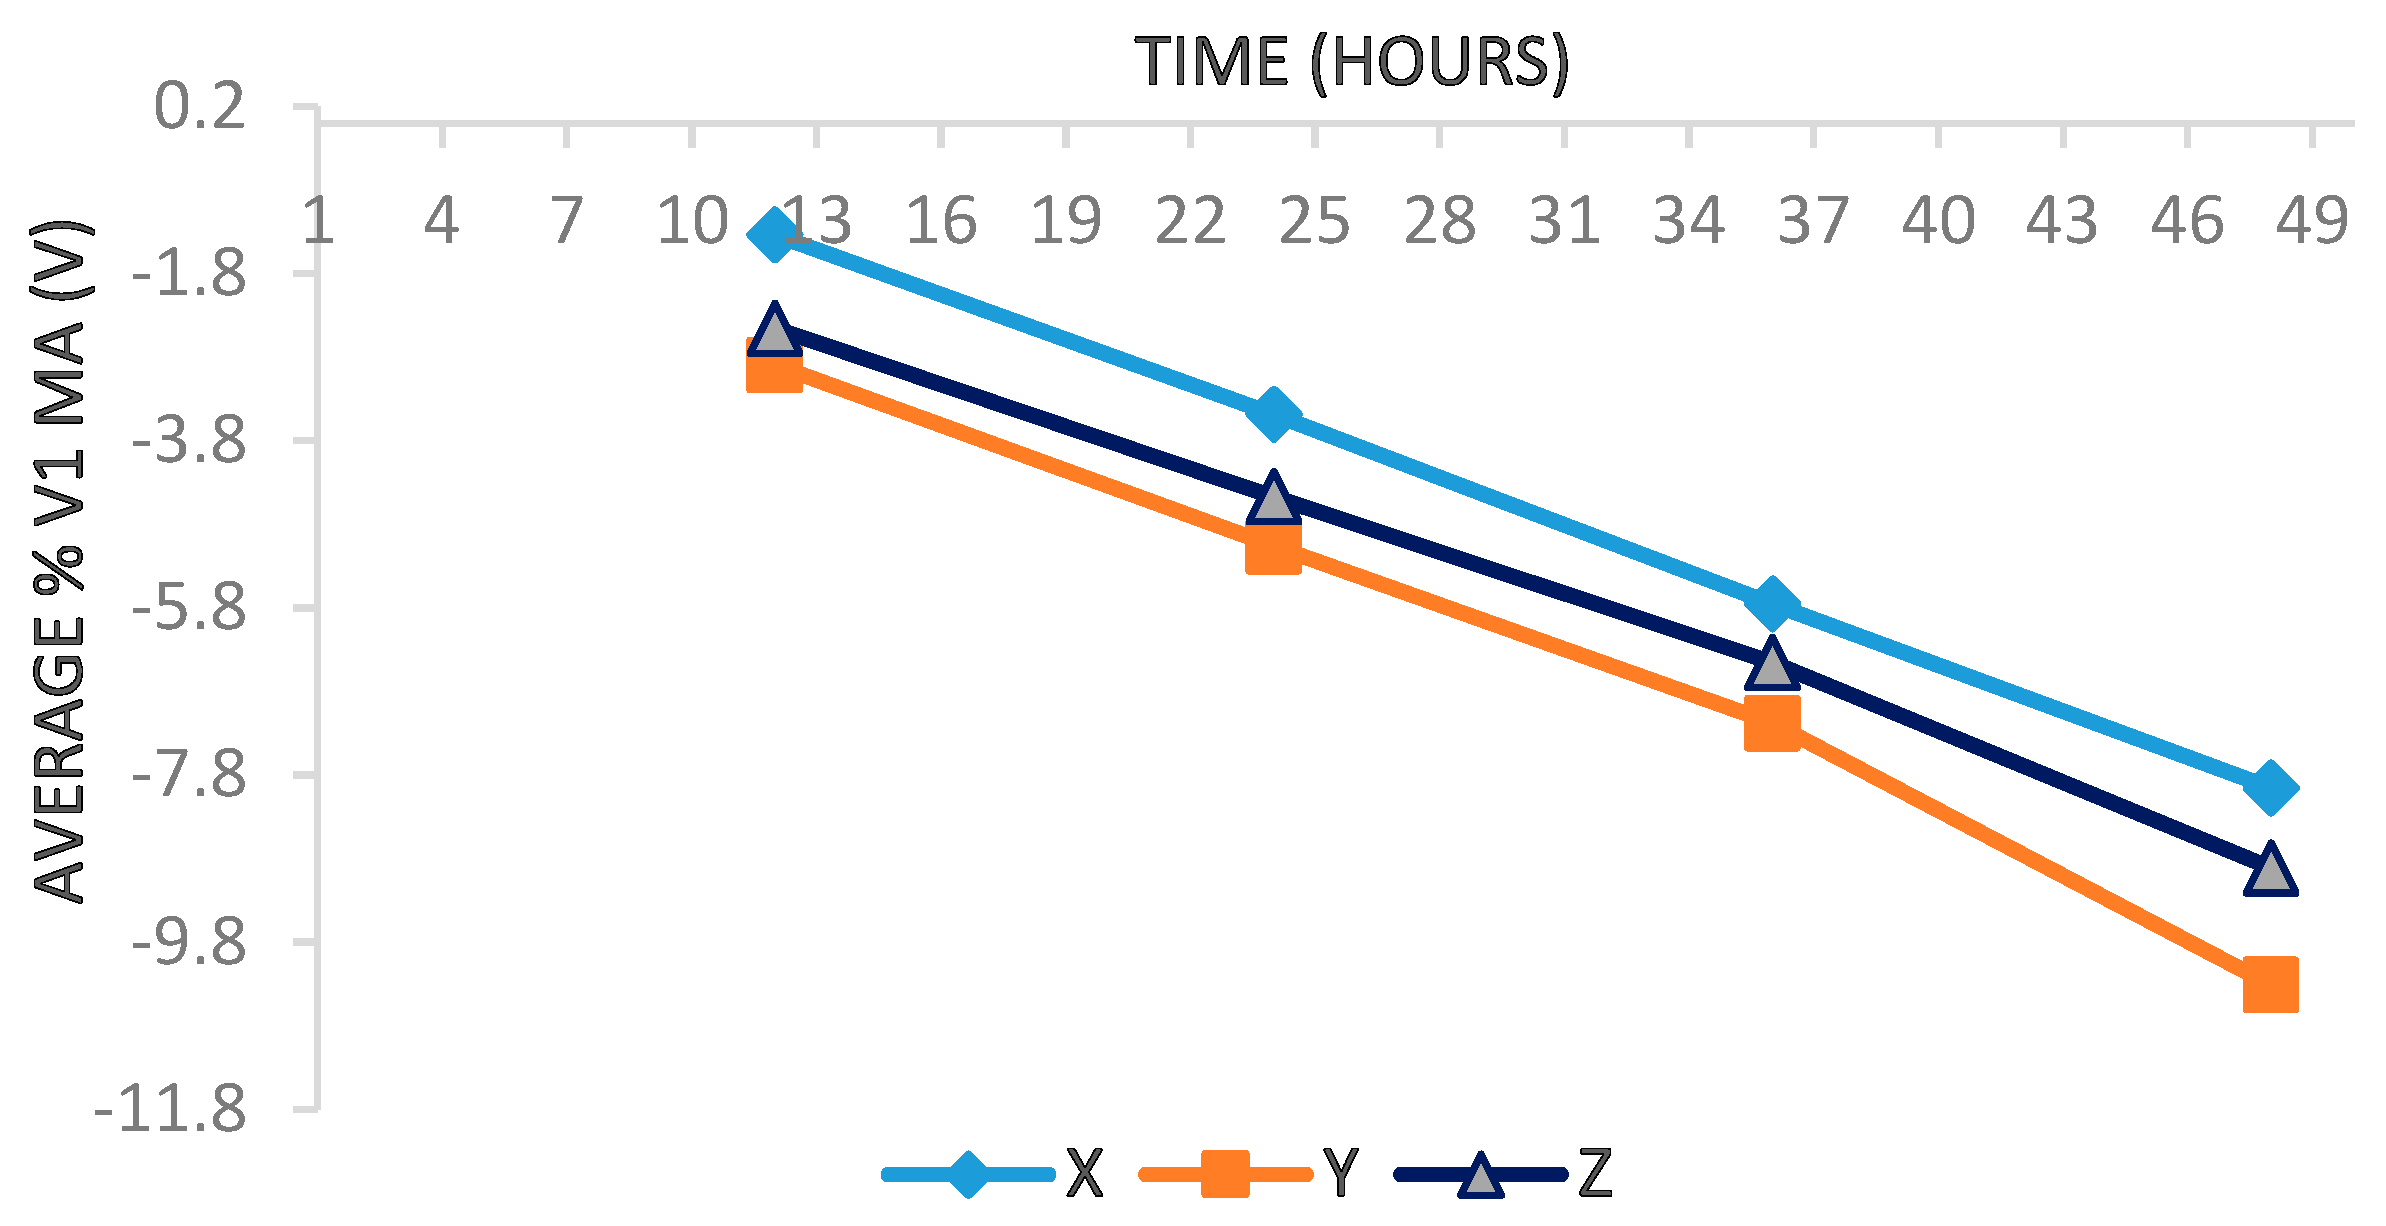
4.1.1. Percentage Change in Average Reference Voltages

The reference voltages were measured before and after the application of induced AC switching surges to monitor the degradation condition of the MOV devices tested in this experiment. It can be observed that the average reference voltage decreases as the number of applied surges increases across all tested manufacturers. The results are tabulated and illustrated in Table 1 and Figure 2 below.
Both IEC and IEEE standards recommend that a change of ±5% in Δ V 1   m A suggests that the MOV under operation is degrading and eventually will experience failure. It can be observed that manufacturer Y reaches the degradation state faster at 24 h as compared to the other two manufacturers. This explains that even though the MOV is connected in parallel with electronic circuits, they may experience degradation before the unacceptable change of ±10% in Δ V 1   m A when exposed to repetitive overvoltages. Manufacturer X has a much slower degradation rate as an average change of 5.75% is reached at 36 h.

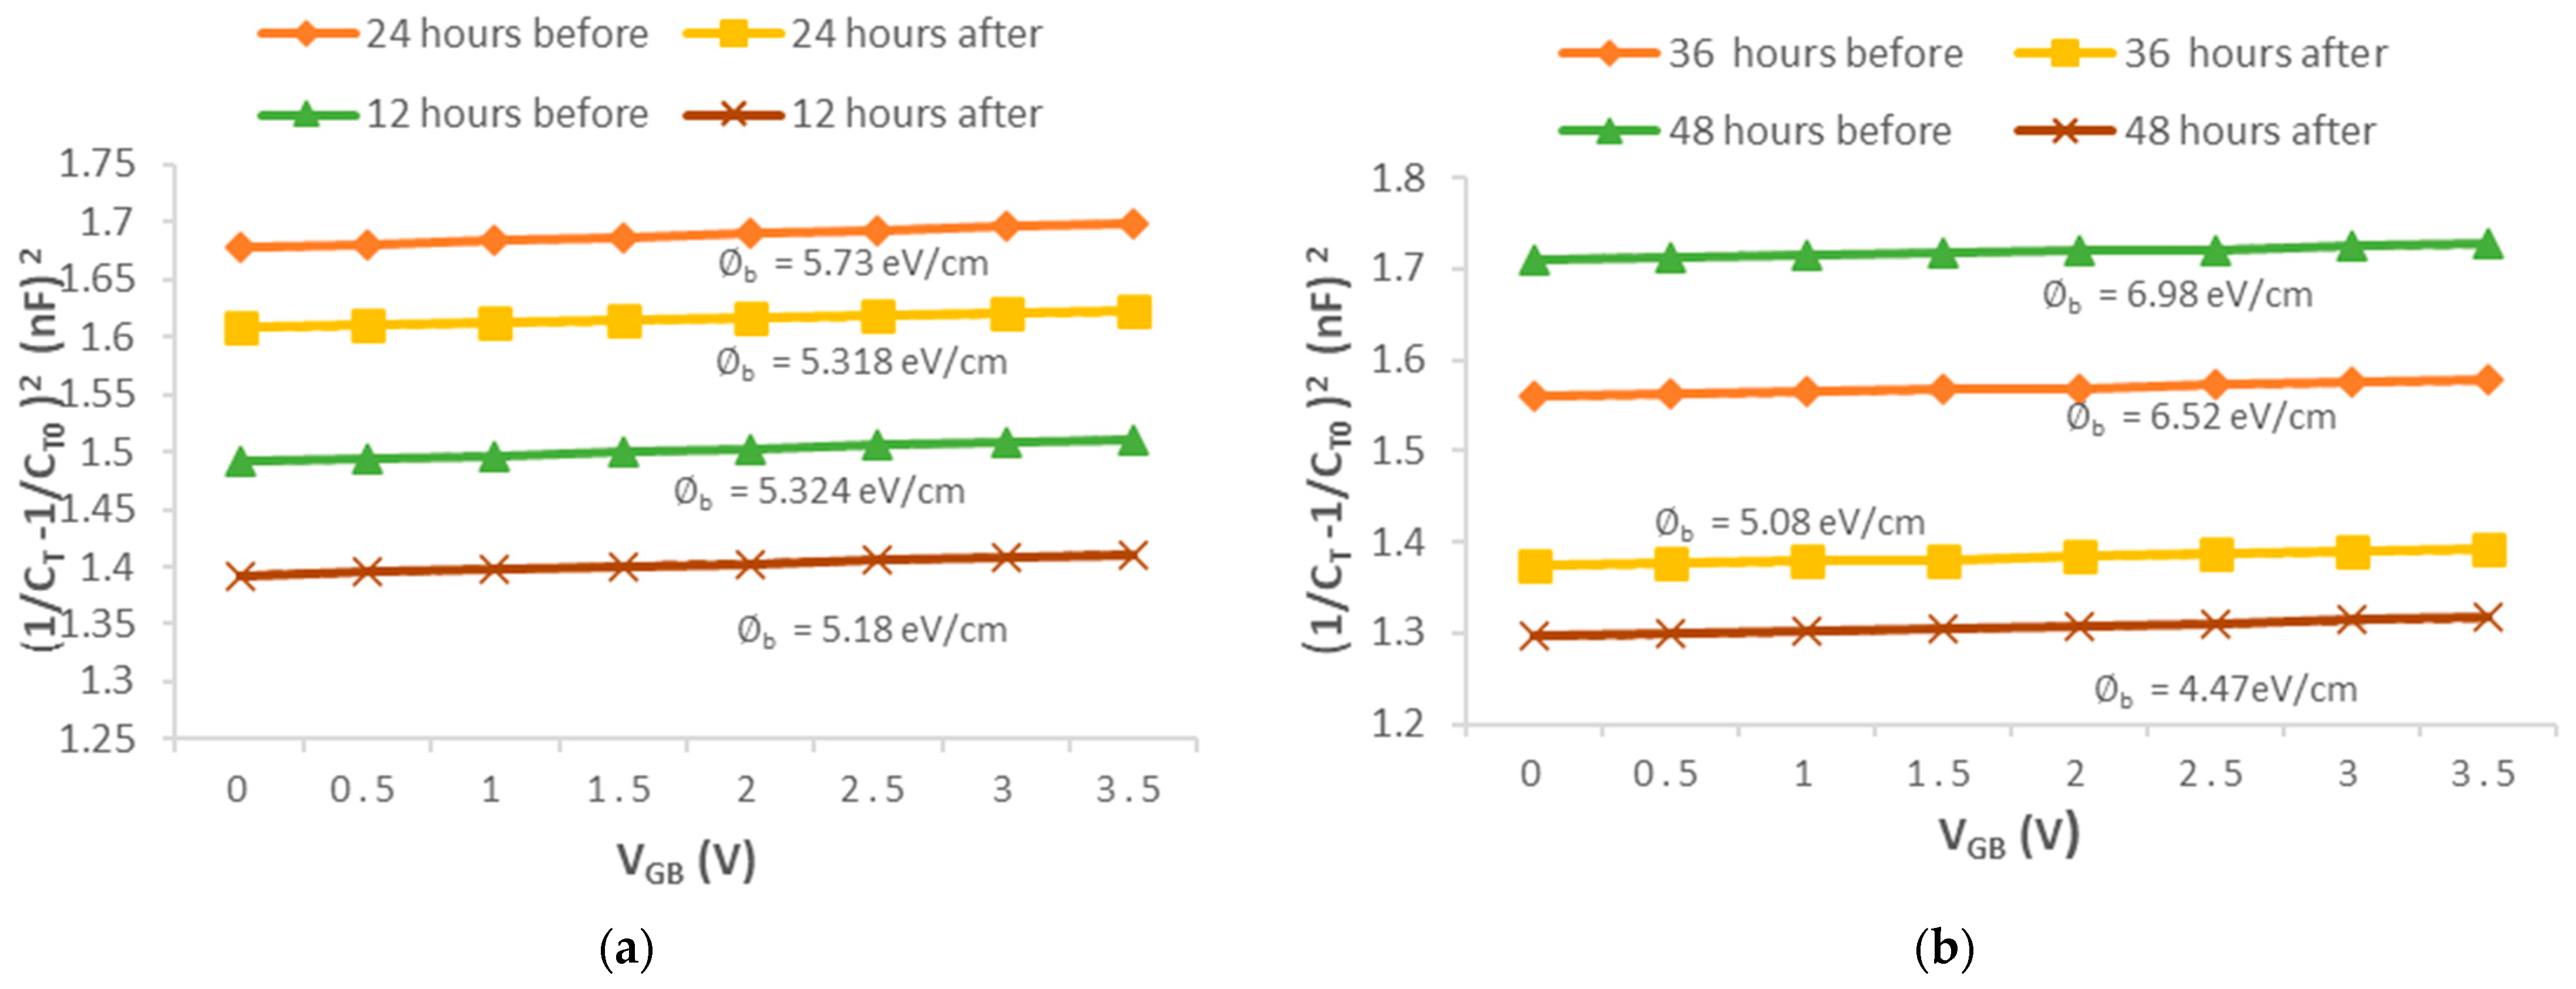
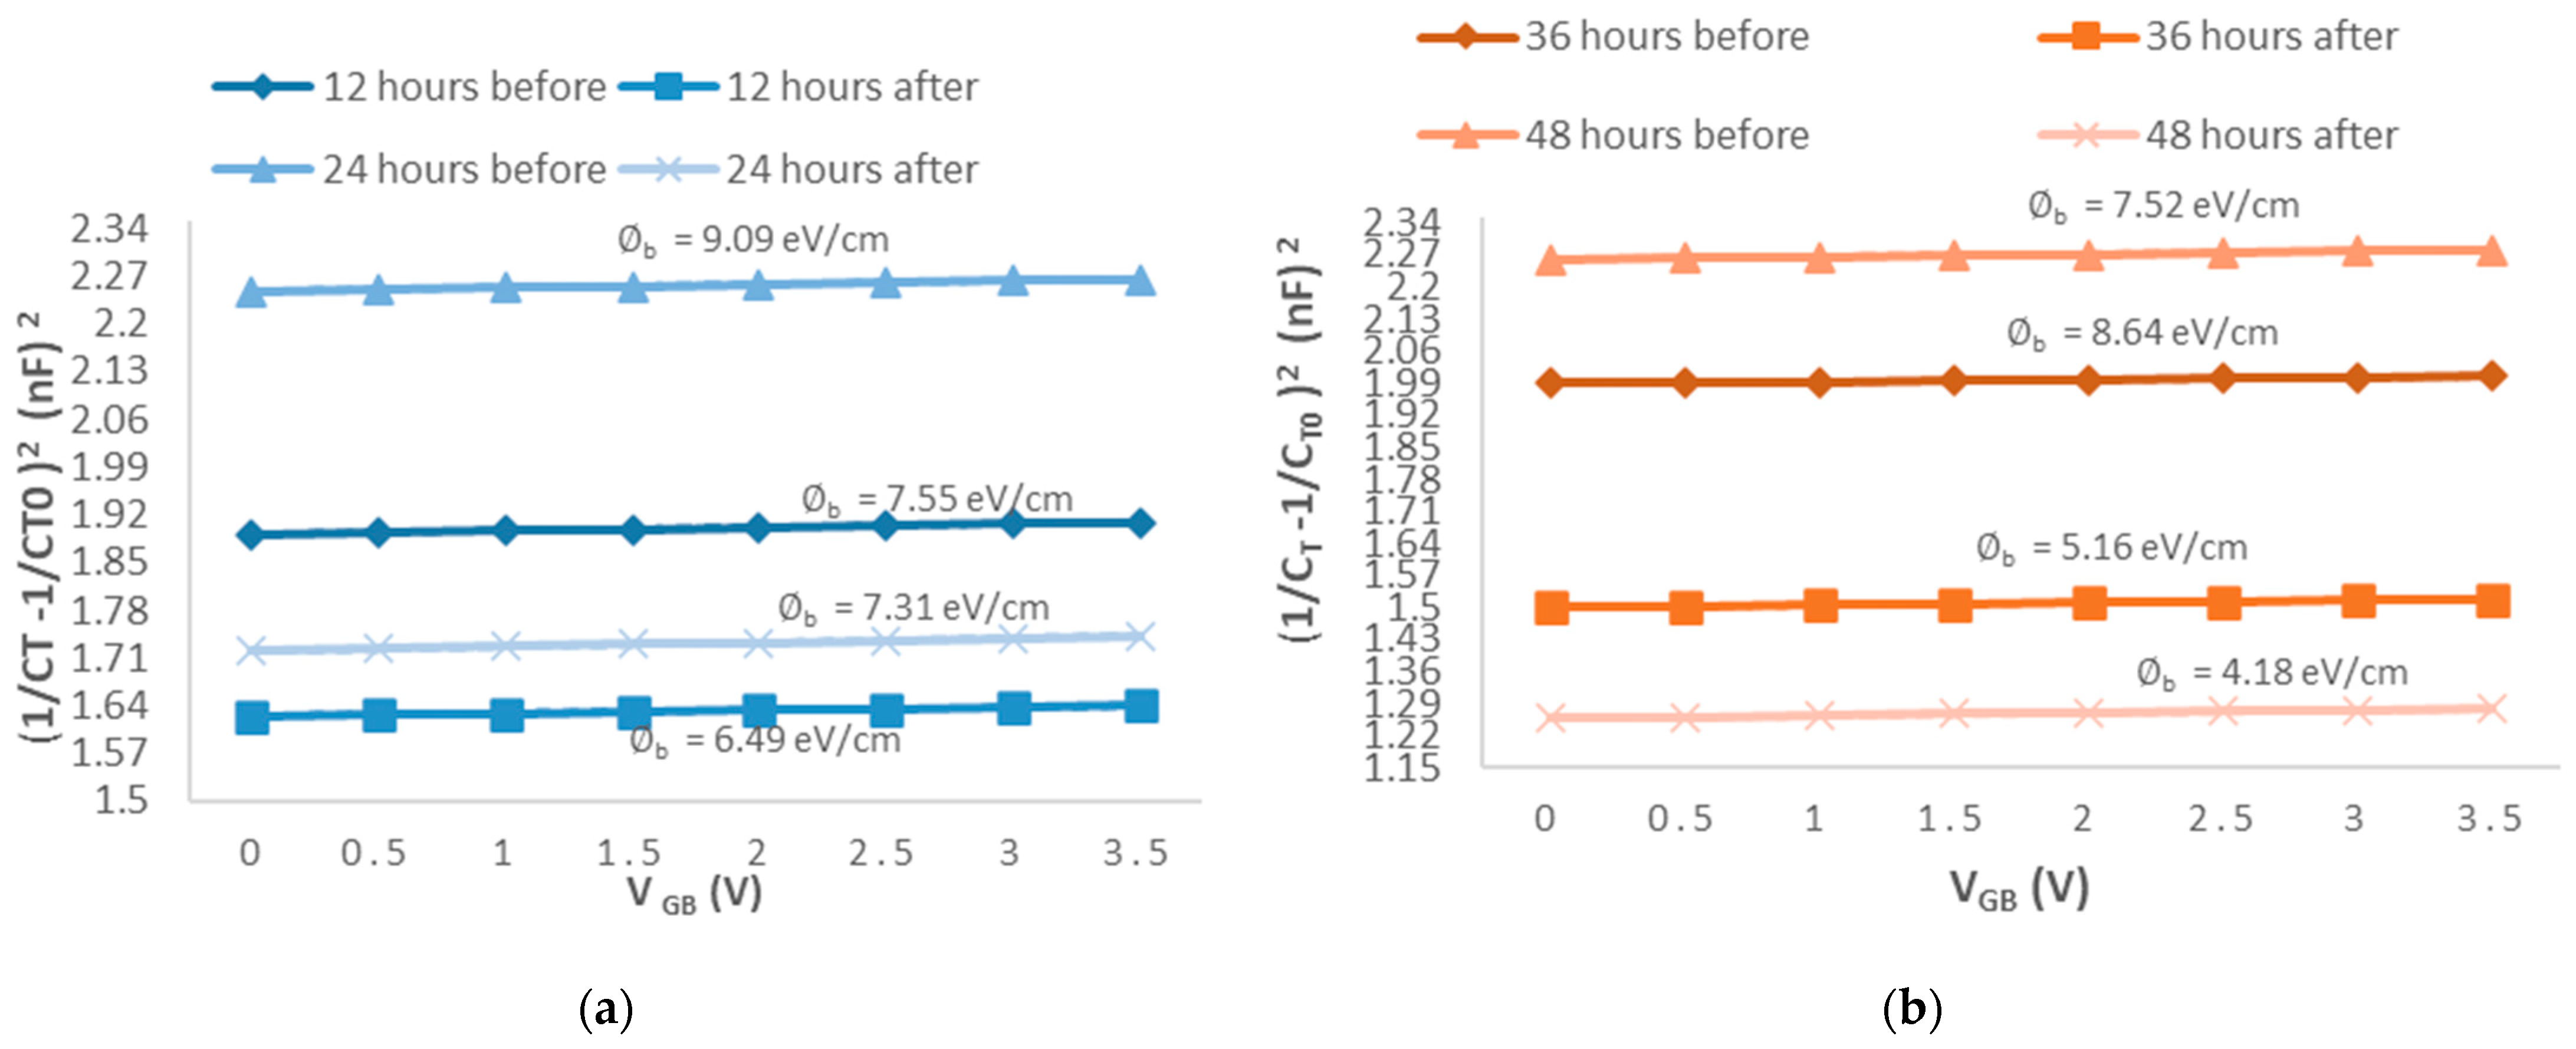
4.1.2. C-V Characteristics and Grain Barrier Height

The C-V characteristics of all manufacturers are shown in Figure 3, Figure 4 and Figure 5 below. As can be seen, the average grain barrier height decreases as the number of applied surges increases. As shown by the change in the average reference voltages, manufacturer Y’s grain barrier height decreases at a higher rate as indicated in Table 2.
It is noted that the average grain barrier height decreases by 16.75% at 12 h as compared to manufacturers X and Z at 6.8% and 6.46%. Manufacturer X shows a lesser percentage change in grain barrier height of 23.57% at 48 h, followed by manufacturer Z at 37.35%. Manufacturer Y decreased by 40.32% and it was attributed to the average percentage change in reference voltages of ± 10 %   Δ V 1 m A . The results indicate that the current will be flowing high as the grain sizes of the varistor under operation increased as a result of decreases in grain barrier height. The reduction in grain barrier height across all manufacturers is in agreement with previous work that reported that during degradation, the average grain size increases which affects the performance reliability. The protection level of MOV devices and protected electronic circuits will be compromised by the changes in the electrical and physical properties of MOV devices. The experimental results show that MOV devices exposed to surges experience degradation over time and the number of surges determines the degradation condition.

4.2. Effects of Number of Surges on the MOV Average Grain Barrier Height

4.2.1. MOV Grain Barrier Height Adherence to Normal Results

The results of the normality test across all three manufacturers tested within each group show that the tested samples are from the same normal distribution family as indicated in Table 3 below.
For manufacturer X, the obtained chi-square value decreases as the number of applied surges increases. For manufacturer Y, it is observed that the chi-square decreases at 24 h, then increases again at 36 h. For manufacturer Z, the chi-square value increases at 24 and 36 h but decreases at 48 h. However, it can be observed that for all three manufacturers the p values are greater than the significance value α = 0.05 , and therefore the null hypothesis is approved at a confidence level of 95%.

4.2.2. F-Statistical Results

To avoid errors when calculating the F ratio values, Microsoft Software was used on the obtained data to determine the ANOVA results shown in Table 4 below. The calculated F   r a t i o ( F r a t i o   X = 13.746 , F r a t i o   Y = 37.896 , and F r a t i o   Z = 12.183 ) is greater than the critical value F c r i t   ( 3 , 116 ) = 2.683 obtained from the distribution table. p values ( 9.88 × 10 8 ,   3.816 × 10 17 ,   and   5.48 × 10 7 ) are also lower than the significance level α = 0.05 . With these results it can be concluded that the null hypothesis is to be rejected and therefore there is a significant difference between the group means. The approval of the alternate hypothesis proves that the number of applied surges has an impact on the grain barrier height response. MOV grain barrier height reduction happens as a result of the number of surges.
The results obtained from Tukey’s honest significant difference are presented in Table 5 below. Each manufacturer was tested between each group and a total of six cases were assessed. The results demonstrate which group means are significantly different and how the number of surges affects the changes in MOV grain barrier height. For manufacturer Y, it can be observed that all groups tested have a significant mean difference. This is attributed to the reported percentage change in the average reference voltages. However, for manufacturer X, groups 12 h and 24 h, 24 h and 36 h, and 36 h and 48 h are not significantly different. This is seen as many samples had more or less changes in the recorded reference voltages. For manufacturer Z, groups 12 h and 36 h and 24 h and 36 h are not significantly different. The T-values obtained also are in agreement with the p values under all conditions.

4.3. Regression Models

The models obtained across all three manufacturers show a linear relationship between the number of applied AC switching surges and the average grain barrier height. The models show that the increased number of surges causes a significant reduction in grain barrier height. The models obtained by the best-fitting line across all three manufacturers are Y i ^ = 0.024 d i + 5.803 for manufacturer X, Y i ^ = 0.055 d i + 8.154 for manufacturer Y, and Y i ^ = 0.0329 d i + 6.181 for manufacturer Z. The regression models are statistically significant as the model-predicted R 2 is found to be 0.977, 0.944, and 0.9266 for manufacturers X, Y, and Z. This shows that there is a 97.72%, 94.44%, and 92.66% correlation between model prediction and the experimental data.
The predicted models indicate that the relationship shows that for each number of surges applied, the grain barrier height decreases by a unit of 0.0242, 0.055, and 0.033 for manufacturers X, Y, and Z, respectively. Furthermore, the statistical significance of the regression coefficient hypothesis test results shows that across all three tested manufacturers, the relationship is linear. The residual plots validate the fitness of the obtained models. The data are scattered around zero and have random patterns. The absolute values of the t-statistic ( | t s t a t | = 9.26 ,   | t s t a t | = 5.84   and   | t s t a t | = 5.026 ) calculated using Equation (32) are found to be greater than the critical t value t ( c r i t = 3.182 ) . The p values (0.011, 0.03, and 0.037) are less than the significance value α = 0.05 and prove that a significant change in the number of surges causes a reduction in average grain barrier height. The best-fitting lines, residual plots, and regression outputs are presented in the Figure 6, Figure 7 and Figure 8 and Table 6 below.

5. Summary

All the tested samples across all manufacturers show a decrease in the recorded average reference voltages. The higher the number of applied surges, the greater the decrease in the reference voltages. This means that when MOVs experience degradation, the electrical properties are affected and therefore the protection of the electronic circuit equipment connected in parallel is compromised. All samples in each group exposed under different number of surges were statistically proven to be from the same distribution population before being tested to assess if the number of surges has a significant impact on the grain barrier height response. ANOVA test was performed at a confidence level of 95% and it is found that the grain barrier height changes are caused by the number of switching surges applied. p values across all tested manufacturers are determined to be less than the significance value α = 0.05 , this permits the rejection of the null hypothesis and the changes in the grain barrier height observed across tested samples are caused by applied AC switching surges. Tukey’s honest significant difference shows which groups are statistically different within the same manufacturer that are exposed to a different set number of surges. It is observed that some groups are non-significantly different as it is expected that MOV devices can experience degradation at an early stage when they are exposed to a continuous constant operating voltage. The grain barrier height reduction confirms that grain sizes increase during degradation and allow more conduction and current flow. Condition monitoring of MOV devices under switching surges is worthy as it is proven that the MOV is affected when exposed to repetitive switching surges.

6. Conclusions

Varistor arresters are used as surge protection in power systems and electronic circuits by connecting them in parallel. However, repetitive overvoltages occurring in the systems cause degradation in these devices, and that places protected equipment at risk. AC switching surges are unavoidable as they result from switching capacitive loads, inverters, and converters. With the world moving towards the fourth industrial revolution, more data collection is required for the protection of electronic equipment from AC switching surges. MOVs will be more frequently employed in electronic circuits for surge protection and therefore more attention needs to be focused on monitoring the behaviour of these devices under AC switching surges. Reductions in barrier height translate to increases in MOV grain sizes. Extensive research conducted in this field has reported that the performance reliability and stability of these devices are entirely dependent on their microstructure. The models obtained show that the number of surges statistically affects the grain barrier height response. This entails that a microstructure change is dependent on the number of surges applied and can determine how the protection level of the varistor is affected. These models will be useful to manufacturers and consumers as they are able to predict the life span and degradation condition of MOVs under the operation of switching surges.

Author Contributions

Conceptualization, L.M.; methodology, L.M.; validation, L.M., P.N.B. and W.D.; formal analysis, L.M.; investigation, L.M.; writing—original draft preparation, L.M.; writing—review and editing, L.M., P.N.B. and W.D.; supervision, P.N.B. and W.D. All authors have read and agreed to the published version of the manuscript.

Funding

This research received no external funding.

Data Availability Statement

Not Applicable.

Conflicts of Interest

The authors declare no conflict of interest.

References

  1. Reddy, B.S.; Verma, A.R. Protection of Digital Telecom Exchanges against Lightning Surges and Earth Faults. IEEE Trans. Ind. Appl. 2015, 51, 5305–5311. [Google Scholar] [CrossRef]
  2. Greenwood, A. Electrical Transients in Power Systems; New York Wiley: New York, NY, USA, 1991. [Google Scholar]
  3. Thione, L. General Report of group 33 (Overvoltages and Insulation Coordination). Electra 1985, 99, 79–93. [Google Scholar]
  4. Grebe, T. Why power factor correction capacitors may upset adjustable speed drives. Power Qual. May/June 1991, 3, 14–18. [Google Scholar]
  5. Shipp, D.D.; Dionise, T.J.; Lorch, V.; MacFarlane, B.G. Transformer failure due to circuit-breaker-induced switching transients. IEEE Trans. Ind. Appl. Mar. 2011, 47, 707–718. [Google Scholar] [CrossRef]
  6. Miyazaki, T.; Ishii, T.; Okabe, S.A. Field Study of Lightning Surges Propagating into Residences. IEEE Trans. Electromagn. Compat. 2010, 52, 921–928. [Google Scholar] [CrossRef]
  7. IEEE Standards C62.34; Performance of Low-Voltage Surge-Protective Devices (Secondary Arresters). IEEE: Piscataway, NJ, USA, 1996; pp. 1–24.
  8. Gupta, T.K. Application of Zinc Oxide Varistors. J. Am. Ceram. Soc. 1990, 73, 1817–1840. [Google Scholar] [CrossRef]
  9. Khanmiri, D.T.; Ball, R.; Mosesian, J.; Lehman, B. Degradation of low voltage metal oxide varistors in power supplies. In Proceedings of the IEEE Applied Power Electronics Conference and Exposition (APEC), Long Beach, CA, USA, 20–24 March 2016; pp. 2122–2126. [Google Scholar]
  10. Khanmiri, D.T.; Ball, R.; Lehman, B. Degradation Effects on Energy Absorption Capability and Time to Failure of Low Voltage Metal Oxide Varistors. IEEE Trans. Power Deliv. 2017, 32, 2272–2280. [Google Scholar] [CrossRef]
  11. Pengfei, M.; Xiao, Y.; Wu, Y.; Xie, Q.; He, J.; Hu, J. Stable electrical properties of ZnO varistor ceramics with multiple additives against the AC accelerated aging process. Ceramic Int. 2019, 45, 11105–11108. [Google Scholar]
  12. Li, S.T.; He, J.Q.; Lin, J.J.; Wang, H.; Liu, W.F.; Liao, Y.L. Electrical-Thermal Failure of Metal–Oxide Arrester by Successive Impulses. IEEE Trans. Power Deliv. 2016, 31, 2538–2545. [Google Scholar] [CrossRef]
  13. Wang, M.; Xin, R.; Zhou, Q.; Li, Z.; Yang, H.; Jiang, H.; Yan, Y.; Ruan, X.; Yu, W.; Jin, L.; et al. High improvement of degradation behavior of ZnO varistors under high current surges by appropriate Sb2O3 doping. J. Eur. Ceram. Soc. 2021, 41, 436–442. [Google Scholar] [CrossRef]
  14. He, J.; Liu, J.; Hu, J.; Zeng, R.; Long, W. Non-uniform ageing behavior of individual grain boundaries in ZnO varistor Ceramics. J. Eur. Ceram. Soc. 2011, 31, 1451–1456. [Google Scholar] [CrossRef]
  15. Mardira, K.P.; Saha, T.K.; Sutton, R.A. Effects of electrical degradation on the microstructure of metal oxide varistor. In 2001 IEEE/PES Transmission and Distribution Conference and Exposition. Developing New Perspectives (Cat. No. 01CH37294); IEEE: Manhattan, NY, USA, 2001; Volume 1, pp. 329–334. [Google Scholar]
  16. Wang, G.; Kim, W.H.; Lee, J.H.; Kil, G.S. Condition monitoring and deterioration of metal oxide varistor. J. Electr. Eng. 2018, 69, 352–358. [Google Scholar] [CrossRef]
  17. Zhang, C.; Li, C.; Lv, D.; Zhu, H.; Xing, H. An Experimental Study on the Effect of Multiple Lightning Waveform Parameters on the Aging Characteristics of ZnO Varistors. Electronics 2020, 9, 930. [Google Scholar] [CrossRef]
  18. Mizukoshi, A.; Ozawa, J.; Shirakawa, S.; Nakano, K. Influence of Uniformity on Energy Absorption Capabilities of Zinc Oxide Elements as Applied in Arresters. IEEE Trans. Power Appar. Syst. 1983, PAS-102, 1384–1390. [Google Scholar] [CrossRef]
  19. Kan, M.; Nishiwaki, S.; Sato, T.; Kojima, S.; Yanabu, S. Surge discharge capability and thermal stability of a metal oxide surge arrester. IEEE Trans. Power Appar. Syst. 1983, PAS-102, 282–288. [Google Scholar] [CrossRef]
  20. He, J. Metal Oxide Varistors: From Microstructure to Macro-Characteristics; John Wiley & Sons: Hoboken, NJ, USA, 2019. [Google Scholar]
  21. Einzinger, R. Metal oxide varistors. Annu. Rev. Mater. Sci. 1987, 17, 299–321. [Google Scholar] [CrossRef]
  22. Plata, A.M.; Ponce, M.A.; Rios, J.M.; de la Rosa, F.; Castano, V.M. Degradation of ZnO based surge arresters under field conditions. IEE Proc. Sci. Meas. Technol. 1996, 143, 291–297. [Google Scholar] [CrossRef]
  23. Zhao, H.; Hu, J.; Chen, S.; He, J. Microstructure and Electrical Properties of Ga2O3 Doping on ZnO Varistor Ceramics with Different Sintering Temperature. In Proceedings of the 2016 IEEE International Conference on Dielectrics, Montpellier, France, 3–7 July 2016; pp. 260–263. [Google Scholar]
  24. Wang, M.H.; Tang, Q.H.; Yao, C. Electrical properties and AC degradation characteristics of low voltage ZnO varistors doped with Nd2O3. Ceram. Int. 2010, 36, 1095–1099. [Google Scholar] [CrossRef]
  25. Cheng, X.; Lu, Z.; Liu, X.; Yi, W.; Chen, Z.; Wang, X. Improvement of surge current performances of ZnO varistor ceramics via C3N4-doping. J. Eur Ceramic Society. J. Eur. Ceram. Soc. 2020, 40, 2390–2395. [Google Scholar] [CrossRef]
  26. Tao, M.; Bui, A.; Dorlanne, O.; Loubiere, A. Different “single grain junctions” within a ZnO varistor. J. Appl. Phys. 1987, 61, 1562–1567. [Google Scholar] [CrossRef]
  27. Wong, J. Barrier voltage measurement in metal oxide varistors. J. Appl. Phys. 1979, 47, 4971–4974. [Google Scholar] [CrossRef]
  28. Meshkatoddini, M.R. Statistical study of the thin metal-oxide varistor ceramics. Aust. J. Basic Appl. Sci. 2010, 4, 751–763. [Google Scholar]
  29. Górecki, T.; Smaga, L. A comparison of tests for the one-way ANOVA problem for functional data. Comput. Stat. 2015, 30, 987–1010. [Google Scholar] [CrossRef]
  30. Alassaf, M.; Qamar, A.M. Improving sentiment analysis of Arabic tweets by One-Way ANOVA. J. King Saud Univ. Comput. Inf. Sci. 2022, 34, 2849–2859. [Google Scholar] [CrossRef]
  31. D’agostino, R.B.; Belanger, A.; D’Agostino, R.B., Jr. A Suggestion for Using Powerful and Informative Tests of Normality. Am. Stat. 1990, 44, 316–321. [Google Scholar]
  32. Kim, T.K.; Park, J.H. More about the basic assumptions of t-test: Normality and sample size. Korean J. Anesthesiol. 2019, 72, 331–335. [Google Scholar] [CrossRef] [PubMed]
  33. Midway, S.; Robertson, M.; Flinn, S.; Kaller, M. Comparing multiple comparisons: Practical guidance for choosing the best multiple comparisons test. PeerJ 2020, 8, e10387. [Google Scholar] [CrossRef]
  34. Nanda, A.; Mohapatra, B.B.; Mahapatra, A.P.K.; Abiresh Prasad Kumar Mahapatra, A.P.K.; Mahapatra, A.P.K. Multiple comparison test by Tukey’s honestly significant difference (HSD): Do the confident level control type I error. IJAMS Int. J. Stat. Appl. Math. 2021, 6, 59–65. [Google Scholar] [CrossRef]
  35. Kim, H.Y. Statistical notes for clinical researchers: Simple linear regression 3–residual analysis. Restor. Dent. Endod. 2019, 4, e11. [Google Scholar] [CrossRef]
  36. Nel, T.; Clarke, C.E.; Hardie, A.G. Evaluation of simple and multivariate linear regression models for exchangeable base cation conversion between seven measurement techniques on South African soils. Geoderma Reg. 2020, 30, e00571. [Google Scholar] [CrossRef]
  37. Alita, D.; Putra, A.D.; Darwis, D. Analysis of classic assumption test and multiple linear regression coefficient test for employee structural office recommendation. IJCCS (Indones. J. Comput. Cybern. Syst.) 2021, 15, 1–5. [Google Scholar] [CrossRef]
Figure 1. Test setup for switching surges degradation test.
Electronicmat 04 00006 g001
Figure 2. Average percentage change in reference voltage.
Electronicmat 04 00006 g002
Figure 3. C-V characteristics of degraded samples for manufacturer X (a) for 12 and 24 h; (b) for 36 and 48 h.
Electronicmat 04 00006 g003
Figure 4. C-V characteristics of degraded samples for manufacturer Y (a) for 12 and 24 h; (b) for 36 and 48 h.
Electronicmat 04 00006 g004
Figure 5. C-V characteristics of degraded samples for manufacturer Z (a) for 12 and 24 h; (b) for 36 and 48 h.
Electronicmat 04 00006 g005
Figure 6. Manufacturer X (a) best-fitting line plot; (b) residual plot.
Electronicmat 04 00006 g006
Figure 7. Manufacturer Y (a) best-fitting line plot; (b) residual plot.
Electronicmat 04 00006 g007
Figure 8. Manufacturer Z (a) best fitting line plot; (b) residual plot.
Electronicmat 04 00006 g008
Table 1. Percentage change in average reference voltages ( % Δ V 1   m A ).
12 h24 h36 h48 h
Manufacturer X−1.33 −3.48−5.75−7.95
Manufacturer Y−2.89 −5.06−7.18−10.31
Manufacturer Z−2.45−4.47−6.45−8.91
Table 2. Percentage change in average grain barrier height %   Δ b (%).
b (eV/cm)
before
b (eV/cm)
after
%   Δ b (%)
Manufacturer X
125.8785.4666.8
246.13775.30413.12
365.89754.90216.54
486.07544.63123.57
Manufacturer Y
128.9377.37416.75
248.6986.87620.38
369.5086.44432.09
489.0415.31840.32
Manufacturer Z
126.0765.6746.46
246.4275.48313.75
367.0285.14826.51
487.1964.46837.35
Table 3. D’Agostino–Pearson ( K 2 ) normality test summary.
f K 3 f k 4 K 2 χ 2 p-Value
Manufacturer X
121.50560.43252.45382.45380.293
241.26460.50981.85881.85880.3948
361.1110.32751.34151.34150.5113
48−0.21−1.00911.06231.06230.5879
Manufacturer Y
121.22180.36951.62931.62930.4428
24−0.1883−0.09810.04510.04510.9777
36−0.53780.49960.53880.53880.7638
48−0.3958−0.54040.44870.44870.799
Manufacturer Z
122.1611.13180.94910.94910.052
241.72851.00023.98823.98820.1361
360.3887−2.0334.28544.28540.1173
48−0.3907−0.78050.76180.76180.6833
Table 4. F statistical test results summary.
Source of VariationSSDfMS F p-Value F c r i t
Manufacturer X
Among Groups13.969534.3213.745679.88 × 10 8 2.682809
Within Groups36.4871160.31
Total49.456119
Manufacturer Y
Among Groups69.21657323.0721937.89623.81 × 10 17 2.682809
Within Groups70.623821160.608826
Total139.8404119
Manufacturer Z
Among Groups25.2743738.42478912.183095.48 × 10 7 2.682809
Within Groups80.215721160.691515
Total105.4901119
Table 5. Tukey’s post hoc test results.
Groups (Hours) t s t a t t c r i t p Value < 0.005Results
Manufacturer X
12 and 241.3972.0480.173170368Non-significantly different
12 and 364.0772.0480.0003414Significantly different
12 and 485.2332.0481.1455 × 10 5 Significantly different
24 and 362.3792.0400.024379054Non-significantly different
24 and 484.762.0485.31122 × 10 5 Significantly different
36 and 481.9612.0480.059821666Non-significantly different
Manufacturer Y
12 and 242.27392.0480.0308Significantly different
12 and 365.4142.0488.94831 × 10 6 Significantly different
12 and 488.1282.0487.53 × 10 9 Significantly different
24 and 362.0682.0480.0479Significantly different
24 and 486.9362.0481.53339 × 10 7 Significantly different
36 and 485.1042.0482.08652 × 10 5 Significantly different
Manufacturer Z
12 and 246.1022.0481.39154 × 10 6 Significantly different
12 and 361.9872.0480.0567Non-significantly different
12 and 486.1022.0481.39154 × 10 6 Significantly different
24 and 361.2882.0480.208Non-significantly different
24 and 485.2842.0481.27789 × 10 5 Significantly different
36 and 484.2042.0480.000242741Significantly different
Table 6. Regression Analysis Results.
Regression Statistics
Manufacturer XManufacturer YManufacturer Z
Multiple R0.9885410.9719190.962617
R Square0.9772140.9446260.926631
Adjusted R Square0.9658210.9169390.889947
Standard Error0.0701870.2527440.1758
Observations120120120
CoefficientsStandard Errort Statp-value
Manufacturer X
Intercept5.80250.08596167.501850.000219
Surges−0.024230.002616−9.261390.011459
Manufacturer Y
Intercept8.1536820.30954726.340660.001438
Surges−0.055020.009419−5.841080.028081
Manufacturer Z
Intercept6.18130.21531128.708770.001211
surges−0.032930.006552−5.02590.037383
Disclaimer/Publisher’s Note: The statements, opinions and data contained in all publications are solely those of the individual author(s) and contributor(s) and not of MDPI and/or the editor(s). MDPI and/or the editor(s) disclaim responsibility for any injury to people or property resulting from any ideas, methods, instructions or products referred to in the content.

