
Chlorine Adsorption on TiO2(110)/Water Interface: Nonadiabatic Molecular Dynamics Simulations for Photocatalytic Water Splitting

 , , , , , and
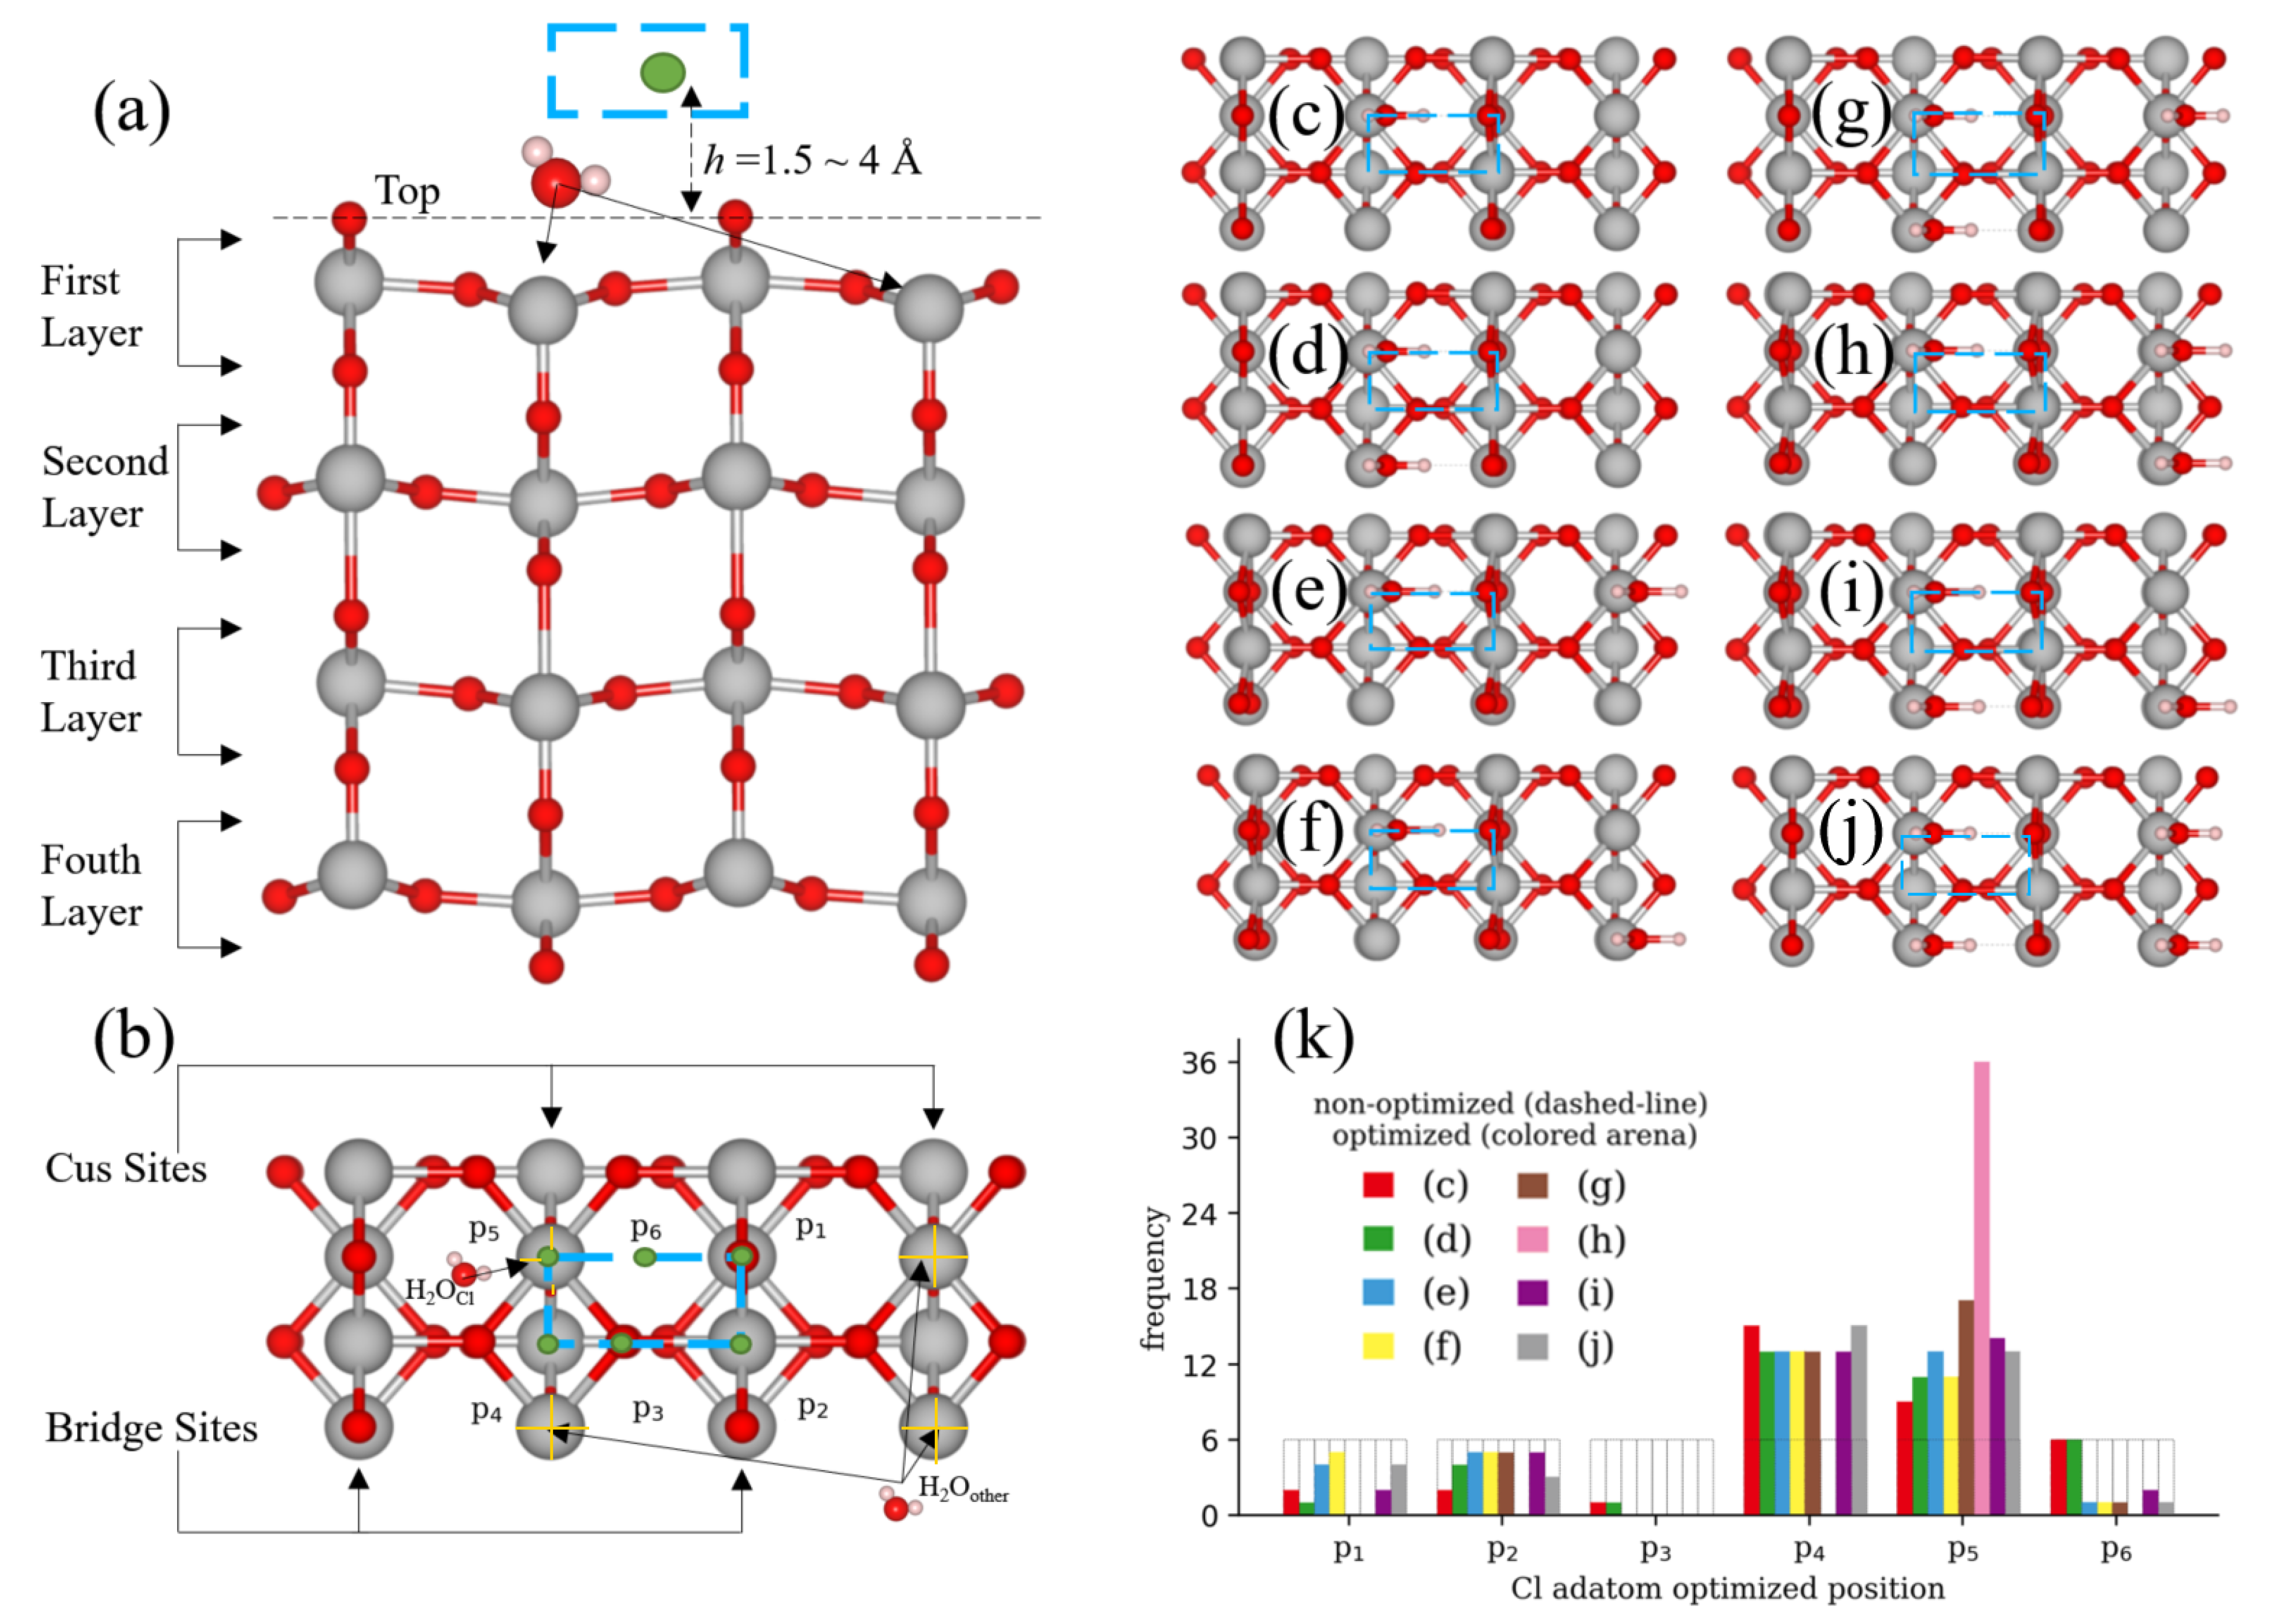
Abstract
:1. Introduction
2. Computational Methods and Models
2.1. Methodology
2.2. TiO Surface Models
3. Results and Discussions
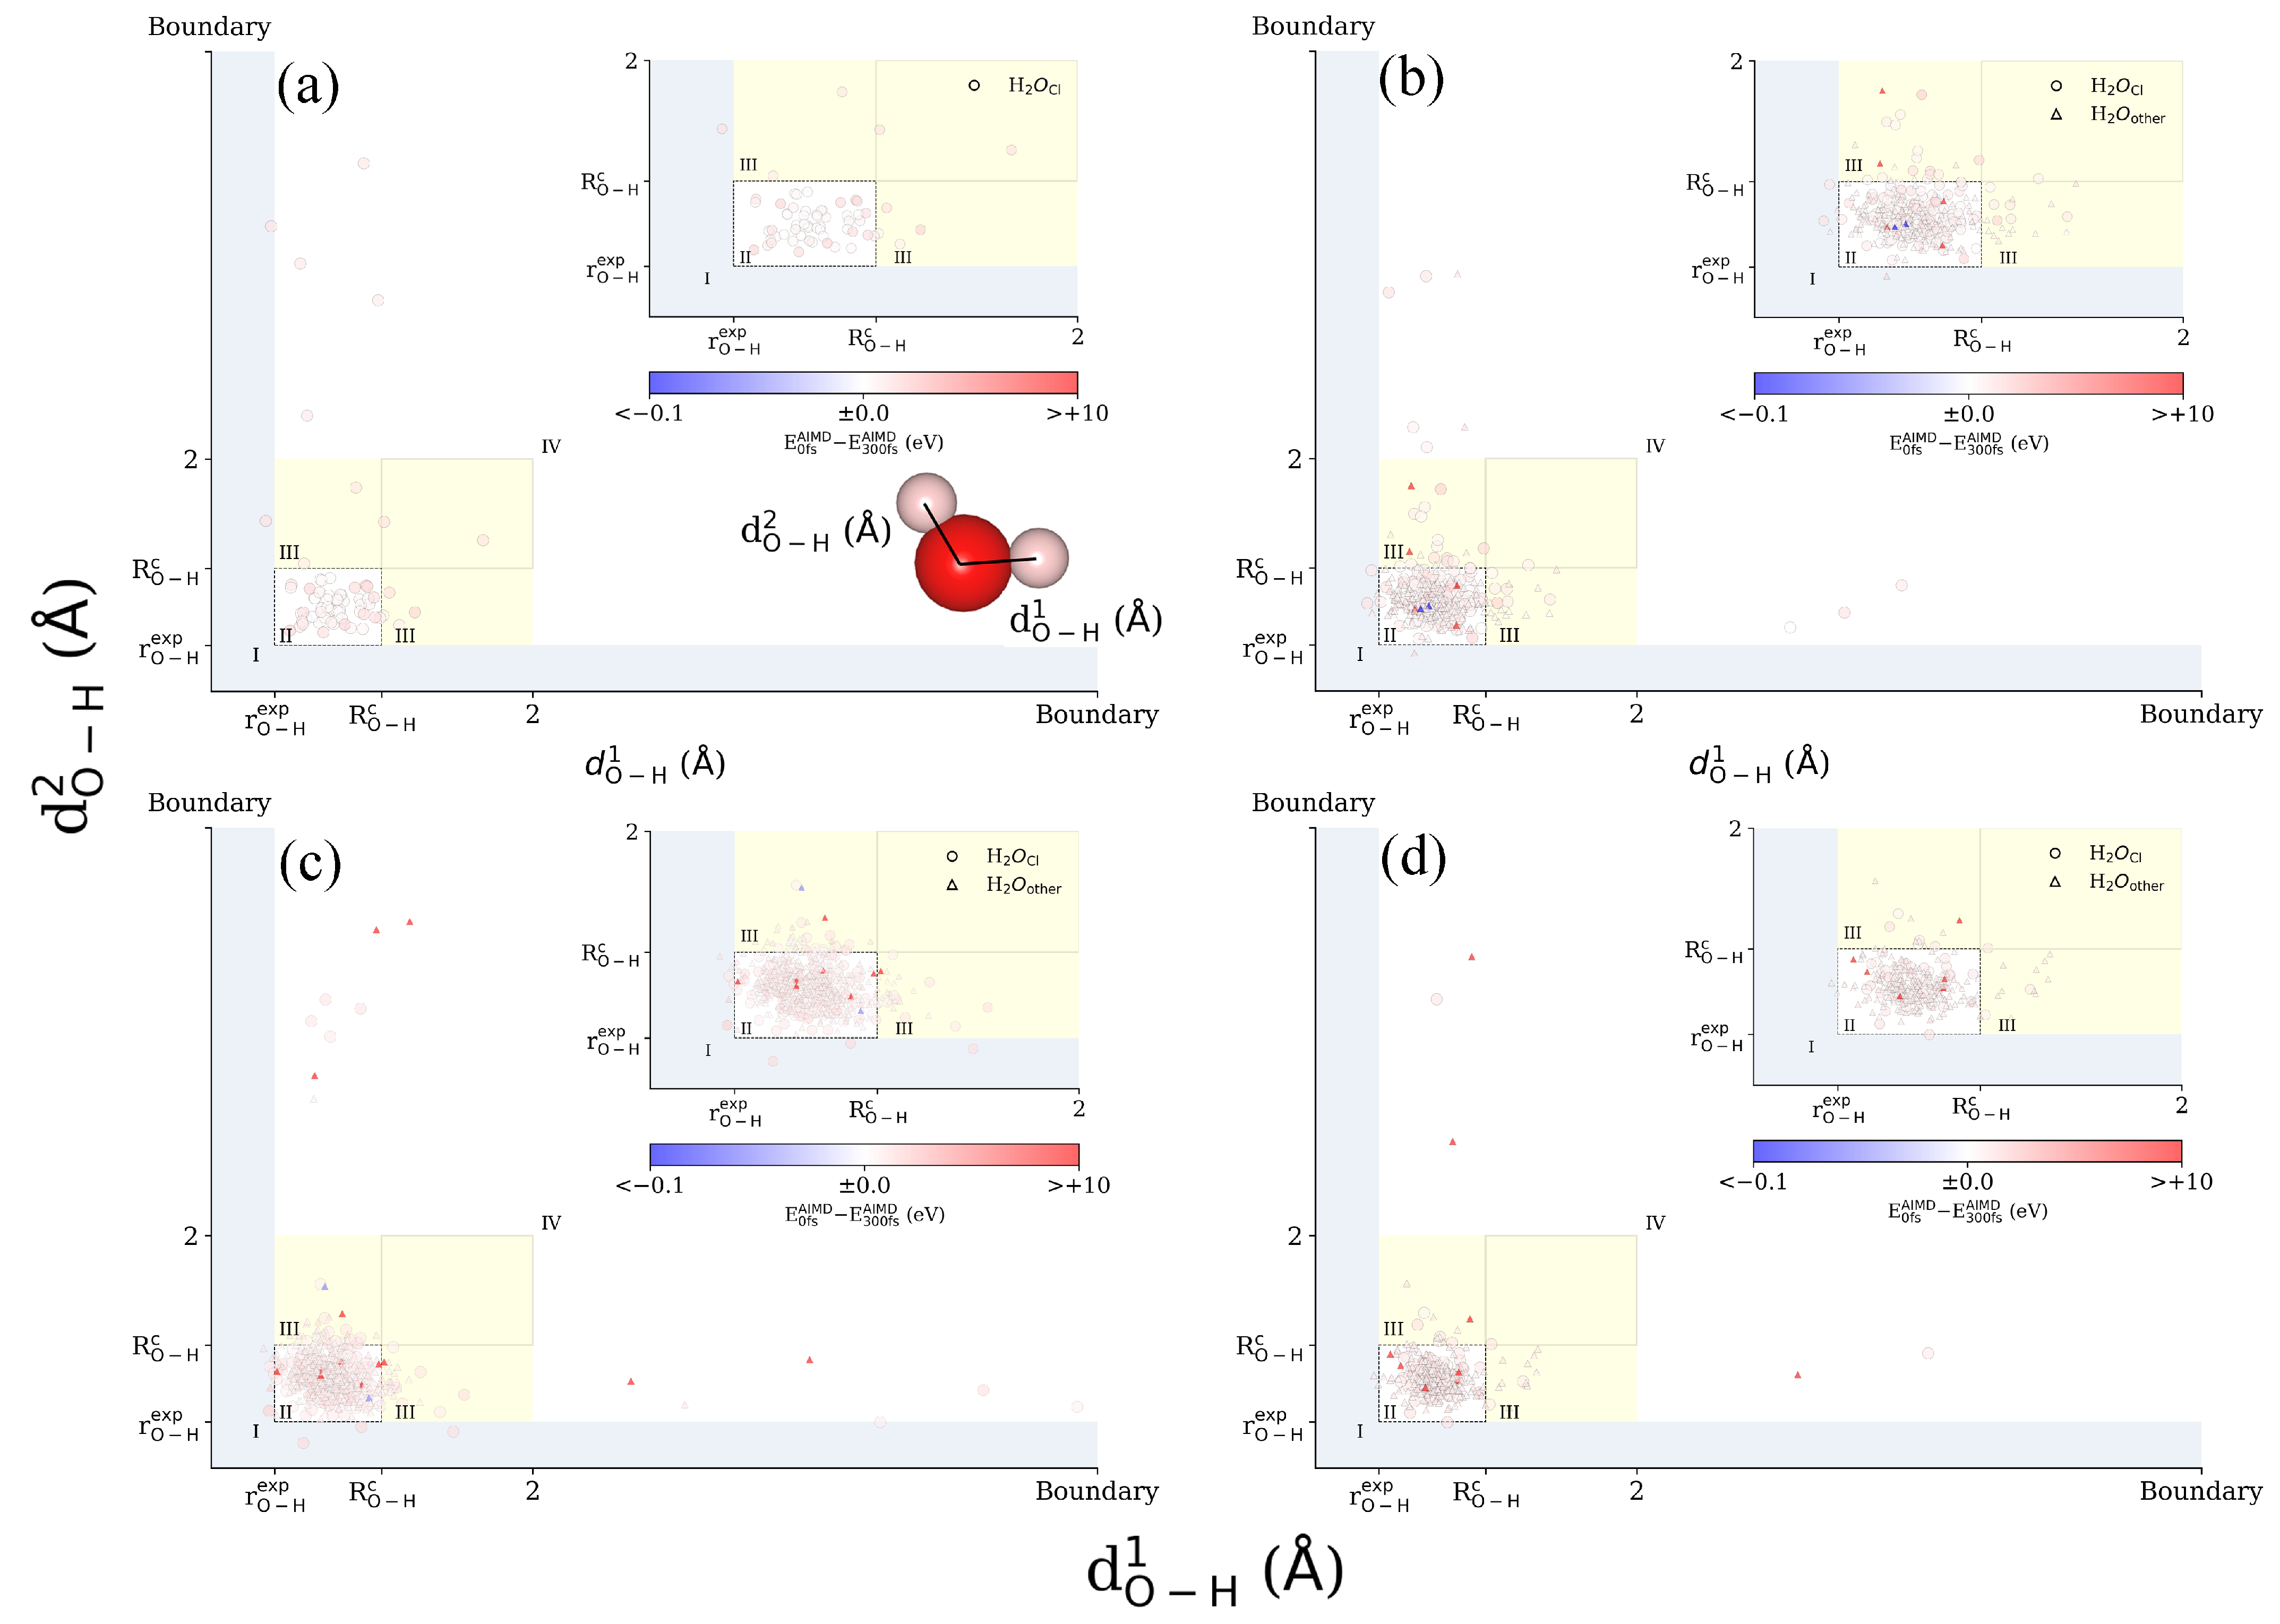
3.1. Ab Initio Molecular Dynamics (AIMD)
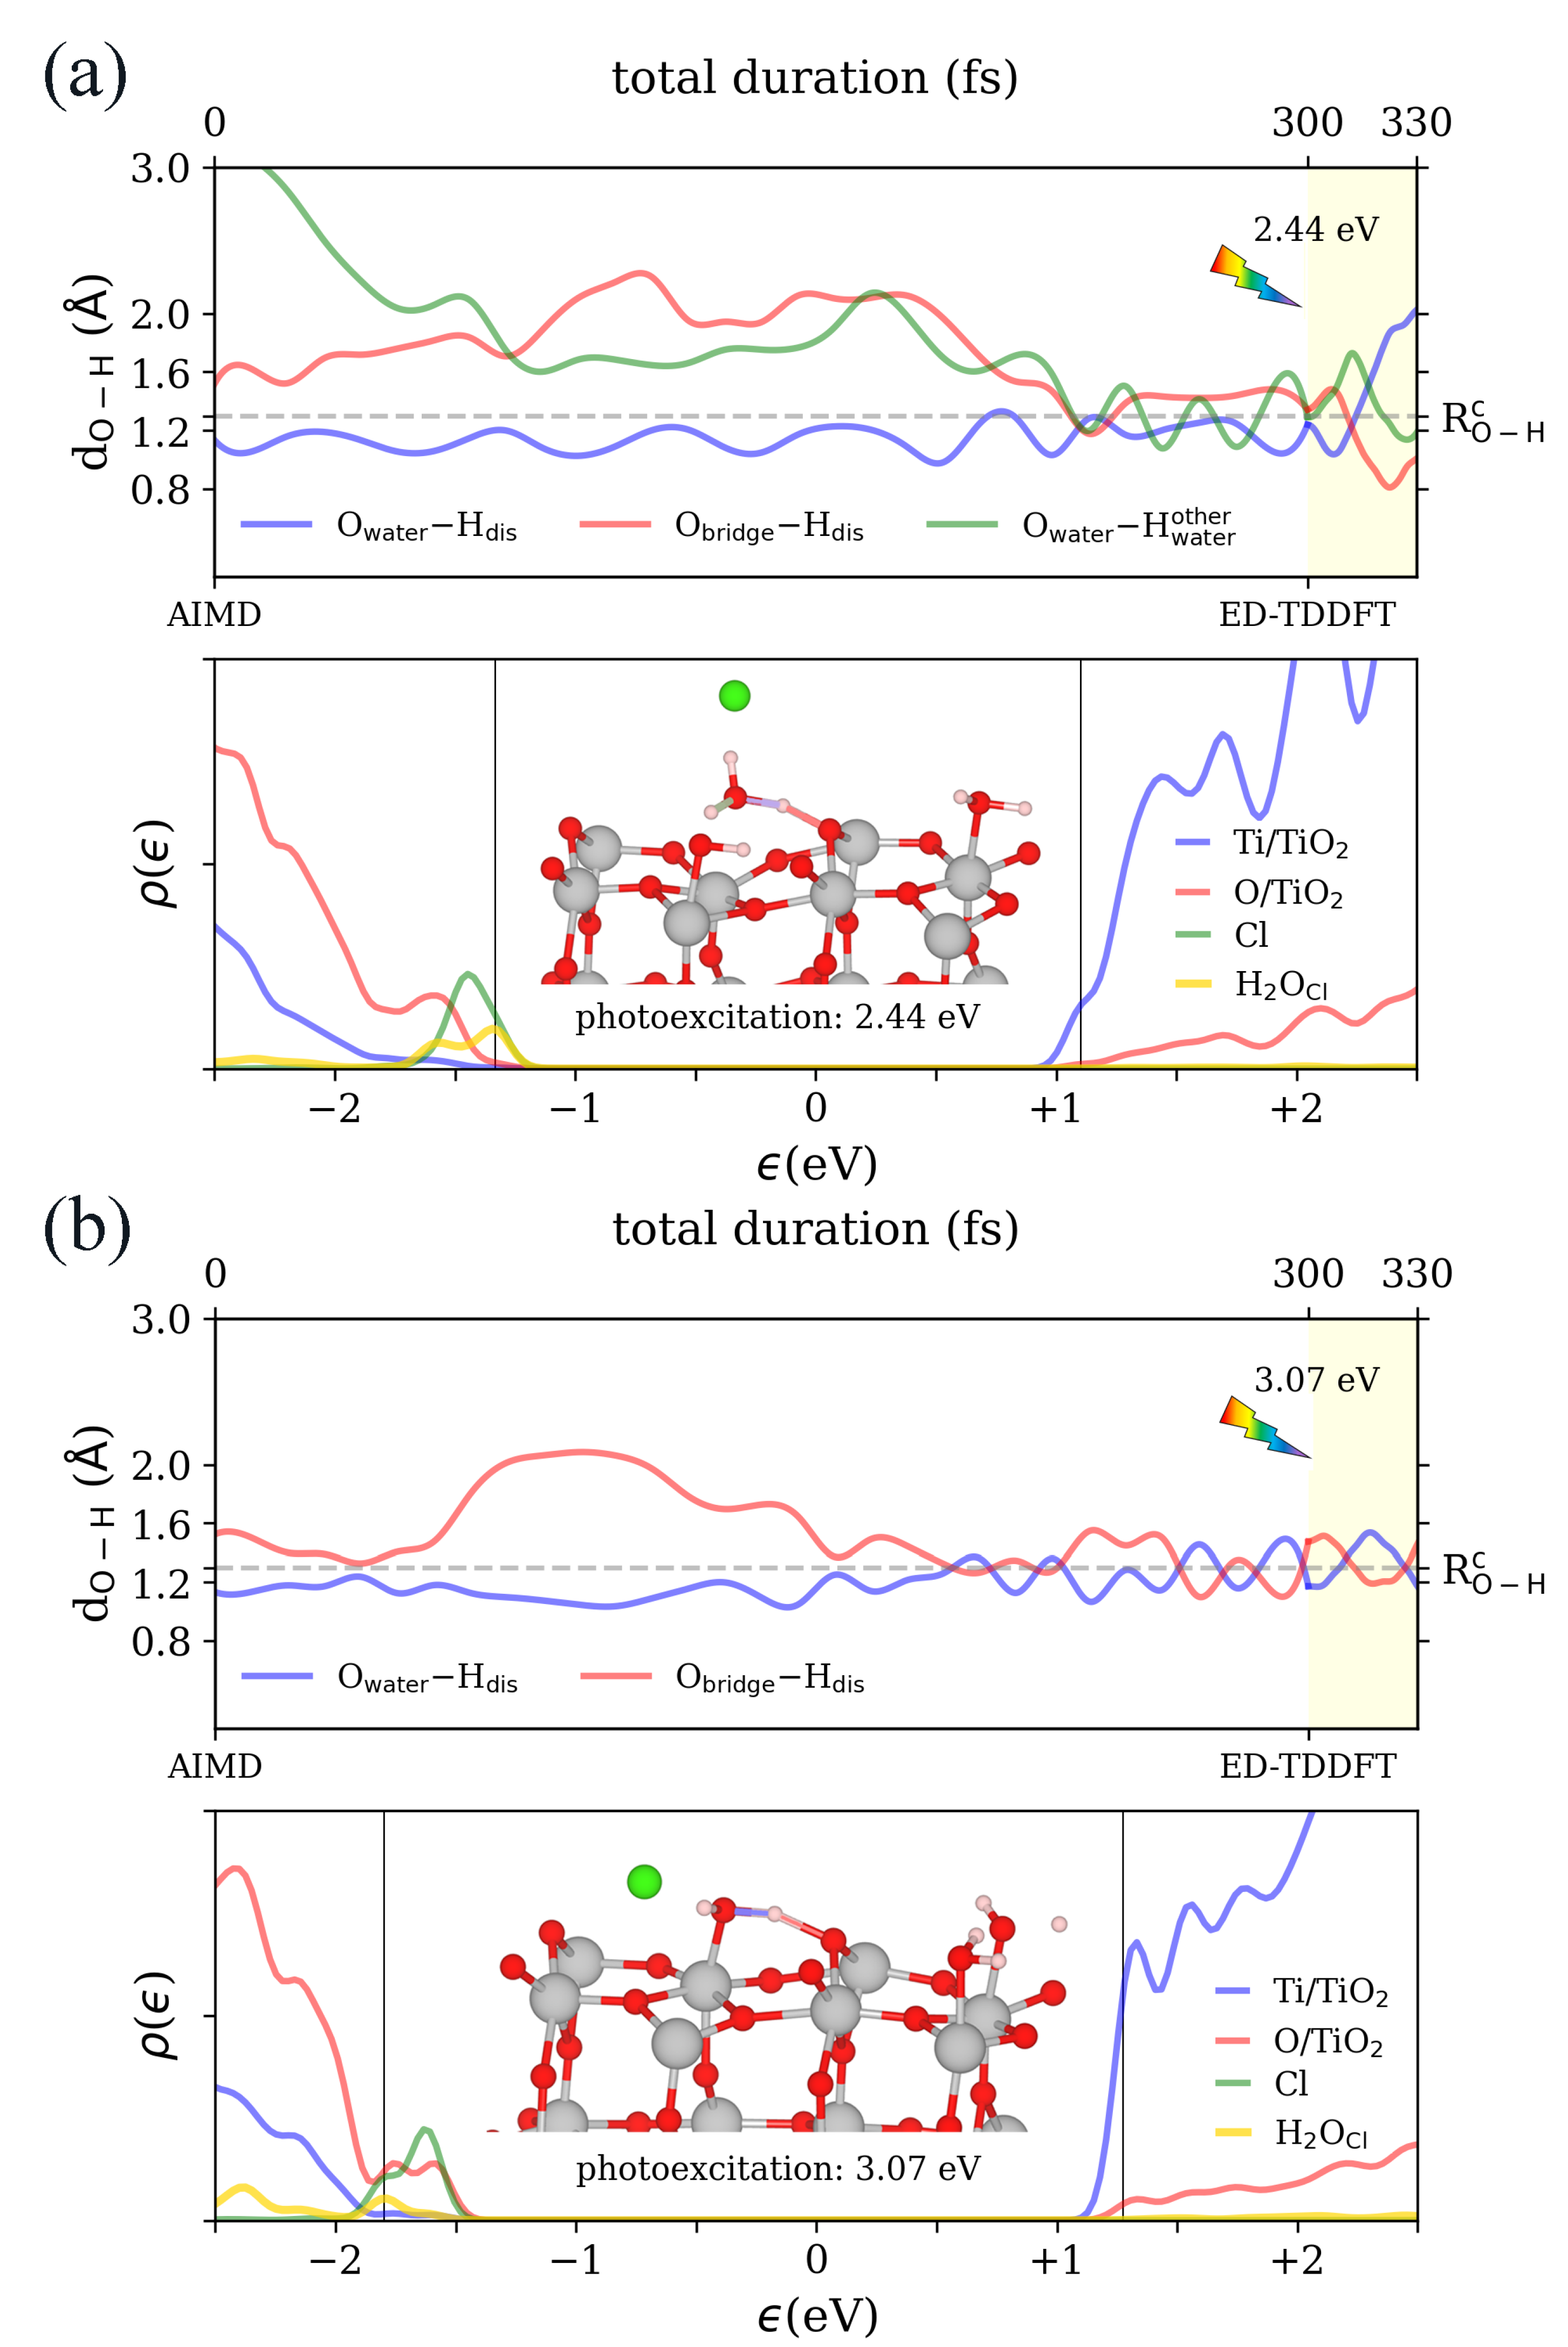
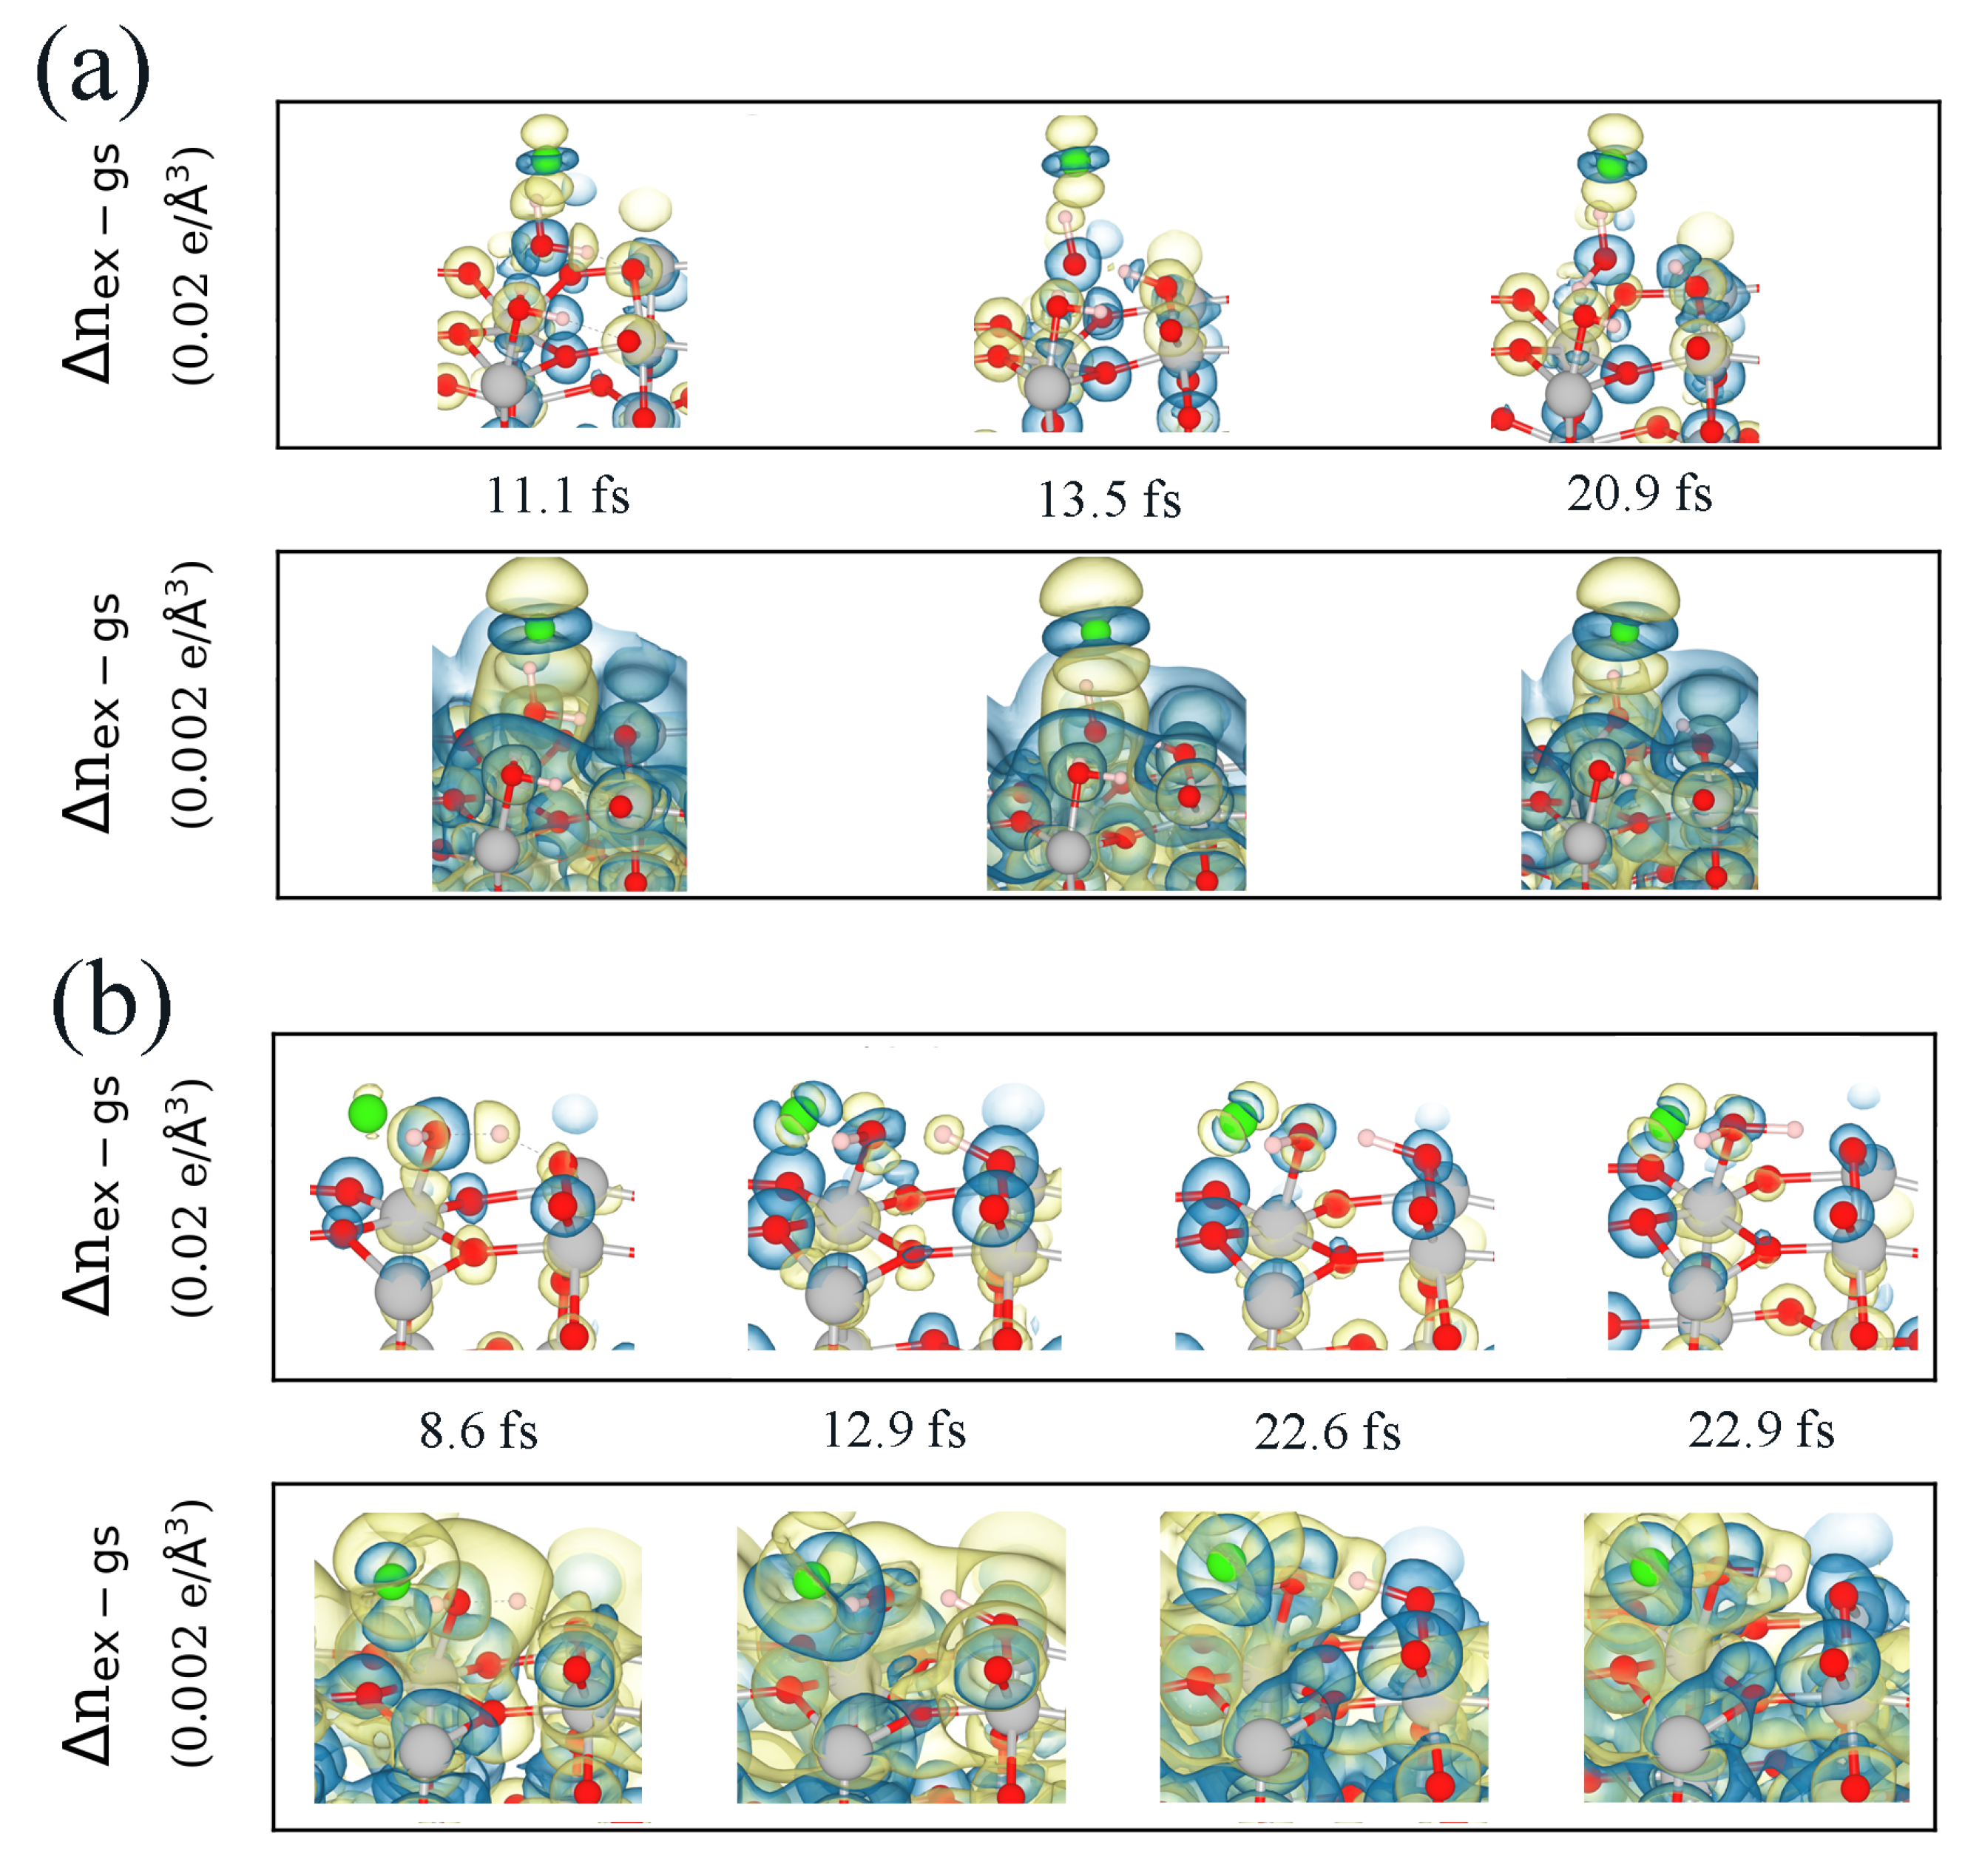
3.2. Real-Time Propagation of Time-Dependent Density Functional Theory within Ehrenfest Dynamics (ED–TDDFT)
4. Conclusions
Supplementary Materials
Author Contributions
Funding
Institutional Review Board Statement
Informed Consent Statement
Data Availability Statement
Conflicts of Interest
References
- Zhang, J.; Hu, W.; Cao, S.; Piao, L. Recent progress for hydrogen production by photocatalytic natural or simulated seawater splitting. Nano Res. 2020, 13, 2313–2322. [Google Scholar] [CrossRef]
- Ahmadvand, S.; Abbasi, B.; Azarfar, B.; Elhashimi, M.; Zhang, X.; Abbasi, B. Looking beyond energy efficiency: An applied review of water desalination technologies and an introduction to capillary–driven desalination. Water 2019, 11, 696. [Google Scholar] [CrossRef] [Green Version]
- Hausmann, J.N.; Schlögl, R.; Menezes, P.W.; Driess, M. Is direct seawater splitting economically meaningful? Energy Environ. Sci. 2021, 14, 3679–3685. [Google Scholar] [CrossRef]
- Gao, M.; Connor, P.K.N.; Ho, G.W. Plasmonic photothermic directed broadband sunlight harnessing for seawater catalysis and desalination. Energy Environ. Sci. 2016, 9, 3151–3160. [Google Scholar] [CrossRef] [Green Version]
- Simamora, A.J.; Chang, F.C.; Wang, H.P.; Yang, T.C.; Wei, Y.L.; Lin, W.K. H2 fuels from photocatalytic splitting of seawater affected by nano–TiO2 promoted with CuO and NiO. Int. J. Photoenergy 2013, 2013, 419182. [Google Scholar] [CrossRef] [Green Version]
- Ji, S.M.; Jun, H.; Jang, J.S.; Son, H.C.; Borse, P.H.; Lee, J.S. Photocatalytic hydrogen production from natural seawater. J. Photochem. Photobiol. A: Chem. 2007, 189, 141–144. [Google Scholar] [CrossRef]
- Yang, C.; Qin, J.; Rajendran, S.; Zhang, X.; Liu, R. WS2 and C–TiO2 nanorods acting as effective charge separators on g–C3N4 to boost visible–light activated hydrogen production from seawater. ChemSusChem 2018, 11, 4077–4085. [Google Scholar] [CrossRef]
- Perović, K.; dela Rosa, F.M.; Kovačić, M.; Kušić, H.; Štangar, U.L.; Fresno, F.; Dionysiou, D.D.; Loncaric Bozic, A. Recent achievements in development of TiO2-based composite photocatalytic materials for solar driven water purification and water splitting. Materials 2020, 13, 1338. [Google Scholar] [CrossRef] [Green Version]
- Dorosheva, I.; Rempel, A.; Trestsova, M.; Utepova, I.; Chupakhin, O. Synthesis of a TiO2 Photocatalyst for Dehydrogenative Cross-Coupling of (Hetero) Arenes. Inorg. Mater. 2019, 55, 155–161. [Google Scholar] [CrossRef]
- Serga, V.; Burve, R.; Krumina, A.; Pankratova, V.; Popov, A.I.; Pankratov, V. Study of phase composition, photocatalytic activity, and photoluminescence of TiO2 with Eu additive produced by the extraction-pyrolytic method. J. Mater. Res. Technol. 2021, 13, 2350–2360. [Google Scholar] [CrossRef]
- Kenmoe, S.; Lisovski, O.; Piskunov, S.; Bocharov, D.; Zhukovskii, Y.F.; Spohr, E. Water adsorption on clean and defective anatase TiO2 (001) nanotube surfaces: A surface science approach. J. Phys. Chem. B 2018, 122, 5432–5440. [Google Scholar] [CrossRef] [PubMed]
- Dorosheva, I.; Valeeva, A.; Rempel, A.; Trestsova, M.; Utepova, I.; Chupakhin, O. Synthesis and physicochemical properties of nanostructured TiO2 with enhanced photocatalytic activity. Inorg. Mater. 2021, 57, 503–510. [Google Scholar] [CrossRef]
- Schneider, J.; Matsuoka, M.; Takeuchi, M.; Zhang, J.; Horiuchi, Y.; Anpo, M.; Bahnemann, D.W. Understanding TiO2 photocatalysis: Mechanisms and materials. Chem. Rev. 2014, 114, 9919–9986. [Google Scholar] [CrossRef] [PubMed]
- Margineda, J.; English, N.J. Dynamical and structural properties of adsorbed water molecules at the TiO2 rutile–(110) surface: Interfacial hydrogen bonding probed by ab–initio molecular dynamics. Mol. Phys. 2020, 118, e1725166. [Google Scholar] [CrossRef]
- Balzaretti, F.; Gupta, V.; Ciacchi, L.C.; Aradi, B.; Frauenheim, T.; Köppen, S. Water reactions on reconstructed rutile TiO2: A density functional theory/density functional tight binding approach. J. Phys. Chem. C 2021, 125, 13234–13246. [Google Scholar] [CrossRef]
- Agosta, L.; Brandt, E.G.; Lyubartsev, A.P. Diffusion and reaction pathways of water near fully hydrated TiO2 surfaces from ab initio molecular dynamics. J. Chem. Phys. 2017, 147, 024704. [Google Scholar] [CrossRef] [Green Version]
- Tritsaris, G.A.; Vinichenko, D.; Kolesov, G.; Friend, C.M.; Kaxiras, E. Dynamics of the photogenerated hole at the rutile TiO2(110)/water interface: A nonadiabatic simulation study. J. Phys. Chem. C 2014, 118, 27393–27401. [Google Scholar] [CrossRef]
- Sumaria, V.; Krishnamurthy, D.; Viswanathan, V. Quantifying Confidence in DFT Predicted Surface Pourbaix Diagrams and Associated Reaction Pathways for Chlorine Evolution. ACS Catal. 2018, 8, 9034–9042. [Google Scholar] [CrossRef] [Green Version]
- Pham, T.A.; Ping, Y.; Galli, G. Modelling heterogeneous interfaces for solar water splitting. Nat. Mater. 2017, 16, 401–408. [Google Scholar] [CrossRef]
- Ojanperä, A.; Havu, V.; Lehtovaara, L.; Puska, M. Nonadiabatic Ehrenfest molecular dynamics within the projector augmented–wave method. J. Chem. Phys. 2012, 136, 144103. [Google Scholar] [CrossRef] [Green Version]
- Ojanperä, A.; Krasheninnikov, A.V.; Puska, M. Electronic stopping power from first–principles calculations with account for core electron excitations and projectile ionization. Phys. Rev. B 2014, 89, 035120. [Google Scholar] [CrossRef] [Green Version]
- Kolesov, G.; Vinichenko, D.; Tritsaris, G.A.; Friend, C.M.; Kaxiras, E. Anatomy of the photochemical reaction: Excited-state dynamics reveals the C–H acidity mechanism of methoxy photo–oxidation on titania. J. Phys. Chem. Lett. 2015, 6, 1624–1627. [Google Scholar] [CrossRef]
- You, P.; Lian, C.; Chen, D.; Xu, J.; Zhang, C.; Meng, S.; Wang, E. Nonadiabatic dynamics of photocatalytic water splitting on a polymeric semiconductor. Nano Lett. 2021, 21, 6449–6455. [Google Scholar] [CrossRef] [PubMed]
- Lee, Y.; Kolesov, G.; Yao, X.; Kaxiras, E.; Cho, K. Nonadiabatic dynamics of cobalt tricarbonyl nitrosyl for ligand dissociation induced by electronic excitation. Sci. Rep. 2021, 11, 8997. [Google Scholar] [CrossRef] [PubMed]
- You, P.; Chen, D.; Lian, C.; Zhang, C.; Meng, S. First–principles dynamics of photoexcited molecules and materials towards a quantum description. Wiley Interdiscip. Rev. Comput. Mol. Sci. 2021, 11, e1492. [Google Scholar] [CrossRef]
- Kolesov, G.; Grånäs, O.; Hoyt, R.; Vinichenko, D.; Kaxiras, E. Real–time TD–DFT with classical ion dynamics: Methodology and applications. J. Chem. Theory Comput. 2016, 12, 466–476. [Google Scholar] [CrossRef]
- Walter, M.; Häkkinen, H.; Lehtovaara, L.; Puska, M.; Enkovaara, J.; Rostgaard, C.; Mortensen, J.J. Time–dependent density-functional theory in the projector augmented–wave method. J. Chem. Phys. 2008, 128, 244101. [Google Scholar] [CrossRef] [Green Version]
- Gavnholt, J.; Olsen, T.; Engelund, M.; Schiøtz, J. Δ self-consistent field method to obtain potential energy surfaces of excited molecules on surfaces. Phys. Rev. B 2008, 78, 075441. [Google Scholar] [CrossRef] [Green Version]
- Olsen, T.; Gavnholt, J.; Schiøtz, J. Hot–electron–mediated desorption rates calculated from excited–state potential energy surfaces. Phys. Rev. B 2009, 79, 035403. [Google Scholar] [CrossRef] [Green Version]
- Fiorenza, R.; Sciré, S.; D’Urso, L.; Compagnini, G.; Bellardita, M.; Palmisano, L. Efficient H2 production by photocatalytic water splitting under UV or solar light over variously modified TiO2–based catalysts. Int. J. Hydrog. Energy 2019, 44, 14796–14807. [Google Scholar] [CrossRef]
- Larsen, A.H.; Mortensen, J.J.; Blomqvist, J.; Castelli, I.E.; Christensen, R.; Dułak, M.; Friis, J.; Groves, M.N.; Hammer, B.; Hargus, C.; et al. The atomic simulation environment—A Python library for working with atoms. J. Phys. Condens. Matter 2017, 29, 273002. [Google Scholar] [CrossRef] [PubMed] [Green Version]
- Bahn, S.R.; Jacobsen, K.W. An object–oriented scripting interface to a legacy electronic structure code. Comput. Sci. Eng. 2002, 4, 56–66. [Google Scholar] [CrossRef] [Green Version]
- Mortensen, J.J.; Hansen, L.B.; Jacobsen, K.W. Real-space grid implementation of the projector augmented wave method. Phys. Rev. B 2005, 71, 035109. [Google Scholar] [CrossRef] [Green Version]
- Enkovaara, J.; Rostgaard, C.; Mortensen, J.J.; Chen, J.; Dułak, M.; Ferrighi, L.; Gavnholt, J.; Glinsvad, C.; Haikola, V.; Hansen, H.A.; et al. Electronic structure calculations with GPAW: A real-space implementation of the projector augmented-wave method. J. Phys.: Condens. Matter 2010, 22, 253202. [Google Scholar] [CrossRef]
- Nocedal, J.; Wright, S.J. Numerical Optimization: Springer Series in Operations Research and Financial Engineering; Springer: Cham, Swizterland, 2006. [Google Scholar]
- Larsen, A.H.; Vanin, M.; Mortensen, J.J.; Thygesen, K.S.; Jacobsen, K.W. Localized atomic basis set in the projector augmented wave method. Phys. Rev. B 2009, 80, 195112. [Google Scholar] [CrossRef] [Green Version]
- Brandt, E.G.; Agosta, L.; Lyubartsev, A.P. Reactive wetting properties of TiO2 nanoparticles predicted by ab initio molecular dynamics simulations. Nanoscale 2016, 8, 13385–13398. [Google Scholar] [CrossRef]
- Barca, G.M.J.; Gilbert, A.T.B.; Gill, P.M.W. Simple Models for Difficult Electronic Excitations. J. Chem. Theory Comput. 2018, 14, 1501–1509. [Google Scholar] [CrossRef]
- Ivanov, A.V.; Levi, G.; Jansson, E.A.; Jansson, H. Method for Calculating Excited Electronic States Using Density Functionals and Direct Orbital Optimization with Real Space Grid or Plane-Wave Basis Set. J. Chem. Theory Comput. 2021, 17, 5034–5049. [Google Scholar] [CrossRef]
- Perdew, J.P.; Burke, K.; Ernzerhof, M. Generalized Gradient Approximation Made Simple. Phys. Rev. Lett. 1996, 77, 3865–3868. [Google Scholar] [CrossRef] [Green Version]
- Kowalski, P.M.; Camellone, M.F.; Nair, N.N.; Meyer, B.; Marx, D. Charge localization dynamics induced by oxygen vacancies on the TiO2(110) Surface. Phys. Rev. Lett. 2010, 105, 146405. [Google Scholar] [CrossRef] [Green Version]
- Morgan, B.J.; Watson, G.W. Intrinsic n-type defect formation in TiO2: A comparison of rutile and anatase from GGA+U calculations. J. Phys. Chem. C 2010, 114, 2321–2328. [Google Scholar] [CrossRef]
- Vu, N.H.; Le, H.V.; Cao, T.M.; Pham, V.V.; Le, H.M.; Nguyen-Manh, D. Anatase–rutile phase transformation of titanium dioxide bulk material: A DFT+U approach. J. Phys. Condens. Matter 2012, 24, 405501. [Google Scholar] [CrossRef]
- Alghamdi, H.; Idriss, H. Study of the modes of adsorption and electronic structure of hydrogen peroxide and ethanol over TiO2 rutile (110) surface within the context of water splitting. Surf. Sci. 2018, 669, 103–113. [Google Scholar] [CrossRef]
- Chrétien, S.; Metiu, H. Electronic structure of partially reduced rutile TiO2(110) surface: Where are the unpaired electrons located? J. Phys. Chem. C 2011, 115, 4696–4705. [Google Scholar] [CrossRef]
- Van der Walt, S.; Colbert, S.C.; Varoquaux, G. The numpy array: A structure for efficient numerical computation. Comput. Sci. Eng. 2011, 13, 22–30. [Google Scholar] [CrossRef] [Green Version]
- Hunter, J.D. Matplotlib: A 2D graphics environment. Comput. Sci. Eng. 2007, 9, 90–95. [Google Scholar] [CrossRef]
- Vogtenhuber, D.; Podloucky, R.; Redinger, J. Ab initio study of atomic Cl adsorption on stoichiometric and reduced rutile TiO2 (110) surfaces. Surf. Sci. 2000, 454–456, 369–373. [Google Scholar] [CrossRef]
- Vogtenhuber, D.; Podloucky, R.; Redinger, J.; Hebenstreit, E.L.D.; Hebenstreit, W.; Diebold, U. Ab initio and experimental studies of chlorine adsorption on the rutile TiO2(110) (110) surface. Phys. Rev. B 2002, 65, 125411. [Google Scholar] [CrossRef]
- Enshasy, H.; Al-Haija, Q.A.; Al-Nashr, M.; Al-Muhaisen, S. A schematic design of HHO cell as green energy storage. Acta Electron. Malays. (AEM) 2019, 3, 9–15. [Google Scholar] [CrossRef]
- Huš, M.; Urbic, T. Strength of hydrogen bonds of water depends on local environment. J. Chem. Phys. 2012, 136, 144305. [Google Scholar] [CrossRef] [Green Version]
- Soper, A.K.; Benmore, C.J. Quantum differences between heavy and light water. Phys. Rev. Lett. 2008, 101, 065502. [Google Scholar] [CrossRef] [PubMed]
- Fanourgakis, G.S.; Xantheas, S.S. The bend angle of water in ice Ih and liquid water: The significance of implementing the nonlinear monomer dipole moment surface in classical interaction potentials. J. Chem. Phys. 2006, 124, 174504. [Google Scholar] [CrossRef]
- Li, Y.; He, F.; Peng, S.; Lu, G.; Li, S. Photocatalytic H2 evolution from NaCl saltwater over ZnS1−x−0.5yOx(OH)y–ZnO under visible light irradiation. Int. J. Hydrog. Energy 2011, 36, 10565–10573. [Google Scholar] [CrossRef]
- Li, Y.; Gao, D.; Peng, S.; Lu, G.; Li, S. Photocatalytic hydrogen evolution over Pt/Cd0.5Zn0.5S from saltwater using glucose as electron donor: An investigation of the influence of electrolyte NaCl. Int. J. Hydrog. Energy 2011, 36, 4291–4297. [Google Scholar] [CrossRef]
- Tada, K.; Sakata, K.; Yamada, S.; Okazaki, K.; Kitagawa, Y.; Kawakami, T.; Yamanaka, S.; Okumura, M. DFT calculations for Au adsorption onto a reduced TiO2 (110) surface with the coexistence of Cl. Mol. Phys. 2014, 112, 365–378. [Google Scholar] [CrossRef]
- Hirshfeld, F.L. Bonded–atom fragments for describing molecular charge densities. Theoret. Chim. Acta 1977, 44, 129–138. [Google Scholar] [CrossRef]
- Zhang, Y.; Liu, J.; Zhang, Y.; Bi, Y. Relationship between interatomic electron transfer and photocatalytic activity of TiO2. Nano Energy 2018, 51, 504–512. [Google Scholar] [CrossRef]


Disclaimer/Publisher’s Note: The statements, opinions and data contained in all publications are solely those of the individual author(s) and contributor(s) and not of MDPI and/or the editor(s). MDPI and/or the editor(s) disclaim responsibility for any injury to people or property resulting from any ideas, methods, instructions or products referred to in the content. |
© 2023 by the authors. Licensee MDPI, Basel, Switzerland. This article is an open access article distributed under the terms and conditions of the Creative Commons Attribution (CC BY) license (https://creativecommons.org/licenses/by/4.0/).
Share and Cite
Lin, Y.-P.; Bocharov, D.; Isakoviča, I.; Pankratov, V.; Popov, A.A.; Popov, A.I.; Piskunov, S. Chlorine Adsorption on TiO2(110)/Water Interface: Nonadiabatic Molecular Dynamics Simulations for Photocatalytic Water Splitting. Electron. Mater. 2023, 4, 33-48. https://doi.org/10.3390/electronicmat4010004
Lin Y-P, Bocharov D, Isakoviča I, Pankratov V, Popov AA, Popov AI, Piskunov S. Chlorine Adsorption on TiO2(110)/Water Interface: Nonadiabatic Molecular Dynamics Simulations for Photocatalytic Water Splitting. Electronic Materials. 2023; 4(1):33-48. https://doi.org/10.3390/electronicmat4010004
Chicago/Turabian StyleLin, Yin-Pai, Dmitry Bocharov, Inta Isakoviča, Vladimir Pankratov, Aleksandr A. Popov, Anatoli I. Popov, and Sergei Piskunov. 2023. "Chlorine Adsorption on TiO2(110)/Water Interface: Nonadiabatic Molecular Dynamics Simulations for Photocatalytic Water Splitting" Electronic Materials 4, no. 1: 33-48. https://doi.org/10.3390/electronicmat4010004