

Study of Electronic Bands of Diatomic Molecules for the Evaluation of Toxicity of Green Crackers Using LIBS Coupled with Chemometric Method

Abstract
:1. Introduction
2. Materials and Methods
3. Results and Discussion
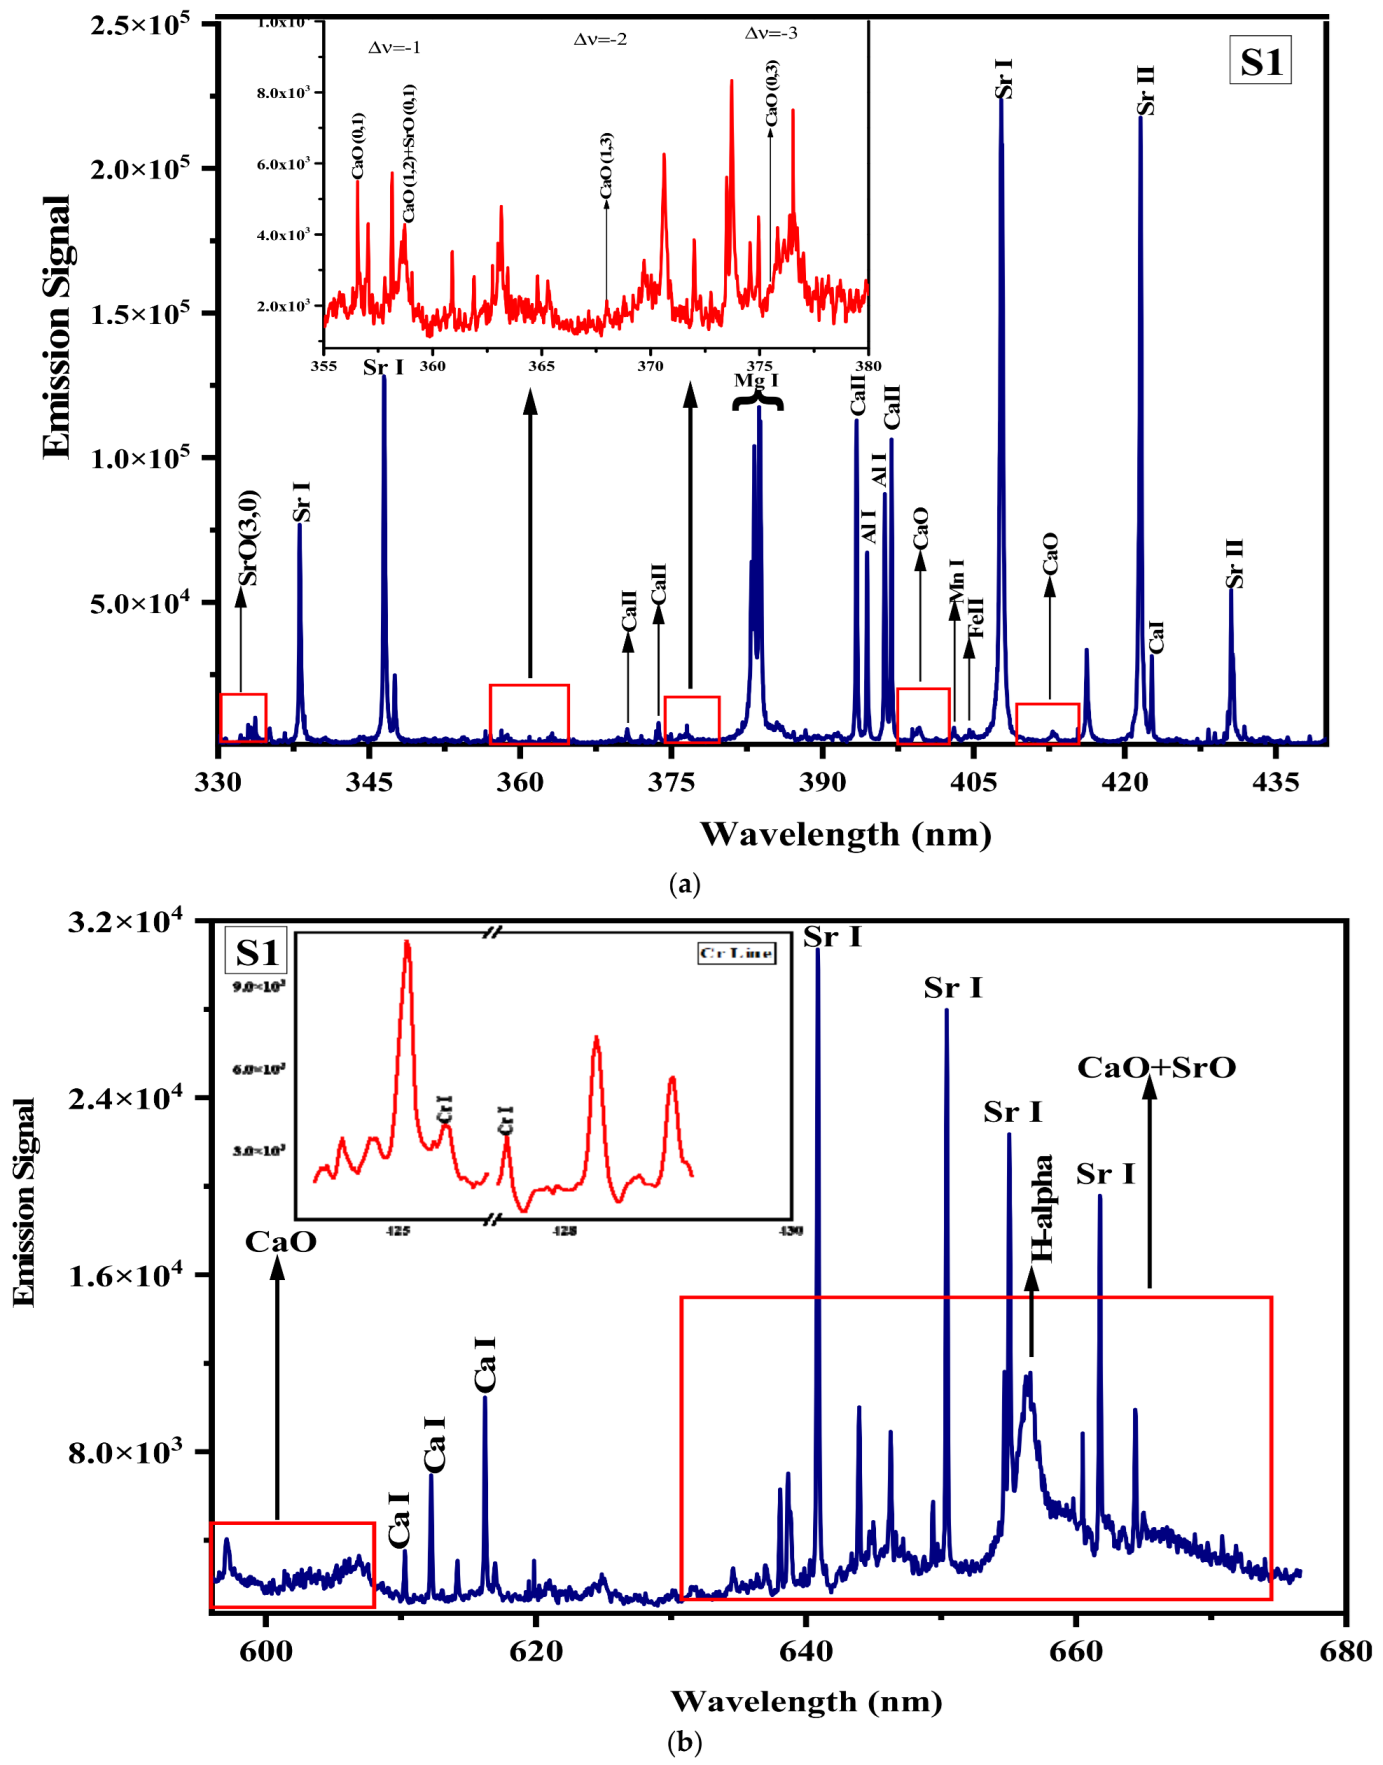
3.1. Qualitative Analysis
- (i).
- Stoichiometric Ablation
- (ii).
- Optically thin Plasma.
- (iii).
- Local thermal equilibrium (LTE).
- (i).
- Stoichiometric Ablation.
- (ii).
- Optically thin plasma:
- (iii).
- Local Thermal Equilibrium (LTE):
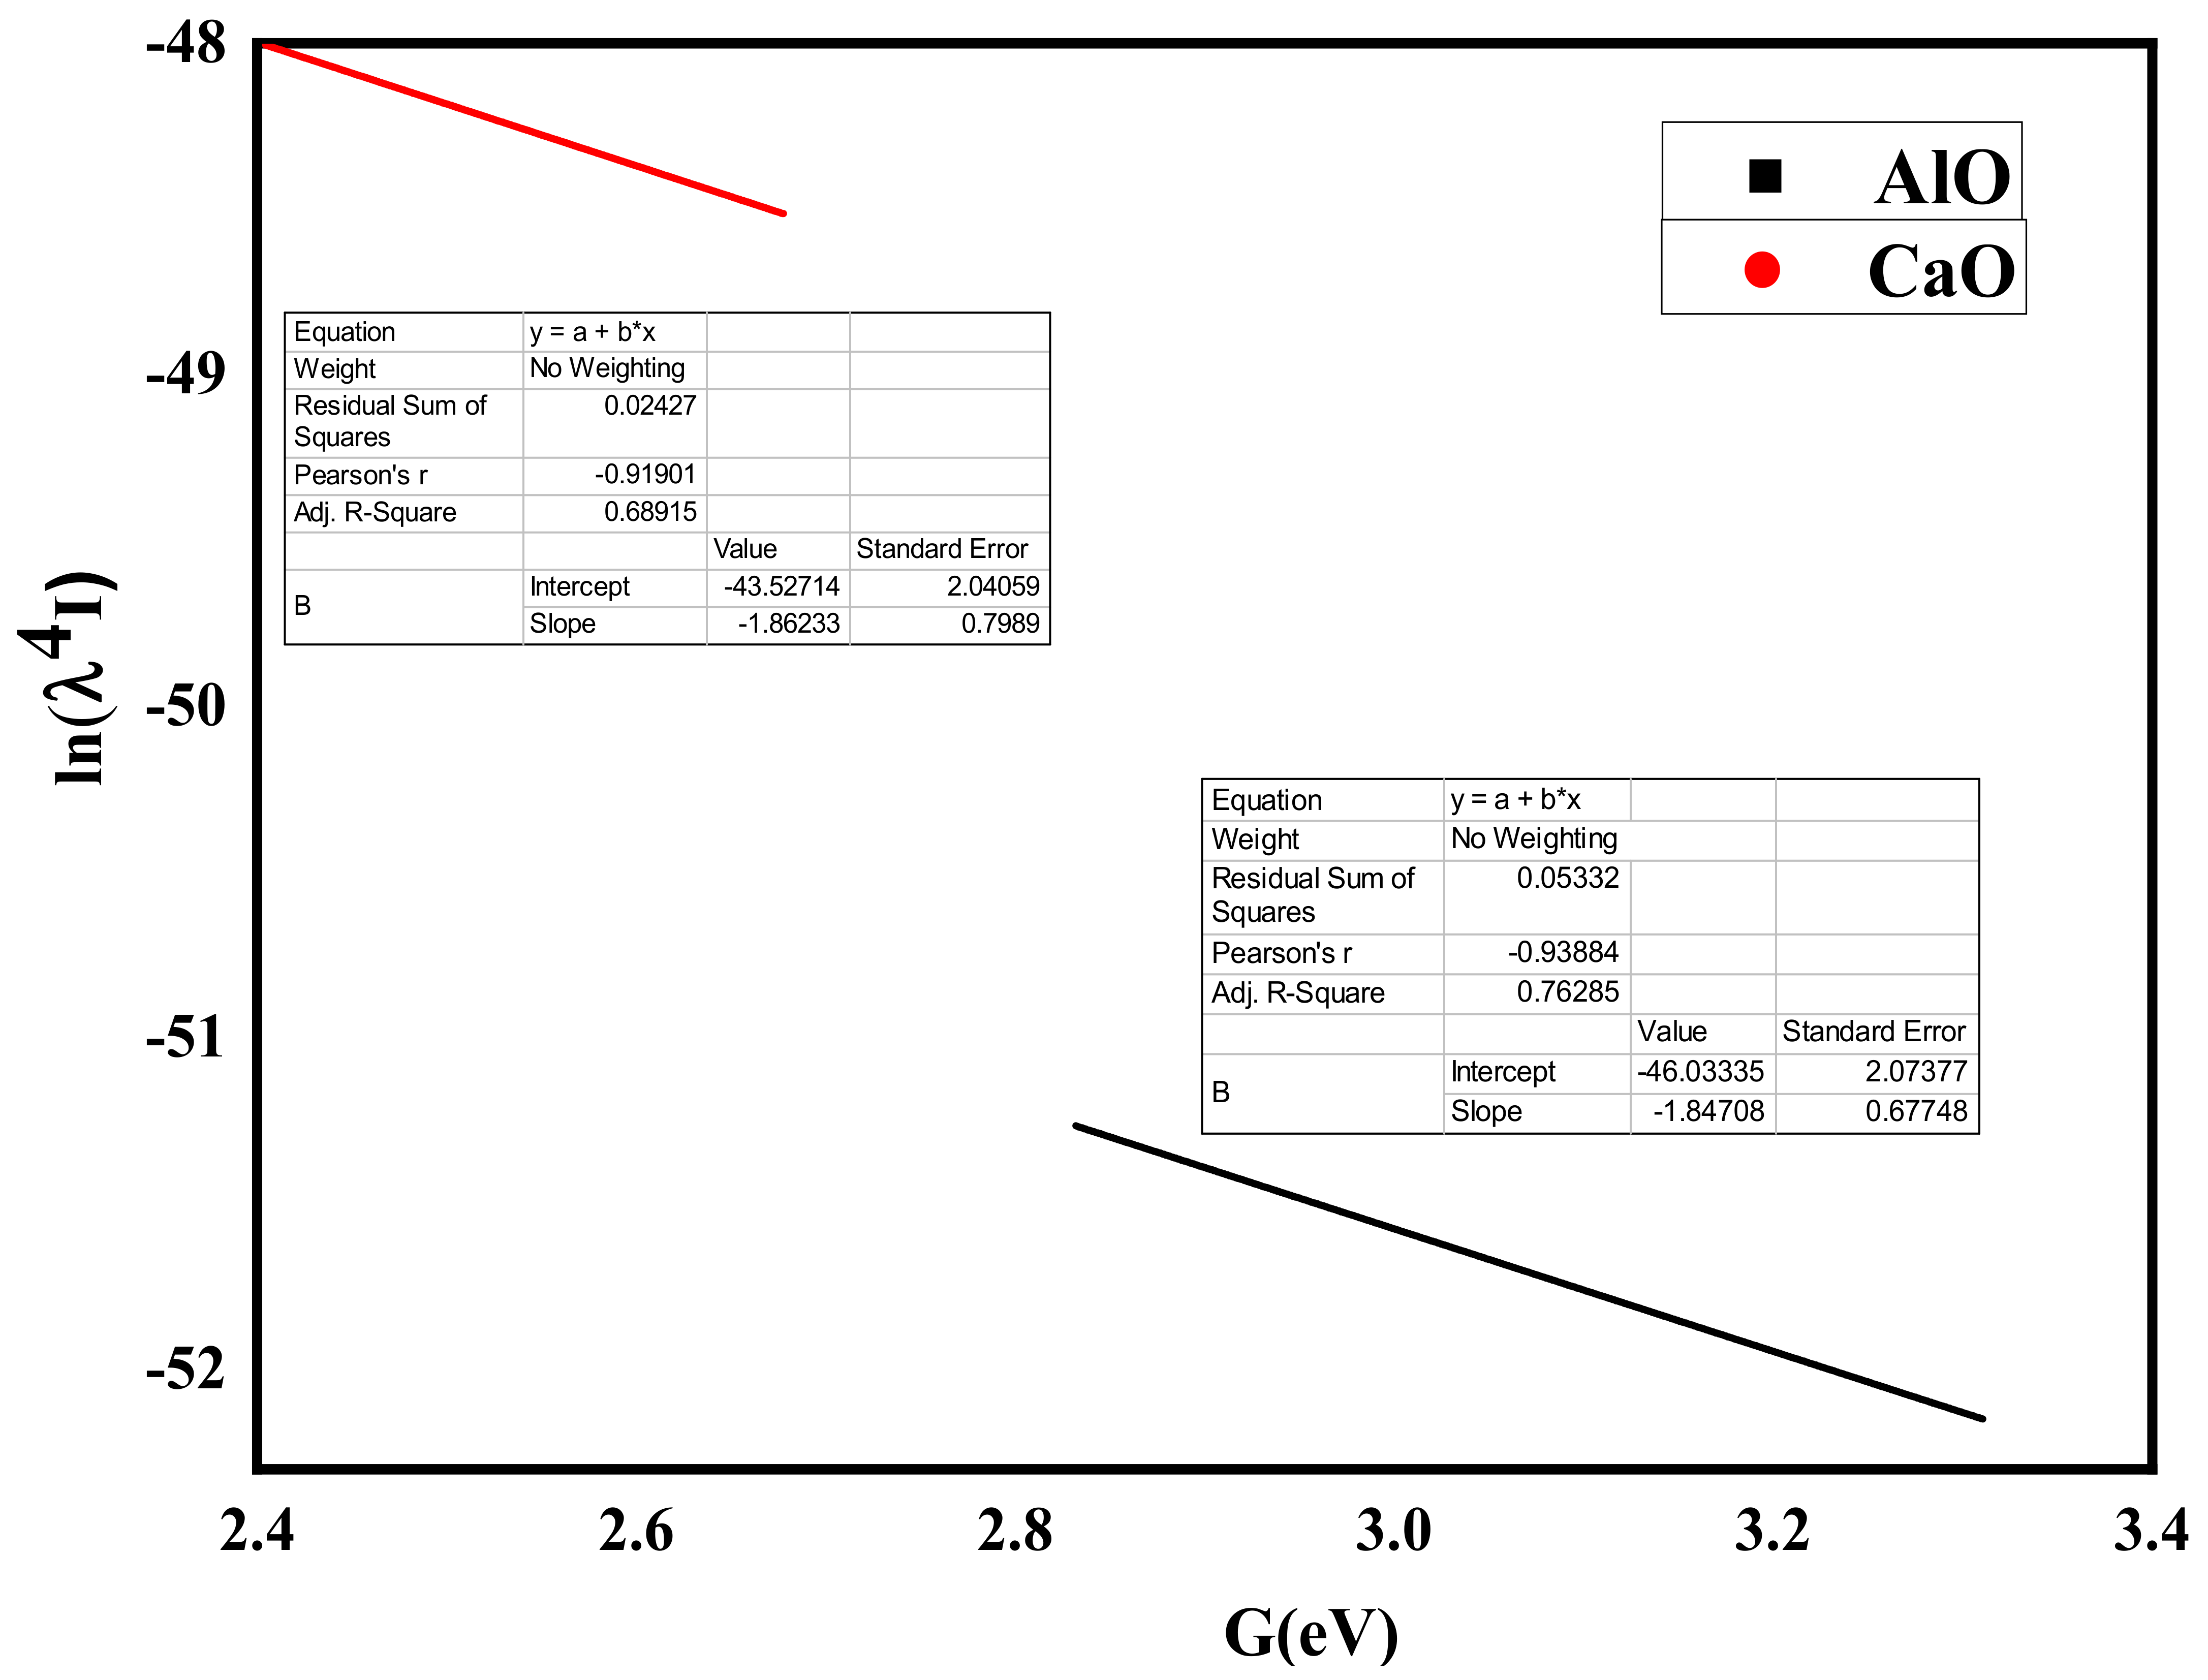
3.2. Plasma Parameters Using AlO Molecular Bands
3.3. Fourier Transform Infrared Analysis (FTIR) Analysis
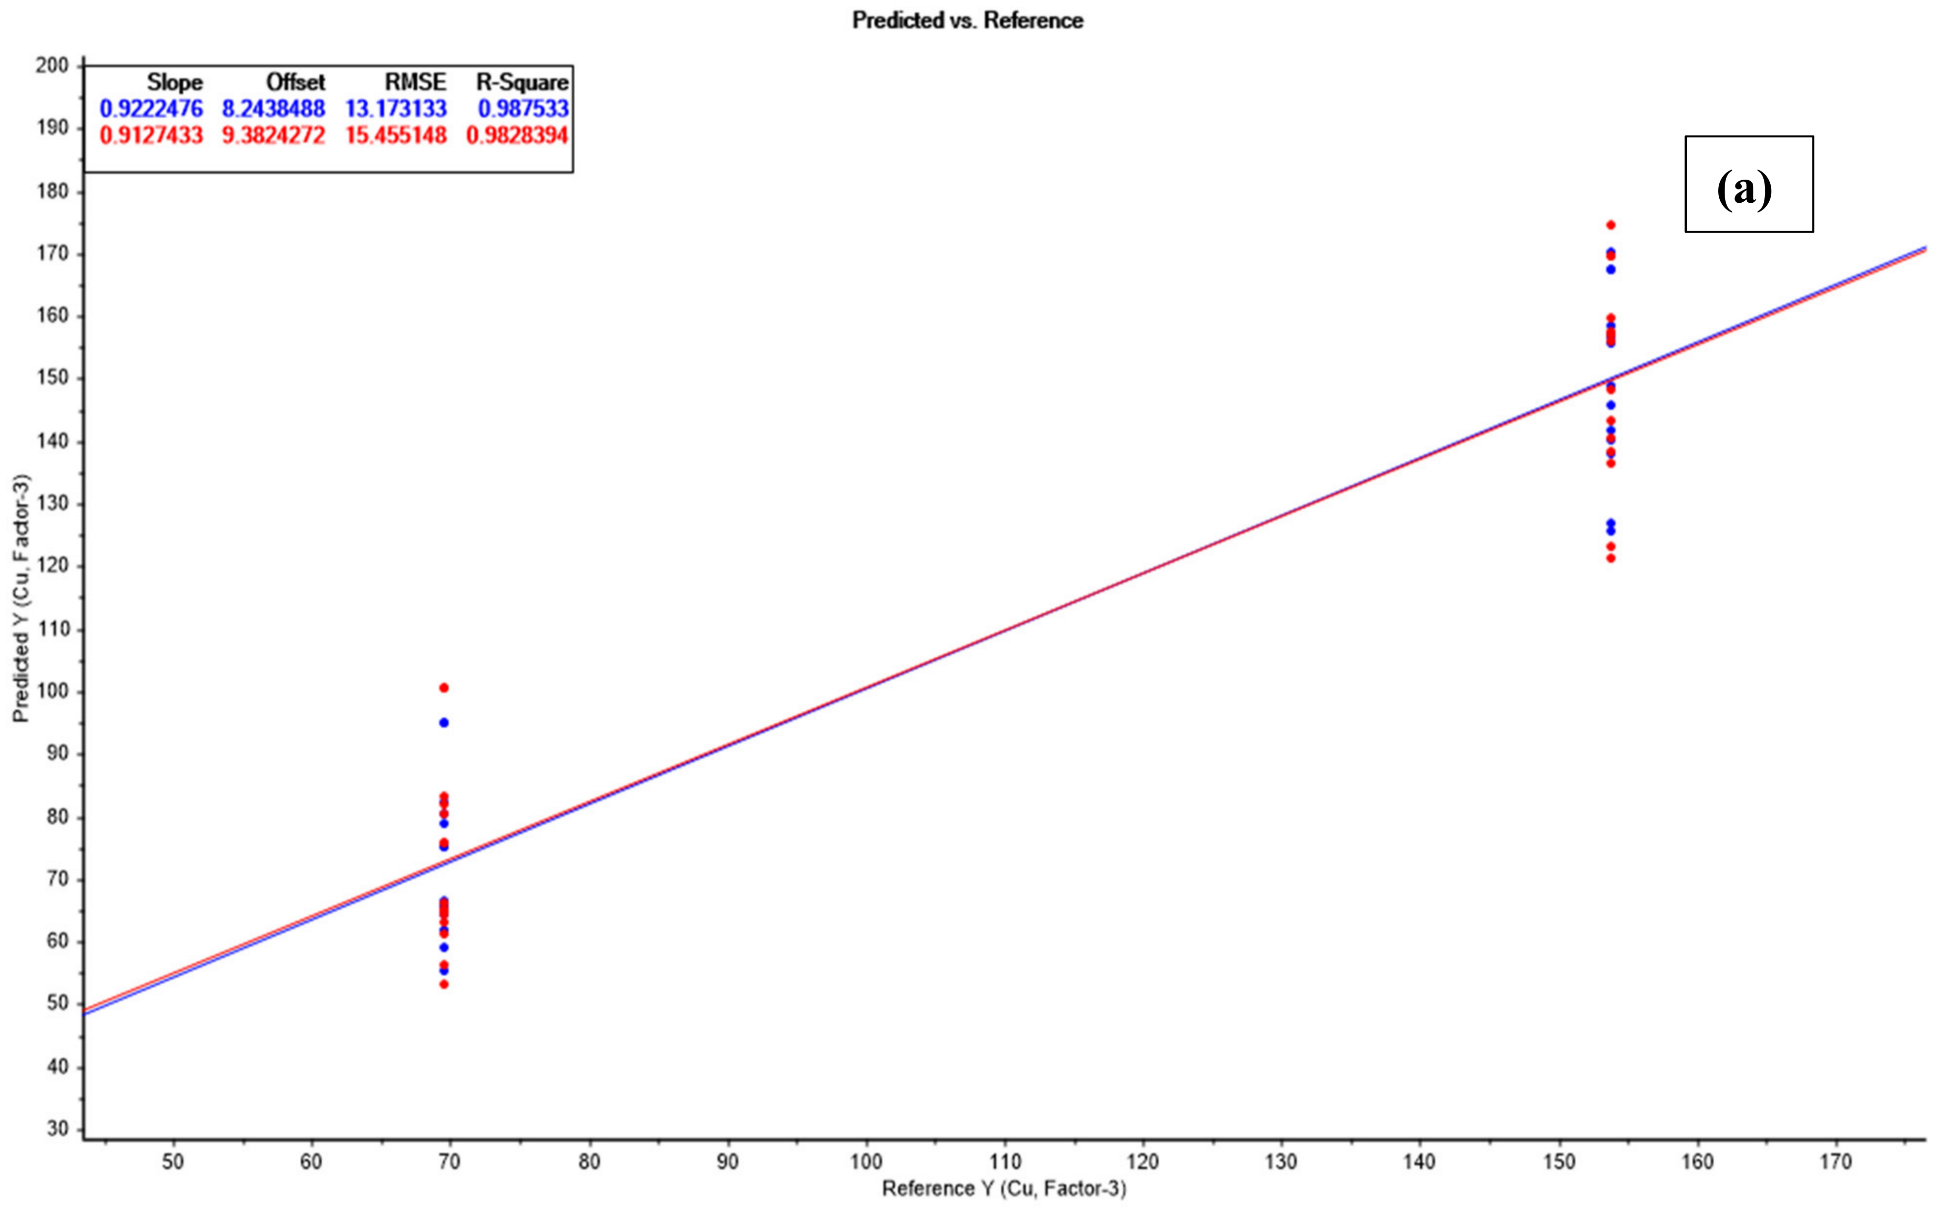
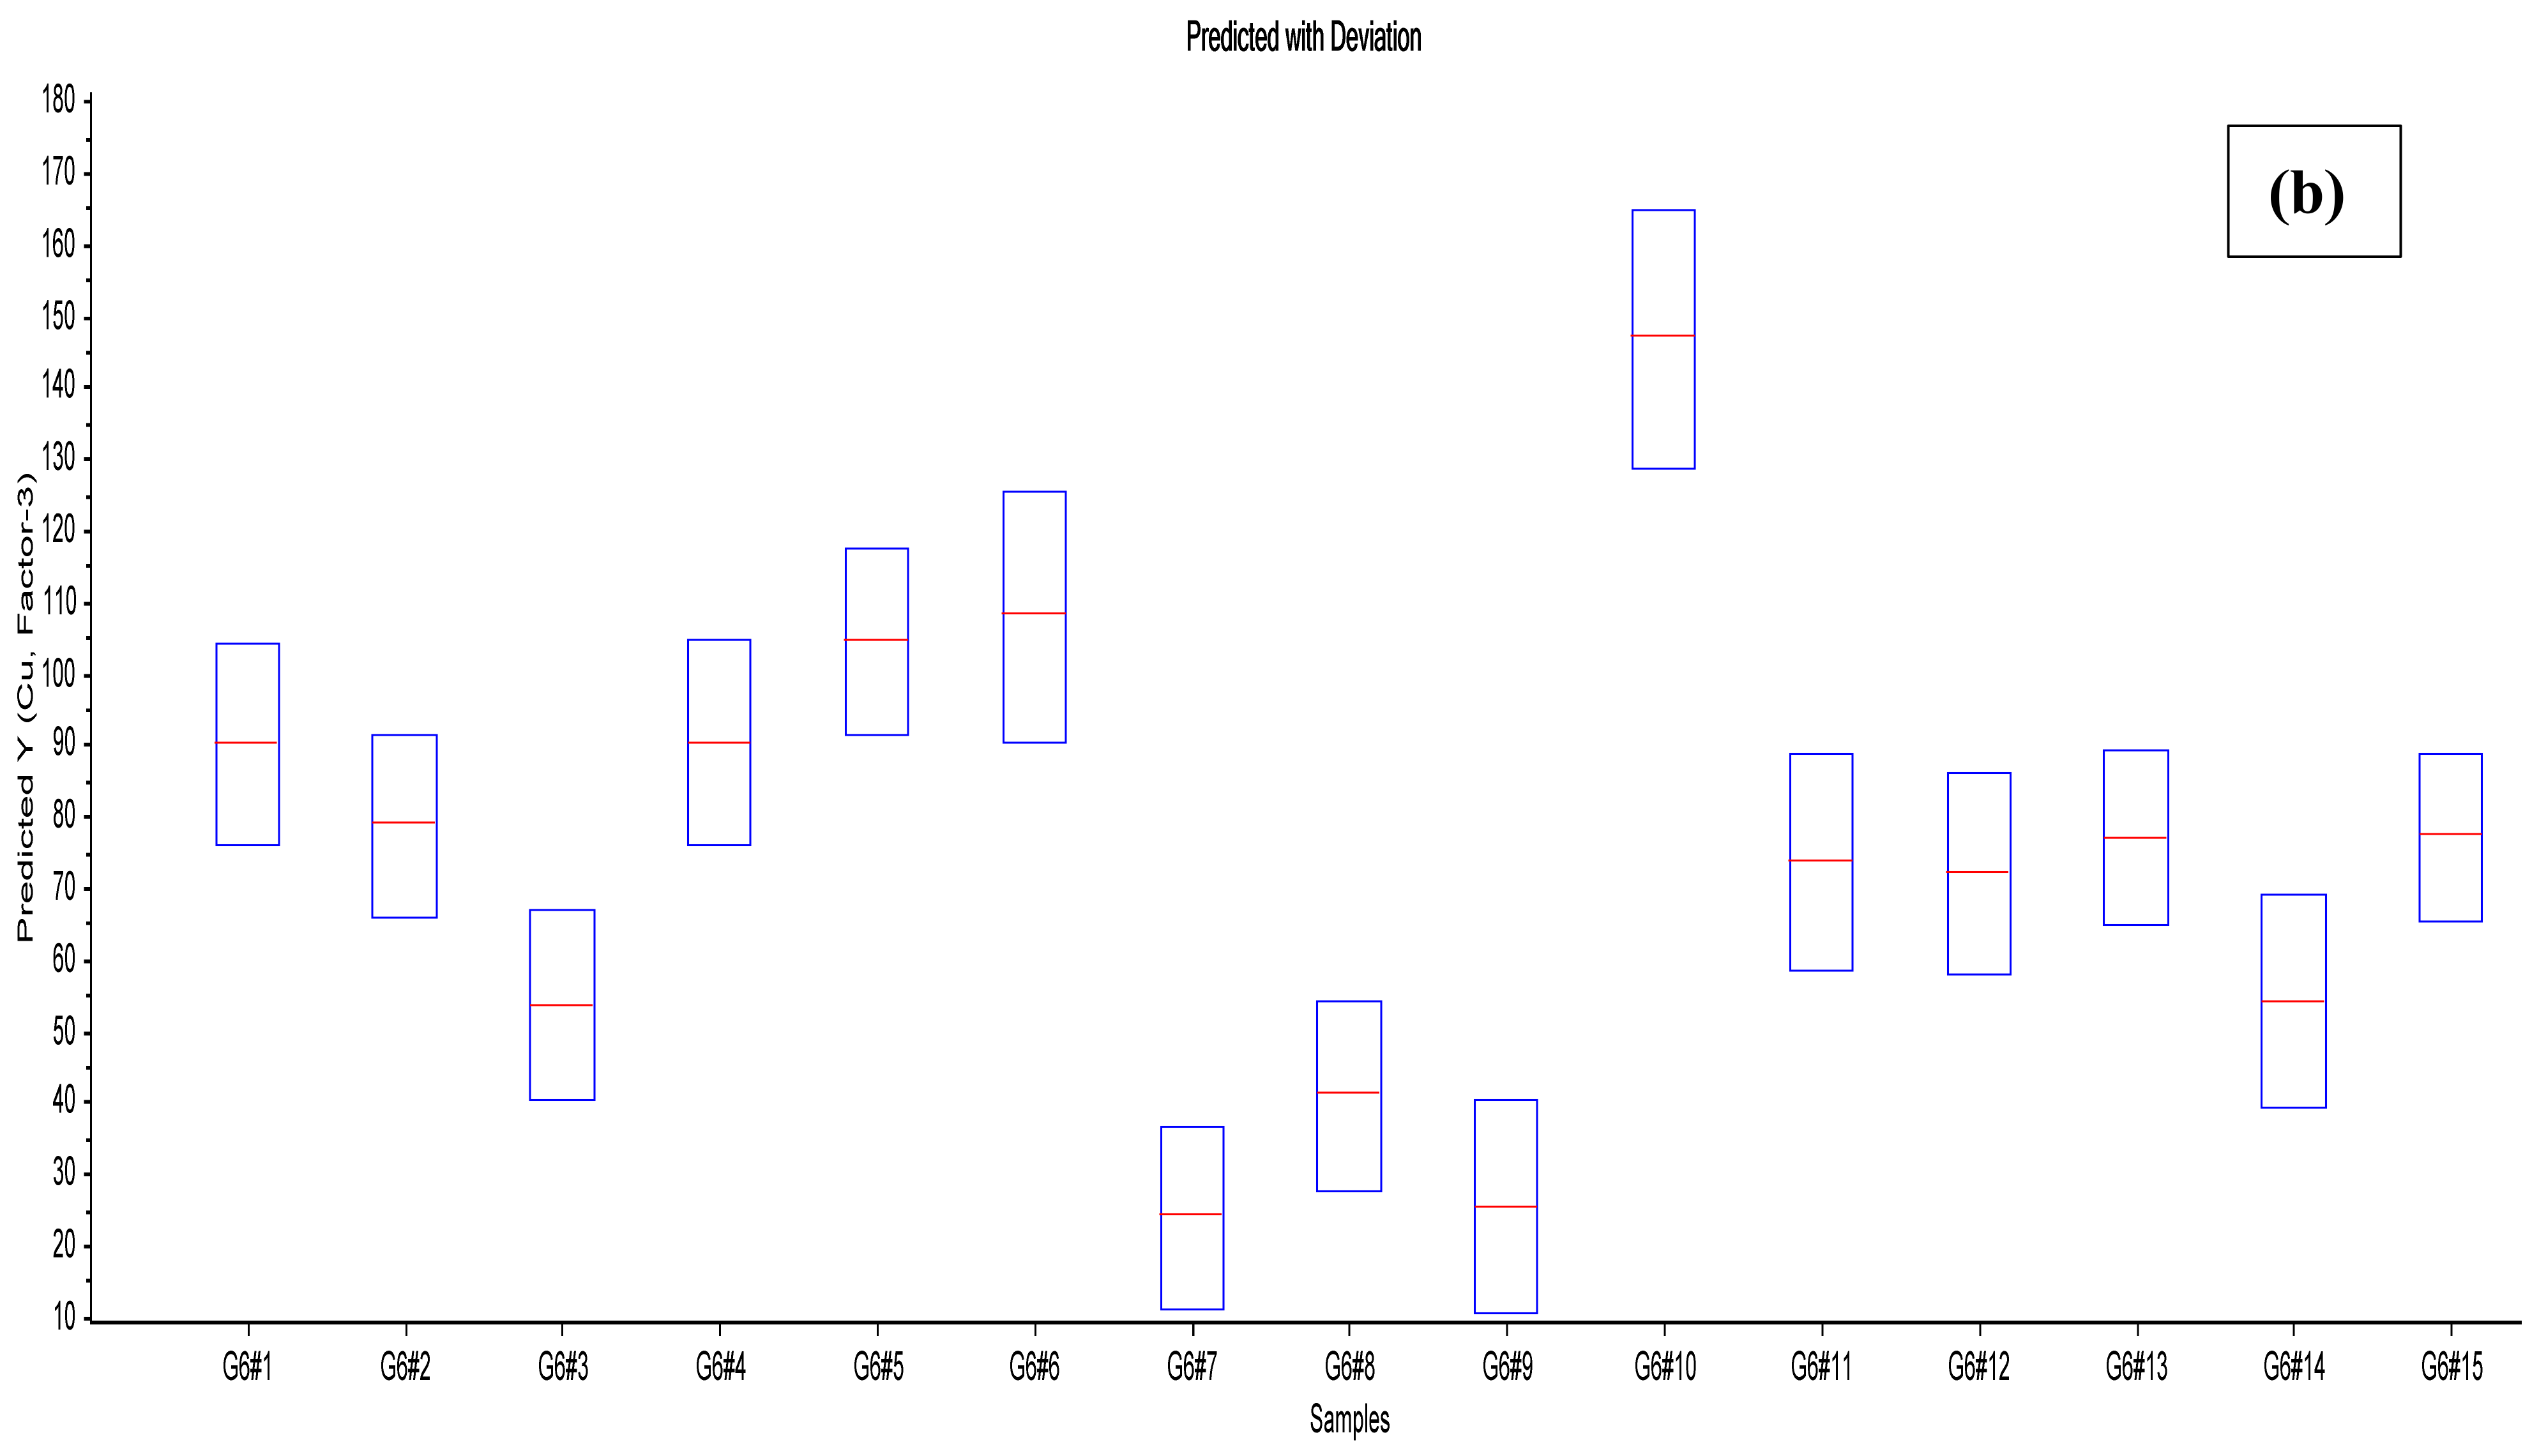
3.4. Partial Least Square Regression Method (PLSR)
4. Conclusions
Author Contributions
Funding
Institutional Review Board Statement
Informed Consent Statement
Data Availability Statement
Acknowledgments
Conflicts of Interest
References
- Central Pollution Control Board (CPCB); Ministry of Environment, Forest and Climate Change. Report CPCB: Status of Pollution Abatement Measure, Firecracker; Control of Urban Pollution Series; Central Pollution Control Board (CPCB): New Delhi, India, 2020.
- Awasthi, S.; Kumar, R.; Rai, A.K. In situ Analysis of Fireworks Using Laser-Induced Breakdown Spectroscopy and Chemometrics. J. Appl. Spectrosc. 2017, 84, 811–815. [Google Scholar] [CrossRef]
- Russel, M.S. The Chemistry of Fireworks; The Royal Society of Chemistry: Cambridge, UK, 2009. [Google Scholar]
- Uddin, M.K. A review on the adsorption of heavy metals by clay minerals, with special focus on the past decade. Chem. Eng. J. 2017, 308, 438–462. [Google Scholar] [CrossRef]
- National Environmental Engineering Research Institute (CSIR-NEERI). Definition of Green Crackers. 2022. Available online: https://www.neeri.res.in/contents/banner_details/green-crackers/5d81cbedbc313#googtrans(en|en) (accessed on 6 June 2022).
- Rehan, I.; Gondal, M.; Rehan, K.; Sultana, S. Spectral diagnosis of health hazardous toxins in face foundation powders using laser induced breakdown spectroscopy and inductively coupled plasma-optical emission spectroscopy (ICP-OES). Talanta 2020, 217, 121007. [Google Scholar] [CrossRef] [PubMed]
- Agarwal, R.; Kumar, R.; Rai, S.; Pathak, A.K.; Rai, G.K. LIBS: A Quality Control Tool for Food Supplements. Food Biophys. 2011, 6, 527–533. [Google Scholar] [CrossRef]
- Sallé, B.; Lacour, J.L.; Mauchien, P.; Fichet, P.; Maurice, S.; Manhès, G. Comparative study of different methodologies for quantitative rock analysis by Laser-Induced Breakdown Spectroscopy in a simulated Martian atmosphere. Spectrochim. Acta Part B 2006, 61, 301–313. [Google Scholar] [CrossRef]
- Harris, R.D.; Cremers, D.A.; Ebinger, M.H.; Bluhm, B.K.E. Determination of Nitrogen in Sand Using Laser-Induced Breakdown Spectroscopy. J. Appl. Spectrosc. 2004, 58, 770–775. [Google Scholar] [CrossRef] [PubMed]
- St-Onge, L.; Kwong, E.; Sabsabi, M.; Vadas, E.B. Quantitative analysis of pharmaceutical products by laser-induced breakdown spectroscopy. Spectrochim. Acta Part B 2002, 57, 1131–1140. [Google Scholar] [CrossRef]
- Bai, X.; Motto-Ros, V.; Lei, W.; Zheng, L.; Yu, J. Experimental determination of the temperature range of AlO molecular emission in laser-induced aluminum plasma in air. Spectrochim. Acta Part B 2014, 99, 193–200. [Google Scholar] [CrossRef]
- Tang, Z.; Zhou, R.; Hao, Z.; Zhang, W.; Li, Q.; Zeng, Q.; Li, X.; Zeng, X.; Lu, Y. Determination of fluorine in copper ore using laser-induced breakdown spectroscopy assisted with SrF molecular emission band. J. Anal. At. Spectrom. 2020, 35, 754–761. [Google Scholar] [CrossRef]
- Bol′shakov, A.A.; Mao, X.; Jain, J.; McIntyre, D.L.; Russo, R.E. Laser ablation molecular isotopic spectrometry of carbon isotopes. Spectrochim. Acta Part B 2015, 113, 106–112. [Google Scholar] [CrossRef]
- Dubey, D.; Kumar, R.; Dwivedi, A.; Agarwal, R.; Rai, A.K. Evaluation of the suitable analytical techniques for the investigation of the toxic elements and compounds in the Pyrotechnic materials (Green crackers). arXiv 2022, arXiv:2208.09655. [Google Scholar] [CrossRef]
- Maurya, G.S.; Jyotsana, A.; Kumar, R.; Kumar, A.; Rai, A.K. Analysis of deposited impurity material on the surface of the optical window of the Tokamak using LIBS. Phys. Scr. 2014, 89, 075601. [Google Scholar] [CrossRef]
- Vera-Londoño, L.P.; Pérez-Taborda, J.A.; Riascos-Landázuri, H. Spectroscopic analysis of coal plasma emission produced by Laser ablation. SciELo 2016, 78, 120–6230. [Google Scholar] [CrossRef] [Green Version]
- Awasthi, S.; Kumar, R.; Rai, G.K.; Rai, A.K. Study of archaeological coins of different dynasties using LIBS coupled with multivariate analysis. Opt. Laser Eng. 2016, 79, 29–38. [Google Scholar] [CrossRef]
- Mansur, H.; Sadahira, C.M.; Souza, A.N.; Mansur, A. FTIR spectroscopy characterization of poly (vinyl alcohol) hydrogel with different hydrolysis degree and chemically crosslinked with glutaraldehyde. Mater. Sci. Eng. C 2008, 28, 539–548. [Google Scholar] [CrossRef]
- Gaydon, A.G. Handbook of the Identification of Molecular Spectra; Printed in Great Britain by the whitefriars Press Ltd., Bound by G. & J. Kitcat Ltd., flexiback binding patent No. 441294; Hassell Street Press: London, UK, 1964. [Google Scholar]
- Dietz, T.; Kohns, P.; Ankerhold, G. Diagnostics and simulations of molecular formation in laser-induced plasmas. Spectrochim. Acta Part B 2018, 148, 51–59. [Google Scholar] [CrossRef]
- Gaft, M.; Nagli, L.; Gornushkin, I.; Raichlin, Y. Review on recent advances in analytical applications of molecular emission and modelling. Spectrochim. Acta Part B 2020, 173, 105989. [Google Scholar] [CrossRef]
- Wang, Q.; Chen, A.; Xu, W.; Zhang, D.; Wang, Y.; Li, S.; Jiang, Y.; Jin, M. Effect of lens focusing distance on AlO molecular emission from femtosecond laser-induced aluminum plasma in air. Opt. Laser Technol. 2020, 122, 105862. [Google Scholar] [CrossRef]
- Nagababu, P.; Kularkar, A.; Ahmed, S.A.M.; Bhanarkar, A.D.; Krupadam, R.J.; Kumar, R.; Rayalu, S. Reduced emission firecrackers: Barium-free pyrotechnic formulations. Fuel 2022, 317, 123500. [Google Scholar] [CrossRef]
- Martín-Alberca, C.; García-Ruiz, C. Analytical techniques for the analysis of consumer fireworks. TrAC Trends Anal. Chem. 2014, 56, 27–36. [Google Scholar] [CrossRef]


| Name | Type | Amount (g) |
|---|---|---|
| S1 | Sparkler | 0.600 |
| S2 | Flower Pot | 0.600 |
| S3 | Flower Pot | 0.600 |
| Wavelength λ (nm) | Intensity Observed | ln (λ4IV, V′) | G(v) (eV) |
|---|---|---|---|
| 484.4 | 1040.0 | −52.2 | 3.31 |
| 465.4 | 1598.4 | −51.4 | 3.02 |
| 518.1 | 1296.3 | −51.38 | 2.83 |
| Wavelength λ (nm) | Intensity Observed | ln (λ4IV, V′) | G(v) (eV) |
|---|---|---|---|
| 376.5 | 21,336.6 | −48.1 | 2.57 |
| 412.5 | 18,711.8 | −48.0 | 2.40 |
| 440.1 | 16,796.6 | −48.5 | 2.68 |
| Sample | AlO | Al (I) | CaO | Ca (I) |
|---|---|---|---|---|
| S1 | 0 | 15,409.3 | 1598.4 (0,1) | 5045.5 |
| S2 | 21,336.4 (0,0) | 113,468.8 | 0 | 1051.8 |
| S3 | 18,711.3 (0,0) | 92,950.8 | 0 | 1634.5 |
| Element | Predicted Value S1 | Deviated Value (%) | Predicted Value S2 | Deviated Value (%) | Predicted Value S3 | Deviated Value (%) |
|---|---|---|---|---|---|---|
| Al | 13,710.2 | 21.0 | 102,448.8 | 9.7 | 92,448.8 | 6.5 |
| Cu | 149.6 | 7.2 | 73.6 | 18.8 | 99.1 | 18.1 |
| Cr | 77.1 | 12.6 | 99.1 | 10.0 | 249.1 | 10.0 |
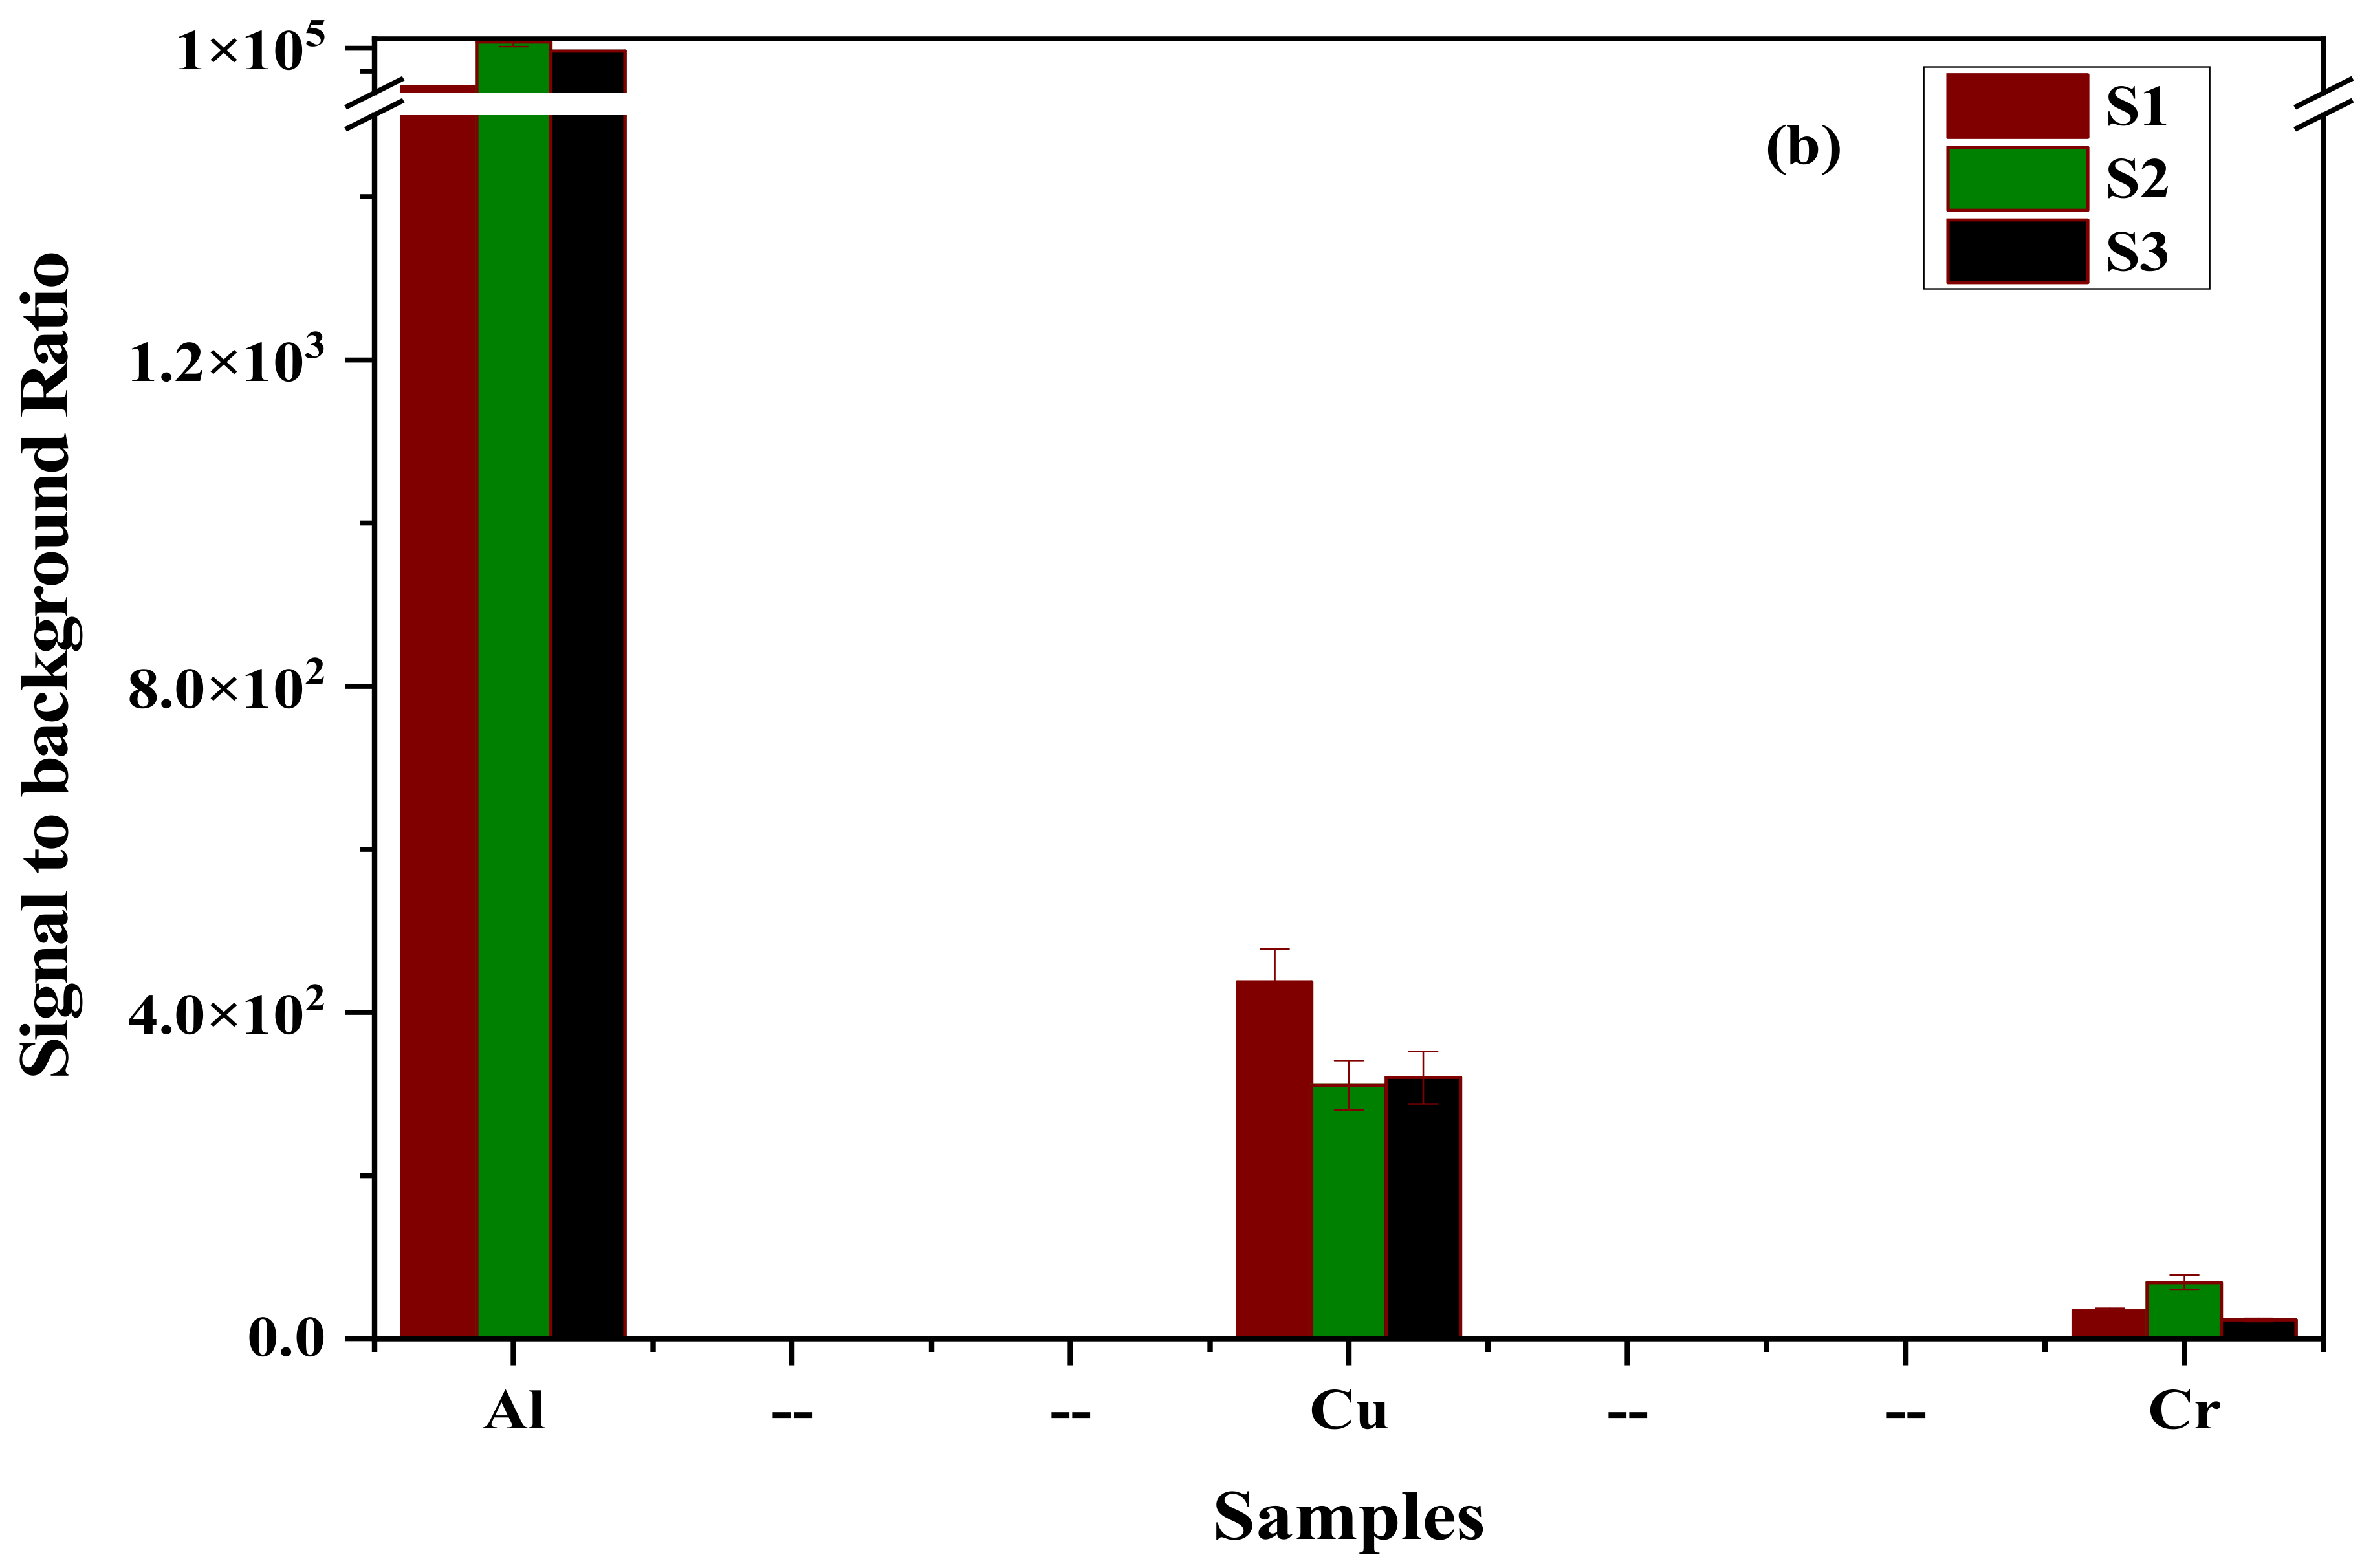
| Elements | S1 | S2 | S3 |
|---|---|---|---|
| Al | 12,377.7 | 118,161.0 | 94,369.8 |
| Cu Cr | 153.7 71.9 | 69.6 333.9 | 143.2 204.7 |
Disclaimer/Publisher’s Note: The statements, opinions and data contained in all publications are solely those of the individual author(s) and contributor(s) and not of MDPI and/or the editor(s). MDPI and/or the editor(s) disclaim responsibility for any injury to people or property resulting from any ideas, methods, instructions or products referred to in the content. |
© 2022 by the authors. Licensee MDPI, Basel, Switzerland. This article is an open access article distributed under the terms and conditions of the Creative Commons Attribution (CC BY) license (https://creativecommons.org/licenses/by/4.0/).
Share and Cite
Dubey, D.; Kumar, R.; Dwivedi, A.; Rai, A.K. Study of Electronic Bands of Diatomic Molecules for the Evaluation of Toxicity of Green Crackers Using LIBS Coupled with Chemometric Method. Electron. Mater. 2023, 4, 1-14. https://doi.org/10.3390/electronicmat4010001
Dubey D, Kumar R, Dwivedi A, Rai AK. Study of Electronic Bands of Diatomic Molecules for the Evaluation of Toxicity of Green Crackers Using LIBS Coupled with Chemometric Method. Electronic Materials. 2023; 4(1):1-14. https://doi.org/10.3390/electronicmat4010001
Chicago/Turabian StyleDubey, Darpan, Rohit Kumar, Abhishek Dwivedi, and Awadhesh Kumar Rai. 2023. "Study of Electronic Bands of Diatomic Molecules for the Evaluation of Toxicity of Green Crackers Using LIBS Coupled with Chemometric Method" Electronic Materials 4, no. 1: 1-14. https://doi.org/10.3390/electronicmat4010001