
Damage Evolution Prediction during 2D Scale-Model Tests of a Rubble-Mound Breakwater: A Case Study of Ericeira’s Breakwater

1
LNEC—Hydraulics and Environment Department. Laboratório Nacional de Engenharia Civil, 1700-066 Lisboa, Portugal
2
ISEL—Instituto Superior de Engenharia de Lisboa, Instituto Politécnico de Lisboa, 1959-007 Lisboa, Portugal
3
CENTEC—Centre for Marine Technology and Ocean Engineering, Instituto Superior Técnico, 1040-001 Lisboa, Portugal
*
Author to whom correspondence should be addressed.
Modelling 2023, 4(1), 1-18; https://doi.org/10.3390/modelling4010001
Submission received: 11 November 2022
/
Revised: 12 December 2022
/
Accepted: 14 December 2022
/
Published: 20 December 2022
(This article belongs to the Special Issue Ocean and Coastal Modelling)
Abstract
:Melby presents a formula to predict damage evolution in rubble-mound breakwaters whose armour layer is made of rock, based on the erosion measured in scale-model tests and the characteristics of the incident sea waves in such tests. However, this formula is only valid for armour layers made of rock and for the range of tested sea states. The present work aims to show how the Melby methodology can be used to establish a similar formula for the armour layer damage evolution in a rubble-mound breakwater where tetrapods are employed. For that, a long-duration test series is conducted with a 1:50 scale model of the quay section of the Ericeira Harbour breakwater. The eroded volume of the armour layer was measured using a Kinect position sensor. The damage parameter values measured in the experiments are lower than those predicted by the formulation for rock armour layers. New and coefficients for the Melby formula for the tested armour layer were established based on the minimum root mean square error between the measured and the predicted damage. This work shows also that it is possible to assess the damage evolution in scale-model tests with rubble-mound breakwaters by computing the eroded volume and subsequently, the dimensionless damage parameter based on the equivalent removed armour units.
1. Introduction
Rubble mound breakwaters are usually built at locations where the construction of vertical structures to create a harbour would imply using too large and expensive caissons. In addition, they have the advantage, compared to vertical structures, of maintaining good performance even after the removal of some elements from the armour layer during storms.
To help in the decision-making process concerning the maintenance of a given rubble-mound breakwater, a common procedure is to periodically inspect such a structure and assess the armour layer condition, as referred in Santos et al. [1]. Such inspections usually take place after the end of the storm season. This information combined with knowledge on the wave climate at the breakwater location would help in establishing the need for maintenance work before the next inspection.
This characterisation of the condition of the armour layer was mainly qualitative and the same happened for the prediction of the armour layer evolution until the next inspection. The instruments currently available and the models for armour layer response to the incident sea waves make it possible to have a more quantitative characterisation of these aspects.
To measure the armour layer damage, several techniques have been developed for surveying the outer envelope of the armour layer of rubble-mound breakwaters in scale-model tests. A review of these techniques can be found in Campos et al. [2], namely the work of Vidal et al. [3], based on the H50 formulae and the work of Castillo et al. [4], who modelled damage as a random variable.
Melby’s initial experiments [5] used a mechanical profiler with eight arms to simultaneously survey eight slope profiles. Nowadays, surface elevation of rubble-mound breakwaters scale models can be obtained with millimetre resolution and sub-millimetre accuracy. The most-used high-resolution techniques are based on terrestrial laser scanning [6,7,8]. Ferreira et al. [9] and Lemos et al. [10] used a procedure for reconstructing submerged scenes from stereo photos where the refraction at the air-water interface is corrected, allowing the surveys of the armour layer surface without the need to empty the flume or tank where the tests take place. However, the main drawback of this methodology is its dependence on very demanding lighting conditions and the complete transparency of the water. A more sophisticated approach, but one requiring dry visualisation of the slope, is presented in Vieira et al. [11] where, using artificial intelligence procedures, it is possible to identify, two-dimensionally, the variations in the position of each element of an armour layer consisting of a single layer of cubes.
Soares et al. [12] tested the use of the Kinect to detect displacements of cubes and tetrapods in two different scale models, based on data acquired by a Kinect V2. Musumeci et al. [13] conducted investigations on surveys of the submerged part of a breakwater model using a Kinect sensor, during 2D scale-model tests of accropode armour units.
Sande et al. [14] conducted a set of tests to optimise the best distance of the Kinect sensor to the surveyed scene. This investigation comprised scans of a 2D scale model of a breakwater with an armour layer made of antifer cubes. The distances from the sensor to the model, which ranged from 1 m to 5 m, enabled the conclusion that the best combination of practical distance and point density was obtained at 1.5 m with 6.2 points/cm2 resolution.
In Lemos et al. [15], a Kinect sensor is used to survey the roundhead of a rubble-mound breakwater whose armour layer is composed of antifer cubes. The armour layer damage estimated from the eroded volume in the most damaged areas agreed well with the number of displaced armour units in the same areas.
The prediction of the armour layer damage evolution with the wave conditions that can hit the breakwater during the period between two inspections can be carried out with the formulae used for the hydraulic design of the armour units. Although such a design has a character of safety verification to an ultimate limit state and the prediction of the armour layer evolution can be considered a serviceability limit state verification, the difference between these verifications lies in the loads considered: in the first case, the verification is made for extreme sea-states, whereas in the second one, such verification is carried out for sea states that are common in the study area.
Based on an extensive set of scale-model tests, Van der Meer [16] proposes a formula for the hydraulic design of armour layer units when the armour layer is subjected to an incident storm characterised by a significant wave height, peak period and duration (number of waves in the storm). The formula also considers the slope angle, giving the characteristic length of the armour layer units for a chosen damage level (such a level is related to the eroded area of the armour layer cross-section). During those tests, Van der Meer used a surface profiler with nine gauges placed apart on a computer-controlled carriage.
Long-duration tests were used to establish the coefficients of the formula derived by Melby [5] to evaluate the damage evolution in the armour layers of rubble-mound breakwaters. This formula was based on the formula proposed by Van der Meer [17], probably the first damage progression model [18]. The damage parameter used in Melby’s formula was established from surveys with a mechanical profiler of the armour layer envelope. From the work of Melby [5], not only are the limitations of the damage evolution formulas clear, but so is the potential of long-duration tests for the adjustment of customised formulae for rubble-mound breakwaters, subjected to another range of characteristics of incident sea waves or whose armour layer is made of artificial units.
This work describes the application of Melby’s procedure [5] in the definition of the damage evolution for an armour layer composed of tetrapods, something that, to the authors’ best knowledge, has never been performed. Furthermore, in the characterisation of the armour layer damage, the results of surveys carried out with a position sensor are used, another of the novelties of this paper. After this introductory section, the Materials and Methods section describes not only the main steps of the methodology used by Melby [5] but also the experimental setup and measurement procedures used in the physical model tests carried out for a section of the Ericeira breakwater. The test results are presented and discussed in Section 3. In Section 4 are presented the conclusions of the work.
2. Materials and Methods
2.1. Formulae for Armour Layer Damage Evolution
Burcharth and Hughes [19] explain how writing the ratio between the destabilising forces that are due to the flow—where it can be considered that the drag and lift parts of the Morison [20] equation are dominant when compared to the inertia part—and the stabilising forces, which are mainly due to the weight of the armour units, one ends up with the so-called stability number, , a dimensionless parameter that is intended to be as low as possible so that the armour layer can be considered stable. The dependence of the stability number on other relevant physical quantities can be determined through laboratory experiments resulting in:
where is a characteristic wave height of the incident sea state, is the submerged density of the armour layer material and is the median nominal diameter of the armour layer units; to are the dimensionless parameters corresponding to the physical quantities considered in the tests and is an experimentally determined coefficient that reflects the influence of physical quantities not considered in the tests [21].
The most-known empirical stability model was proposed by Hudson [22] and it reflected the knowledge acquired in scale-model tests of rubble-mound breakwaters subjected to normal non-overtopping regular waves and using rock and tetrapods as armour elements:
where is the angle of the armour layer slope to the horizontal plan and is a tabulated constant for each armour unit type as a function of the percent damage range at the end of the test. Such damage is based on the volume of armour units displaced from the active zone of the breakwater. This zone extends from the middle of the breakwater crest down the seaward face to a depth equivalent to the wave height.
Van der Meer [16,17] developed a stability model for an armour layer made of rock elements that incorporated the wave period (by means of Iribarren’s number, ) and the number of waves (), as well as a measure of the core permeability ():
Both formulae include a dimensionless damage descriptor, , where is the eroded area of the profile and is the equivalent cube length.
Later, Van der Meer [23] developed a formulation for cubes, tetrapods and accropodes. Since the is not the most suitable damage descriptor for these armour elements, Van de Meer used in these formulae , the number of units displaced out of the armour layer within a strip width of one equivalent cube length, according to Hedar [24].
Starting from the formula of Van der Meer [16,17] and using results from a long-duration test series, Melby [5] proposed a model to predict the damage evolution for a rock armour layer that starts from an undisturbed or zero damage () at the initial instant () and is subjected to incident sea waves of constant characteristics ( and ):
where and are empirical parameters resulting from the adjustment of the expression to the results of the scale-model tests. To obtain a model capable of being applied to a sequence of sea states, that is, to variable sea-wave conditions, Melby [5] derived in order of time the previous equation and integrated the result in a finite time interval () during which and can be considered constant (or and if the sea state is characterised by its spectrum):
This formulation allows non-zero initial damage values, being the damage at the time , and where and are empirical coefficients derived from the tests. Based on the values measured in his experiments with a scale model of a rubble-mound breakwater whose armour layer was made of rock, Melby [5] proposed and .
Melby conducted three test series where the wave conditions considered were peak periods of and and significant wave heights, ranging between and . The longest test series, series A, aimed to confirm the stabilisation of damage of the armour layer when subjected to a sea state with constant characteristics. Thus, a given test condition, characterised by a significant wave height () and peak period is repeated until the number of armour units displaced from their original position does not change at the end of two consecutive tests. Then, the test series continues, using the next test condition, with increasing energy. Test series B and C have limited test durations. Test B was conducted with increasing water levels and peak periods and test C with decreasing water levels and peak periods.
It must be pointed out that the stabilisation of the armour layer damage in test series A seems contrary to the damage evolution established in the Melby formula, since it predicts a continuous damage increase with the storm duration. However, the rate of such an increase is not constant, and it decreases with time. This means that above a given duration, one should expect a damage variation that is smaller than the characteristic area of the armour elements, and so an apparent damage stabilisation is reached.
The tested breakwater profile had a 1:2 slope, the armour layer was made of rock units weighing and their nominal diameter was . Regarding damage evaluation, Melby [5] used a mechanical profiler with eight arms to survey individual profiles. The parameter for each test is the average of the damage parameters obtained in each of the eight profiles in that test. This approach introduces more errors the fewer the profiles that are analysed. Conversely, the use of several profiles that cover the entire slope would minimise the errors.
Comparing the Melby formula in Equation (5) with the Van der Meer formula in Equations (3) and (4), it is clear that the Iribarren coefficient is missing in the Melby formula. Hence, the slope of the armour layer is not considered in that formula and so new values of the and coefficients have to be fitted to the formula to describe the damage evolution in different armour layer slopes. In addition, when armour elements other than rock are employed, the coefficients obtained for a rock armour layer cannot be used.
In a first approach to adapt Melby’s ap and b coefficients to the damage evolution of armour layers that are not made of rock elements, the following procedure, based on the derivation of Equation (6) presented in Melby [5], was adopted. In the time interval between and , where sea-wave conditions can be assumed constant, one may write:
Dividing by and using logarithms to calculate the power one gets:
Coming back to Melby´s expression, can now be determined as:
For tests with similar wave conditions, the estimated values of the and coefficients should not vary much. Averaging the obtained values for all the test conditions can give a good first approach for the and coefficients for the tested structure.
2.2. Physical Model and Test Conditions
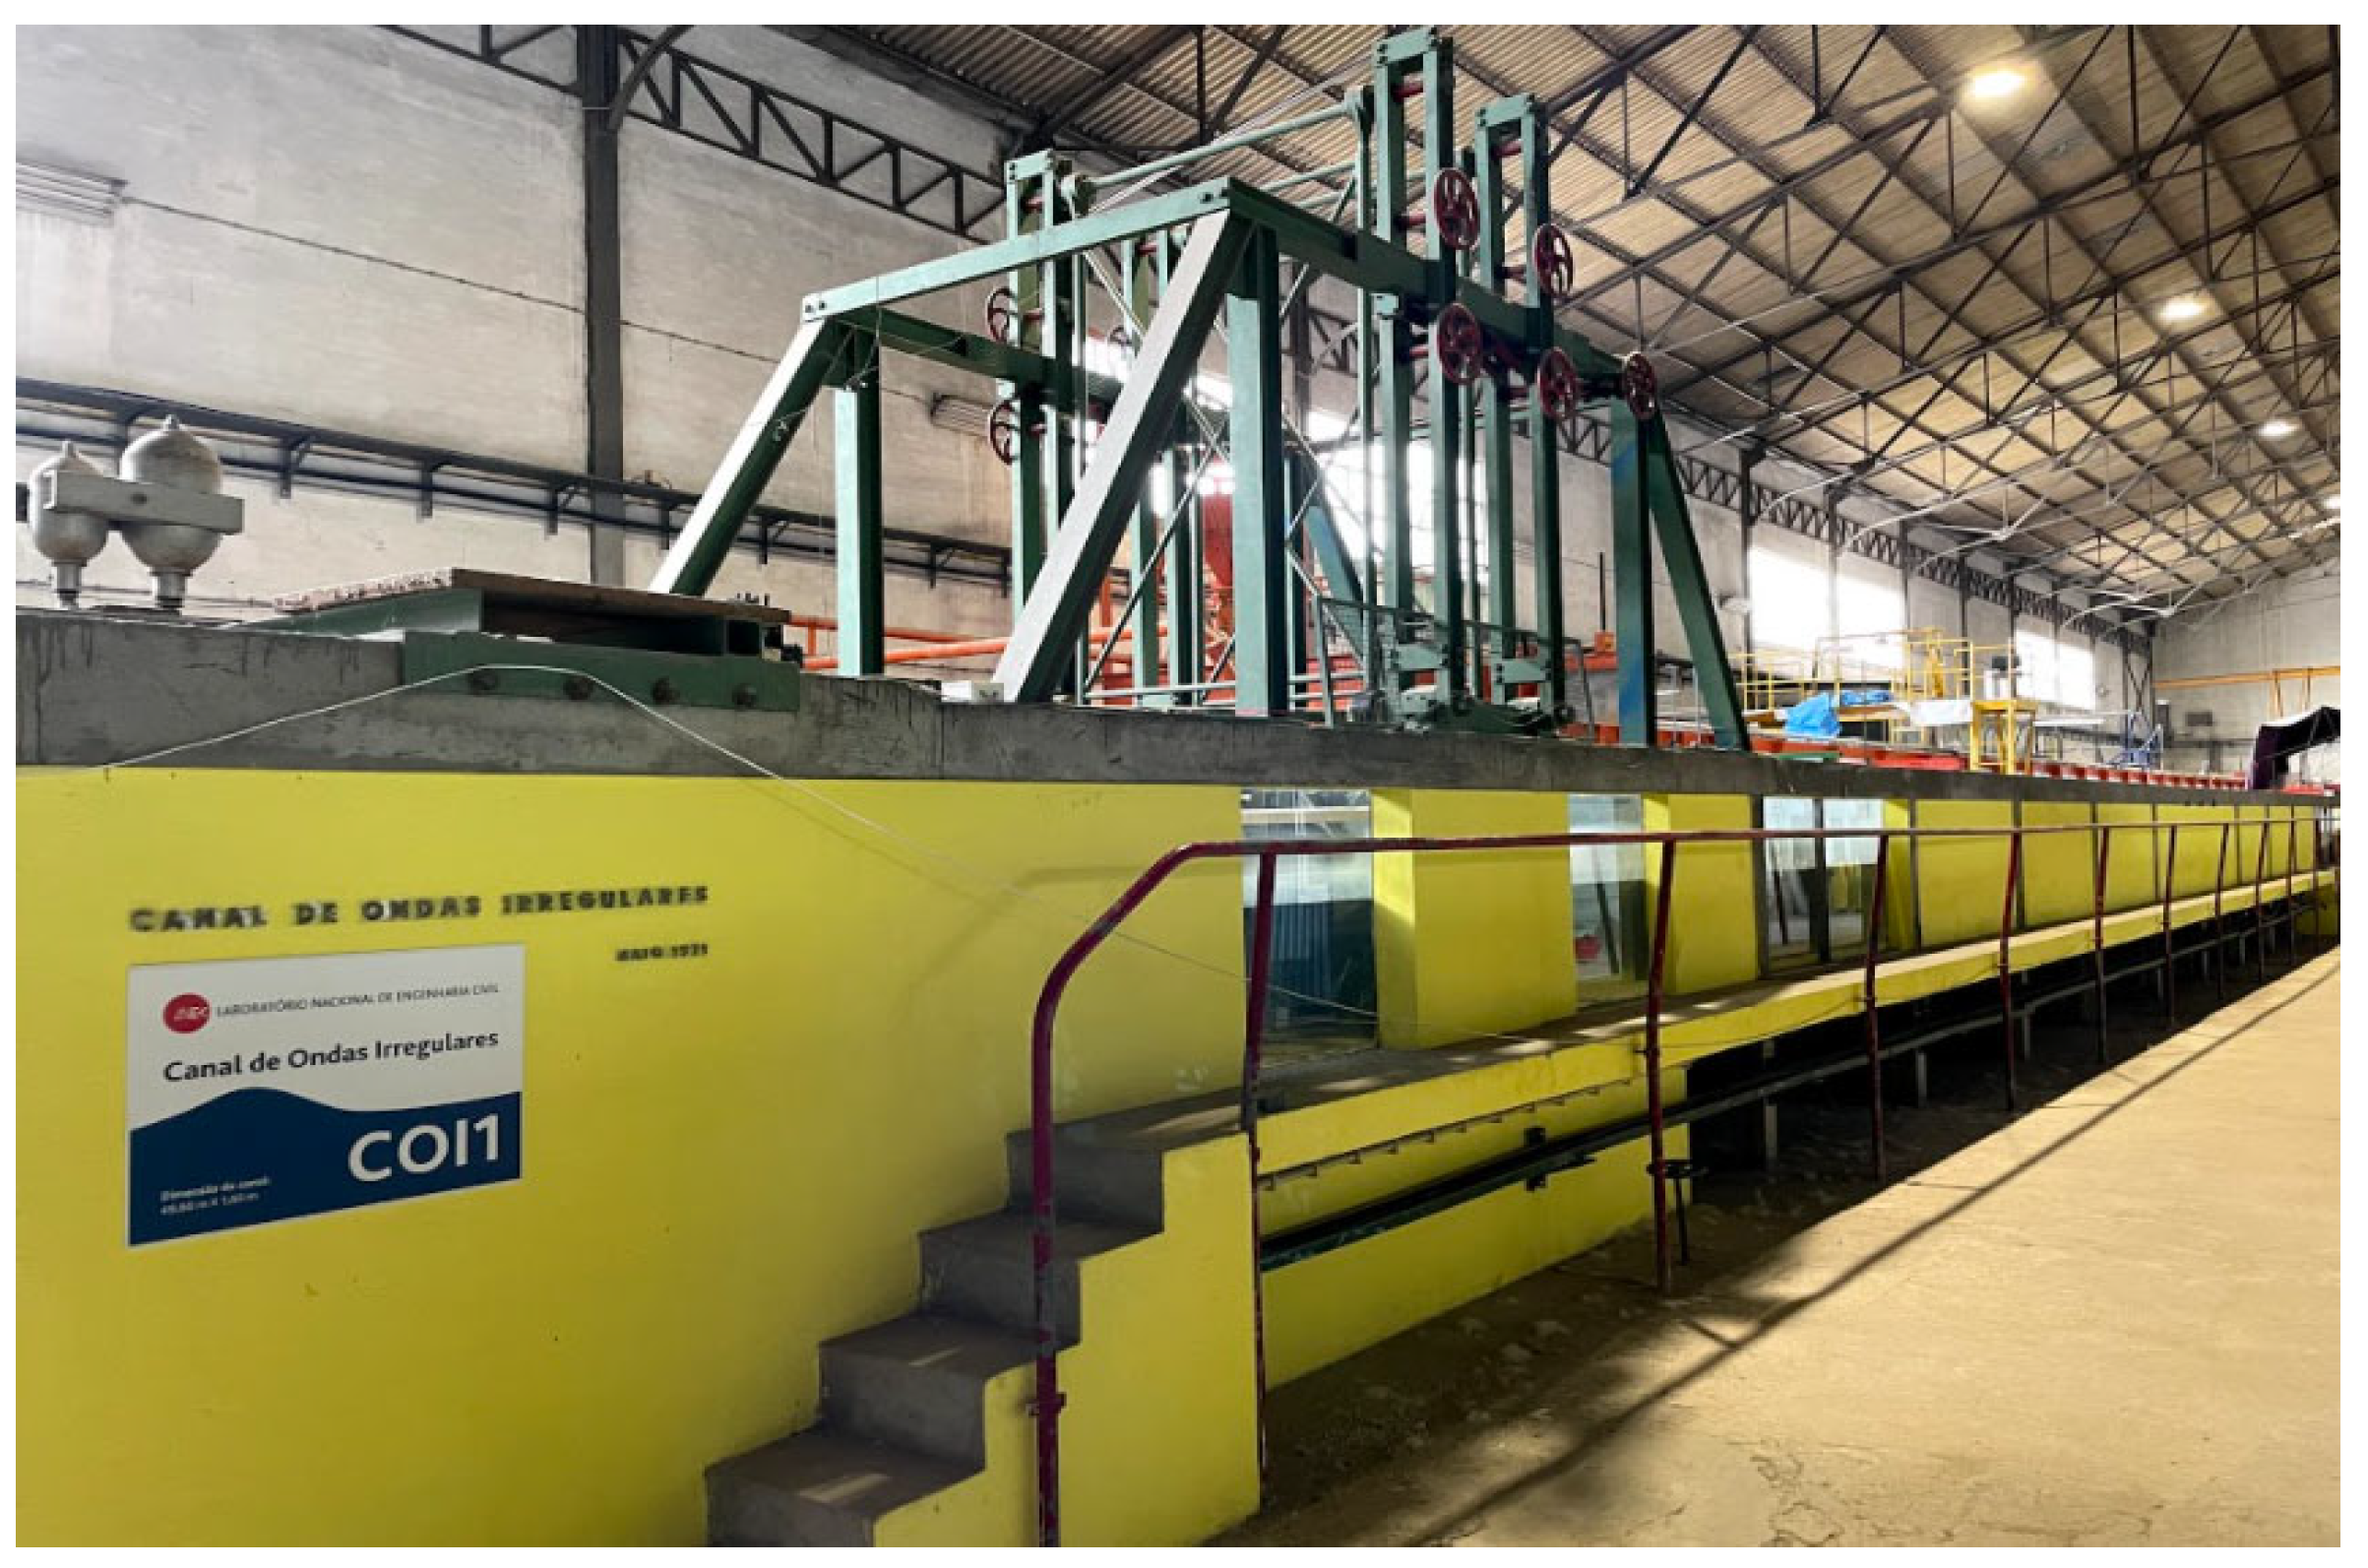
Since the objective of this work was to apply the Melby procedure [5] to the definition of a formula for the damage evolution in the tetrapod armour layer of a rubble-mound breakwater, a set of tests with a scale model was carried out at the COI1 wave flume of the Ports and Maritime Structures Unit (NPE) of the Hydraulics and Environment Department of the Portuguese Laboratory for Civil Engineering (LNEC). This is a wave flume that is approximately long, with an operating width and an operating water depth of . The flume is equipped with a piston-type wave-maker that combines both irregular wave generation and dynamic absorption of reflected waves identified with two wave gauges located in front of the paddle (Figure 1).
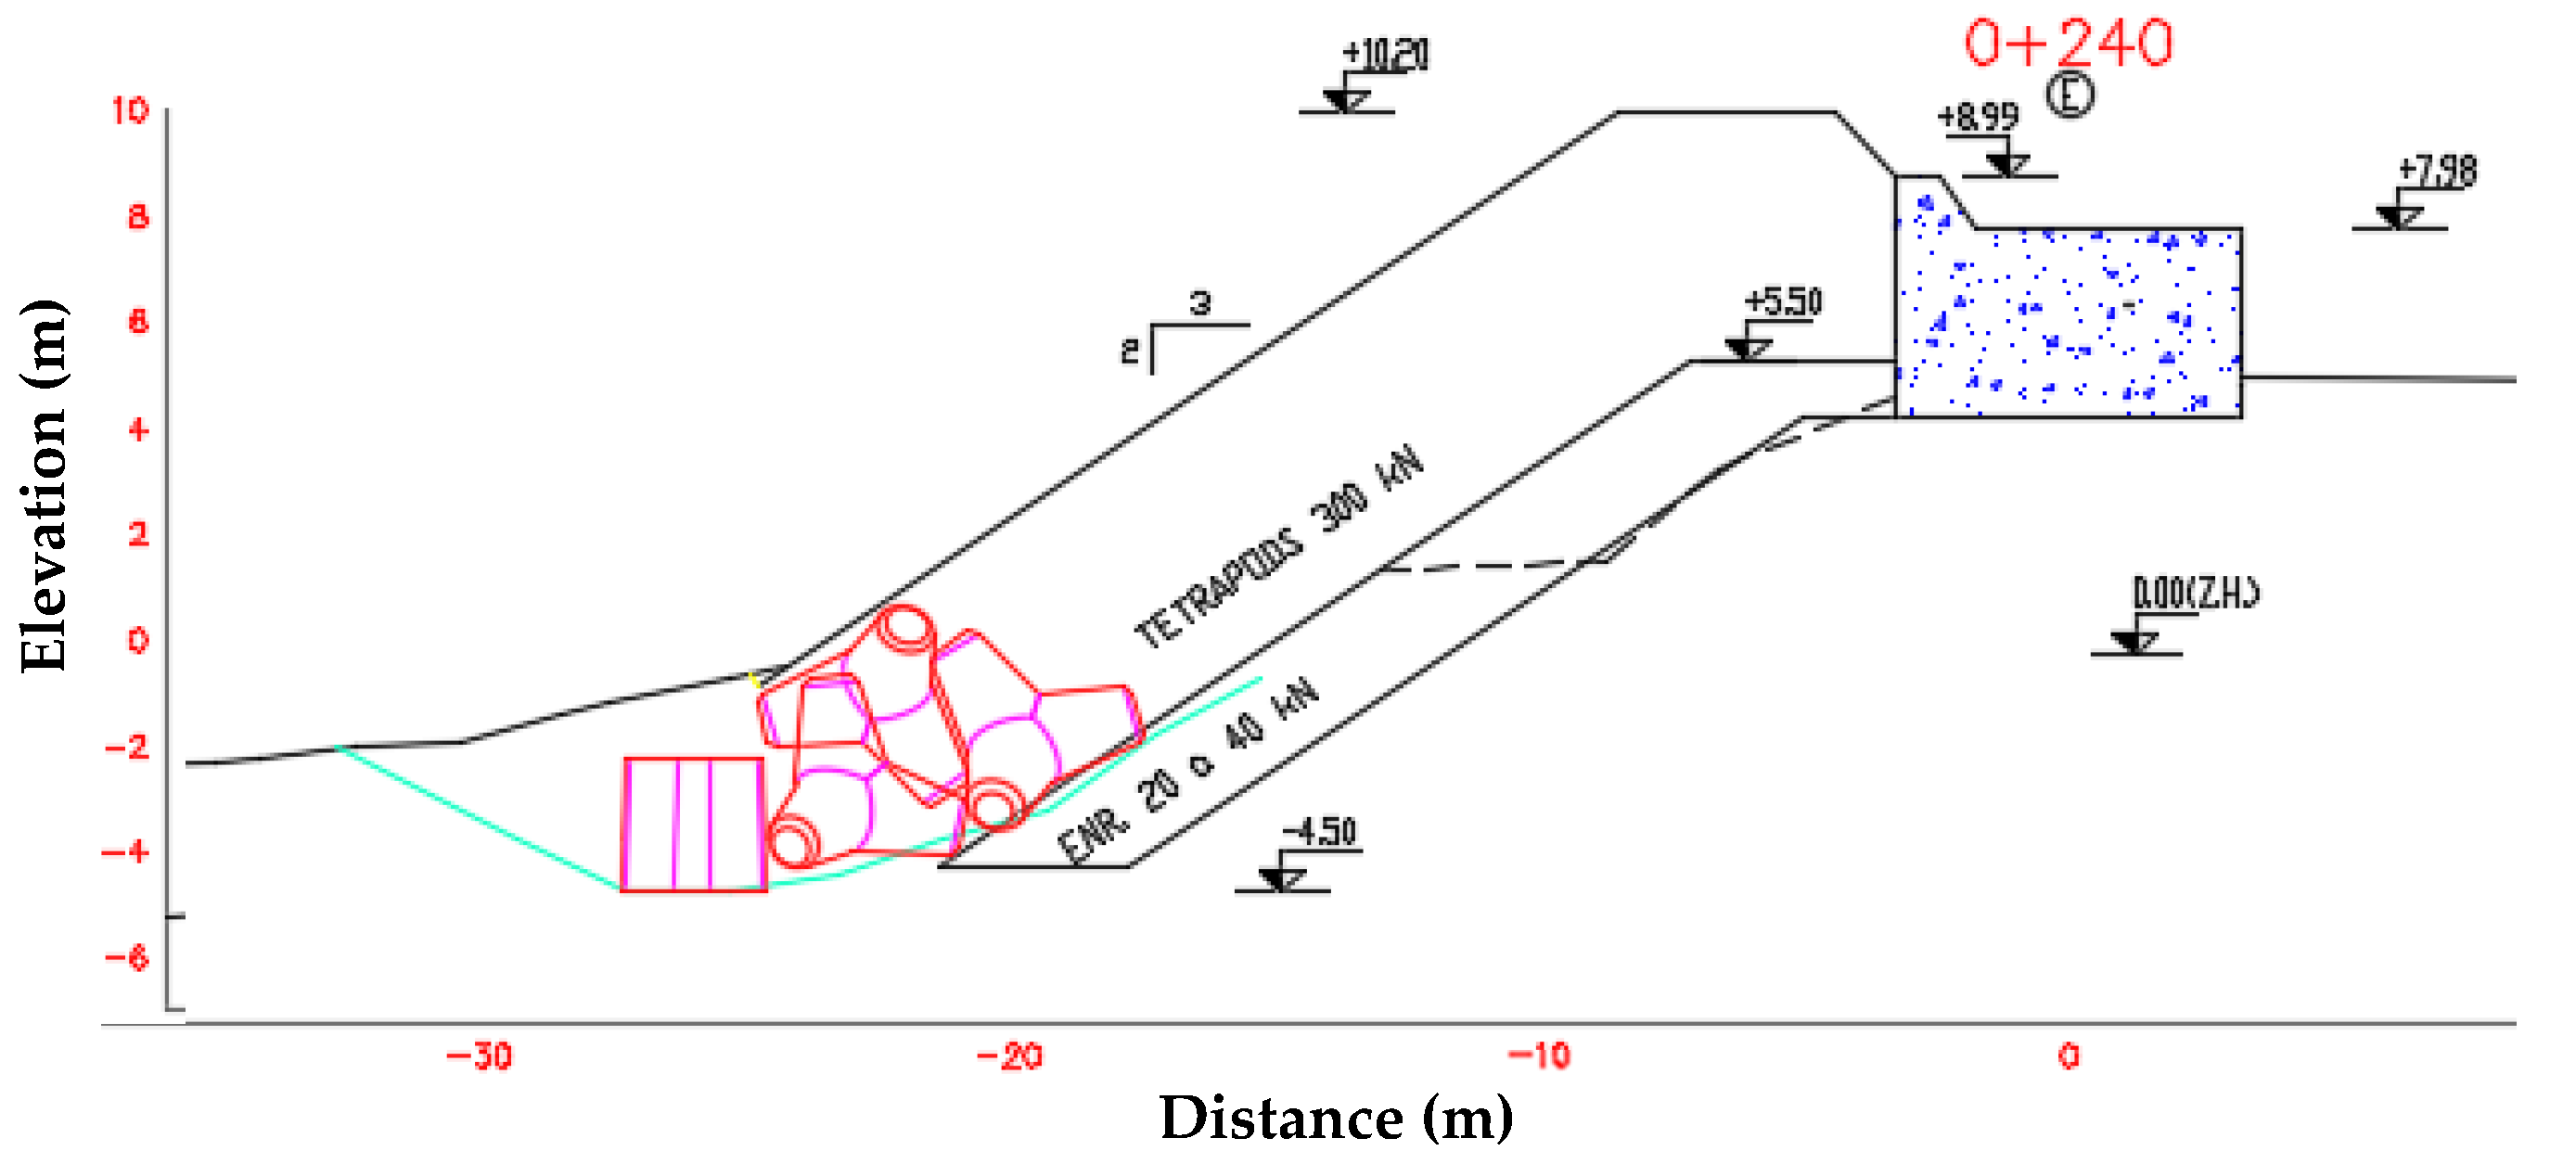
The model was built and operated according to Froude’s similarity law, with a geometrical scale of 1:50. The tested breakwater cross-section was inspired by Ericeira’s breakwater quay section. It has the same 2:3 slope and a two-layer rock filter covering the core, as illustrated in Figure 2. However, in the exploratory tests carried out before the beginning of the study, the absence of any damage in the armour layer for the wave conditions to be tested was observed. To obtain a less stable armour layer, it was decided to replace the two tetrapod layers with a tetrapod inner layer and an even lighter tetrapod outer layer. The nominal diameter () of the outer layer armour units was and the armour layer porosity was around .
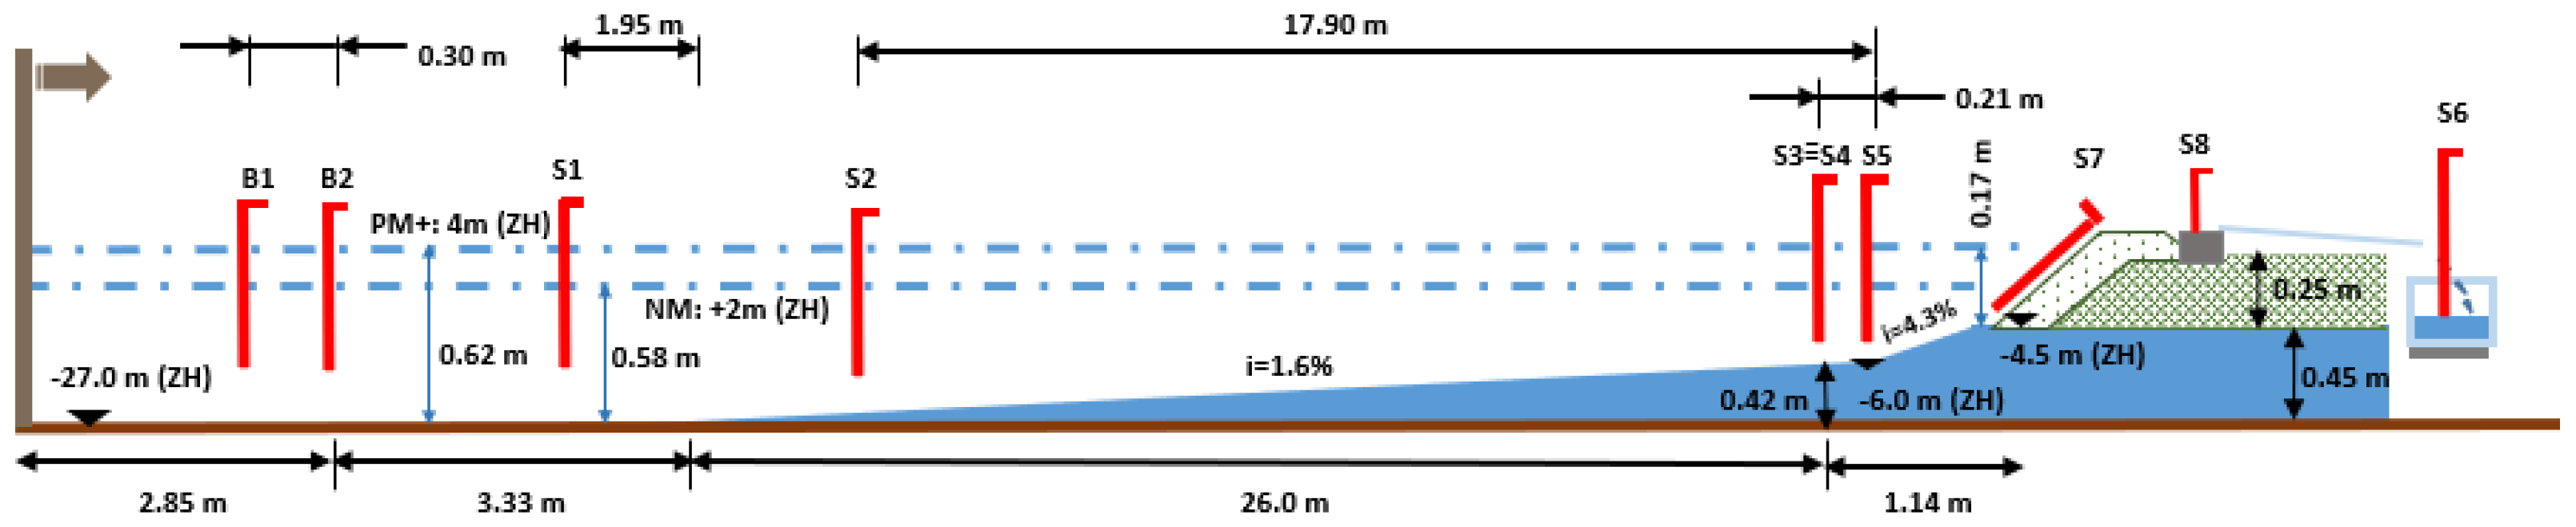
The bottom built at the wave flume is made of a long smooth slope (), followed by a slope that represented the bottom in front of the quay section of the breakwater. This slope ended on a flat surface above the flume bottom. On this surface the cross-section of the breakwater was built as shown in Figure 3.
The flume was equipped with 10 resistive-type wave gauges deployed along the wave flume, where wave gauges B1 and B2 measured the wave conditions near the wavemaker, while probes S1 to S5 characterised the wave propagation along the flume (Figure 3). All probes used in the tests were resistive, with a acquisition frequency for gauges B1 and B2, and for gauges S1 to S5. Gauges S3 and S4 defined the base of a triangle, perpendicular to the flume wall, whose third vertex was the S5 probe.
The wave conditions considered were the peak periods of ( at prototype) and () and significant wave heights of ( at prototype), () and (). Table 1 summarises the considered test conditions. Note that the sea wave characteristics used to describe the test conditions are those obtained at the vicinity of the wave generator, where a JONSWAP spectrum with a peak enhancement factor of 3.3 was imposed. Given the size of the armour layer elements and the range of significant wave heights tested, one may conclude that scale effects caused by the viscosity forces in the flow are negligible since the Reynolds number of the flow , where is the gravitational acceleration () and is the water kinematic viscosity ().
Two tide levels were considered: the mean level, which corresponds to a water depth of at the toe of the structure and a depth of at the deepest part of the wave flume, and the high-water level, with a depth of at the toe of the structure and a depth of at the deepest part of the wave flume. Table 1 describes the test sequence that tried to reproduce the longest test series of Melby [5], test series A. This test series aimed to confirm that the armour layer damage reached quasi-stabilisation when subjected to a sea state with constant characteristics. Thus, a given test condition, characterised by a significant wave height () and peak period, () with a duration of 1000 waves, is repeated until the number of the armour units displaced from their original positions does not change at the end of two consecutive tests. Then, the test series continues, using the next test condition, with increasing energy. The test sequences started with the mean water level and then changed to the high-water level.
The wave parameters measured at the toe of the structure refer to the total wave spectra, instead of the incident wave spectra used by Melby.
2.3. Armour Layer Surveys
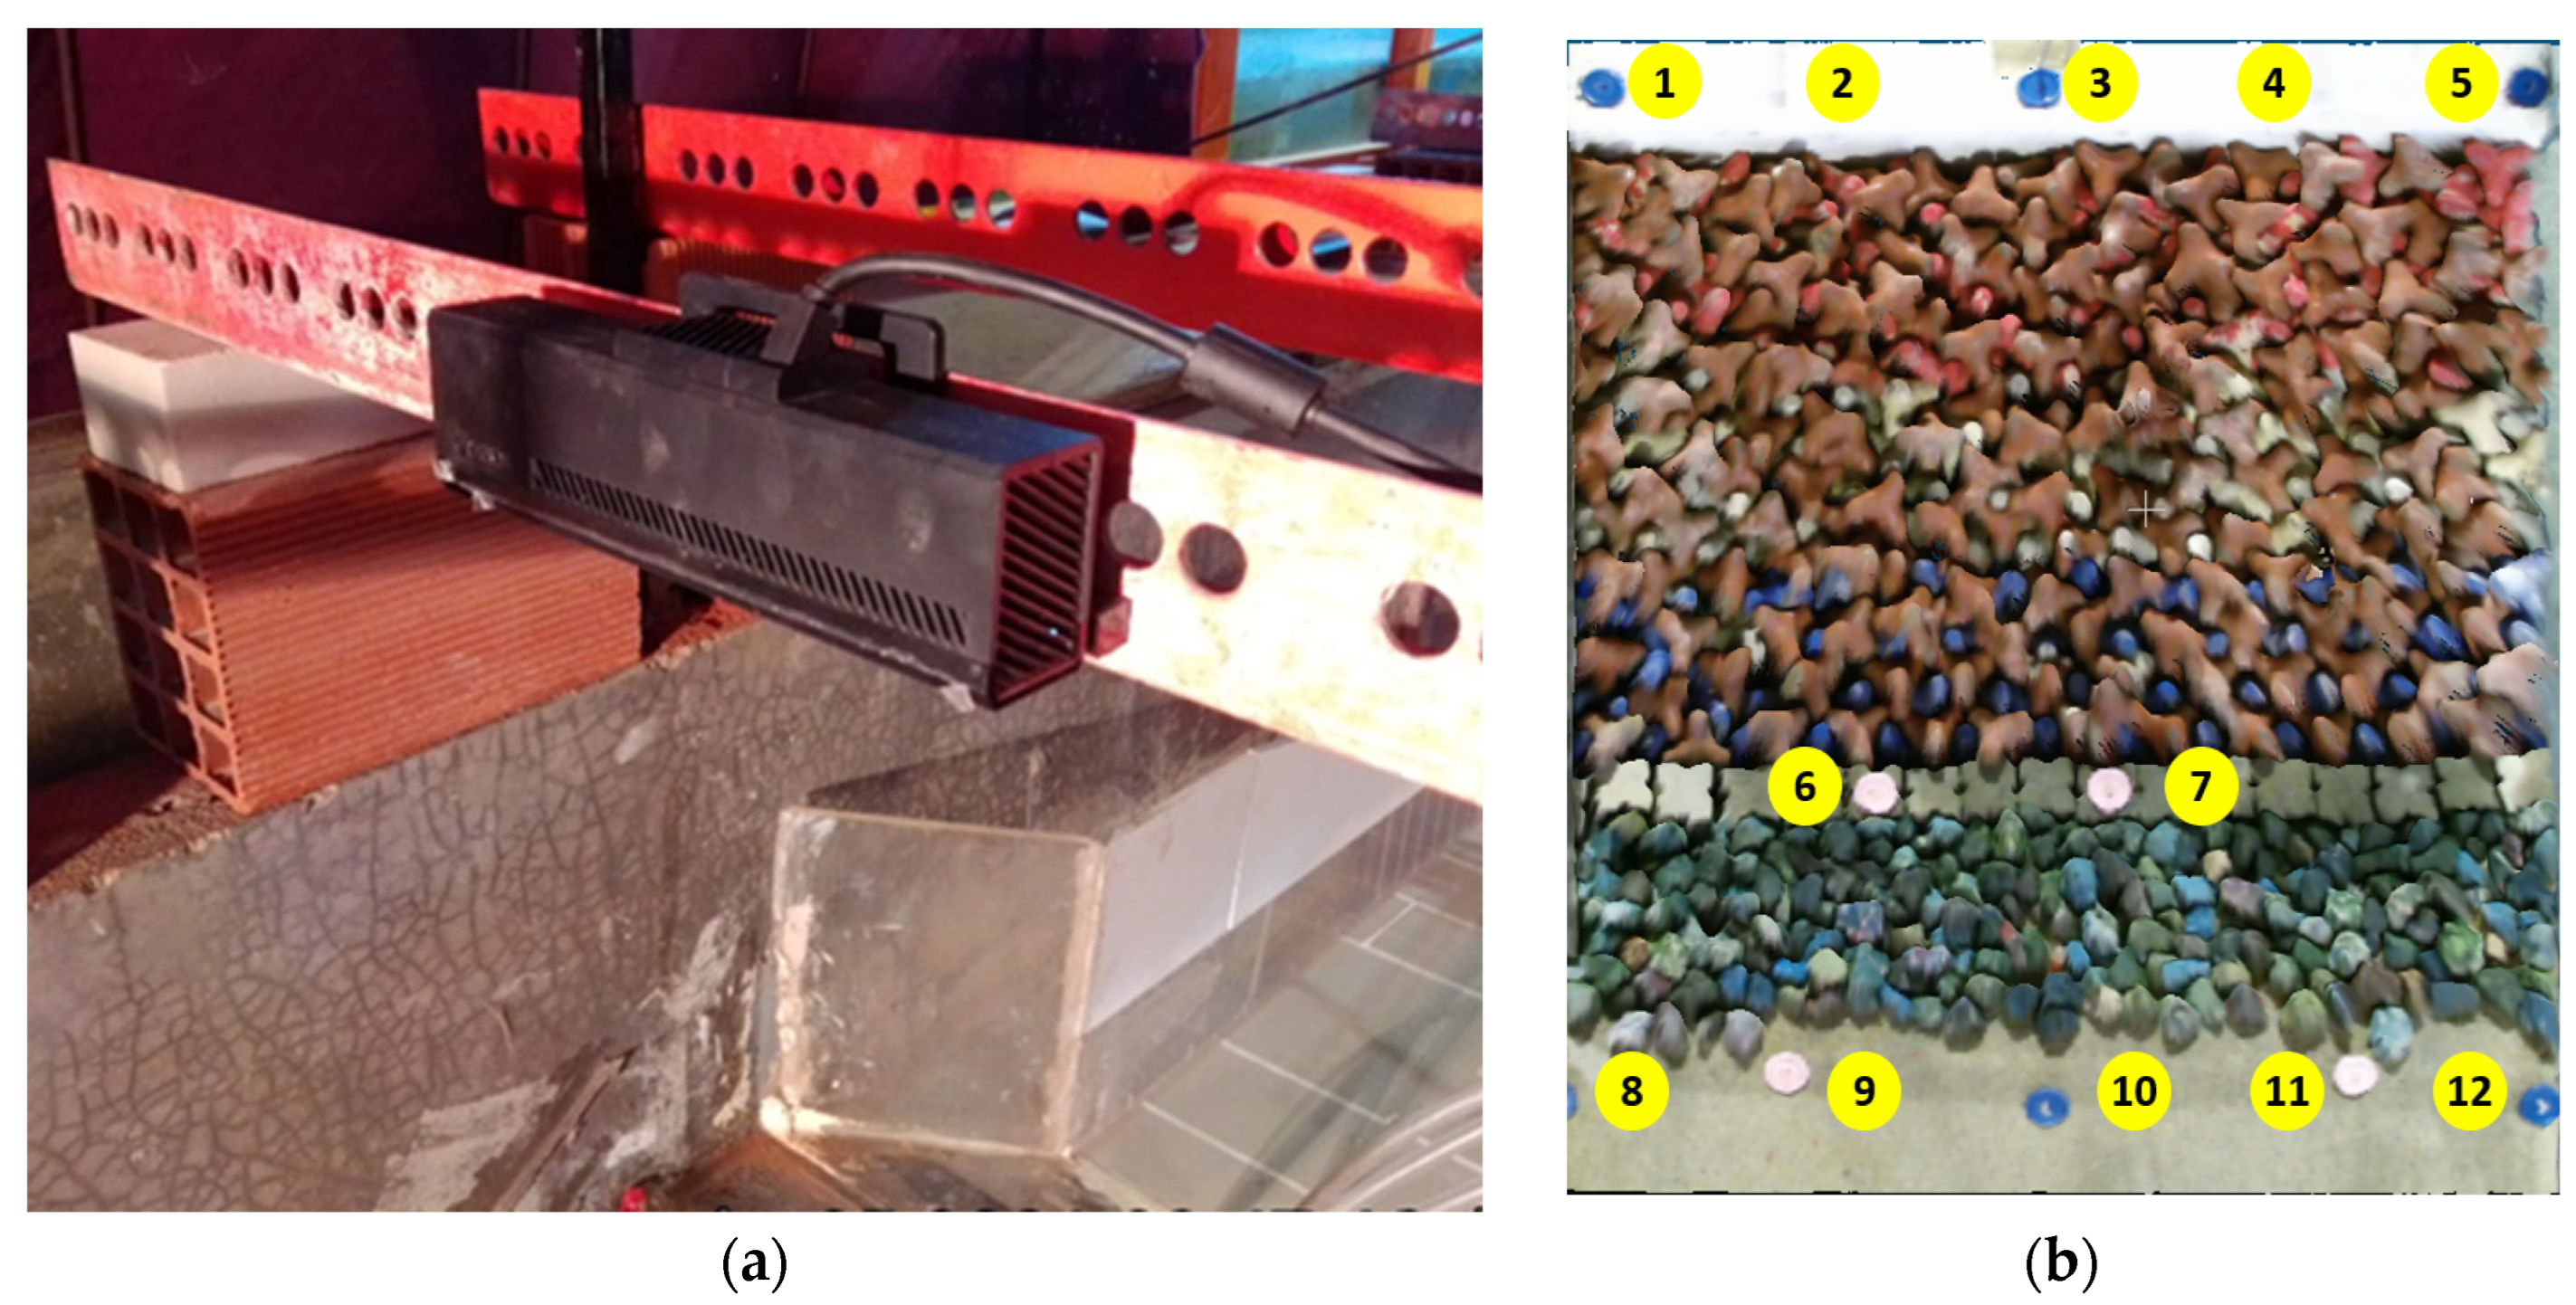
The Kinect sensor was positioned from the crest of the structure in a fixed structure above the flume (Figure 4a), and its sensor survey parameters were: voxel volume resolution for the three coordinated axes x, y and z: 512; voxel for metre; 256. That means that the volume of each scanned scene is . The sensor acquisition distance range was between and . Kinect surveys were carried out without water in the flume at the beginning and at the end of each test series, and with water in the flume at the end of each intermediate test. In addition to these surveys, the traditional method of counting rocking and displaced armour units was used also.
To reference the point clouds resulting from the surveys, i.e., to transpose the coordinates from the Kinect reference system to a coordinate system on the bottom of the flume, 12 ground control points (GCP) were used (numbered points in Figure 4b). They were materialised with coloured buttons placed at the bottom of the channel, in front of the toe of the armour layer, on top of the cubes that support the armour layer elements and on the superstructure. The coordinates of the GCP were obtained with a total station before the start of the test series.
Such a referencing procedure promotes the correction of the distortion caused by the light refraction in the air–water interface in the intermediate surveys, which were carried out with water in the wave flume. This type of refraction correction is only possible when the submerged GCP can be detected by the sensor, thus enabling one to correct the rotation angle. Musumeci et al. [13] employed a similar procedure in their surveys of scale-model rubble-mound breakwaters carried out with a Kinect sensor.
The post-processing of the surveys conducted with water in the flume comprised also a fine alignment of the point clouds resulting from the previous referencing procedure with a similar cloud obtained without water in the flume. This fine alignment was performed using the iterative closest point (ICP) algorithm [25], available in the open-source software CloudCompare [26].
For each point in the point cloud with water, the ICP algorithm matches the closest point in the reference point cloud (without water). It estimates the combination of rotation and translation using a root mean square (RMS) point-to-point distance metric minimisation technique, which will best align each point of the cloud with water to its match found in the previous step. The algorithm transforms the points of the cloud with water, using the obtained transformation. It iterates a certain number of times depending on the criteria to stop (an RMS difference or a pre-defined number of iterations). In this case, one used the value of RMS = suggested by the algorithm for a 100% final overlap.
The irregular shape of the tetrapod units makes it difficult to determine the eroded area of individual profiles, which is needed to estimate S. In this study, the damage evolution was based on surveys of the whole stretch of the armour layer being tested and on the computation of the eroded volume () between the initial 3D survey and the one of the current test run. By dividing the eroded volume in the whole stretch at the end of a test run by the usable width of the survey (, in this case ), one obtains the stretch mean eroded area () and, subsequently, dimensionless damage parameter .
Thus, it is possible to minimise the error resulting from an averaged S if the long-shore damage does not vary much, as is the case with the two-dimensional scale models. Otherwise, this type of analysis should be restricted to the most damaged strips, each with a Dn width.
The eroded volume computation relies on the gridding process of the point clouds. This step defines the size of the elementary cells used in the volume computation. To compute the volume, CloudCompare sums up the volume of the elementary parallelepiped whose base area is the elementary cell area and whose height is the difference between the cloud z-coordinates (dV = grid step * grid step * distance).
A preliminary calibration of the grid size has always to be performed, using tests with a small number of removed armour units, to find the best grid step to be used in the eroded volume computation. A suitable grid step should lead to an estimation of displaced armour units quite similar to those counted at the end of each test. In previous experiences with Kinect surveys in armour layers made of antifer cubes, this calibration proved to be effective [15]. In that experiment, the estimated number of displaced armour units, based on the eroded volume, converged to the observed number of such units. When the armour layer is made of units with slender parts, for instance tetrapods, this type of calibration is of utmost importance, since small rotations of the tetrapods can show narrow voids with important depths, which are read by the scan and counted as erosion.
After several experiences with grid steps ranging from to , the best combination of point density and depth estimation was obtained with a grid step of . Steps smaller than led to an overestimated erosion volume, while grid steps higher than led to an important loss of point density.
The novelty of this damage evaluation procedure lies in using 3D surface models of the armour layer to compute the eroded volume from the difference between those models and from that the eroded area () and, subsequently, the dimensionless parameter . Given the difficulty in the determination of the eroded area when the armour layers are made of artificial units because of the irregular shape of such units, the parameter has been mainly used with armour layers made of rock. The calibration of the grid step for the volume calculation, described in the previous paragraphs, allows one to reduce the errors in this calculation. This new procedure aims to promote the use of the parameter in armour layers whose units are not rock, thus avoiding the traditional displaced-units counting method.
3. Results and Discussion
The results presented in this point refer to the so-called test series A, the longest test series (44 test runs) and where damage stabilisation is expected. Table 2 summarises the number of test repeats until damage stabilisation.
The damage characterisation used in Melby [5] was based on the eroded area average obtained in 14 transversal profiles of the armour layer. The damage values in test series A, presented in Table 3, resulted from a different approach: with the survey of the armour layer along the entire width of the flume it is possible to compute the eroded volume for the entire breakwater usable section. Figure 5a presents the Kinect survey of the armour layer envelope before the beginning of series A (before test T72) and after the end of that test series (after test T115), whereas Figure 5b presents the map of the distances between those two point clouds that were used for erosion computing. In blue are erosion regions where a negative difference between the last and the first survey were found, and in red are accretion regions.
Thus, the average of the eroded area can be determined by dividing the eroded volume by the usable stretch width (). Note that this area corresponds to the average of the eroded areas in each of the transversal profiles. Eroded areas in different profiles can differ from this value, depending on the heterogeneity of the damage value along the tested armour layer stretch.
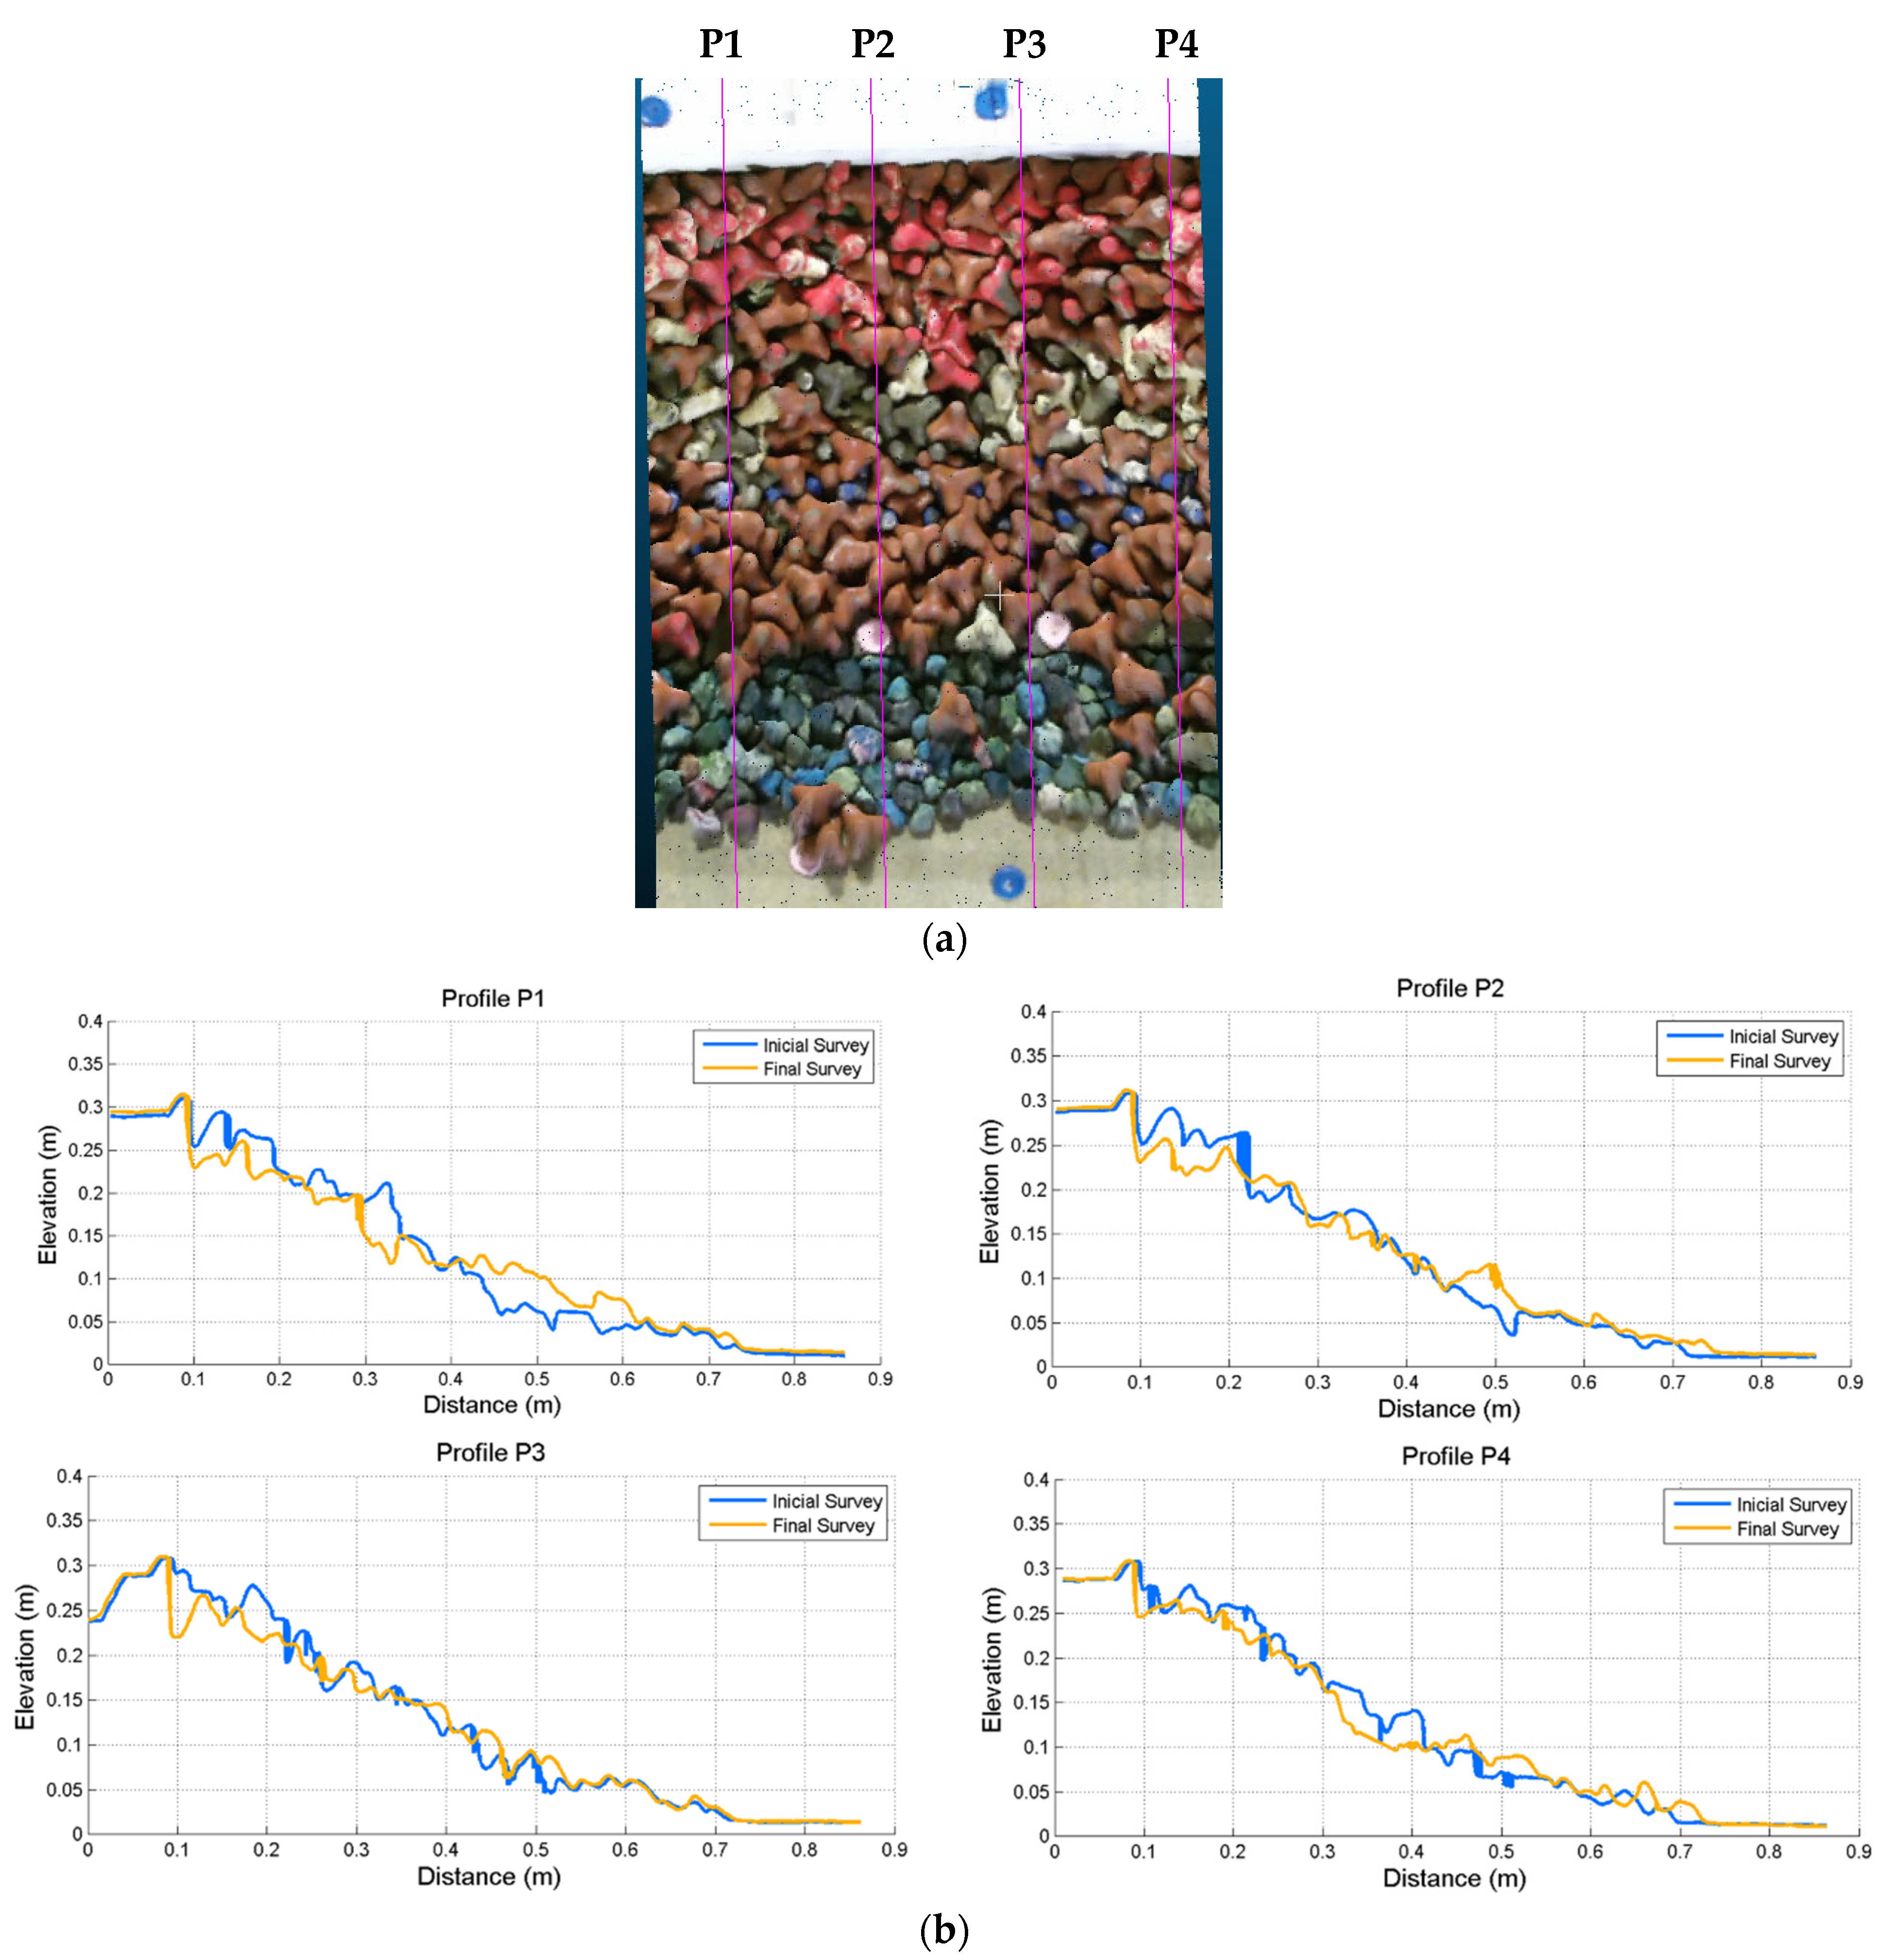
For test T115, an assessment of the variability of the erosion at four cross-sections (profiles P1 to P4 in Figure 6a) along the tested breakwater stretch was made. For this, a Matlab algorithm was used that computes (by trapezoidal numerical integration) the eroded area between the initial and final survey for the cross-sections presented in Figure 6b. The eroded area values (in ) obtained (, with an average of ) do confirm that erosion can be considered homogenous alongshore.
The peak period () and the significant wave height () values presented in Table 4 were obtained from the spectrum of the free surface elevation measured in gauge S5. It should be noted that this is not the spectrum of the incident wave at the toe of the structure, as the free surface elevation, measured by gauge S5, results from the superposition of the incident and reflected wave in the structure. Changes in the characteristics of the spectrum can be observed for all test conditions. The same values of peak period and significant wave height are never obtained for the several tests of a given test condition.
Table 4 shows the damage values () measured at the end of each test run, with a duration of 1000 waves, corresponding to a given sea-wave condition corresponding to the test sequences 1 to 6. The table also presents the values predicted with the Melby formula (Equation (6)) and the coefficients proposed by Melby [5] for an armour layer made of rock.
Since the Kinect surveys were only processed after the whole test series was complete, the criterion for defining damage stabilisation after consecutive test runs was based in the visual verification of the absence of armour-unit displacements during the last test.
Due to the armour layer characteristics (a tetrapod armour layer), the measured values of damage based on the eroded volume did not always show an increasing trend, presenting increasing and decreasing variations. The increasing trend, representative of the phenomenon of erosion, was followed by a decreasing trend, caused by the filling of voids by translations/rotations of adjacent armour units.
In addition, small rotations of the tetrapods can uncover small voids with important depths that are clearly read by the scan and counted as erosion. Since, in the next test, those holes can be covered again, this phenomenon also contributes to the increasing/decreasing tendency of the damage parameter.
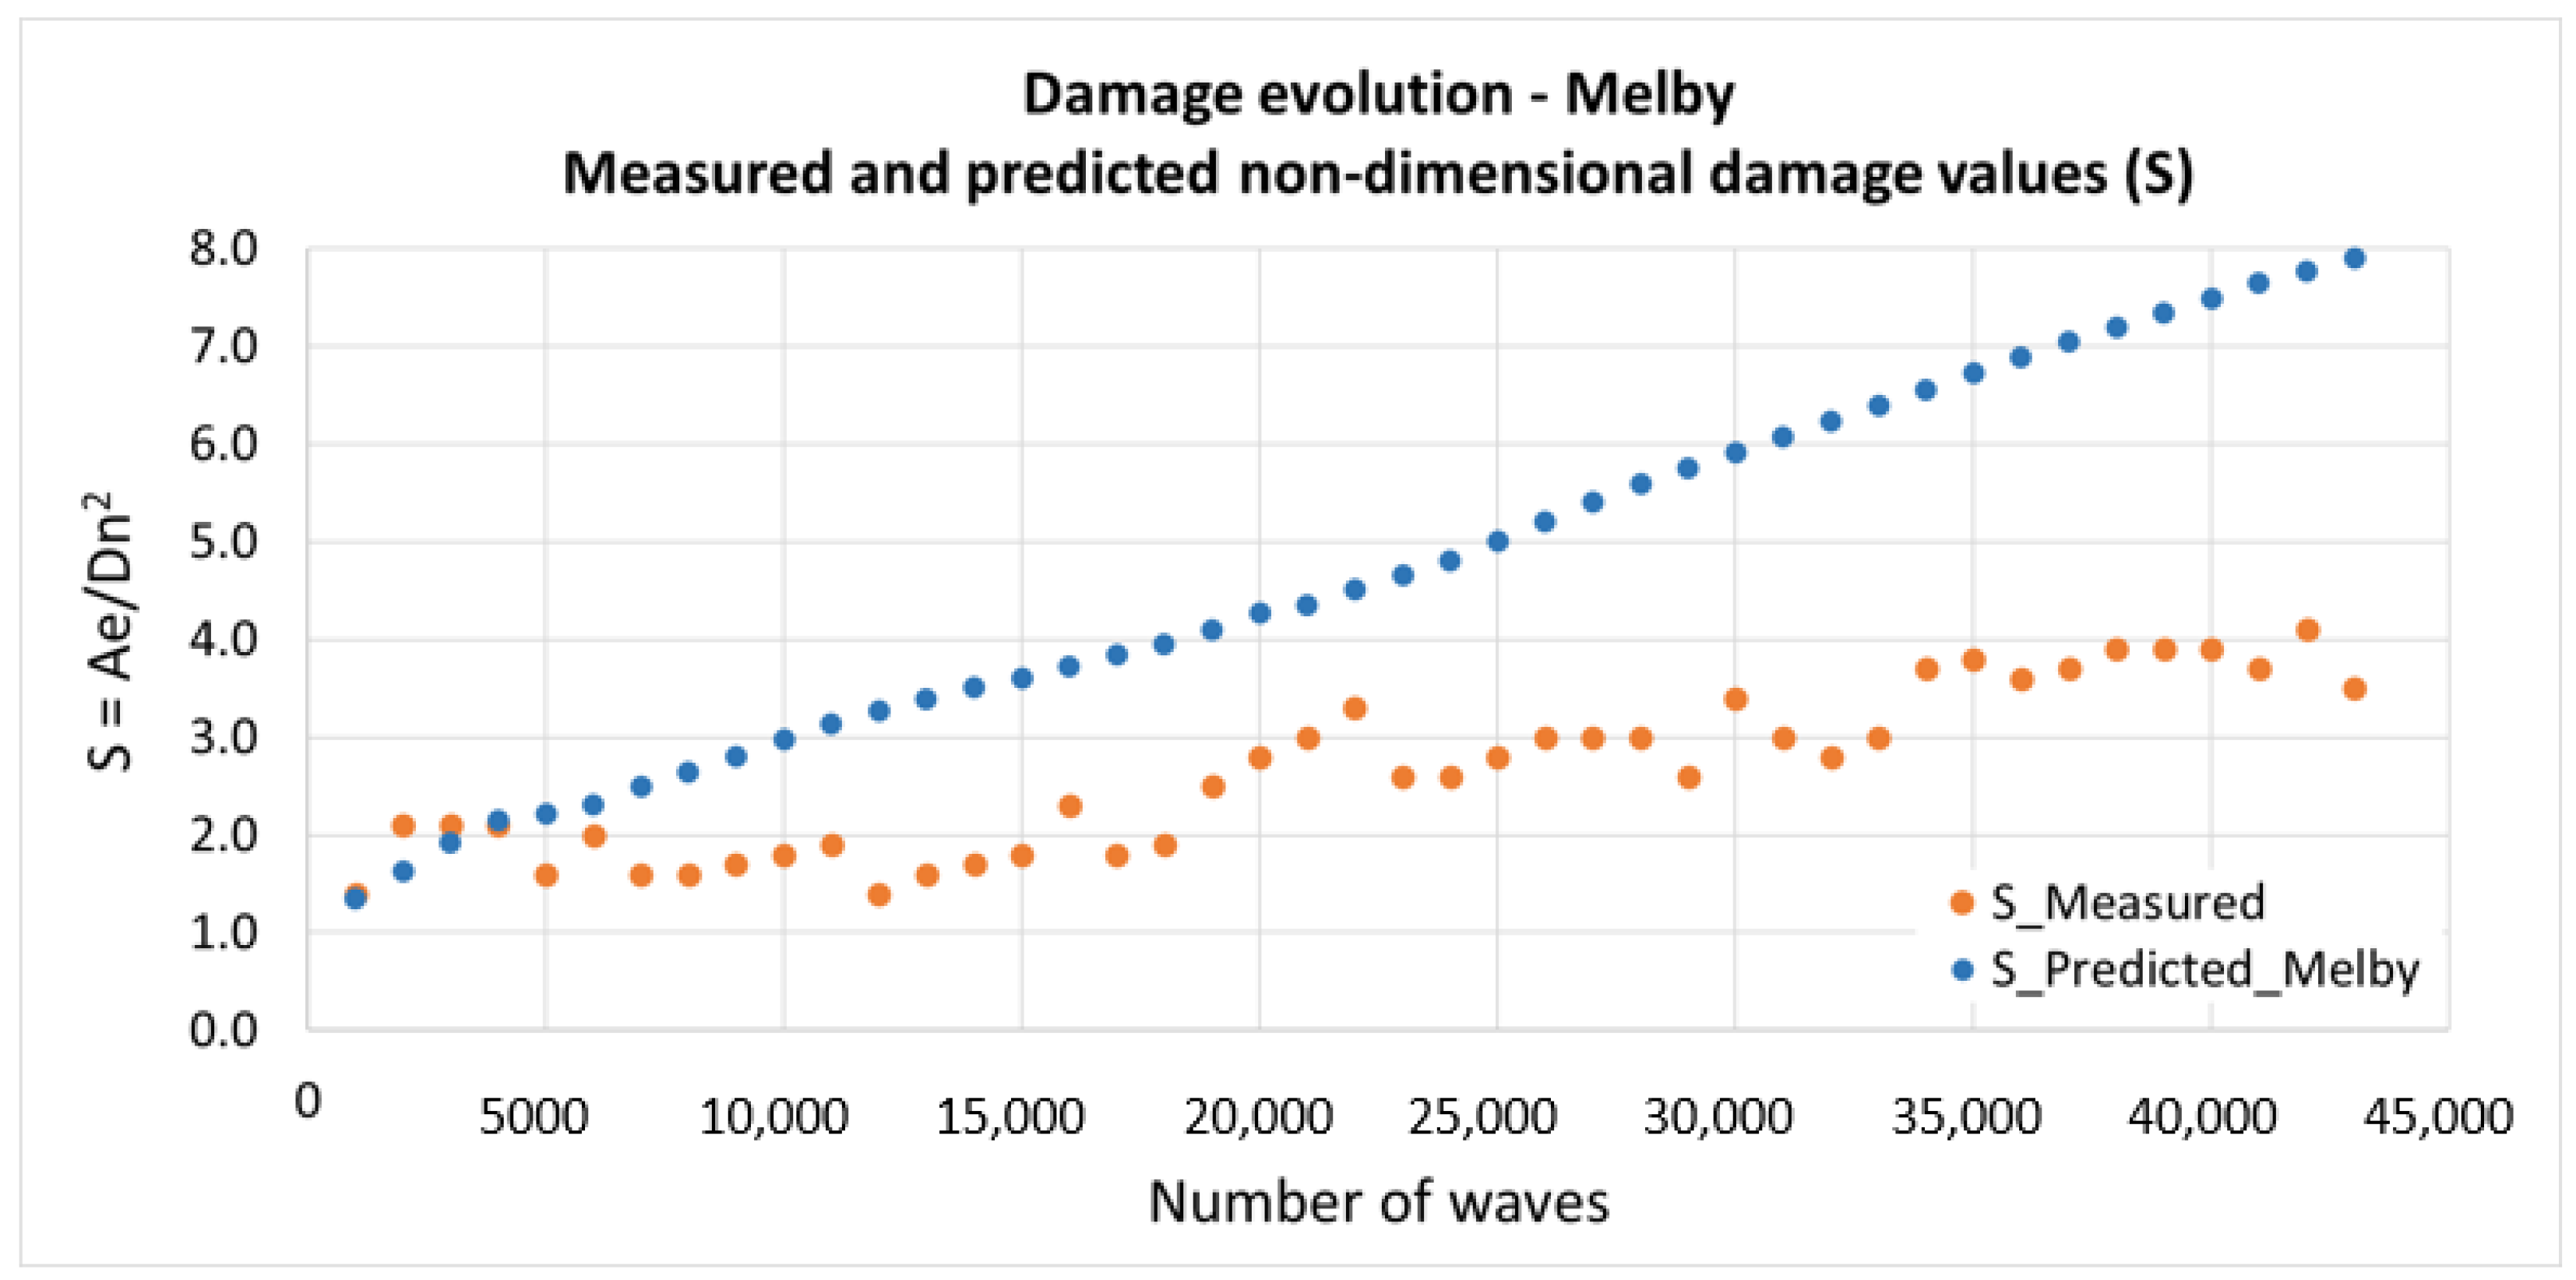
Figure 7 shows the damage evolution for measured and predicted values of the dimensionless damage parameter (). As expected, the results obtained on the physical model do not converge to those obtained by Melby´s formulation. It is verified that the predicted values overestimate the damage values at the beginning of the test series, showing a tendency towards the stabilisation of the damage at the end of the test series. At the end of the test program, predicted damage values largely overestimate measured damage. Since, due to the interlocking effect, armour layers made of tetrapods are more stable than the ones made of rock, the damage overestimation using a formula established for rock armour layers is no surprise.
Given the type and weight of the blocks used, it was expected that the damage evolution would be different from the one in Melby’s tests. In the present tests, damage evolved slowly (contrary to what happened in Melby´s test), despite not having reached a complete stabilisation. In fact, due to the interlocking effect and high porosity so characteristic of tetrapod armour layers, the displacements of some armour units end up filling the spaces left open by displacements or movements that occurred previously. In addition, run-up and run-down processes are not so critical for armour layers composed of tetrapods as for those composed of rock units.
Unlike armour layers made of rock units, tetrapod armour layers have a slower damage stabilisation, leading to a damage evolution curve with a smooth slope. In fact, despite the absence of visually detected armour unit displacements, the computed damage parameter still shows some variability because some armour units’ positions change.
To get an estimate of the coefficients to be used in the Melby formula for the armour layer damage evolution in this breakwater, the damage values at the end of each sequence of tests carried out with the same sea-wave conditions at the wave maker were investigated first. Constant sea-wave conditions at the toe of the structure were established as the average of the peak period, as well as the average of the significant wave height. Table 5 presents these constant values, the instants of the beginning and of the end of the test sequence considered to compute the and coefficients and the corresponding values of the dimensionless damage parameter. It includes also the estimated and coefficients for the test sequences.
To avoid the numerical problems with the initial zero damage value, the computations for test sequence 1 ( and ) started at the beginning of the second test in that sequence (test T73) using the damage at the beginning of this test (). Test sequence 2 ( and ) produced no usable estimates since the damage decreased in that sequence from at the beginning of test T74 to at the end of test T77. A similar behaviour was observed in test sequence 3 ( and ), but in this case it was possible to get a sequence of measured values with an increasing trend starting at test T79, with damage at the beginning of the test of and finishing at test T86 with .
The average of the values was obtained discarding the value for test sequence 2 and produced the value . The corresponding average of values produced . A better estimate of these parameters was obtained using the root mean square of the error () between the estimated and measured dimensionless damage parameter at the end of every individual test.
The sea-wave conditions at the toe of the structure were considered constant for the duration of the test sequence, i.e., the average values presented in Table 5 and the values tested were in the interval [0.10, 0.50], whereas the values were in the interval [0.001, 0.040]. The smallest root mean square error was found for and .
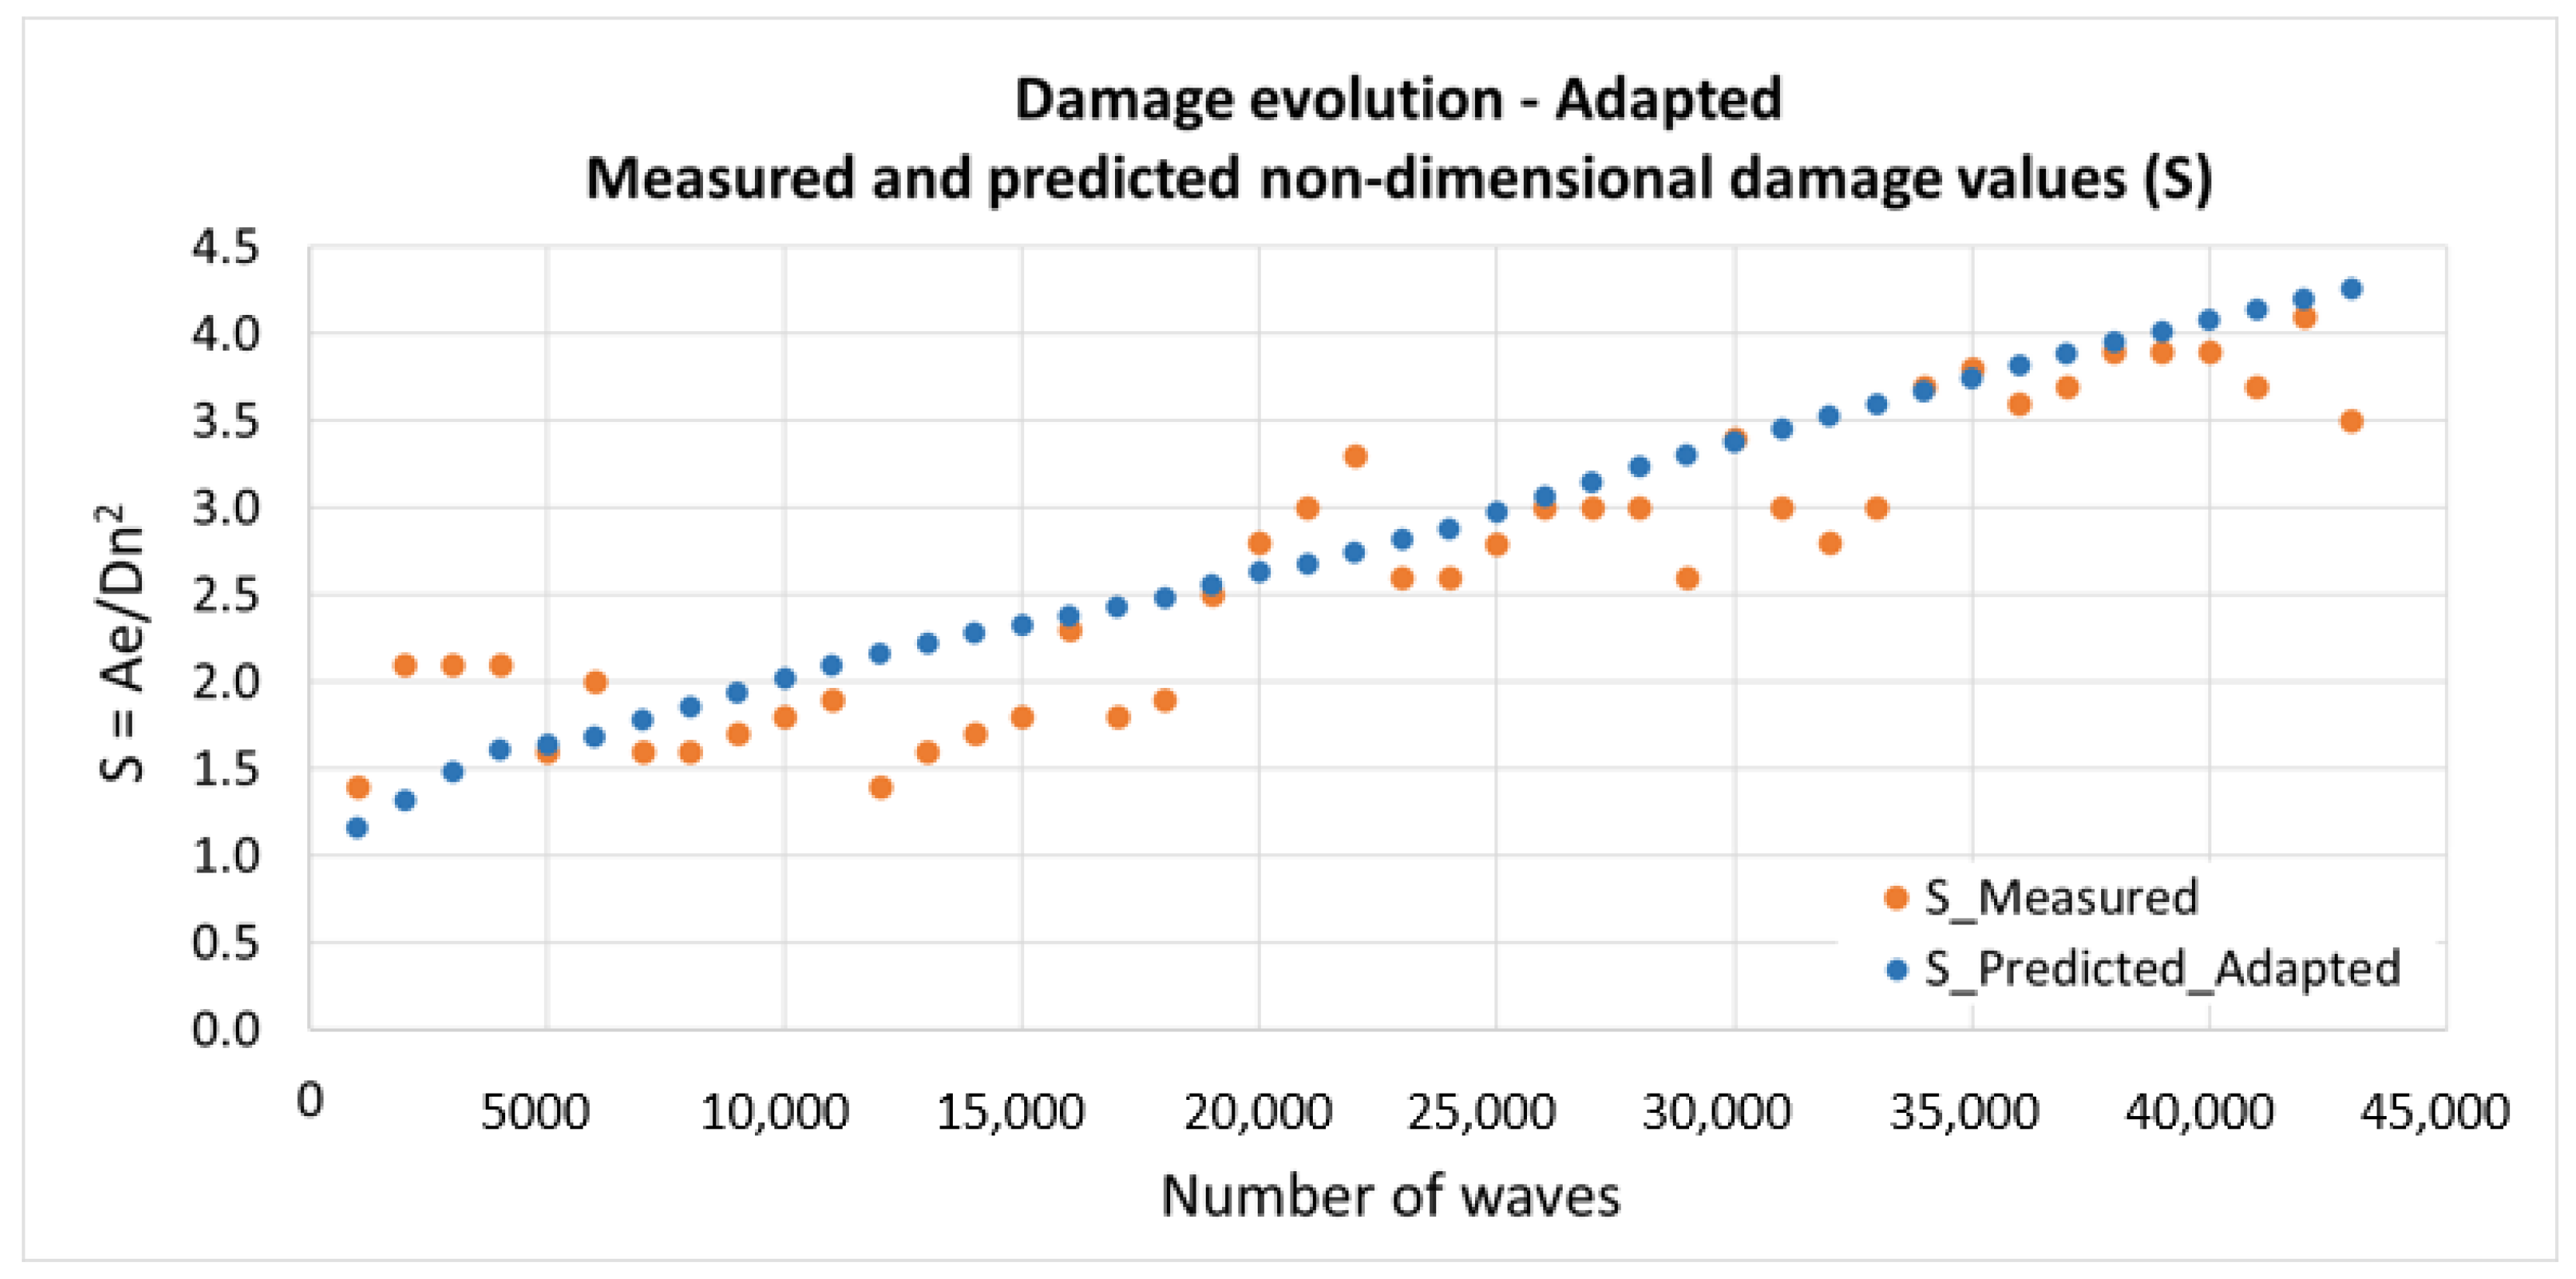
Should the estimated sea-wave parameters at the toe of the structure for each test be used in the Melby formula, the best coefficients are and . Figure 8 compares the measured dimensionless damage parameter with the estimates of the Melby formula using the sea-wave characteristics at the toe of the structure in each individual test and the coefficients and .
4. Conclusions
The procedure presented in Melby [5]) to get the and coefficients for the armour layer damage evolution of rubble-mound breakwaters was used in this paper to estimate the corresponding coefficients when the armour layer is made of tetrapods. The characterisation of the armour layer damage was based on the results of surveys carried out with a position sensor.
The use of a position sensor proved to be quite effective in obtaining three-dimensional surface models of the armour layers of the breakwater model, making it possible to extract profiles and obtain damage measurements, such as eroded volume and average eroded area. It was found that the measured damage parameter values () are lower than those predicted by the Melby formulation with the and coefficients published in Melby [5] for armour layers made of rock.
The interlocking effect and high porosity of the tetrapod armour layer make some displaced armour units fill the spaces left open by previous displacements or movements. Furthermore, small movements of the tetrapods can uncover narrow voids with important depths that are clearly read by the scan and counted as erosion, followed by accretion at the next test since those holes can be covered again, leading to a sawtooth-shaped measured damage evolution graphic.
A good fit for the and coefficients for the armour layer damage evolution in the studied structure was obtained by looking for the smallest root mean square of the error between the measured and the predicted damage for the whole test series. The obtained values were and .
The paper shows that these long-duration tests can be a valuable spin-off of the common hydraulic stability tests carried out in wave flumes, whose main objective is to check the behaviour of a proposed cross-section for a given rubble-mound breakwater. In fact, using the same setup built for these tests, the procedure presented in this paper enables one to derive the and coefficients for damage evolution of the tested armour layer. With such coefficients, and knowledge of the wave climate in the region where the tested rubble-mound breakwater is built, one will be able to forecast the damage evolution of its armour layer in the time interval that starts in the last periodic inspection of this structure.
Author Contributions
Conceptualization, R.L., J.A.S. and C.J.E.M.F.; methodology, R.L., J.A.S. and C.J.E.M.F.; software, R.L.; validation, R.L. and J.A.S.; formal analysis, R.L, J.A.S. and C.J.E.M.F.; investigation, R.L and J.A.S.; resources, C.J.E.M.F.; data curation, R.L. and J.A.S.; writing—original draft preparation, R.L.; writing—review and editing, R.L. and J.A.S.; visualization, R.L., J.A.S. and C.J.E.M.F.; supervision, J.A.S.; project administration, C.J.E.M.F.; funding acquisition, C.J.E.M.F. All authors have read and agreed to the published version of the manuscript.
Funding
This work was carried out within the scope of the projects: PTDC/EAM-OCE/31207/2017 To-Sealert-Wave overtopping and flooding in coastal and port areas: Tools for an early warning, emergency planning and risk management system and PTDC/ECI-EGC/31090/2017 BSafe4Sea— Breakwaters SAFEty control through a FORecast and decision support SystEm Analysis, both funded by the Portuguese Research Foundation (FCT).
Institutional Review Board Statement
Not applicable.
Informed Consent Statement
Not applicable.
Data Availability Statement
Not applicable.
Conflicts of Interest
The authors declare no conflict of interest.
References
- Santos, J.A.; Neves, M.G.; Silva, L.G. Rubble-mound Breakwater Inspection in Portugal. In Coastal Structures 2003; Melby, J.A., Ed.; ASCE: Reston, VA, USA, 2004; pp. 249–261. [Google Scholar]
- Campos, A.; Castillo, C.; Molina-Sanchez, R. Damage in Rubble Mound Breakwaters. Part I: Historical Review of Damage Models. J. Mar. Sci. Eng. 2020, 8, 317. [Google Scholar] [CrossRef]
- Vidal, C.; Medina, R.; Lomónaco, P. Wave Height Parameter for Damage Description of Rubble-Mound Breakwaters. Coast. Eng. 2006, 53, 711–722. [Google Scholar] [CrossRef]
- Castillo, C.; Castillo, E.; Fernández-Canteli, A.; Molina, R.; Gómez, R. Stochastic Model for Damage Accumulation in Rubble-Mound Breakwaters Based on Compatibility Conditions and the Central Limit Theorem. J. Waterw. Port. Coast. Ocean. Eng. 2012, 138, 451–463. [Google Scholar] [CrossRef]
- Melby, J.A. Damage Progression on Rubble-Mound Breakwaters; US Army Corps of Engineers: Washington, DC, USA, 1999. [Google Scholar]
- Molines, J.; Herrera, M.P.; Perez, T.J.; Pardo, V.; Medina, J.R. Laser scanning technique to quantify randomness in cube and cubipod armour layers. In Proceedings of the CoastLab 2012—4th International Conference on the Application of Physical Modelling to Port and Costal Protection, Ghent, Belgium, 17–20 September 2012. [Google Scholar]
- Puente, I.; Sande, J.; González-Jorge, H.; Peña, E.; Maciñeira, E.; Martínez-Sánchez, J.; Arias, P. Novel image analysis approach to the terrestrial LiDAR monitoring of damage in rubble mound breakwaters. Ocean. Eng. 2014, 91, 273–280. [Google Scholar] [CrossRef]
- Rigden, T.; Steward, T. Use of 3D laser scanning in determining breakwater damage parameters. In Proceedings of the CoastLab 2012—4th International Conference on the Application of Physical Modelling to Port and Costal Protection, Ghent, Belgium, 17–20 September 2012. [Google Scholar]
- Ferreira, R.; Costeira, J.P.; Santos, J.A. Stereo Reconstruction of a Submerged Scene. In Pattern Recognition and Image Analysis; Marques, J.S., Pérez de la Blanca, N., Pina, P., Eds.; Springer: Berlin/Heidelberg, 2005; Volume 3522. [Google Scholar]
- Lemos, R.; Santos, J.A.; Fortes, C.J. Rubble Mound Breakwater Damage Assessment through Stereo Photogrammetry in Physical Scale Laboratory Tests. Ribagua 2017, 4, 84–98. [Google Scholar] [CrossRef] [Green Version]
- Vieira, F.; Taveira-Pinto, F.; Rosa-Santos, P. Damage Evolution in Single-Layer Cube Armoured Breakwaters with a Regular Placement Pattern. Coast. Eng. 2021, 169, 103943. [Google Scholar] [CrossRef]
- Soares, F.; Henriques, M.; Rocha, C. Concrete block tracking in breakwater models. In Proceedings of the of FIG Working Week, Helsinki, Finland, 29 May–2 June 2017. [Google Scholar]
- Musumeci, R.; Moltisanti, D.; Foti, E.; Battiato, S. 3-D monitoring of rubble-mound breakwater damages. Measurement 2018, 117, 347–364. [Google Scholar] [CrossRef] [Green Version]
- Sande, J.; Peña, E.; Neves, M.G.; Lemos, R.; Figuero, A.; Reis, M.T.; Alvarellos, A.; Rabuñal, J. Application of scanning techniques for damage analysis in rubble mound breakwaters. In Proceedings of the CoastLab 2018—7th International Conference on the Application of Physical Modelling to Costal and Port Engineering and Science, Santander, Spain, 22–26 May 2018. [Google Scholar]
- Lemos, R.; Peña, E.; Santos, J.A.; Sande, J.; Figuero, A.; Alvarellos, A.; Laiño, E.; Reis, M.T.; Fortes, C.J.; Kerpen, N. Measuring Armour Layer Damage in Rubble-mound Breakwaters under Oblique Wave Incidence. In Proceedings of the Coastal Structures Conference 2019, Hannover, Germany, 29 September–2 October 2019. [Google Scholar]
- van der Meer, J.W. Stability of Rubble Mound Revetments and Breakwaters under Random Wave Attack. In Proceedings of the Breakwaters Conference, London, UK, 2–4 October 1985. [Google Scholar]
- van der Meer, J.W. Rock Slopes and Gravel Beaches under Wave Attack. Ph.D. Thesis, Faculty of Civil Engineering and Geosciences, Delft, The Netherlands, 26 April 1988. [Google Scholar]
- Campos, A.; Castillo, C.; Molina-Sanchez, R. Damage in Rubble Mound Breakwaters. Part II: Review of the Definition, Parametrization and Measurement of Damage. J. Mar. Sci. Eng. 2020, 8, 306. [Google Scholar] [CrossRef]
- Burcharth, H.F.; Hughes, S.A. Fundamentals of Design. In Coastal Engineering Manual; USACE Publications: Hyattsville, MD, USA, 2011. [Google Scholar]
- Morison, J.; O'Brien, M.; Johnson, J.; Scaaf, S. The force exerted by surface waves on piles. J. Pet. Technol. 1950, 189, 149–154. [Google Scholar] [CrossRef]
- Munson, B.R.; Young, D.F.; Okiishi, T.H.; Huebsch, W.W. Fundamentals of Fluid Mechanics, 6th ed.; John Wiley & Son, Inc.: Hoboken, NJ, USA, 2009. [Google Scholar]
- Hudson, R.Y. Design of Quarry-Stone Cover Layers for Rubble-Mound Breakwaters; WES: Vicksburg, MS, USA, 1958. [Google Scholar]
- van der Meer, J.W. Stability of Cubes, Tetrapodes and Accropode. In Proceedings of the Breakwaters Conference, Eastbourne, UK, 2–4 May 1988; pp. 71–80. [Google Scholar]
- Hedar, P.A. Stability of Rock-Fill Breakwaters. Ph.D. Thesis, University of Gothenburg, Gothenburg, Sweden, 1960. [Google Scholar]
- Chen, Y.; Medioni, G. Object modelling by registration of multiple range images. Image Vis. Comput. 1992, 10, 145–155. [Google Scholar] [CrossRef]
- Girardeau-Montaut, D. Détection de changement sur des données géométriques tridimensionnelles. Ph.D. Thesis, Télécom ParisTech, Palaiseau, France, 2006. [Google Scholar]
Figure 1.
Overview of the irregular wave flume COI1.

Figure 2.
Ericeira’s breakwater quay section.

Figure 3.
Bottom and cross-section of the quay section of Ericeira’s breakwater tested in the scale-model tests. Layout of the resistive wave probes along the flume.
Figure 3.
Bottom and cross-section of the quay section of Ericeira’s breakwater tested in the scale-model tests. Layout of the resistive wave probes along the flume.

Figure 4.
(a) Position sensor Kinect; (b) ground control points.

Figure 5.
Survey conducted at the beginning and at the end of test series A. (a) Clouds of points of initial and final surveys; (b) distance map.
Figure 5.
Survey conducted at the beginning and at the end of test series A. (a) Clouds of points of initial and final surveys; (b) distance map.

Figure 6.
Profile P1 to P4. Profile location (a) and profile differences between initial and final survey (b).
Figure 6.
Profile P1 to P4. Profile location (a) and profile differences between initial and final survey (b).

Figure 7.
Damage evolution for measured and predicted values of the non-dimensional damage parameter (S).
Figure 7.
Damage evolution for measured and predicted values of the non-dimensional damage parameter (S).

Figure 8.
Damage evolution for measured and predicted values of the dimensionless damage parameter () using the adapted coefficients.
Figure 8.
Damage evolution for measured and predicted values of the dimensionless damage parameter () using the adapted coefficients.


Table 1.
Water levels and wave conditions considered for damage evolution for test series A.
| Test | Tp (s) | Hm0 (m) | Depth At The Toe (m) | Test Duration For 1000 Waves (s) | Number Of Test Runs |
|---|---|---|---|---|---|
| 1 | 1.70 | 0.12 | 0.13 | 1697 s | Until damage stabilisation |
| 2 | 1.70 | 0.16 | 0.13 | 1697 s | |
| 3 | 1.70 | 0.19 | 0.13 | 1697 s | |
| 4 | 1.98 | 0.12 | 0.17 | 1980 s | |
| 5 | 1.98 | 0.14 | 0.17 | 1980 s | |
| 6 | 1.98 | 0.17 | 0.17 | 1980 s |
Table 2.
Tests conducted during test series A.
| Test | Number Of Test Repeats Until Stabilisation | Test Names |
|---|---|---|
| 1 | 3 | T72 to T73 |
| 2 | 4 | T74 to T77 |
| 3 | 10 | T78 to T87 |
| 4 | 3 | T88 toT90 |
| 5 | 6 | T91 to T96 |
| 6 | 19 | T97 toT115 |
Table 3.
Damage values (S) measured and predicted by Melby’s formula (Equation (6)) and coefficients for armour layer made of rock.
Table 3.
Damage values (S) measured and predicted by Melby’s formula (Equation (6)) and coefficients for armour layer made of rock.
| Test Sequence | Test | Depth At The Toe (m) | Elapsed Time (s) | Tp (s) | Hm0 (m) | Nm0 | S Measured (Ae/Dn2) | S Predicted |
|---|---|---|---|---|---|---|---|---|
| 1 | 72 | 0.17 | 1697 | 1.952 | 0.104 | 1.65 | 1.4 | 1.34 |
| 73 | 0.17 | 3394 | 1.967 | 0.106 | 1.68 | 2.1 | 1.62 | |
| 2 | 74 | 0.17 | 5091 | 1.959 | 0.116 | 1.84 | 2.1 | 1.92 |
| 75 | 0.17 | 6788 | 2.077 | 0.117 | 1.86 | 2.1 | 2.15 | |
| 76 | 0.17 | 8485 | 2.069 | 0.092 | 1.46 | 1.6 | 2.21 | |
| 77 | 0.17 | 10182 | 2.077 | 0.104 | 1.65 | 2.0 | 2.30 | |
| 3 | 78 | 0.17 | 11879 | 1.988 | 0.124 | 1.97 | 1.7 | 2.50 |
| 79 | 0.17 | 13576 | 1.987 | 0.119 | 1.89 | 1.6 | 2.65 | |
| 80 | 0.17 | 15273 | 2.175 | 0.124 | 1.97 | 1.7 | 2.80 | |
| 81 | 0.17 | 16970 | 2.175 | 0.128 | 2.03 | 1.8 | 2.97 | |
| 82 | 0.17 | 18667 | 1.765 | 0.126 | 2.00 | 1.9 | 3.13 | |
| 83 | 0.17 | 20364 | 1.807 | 0.125 | 1.99 | 1.4 | 3.27 | |
| 84 | 0.17 | 22061 | 2.179 | 0.125 | 1.98 | 1.6 | 3.39 | |
| 85 | 0.17 | 23758 | 1.990 | 0.125 | 1.98 | 1.7 | 3.51 | |
| 86 | 0.17 | 25455 | 1.988 | 0.122 | 1.93 | 1.8 | 3.61 | |
| 4 | 88 | 0.20 | 27435 | 2.000 | 0.122 | 1.94 | 2.3 | 3.72 |
| 89 | 0.20 | 29415 | 2.017 | 0.125 | 1.98 | 1.8 | 3.84 | |
| 90 | 0.20 | 31395 | 2.004 | 0.124 | 1.97 | 1.9 | 3.95 | |
| 5 | 91 | 0.20 | 33375 | 1.995 | 0.135 | 2.14 | 2.5 | 4.10 |
| 92 | 0.20 | 35355 | 1.940 | 0.137 | 2.17 | 2.8 | 4.27 | |
| 93 | 0.20 | 37335 | 2.124 | 0.123 | 1.95 | 3.0 | 4.35 | |
| 94 | 0.20 | 39315 | 2.126 | 0.139 | 2.21 | 3.3 | 4.51 | |
| 95 | 0.20 | 41295 | 2.195 | 0.139 | 2.21 | 2.6 | 4.66 | |
| 96 | 0.20 | 43275 | 2.096 | 0.137 | 2.17 | 2.6 | 4.80 | |
| 6 | 97 | 0.20 | 45255 | 2.014 | 0.149 | 2.37 | 2.6 | 5.01 |
| 98 | 0.20 | 47235 | 2.014 | 0.149 | 2.37 | 3.0 | 5.21 | |
| 99 | 0.20 | 49215 | 2.014 | 0.149 | 2.37 | 3.0 | 5.40 | |
| 100 | 0.20 | 51195 | 2.014 | 0.149 | 2.37 | 3.0 | 5.59 | |
| 101 | 0.20 | 53175 | 2.321 | 0.147 | 2.33 | 2.6 | 5.75 | |
| 102 | 0.20 | 55155 | 2.275 | 0.148 | 2.35 | 3.4 | 5.91 | |
| 103 | 0.20 | 57135 | 2.376 | 0.149 | 2.37 | 3.0 | 6.07 | |
| 104 | 0.20 | 59115 | 2.083 | 0.149 | 2.36 | 2.8 | 6.24 | |
| 105 | 0.20 | 61095 | 2.324 | 0.149 | 2.36 | 3.0 | 6.39 | |
| 106 | 0.20 | 63075 | 2.219 | 0.151 | 2.39 | 3.7 | 6.56 | |
| 107 | 0.20 | 65055 | 2.012 | 0.152 | 2.41 | 3.8 | 6.72 | |
| 108 | 0.20 | 67035 | 2.066 | 0.153 | 2.42 | 3.6 | 6.89 | |
| 109 | 0.20 | 69015 | 2.339 | 0.151 | 2.39 | 3.7 | 7.04 | |
| 110 | 0.20 | 70995 | 2.014 | 0.151 | 2.40 | 3.9 | 7.20 | |
| 111 | 0.20 | 72975 | 2.129 | 0.151 | 2.39 | 3.9 | 7.35 | |
| 112 | 0.20 | 74955 | 2.379 | 0.150 | 2.38 | 3.9 | 7.48 | |
| 113 | 0.20 | 76935 | 1.024 | 0.149 | 2.37 | 3.7 | 7.64 | |
| 114 | 0.20 | 78915 | 2.380 | 0.148 | 2.35 | 4.1 | 7.77 | |
| 115 | 0.20 | 80895 | 2.082 | 0.150 | 2.39 | 3.5 | 7.90 |
Table 4.
Damage values (S) measured and predicted by Melby’s formula (Equation (6)) and coefficients for armour layer made of rock.
Table 4.
Damage values (S) measured and predicted by Melby’s formula (Equation (6)) and coefficients for armour layer made of rock.
| Test sequence | Test | Depth at the toe (m) | Elapsed time (s) | Tp (s) | Hm0 (m) | Nm0 | S Measured (Ae/Dn2) | S Predicted |
|---|---|---|---|---|---|---|---|---|
| 1 | 72 | 0.17 | 1697 | 1.952 | 0.104 | 1.65 | 1.4 | 1.34 |
| 73 | 0.17 | 3394 | 1.967 | 0.106 | 1.68 | 2.1 | 1.62 | |
| 2 | 74 | 0.17 | 5091 | 1.959 | 0.116 | 1.84 | 2.1 | 1.92 |
| 75 | 0.17 | 6788 | 2.077 | 0.117 | 1.86 | 2.1 | 2.15 | |
| 76 | 0.17 | 8485 | 2.069 | 0.092 | 1.46 | 1.6 | 2.21 | |
| 77 | 0.17 | 10182 | 2.077 | 0.104 | 1.65 | 2.0 | 2.30 | |
| 3 | 78 | 0.17 | 11879 | 1.988 | 0.124 | 1.97 | 1.7 | 2.50 |
| 79 | 0.17 | 13576 | 1.987 | 0.119 | 1.89 | 1.6 | 2.65 | |
| 80 | 0.17 | 15273 | 2.175 | 0.124 | 1.97 | 1.7 | 2.80 | |
| 81 | 0.17 | 16970 | 2.175 | 0.128 | 2.03 | 1.8 | 2.97 | |
| 82 | 0.17 | 18667 | 1.765 | 0.126 | 2.00 | 1.9 | 3.13 | |
| 83 | 0.17 | 20364 | 1.807 | 0.125 | 1.99 | 1.4 | 3.27 | |
| 84 | 0.17 | 22061 | 2.179 | 0.125 | 1.98 | 1.6 | 3.39 | |
| 85 | 0.17 | 23758 | 1.990 | 0.125 | 1.98 | 1.7 | 3.51 | |
| 86 | 0.17 | 25455 | 1.988 | 0.122 | 1.93 | 1.8 | 3.61 | |
| 4 | 88 | 0.20 | 27435 | 2.000 | 0.122 | 1.94 | 2.3 | 3.72 |
| 89 | 0.20 | 29415 | 2.017 | 0.125 | 1.98 | 1.8 | 3.84 | |
| 90 | 0.20 | 31395 | 2.004 | 0.124 | 1.97 | 1.9 | 3.95 | |
| 5 | 91 | 0.20 | 33375 | 1.995 | 0.135 | 2.14 | 2.5 | 4.10 |
| 92 | 0.20 | 35355 | 1.940 | 0.137 | 2.17 | 2.8 | 4.27 | |
| 93 | 0.20 | 37335 | 2.124 | 0.123 | 1.95 | 3.0 | 4.35 | |
| 94 | 0.20 | 39315 | 2.126 | 0.139 | 2.21 | 3.3 | 4.51 | |
| 95 | 0.20 | 41295 | 2.195 | 0.139 | 2.21 | 2.6 | 4.66 | |
| 96 | 0.20 | 43275 | 2.096 | 0.137 | 2.17 | 2.6 | 4.80 | |
| 6 | 97 | 0.20 | 45255 | 2.014 | 0.149 | 2.37 | 2.6 | 5.01 |
| 98 | 0.20 | 47235 | 2.014 | 0.149 | 2.37 | 3.0 | 5.21 | |
| 99 | 0.20 | 49215 | 2.014 | 0.149 | 2.37 | 3.0 | 5.40 | |
| 100 | 0.20 | 51195 | 2.014 | 0.149 | 2.37 | 3.0 | 5.59 | |
| 101 | 0.20 | 53175 | 2.321 | 0.147 | 2.33 | 2.6 | 5.75 | |
| 102 | 0.20 | 55155 | 2.275 | 0.148 | 2.35 | 3.4 | 5.91 | |
| 103 | 0.20 | 57135 | 2.376 | 0.149 | 2.37 | 3.0 | 6.07 | |
| 104 | 0.20 | 59115 | 2.083 | 0.149 | 2.36 | 2.8 | 6.24 | |
| 105 | 0.20 | 61095 | 2.324 | 0.149 | 2.36 | 3.0 | 6.39 | |
| 106 | 0.20 | 63075 | 2.219 | 0.151 | 2.39 | 3.7 | 6.56 | |
| 107 | 0.20 | 65055 | 2.012 | 0.152 | 2.41 | 3.8 | 6.72 | |
| 108 | 0.20 | 67035 | 2.066 | 0.153 | 2.42 | 3.6 | 6.89 | |
| 109 | 0.20 | 69015 | 2.339 | 0.151 | 2.39 | 3.7 | 7.04 | |
| 110 | 0.20 | 70995 | 2.014 | 0.151 | 2.40 | 3.9 | 7.20 | |
| 111 | 0.20 | 72975 | 2.129 | 0.151 | 2.39 | 3.9 | 7.35 | |
| 112 | 0.20 | 74955 | 2.379 | 0.150 | 2.38 | 3.9 | 7.48 | |
| 113 | 0.20 | 76935 | 1.024 | 0.149 | 2.37 | 3.7 | 7.64 | |
| 114 | 0.20 | 78915 | 2.380 | 0.148 | 2.35 | 4.1 | 7.77 | |
| 115 | 0.20 | 80895 | 2.082 | 0.150 | 2.39 | 3.5 | 7.90 |
Table 5.
Average sea-wave characteristics at the toe of the structure for each test sequence, time at the beginning and at the end of the test sequence, corresponding to the measured dimensionless parameters and estimated coefficients and for Melby’s formula.
Table 5.
Average sea-wave characteristics at the toe of the structure for each test sequence, time at the beginning and at the end of the test sequence, corresponding to the measured dimensionless parameters and estimated coefficients and for Melby’s formula.
| Test Sequence | Tp (s) | Hm0 (m) | tn (s) | Sn (-) | tn + 1 (s) | Sn + 1 (-) | b | ap |
|---|---|---|---|---|---|---|---|---|
| 1 | 1.96 | 0.105 | 1697 | 1.4 | 3394 | 2.1 | 0.58 | 0.002 |
| 2 | 2.04 | 0.108 | 3394 | 2.1 | 10182 | 2.0 | −0.04 | 0.194 |
| 3 | 2.01 | 0.124 | 11879 | 1.7 | 25455 | 1.8 | 0.08 | 0.030 |
| 4 | 2.01 | 0.124 | 25455 | 1.8 | 31395 | 1.9 | 0.26 | 0.005 |
| 5 | 2.08 | 0.135 | 31395 | 1.9 | 43275 | 2.6 | 0.98 | 3 × 10⁻⁶ |
| 6 | 2.11 | 0.150 | 43275 | 2.6 | 80895 | 3.5 | 0.47 | 0.003 |
Disclaimer/Publisher’s Note: The statements, opinions and data contained in all publications are solely those of the individual author(s) and contributor(s) and not of MDPI and/or the editor(s). MDPI and/or the editor(s) disclaim responsibility for any injury to people or property resulting from any ideas, methods, instructions or products referred to in the content. |
© 2022 by the authors. Licensee MDPI, Basel, Switzerland. This article is an open access article distributed under the terms and conditions of the Creative Commons Attribution (CC BY) license (https://creativecommons.org/licenses/by/4.0/).
Share and Cite
MDPI and ACS Style
Lemos, R.; Santos, J.A.; Fortes, C.J.E.M. Damage Evolution Prediction during 2D Scale-Model Tests of a Rubble-Mound Breakwater: A Case Study of Ericeira’s Breakwater. Modelling 2023, 4, 1-18. https://doi.org/10.3390/modelling4010001
AMA Style
Lemos R, Santos JA, Fortes CJEM. Damage Evolution Prediction during 2D Scale-Model Tests of a Rubble-Mound Breakwater: A Case Study of Ericeira’s Breakwater. Modelling. 2023; 4(1):1-18. https://doi.org/10.3390/modelling4010001
Chicago/Turabian StyleLemos, Rute, João A. Santos, and Conceição J.E.M. Fortes. 2023. "Damage Evolution Prediction during 2D Scale-Model Tests of a Rubble-Mound Breakwater: A Case Study of Ericeira’s Breakwater" Modelling 4, no. 1: 1-18. https://doi.org/10.3390/modelling4010001