Article

Production and Properties of Quercetin-Loaded Liposomes and Their Influence on the Properties of Galactomannan-Based Films

by
Priscilla Barbosa Sales de Albuquerque
1,2,3,*,
Marthyna Pessoa de Souza
4,
Ana Isabel Bourbon
5,
Miguel A. Cerqueira
5,
Lorenzo Pastrana
5,
Paula Jauregi
6,†,‡,
José A. Teixeira
2 and
Maria das Graças Carneiro-da-Cunha
1,7
1
Laboratório de Imunopatologia Keizo Asami, Universidade Federal de Pernambuco, Campus Universitário, s/n, Cidade Universitária, Recife 50670-901, PE, Brazil
2
Center of Biological Engineering, Universidade do Minho, Campus de Gualtar, 4710-057 Braga, Portugal
3
Department of Medicine, Universidade de Pernambuco—UPE, R. Cap. Pedro Rodrigues, Garanhuns 55294-902, PE, Brazil
4
Centro de Saúde e Tecnologia Rural, Universidade Federal de Campina Grande, Av. Universitária s/n, Patos 58700-970, PB, Brazil
5
International Iberian Nanotechnology Laboratory, Av. Mestre José Veiga s/n, 4715-330 Braga, Portugal
6
Department of Food and Nutritional Sciences, University of Reading, Harry Nursten Building, Reading RG6 6DZ, UK
7
Departamento de Bioquímica, Universidade Federal de Pernambuco, Av. Prof. Moraes Rego, s/n, Cidade Universitária, Recife 50670-420, PE, Brazil
*
Author to whom correspondence should be addressed.
Current address: Ikerbasque, Basque Foundation for Science, Bilbao 48013, Spain.
Current address: AZTI, Food Research, Basque Research and Technology Alliance (BRTA), Parque Tecnlógico de Bizkaia, Astondo Bidea, Edificio 609, 48160 Derio, Spain.
Appl. Nano 2023, 4(2), 159-177; https://doi.org/10.3390/applnano4020009
Submission received: 2 March 2023 / Revised: 19 April 2023 / Accepted: 26 May 2023 / Published: 31 May 2023
(This article belongs to the Topic Preparation and Application of Polymer Nanocomposites)

Abstract

:
The objective of this work was to prepare different concentrations of liposomes based on lecithin containing quercetin, and evaluate their effect on the properties of galactomannan films obtained from Cassia grandis seeds. Quercetin-loaded lecithin liposomes (QT-LL) were obtained by the ethanol injection method by incorporating quercetin in different concentrations in a previously prepared suspension of lecithin liposomes in water. Following characterization of QT-LLs by zeta potential and dynamic light scattering, QT-LL with 75 µg quercetin/mL suspension was incorporated at different concentrations in galactomannan films. The films obtained were characterized for color, solubility, moisture content (MC), water vapor permeability (WVP), scanning electron microscopy (SEM), X-ray diffraction (XRD), and Fourier-transform infrared (FTIR) spectroscopy. The size of lecithin liposomes with no quercetin was statistically than those containing quercetin above 50 µg/mL. All the QT-LLs presented a low polydispersity index, even considering their significant differences and similar values for zeta potential. The films displayed a rough surface and the galactomannan structure was confirmed by FTIR. Additionally, the amorphous nature of the polysaccharide was observed by XRD. The films were luminous, with a predominant yellow tendency and low opacity. The incorporation of QT-LL in galactomannan films did not lead to statistical differences for solubility and MC, while significant differences were observed for WVP. Galactomannan films were shown to be a promising structure for the incorporation of lecithin liposomes loaded with quercetin, pointing at promising applications for different applications.

1. Introduction

Natural or synthetic polymers are molecules whose chains are long enough to produce different scaffolds, such as films, membranes, and coatings. The preparation of films from biodegradable polymers has attracted the interest of the scientific community in recent years, mainly due to the importance given to the replacement of synthetic polymers. Films developed from polysaccharides act as excellent barriers to oxygen due to the packing of molecules, forming a structural network ordered through hydrogen bonds with potential for many applications; however, their hygroscopic characteristics can reduce this potential and should be studied [1].
Galactomannans are polysaccharides mainly found as an energy reserve in leguminous seeds, being composed of a central core of (1→4)-linked D-mannopyranose units to which (1→6)-linked D-galactopyranose units are attached. They are an essential hydrophilic material with a variety of properties, such as low- or non-toxicity, biodegradability, film forming capacity, and ready availability. The galactomannan obtained from the seeds of Cassia grandis collected in the northeast of Brazil was extensively characterized [2] and used for the production of films containing different concentrations of bioactive compounds [3]. Subsequently, the same galactomannan was reported to show the ability to accelerate the stages of wound healing and improve the remodeling of the extracellular matrix of topical wounds produced on rats [4].
Quercetin, chemically named as 3,3′,4′,5′-7-pentahydroxy flavone, is one of the most abundant flavonoids in plants. Despite the wide spectrum of its pharmacological properties, the use of quercetin in the pharmaceutical field is limited due to its low aqueous solubility and instability in physiological medium, resulting in poor bioavailability and permeability, in addition to instability, thus hindering its absorption through the skin. One way to circumvent these problems is to entrap/adsorb the quercetin into nanocarriers because of their ability to encapsulate hydrophobic and hydrophilic moieties [5].
The first-developed closed bilayer systems are called liposomes, which were also the first nanomedicines to enter the market and be applied to human patients [6]. Regarding their structure, liposomes are colloidal systems formed by the self-assembly of amphiphilic lipid molecules in solution; their polar head and long-chain hydrocarbon tail provide a unique configuration that is capable of encapsulating both hydrophilic and lipophilic molecules [7]. Because of this, they have found applications, for example, as antitumor [8,9] and anti-ischemic stroke neuroprotective [10] agents, in the management of psoriasis [11], as vaccines to combat COVID-19 [6], and also as an approach to improve quercetin delivery to the skin [12].
The most common methods for preparing liposomes require organic solvents, for example, ethanol and diethyl ether, complex multistage processes, and high energy costs. Despite the utilization of methods such as thin-film hydration, reverse-phase evaporation, and freeze-drying in industry, the technique extensively used in scaled-up manufacturing was the ethanol injection method followed by extrusion [13]. In the ethanol injection method, phospholipids are dissolved in ethanol and rapidly injected into water to produce liposomes; this leads to the formation of encapsulated vesicles without an external energy source [14].
Lecithin, a mixture of phospholipids of vegetable origin comprised mainly of phosphatidylcholine and phosphatidyl-ethanolamine, is considered a safe and biocompatible excipient for humans. It is commonly used in many formulations [15,16,17]; for example, Lecinova®, Lipoid S45, and Lipoid S75 are soybean-derived types of lecithin widely used in the development of liposomes as they are easily available and less expensive than the pure phospholipids [18]. More specifically, Lipoid S45 was recently used for the production of liposomes, by ethanol injection or otherwise, and suggested for different applications: the development of an innovative antifibrotic pirfenidone-loaded lecithin core nanocapsule [19]; the production of melatonin-loaded lecithin-chitosan nanoparticles as wound-healing agents in diabetic rats [20]; and the encapsulation of eugenol by spray-drying in lecithin and maltodextrin matrices for food applications [21]. However, to the best of our knowledge, no work has described the ethanol injection method for the development of quercetin-loaded liposomes.
Considering the above, the technological development of a simple, quickly-prepared, and nanometric vesicle of lecithin emerges as a promising strategy to deliver quercetin. In addition, the galactomannan from C. grandis could be considered an efficient support to immobilize the liposome for a prolonged period of time; due to the inherent characteristics of the polysaccharide and the ability to promote the controlled delivery of quercetin from the film, interesting applications can be suggested for the system. During this work, quercetin was incorporated in lecithin liposomes and characterized by particle size and zeta potential measurements, in addition to encapsulation efficiency and loading. The best nanometric formulation was incorporated in galactomannan films and the film´s properties were evaluated. Moisture content, solubility, water vapor permeability, water contact angle, color, FTIR, XRD, and SEM were performed on the films, aiming at the development of a matrix valuable for medicine and biology, especially in the nanopharmacology field.

2. Materials and Methods

2.1. Materials

Soya lecithin, type Lipoid S45 (fat free soybean lecithin with 45% phosphatidylcholine, agglomerates), was kindly provided by Lipoid (Ludwigshafen, Germany), and ethanol (99.8%) and quercetin ≥95% were purchased from Sigma-Aldrich (Steinheim, Germany). The pods of C. grandis were collected in Pernambuco state, Brazil, in the city of Recife (8°02′50.0″ S 34°57′00.1″ W). Acetone (PA) and sodium chloride were obtained from Vetec Fine Chemicals Ltd. (Rio de Janeiro, Brazil). The solvents used were of analytical grade and all other reagents were purchased from Sigma-Aldrich (Steinheim, Germany).

2.2. Development of the Liposomes

Liposomes were produced by the ethanol injection method. An amount of 2 mL of an ethanolic solution of Lipoid S45 (25 mg/mL) was injected, drop by drop, during 2 min, into 23 mL of distilled water under magnetic stirring (600 rpm). The suspension was left in magnetic stirring for 8 min and then submitted to a vigorous shaking on a Vortex mixer (Thermo Fisher Scientific, Langenselbold, Germany) for 2 min at room temperature (20 ± 2 °C). The developed system was called LL (lecithin liposome). The incorporation of quercetin at different concentrations (0–150 μg/mL) was performed by prior dissolution in the ethanolic solution of Lipoid S45 and subsequent addition into distilled water as described above. Finally, quercetin-loaded lecithin liposomes (QT-LLs) were named as described.
SampleQuercetin Diluted into the Ethanolic Solution of Lipoid S45 [µg/mL]
QT-LL 00
QT-LL 2525
QT-LL 5050
QT-LL 7575
QT-LL 100100
QT-LL 125125
QT-LL 150150

2.3. Quercetin Encapsulation Efficiency and Loading

The quercetin encapsulation efficiency [EE (%)] and loading [LC (%)] were conducted according to the modified procedures previously described by Souza et al. [22]. A sample of QT-LL was measured with a microplate reader (GENios, TECAN, Männedorf, Switzerland) at 373 nm, in order to obtain the total content of quercetin. The same volume of the QT-LL sample was ultracentrifuged at 180,000× g over 30 min and 4 °C (Micro-Ultracentrifuge Sorvall MTX 150, Thermo Fisher Scientific, Langenselbold, Germany), and the supernatant was accurately taken and measured with a microplate reader under the same conditions to obtain the amount of free quercetin. Then, the content of quercetin loaded into each QT-LL was calculated by subtracting the total content of quercetin and the amount of free quercetin. The encapsulation efficiency of quercetin [Equation (1)] and quercetin-loading (Equation (2)) were calculated by the following equations:
EE (%) = [(Wtotal − Wfree)/Wtotal] × 100,
LC (%) = [(Wtotal − Wfree)/Wvehicle] × 100,
where Wfree is the amount of quercetin loaded into each QT-LL; Wtotal is the total content of quercetin into the QT-LL; and Wvehicle is the liposome vehicle weight.

2.4. Physicochemical Characterization of the Liposomes

The hydrodynamic diameter (average size) and polydispersity index (PDI) of the liposomes were determined by dynamic light scattering (Zetasizer Nano ZS, Malvern Instruments, Malvern, UK). The samples were analyzed in a folded capillary cell. Detection of the scattered light was carried out at 173° (NIBS = non-invasive backscatter detection) and temperature of 25 °C. The zeta potential was measured by laser Doppler micro-electrophoresis using the same Zetasizer ZS Nano. The samples were filtered with 0.45 µm syringe filter (Minisart® High Flow, Sartorius, Gloucestershire, UK) to eliminate eventual particles above 450 nm and compared to the samples without filtering. At least five replicates were performed for each sample and the results were given as mean ± standard deviation of the obtained values.

2.5. Antioxidant Activity Assays

To performe the ferric reducing antioxidant power (FRAP), the method based on Benzie and Strain [23] was carried out with some modifications. Briefly, 10 μL of free quercetin and QT-LLs were mixed with 290 μL of FRAP reagent, which was freshly prepared by mixing 2,4,6-tris (1-pyridyl)-5-triazine 10 mM in 40 mM HCl with 20 mM FeCl3 solution and 0.3 M acetate buffer (pH 3.6) in the proportion of 1:1:10 (v/v/v). The mixture containing each sample and the FRAP reagent was then incubated at 37 °C for 15 min and the absorbance determined at 593 nm (Microplate reader, Bio-Rad Laboratories, Hercules, CA, USA). The calibration curve was prepared with ascorbic acid (AA) and expressed as equivalent of AA/μL of each sample. All determinations were performed in triplicate and expressed as mean ± standard deviation.
The antioxidant capacity of QT-LLs was also determined using the ABTS (2,2′- azino-bis(3-ethylbenzothiazoline-6-sulphonic acid) method according to Torres et al. [24]. Free quercetin and QT-LLs were added to the ABTS•+ solution and the decrease in absorbance was measured at 734 nm after 15 min in the dark. The calibration curve was prepared with Trolox and the ability to eliminate ABTS radicals (%) was calculated (Equation (3)) according to the formula:
ABTS radical elimination capacity (%) = [(AB − AS)/AB] × 100
where AB is the blank absorbance of Trolox and AS is the absorbance of each sample. All determinations were performed in triplicate and the results expressed as mean ± standard deviation.

2.6. Film Characterization

2.6.1. Film Preparation

The galactomannan contained in C. grandis seeds was obtained according to Albuquerque et al. [2], while the film forming solutions (FFSs) were prepared in accordance with the methodology described by Albuquerque et al. [3]. The FFS was prepared with 0.8% (w/v) of galactomannan and 0.2% (v/v) of glycerol under magnetic stirring (500 rpm) for 12 h, at room temperature. QT-LL 75 was chosen to be immobilized at different concentrations [0–0.5% (v/v)] in the FFSs (please see Section 3.1, Liposomes’ physicochemical characterization, for further explanation). The immobilization was made under magnetic stirring (500 rpm) for 2 h, at room temperature, and the obtained samples were named according to the respective amount (%, v/v) of QT-LL 75 added: A (0%), B (0.1%), C (0.2%), D (0.3%), E (0.4%), and F (0.5%). The samples were cast (15 mL) onto 90 mm diameter polystyrene Petri dishes and then dried in an oven at 33 °C for 24 h. Finally, the films were maintained at 20 °C and 54% relative humidity (RH) until further characterization.

2.6.2. Film Thickness

Film thickness was measured with a digital micrometer (No. 293–561, Mitutoyo, Nagoia, Japan). Five different randomly chosen points were performed on each film in order to obtain the values to be used in the calculations of water vapor permeability (WVP).

2.6.3. Scanning Electron Microscopy

The films’ Scanning Electron Microscopy (SEM) surface scans were performed on a scanning electron microscope (Quanta FEG 650, FEI Company, ThermoFisher Scientific, Hillsboro, OR, USA) with an accelerating voltage of 5 kV under vacuum conditions. Before analysis, all samples were mounted on aluminum stubs using carbon adhesive tape and sputter-coated with gold and then shredded.

2.6.4. Fourier-Transform Infrared (FTIR) Spectroscopy

The films (A–F) were characterized by FTIR on a Bruker FT-IR VERTEX 80/80 v (Boston, MA, USA) in Attenuated Total Reflectance mode (ATR) with a platinum crystal accessory between 400 and 4000 cm−1, a resolution of 4 cm−1 and 16 scans. Data analysis was performed with GraphPad Prism 5.00.288 (GraphPad Software, Inc., San Diego, CA, USA).

2.6.5. X-ray Patterns

An X-ray diffraction system (Malvern Panalytical Ltd., Malvern, UK) was used to evaluate the crystallographic structure. PANanalytical X’Pert HighScore Plus was the software used to gather data and analyze peak diffractions. Background noise was also measured. The powder sample was added to the glass slide through an adhesive glue and put on the sample holder for detection. The XRD diffractograms were acquired at room temperature; angular scans from 5° to 50° (2ϴ) were performed with a Cu source X-ray tube (° = 1.54056 Å) at 45 kV and 40 mÅ. For each sample, one measurement was performed. To determine the films’ crystallinity, the total diffracted area and the area under the crystallinity peaks were evaluated by integration after correcting the data for absorption. The ratio of the crystalline area to the total area was taken as the relative crystallinity.

2.6.6. Color and Opacity

Color and opacity were determined using a digital colorimeter (Konica Minolta, model Chroma Meter CR-400, Osaka, Japan) calibrated at illuminant C with a white standard. L* (L* = 0 (black) and L* = 100 (white)), a* (−a* = greenness and +a* = redness), and b* (−b* = blueness and +b* = yellowness) were the analyzed parameters, which are the ones recommended by the International Commission on Illumination. The film’s opacity (Y) was calculated as the ratio between the opacity of each sample on the black standard (Yb) and the opacity of each sample on the white standard (Yw). Five measurements were determined at random Yb and Yw and an average of them was used for calculations. The experiment was performed in triplicate and the results were expressed as a percentage and determined through Equation (4):
Y (%) = (Yb/Yw) × 100,

2.6.7. Moisture Content

MC was determined gravimetrically by drying the films at 105 °C in an oven with forced air circulation for 24 h. The results were expressed as the percentage of water removed from the initial mass sample. The experiments were performed in triplicate.

2.6.8. Solubility

The measurement of solubility was determined according to Albuquerque et al. [3]. Triplicates of each film were cut with a circular mold of 2 cm diameter and dried at 105 °C in an oven for 24 h until constant weight (W1). The films were placed in cups with 50 mL of distilled water, sealed over with parafilm and homogenized at 60 rpm for 24 h. The non-soluble part of each film was dried at 105 °C for 24 h and weighted again (W2). The solubility of the film samples was expressed as a percentage and calculated as follows (Equation (5)):
Solubility (S %) = [(W1 − W2)/W1] × 100,

2.6.9. Water Vapor Permeability (WVP)

WVP was determined gravimetrically based on ASTM E96-92. The film was sealed on top of a permeation cell containing distilled water (100% RH; 2337 Pa vapor pressure at 20 °C), and placed in a desiccator at 20 °C and 0% RH (0 Pa water vapor pressure) containing silica. The cells were weighed at intervals of 2 h for 10 h. Steady-state and uniform water-pressure conditions were assured by maintaining constant air circulation outside the test cell by using a miniature fan inside the desiccator. The slope of weight loss versus time was obtained by linear regression. Three replicates were obtained for each sample.

2.6.10. Contact Angle

Initially, the degree of hydrophilicity of the liposomes was measured by the sessile drop method in a face contact angle meter (OCA 20, Dataphysics, Filderstadt, Germany). The methodology was based on Mahaling and Katti [25] with some modifications. An amount of 1 mL of the liposome suspension was dropped on a glass slide to form a particle thin film and allowed to dry at room temperature in a desiccator. An amount of 500 µL of sterile water was dropped on the slides containing dried liposomes using a syringe (Hamilton, Domat/Ems, Switzerland) with a needle of 0.75 mm of diameter. Measurements were made in less than 5 s. Thirty replicates of contact angle measurements were obtained at 24.0 (±0.2) °C and ~65% RH, then calculated using the inbuilt software of the instrument. After that, contact angles for galactomannan-based films with different concentrations [0–0.5% (v/v)] of QT-LLs were evaluated as described above, in addition to a further measurement at 30 s to evaluate the pattern of hydrophobicity of the films.

2.7. Statistical Analyses

Statistical analyses were performed using Analysis of Variance (ANOVA) and linear regression analysis. The Tukey test (α = 0.05) was used to determine any significance of differences between specific means (GraphPad Prism 5.00.288, GraphPad Software, Inc., San Diego, CA, USA).

3. Results and Discussion

3.1. Liposomes’ Physicochemical Characterization

Table 1 presents the average size, PDI, and zeta potential of the produced QT-LLs. Regarding the results of average size, it can be noted that QT-LL 0 (control) presents statistically lower values (p < 0.05) when compared with those containing quercetin concentrations above 50 µg/mL, while for QT-LL 25 no difference (
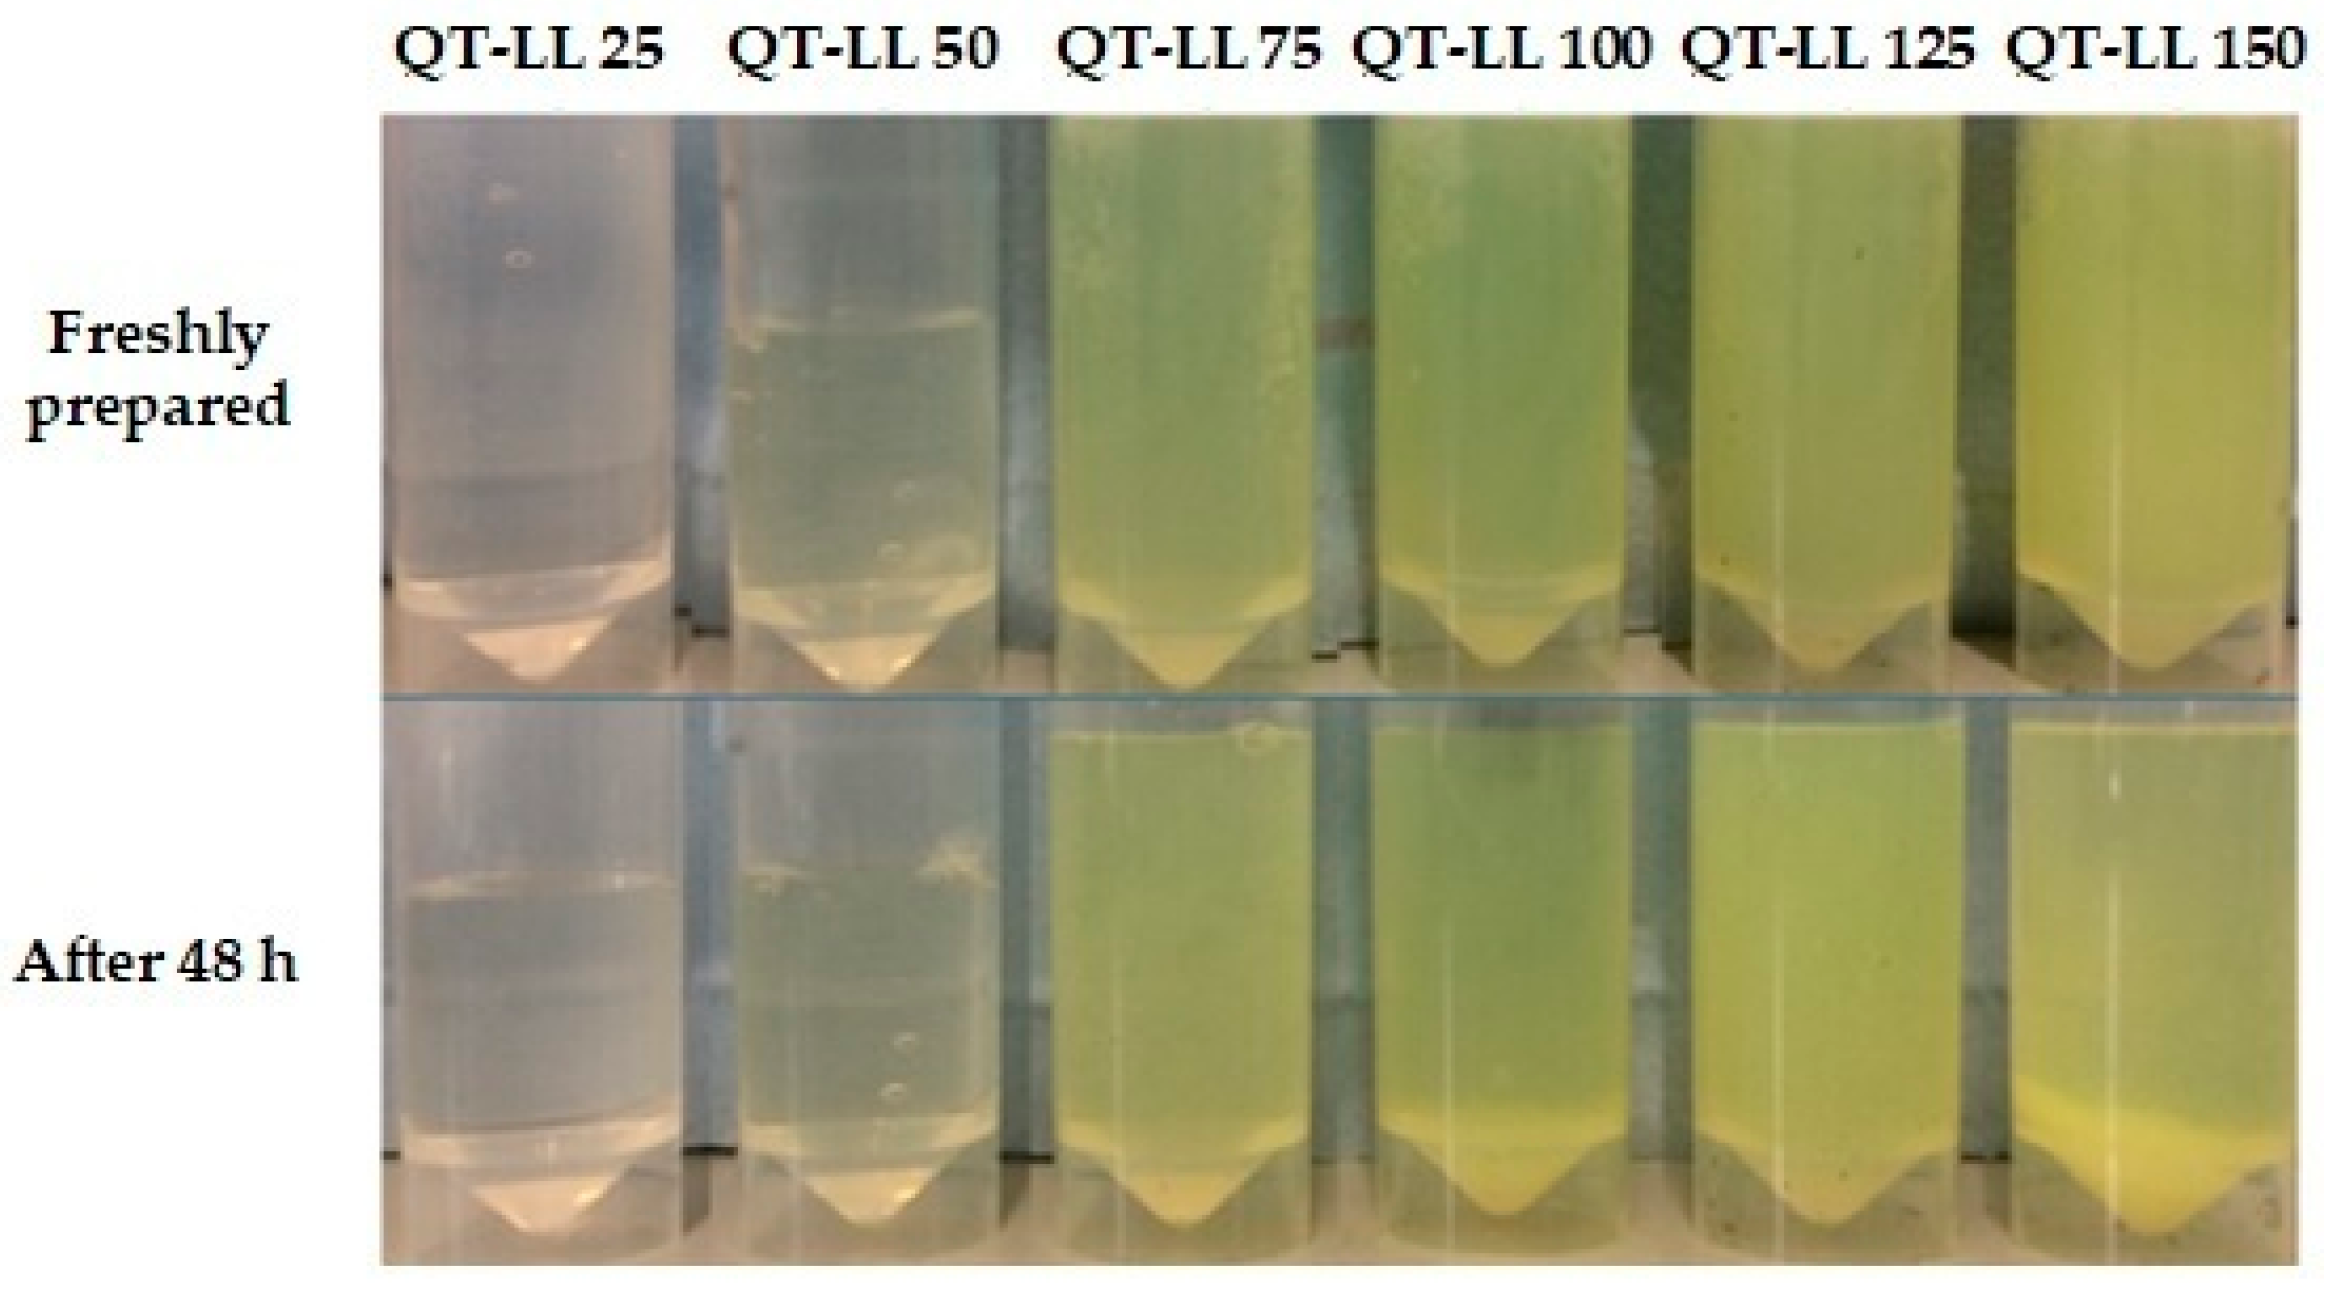
p > 0.05) was observed. In addition, increasing quercetin concentrations above 100 µg/mL led to higher values of average size. The results related to PDI showed that all samples presented a low PDI (≤0.29) even considering their significant differences. All QT-LLs presented zeta potential values around −45 mV with no statistical differences; regarding these values, it is possible to say that the encapsulation of quercetin does not influence the surface of the liposomes. LLs 0, 25, 50, and 75 were homogeneous; however, QT-LLs 100, 125, and 150 showed signs of instability (precipitation): QT-LL 100 and 125 after 72 h, and QT-LL 150 after 48 h of observation (Figure 1).
It is known that smaller particles present a higher exposed surface area which can lead to a faster release of encapsulated drugs; however, smaller particles also have an increased risk of aggregation during storage. In view of this, it is important to produce liposomes with adequate size (<200 nm) and low values of PDI, thus reaching maximum stability by a good control of particles’ size. It is also important to mention that the reproducibility of parameters such as stability and release is directly connected to a low PDI (≤0.4), since a high PDI means that there is no uniformity in the size distribution of the sample [21]. In relation to the zeta potential parameter, results around ± 45 mV of surface charge can positively influence its stability through electrostatic repulsion among the liposomes. In the present study, the negative charge demonstrated by zeta potential could be associated to the phosphate groups of the mixture of phospholipids composing the lecithin (Lipoid S45).
This behavior was also reported by Gibis, Vogt, and Weiss [26] for 1% (w/v) lecithin liposomes, which had negative surface charges regardless of the exposure to different pH values; the magnitude of surface charges decreased from −21.8 at pH 3 to −57.7 at pH 11. More recently, Talón et al. [21] also reported a zeta potential value of −45.7 mV for liposomes based on lecithin and maldodextrin. This charge was inverted when chitosan was incorporated into the system, leading to a zeta potential of +61.5 mV. Our zeta potential results were not influenced by the amount of quercetin loaded in lecithin liposomes, However, a different pattern was observed for average size values; increasing the concentration of quercetin resulted in decreased stability of QT-LLs.

3.2. Antioxidant Activity Assays

Antioxidant activity is a key parameter of the antioxidant capacity of a compound; in this sense, its measure aids the understanding of the functional property of a compound, whether free-exposed or encapsulated, for example, in nanocarrier systems [24]. The antioxidant activity of QT-LLs was determined in comparison to the free quercetin samples by FRAP and ABTS methods (Table 2).
In relation to FRAP results, free quercetin was more effective in reducing Fe3+ to Fe2+ in comparison to QT-LLs (p < 0.05), achieving values around four-fold higher than the reducing power of the liposomes for all of the tested concentrations. For ABTS results, the antioxidant capacities of QT-LLs 25 and 50 could be disregarded because of the low percentage when compared to free quercetin at the same concentrations. When comparing the % inhibition of quercetin at 75 μg/mL concentration between free quercetin (36.03 ± 0.18%) and QT-LL 75 (28.05 ± 0.18%), there was a decrease in this difference, and the antioxidant capacity of the liposome presented a value 1.2 times lower than the other. The results of antioxidant capacity for both free quercetin and QT-LLs containing quercetin above 100 μg/mL of concentration were quite similar. For example, QT-LL 150 showed an antioxidant capacity of 55.49 ± 3.07%, while free quercetin at 150 μg/mL concentration was 48.21 ± 3.68%. Regarding the differences in the antioxidant activities between free quercetin and QT-LLs, it is important to mention, again, our simple and quickly-prepared method of production, in which QT-LLs 75–150 reached values of antioxidant capacity very close to those of free quercetin. Additionally, higher antioxidant capacities for QT-LLs 75–150 could be explained by an improvement in the dissolution pattern of quercetin in the aqueous medium as the concentration of encapsulated quercetin increases [21].
Greater antioxidant activities of free molecules were also observed, for example, by Talón et al. [21] working with the encapsulation of eugenol by spray-drying in lecithin and maltodextrin matrices. Pure eugenol showed the best antioxidant activity when compared to emulsions based on lecithin as wall material, with or without oleic acid as a carrier agent, and chitosan as a coating. It is important to mention that the ethanol injection method used here is faster and simpler than other methods reported in the scientific literature: magnetic stirring (<1000 rpm) and approximately 20 min can produce liposomes with small particle sizes and good monodispersed properties. The lower antioxidant activities of QT-LLs than free quercetin could be due to the partial oxidation of the compound during this simple process.

3.3. Quercetin Encapsulation Efficiency (EE %) and Loading Content (LC %)

EE % and LC % of the compound depends on its solubility in the matrix [27]. Figure 2A shows that EE % of quercetin into liposomes presented better values for concentrations above 75 μg/mL, while Figure 2B demonstrates that LC% for QT-LLs from 0 to 75 μg/mL of quercetin were quite similar. QT-LLs containing quercetin above 100 μg/mL of concentration resulted in improved LC%. The encapsulation efficiency of quercetin in other nanocarrier systems reached higher values than the presented ones; for example, EE % of quercetin into lecithin/chitosan nanoparticles presented values higher than 95% for concentrations varying from 50 to 100 μg/mL [5], while EE % of quercetin in cholesterol liposomes coated with chitosan and sodium tripolyphosphate was 91 ± 1% [28]. This difference may be related to the structure of the mentioned systems. Regarding the results for lecithin/chitosan nanoparticles, the association of both molecules was strongly influenced by its hydrophobic nature; consequently, a larger amount of quercetin was inserted into the lipid nuclei of the nanoparticles and only a small amount of quercetin was lost in the aqueous phase during the preparation process. In relation to cholesterol liposomes, the free quercetin could be embedded in the three-dimensional polyelectrolyte shell of chitosan during the coating and cross-linking process.
Concerning the results of our simple and fast-prepared liposome composed only with lecithin, the system presents stability even in the absence of a coating. This is expected, since the ethanol injection method produces single bilayered liposomes with a smaller particle size and good monodispersion without sonication, extrusion or homogenization by Rotor Stator [5]. Another advantage of liposomes produced by the ethanol injection method is that they function as transfection delivery vectors. Because of this, we believe that the delivery of quercetin from liposomes can be suggested for future research, especially in relation to the nanopharmacology field.
In view of the information already demonstrated in Section 3.1 about formulations containing more than 75 μg/mL of quercetin showing signs of instability, the liposome with 75 μg/mL of quercetin (QT-LL 75) was chosen for further analyses.

3.4. Films’ Characterization

Regarding the information already mentioned in Section 3.1 and Section 3.3, all of the analyses in this very section were conducted by using QT-LL 75 immobilized at different concentrations [0–0.5% (v/v)] in galactomannan-based films.

3.4.1. Scanning Electron Microscopy (SEM)

SEM allows the visualization of the surface morphology of QT-LL 75 and the films; additionally, the distribution of the immobilized QT-LL 75 at different concentrations could be observed in the microstructure of each film matrix.
It is possible to observe in Figure 3 that QT-LL 75 presents an irregular spherical shape, while all of the film’s surface is rough; in addition, the roughness is increased by increasing the concentration of immobilized QT-LL 75 from 0 to 0.5% (v/v). We hypothesize that QT-LL 75 is immobilized on the surface of the films, embedded between the chains of the galactomannan, and the higher concentrations of the immobilized liposome influenced the voluminous appearance of the films. Indeed, the presence of QT-LL 75 could be visualized even immobilized in different concentrations. Despite the absence of QT-LL 75 in the control film (sample A), a few granules are evident which could be related to contaminating residues remaining from the galactomannan extraction.
Regarding other research dealing with nanocarriers and polymeric films, many differences about the immobilized compounds into the microstructure of the films have been reported. For instance, working with lactoferrin, bioactive peptides, and phytosterols, Albuquerque et al. [3] reported that the immobilization of these bioactive compounds in galactomannan films derived from C. grandis led to films with roughness on their surface. González et al. [29] developed nanofibers obtained from soybean hulls and pods and used these low-cost agro-industrial by-products as nano-reinforcers of soy protein films; they observed that the surface for the film with the highest number of nanofibers was rougher when compared with the films without them. Bionanocomposite films of konjac glucomannan were prepared by Wu et al. [30] as immobilization matrices for chitosan/gallic acid nanoparticles. Again, the authors observed that the films’ surface became less homogeneous with visible microcracks or discontinuous void when higher amounts of nanoparticles were incorporated into the matrix.

3.4.2. Fourier-Transform Infrared (FTIR) Spectroscopy

FTIR was used for the evaluation of possible chemical interactions and modifications in the structure of galactomannan-based films containing QT-LL 75 at different concentrations (Figure 4).
All spectra were quite similar to each other; indeed, the superposition of the spectra confirms that the immobilization of QT-LL 75 in different concentrations did not alter the structure of the films. The absorption peaks associated to the assigned regions are in agreement with those reported by Albuquerque et al. [2] working for the first time with the C. grandis galactomannan. Region 1 is related to absorption peaks between 3500–3100 cm−1, which is characteristic of a carbohydrate ring and represents hydroxyl stretching vibration of polysaccharides and water involved in hydrogen bonding. Region 2 is comprised of absorptions between 3000–2800 cm−1 and represents the stretching vibration of the methylene group (C–H) [31]. Region 3 arose from the bending vibration of water molecules, while region 4 contains bands between 1376 and 1378 cm−1 related to symmetrical deformations of the CH2 and COH groups [32]. Region 5 is associated with absorption peaks of 1021–1023 cm−1 that are consistent with C–H vibrations [33]. Regions 6 and 7 indicate absorption peaks at 870–874 cm−1 and 810–812 cm−1 that are associated with the presence of anomeric α and β configurations and glycosidic linkages, attributed to β-D-mannopyranose units and α-D-galactopyranose units, respectively [2,3,34,35].
The literature reports quercetin showing FTIR bands and typical molecular peaks around 1380 cm−1 (COH), 1610 cm−1 (CC), 1264 cm−1 (COC), 1662 cm−1 (CO), and 3403 cm−1 (OH stretch). The recorded spectra showed no characteristic peaks of quercetin, which may be indicative of quercetin encapsulation in lecithin-liposomes [22,27]. In relation to lecithin, the strong peaks reported by the literature are 1737 and 1245 cm−1, which are associated to CO and PO stretching vibrations; again, they were not shown in the recorded spectra. This phenomenon revealed that quercetin might be associated with lecithin by hydrogen bonding or hydrophobic effects [36] and does not influence the structure of the films. Even considering this information, it is important to mention that the presence of QT-LL 75 slightly shifted the peak of hydrogen bonds for B–F films (region 1), implying that soft hydrogen bonding was generated among quercetin-loaded lecithin liposomes and the film matrix.

3.4.3. X-ray Patterns

In this study, all of the films (A–F) presented a broad peak around 2θ = 20°, characteristic of amorphous structures (Figure 5). The degree of crystallinity (%), or crystallinity index, was calculated by considering the total diffracted area and the area under the crystallinity peaks; after integration and correction of the data for absorption, the ratio of the crystalline area to the total area was obtained and considered as the crystallinity index (%). The obtained values for A, B, C, D, E, and F were 0.71, 2.37, 1.89, 2.33, 6.79, and 1.41%, respectively. These results are similar to those obtained by Albuquerque et al. [2] in the first study about the galactomannan obtained from the seeds of C. grandis collected in Pernambuco, Brazil. Other studies also showed low overall crystallinity for polysaccharide characterization by XRD; for example, water-soluble polysaccharides from potato peel [37] and chickpea flour [38].
The scientific literature reports the XRD pattern for lecithin as peak around 2θ = 20°, suggesting its amorphous characteristic [39,40]. In our case, it is not possible to claim a superimposition of the individual patterns of galactomannan and lecithin due to the low crystallinity of both of them. Concerning the crystallinity pattern expected for quercetin, one can suggest that weak interactions occur between quercetin and the film matrix. The absence of peaks corresponding to pure quercetin indicates that the flavonoid mainly exists dispersed in a non-crystalline state within the film matrix [41], which is in agreement with the results already mentioned by SEM and FTIR.

3.4.4. Color and Opacity

Color and opacity are important features for the acceptance of products by the pharmaceutical or food industry. Therefore, the measurement of the color of products potentially valuable for the industry is an important point of the physical characterization. Table 3 presents the color parameters and opacity of the films with immobilized QT-LL 75 at different concentrations. All of the films were strongly luminous, represented by L* coordinate values, with a tendency to yellowness, represented by b* coordinates; for those parameters, the films did not present statistically significant differences among them and were quite similar to the films produced with the C. grandis galactomannan with immobilized bioactive compounds [3]. Similar values of the L* coordinate (around 96.4) were reported for films based on Delonix regia galactomannan with different molecular weights and interaction with k-Carrageenan [31]; however, our films showed a greater yellowness when compared to b* values around 2.43 and 4.39, respectively, for the galactomannan films and those composed of galactomannan and k-carrageenan. The film produced with the galactomannan obtained from Gleditsia triacanthos was less bright (as represented by L* of 78.20 ± 0.39) and almost twice as yellow (represented by b* of 14.55 ± 0.60) as all of our films. Blended films composed of this galactomannan and soy protein led to a reduction in L* and an increase in the b* parameters, which may be associated with the natural color of the solutions prepared from the yellowish powder extract of G. triacanthos, and also related to Maillard reactions between the components [42].
Regarding the a* parameter, values close to zero demonstrate that films tend to a green color besides its slight tendency to redness; also, the presence of QT-LL 75 at 0.5% (F) decreased (p < 0.05) the red appearance of the film when compared to the control film. These results are in agreement with those reporting the immobilization of quercetin in a chitosan-based film [43]. A tendency to greenness was also reported for the galactomannan film from G. triacanthos (represented by a* of 1.29 ± 0.09) [42], and Tara gum films with (a* around −2.18) or not incorporated chitosan (a* of −1.29 ± 0.09) and chitosan nanoparticles (a* around −2.23) [44].
All studied films presented low opacity values, with no significant differences between them. In comparison with Y results for films based on D. regia galactomannan with different molecular weights (around 9.97) [33], our films we shown to be opaquer (around 12.39) besides their evident transparency. On the other hand, the film molded with the galactomannan extracted from G. triacanthos [42] presented incomparable transparency with Y 18-fold lower than our films.

3.5. Film Thickness, Moisture Content (MC), Solubility (S %), Water Vapor Permeability (WVP), and Contact Angle (CA)

The moisture-binding abilities of films can affect significantly their physical and barrier properties; thus knowledge of the content and affinity of the film matrix to water is a key parameter when choosing a film for specific applications. Table 4 shows the values of thickness, moisture content (MC), solubility (S %), and water vapor permeability (WVP) of the control film and the films with QT-LL 75 immobilized in different concentrations (B–F).
The incorporation of different concentrations of QT-LL 75 in galactomannan-based films did not lead to statistical differences (p > 0.05) for thickness, MC, and S %; in addition, these values were similar to those reported by [3] working with similar galactomannan-based films. Other authors have reported values of thickness and discussed its importance in the characterization of galactomannan films or blends containing galactomannans. For example, films based on D. regia galactomannan with different molecular weight and interaction with k-carrageenan presented values of thickness between 37 and 59 µm [31], while the galactomannan extracted from G. triacanthos and its combination with soy protein isolates showed thickness of 76 ± 8 and 106 ± 3 µm, respectively [42]. Therefore, variations in thickness values could be observed when molecular interactions occur between the components of the blend, and also caused by acid solvents used in the preparation of the components [45].
Modifications in the MC can affect the physicochemical and thermomechanical properties of the films; the addition of glycerol is one of the main modifiers, which is explained by its hydrophilic nature and the attraction of water into the polymer matrix, thus creating more mobile regions with greater inter-chain distances in the polymer matrix [44,46]. Our results showed that the films’ MC were around 22% and the addition of QT-LL 75 did not influence this parameter; however, a different behavior was observed for the same galactomannan film incorporating 0.2% of lactoferrin (15.67 ± 5.51%) [3]. According to the authors, the decreased MC values could be associated with the fact that lactoferrin presents both hydrophilic and hydrophobic parts in its conformation; the higher concentration of lactoferrin into the film may reduce the availability of hydroxyl groups to interact with water, resulting in decreased MC values. Tara gum (TG) films and nanocomposites, in this case chitosan nanoparticles incorporated in TG films, also presented lower values of MC, respectively, 14 and 13%. The authors explained that the nanocomposites presented a more compact matrix, which allowed them to occupy more free volume into the polymeric structure, thus reducing MC values [44]. Other works reported MC values similar to the ones of this work; for example, 31.01 ± 0.80% for chitosan-based films, 21–7% for chitosan films incorporated with different amounts of black soybean seed coat extract [47], and 14–7% for chitosan films neutralized with citrate and acetate buffers, added or not with glycerol [45].
The values of the films’ solubility were approximately 70% and this was not influenced by the addition of QT-LL 75 in different concentrations. This great solubility behavior was also observed for films produced with D. regia galactomannan with different molecular weights (between 69 and 76%) [31]. In this same work, the galactomannan was blended with k-carrageenan and all of the obtained films presented 100% solubility, which was considered to be a result of the k-carrageenan sulphate functional groups which can form hydrogen bonds with water molecules helping to disrupt the film and increasing its solubility. The solubility of Tara gum films was 24% and different when compared to our results; and the addition of chitosan and chitosan nanoparticles (both at 15% w/w content) significantly decreased the films’ solubility (%) to 10.37 ± 2.31 and 6.16 ± 1.17, respectively [44]. The quercetin-loaded lecithin liposomes used in this work have average sizes ranging from 93 to 131 nm, different from the chitosan nanostructures used in the above-mentioned work (180.25 nm). The average size, in addition to the strong interaction between chitosan nanoparticles and Tara gum chains, may have influenced the Tara gum film structure, justifying the differences obtained for S % when compared to our galactomannan-based films.
WVP values ranged from 7.27 ± 0.80 (A) to 11.41 ± 1.05 × 10⁻⁷ (D) g/(h·m·Pa). The presence of QT-LL 75 at 0.2% (C), 0.3% (D), and 0.5% (F) significantly increased (p < 0.05) the WVP results, leading to values up to 1.9-fold higher than the galactomannan-based film without liposome (A). On the other hand, the WVP values of B and E films were similar to the control film. According to Antoniou et al. [48], the hydrophilic pattern and the water attracted into the film contribute to create regions of higher water mobility, with greater inter-chain distances in the galactomannan film. In view of this, it is possible to consider that these WVP results are in agreement with those of MC and S, confirming the hydrophilicity of all of the films. Indeed, the differences in WVP values of films C, D, and F can be associated with the irregular surface of the film, as reported by SEM results (Section 3.4.1). Since the liposomes are immobilized on the surface of the films, the free spaces release a passage of water vapor through the chains of the galactomannan; thus, we hypothesize that the increase in WVP values occurs due to a lower compression of the film matrix, resulting in a modified diffusivity.
The water vapor pattern demonstrated by our films was also reported by other authors working with galactomannans; for instance, WVP values for films produced with the C. grandis galactomannan and different bioactive molecules ranged from 5.60 ± 0.39 to 22.43 ± 0.21 × 10⁻⁷ g/(h·m·Pa) [3], while those for films produced with D. regia galactomannan with different molecular weights varied between 7.55 and 12.70 × 10⁻¹¹ g/(s.m.Pa) [31]. Easy water-vapor permeation was demonstrated for Tara gum films and associated with the high glycerol concentration used in the film-forming solution [44]; however, when chitosan and chitosan nanostructures were added to the galactomannan-based films, they decreased WVP values in a different manner than what was demonstrated for our films with incorporated quercetin-loaded lecithin liposomes. According to the authors of the above-mentioned study, the chitosan nanoparticles have a greater ability to occupy the empty spaces of the porous film matrix, thus creating a more compact structure in the films and impairing the permeation of water, which is associated with decreased WVP results. Similar decreases in WVP values were reported when chitosan film incorporated different amounts of black soybean seed coat extract [47], carvacrol extract [49], and apple polyphenol [50]; in this case, reduced WVP values could be related to the compact and dense networks formed through intermolecular interactions between the immobilized molecules and chitosan chains.
The determination of the contact angle (CA) is a simple way to evaluate the degree of hydrophobicity of a material layered on a surface or immobilized on a ready surface. Commonly, CA values lower than 90° are related to hydrophilic materials [3,51]. CA for all of the films (A–F) was measured at 5 s and additionally 30 s in order to understand the pattern of hydrophobicity of the films over time. The results demonstrate that all of the films were essentially hydrophobic with no statistical differences between them, including when analyzed over time (Table 5). The distribution of QT-LL 75 on the surface of the films was quite homogeneous and did not statistically influence CA values, as confirmed by S% and MC results (Table 4). The C. grandis galactomannan film reported by Albuquerque et al. [3] presented a lower CA, being considered more hydrophilic than any of the films in this study. Considering that the same source of galactomannan was used in both studies, it is possible to predict that different procedure conditions, the period of study, and environmental conditions could have influenced the final films. However, as mentioned by the authors, this difference can be useful for specific applications, since the relatively hydrophobic pattern of the film allows the graduated delivery of immobilized compounds by helping them to remain in the film until the complete solubilization of the matrix.
Other works evaluated the hydrophobic character of films produced by polymers from different sources. For example, nanofibers obtained from low-cost agro-industrial by-products (soybean hulls and pods) were used as reinforcers of soy protein films. The authors performed an extensive characterization and reported a reduction in the hydrophilicity of the reinforced films’ surface, as revealed by higher CA values; they also suggested that it occurred due to the interactions between components and attributed this effect to the properties of the nanomaterials [29]. The film-forming properties of the galactomannan fraction extracted from G. triacanthos and its ability to improve the properties of soy protein films were also evaluated [42]. The results revealed that the galactomannan film had a more hydrophobic surface when compared to the pure soy protein film; however, a synergic effect was achieved by the combination of both components, probably derived from their interactions. In addition, the correlation of WVP with the contact angle was inferred, and they reported that the more hydrophobic surface led to a smaller WVP, as noted in our work.
Considering the above-mentioned results, it is possible to state that quercetin has been successfully encapsulated in lecithin liposomes by a simple technique were we used a low concentration of lecithin (Lipoid S45 at 25 mg/mL), which was injected, drop by drop, during only 2 min, in 23 mL of distilled water under magnetic stirring (600 rpm). This suspension was left in magnetic stirring for a further 8 min and then submitted to a vigorous shaking on a simple mixer for 2 min at room temperature. Other references also used ethanol injection and similar phospholipids; however, significant differences in technique could be seen:
(1)
Higher concentration of phospholipids, for example, the 60 mg/mL of Lecinova® or Lipoid S75 used for the development of liposomes by Gil et al. [18];
(2)
Other reagents and sophisticated equipment, as mentioned by AbouSamra, Elgohary, and Mansy [19] on the development of pirfenidone-loaded lecithin core nanocapsules, which included Span 60, Tween 80, and chloroform, in addition to a homogenizer that reached more than 20,000 rpm;
(3)
Longer experimental period, for example the stirring overnight of the suspensions containing whey lecithin, maltodextrin, eugenol, oleic acid, and chitosan; these suspensions also required a high-pressure homogenizer for complete homogenization [21].

4. Conclusions

Quercetin was successfully encapsulated in lecithin liposomes using a simple and fast technique based on the ethanol injection method. From a pharmaceutical point of view, the results obtained in this study are valuable for the design and fabrication of liposomes as a delivery system for quercetin. Additionally, galactomannan-based films from C. grandis proved to be a promising structure for the immobilization of quercetin-loaded lecithin liposomes, thus prolonging the availability of quercetin and its biological activities. Therefore, the knowledge derived from this investigation could facilitate the encapsulation, protection, and delivery of quercetin in products suggested for the nanopharmacology field, including personalized dosage forms for skincare. However, further delivery studies, and also in vitro and in vivo evaluations, are necessary to understand transdermal delivery regarding drug permeation, drug loading, and stability of quercetin-loaded lecithin liposomes.

Author Contributions

P.B.S.d.A. was responsible for the investigation, methodology, and the original writing of the manuscript. M.P.d.S., M.A.C. and A.I.B. were responsible for the analysis and interpretation of the results, and M.A.C. supervised and contributed to the writing and the revision of the manuscript. L.P., P.J., J.A.T. and M.d.G.C.-d.-C. were responsible for the research concept, and the experimental design. J.A.T. and M.d.G.C.-d.-C. were also responsible for the funding acquisition. All authors have read and agreed to the published version of the manuscript.

Funding

This study was supported by the Coordenação de Aperfeiçoamento de Pessoal de Nível Superior (CAPES) and the Portuguese Foundation for Science and Technology (FCT) under the scope of the strategic funding of UID/BIO/04469/2013 unit and COMPETE 2020 (POCI-01-0145-FEDER-006684) and under the scope of the Project RECI/BBB-EBI/0179/2012 (FCOMP-01-0124-FEDER-027462). P.A. receipted a scholarship from CAPES. M.d.G.C.-d.-C. express her gratitude to the Conselho Nacional de Desenvolvimento Científico e Tecnológico (CNPq) for research grants and fellowship. The authors acknowledge CNPq and CAPES for financial support.

Data Availability Statement

Data supporting reported results of this work are contained within the article. The data presented in this study are available in the following articles: “Cross-linked chitosan/liposome hybrid system for the intestinal delivery of quercetin”, “Immobilization of bioactive compounds in Cassia grandis galactomannan-based films: Influence on physicochemical properties”, “Delonix regia galactomannan-based edible films: Effect of molecular weight and k-carrageenan on physicochemical properties”, “Development of edible films prepared by soy protein and the galactomannan fraction extracted from Gleditsia triacanthos (Fabaceae) seed”, and “Preparation and characterization of konjac glucomannan-based bionanocomposite film for active food packaging”.

Acknowledgments

The authors acknowledge the University of Minho and University of Reading for analytical support.

Conflicts of Interest

The authors declare no conflict of interest.

References

  1. Albuquerque, P.B.S.; de Oliveira, W.F.; Silva, P.M.D.S.; Correia, M.T.D.S.; Kennedy, J.F.; Coelho, L.C.B.B. Epiphanies of well-known and newly discovered macromolecular carbohydrates—A review. Int. J. Biol. Macromol. 2020, 156, 51–66. [Google Scholar] [CrossRef] [PubMed]
  2. Albuquerque, P.B.; Barros, W.; Santos, G.R.; Correia, M.T.; Mourão, P.A.; Teixeira, J.A.; Carneiro-Da-Cunha, M.G. Characterization and rheological study of the galactomannan extracted from seeds of Cassia grandis. Carbohydr. Polym. 2014, 104, 127–134. [Google Scholar] [CrossRef] [PubMed] [Green Version]
  3. Albuquerque, P.B.; Cerqueira, M.A.; Vicente, A.A.; Teixeira, J.A.; Carneiro-Da-Cunha, M.G. Immobilization of bioactive compounds in Cassia grandis galactomannan-based films: Influence on physicochemical properties. Int. J. Biol. Macromol. 2017, 96, 727–735. [Google Scholar] [CrossRef]
  4. Albuquerque, P.B.; Soares, P.A.; Aragão-Neto, A.C.; Albuquerque, G.S.; Silva, L.C.; Lima-Ribeiro, M.H.; Neto, J.C.S.; Coelho, L.C.; Correia, M.T.; Teixeira, J.A.; et al. Healing activity evaluation of the galactomannan film obtained from Cassia grandis seeds with immobilized Cratylia mollis seed lectin. Int. J. Biol. Macromol. 2017, 102, 749–757. Available online: http://linkinghub.elsevier.com/retrieve/pii/S0141813017304683 (accessed on 1 February 2023). [CrossRef] [PubMed]
  5. Gouda, A.; Sakr, O.S.; Nasr, M.; Sammour, O. Ethanol injection technique for liposomes formulation: An insight into development, influencing factors, challenges and applications. J. Drug Deliv. Sci. Technol. 2021, 61, 102174. [Google Scholar] [CrossRef]
  6. He, Y.; Zhang, W.; Xiao, Q.; Fan, L.; Huang, D.; Chen, W.; He, W. Liposomes and liposome-like nanoparticles: From anti-fungal infection to the COVID-19 pandemic treatment. Asian J. Pharm. Sci. 2022, 17, 817–837. [Google Scholar] [CrossRef]
  7. Imura, T.; Otake, K.; Hashimoto, S.; Gotoh, T.; Yuasa, M.; Yokoyama, S.; Sakai, H.; Rathman, J.F.; Abe, M. Preparation and physicochemical properties of various soybean lecithin liposomes using supercritical reverse phase evaporation method. Colloids Surf. B Biointerfaces 2003, 27, 133–140. [Google Scholar] [CrossRef]
  8. Zahednezhad, F.; Zakeri-Milani, P.; Mojarrad, J.S.; Sarfraz, M.; Mahmoudian, M.; Baradaran, B.; Valizadeh, H. Acetyl carnitine modified liposomes elevate cisplatin uptake in macrophage and cancer cells. J. Drug Deliv. Sci. Technol. 2023, 81, 104198. [Google Scholar] [CrossRef]
  9. Zhang, L.; Lin, Z.; Chen, Y.; Gao, D.; Wang, P.; Lin, Y.; Wang, Y.; Wang, F.; Han, Y.; Yuan, H. Co-delivery of Docetaxel and Resveratrol by liposomes synergistically boosts antitumor efficiency against prostate cancer. Eur. J. Pharm. Sci. 2022, 174, 106199. [Google Scholar] [CrossRef]
  10. Yu, S.; Li, D.; Shi, A.; Long, Y.; Deng, J.; Ma, Y.; Li, X.; Wen, J.; Hu, Y.; He, X.; et al. Multidrug-loaded liposomes prevent ischemic stroke through intranasal administration. Biomed. Pharmacother. 2023, 162, 114542. [Google Scholar] [CrossRef]
  11. Fereig, S.A.; El-Zaafarany, G.M.; Arafa, M.G.; Abdel-Mottaleb, M.M. Self-assembled tacrolimus-loaded lecithin-chitosan hybrid nanoparticles for in vivo management of psoriasis. Int. J. Pharm. 2021, 608, 121114. [Google Scholar] [CrossRef]
  12. Hatahet, T.; Morille, M.; Hommoss, A.; Devoisselle, J.-M.; Müller, R.; Bégu, S. Liposomes, lipid nanocapsules and smartCrystals®: A comparative study for an effective quercetin delivery to the skin. Int. J. Pharm. 2018, 542, 176–185. [Google Scholar] [CrossRef] [PubMed]
  13. Shah, S.; Dhawan, V.; Holm, R.; Nagarsenker, M.S.; Perrie, Y. Liposomes: Advancements and innovation in the manufacturing process. Adv. Drug Deliv. Rev. 2020, 154–155, 102–122. [Google Scholar] [CrossRef] [PubMed]
  14. Kanda, H.; Katsube, T.; Wahyudiono; Goto, M. Preparation of Liposomes from Soy Lecithin Using Liquefied Dimethyl Ether. Foods 2021, 10, 1789. [Google Scholar] [CrossRef] [PubMed]
  15. Płaczek, M.; Wątróbska-Świetlikowska, D.; Stefanowicz-Hajduk, J.; Drechsler, M.; Ochocka, J.R.; Sznitowska, M. Comparison of the in vitro cytotoxicity among phospholipid-based parenteral drug delivery systems: Emulsions, liposomes and aqueous lecithin dispersions (WLDs). Eur. J. Pharm. Sci. 2018, 127, 92–101. [Google Scholar] [CrossRef]
  16. Savić, V.; Ilić, T.; Nikolić, I.; Marković, B.; Čalija, B.; Cekic, N.; Savic, S. Tacrolimus-loaded lecithin-based nanostructured lipid carrier and nanoemulsion with propylene glycol monocaprylate as a liquid lipid: Formulation characterization and assessment of dermal delivery compared to referent ointment. Int. J. Pharm. 2019, 569, 118624. [Google Scholar] [CrossRef]
  17. Vater, C.; Hlawaty, V.; Werdenits, P.; Cichoń, M.A.; Klang, V.; Elbe-Bürger, A.; Wirth, M.; Valenta, C. Effects of lecithin-based nanoemulsions on skin: Short-time cytotoxicity MTT and BrdU studies, skin penetration of surfactants and additives and the delivery of curcumin. Int. J. Pharm. 2020, 580, 119209. [Google Scholar] [CrossRef]
  18. Gil, K.A.; Jerković, I.; Marijanović, Z.; Manca, M.L.; Caddeo, C.; Tuberoso, C.I.G. Evaluation of an innovative sheep cheese with antioxidant activity enriched with different thyme essential oil lecithin liposomes. LWT 2021, 154, 112808. [Google Scholar] [CrossRef]
  19. AbouSamra, M.M.; Elgohary, R.; Mansy, S.S. Innovated pirfenidone loaded lecithin nanocapsules for targeting liver fibrosis: Formulation, characterization and in vivo study. Int. J. Pharm. 2023, 631, 122539. [Google Scholar] [CrossRef]
  20. Correa, V.L.R.; Martins, J.A.; de Souza, T.R.; Rincon, G.D.C.N.; Miguel, M.P.; de Menezes, L.B.; Amaral, A.C. Melatonin loaded lecithin-chitosan nanoparticles improved the wound healing in diabetic rats. Int. J. Biol. Macromol. 2020, 162, 1465–1475. [Google Scholar] [CrossRef]
  21. Talón, E.; Lampi, A.-M.; Vargas, M.; Chiralt, A.; Jouppila, K.; González-Martínez, C. Encapsulation of eugenol by spray-drying using whey protein isolate or lecithin: Release kinetics, antioxidant and antimicrobial properties. Food Chem. 2019, 295, 588–598. [Google Scholar] [CrossRef] [PubMed]
  22. Souza, M.P.; Vaz, A.F.M.; Correia, M.T.S.; Cerqueira, M.A.; Vicente, A.A.; Carneiro-da-Cunha, M.G. Quercetin-Loaded Lecithin/Chitosan Nanoparticles for Functional Food Applications. Food Bioprocess Technol. 2014, 7, 1149–1159. [Google Scholar] [CrossRef] [Green Version]
  23. Benzie, I.F.F.; Strain, J.J. The ferric reducing ability of plasma (FRAP) as a measure of “antioxidant power”: The FRAP assay. Anal. Biochem. 1996, 239, 70–76. Available online: http://linkinghub.elsevier.com/retrieve/pii/S0003269796902924 (accessed on 1 February 2023). [CrossRef] [PubMed] [Green Version]
  24. Torres, E.; Marín, V.; Aburto, J.; Beltran, H.I.; Shirai, K.; Villanueva, S.; Sandoval, G. Enzymatic modification of chitosan with quercetin and its application as antioxidant edible films. Appl. Biochem. Microbiol. 2012, 48, 151–158. Available online: http://link.springer.com/10.1134/S0003683812020123 (accessed on 1 February 2023). [CrossRef]
  25. Mahaling, B.; Katti, D.S. Understanding the influence of surface properties of nanoparticles and penetration enhancers for improving bioavailability in eye tissues in vivo. Int. J. Pharm. 2016, 501, 1–9. [Google Scholar] [CrossRef]
  26. Gibis, M.; Vogt, E.; Weiss, J. Encapsulation of polyphenolic grape seed extract in polymer-coated liposomes. Food Funct. 2012, 3, 246–254. [Google Scholar] [CrossRef]
  27. Kumari, A.; Yadav, S.K.; Pakade, Y.B.; Singh, B.; Yadav, S.C. Development of biodegradable nanoparticles for delivery of quercetin. Colloids Surf. B Biointerfaces 2010, 80, 184–192. [Google Scholar] [CrossRef]
  28. Caddeo, C.; Díez-Sales, O.; Pons, R.; Carbone, C.; Ennas, G.; Puglisi, G.; Fadda, A.M.; Manconi, M. Cross-linked chitosan/liposome hybrid system for the intestinal delivery of quercetin. J. Colloid Interface Sci. 2016, 461, 69–78. [Google Scholar] [CrossRef] [Green Version]
  29. González, A.; Gastelú, G.; Barrera, G.N.; Ribotta, P.D.; Igarzabal, C.I. Preparation and characterization of soy protein films reinforced with cellulose nanofibers obtained from soybean by-products. Food Hydrocoll. 2018, 89, 758–764. [Google Scholar] [CrossRef]
  30. Wu, C.; Li, Y.; Du, Y.; Wang, L.; Tong, C.; Hu, Y.; Pang, J.; Yan, Z. Preparation and characterization of konjac glucomannan-based bionanocomposite film for active food packaging. Food Hydrocoll. 2018, 89, 682–690. [Google Scholar] [CrossRef]
  31. Rodriguez-Canto, W.; Cerqueira, M.A.; Chel-Guerrero, L.; Pastrana, L.M.; Aguilar-Vega, M. Delonix regia galactomannan-based edible films: Effect of molecular weight and k-carrageenan on physicochemical properties. Food Hydrocoll. 2020, 103, 105632. [Google Scholar] [CrossRef]
  32. De Sousa, F.D.; Vasconselos, P.D.; da Silva, A.F.B.; Mota, E.F.; Tomé, A.D.R.; Mendes, F.R.D.S.; Gomes, A.M.M.; Abraham, D.J.; Shiwen, X.; Owen, J.S.; et al. Hydrogel and membrane scaffold formulations of Frutalin (breadfruit lectin) within a polysaccharide galactomannan matrix have potential for wound healing. Int. J. Biol. Macromol. 2019, 121, 429–442. [Google Scholar] [CrossRef] [PubMed]
  33. Rossi, B.; Campia, P.; Merlini, L.; Brasca, M.; Pastori, N.; Farris, S.; Melone, L.; Punta, C.; Galante, Y.M. An aerogel obtained from chemo-enzymatically oxidized fenugreek galactomannans as a versatile delivery system. Carbohydr. Polym. 2016, 144, 353–361. Available online: http://linkinghub.elsevier.com/retrieve/pii/S0144861716300479 (accessed on 1 February 2023). [CrossRef] [PubMed]
  34. Chouaibi, M.; Rezig, L.; Lakoud, A.; Boussaid, A.; Hassouna, M.; Ferrari, G.; Hamdi, S. Exploring potential new galactomannan source of Retama reatam seeds for food, cosmetic and pharmaceuticals: Characterization and physical, emulsifying and antidiabetic properties. Int. J. Biol. Macromol. 2019, 124, 1167–1176. [Google Scholar] [CrossRef]
  35. Mudgil, D.; Barak, S.; Khatkar, B. X-ray diffraction, IR spectroscopy and thermal characterization of partially hydrolyzed guar gum. Int. J. Biol. Macromol. 2012, 50, 1035–1039. [Google Scholar] [CrossRef]
  36. Dai, L.; Sun, C.; Li, R.; Mao, L.; Liu, F.; Gao, Y. Structural characterization, formation mechanism and stability of curcumin in zein-lecithin composite nanoparticles fabricated by antisolvent co-precipitation. Food Chem. 2017, 237, 1163–1171. [Google Scholar] [CrossRef]
  37. Ben Jeddou, K.; Chaari, F.; Maktouf, S.; Nouri-Ellouz, O.; Helbert, C.B.; Ghorbel, R.E. Structural, functional, and antioxidant properties of water-soluble polysaccharides from potatoes peels. Food Chem. 2016, 205, 97–105. Available online: http://linkinghub.elsevier.com/retrieve/pii/S0308814616302783 (accessed on 1 February 2023). [CrossRef]
  38. Ghribi, A.M.; Sila, A.; Gafsi, I.M.; Blecker, C.; Danthine, S.; Attia, H.; Bougatef, A.; Besbes, S. Structural, functional, and ACE inhibitory properties of water-soluble polysaccharides from chickpea flours. Int. J. Biol. Macromol. 2015, 75, 276–282. [Google Scholar] [CrossRef]
  39. Wang, X.; Luo, Z.; Xiao, Z. Preparation, characterization, and thermal stability of β-cyclodextrin/soybean lecithin inclusion complex. Carbohydr. Polym. 2014, 101, 1027–1032. [Google Scholar] [CrossRef]
  40. Xie, H.; Liu, C.; Gao, J.; Shi, J.; Ni, F.; Luo, X.; He, Y.; Ren, G.; Luo, Z. Fabrication of Zein-Lecithin-EGCG complex nanoparticles: Characterization, controlled release in simulated gastrointestinal digestion. Food Chem. 2021, 365, 130542. [Google Scholar] [CrossRef]
  41. Pool, H.; Quintanar, D.; Figueroa, J.D.D.; Mano, C.M.; Bechara, J.E.H.; Godínez, L.A.; Mendoza, S. Antioxidant Effects of Quercetin and Catechin Encapsulated into PLGA Nanoparticles. J. Nanomater. 2012, 2012, 145380. [Google Scholar] [CrossRef]
  42. González, A.; Barrera, G.N.; Galimberti, P.I.; Ribotta, P.D.; Igarzabal, C.I.A. Development of edible films prepared by soy protein and the galactomannan fraction extracted from Gleditsia triacanthos (Fabaceae) seed. Food Hydrocoll. 2019, 97, 105227. [Google Scholar] [CrossRef]
  43. Souza, M.P.; Vaz, A.F.M.; Silva, H.D.; Cerqueira, M.A.; Vicente, A.A.; Carneiro-Da-Cunha, M.G. Development and Characterization of an Active Chitosan-Based Film Containing Quercetin. Food Bioprocess Technol. 2015, 8, 2183–2191. [Google Scholar] [CrossRef] [Green Version]
  44. Antoniou, J.; Liu, F.; Majeed, H.; Zhong, F. Characterization of tara gum edible films incorporated with bulk chitosan and chitosan nanoparticles: A comparative study. Food Hydrocoll. 2015, 44, 309–319. Available online: http://www.sciencedirect.com/science/article/pii/S0268005X14003294 (accessed on 1 February 2023). [CrossRef]
  45. Libio, I.C.; Demori, R.; Ferrão, M.F.; Lionzo, M.I.; da Silveira, N.P. Films based on neutralized chitosan citrate as innovative composition for cosmetic application. Mater. Sci. Eng. C 2016, 67, 115–124. Available online: http://linkinghub.elsevier.com/retrieve/pii/S0928493116304337 (accessed on 1 February 2023). [CrossRef] [PubMed]
  46. Cerqueira, M.A.; Souza, B.W.S.; Teixeira, J.A.; Vicente, A.A. Effect of glycerol and corn oil on physicochemical properties of polysaccharide films—A comparative study. Food Hydrocoll. 2012, 27, 175–184. Available online: http://linkinghub.elsevier.com/retrieve/pii/S0268005X11002086 (accessed on 1 February 2023). [CrossRef] [Green Version]
  47. Wang, X.; Yong, H.; Gao, L.; Li, L.; Jin, M.; Liu, J. Preparation and characterization of antioxidant and pH-sensitive films based on chitosan and black soybean seed coat extract. Food Hydrocoll. 2018, 89, 56–66. [Google Scholar] [CrossRef]
  48. Antoniou, J.; Liu, F.; Majeed, H.; Qazi, H.J.; Zhong, F. Physicochemical and thermomechanical characterization of tara gum edible films: Effect of polyols as plasticizers. Carbohydr. Polym. 2014, 111, 359–365. [Google Scholar] [CrossRef]
  49. Rubilar, J.F.; Cruz, R.M.S.; Silva, H.D.; Vicente, A.A.; Khmelinskii, I.; Vieira, M.C. Physico-mechanical properties of chitosan films with carvacrol and grape seed extract. J. Food Eng. 2013, 115, 466–474. [Google Scholar] [CrossRef] [Green Version]
  50. Sun, L.; Sun, J.; Chen, L.; Niu, P.; Yang, X.; Guo, Y. Preparation and characterization of chitosan film incorporated with thinned young apple polyphenols as an active packaging material. Carbohydr. Polym. 2017, 163, 81–91. [Google Scholar] [CrossRef] [Green Version]
  51. Ma, Q.; Hu, D.; Wang, L. Preparation and physical properties of tara gum film reinforced with cellulose nanocrystals. Int. J. Biol. Macromol. 2016, 86, 606–612. Available online: http://linkinghub.elsevier.com/retrieve/pii/S0141813016301052 (accessed on 1 February 2023). [CrossRef] [PubMed]
Figure 1. Images of QT-LLs with different concentrations of quercetin (µg/mL), freshly prepared and after 48 h of production.
Applnano 04 00009 g001
Figure 2. Influence of quercetin concentration (μg/mL) in the encapsulation efficiency (A) and loading (B) of the liposomes (LLs). All determinations were performed in triplicate, the error bars are standard deviation, and different letters represent statistical significance (p < 0.05).
Applnano 04 00009 g002
Figure 3. SEM images showing QT-LL 75 and the surface structure of galactomannan-based films containing QT-LL 75 at 0% (A), 0.1% (B), 0.2% (C), 0.3% (D), 0.4% (E), and 0.5% (F) concentration (v/v).
Applnano 04 00009 g003
Figure 4. FTIR spectra of the galactomannan-based films containing QT-LL 75 at 0% (A), 0.1% (B), 0.2% (C), 0.3% (D), 0.4% (E), and 0.5% (F) concentration (v/v).
Applnano 04 00009 g004
Figure 5. XRD patterns of the galactomannan-based films containing QT-LL 75 at 0% (A), 0.1% (B), 0.2% (C), 0.3% (D), 0.4% (E), and 0.5% (F) concentration (v/v).
Applnano 04 00009 g005
Table 1. Average size, polydispersity (PDI), and zeta potential for QT-LLs with different concentrations of quercetin (µg/mL).
SampleAverage Size (nm)PDIZeta Potential (mV)
QT-LL 094.26 ± 0.823 c0.27 ± 0.004 b,d−44.98 ± 0.98 a
QT-LL 2593.85 ± 4.343 c0.28 ± 0.012 c,d−46.85 ± 10.92 a
QT-LL 50100.2 ± 0.567 d0.23 ± 0.009 a−50.83 ± 10.85 a
QT-LL 75100.5 ± 4.569 d0.27 ± 0.0124 c,d−48.14 ± 5.64 a
QT-LL 100104.1 ± 4.214 d0.28 ± 0.007 c−46.76 ± 1.85 a
QT-LL 125114.0 ± 1.045 b0.27 ± 0.006 d−47.10 ± 2.59 a
QT-LL 150131.8 ± 3.469 a0.26 ± 0.005 b−45.30 ± 0.59 a
a–d Different superscript letters in the same column indicate a statistically significant difference (p < 0.05).
Table 2. ABTS and FRAP results for QT-LNps with different concentrations of quercetin (µg/mL) and the same concentrations for free quercetin.
Concentration of QuercetinABTS (%)FRAP (AA/μL)
QT-LLFree QuercetinQT-LLFree Quercetin
25−4.20 ± 5.0910.76 ± 0.3341.61 ± 11.93165.71 ± 12.23
506.53 ± 11.3125.97 ± 3.63100.90 ± 12.06 502.58 ± 6.82
7528.05 ± 0.1836.03 ± 0.18312.59 ± 13.671023.47 ± 12.04
10035.88 ± 2.7542.34 ± 1.18476.37 ± 24.882281.29 ± 15.56
12542.53 ± 2.9947.68 ± 0.84731.81 ± 38.182579.89 ± 9.78
15055.49 ± 3.0752.87 ± 1.09812.70 ± 49.802933.27 ± 35.19
Table 3. Color parameters L (luminosity), a* (−a* = greenness and +a* = redness), b* (−b* = blueness and +b* = yellowness), and Y (opacity) for (A) the control film and the films (B–F) with different concentrations of QT-LL 75 (values expressed as average ± standard deviation).
FilmQT-LL 75 (v/v)L*a*b*Y
A095.62 ± 0.40 a0.35 ± 0.06 b,c7.93 ± 0.61 a12.30 ± 0.32 a
B0.1%95.66 ± 0.22 a0.35 ± 0.01 b,c7.46 ± 0.09 a12.59 ± 0.26 a
C0.2%95.77 ± 0.22 a0.30 ± 0.01 a,b,c7.24 ± 0.33 a12.49 ± 0.24 a
D0.3%95.01 ± 1.09 a0.39 ± 0.04 b8.17 ± 2.08 a12.11 ± 0.36 a
E0.4%96.05 ± 0.31 a0.27 ± 0.03 a,c7.46 ± 0.99 a12.27 ± 0.29 a
F0.5%95.84 ± 0.42 a0.25 ± 0.04 a7.25 ± 0.36 a12.62 ± 0.14 a
a–c Different superscript letters in the same column indicate a statistically significant difference (p < 0.05).
Table 4. Thickness, solubility (S), moisture content (MC), and water vapour permeability (WVP) for (A) the control film and the films (B–F) with different concentrations of QT-LL 75 (values expressed as average ± standard deviation).
FilmQT-LL 75 (v/v)Thickness (mm)S (%)MC (%)WVP × 10−7 (g·h−1·m−1·Pa−1)
A00.046 ± 0.004 a77.0 ± 8.0 a17.0 ± 1.0 a7.27 ± 0.80 a
B0.1%0.051 ± 0.001 a68.0 ± 10.0 a19.0 ± 2.0 a8.07 ± 0.63 a,c
C0.2%0.058 ± 0.002 a77.0 ± 4.0 a22.0 ± 3.0 a10.44 ± 0.48 b,c
D0.3%0.056 ± 0.008 a75.0 ± 2.0 a27.0 ± 5.0 a11.41 ± 1.05 b
E0.4%0.051 ± 0.002 a54.0 ± 22.0 a28.0 ± 9.0 a9.72 ± 0.57 a,b,c
F0.5%0.054 ± 0.008 a73.0 ± 13.0 a23.0 ± 2.0 a9.94 ± 1.46 b,c
a–c Different superscript letters in the same column indicate a statistically significant difference (p < 0.05).
Table 5. Contact angle (CA) for (A) the control film and the films (B–F) with different concentrations of QT-LL 75 (values expressed as average ± standard deviation) at 5 and 2 seconds.
SampleCA at 5 sCA at 30 s
A113.5 ± 9.57 a111.5 ± 2.61 a
B114.2 ± 5.93 a119.1 ± 3.47 a
C108.3 ± 4.36 a112.2 ± 3.04 a
D108.2 ± 3.98 a114.2 ± 6.02 a
E112.8 ± 7.03 a115.6 ± 6.22 a
F113.8 ± 4.81 a117.1 ± 3.78 a
a The same superscript letter in the same column indicates no statistical difference (p > 0.05).
Disclaimer/Publisher’s Note: The statements, opinions and data contained in all publications are solely those of the individual author(s) and contributor(s) and not of MDPI and/or the editor(s). MDPI and/or the editor(s) disclaim responsibility for any injury to people or property resulting from any ideas, methods, instructions or products referred to in the content.

