Article

Growth of New, Optically Active, Semi-Organic Single Crystals Glycine-Copper Sulphate Doped by Silver Nanoparticles

by
Rasmiah Saad A. Almufarij
1,
Alaa El-Deen Ali
2,
Mohamed Elsayed Elba
2,
Howida Eid Okab
2,
Ollaa Moftah Mailoud
3,
Hamida Abdel-Hamid
4 and
Howida Abouel Fetouh Elsayed
4,*
1
Chemistry Department, College of Science, Princess Nourah bint Abdulrahman University, P.O. Box 84428, Riyadh 11671, Saudi Arabia
2
Chemistry Department, Faculty of Science, Damanhur University, Damanhour 22511, Egypt
3
Physics Department, Faculty of Science, Benghazi University, Benghazi 21861, Libya
4
Chemistry Department, Faculty of Science, Alexandria University, P.O. Box 426, Alexandria 21321, Egypt
*
Author to whom correspondence should be addressed.
Appl. Nano 2023, 4(2), 115-137; https://doi.org/10.3390/applnano4020007
Submission received: 15 February 2023 / Revised: 15 March 2023 / Accepted: 11 April 2023 / Published: 18 April 2023
(This article belongs to the Topic Electronic and Optical Properties of Nanostructures)

Abstract

:
The purpose of this study is to modify all physicochemical properties of glycine–copper sulphate single crystals, such as crystal habits, molar mass, thermal stability, optical activity, and electrical properties. The novelty of this study is growth of glycine–copper sulphate single crystals doped by a low concentration of silver nanoparticles (SNPs) that improved both crystal habits and physicochemical properties. The originality of this work is that trace amounts of SNPs largely increased the crystal size. Crystals have molar stoichiometric formula [glycine]0.95, [CuSO4·5H2O]0.05 in the absence and presence of silver nanoparticles (SNPs) in different concentrations: 10 ppm, 20 ppm, and 30 ppm. The crystals’ names and abbreviations are: glycine–copper sulphate (GCS), glycine–copper sulphate doped by 10 ppm SNPs (GCSN1), glycine–copper sulphate doped by 20 ppm SNPs (GCSN2), and glycine–copper sulphate doped by 30 ppm SNPs (GCSN3). Dopant silver nanoparticles increased: crystallinity reflecting purity, transparency to UV-Vis. electromagnetic radiation, thermal stability, and melting point of glycine–copper sulphate single crystal. GCSN3 is a super conductor. High thermal conductivity of crystals ranging from 1.1 W·min−1·K−1 to 1.6 W·min−1·K−1 enabled attenuation of electromagnetic radiation and rapid heat dissipation due to good dielectric and polar properties. On rising temperature, AC electrical conductivity and dielectric properties of perfect crystal GCSN3 increased confirmed attenuation of thermal infrared radiation.

1. Introduction

Good optical, dielectric, and thermal properties of semi-organic single crystals enable application in modern technologies for design components in photonic devices, optical communication systems, optoelectronics, frequency convertors, and nonlinear optical (NLO) devices [1]. Single crystals of glycine amino acid containing copper sulphate (CuSO4) are used in optical high-resolution band pass filters for spectral devices [2]. Such crystals having a good optical quality are rarely reported. At room temperature, glycine amino acid in zwitterion form is crystalized to α, β, and γ polymorphs [3,4,5]. Glycine–copper sulphate single crystals possess NLO activity and thermal stability due to synergism of both organic and inorganic components [6,7]. Glycine has a chiral center that crystallizes in non-centrosymmetric space groups [8]. Inorganic copper sulphate enhanced mechanical and thermal stability of glycine crystals [9]. Crystals’ growth in the presence of doping impurities modified crystal habit and properties [10,11]. No studies are reported doping glycine–copper sulphate crystals by silver nanoparticles that is widely used in food, medical, industrial, catalysis, and pharmaceutical applications [12,13]. This study aims to grow new single crystals of glycine–copper sulphate in the absence and presence of silver nanoparticles to add new unique properties for these blue-colored glycine–copper sulphate single crystals to improve absorption of weak infra-red photons reaching the earth from the sun causing global warming.

2. Experimental Procedure

2.1. Materials and Methods

All chemicals in this study are highly pure, of analytical grade, and used as received without further purification: glycine (C2H5NO2, Oxford Co.) purity 98.5%, CuSO4·5H2O (Sigma Aldrich Co., St. Louis, MO, USA), purity 98%. SNPs with polyvinylpyrrolidone, purity 99.9%, was purchased from Sigma Aldrich Co. with these physical characteristics: spherical shape nanoparticles: average diameter 21.44 ± 4.92 nm and UV: electronic absorption bands at maximum wavelength (λmax. 430 nm) due to delocalized electronic surface plasmon.
Slow solvent evaporation method is employed at 25 °C for growth of GCS crystals doped by SNPs. The stoichiometric formula is (glycine)0.95, [CuSO4]0.05. Salts are dissolved in double distilled water and agitated at 50 rpm using a magnetic stirrer for two h to obtain a homogeneous saturated solution. For SNP doping, a solution of glycine and CuSO4 are agitated at 50 rpm for two hours. Different concentrations of 10 ppm, 20 ppm, and 30 ppm SNPs are added to the filtrate that is further stirred for half an hour to complete homogeneity. The solution is covered by porous aluminum foil in a dust-free environment to allow slow solvent evaporation. High-quality, blue-color, pure crystals are harvested after one month, Figure 1.
GCS crystals increased in size and intensity of blue color as doping concentration of SNPs increased.

2.2. Characterization of Single Crystals

The grown crystals are characterized by:
Mass spectra (MS) by electron ionization technique at 70 eV using Thermo GCMS-ISQLT mass spectrometer; elemental analysis by energy dispersive X-ray analysis (EDX), and scanning electron microscope (SEM) using JSM-IT200 SEM.
Powder X-ray diffraction pXRD patterns at 25 °C and diffraction, reflection angle (2-theta) ranges from 5° to 70° at 0.02° step and scan rate 1° min−1 using Cu-Kα radiation of wavelength 1.5418 Å and acceleration voltage 40 kV using Bruker D8 advance diffractometer. Intensity of reflected X-rays in arbitrary units is plotted versus incidence and reflection angles 2θ°, FTIR vibrational spectra at the frequency range 400–4000 cm−1 using IR Prestige-21, Borken, Germany.
UV-Vis. electronic absorption spectra using Helios alpha Unicom UV-Spectrophotometer at wavelength range 190–1200 nm; differential scanning calorimetry (DSC), thermal gravimetric analysis (TGA), and differential thermal gravimetric (DTG) analysis at temperature range: 25–800 °C using SDT Q600 V20.9 Build 20 instrument, 20 °C·min−1 heating rate in de-aerated alumina cell to avoid sample oxidation by atmospheric oxygen; X-band electron spin resonance spectra ESR at room temperature, 9.43 GHz using reflection JES-RE1X ESR spectrometer in cylindrical resonance cavity with 100 kHz modulation, 5 mW power where applied magnetic field is controlled with LMR Gauss meter; electrical conductivity and dielectric characteristics of GCSN3 sample is measured using four probes Agilent 4294 A impedance bridge with sinusoidal voltage signal 10 mV amplitude. The sample is compressed as a pellet: 0.5 cm radius, 0.23 × 10⁻² m thickness, and 7.854 × 10⁻⁵ m2 geometrical area, coated on two opposite surfaces by silver paste for Ohmic contact with copper electrodes and annealed at 120 °C; thermal conductivity is measured at room temperature using hot disk TP 2500 [14].

3. Results and Discussion

MS is in Supplementary Information (SI); Figure S1 showed the relative abundance of the fragmented molecular ion versus m a s s ( m ) c h a r g e ( z ) ratio peaked at m/z 73.37, 75.2, 73.32, and 70.29, corresponding to molecular weight (M.wt) 75.07 g mol−1 of glycine. The last peaks correspond to M.w. 614.32, 662.38, 758.57, 834.65 g mol−1 for glycine–copper sulphate (GCS), glycine–copper sulphate doped 10 ppm SNPs (GCSN1), glycine–copper sulphate doped 20 ppm SNPs (GCSN2), and glycine–copper sulphate doped 30 ppm SNPs (GCSN3) crystals, respectively. An increasing concentration of SNPs increased chelation of glycine organic ligand to Cu(II) ion in CuSO4.
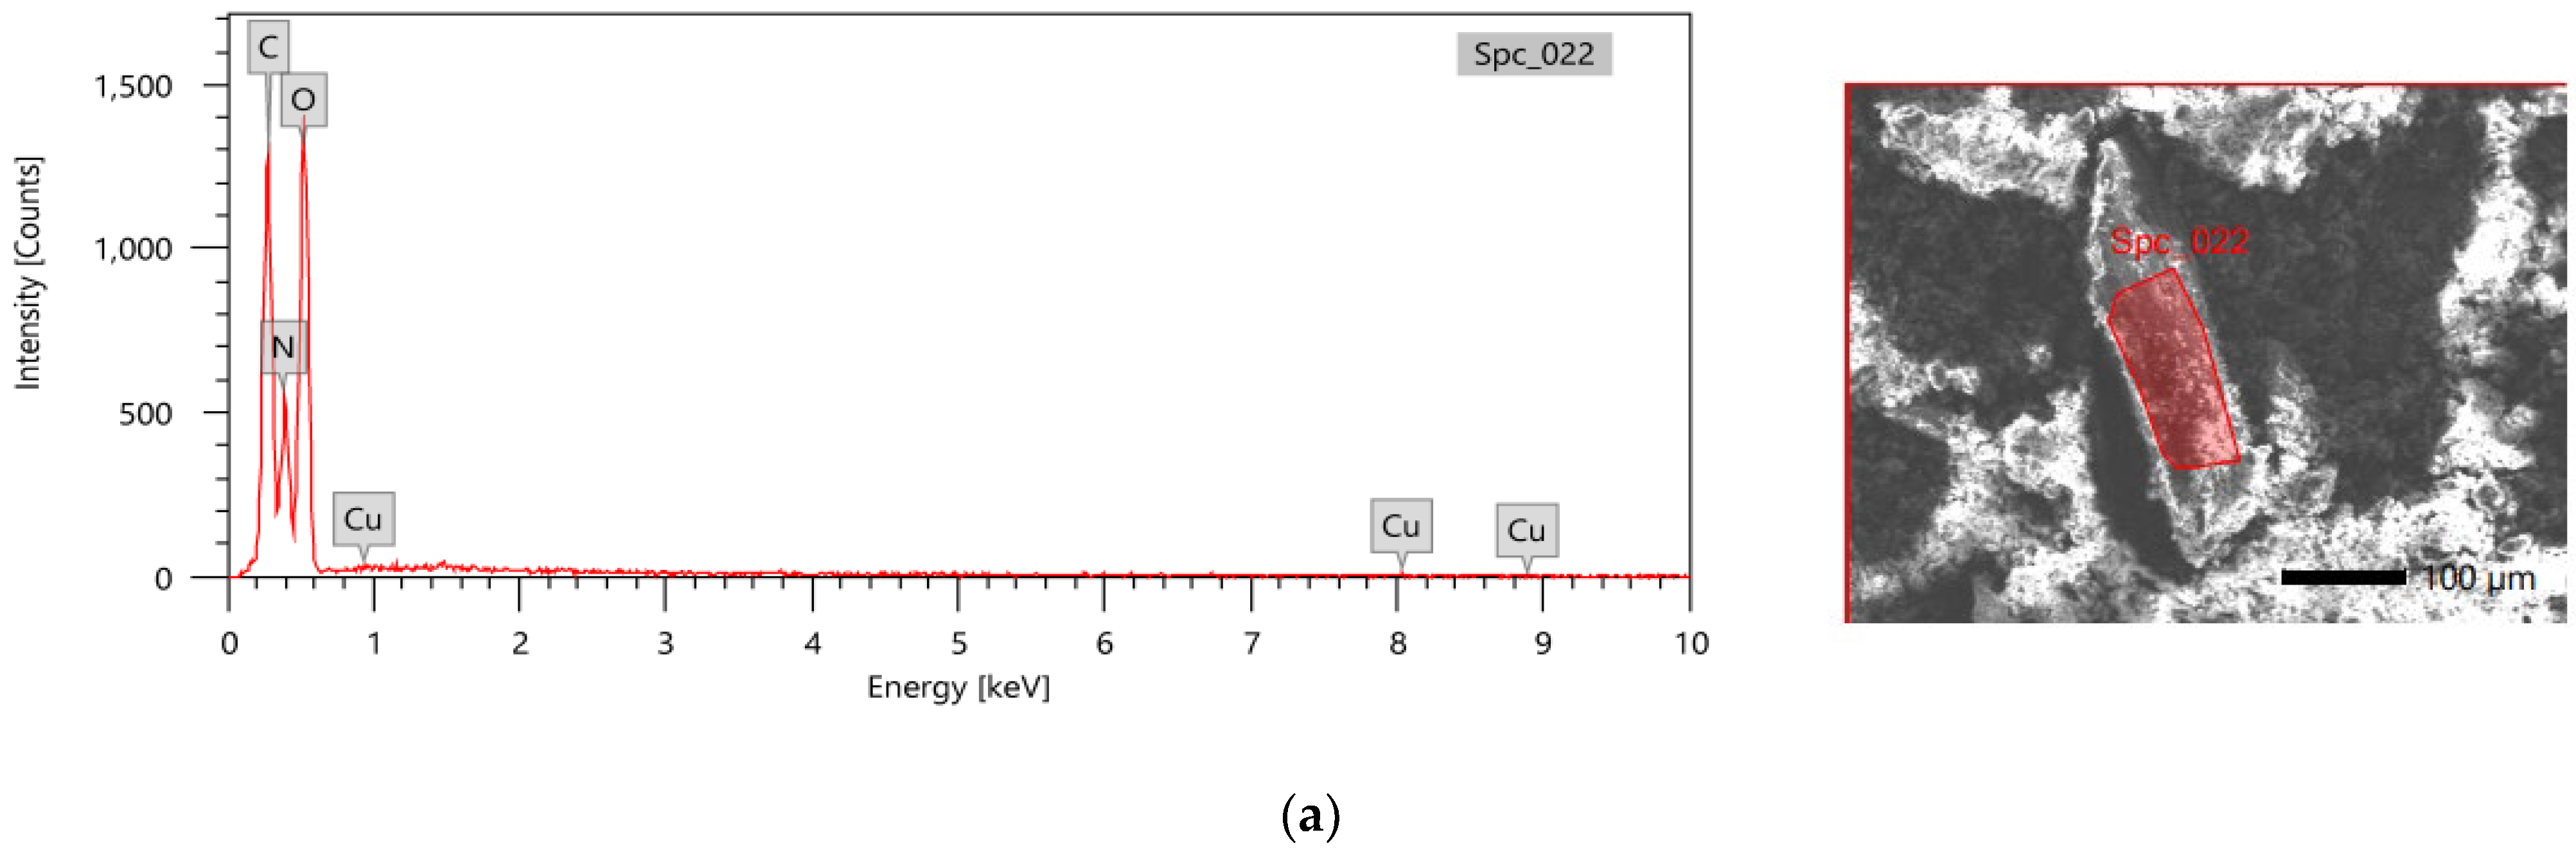
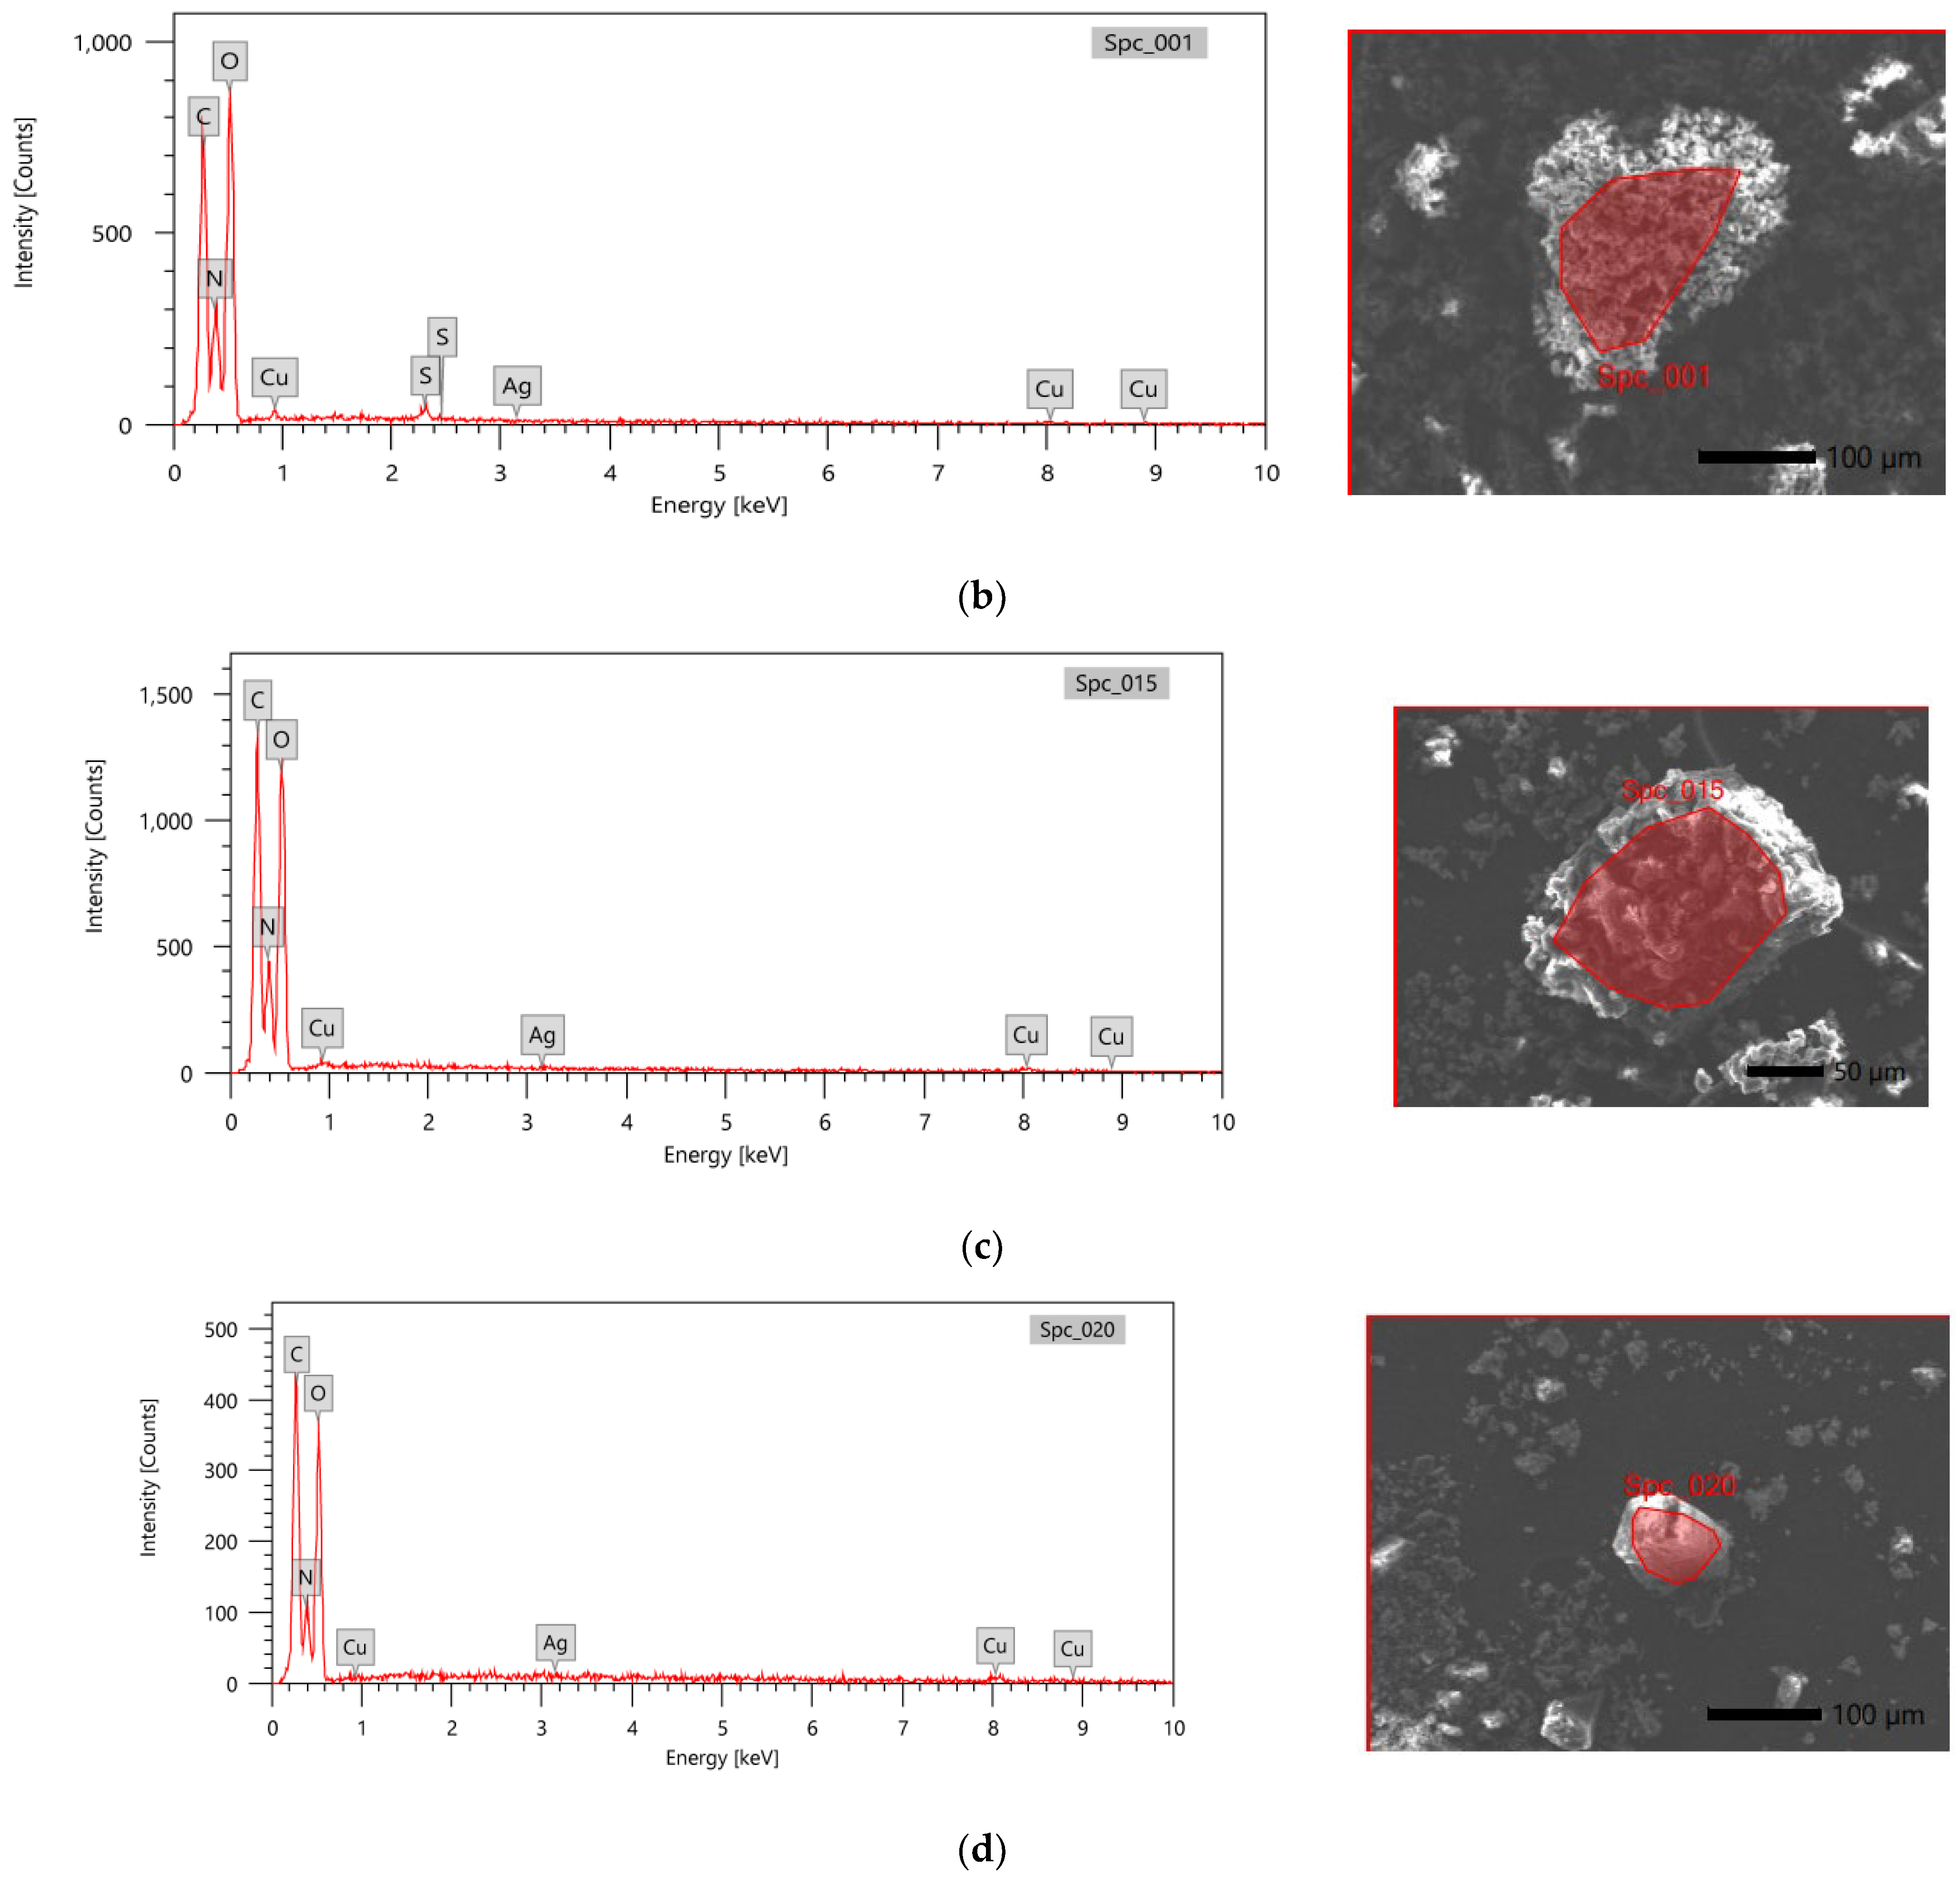
EDX spectra and SEM micrographs: Figure 2a–d show SEM-EDX analysis of GCS, GCSN1, GCSN2, and GCSN3 crystals, respectively. These spectra were produced as a focused electron beam on the sample ejected electrons from the inner-most electron atoms in the crystal leaving holes filled by ejected electrons from higher level emissions of X-ray [14,15].
EDX spectra confirmed that SNPs improved self-assembly of GCS from Figure 2a–d. Perfect crystallization is attained in Figure 2d.
The data in Table 1 indicated that oxygen, carbon, and nitrogen have maximum weight %, confirming that glycine is the base matrix of these single crystals. EDX spectrums of the doped crystals confirm the entry of both Cu(II) ion and Ag(I) ions into glycine crystal lattice.
The crystals have molar stoichiometric formula [CH2NH2COOH]0.95, [CuSO4·5H2O]0.05 in the absence and presence of SNPs.
The vibrational band in FTIR spectra, as shown in Figure S2, is assigned to the function groups in the crystals, Table 2.
IR spectra of the GCS crystal showed a strong vibrational band at 509.21 cm−1 due to Cu–N stretching [16], NH stretching band at 3811.34 cm−1, And medium peak at 1111.00 cm−1 for CH2 rocking [17]. There is a strong peak at 1334.79 cm−1 due to CH2 wagging. Intense peak C=O asymmetric stretching occurs at 1604.77 cm−1 [18], symmetric stretching COO at 1411.68 cm−1, intense band asymmetric stretching COO at 1519.91 cm−1 [19], and medium peak at 1033.85 cm−1 for CCN asymmetric stretching deformation [20]. There is strong band SO4 stretching at 894.97 cm−1, an intense band due to bending COO at 694.37 cm−1, medium peak wagging COO at 609.51 cm−1 [13], and NH2 asymmetric stretching at 2823.79 cm−1 [21]. FTIR spectra of the samples GCSN1, GCSN2, and GCSN3 have small shift compared to that of GCS observed, which suggests the incorporation of SNPs into the crystals lattice.
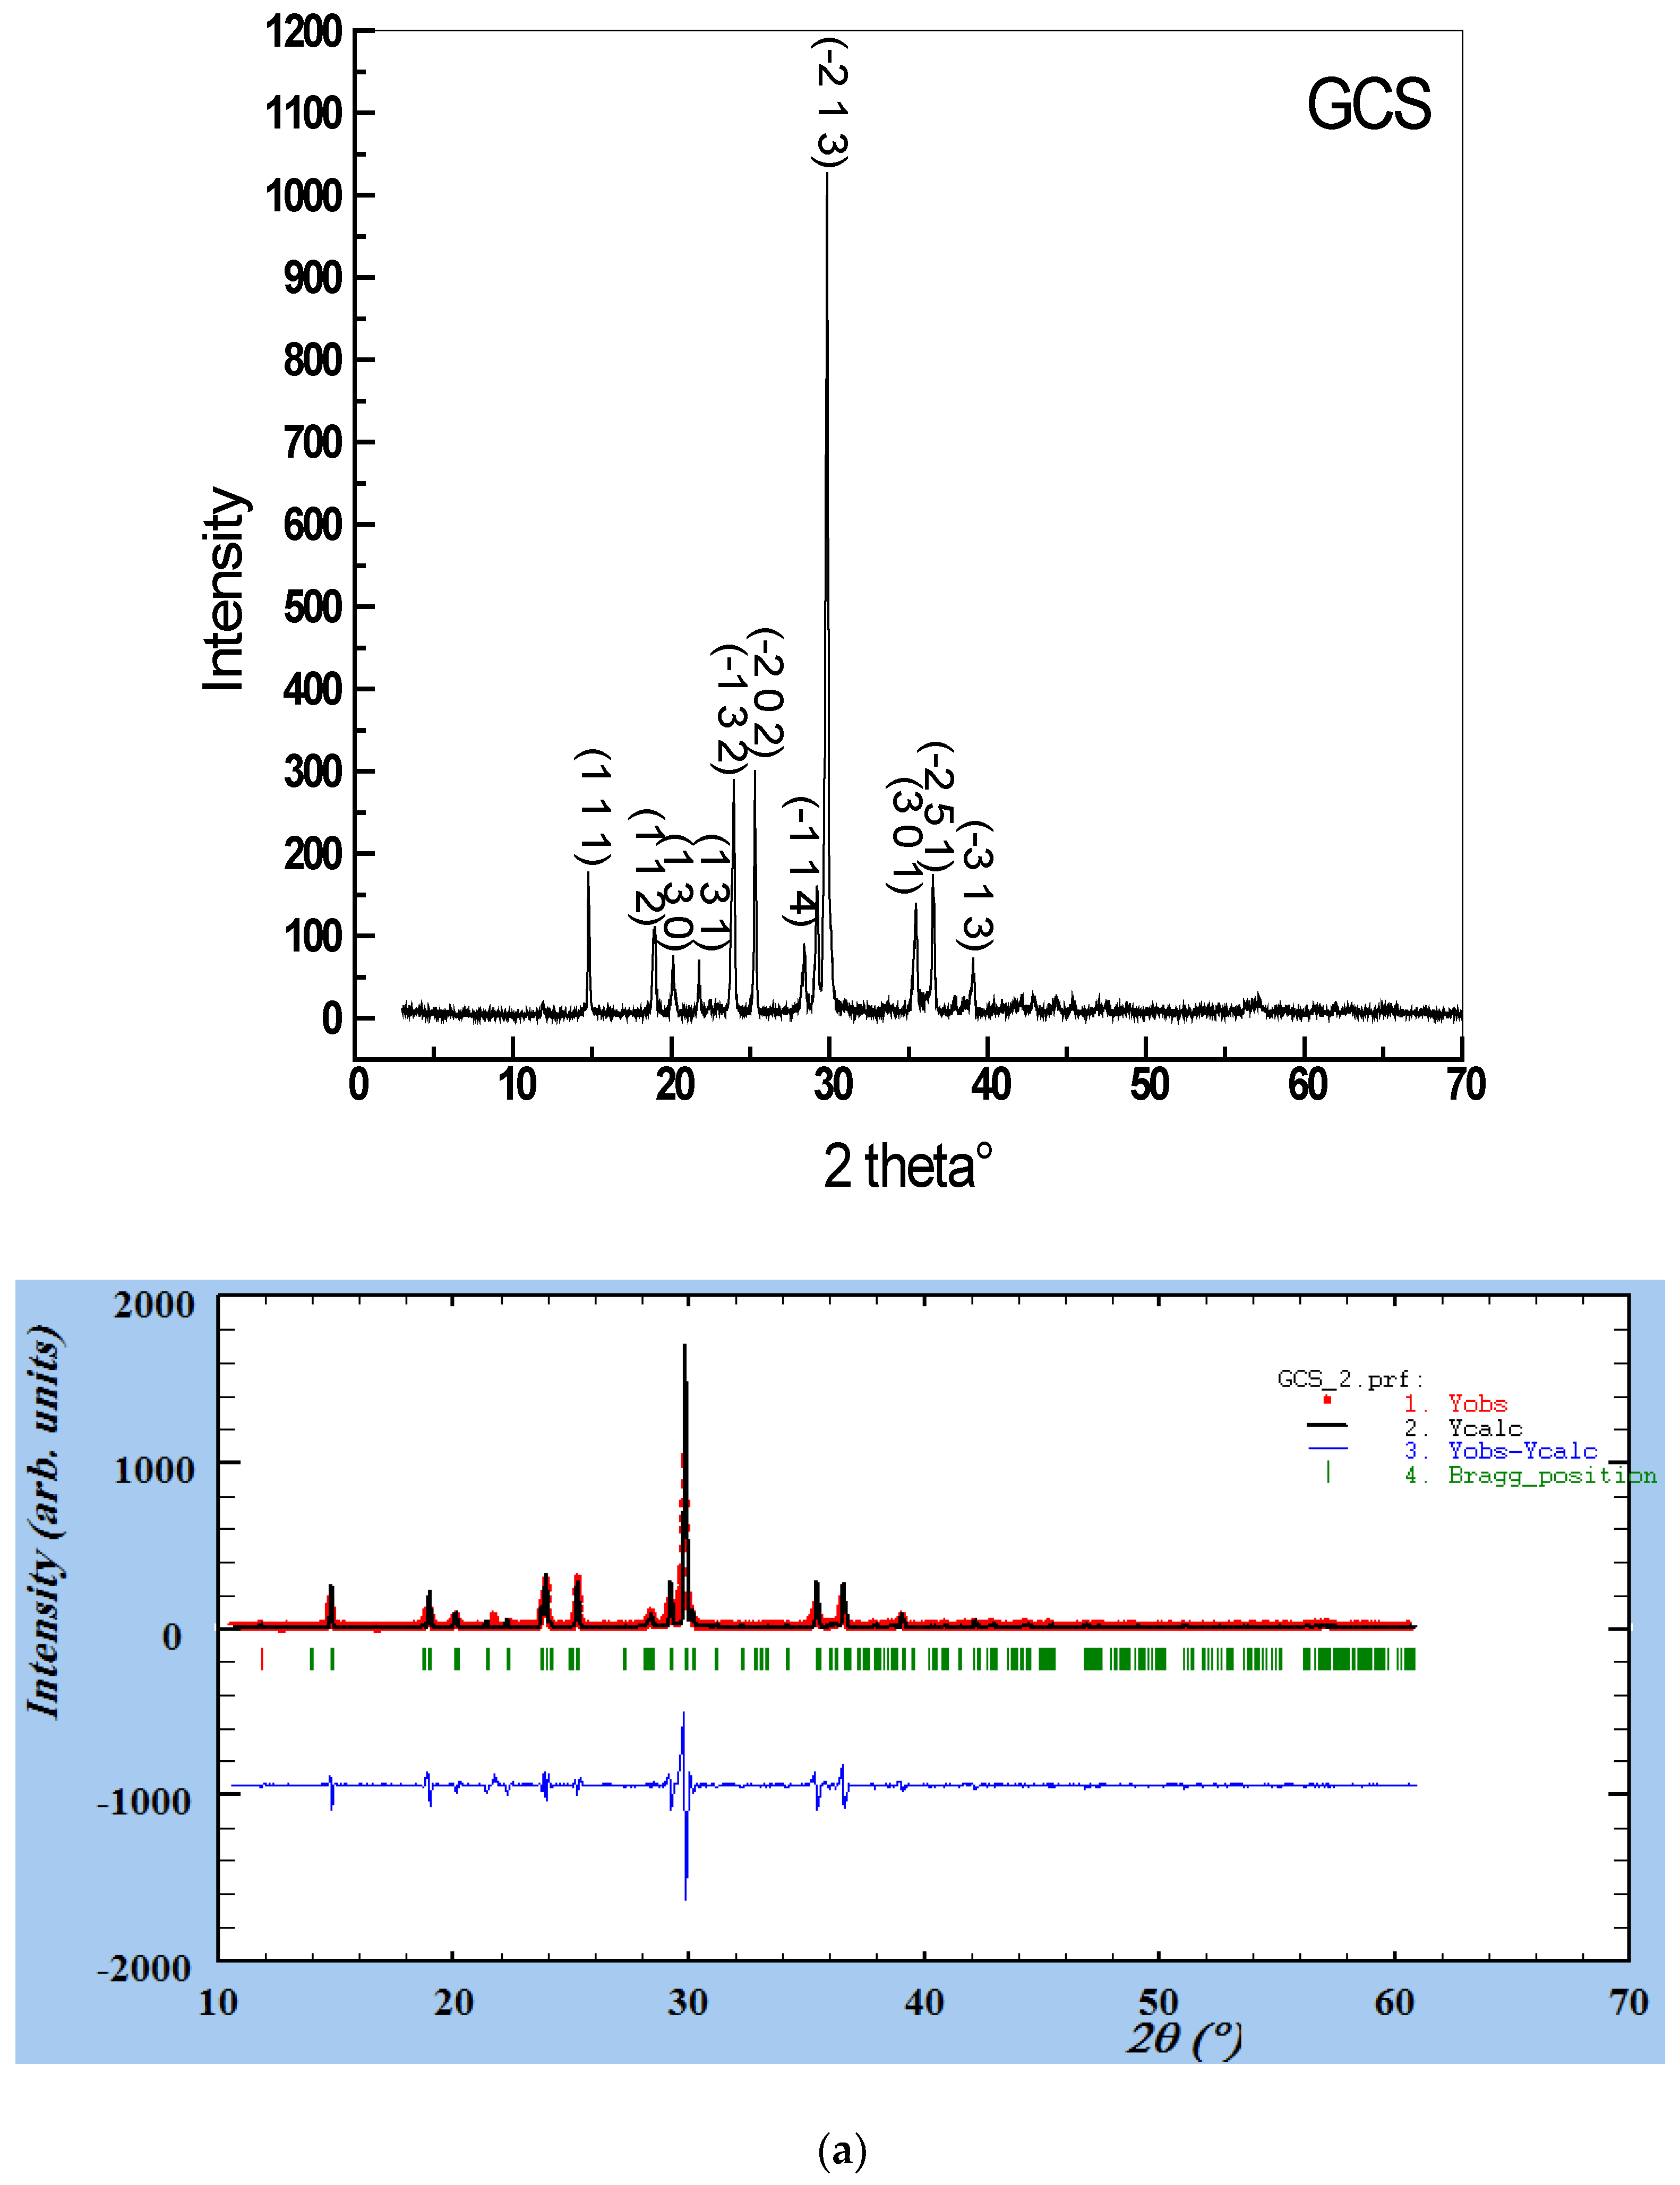
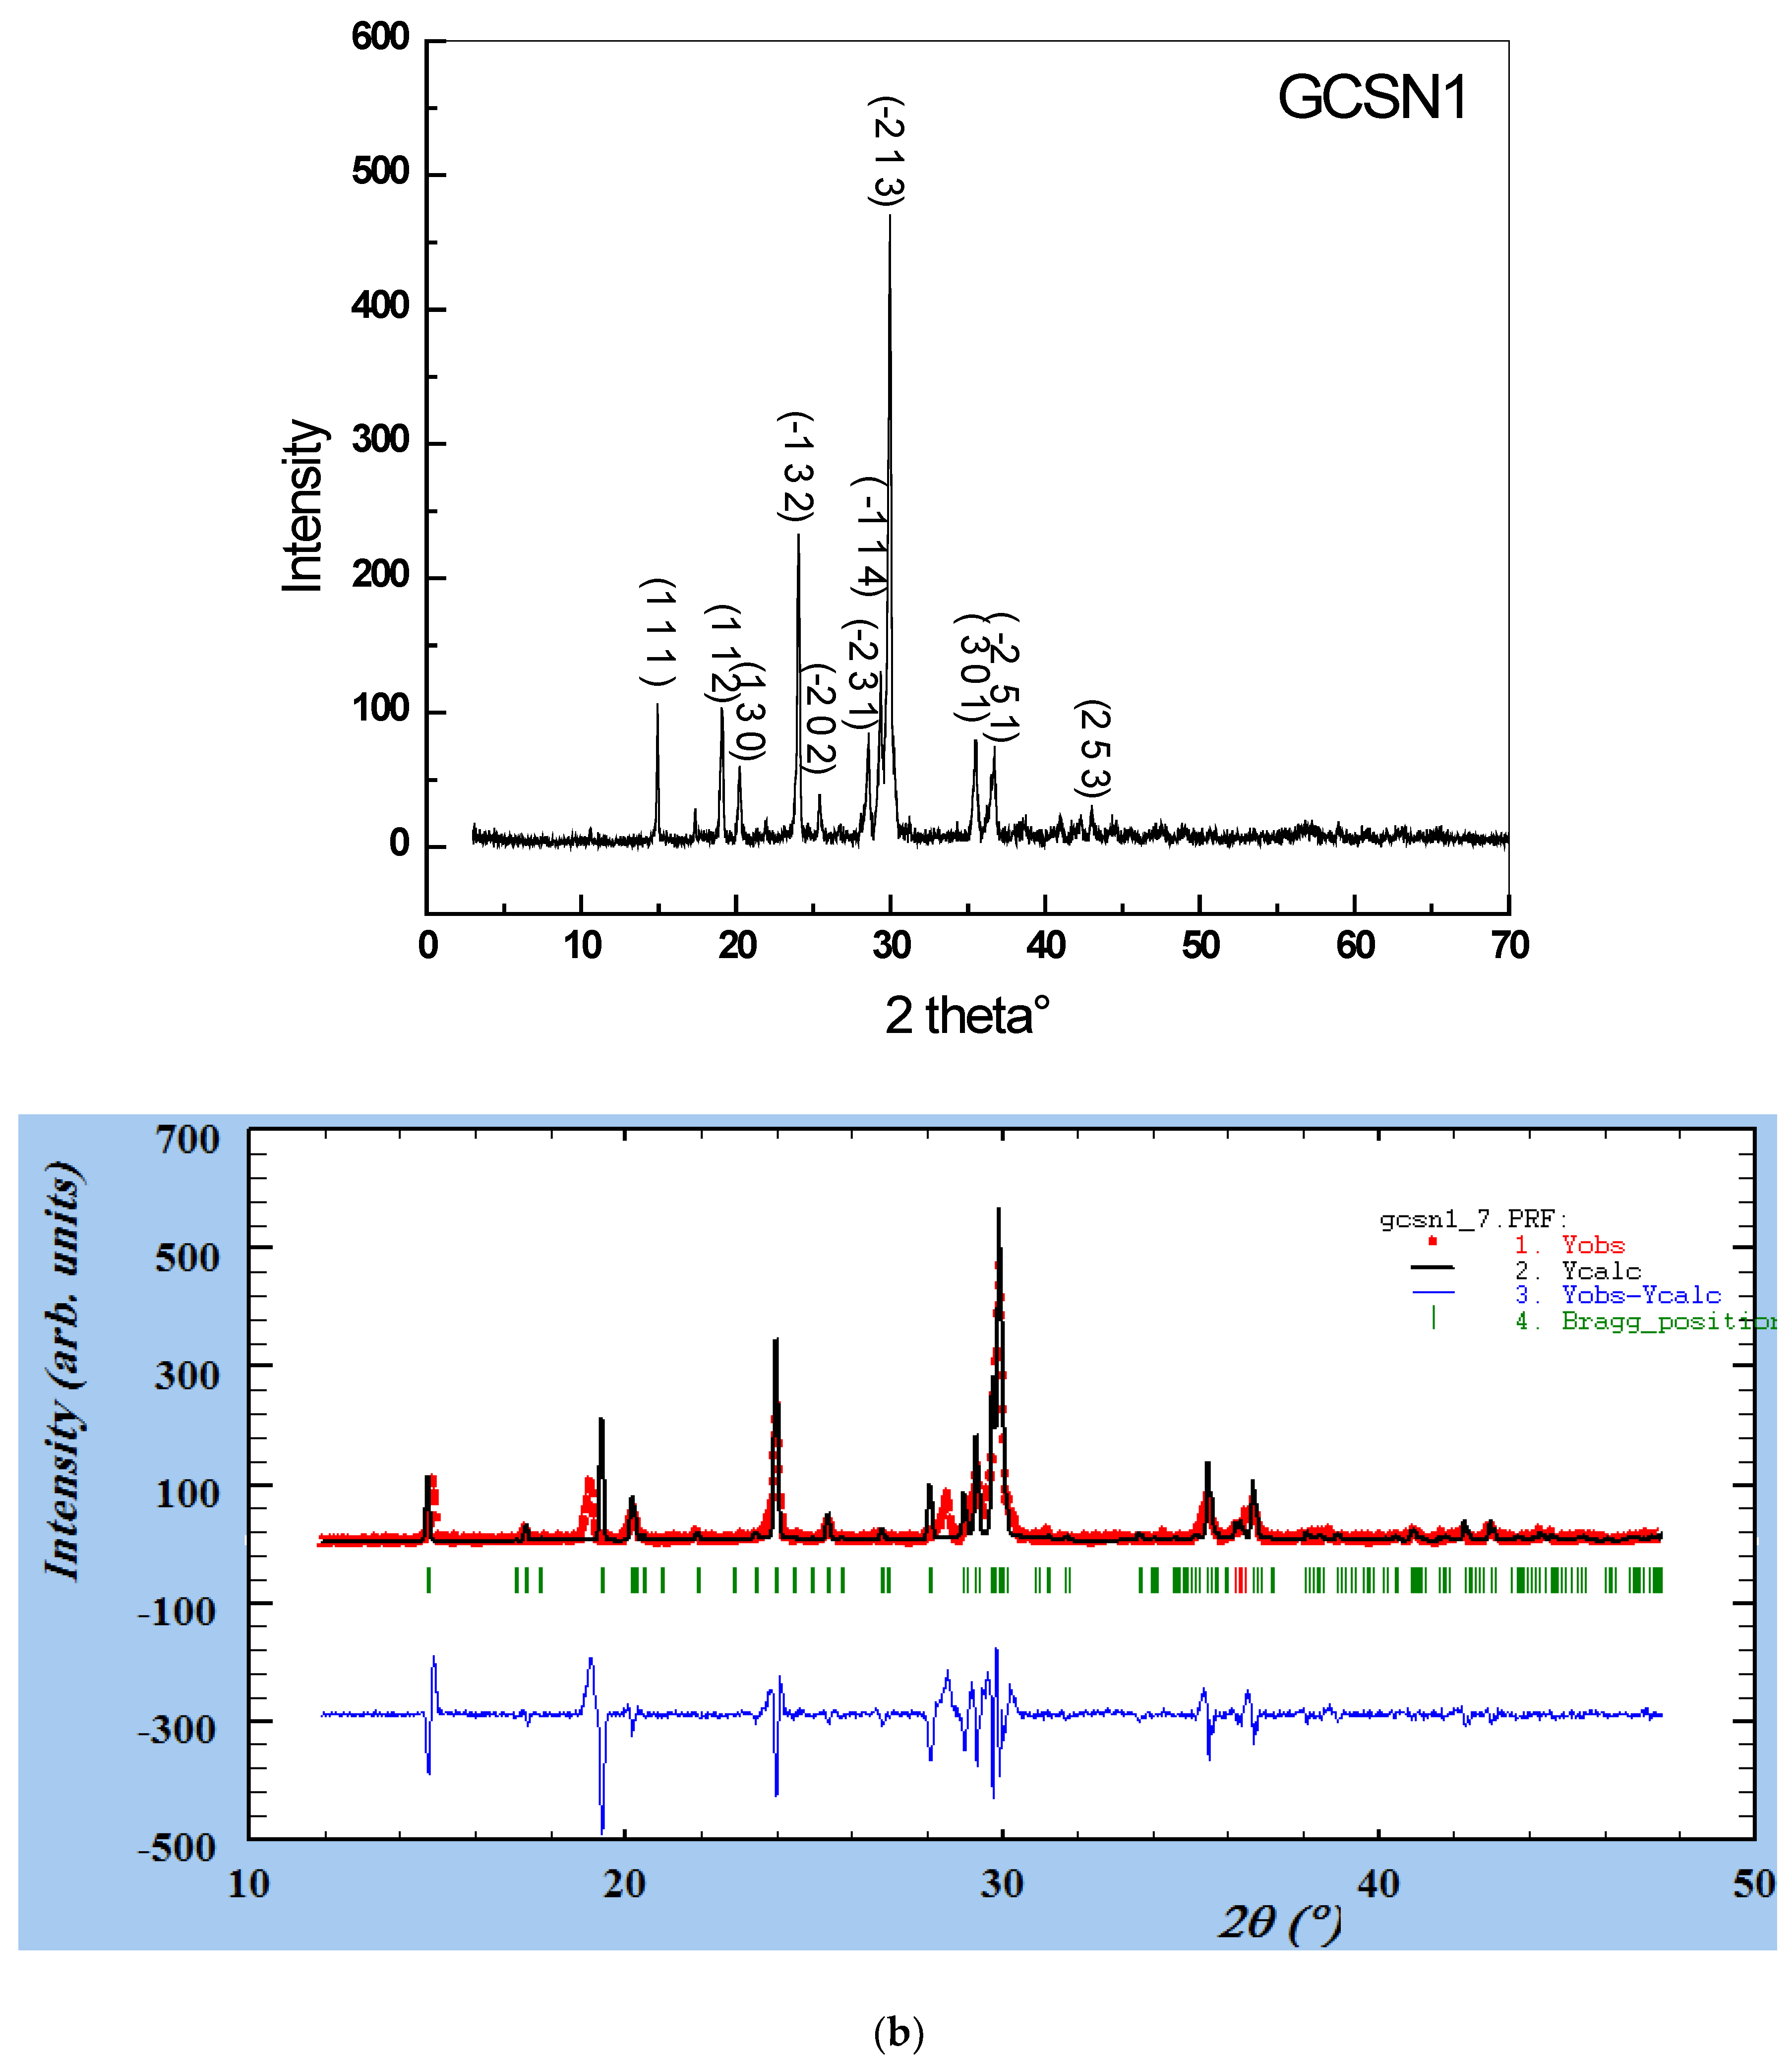
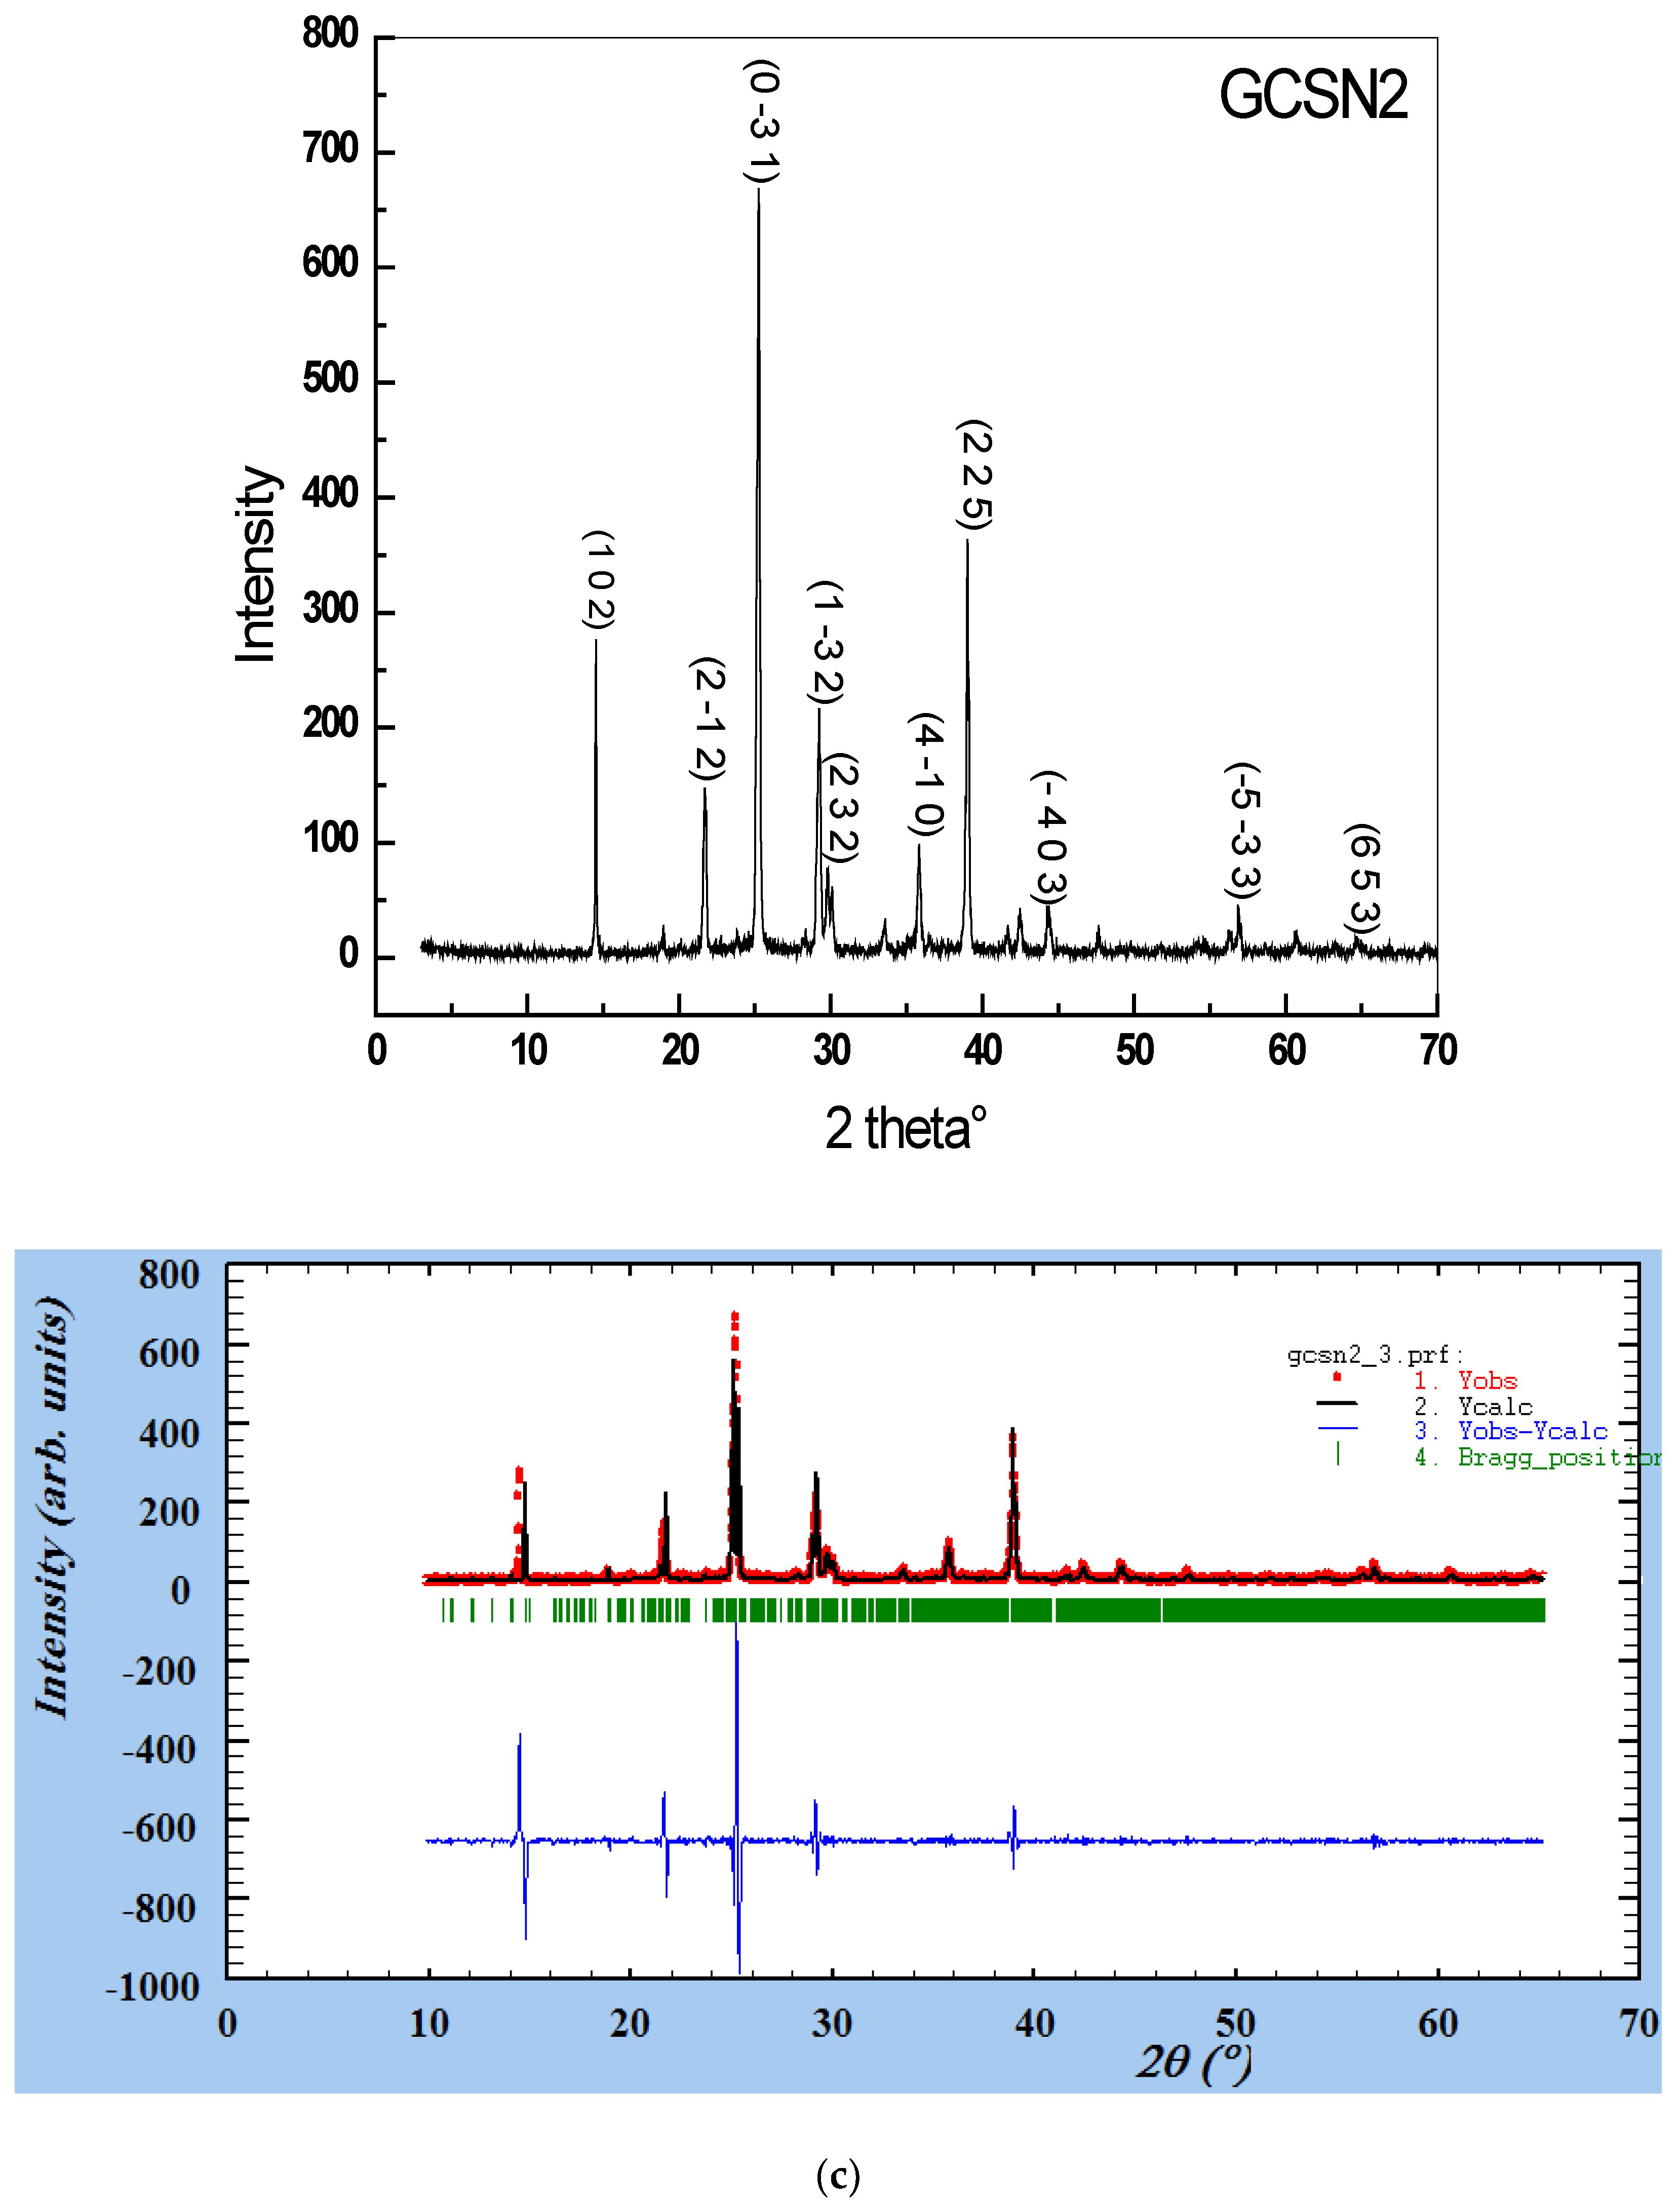
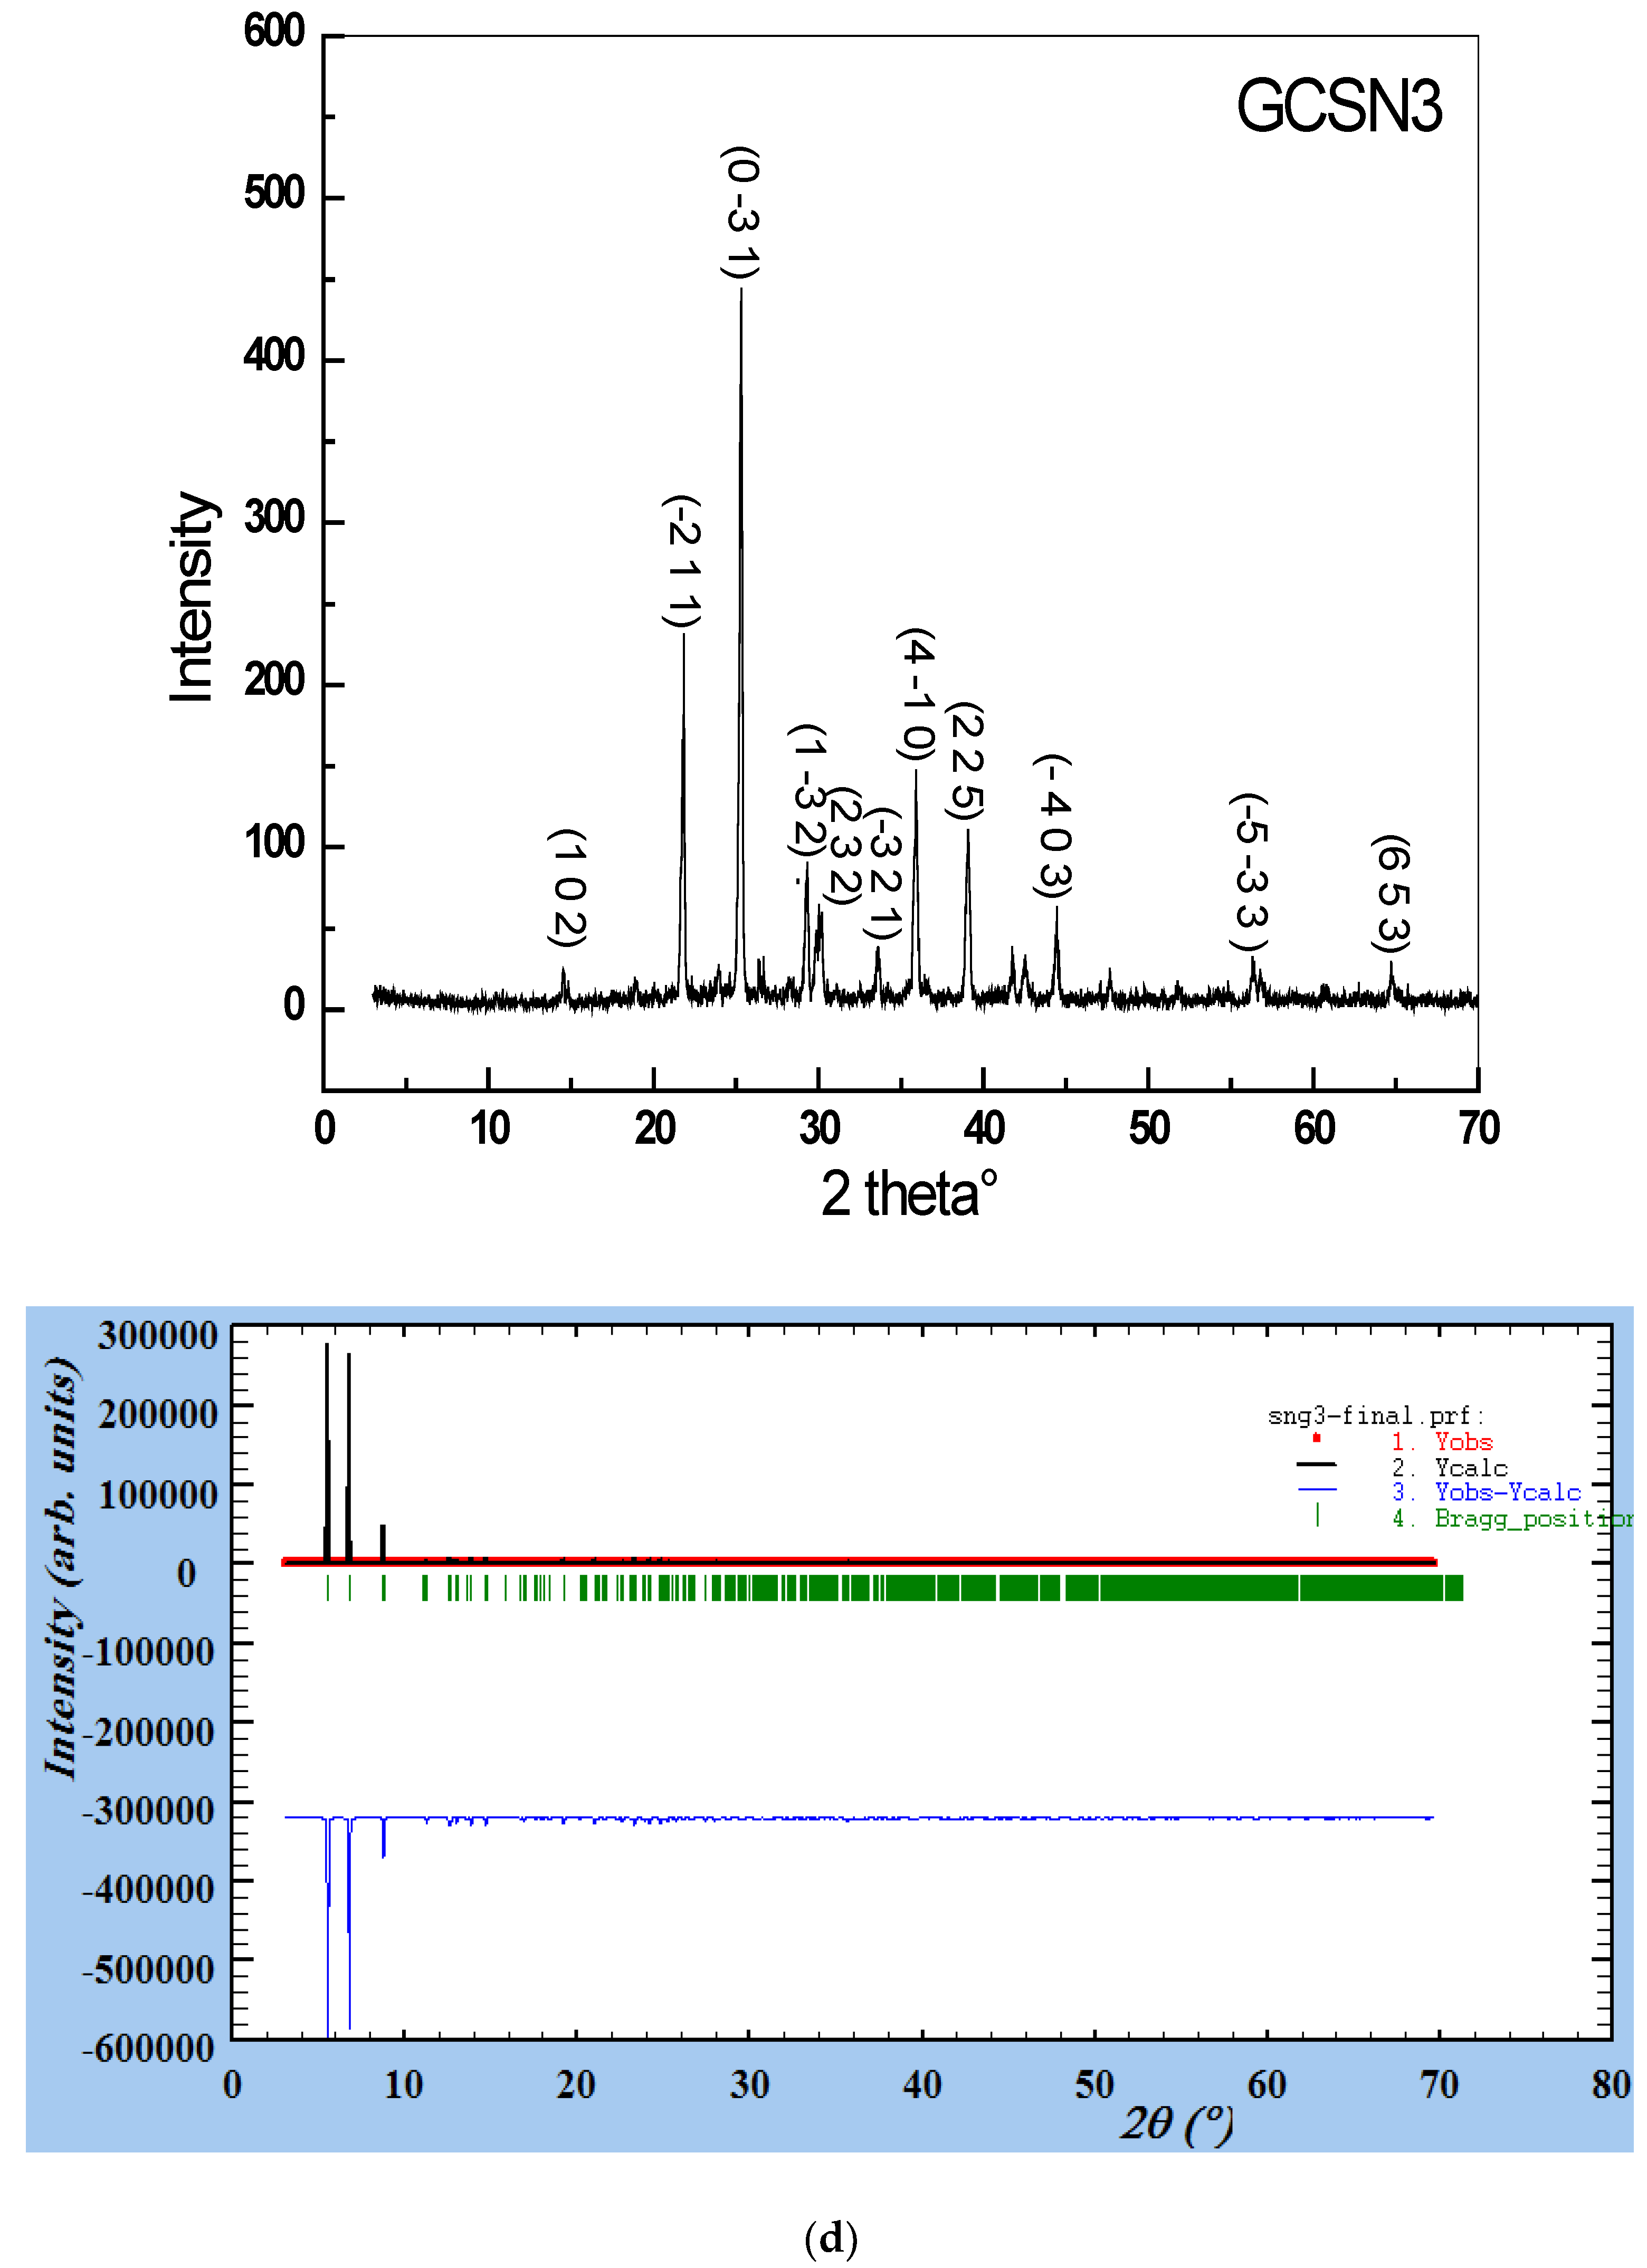
Figure 3a–d showed indexed pXRD profile versus Rietveld refined PXRD patterns for GCS, GCSN1, GCSN2, and GCSN3 crystals. All pXRD patterns showed a prominent sharp diffraction peak at 30°. SNPs increased the peaks’ intensity and modified crystal structure and lattice planes [22,23,24]. The crystals’ structure and geometry agreed with Crystallography Opened Database, COD files. GCS and GCSN1 have monoclinic unit cell alpha glycine. Triclinic GCSN2 and GCSN3 have gamma glycine. pXRD patterns are refined using Full prof Suit software using CIF files containing crystal information. Peak patterns are refined following pseudo-Voigt profile analytical function [25]. Background and peak shapes are modeled with linear fitting by applying least-squares cycles and six background (polynomial 6th grade parameters) at the wavelength of Cu-detector and neglecting instrument contribution [26]. The crystallinity followed the trend:
GCSN3 > GCSN2 > GCSN1 > GCS
Doping GCS with SNPs improved crystallinity, hence purity and crystal engineering.
During refinement, the number and order of crystalline planes and diffraction peaks increased in the same order. Many iteration cycles and all noise data are neglected; too long iteration time is consumed for GCSN2 and GCSN3 due to extra high crystallinity, long cartesian coordinates, and different angles in the triclinic unit cell. Intense peaks shifted to lower 2-theta, indicating a pillared crystal structure. Small peak absence and no polycrystallinity regions are observed in the perfect GCSN3 crystal, which confirmed good surface. There is good fitting of pXRD spectra (calculated intensity of the diffraction peaks are close to each other, resulting in a very negligible difference between the observed and calculated intensities (Yobs.-Ycal.)) with less than zero in arbitrary unit.
Both observed and calculated profiles are closely coincided to each other in a nonlinearly fit.
Figure 3. Observed and refined pXRD patterns of crystals respectively: (a): GCS, (b): GCSN1, (c): GCSN2 and (d): GCSN3.
Applnano 04 00007 g003aApplnano 04 00007 g003bApplnano 04 00007 g003cApplnano 04 00007 g003d
Sharp intense pXRD patterns with a dominating diffraction peak in crystals confirmed good crystallinity. Intensity changes and a slight shift in peak positions of GCS by SNPs reflected modified crystalline planes [23]. Diffraction peaks at 44.4° and 64.7° in GCSN2 and GCSN3 confirmed doping impurities [24].
Miller indices h k of the crystal planes, full width at half maximum (FWHM) of XRD patterns, peak position, and inter planar distance (dcal.), are collected in Table S1. The crystallinity and geometry of single crystals are deduced from pXRD by matching these diffraction patterns to pdf cards of similar crystals in Crystallography Opened Database using FWHM that characterized different material properties and surface integrity features [25,26]. The unit cell parameters are collected in Table 3.
UV-Vis. absorbance spectrum of crystals at wavelength range 190–1100 nm are shown in Figure 4. UV-Vis. absorbance curve showed cut-off of wavelength λcut off is lower than that of glycine [27].
Doping by SNPs decreased λcut off, i.e., increased band gas for UV–electronic transition. SNPs enhanced transparency of crystals to UV radiation-enabled deposition as thin film on glass for protection against UV radiation [28,29]:
A b s o r p t i o n   f r a c t i o n   α = 2.3042 × a b s o r b a n c e   A s a m p l e   t h i c k n e s s   t
Band gap-controlled UV absorption coefficient depends on the energy of the incident photon and is estimated using Equation (2) [30,31].
α h ν = A h υ E g r
where ν frequency of the incident radiation is inversely proportional to the wavelength of absorbance (λ), A is constant, and the exponent r depends on the nature of electronic transition. r = 2 for indirect transition, and r = ½ for allowed direct transition, r = ½. Since all crystals are blue colored, allowed direct transition is considered [15,30]. The optical gaps, Eg, are calculated from plots (αhν)2 as a function of photon energy (hν), as shown in Figure 5, and the observed values Eg are given in Table 4 along with the values of all reported glycine single crystals.
λcut off 287 nm for GCS decreased to 283, 276, and 280 nm for GCSN1, GCSN2, and GCSN3, respectively, which indicated an increasing band gap. Blue shift of λcut off to lower values indicated SNPs’ improved polarizability of electron density on the single crystals. This finding suggested the suitability of GCS-doped SNPs single crystals for applications in optoelectronic devices such as frequency multiplier, sum-, difference-, and blue laser frequency generators, etc. [34]. Optical band gaps’ eV are 4.58, 4.61, 4.65, and 4.67 for GCS, GCSN1, GCSN2, and GCSN3 crystals, respectively. SNPs increased Eg and enhanced optical properties of GCS. High Eg indicated the decrease in the localized energy states on doping by SNPs due to extrinsic defects or disorders in GCS caused by interstitial doped SNPs [35].
Good optical properties of the GCS crystals doped by SNPs are confirmed by extinction coefficient K calculated using Equation (3); α and refractive index (n) reflect dissipated incident radiation by absorption and scattering [36,37].
K = λ α 4 π
Reflectance R and K depend on photon energy, Figure S3: The reflectance is calculated using Equation (4): [36]
R = 1 ± 1 exp α t + e x p α t 1 + exp ( α t )
where t is the sample thickness.
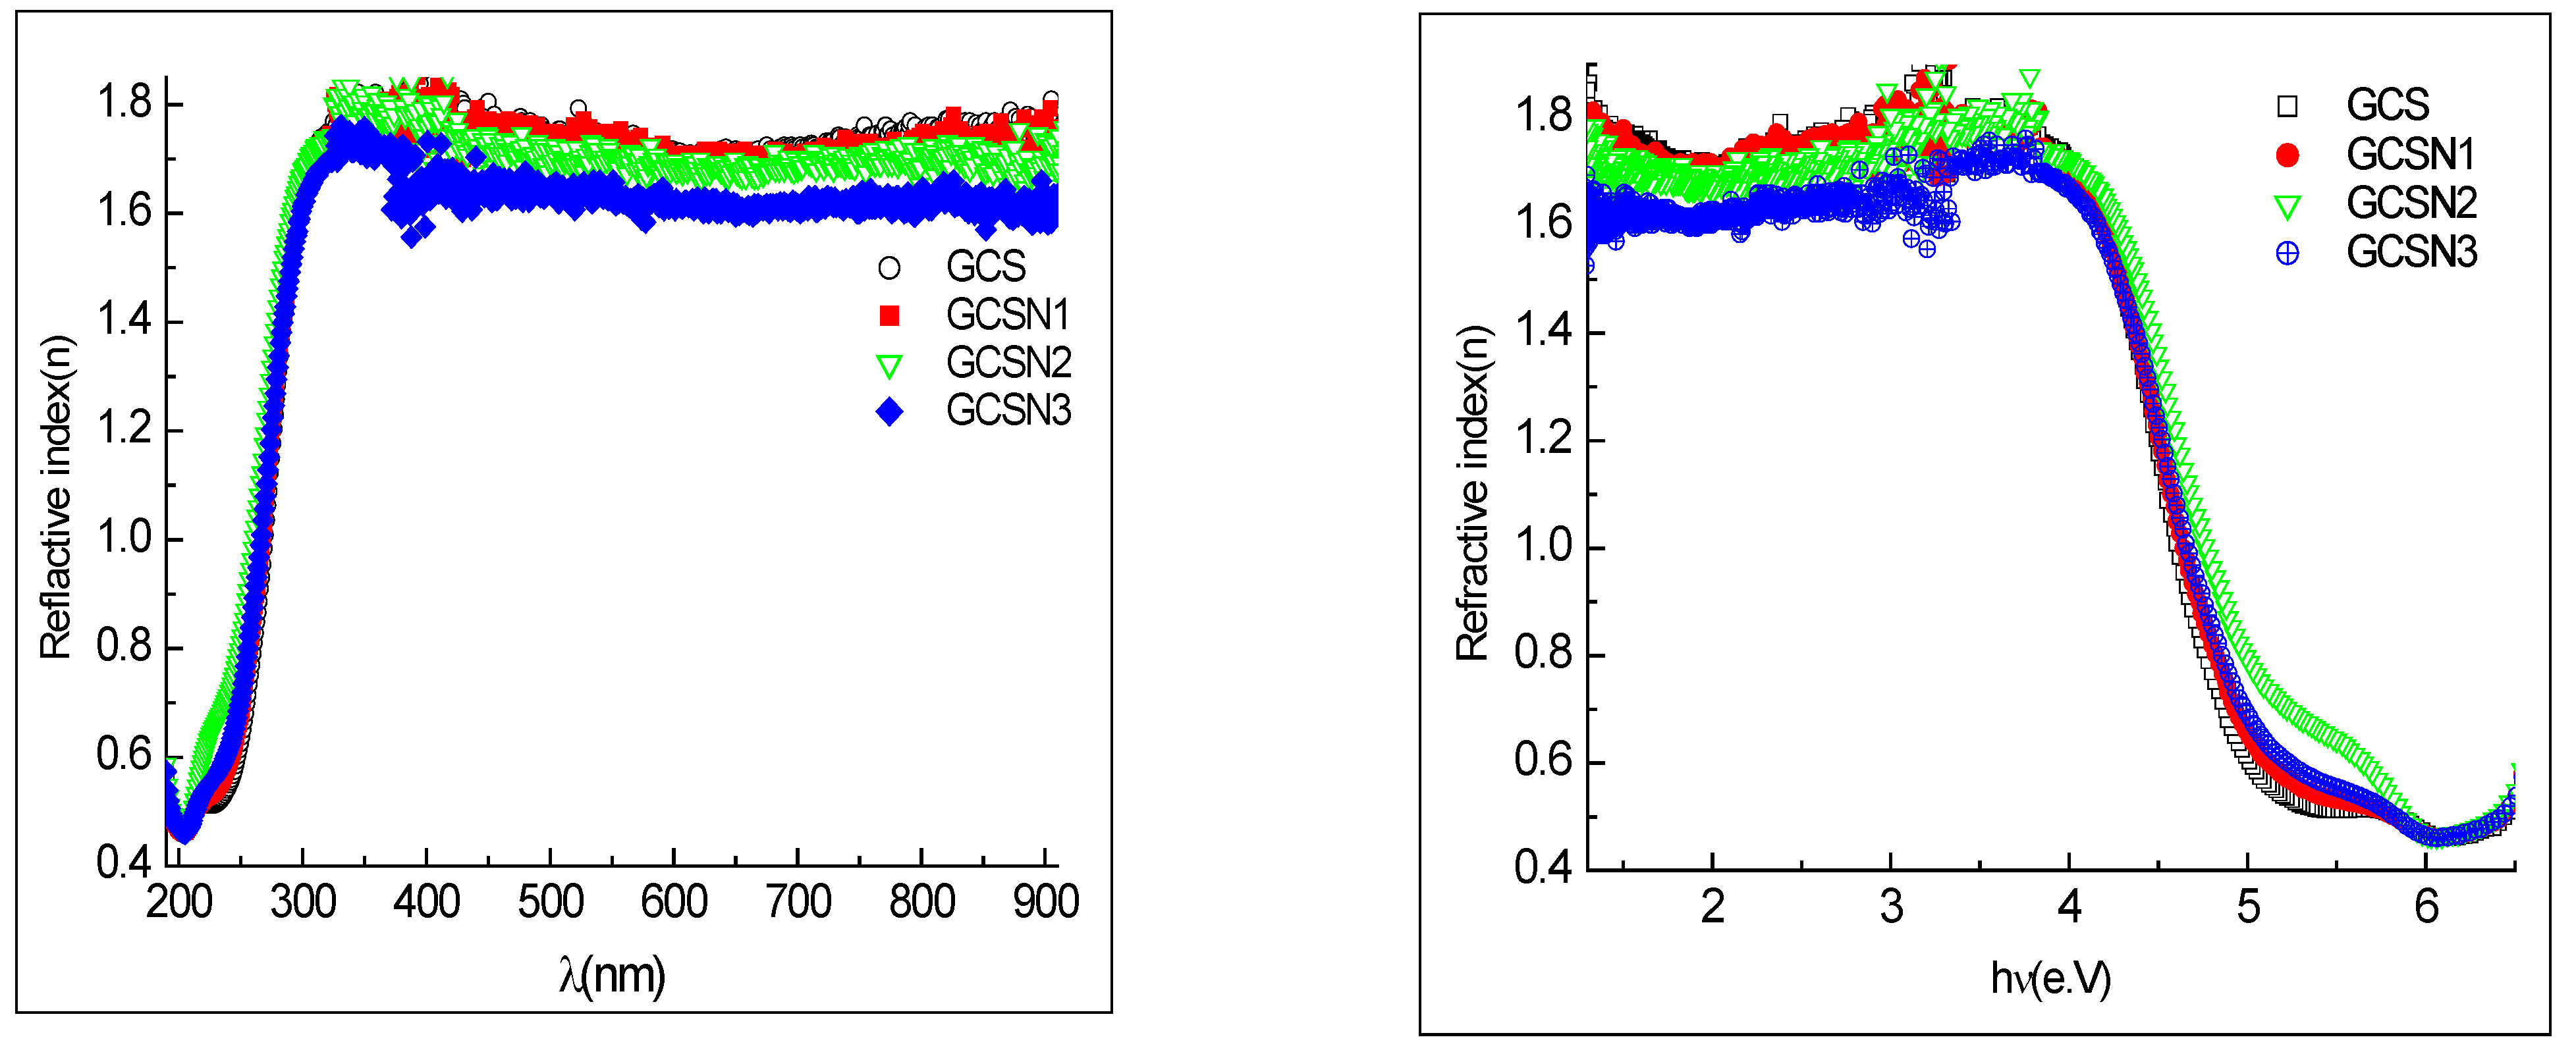
Refractive index (n) depends on wavelength, and photon energy is calculated using mathematical Equation (5): [36,37,38], Figure 6.
n = R + 1 ± 3 R 2 + 10 R 3 2 R 1
Positive refractive index (n) 1.6–1.8 indicated dispersion of incident radiation on the crystals is inversely proportional to the photon energy. Refractive index (n) is decreased by increasing photon energy and concentration of SNPs. High photon energy enables passing through the crystal lattice with low dispersion. SNPs decreased dispersion of incident radiation by improving transparency to UV radiation. High transmission and low absorbance of UV radiation and low refractive index suggest the single crystals are suitable for antireflection coating in solar thermal devices and NLO applications [38].
Figure 6. Refractive index with wavelength and photon energy.
Applnano 04 00007 g006
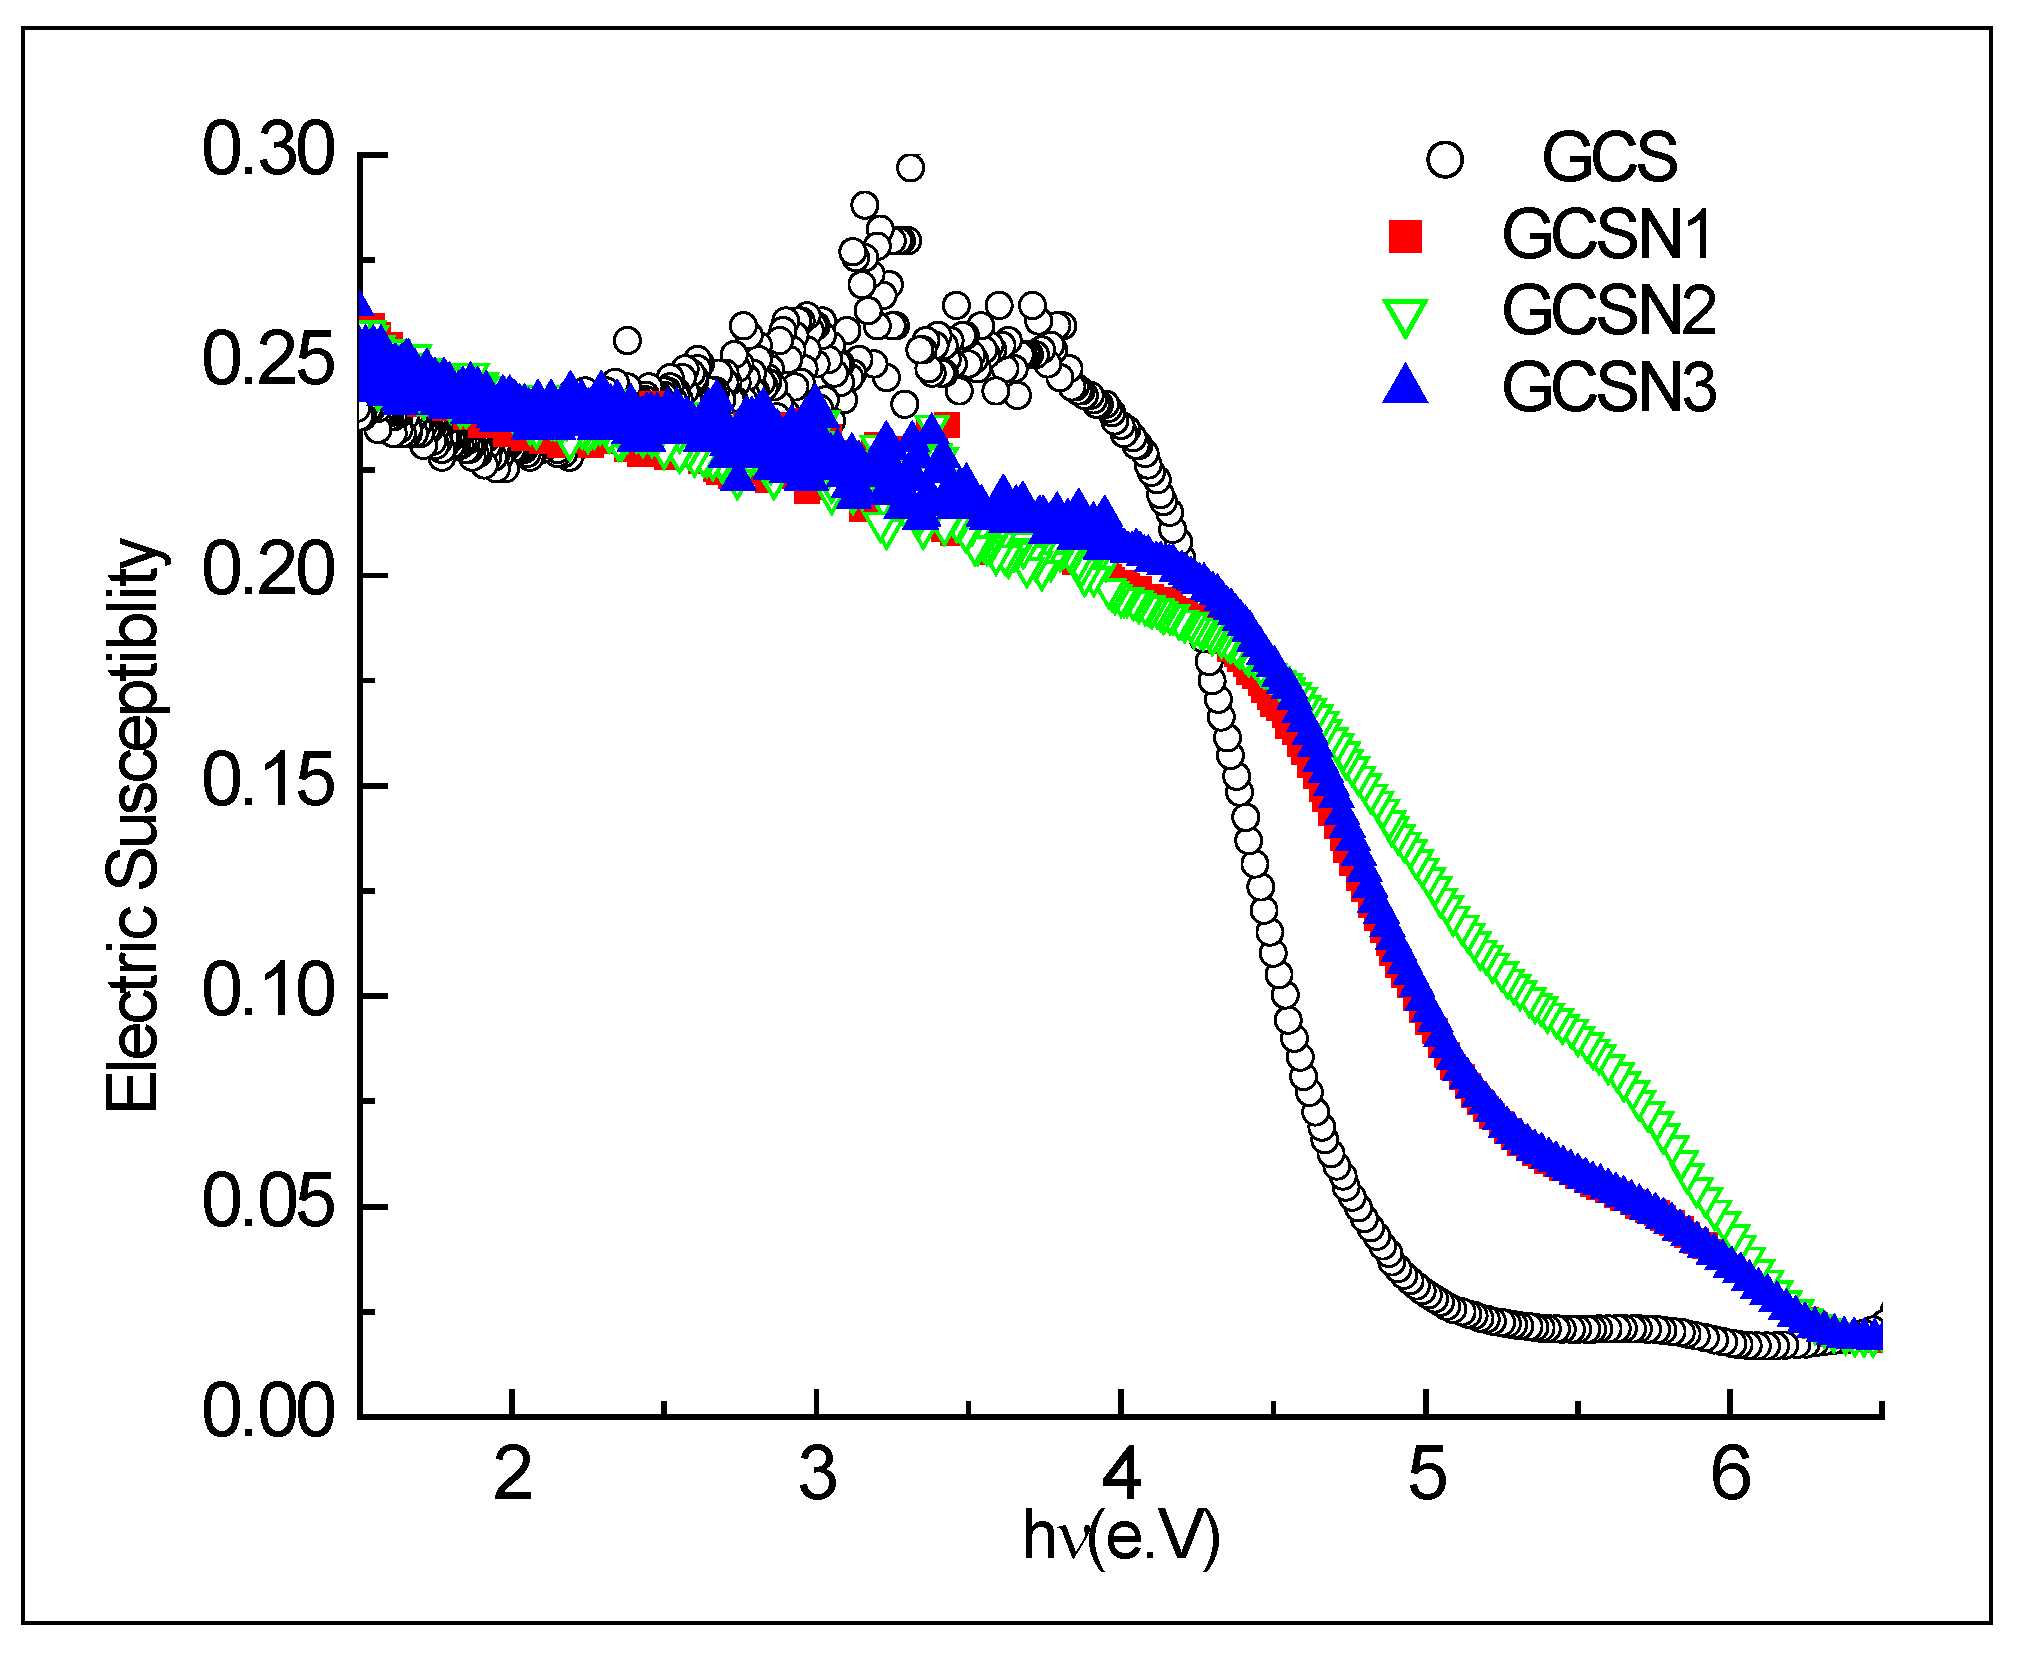
Figure 7 shows the nonlinear variation of the electrical susceptibility (χ) with the photon energy.
GSC crystals showed large noise scattering in electrical susceptibility. This scattering disappeared on doping by SNPs that elevated electrical susceptibility (χ) at high photon energy following the order:
GCSN2 > GCSN3 > GCSN1>>> GCS
GCSN3 showed lower χ than GCSN2 due to extra high crystallinity; GCSN3 decreased the mean free path for electron charge transfer.
The calculated electric susceptibility is plotted with photon energy; Figure 7 shows electric susceptibility (χ) is about 0.25 for all crystals at low photon energy.
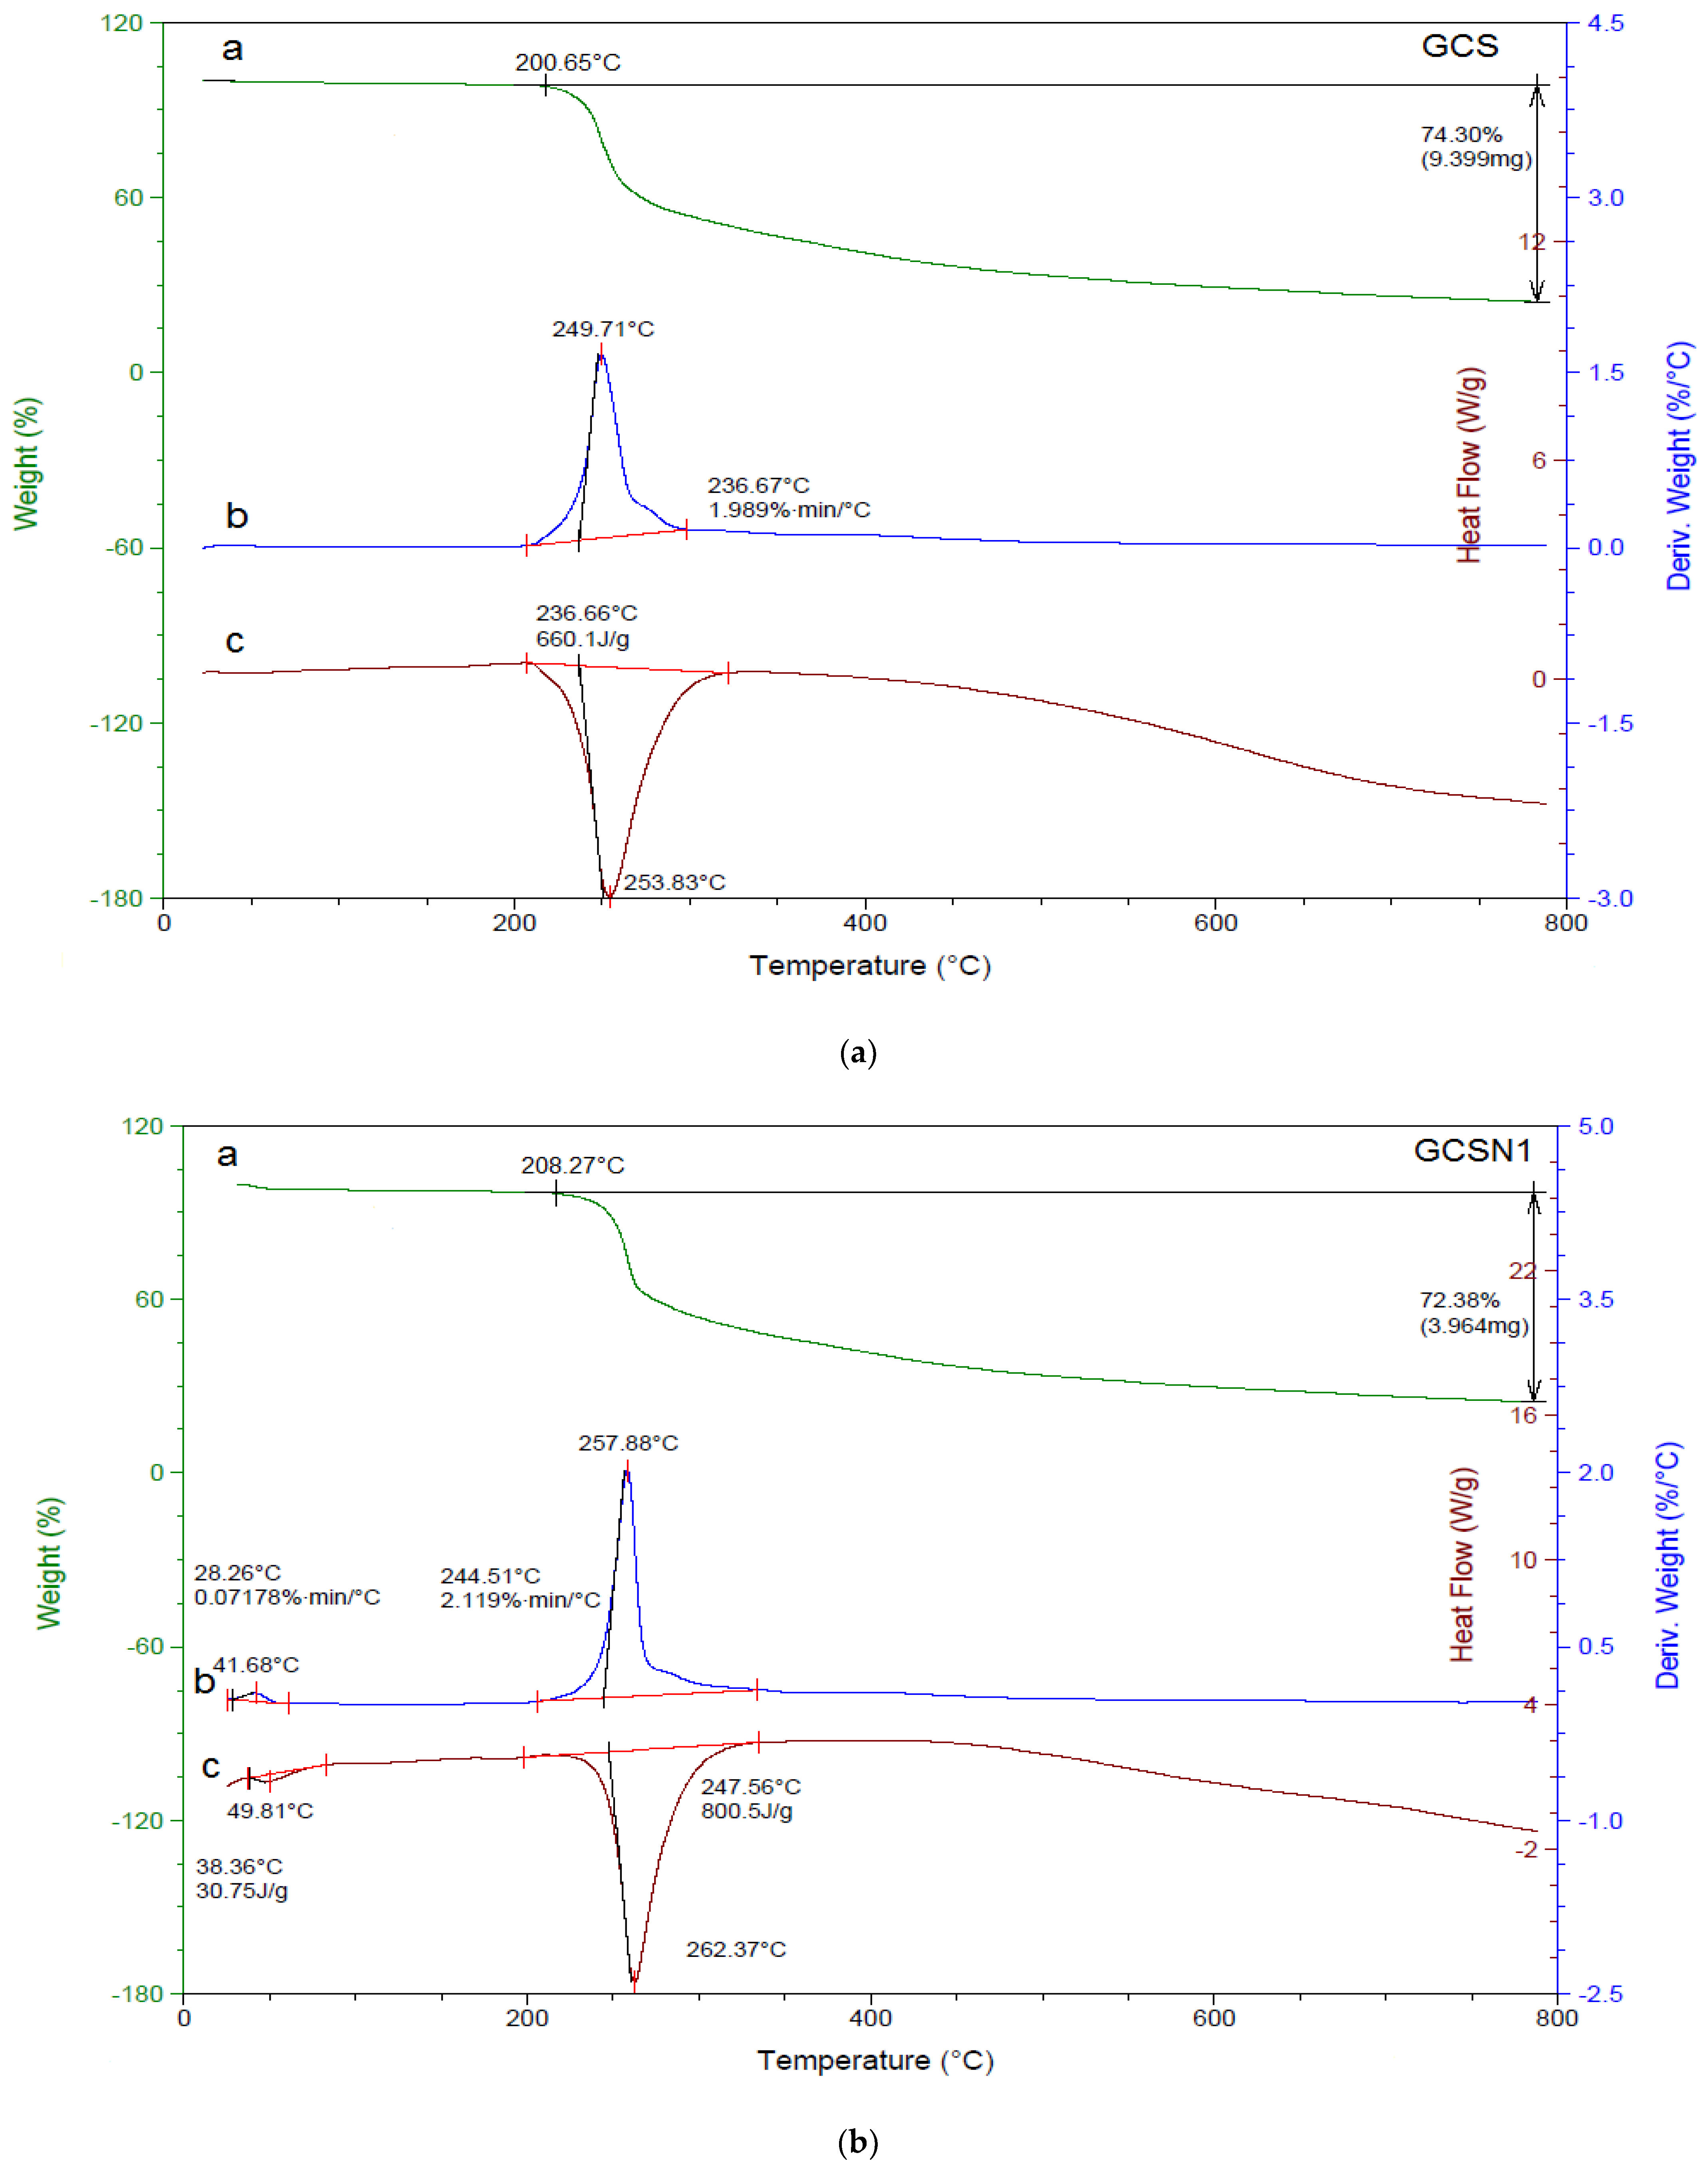
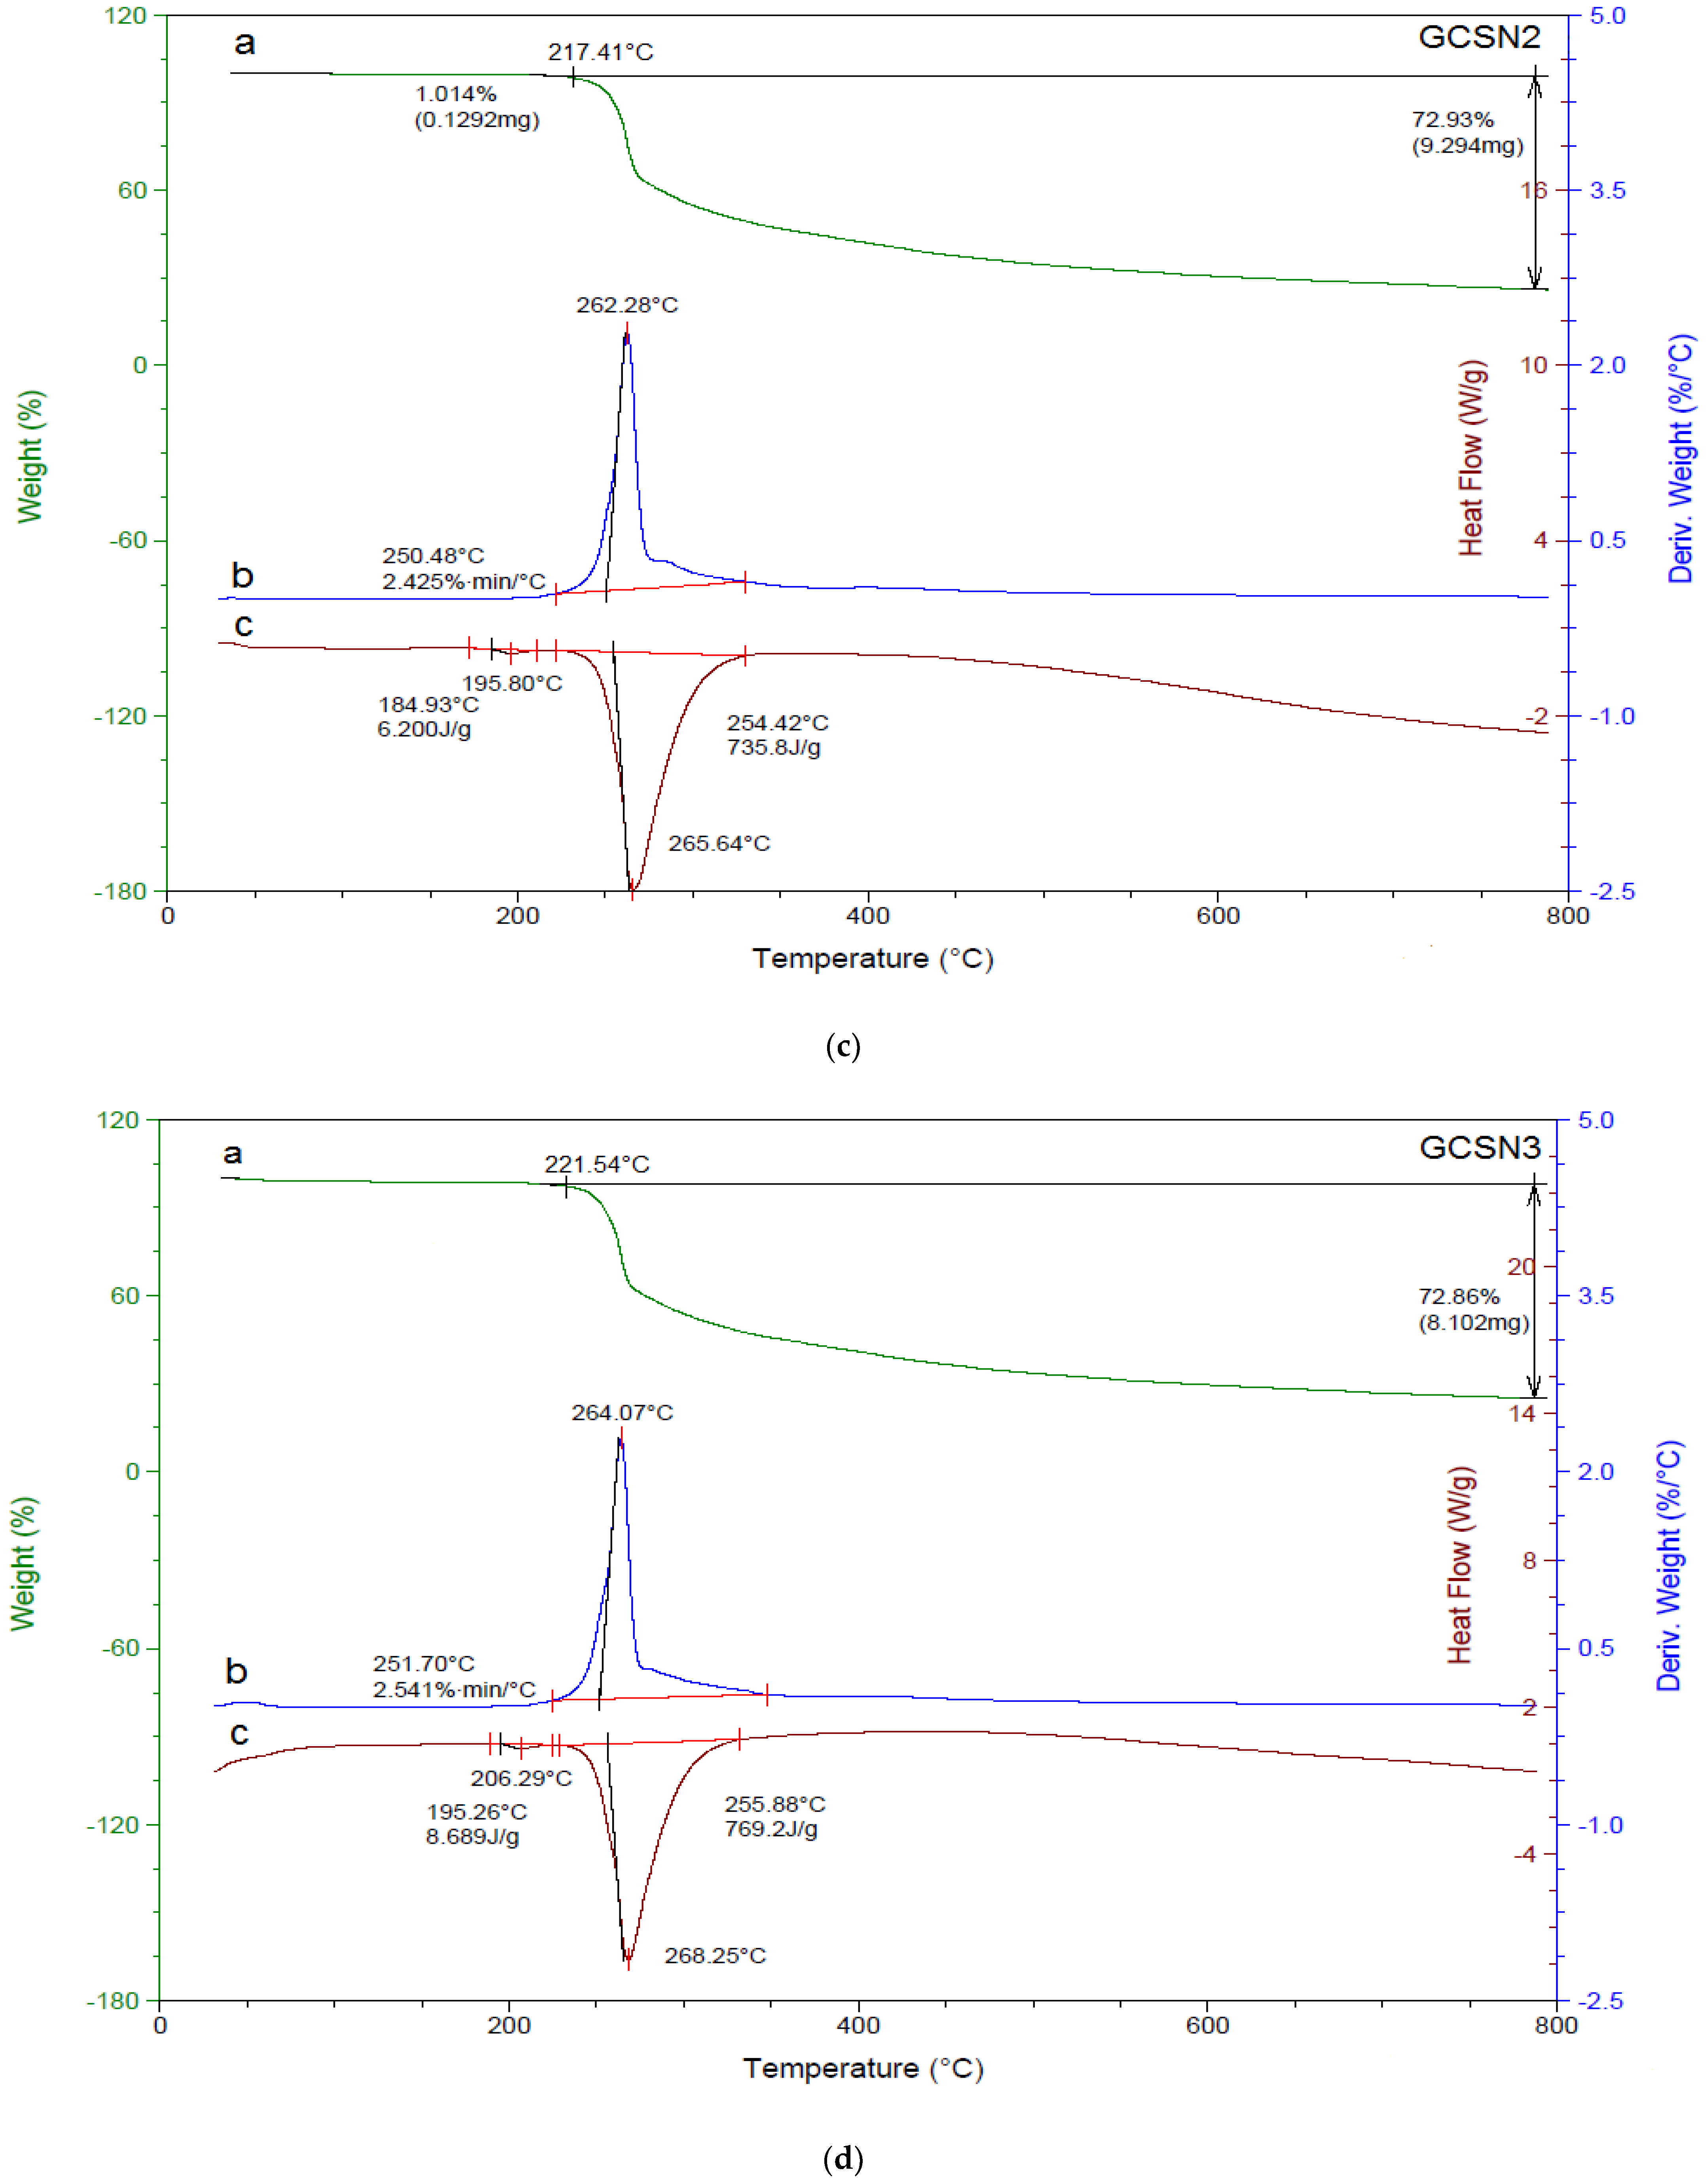
Melting point, crystallization, phase transition, enthalpy, and entropy changes are clarified using DSC thermograms [39], Figure 8a–d. A sharp endothermic peak at decomposition temperature reflects good crystallinity. A weak broad peak at 195.80 and 206.29 °C in GCSN2 and GCSN3 characterized phase change from γ -glycine to α-glycine [40]. Melting point (m.p.) is 253.83, 262.37, 265.64, 268.25 °C for GCS, GCSN1, GCSN2, and GCSN3, respectively. Increased m.p. on doping by SNPs is attributed to high thermal stability.
Heat capacity “Cp” is the ratio between heat flow to heating rate and depends on temperature: [41,42,43,44].
C p = a   T + b , C p T = α   T 2 + γ
where parameters a and b are calculated from intercept (a) and slope b of straight-line Cp-T plot. Cp of all prepared single crystals showed nonlinear variation with the absolute temperature, Figures S4–S7.
Thermal lattice coefficient α and electronic heat capacities γ are obtained from linear C p T   v e r s u s T2 plot, (coefficient, R2 above 0.99) Figures S4a,b and S7a,b. Table 5 shows linear fits parameters of DCS.
Heat capacity at constant pressure, Cp, is the heat required to raise the temperature of the crystal sample by 1 °C and represents the variation of the heat content of the crystal sample on heating. The variation of α, γ coefficients approved Cp variation with temperature. This finding indicated that the Cp amount of thermal heat absorbed by the crystals increases on heating, enabling the application of a heat shielding coating on thin film glasses.
Thermograms are shown in Figure 8a–d. DTG showed one peak confirmed one thermal decomposition step. GCS showed weight loss (wt. loss) 74.3 wt. % at temperature range 200.65–787.67 °C, DTG peak at 249.7 °C. Glycine decomposed into CO2, NH3 [45] leaving 25.7% residue, 72.31%. GCSN1 decomposed at 208.27–788.29 °C and 27.69% residue. DTG peak was at 257.88 °C. In addition, 72.93 wt. % of GCSN2 decomposed at 217.41–788.84 °C, 27.07 wt. % residue, DTG peaked at 262.28 °C. Additionally, 72.86 wt. % of GCSN3 decomposed at 221.54–787.96 °C, gave 27.14 wt. % residue, and peak at 264.07 °C. SNPs decreased wt. loss on thermal decomposition of the crystals. Higher residue left after thermal decomposition confirmed improved crystallinity on doping GCS by SNPs.
Crystals contain no water of crystallization as wt. loss at 100 °C is absent [46]. TGA thermograms confirmed thermal stability up to 200.65, 208.27, 217.41, and 221.54 °C for GCS, GCSN1, GCSN2, and GCSN3, which enabled laser applications [47]. Peak temperature Tm increased from 249.71 to 257.88, 262.28, 264.07 °C on increasing SNPs’ concentration.
ESR spectra of powder sample crystals are shown in Figure 9. Anisotropy g-factor for crystals confirmed low symmetry. Spin Hamiltonian parameters g and A tensors revealed rhombic symmetry crystal field around Cu(II) ion split ground state. Degeneracy of ground state energy level is lifted giving static Jahn–Teller distortion [48,49].
Value g and unpaired electronic state R are given by Equations (7) and (8): [50,51].
g = g x + g y / 2
R = (gx − gy)/(gz − gx)
Table 6 includes g factor, hyper fine constants A, and R for the crystals.
Values A and g factor have no axial symmetry in the crystal lattice (no dynamic Jahn–Teller) [52]. R = 0.1805, 0.1224, 0.1673, 0.1418 for GCS, GCSN1, GCSN2, and GCSN3, respectively; less than unity indicated dx2−y2 ground state for unpaired electron [53].
Ax, Ay equals A are lower than Az; g-parallel is greater than perpendicular g and confirmed dx2−y2 ground state [52]. g value is less than 2.3, indicating strong covalent copper–glycine bond [54].
σ bond coefficient or covalence parameter α2 for unpaired electron density on Cu(II) ion is estimated using Equation (9) [54,55], Table 7.
α 2 = A / 0.036 + ( g 2.0023 ) + 3 / 7 ( g 2.0023 ) + 0.04
where
A = A Z , A = ( A x + A y ) / 2
The parameter α2 is less than unity, indicating covalent bonding between Cu(II) and glycine ligand [56]. SNPs decreased covalence parameter (α2) of glycine-Cu(II) bond, except that GCSN2 showed abnormally high α2, which confirmed its highest electrical susceptibility.
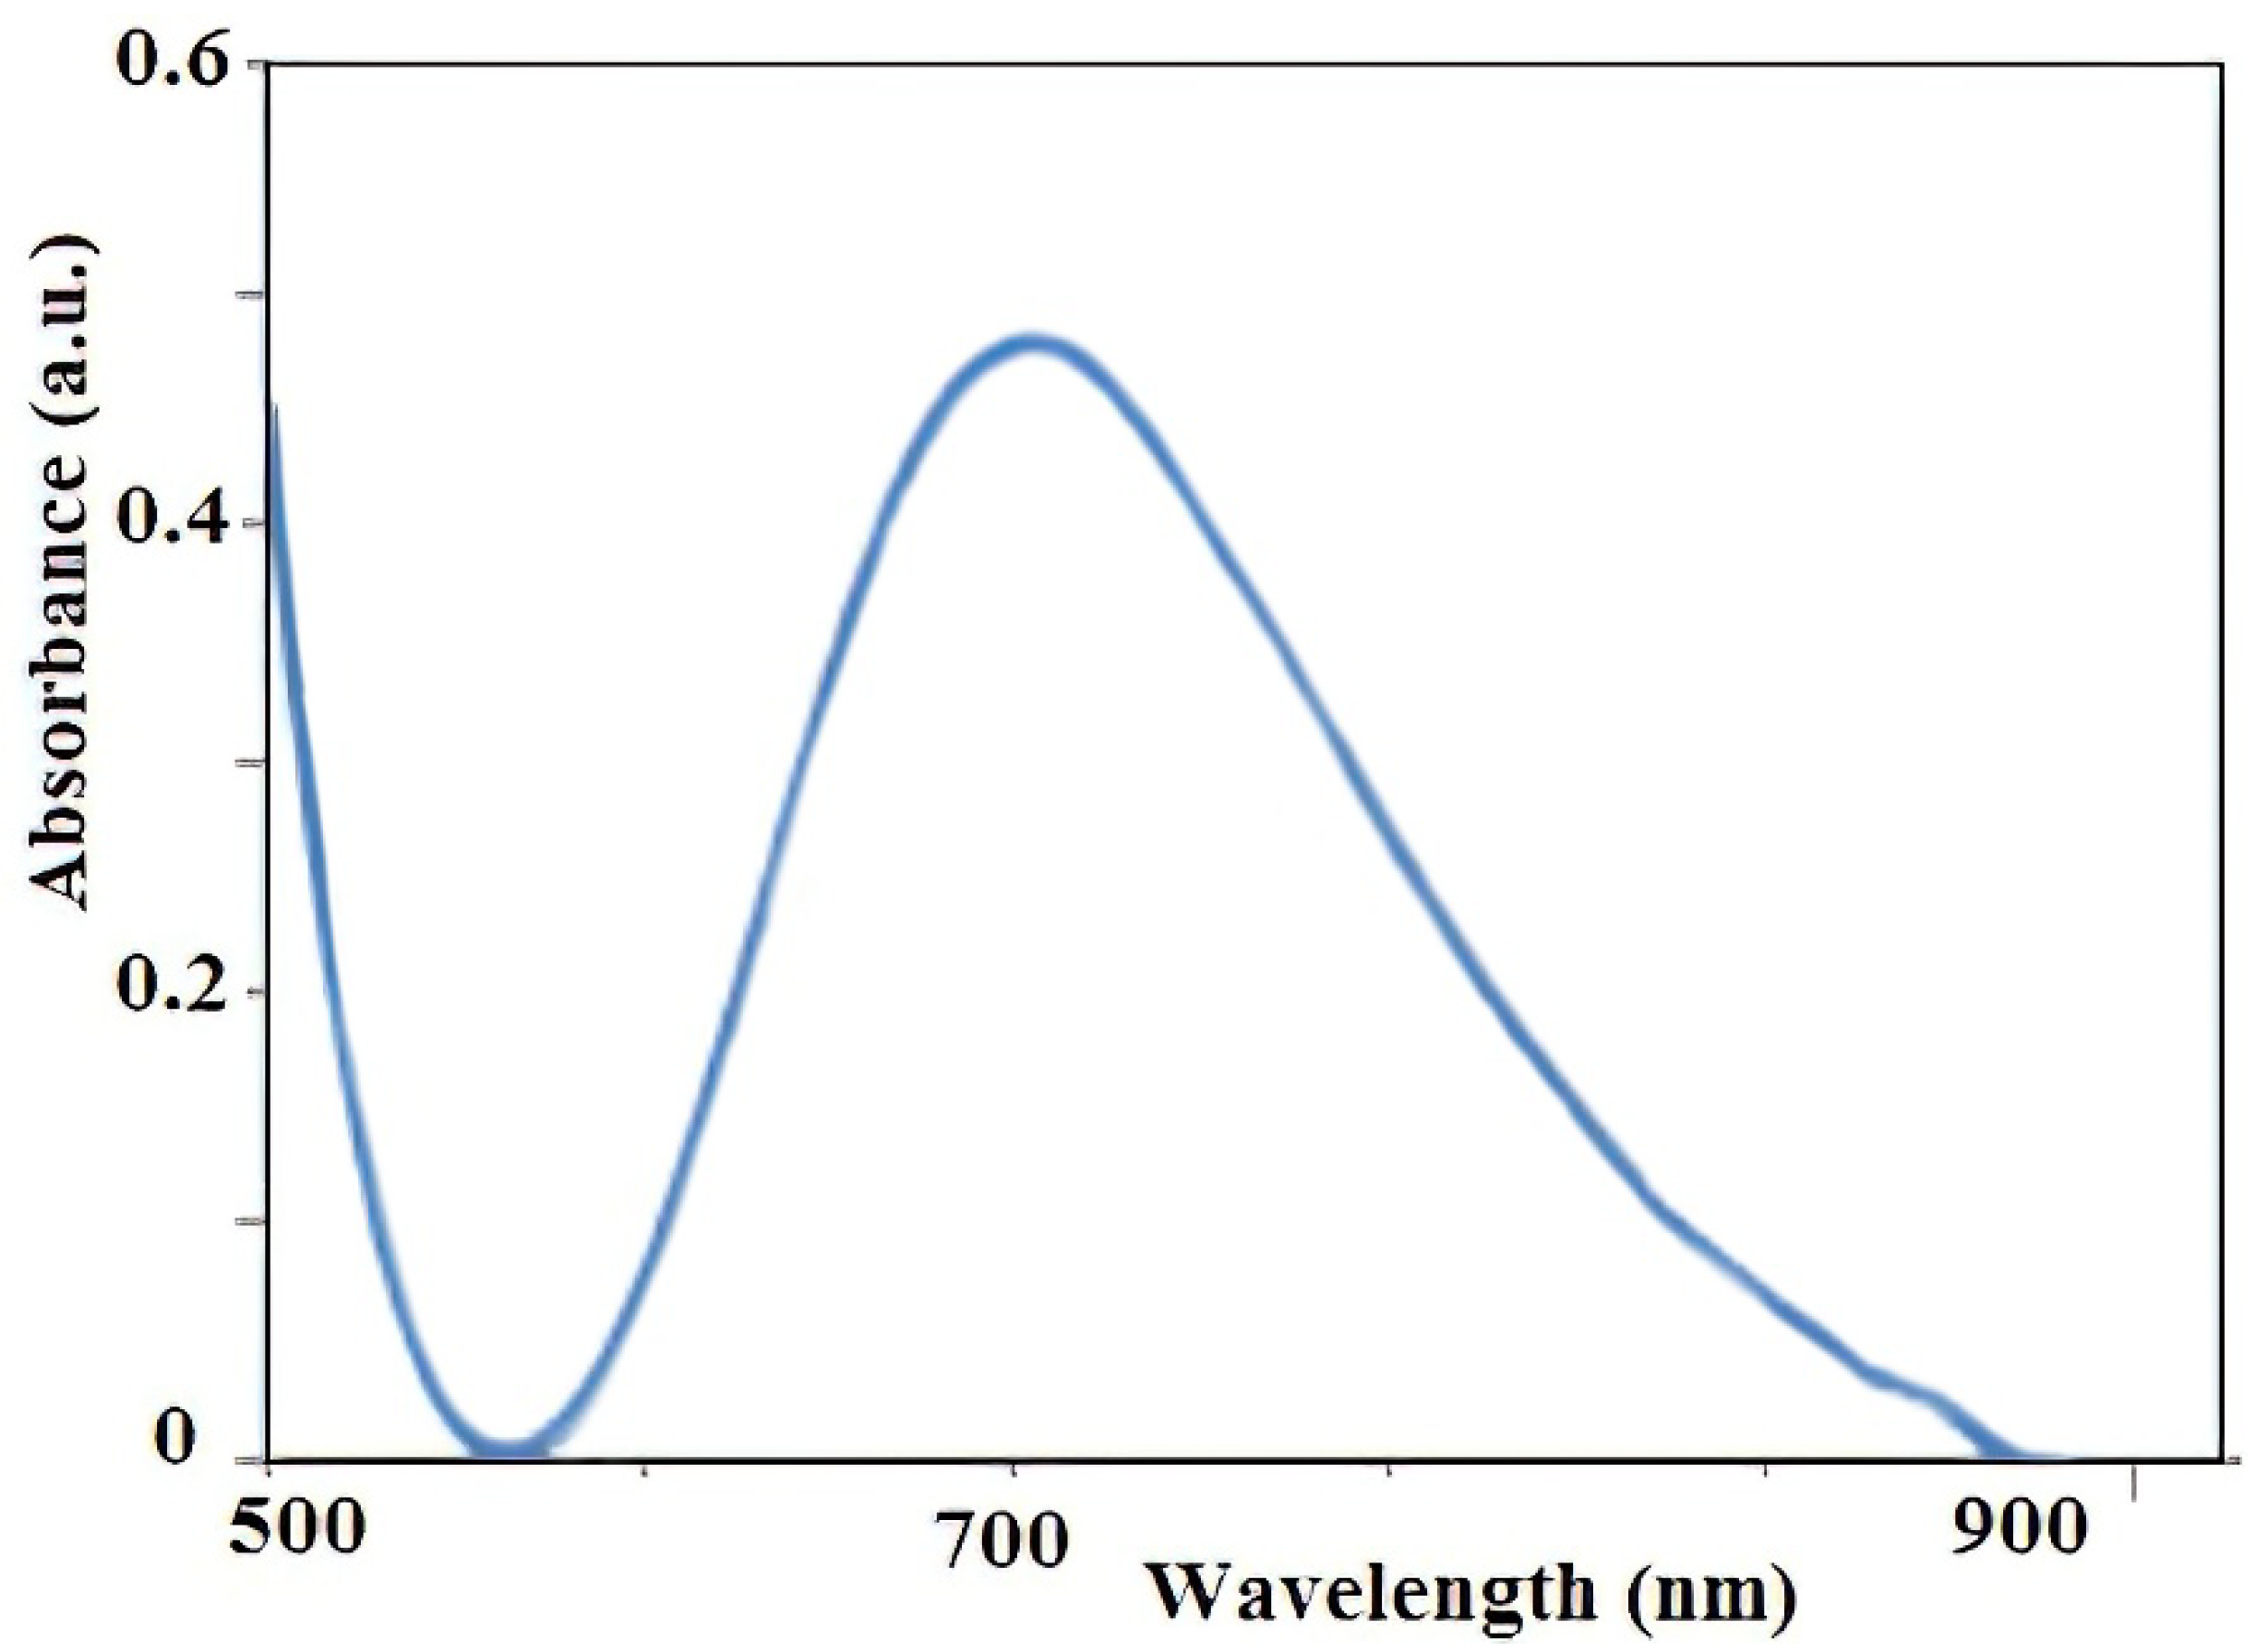
Figure 10 showed UV of thin film coating of GCSN3 on the aluminum (Al) foil sample. An aqueous solution of GCSN3 was evaporated under ultra-high vacuum conditions onto the Al foil where carboxylate COOH of glycine zwitterion amino acid is chemically adsorbed on the aluminum surface. Absorption at long λ 900–1100 nm for this crystal near IR region indicates absorption of thermal energy of IR radiation. Phonon bands at 900 nm originate from vibrational modes of harmonic and unharmonic oscillators in the crystal lattice. Absorbed IR radiation causes thermal vibrations of atoms or molecules and creates thermal phonon waves that propagate in the crystal lattice, dissipating thermal IR energy.
Absorptivity of GCSN3 near the IR region of electromagnetic radiation indicated that crystals can shield thermal heat of IR radiation on the coating as dispersed thin film on alumetal.
The sun provides thousands W·m−2 energy on the earth’s surface daily. Total solar energy in the upper atmosphere contains 50% IR radiation, 40% Vis. Light, and 10% UV radiation. IR radiation causes vibrations that heats earth’s surface [57]. Attenuation of thermal energy can be achieved by painting glass windows with these blue color crystals transparent to UV radiation, filtering, and that dissipates IR radiation.
High thermal conductivity of crystals equals: 1.10, 1.21, 1.54, and 1.6 W·m−1K−1 for GCS, GCSN1, GCSN2, and GCSN3 confirmed rapid attenuation of many incident EM waves by dielectric components and rapidly dissipated as heat.
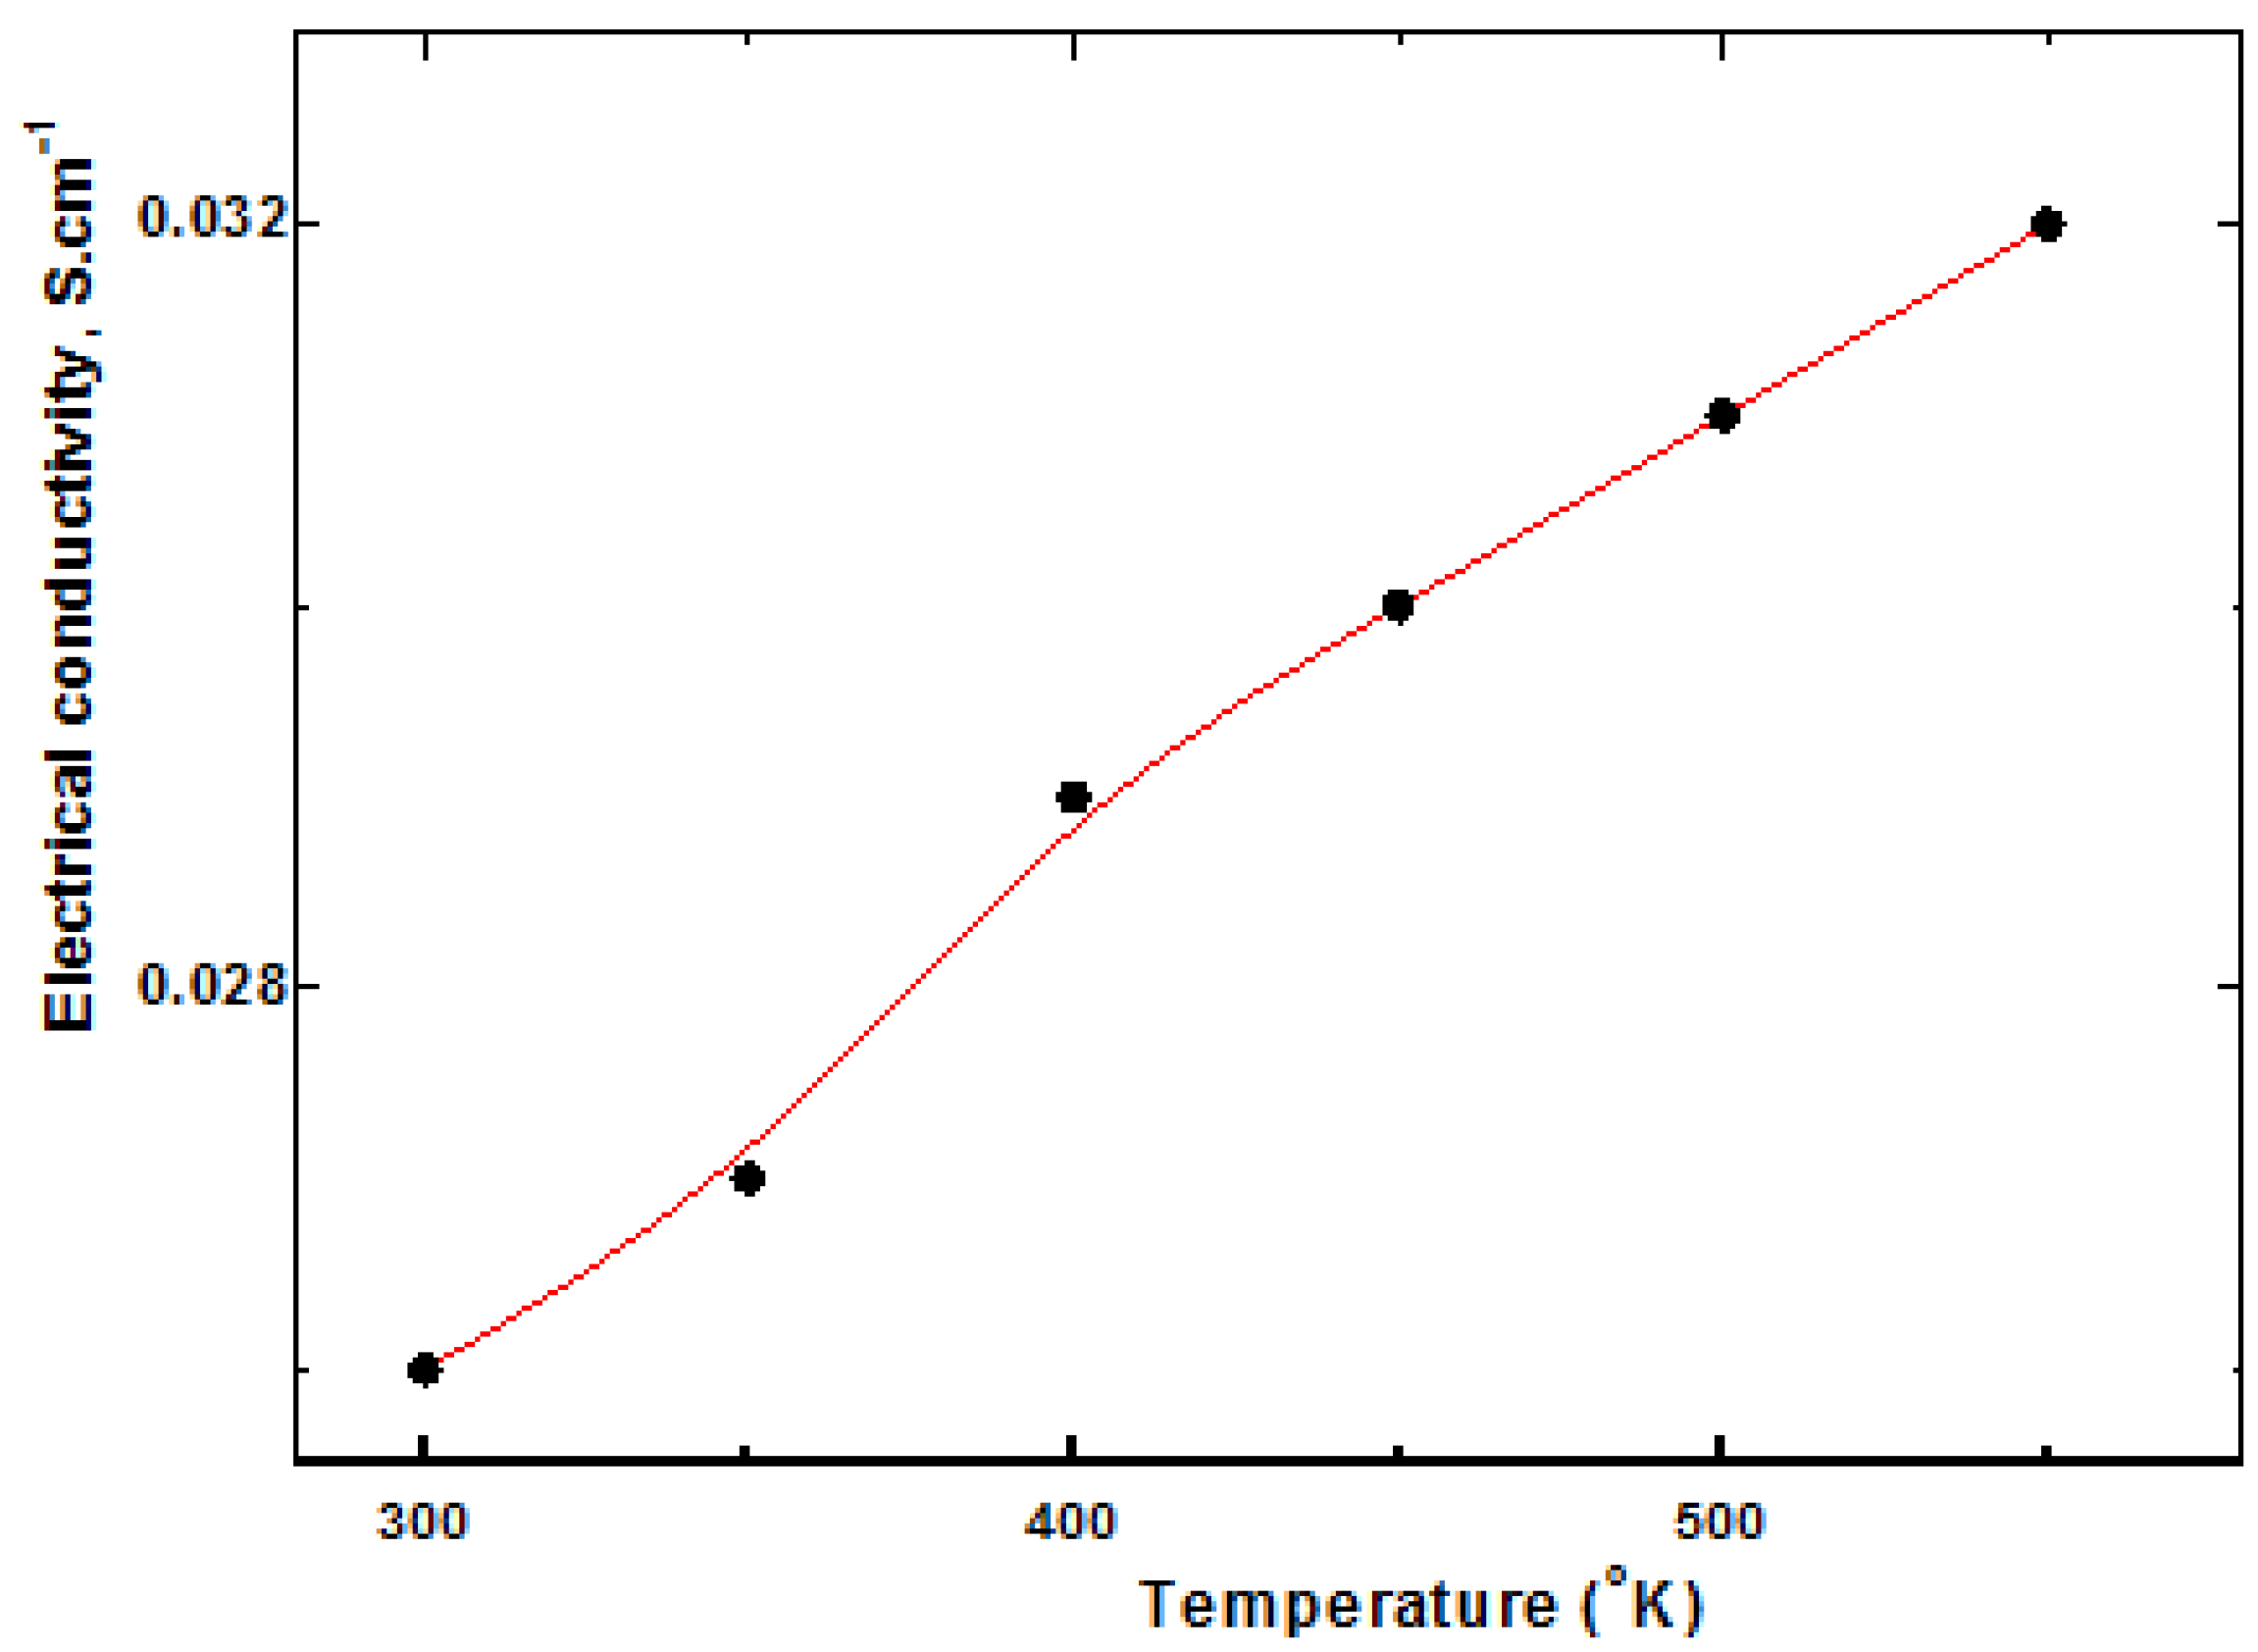
Figure 11 showed electrical conductivity of GCSN3 increased on heating as a typical semiconductor behavior due to thermally activated charge carriers’ mobility [58].
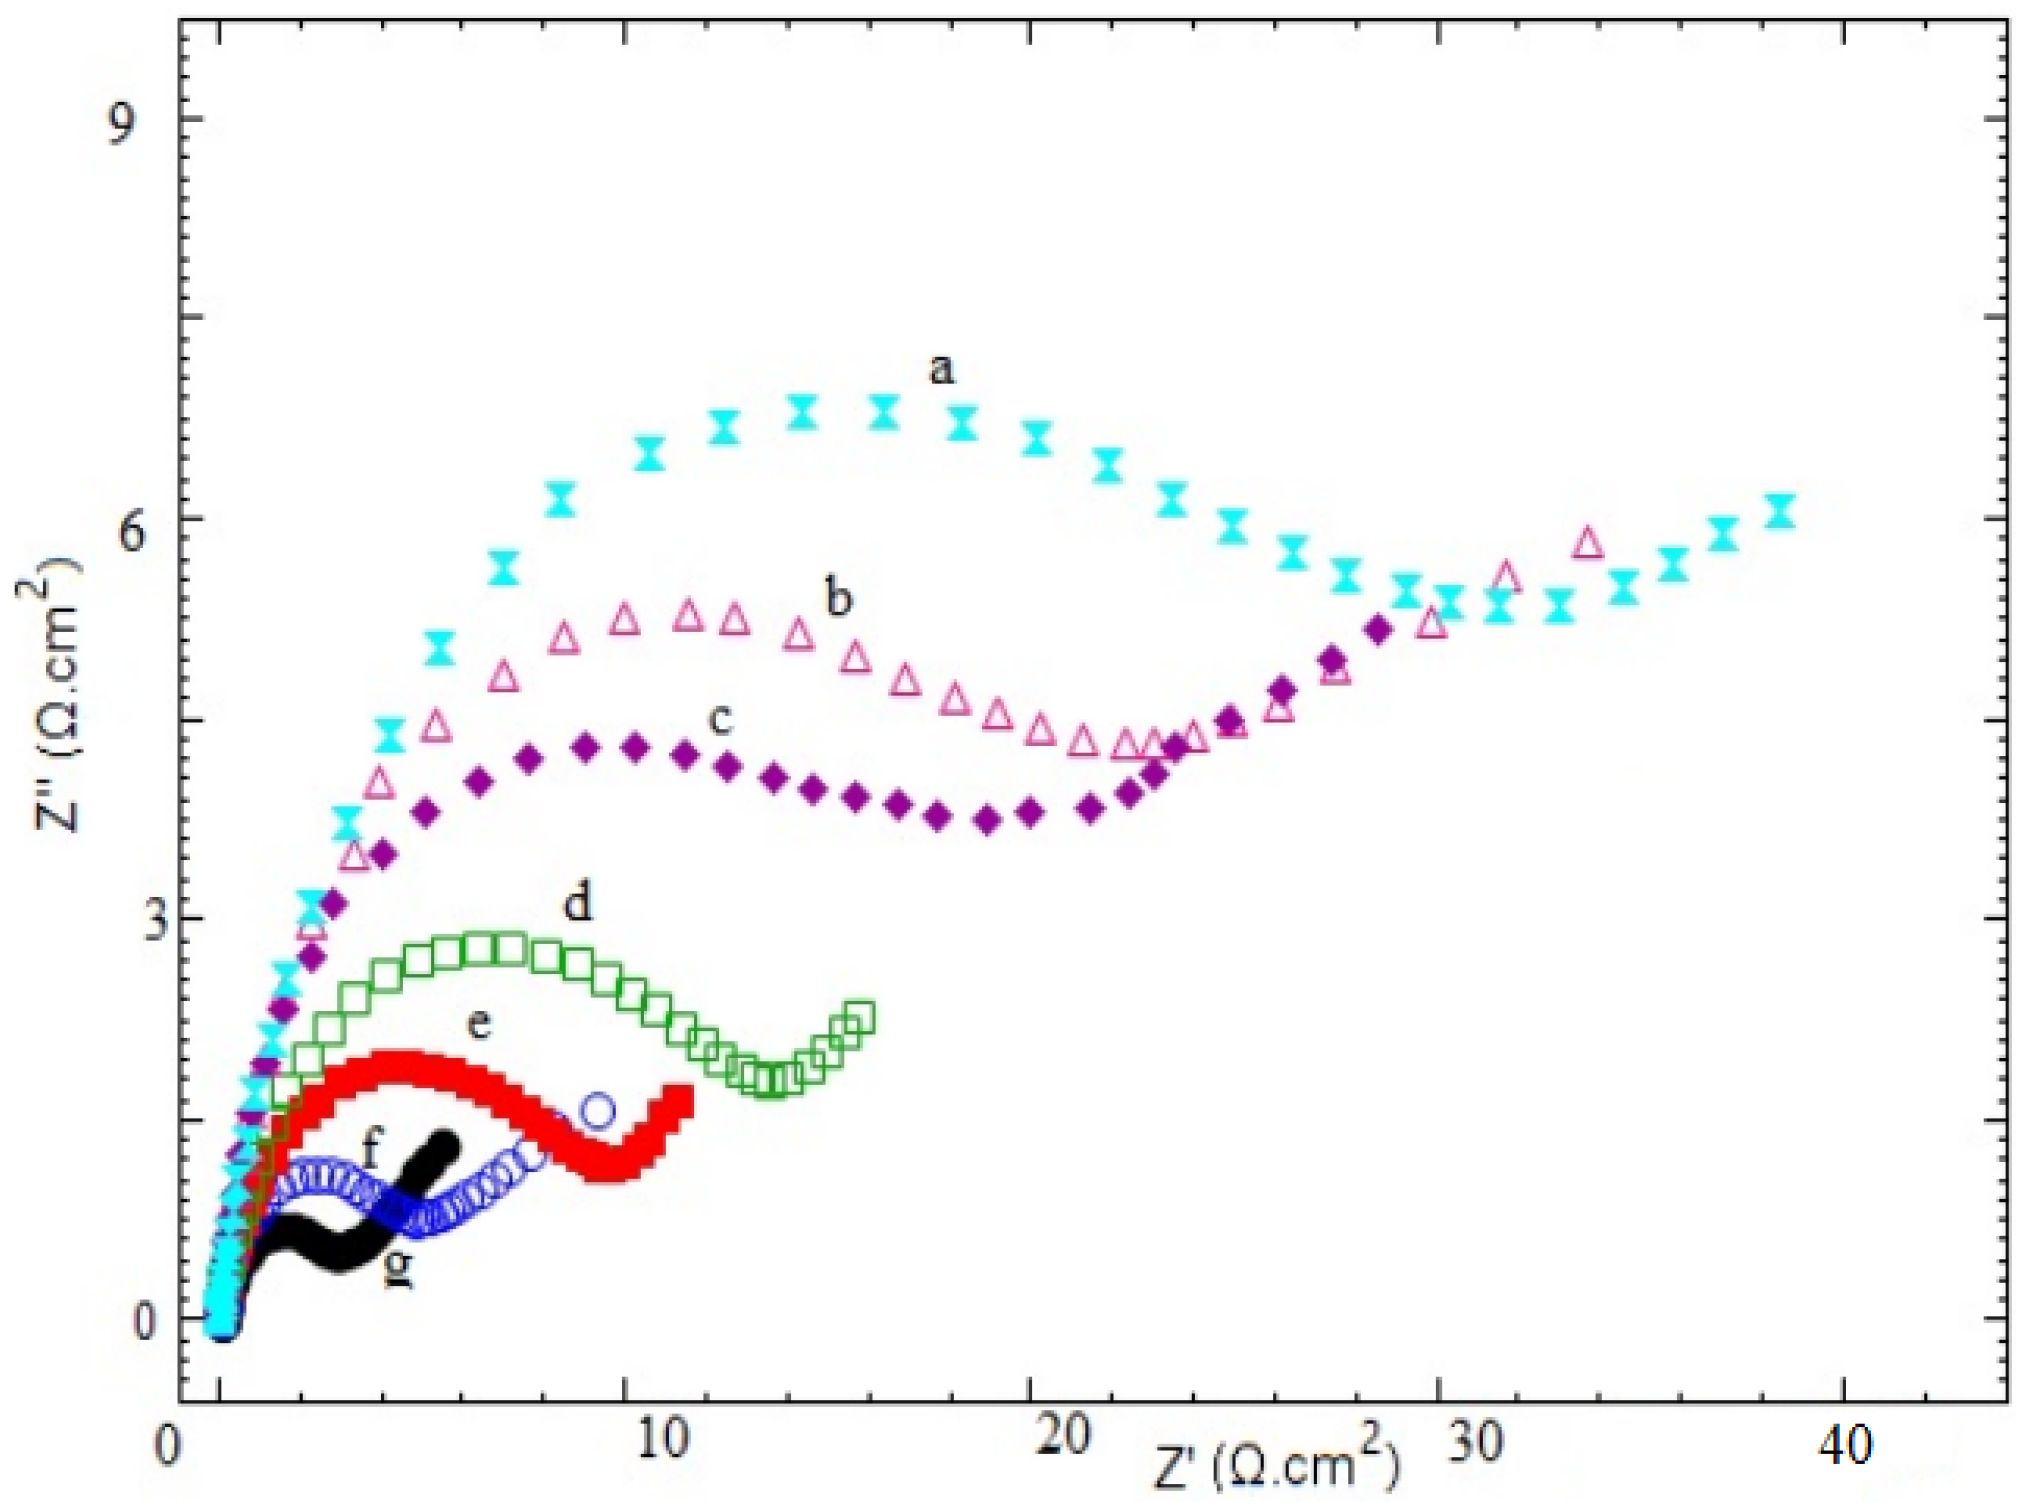
Figure 12 showed variation of impedance of GCSN3 with applied frequency.
Impedance plots confirmed super conductivity. A plateau region at low 0.1Hz frequency region represents total conductivity of grain boundary. A high-frequency region at 100 kHz represents the contribution of grains to total conductivity. An intermediate frequency region at 1 kHz is due to charges trapped between grain boundaries and grains [15]. AC conductivity confirmed the dielectric nature of a single crystal can dissipate heat rapidly. The high-frequency dielectric constant is 4.49.
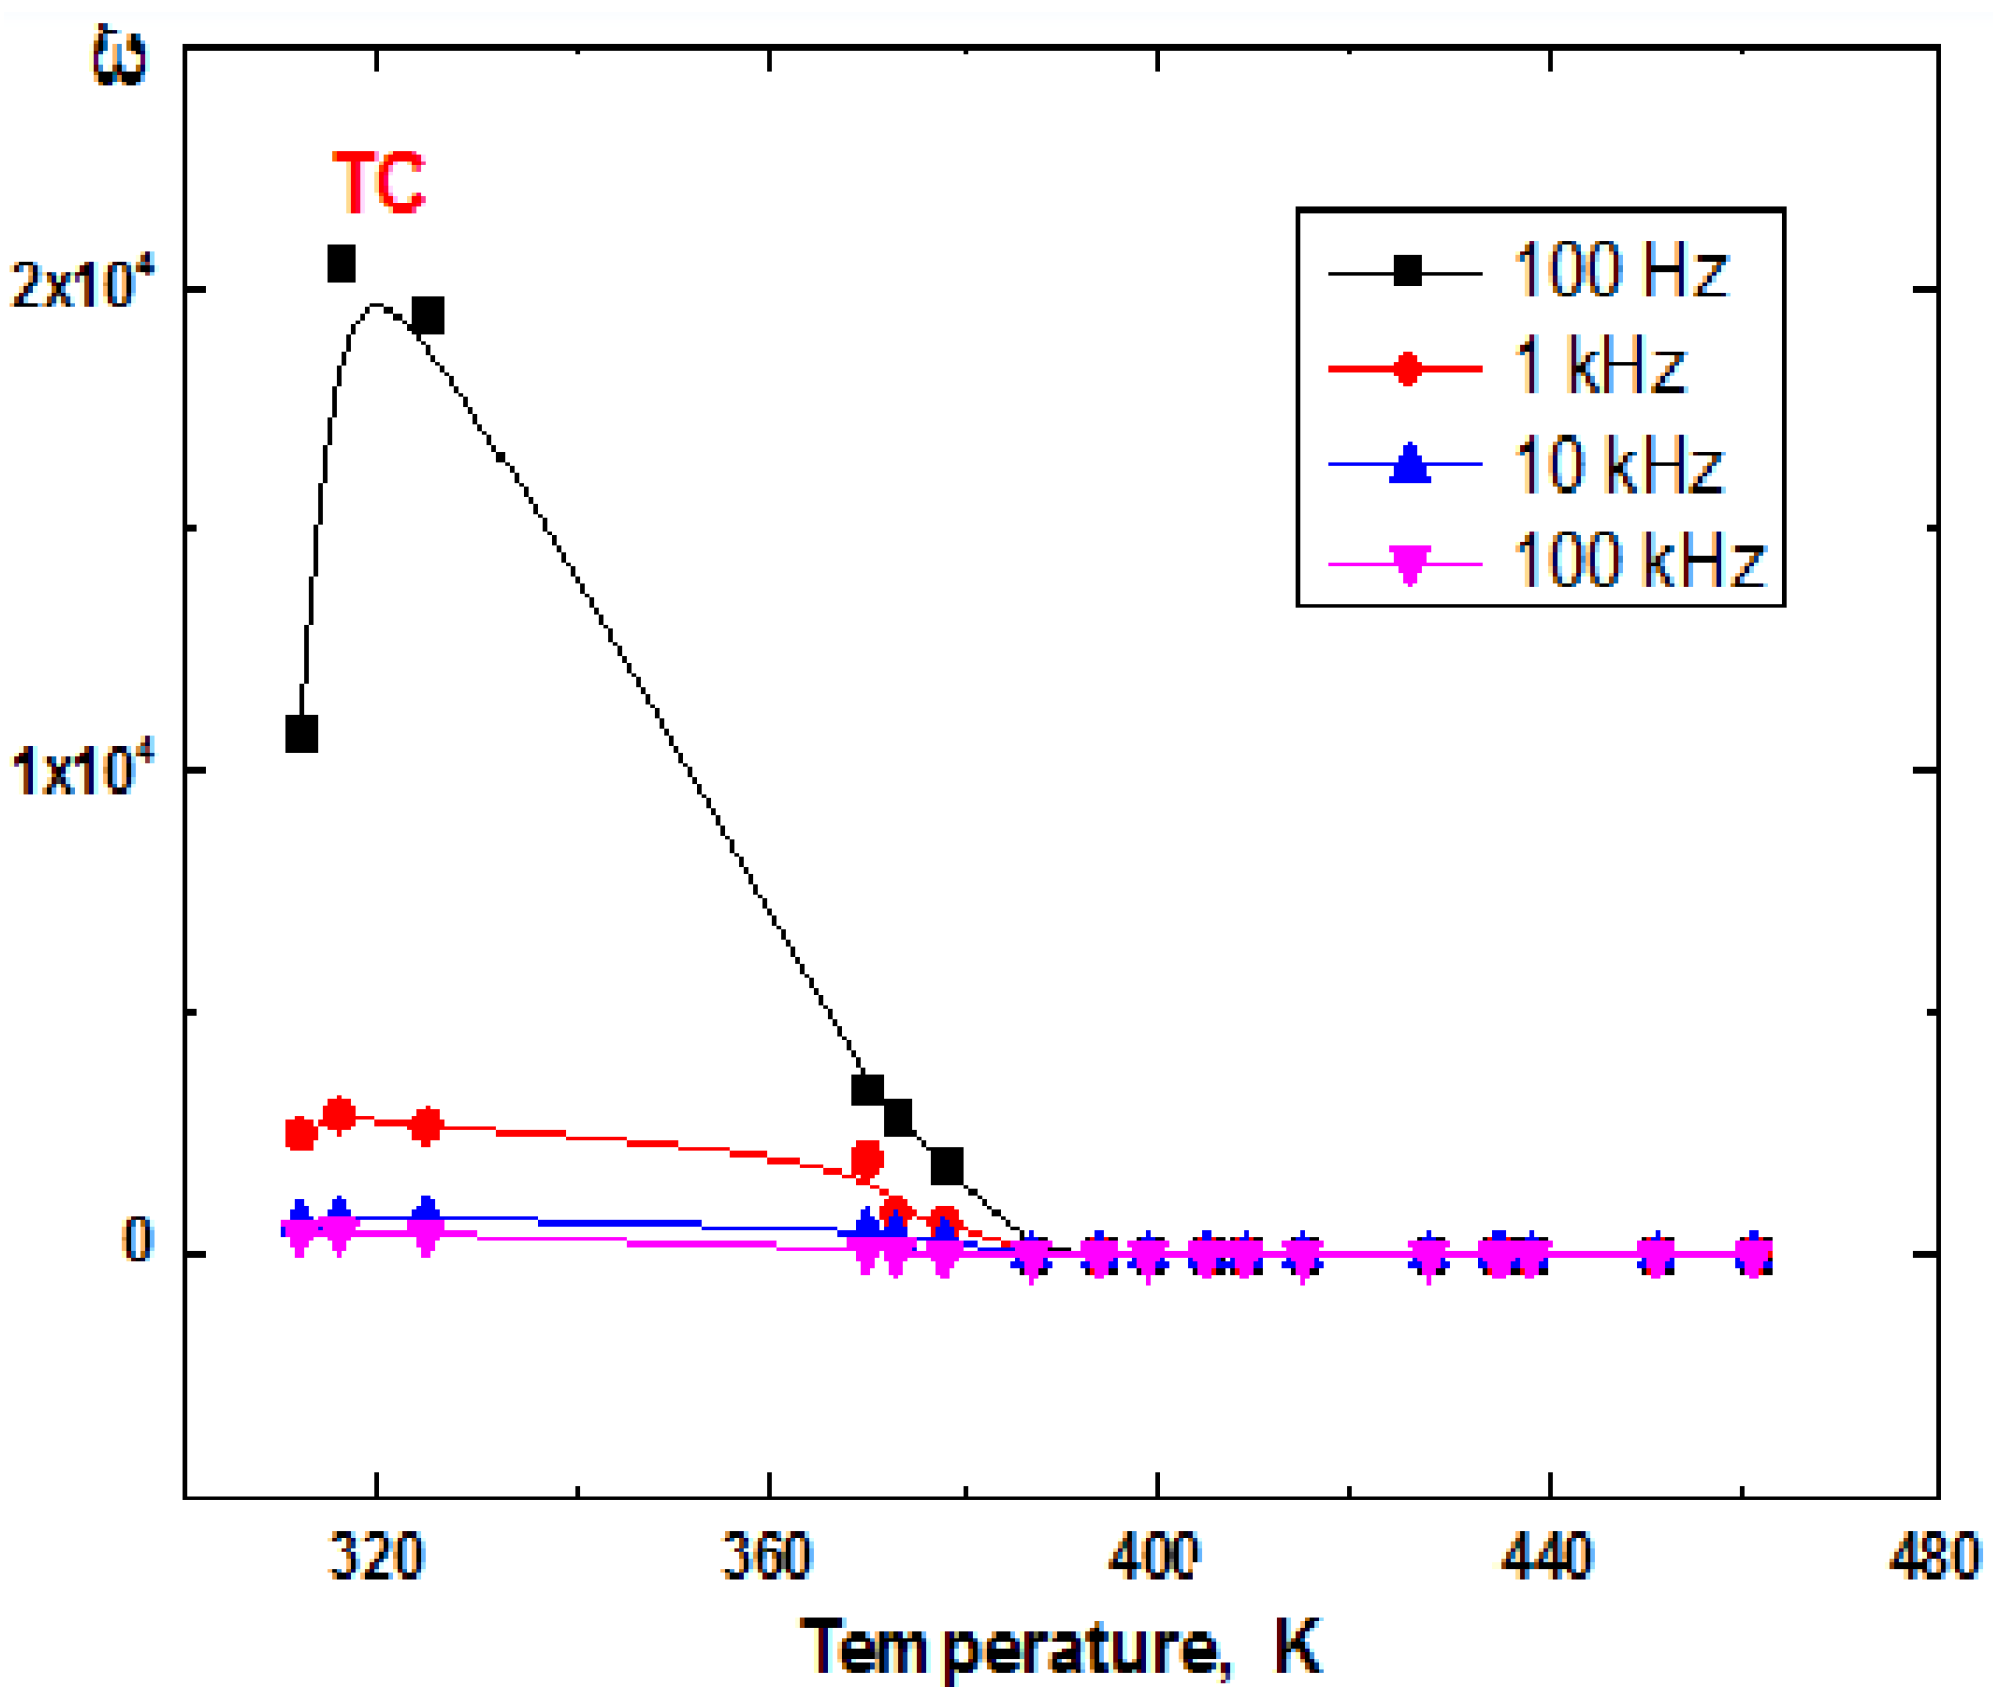
Dielectric study of GCSN3 crystal response of charges to applied electric field showed dielectric constants at 100 Hz, 1 kHz, 10 kHz, and 100 kHz and a temperature range of 200–550 K. Dielectric constant was calculated using equation [59]:
ε = C d ε o A
where ε o is free space permittivity, C and d are capacitance and thickness of pellet, and A is electrode area.
Real ε′ and imaginary ε″ components of ε represented equals [60]:
ε′ = |ε|cosθ, ε″ = |ε|sinθ
Figure 13 showed ε′ varied with temperature at a different frequency and decreased with increasing frequency, indicating an ability to dissipate incident IR radiation. ε′ decreased until it reached glass transition Tg at 380 K, then became limited up to 470 K. Peak at Curie TC represented phase transition from ferroelectric to paraelectric behavior.

4. Conclusions

SNPs dopant increased thermal stability of gamma and alpha glycine single crystals. Optical absorption studies revealed that cut-off wavelengths are 287, 283, 276, and 280 nm and optical band gap energy 4.58, 4.61, 4.65, and 4.67 eV for GCS, GCSN1, GCSN2, and GCSN3 single crystals, respectively. SNPs increased band gaps of crystals, hence transparency to UV radiation. AC electrical conductivity of the thin film sample of perfect crystal increased to 0.03 Siemens/cm. High thermal conductivity, W·m−1K−1 in range 1.10–1.6, confirmed efficient radiation attenuation by rapid heat dissipation due to dielectric properties of single crystals. Single crystals could be used to shield and dissipate thermal heat of IR radiation. AC confirmed the dielectric component and increased on heating due to thermal activation of charge carriers.

Supplementary Materials

The following supporting information can be downloaded at: https://www.mdpi.com/article/10.3390/applnano4020007/s1, Figure S1. Mass spectra of the single crystals (a) GCS, (b) GCSN1, (c) GCSN2 and (d) GCSN3; Figure S2. FTIR spectra of the single crystals GCS, GCSN1, GCSN2 and GCSN3; Figure S3. Plot extinction coefficient (k) (a) and reflectance versus (b) photon energy (eV) of GCS, GCSN1, GCSN2, and GCSN3; Figure S4. DSC curves for GCS crystals: a. specific heat capacity versus T, b. Cp/T versus T2; Figure S5. DSC curves for GCSN1 crystal: a. specific heat capacity versus T, b. Cp/T versus T2; Figure S6. DSC curves for GCSN2 crystal: a. specific heat capacity versus T, b. Cp/T versus T2; Figure S7. DSC curves for GCSN3 crystal: a. Specific heat capacity versus T, b. Cp/T versus T2; Table S1. Indexed PXRD patterns of GCS, GCSN1, GCSN2 and GCSN3 single crystals.

Author Contributions

Conceptualization, H.A.F.E.; methodology, H.A.F.E., H.E.O. and O.M.M.; software, H.E.O., O.M.M. and H.A.F.E.; validation, A.E.-D.A., M.E.E., H.A.-H., H.A.F.E. and R.S.A.A.; formal analysis, H.E.O., O.M.M., R.S.A.A. and H.A.F.E.; investigation, H.A.F.E. and R.S.A.A.; resources, H.A.F.E. and H.A.-H.; data curation, H.E.O., O.M.M. and H.A.F.E.; writing—original draft preparation, O.M.M., H.E.O. and H.A.F.E.; writing—review and editing, H.A.F.E., H.E.O. and R.S.A.A.; visualization, A.E.-D.A., M.E.E. and H.A.-H.; supervision, A.E.-D.A., M.E.E. and H.A.-H., project administration, H.A.F.E.; funding acquisition, R.S.A.A. All authors have read and agreed to the published version of the manuscript.

Funding

Princess Nourah bint Abdulrahman University Researchers Supporting Project number (PNURSP2023R316), Princess Nourah bint Abdulrahman University, Riyadh, Saudi Arabia.

Institutional Review Board Statement

Not applicable.

Informed Consent Statement

Authors approved consent on publication.

Data Availability Statement

All data and materials of study are available in manuscript and Supplementary Information.

Acknowledgments

Work on this research was carried out at the Chemistry Department, Faculty of Science, Daman-hour University, Egypt. The authors would like to thank Princess Nourah bint Abdulrahman University Researchers Supporting Project number (PNURSP2023R316), Princess Nourah bint Abdulrahman University, Riyadh, Saudi Arabia for funding this research article.

Conflicts of Interest

The authors declare no conflict of interest.

References

  1. Mahendra, K.; Kumar, H.K.T.; Udayashankar, N.K. Enhanced structural, optical, thermal, mechanical and electrical properties by a noval approach (nanoparticle doping) on ferroelectric triglycine sulphate single crystal. Appl. Phys. A Mater. Sci. Process. 2019, 125, 1–15. [Google Scholar] [CrossRef]
  2. Cheng, X.; Yang, S.; Cao, B.; Tao, X.; Chen, Z. Single crystal perovskite solar cells: Development and perspectives. Adv. Funct. Mater. 2020, 30, 1905021. [Google Scholar] [CrossRef]
  3. Sivakumar, N.; Jayaramakrishnan, V.; Baskar, K.; Anbalagan, G. Synthesis, growth and characterization of γ-glycine—A promising material for optical applications. Opt. Mater. 2014, 37, 780–787. [Google Scholar] [CrossRef]
  4. Venkatesan, G.; Kathiravan, V.; Pari, S. Optical and electrical properties of glycine manganese chloride crystal. Phys. B Condens. Matter 2017, 515, 99–103. [Google Scholar] [CrossRef]
  5. Karolin, A.; Jayakumari, K.; Mahadevan, C.K. Growth and characterization of pure and Ni2+ doped glycine sodium sulfate crystals. Int. J. Res. Eng. Technol. 2013, 2, 646–651. [Google Scholar]
  6. Fleck, M. Compounds of glycine with halogen or metal halogenides: Review and comparison. Z. Krist. 2008, 223, 222–232. [Google Scholar] [CrossRef]
  7. Trzesowska-Kruszynska, A. Copper complex of glycine Schiff base: In situ ligand synthesis, structure, spectral, and thermal properties. J. Mol. Struct. 2012, 1017, 72–78. [Google Scholar] [CrossRef]
  8. Sankar, S.; Manikandan, M.R.; Ram, S.G.; Mahalingam, T.; Ravi, G. Gel growth of alpha and gamma glycine and their characterization. J. Cryst. Growth 2010, 312, 2729–2733. [Google Scholar] [CrossRef]
  9. Furukawa, Y.; Nakajima, K. Advances in Crystal Growth Research; Elsevier: Amsterdam, The Netherlands, 2001. [Google Scholar]
  10. Thompson, C.; Davies, M.C.; Roberts, C.J.; Tendler, S.J.; Wilkinson, M.J. The effects of additives on the growth and morphology of paracetamol (acetaminophen) crystals. Int. J. Pharm. 2004, 280, 137–150. [Google Scholar] [CrossRef] [PubMed]
  11. Schick, C. Differential scanning calorimetry (DSC) of semicrystalline polymers. Anal. Bioanal. Chem. 2009, 395, 1589–1611. [Google Scholar] [CrossRef] [PubMed]
  12. Karbivskyy, V.; Karbivska, L.; Artemyuk, V. Silver- and Gold-Ordered Structures on Single-Crystal Silicon Surface after Thermal Deposition. Nanoscale Res. Lett. 2016, 11, 69. [Google Scholar] [CrossRef] [PubMed] [Green Version]
  13. John, J.S.; Arumanayagam, T.; Murugakoothan, P.; Sajan, D.; Joy, N.; Philip, R. Synthesis, growth and characterization of guanidinium hippurate monohydrate single crystals: A new third order nonlinear. Opt. Mater. 2020, 110, 110493. [Google Scholar] [CrossRef]
  14. Selvarani, K.; Mahalakshmi, R.; Srinivasan, N. Growth and characterization of nonlinear optical crystal glycine sodium nitrate and its biological activity. J. Mater. Sci. Mater. Electron. 2022, 33, 13408–13417. [Google Scholar] [CrossRef]
  15. Mailoud, O.M.; Elsayed, A.H.; Abo-Elazm, A.H.; Fetouh, H.A. Synthesis and study the structure, optical, thermal and dielectric properties of promising Glycine Copper Nitrate (GCN) single crystals. Results Phys. 2018, 10, 512–520. [Google Scholar] [CrossRef]
  16. Masoud, M.S.; Hagagg, S.S.; Ali, A.E.; Nasr, N.M. Synthesis and spectroscopic characterization of gallic acid and some of its azo complexes. J. Mol. Struct. 2012, 1014, 17–25. [Google Scholar] [CrossRef]
  17. Sankar, K.; Rajasekaran, R.; Vetrivelan, V. Synthesis, Growth and Characterization of Glycine Ammonium Bromide: A potential NLO material. Mater. Today Proc. 2019, 8, 332–336. [Google Scholar] [CrossRef]
  18. Selvakumar, S.; Kumar, S.R.; Rajarajan, K.; Pragasam, A.J.A.; Rajasekar, S.A.; Thamizharasan, K.; Sagayaraj, P. Growth and Characterization of a Novel Organometallic Nonlinear Optical Crystal: Bis(Thiourea) Cadmium Formate. Cryst. Growth Des. 2006, 6, 2607–2610. [Google Scholar] [CrossRef]
  19. Vimal, G.; Mani, K.P.; Jose, G.; Biju, P.R.; Joseph, C.; Unnikrishnan, N.V.; Ittyachen, M.A. Growth and spectroscopic properties of samarium oxalate single crystals. J. Cryst. Growth 2014, 404, 20–25. [Google Scholar] [CrossRef]
  20. Vizhi, R.E.; Yogambal, C. Investigations on the growth and characterization of gamma-glycine single crystal in the presence of sodium bromide. J. Cryst. Growth 2016, 452, 198–203. [Google Scholar] [CrossRef]
  21. Balanagammal, S.; Mahalakshmi, R. Optik Growth, optical and dielectric characteristics of MnCl2 -doped glycine. Opt. Int. J. Light Electron Opt. 2015, 126, 5294–5296. [Google Scholar] [CrossRef]
  22. Wang, L.; Xu, H.; Jiang, N.; Wang, Z.; Jiang, J.; Zhang, T. Trace cupric species triggered decomposition of peroxymonosulfate and degradation of organic pollutants: Cu (III) being the primary and selective intermediate oxidant. Environ. Sci. Technol. 2020, 54, 4686–4694. [Google Scholar] [CrossRef]
  23. Premlatha, K.; Krishnamoorthy, P.; Rajagopalan, N.R.; Arumugam, T.K. Synthesis, nucleation kinetics, spectral, structural, mechanical, and thermal studies of semi-organic barium-doped γ-glycine single crystal. J. Mater. Sci. Mater. Electron. 2021, 32, 28494–28514. [Google Scholar] [CrossRef]
  24. Fetouh, H.A.; Abd-Elnaby, H.M.; Alsubaie, M.S.; Sallam, E.R. New experimental low-cost nanoscience technology for formulation of silver nanoparticles-activated carbon composite as a promising antiviral, biocide, and efficient catalyst. J. Exp. Nanosci. 2022, 31, 297–314. [Google Scholar] [CrossRef]
  25. Pandit, B.; Goda, E.S.; Elella, M.H.A.; ur Rehman, A.; Hong, S.E.; Rondiya, S.R.; Barkataki, P.; Shaikh, S.F.; Al-Enizi, A.M.; El-Bahy, S.M.; et al. One-pot hydrothermal preparation of hierarchical manganese oxide nanorods for high-performance symmetric supercapacitors. J. Energy Chem. 2022, 65, 116–126. [Google Scholar] [CrossRef]
  26. Ahlburg, J.V.; Granados-Miralles, C.; Gjørup, F.H.; Andersen, H.L.; Christensen, M. Exploring the direct synthesis of exchange-spring nanocomposites by reduction of CoFe2 O4 spinel nanoparticles using in situ neutron diffraction. Nanoscale 2020, 12, 9440–9451. [Google Scholar] [CrossRef] [PubMed]
  27. Johansson, W.; Peralta, A.; Jonson, B.; Anand, S.; Österlund, L.; Karlsson, S. Transparent TiO2 and ZnO thin films on glass for UV protection of PV modules. Front. Mater. 2019, 6, 259. [Google Scholar] [CrossRef]
  28. Arumanayagam, T.; Murugakoothan, P. Optical Conductivity and Dielectric Response of an Organic Aminopyridine NLO Single Crystal. J. Miner. Mater. Charact. Eng. 2011, 10, 1225–1231. [Google Scholar] [CrossRef]
  29. Ashok Kumar, R.; Ezhil Vizhi, R.; Vijayan, N.; Rajan Babu, D. Structural, dielectric and piezoelectric properties of nonlinear optical γ-glycine single crystals. Phys. B Condens. Matter 2011, 406, 2594–2600. [Google Scholar] [CrossRef]
  30. Hassanien, A.S.; Aly, K.A.; Akl, A.A. Study of optical properties of thermally evaporated ZnSe thin films annealed at different pulsed laser powers. J. Alloys Compd. 2016, 685, 733–742. [Google Scholar] [CrossRef]
  31. Saminathan, P.; SenthilKumar, M.; Shanmugan, S.; Selvaraju, P.; Janarthanan, B.; Sadasivuni, K.K. Materials Today: Proceedings Synthesis and characterization of crystalline perfection on L-Lysine co-doping glycine barium chloride/C6H14N2O2 (L-LGBCAC) single crystal for NLO materials. Mater. Today Proc. 2020, 30, 57–61. [Google Scholar] [CrossRef]
  32. Amirthakumar, C.; Valarmathi, B.; Pandi, P.; Kumar, R.M. Investigation on inorganic potassium lithium sulfate single crystal grown by SR method and its characterization for nonlinear optical application. Chin. J. Phys. 2020, 67, 305–313. [Google Scholar] [CrossRef]
  33. Azhagan, S.A.C.; Ganesan, S. Studies on the growth, structural, optical, SHG and thermal properties of gamma-glycine single crystal: An organic nonlinear optical crystal. Opt. Int. J. Light Electron Opt. 2013, 124, 4452–4455. [Google Scholar] [CrossRef]
  34. Anis, M.; Ramteke, S.P.; Shirsat, M.D.; Muley, G.G.; Baig, M.I. Novel report on g-glycine crystal yielding high second harmonic generation efficiency. Opt. Mater. 2017, 72, 590–595. [Google Scholar] [CrossRef]
  35. Klein, J.; Kerelsky, A.; Lorke, M.; Florian, M.; Sigger, F.; Kiemle, J.U.; Reuter, M.C.; Taniguchi, T.; Watanabe, K.; Finley, J.J. Impact of intrinsic and extrinsic imperfections on the electronic and optical properties of MOS2. arXiv 2019, arXiv:1905.01242. [Google Scholar]
  36. Kumar, R.A.; Vizhi, R.E.; Sivakumar, N.; Vijayan, N.; Babu, D.R. Crystal growth, optical and thermal studies of nonlinear optical gamma glycine single crystal grown from lithium nitrate. Int. J. Light Electron Opt. 2012, 123, 409–413. [Google Scholar] [CrossRef]
  37. Jerusha, E.; Kirupavathy, S.S.; Gopalakrishnan, R. Spectral, optical and dielectric analyses on L-lysine p-nitrophenolate monohydrate organic crystals. Optik 2016, 127, 420–427. [Google Scholar] [CrossRef]
  38. Mailoud, O.M.; Elsayed, A.H.; El Fetouh, H.A.; ELazm, A.A. Synthesis and characterization of paramagnetic isotropic glycine manganese chloride single crystal with various dopant concentrations. Results Phys. 2019, 12, 925–933. [Google Scholar] [CrossRef]
  39. Shkir, M.; Alfaify, S.; Khan, M.A.; Dieguez, E.; Perles, J. Synthesis, growth, crystal structure, EDX, UV–vis–NIR and DSC studies of L-proline lithium bromide monohydrate—A new semiorganic compound. Cryst. Growth 2014, 391, 104–110. [Google Scholar] [CrossRef]
  40. Arasi, M.A.; Alagar, M.; Pugalenthi, M.R. Growth of γ-glycine single crystals using the tailored additive of potassium chloride and L-Proline and analyzing micro structural, optical, mechanical and electrical parameters. Chem. Phys. Lett. 2021, 16, 138301. [Google Scholar] [CrossRef]
  41. Kumar, A.; Fouad, S.S.; El-Bana, M.S.; Mehta, N. Thermal analysis of cadmium addition on the glass transition and crystallization kinetics of Se–Te–Sn glassy network. Therm. Anal. Calorim. 2017, 131, 2491–2501. [Google Scholar] [CrossRef]
  42. Parimaladevi, R.; Sekar, C. Crystal growth and spectral studies of nonlinear optical gamma -glycine single crystal grown from phosphoric acid. Spectrochim. Acta Part A Mol. Biomol. Spectrosc. 2010, 76, 490–495. [Google Scholar] [CrossRef] [PubMed]
  43. El Batouti, M.; Fetouh, H.A. A facile new modified method for the preparation of a new cerium-doped lanthanium cuperate perovskite energy storage system using nanotechnology. New J. Chem. 2021, 45, 8506–8515. [Google Scholar] [CrossRef]
  44. Masoud, M.S.; Ali, A.E.; El-Kaway, A.; Marwa, Y. Thermal properties of mercury (II) and palladium (II) purine and pyrimidine complexes. J. Therm. Anal. Calorim. 2013, 116, 183–194. [Google Scholar] [CrossRef]
  45. Masoud, M.S.; Ali, A.E.; Shaker, M.A.; Elasala, G.S. Synthesis, computational, spectroscopic, thermal and antimicrobial activity studies on some metal–urate complexes. Spectrochim. Acta Part A Mol. Biomol. Spectrosc. 2012, 90, 93–108. [Google Scholar] [CrossRef] [PubMed]
  46. Dhumane, N.R.; Hussaini, S.S.; Dongre, V.G.; Shirsat, M.D. Influence of glycine on the nonlinear optical (NLO) properties of zinc (tris) thiourea sulfate (ZTS) single crystal. Opt. Mater. 2008, 31, 328–332. [Google Scholar] [CrossRef]
  47. Azhagan, S.A.C.; Kathiravan, V.S. Selective crystallization of gamma glycine for NLO applications using magnesium sulfate (MgSO4) as an additive. Mater. Sci. Pol. 2019, 37, 265–279. [Google Scholar] [CrossRef] [Green Version]
  48. Karabulut, B.; Düzgün, F. An EPR study of Cu2+ doped [Na(Hmal)(H2O)5] single crystals. Spectrochim. Acta–Part A Mol. Biomol. Spectrosc. 2010, 75, 1200–1202. [Google Scholar] [CrossRef]
  49. Ravi, S.; Subramanian, P. EPR study of Cu2+ in glycine zinc sulphate single crystal. Solid State Commun. 2007, 143, 277–279. [Google Scholar] [CrossRef]
  50. Rao, J.L.; Krishna, R.M.; Lakshman, S.V.J. EPR and optical studies of vanadyl ion in magnesium thallium sulphate hexahydrate. Solid State Commun. 1988, 67, 531–533. [Google Scholar]
  51. PrabhuKantan, A.; Velavan, K.; Venkatesan, R.; Rao, P.S. Dynamical Jahn-Teller distortion in single crystals of Cu (II) doped magnesium potassium phosphate hexahydrate: A variable temperature EPR study. Solid State Commun. 2003, 126, 285–289. [Google Scholar] [CrossRef]
  52. Hoffmann, S.K.; Goslar, J.; Tadyszak, K. Electronic structure and dynamics of low symmetry Cu2+ complexes in kainite-type crystal KZnClSO4·3H2O: EPR and ESE studies. J. Magn. Reson. 2010, 205, 293–303. [Google Scholar] [CrossRef] [PubMed]
  53. Merz, G.E.; Borbat, P.P.; Muok, A.R.; Srivastava, M.; Bunck, D.N.; Freed, J.H.; Crane, B.R. Site-specific incorporation of a Cu2+ spin label into proteins for measuring distances by pulsed dipolar electron spin resonance spectroscopy. J. Phys. Chem. B. 2018, 122, 9443–9451. [Google Scholar] [CrossRef] [PubMed]
  54. Selvakumar, P.N.; Natarajan, B.; Rao, P.S.; Subramanian, P. EPR studies of Cu(II) doped glycine lithium sulphate single crystals—A case of low hyperfine coupling constant. Cryst. Res. Technol. 2008, 43, 857–862. [Google Scholar] [CrossRef]
  55. Kripal, R.; Govind, H.; Gupta, S.K.; Arora, M. EPR and optical absorption study of Mn2+-doped zinc ammonium phosphate hexahydrate single crystals. Phys. B Condens. Matter. 2007, 392, 92–98. [Google Scholar] [CrossRef]
  56. Hassanien, M.M.; Gabr, I.M.; Abdel-Rhman, M.H.; El-Asmy, A.A. Synthesis and structural investigation of mono- and polynuclear copper complexes of 4-ethyl-1-(pyridin-2-yl) thiosemicarbazide. Spectrochim. Acta Part A Mol. Biomol. Spectrosc. 2008, 71, 73–79. [Google Scholar] [CrossRef]
  57. Batouti, M.E.; El-Mossalamy, E.H.; Fetouh, H.A. Preparation and Characterization of New Optical Active Charge Transfer Complexes for Mitigation Climate Changes. Inorg. Chem. Commun. 2023, 152, 110648. [Google Scholar] [CrossRef]
  58. Slade, T.J.; Grovogui, J.A.; Kuo, J.J.; Anand, S.; Bailey, T.P.; Wood, M.; Uher, C.; Snyder, G.J.; Dravid, V.P.; Kanatzidis, M.G. Understanding the thermally activated charge transport in NaPb m SbQ m + 2 (Q = S, Se, Te) thermoelectrics: Weak dielectric screening leads to grain boundary dominated charge carrier scattering. Energy Environ. Sci. 2020, 13, 1509–1518. [Google Scholar] [CrossRef]
  59. Packiya Raj, M.; Ravi Kumar, S.M.; Srineevasan, R.; Ravisankar, R. Synthesis, growth, and structural, optical, mechanical, electrical properties of a new inorganic nonlinear optical crystal: Sodium manganese tetrachloride (SMTC). J. Taibah Univ. Sci. 2017, 11, 76–84. [Google Scholar] [CrossRef] [Green Version]
  60. Karolin, A.; Jayakumari, K.; Mahadevan, C.K. Dielectric properties of pure and N2+ doped glycine sodium sulfate crystals. Int. J. Res. Eng. Technol. 2013, 2, 2321–7308. [Google Scholar]
Figure 1. Visual inspection of crystals.
Applnano 04 00007 g001
Figure 2. (ad): EDX spectra and SEM micrographs of GCS, GCSN1, GCSN2, and GCSN3, respectively.
Applnano 04 00007 g002aApplnano 04 00007 g002b
Figure 4. UV-Vis. absorbance curve.
Applnano 04 00007 g004
Figure 5. Tauc’s plots for calculation of band gap.
Applnano 04 00007 g005
Figure 7. χ-photon energy plot.
Applnano 04 00007 g007
Figure 8. (ad): Thermograms: a. TGA, b. DTG, and c. DSC of GCS, GCSN1, GCSN2, and GCSN3.
Applnano 04 00007 g008aApplnano 04 00007 g008b
Figure 9. Powder ESR spectra of Cu(II) ions in crystals.
Applnano 04 00007 g009
Figure 10. UV-Vis. absorbance spectra of GCSN3 thin film coated on Al foil.
Applnano 04 00007 g010
Figure 11. Variation of electrical conductivity of GCSN3 on heating.
Applnano 04 00007 g011
Figure 12. Charge transfer resistance of GCSN3 as a function of applied frequency and absolute temperature (K): (a) 200, (b) 300, (c) 350, (d) 400, (e) 450, (f) 500, (g) 550.
Applnano 04 00007 g012
Figure 13. Temperature dependent of the dielectric constant for (GCSN3) single crystal.
Applnano 04 00007 g013
Table 1. Weight percentage elements in crystals.
Crystal Weight %
CNOCuSAg
GCS25.7124.0050.090.150.5-
GCSN126.0122.8650.370.290.400.08
GCSN227.5923.4348.340.54-0.10
GCSN330.7524.7245.951.13-0.42
Table 2. Assigned FTIR vibrational bands.
Vibration ModeWave Number (cm−1)
Glycine [15]GCSGCSN1GCNN2GCSN3
Cu-N stretching-509.21509.21509.21509.21
COO wagging 606.30609.51609.51609.51609.51
COO bending 696.9694.37694.37694.37694.37
CCN asymmetric stretching1031.931033.851033.851033.851033.85
CH2 rocking 1112.441111.001111.001126.431118.71
SO4 stretching -894.97894.97894.97902.51
COO symmetric stretching1492.391411.681411.891411.891404.18
CH2 wagging 1311.891334.791334.741334.741319.31
COO asymmetric stretching 1554.251519.911519.911504.481512.19
C=O asymmetric stretching 1643.531604.771604.771604.771604.77
NH2 asymmetric stretching2924.042823.792831.502831.502831.50
NH stretching3921.393811.343996.213895.483903.92
Table 3. Crystal parameters.
CrystalGCSGCSN1GCSN2GCSN3
Identifier ID 1,505,7631,505,7634,342,4134,342,413
Crystal SystemMonoclinicTriclinic
Polymorphαγ
Space GroupP 21P −1
Lattice Parametera = 7.890 Å, b = 15.94 Å, c = 13.063 Åa = 10.8222 Å, b = 11.0221 Å, c = 12.8735 Å,
α = γ = 90°, β = 94.58°α = 88.85°, β = 77.52°, γ = 84.55°
Volume (Å3)1638.141492.54
Table 4. Comparison between reported and present study: optical band gap (Eg) and λcut off.
Single Crystal Band Gapλcut off (nm)
ValueRef.ValueRef.
Glycine3.13[15]346[15]
GCS4.58Present study287Present study
GCSN14.61283
GCSN24.65276
GCSN34.67280
GCS3.8[23]250[23]
GCN5.77[15]231[15]
GLS5.428[32]330[32]
GZS6.2[33]200[33]
Table 5. Linear fits parameters of DSC curves.
Crystal Temperature Range (°C)Cp = a T + bCp/T = α T2 + γ
ab α × 10−6γ
GCS22–2060.003−0.4410.007070.001
206–254−0.379185.6−0.70.181
253.8–3210.231−134.90.5−0.166
321–788−0.03121.91−0.020.007
GCSN123.8–860.0429−10.95−0.150.006
86–2230.0071.851−0.010.139
223–262−1.266657.3−2.100.575
262–3250.410−233.60.89−0.284
325–788−0.03129.75−0.0230.0212
GCSN228.8–227−0.0022.029−0.0160.005
226.8–265−0.986510.2−1.40.378
265–3310.393−231.70.62−0.213
331–788−0.02114.65−0.0140.006
GCSN3 30–870.045−15.040.2−0.024
87–228−1.29 × 10−51.34−0.00770.004
228–268−0.981509.01−1.90.535
268–3340.349−206.010.59−0.208
334–787−0.01110.78−0.0090.008
Table 6. g values and A (mT) matrices for Cu(II) ion in crystals.
CrystalgxgygzAxAyAz g g R
GCS2.08592.05312.267613.30910.87218.1832.26762.06910.1805
GCSN12.09212.07052.268512.54813.94914.2292.26852.08130.1224
GCSN22.08832.05512.286811.15416.18317.8712.28682.07170.1673
GCSN32.08872.06372.26513.2712.46515.9652.2652.07620.1418
Table 7. EPR parameters.
Crystals A (G) A (G) α2Crystals A (G) A (G) α2
GCS120.908181.8310.8392GCSN2136.685178.7070.8507
GCSN1132.491142.2990.7353GCSN3128.719159.6490.7778
Disclaimer/Publisher’s Note: The statements, opinions and data contained in all publications are solely those of the individual author(s) and contributor(s) and not of MDPI and/or the editor(s). MDPI and/or the editor(s) disclaim responsibility for any injury to people or property resulting from any ideas, methods, instructions or products referred to in the content.

