1. Introduction
Antimicrobial metallic nanoparticles (NPs) are routinely incorporated into a variety of materials to prevent microbes such as bacteria and fungi from destroying them. For example, adding biocidal NPs to textiles can stop/slow down material deterioration, thereby extending its use. Silver nanoparticles (AgNPs) are very effective at either reducing the number of contaminating microbes or completely eliminating them. Consequently, this helps to limit their spread. Biocidal AgNPs have been integrated into wound dressings and medical devices such as dental implants, cardiovascular implants and imaging probes. Additional medical applications include AgNPs use as antibiofilm agents, antitumor agents, and bone healing promoters. Moreover, AgNPs are layered onto optoelectronic devices used in the electronic industry to control microbial growth [
1,
2].
The usefulness of AgNPs has led to an explosive growth of the nanobiotechnology industry. This caused a corresponding increase in AgNPs production. In 2011, it was estimated that nearly 280 tons of AgNPs were produced for commercial or industrial use [
3]. That number increased to about 500 tons of annual global production in 2021 [
4]. This figure also includes AgNPs produced for use in the electronics industry. The silver nanoparticles market was valued at USD 1.5 billion in 2020, and it is anticipated that the market will reach USD 6.6 billion by 2030 [
5].
Chemical synthesis represents a major method for rapidly producing large numbers of AgNPs. This process involves using a strong reducing agent to convert a chemical compound such as silver nitrate (AgNO
3) into a metallic particle measuring in the nanometer range. The use of silver-based nanomaterials was initially hindered due to their instability from oxidation. To remedy this problem, a stabilizer is added to keep the AgNPs from undergoing rapid oxidation [
2]. Although chemical synthesis is very efficient, it also produces a large volume of harsh chemical waste that eventually makes its way into the environment. Accordingly, alternative green synthesis methods are being employed to help reduce an ever-increasing volume of chemical wastes associated with silver nanomaterial production.
Green synthesis can occur by either chemical means or biogenesis. Both processes produce AgNPs that have less of an environmental impact [
6]. Chemical green synthesis involves the use of natural substances, such as plant extracts, to produce chemically synthesized AgNPs (c-AgNPs) but with less associated toxic waste. As the name suggests, biogenic AgNPs (b-AgNPs) are produced by either giving a silver substrate to living microbe-like bacteria, using microbe culture supernatants, or using microbe whole-cell lysates [
7]. b-AgNPs produced by this method appear to hold promise in combating biofilm-associated infections, since biofilms tend to harbor antibiotic-resistant pathogens [
8].
AgNPs effectively control the growth of a wide range of microbes, including antibiotic-resistant bacteria causing infections. Still, their use is hindered by an intrinsic level of toxicity to humans and associated environmental hazards [
9]. Although the demand for AgNPs keeps growing, there has not been a corresponding effort to reduce their impact on the environment, regardless of their synthesis method. Likewise, other metallic nanoparticles with equivalent or greater antimicrobial activity to AgNPs but with reduced toxicity are being sought as a potential replacement. However, the demonstrated antimicrobial effectiveness of AgNPs makes it a prime contender for continued use until a suitable replacement is found. Consequently, producing long-lasting b-AgNPs exhibiting broad-spectrum antimicrobial action at a lower working concentration is highly desired.
The novelty of this study involves two separate findings. First, the differences in antimicrobial effectiveness seen between tested b-AgNPs and c-AgNPs demonstrates that b-AgNp are superior to c-AgNPs in controlling microbe growth. Second, the differences seen between the antimicrobial effectiveness of each b-AgNP type appears to be a product of variation in their post-production processing. We now report on b-AgNPs exhibiting excellent antimicrobial activity at substantially lower concentrations than commercial c-AgNPs.
2. Materials and Methods
2.1. Nanoparticle Preparation
Cell lysates from previously characterized recombinant
Escherichia coli DH5α cells were used to produce b-AgNPs [
10,
11]. In doing so, a 10 µL aliquot of 15% glycerol stocks of
Escherichia coli DH5α cells was transferred into 10 mL of LB medium containing 100 µg/mL carbenicillin and grown overnight at 37 °C on a shaker incubator at 250 rpm. The overnight cell culture was then centrifuged, and cells were resuspended in 100 mL of LB in the presence of carbenicillin and re-incubated at 37 °C while periodically monitoring optical density (OD).
When OD600 reached 0.9, cells were centrifuged at 4500 G for 15 min. The resulting cell pellet was washed with 25 mL of 50 mM sodium phosphate buffer (pH 9) and re-suspended in 2 mL of 50 mM sodium phosphate buffer (pH 9). Subsequently, cells were sonicated on ice for three cycles of 60 pulses at an output of 20%, with a 1 min interval between each cycle. The lysate was spun down to remove the cell debris. The soluble intracellular extract was added to 100 mL of 50 mM sodium phosphate buffer (pH 9) containing 1 mM AgNO3. This cell-free reaction mix was incubated at 37 °C with continuous shaking at 250 rpm for 4 days. The b-AgNPs were then collected by centrifugation at 5000 rpm for 15 min. The pellets were sonicated in 50 mM sodium phosphate buffer (pH 9) for 1 min while on ice and centrifuged at 3000 G for 4 min.
The recovered b-AgNPs were separated into 3 groups, each one being processed somewhat differently. The first group of pelleted b-AgNPs were re-suspended in pure H2O by sonication on ice for 1 min. The b-AgNPs were collected by centrifugation at 17,000 rpm for 15 min at 4 °C. This wash step was repeated once and then the b-AgNPs were resuspended in pure H2O. This set was designated as b-AgNPs (water ×2). The second group of b-AgNPs were sonicated in 8M urea on ice for 1 min, placed on an orbital shaker at 360 rpm for 30 min at 37 °C, and then pelleted by centrifugation at 17,000× g for 20 min. The pellet was washed twice with pure H2O and resuspended by sonication in pure H2O. This set was designated as b-AgNPs (8M urea ×1). The third group was processed similarly to the b-AgNPs (8M urea ×1) but included a second sonication in 8M urea of the supernatant recovered from the first 8M urea wash. The b-AgNPs were washed with pure H2O twice and resuspended in pure H2O. This set was designated as b-AgNPs (8M urea ×2).
Commercial c-AgNPs were obtained from both Alfa Aesar (Cat # J67099) through Fisher Scientific (Waltham, MA, USA) and SkySpring Nanomaterial s(Cat # 0115CY); (Houston, TX, USA). The Alfa Aesar c-AgNPs were 100 nm in size and adjusted to 0.02 mg/mL in 2 mM sodium citrate. The SkySpring Nanomaterials were also 100 nm size but were received in a powdered form. The b-AgNPs (water ×2), b-AgNPs (8M urea ×1), and b-AgNPs (8M urea ×2) samples were all received suspended in pure water. They were subsequently freeze-dried using a Labconco lyophilizing unit (Kansa City, MO, USA). Then, both the SkySpring c-AgNPs powder and lyophilized b-AgNPs were adjusted to 0.02 mg/mL concentration in 2 mM sodium citrate to match the Alfa Aesar c-AgNPs. Two-fold serial dilutions of each AgNPs type were prepared in 1.5 mL amber conical-bottom microcentrifuge tubes (VWR, Atlanta, GA, USA) using sterile deionized water. All dilutions were stored at 4 °C until tested.
2.2. Tested Microbes
The studied bacteria included
Escherichia coli (ATCC 25922),
Staphylococcus aureus (ATCC 29213), and
Pseudomonas aeruginosa (ATCC 27853). Antibiotic-resistant strains (ARS) included methicillin-resistant
Staphylococcus aureus or MRSA (ATCC 45300), vancomycin-resistant
Enterococcus faecalis or VRE (ATCC 51299), and extended spectrum beta-lactamase
Escherichia coli or ESBL (Patient isolate). Tested fungi included
Candida albicans (ATCC 60193) and
Aspergillus fumigatus (KM 8001); (
Table 1). Stock cultures were maintained by periodic passage on growth supportive nutrient agar and incubated at 37 °C under ambient conditions (no CO
2). A single well-isolated colony of a test bacterium was transferred to a fresh agar plate and incubated 24 h before each assay. Fungi were incubated for 48 h before antimicrobial testing.
For all tested bacteria, 2–3 well isolated colonies were transferred to 3 mL cation-adjusted Muller-Hinton (M-H) broth (Remel, Lenexa, KS, USA) in a sterile tube with a glass screw top. The suspension was adjusted to match a 0.5% McFarland turbidity standard using a DEN-1 McFarland Densitometer (Grant-Bio, Beaver Falls, PA, USA), which results in ~1.0 × 10⁸ colony-forming units (CFU)/mL- 1. An additional 1:100 dilution of the 0.5% adjusted sample was made in M-H broth to yield approximately 1.0 × 10⁶ colony-forming units (CFU)/mL- 1.
For Candida albicans yeast, 4–6 well isolated colonies were removed from a 48-h nutrient agar plate and placed into a sterile glass screw top tube containing 3 mL Muller-Hinton (M-H) broth (Remel, Lenexa, KS, USA). The suspension was adjusted to match a 0.5% McFarland turbidity standard, as was previously described for bacteria. An additional 1:100 dilution was not performed.
For Aspergillus fumigatus mold, five 48 h nutrient agar plates containing actively growing mold colonies were flooded with 5 mL of 0.9% sterile saline. Intact fungal colonies were disrupted using a sterile cell spreader (Fisher Scientific 14-665-231, Pittsburgh, PA, USA) by moving the spreader vigorously back and forth over the entire plate surface creating a slurry. This suspension was transferred to a 50 mL conical centrifuge tube (Fisher Scientific12-565-271, Pittsburgh, PA, USA) and vigorously vortexed for 30 s on the highest mixer setting. The resulting solution was adjusted to match a 0.5% McFarland turbidity standard.
The number of either bacteria or fungi in MIC starting inoculum was determined as follows. Ten-fold serial dilutions were prepared of the turbidity adjusted inoculum in 0.9% sterile saline. A 100 μL (0.1 mL) aliquot of each dilution was transferred to a separate nutrient agar plate and spread over its surface using a sterile cell spreader. Plates were incubated for either 24 or 48 h, inspected for growth, and colonies counted. The colony forming units (CFU)/mL−1 was determined by counting the number of bacterial or fungal colonies present on a dilution plate demonstrating between 10 and 100 colonies. This number was multiplied by the reciprocal of the serial dilution and then multiplied by ten to account for the 100 μL (0.1 mL) sample volume distributed to each count plate.
2.3. Minimum Inhibitory Concentration (MIC) Testing
A 100 μL sample of each test nanoparticle dilution was distributed to separate wells of a 96-well microtiter plate (
Figure 1). Each well containing a nanoparticle dilution received a 100 μL aliquot of the microbe inoculum being tested. This resulted in a 1:2 dilution of each nanoparticle concentration in test wells, ranging from 10 µg/mL down 0.04 µg/mL. A negative growth control consisting of 200 μL of the M-H broth, without microbe, was included to detect potential exogenous broth contamination. A separate positive growth control consisting of 100 μL of only 2 mM sodium citrate (no nanoparticles) plus 100 μL aliquot of the microbe inoculum was used to see if 2 mM sodium citrate alone contributed to growth inhibition. The inoculated microtiter plate was covered with a fitted lid and sides wrapped with Parafilm
® to prevent sample desiccation during incubation. The plate was placed inside a MaxQ 4450 shaking incubator (ThermoFisher Scientific, Waltham, MA, USA) and held for either 24 h (bacteria) or 48 h (fungi) at 37 °C under ambient conditions with constant rotation at 100 RPM.
PMI 1640 medium supplemented with 2% glucose is typically used for fungal MIC testing in a clinical lab setting [
12,
13]. Instead, the current study used M-H broth to perform fungal MIC testing. This allowed for a more direct comparison to the bacterial MIC results. M-H broth supports fungal growth and has been used to perform
Candida albicans germ tube testing in lieu of serum [
14]. Additionally, a control well containing either
Candida albicans or
Aspergillus fumigatus test inoculum without nanoparticles demonstrated appreciable growth in each MIC accomplished.
In addition to initial MIC testing, all 3 b-AgNPs and Alfa Aesar c-AgNPs were retested a year later using the same methicillin-sensitive Staphylococcus aureus (MSSA) bacterial strain. This was done to determine the amount of residual antimicrobial activity, if any, that was present after long-term storage at 4 °C. The SkySpring c-AgNPs, which had not been acquired prior to initial MIC testing, were also included in the stability assay.
2.4. Spectroscopy
Direct sampling of each 0.02 mg/mL in 2 mM sodium citrate AgNPs solution was performed for both visible (vis-) and Fourier-transform infrared (FT-IR) spectroscopy. Vis- spectroscopy was accomplished using a Thermo Scientific Evolution 350 UV-VIS spectrometer and Thermo Scientific “Insight 2” software being used to display the resulting data (Waltham, MA, USA). FT-IR was accomplished using a Thermo Scientific Nicolet iS50 FTIR with built-in ATR accessory (Waltham, MA, USA). The AgNPs for X-ray energy-dispersive spectroscopy (EDS) analysis were resuspended in pure water by sonication prior to analysis. A Hitachi HD2700 aberration-corrected scanning transmission electron microscope (Hitachi, Tokyo, Japan) was used to acquire the EDS spectrum.
2.5. TEM
The 0.02 mg/mL in 2 mM sodium citrate AgNPs samples were prepared for transmission electron microscopy (TEM) as follows. Approximately 5.0 mL of each sample was centrifugated using an Eppendorf centrifuge 5810R (Enfield, CT, USA) at 3000× g for 5 min and large precipitates were discarded. Samples were sonicated at preset pulse cycle 5× using a Fisher Scientific FB120 sonicator equipped with a Qsonica model CL-18 probe (Newtown, CT, USA). A 2 mL aliquot of supernatant was then transferred to a 2.0 microcentrifuge tube and centrifugated using a Hermle Labnet Z 323 K (Gosheim, Germany) set to 17,000× g for 30 min. A 1.5 mL aliquot of supernatant was removed and discarded. The remaining 0.5 mL was vigorously vortexed and pipetted up and down several times to thoroughly mix the nanoparticles. The resulting suspension was sonicated again at the same setting. A 2 µL sample of well-suspended nanoparticles was separately applied to a pioloform-filmed 400 mesh Cu grids (Electron Microscopy Sciences). Grids were allowed to air dry completely before being inspected. Subsequent TEM examination was accomplished using a JEOL JEM 1400 operating at 80 kV.
2.6. Particle Sizing
The average size and distribution range of AgNPs were measured using a Model ZEN 1600 Zetasizer (Malvern, UK). This instrument uses dynamic light scattering (DLS) to determine particle characteristics. The Zetasizer unit was calibrated prior to particle analysis by using Nanosphere (61 nm ± 4 nm), an NIST traceable latex standard (ThermoFisher, Waltham, MA, USA). The duration of the count ranged from 70–290 s. The mean value of peak #1 representing the maximum intensity was used to report the particle diameter (nm) and width (nm). Zeta potential measurements were not supported by this analyzer model.
Direct measurements of both b-AgNPs (8M urea ×2) and Alfa Aesar c-AgNPs were also accomplished from TEM microphotographs using ImageJ software. Twenty random measurements were taken for each AgNPs sample type.
4. Discussion
Collectively, these findings indicate that the b-AgNPs produced using cell lysate material are indeed silver nanoparticles. Support is offered by Vis-spectrum, FT-IR, TEM, and EDS results. Furthermore, findings suggest that processing b-AgNPs twice increases their antimicrobial activity against microorganisms.
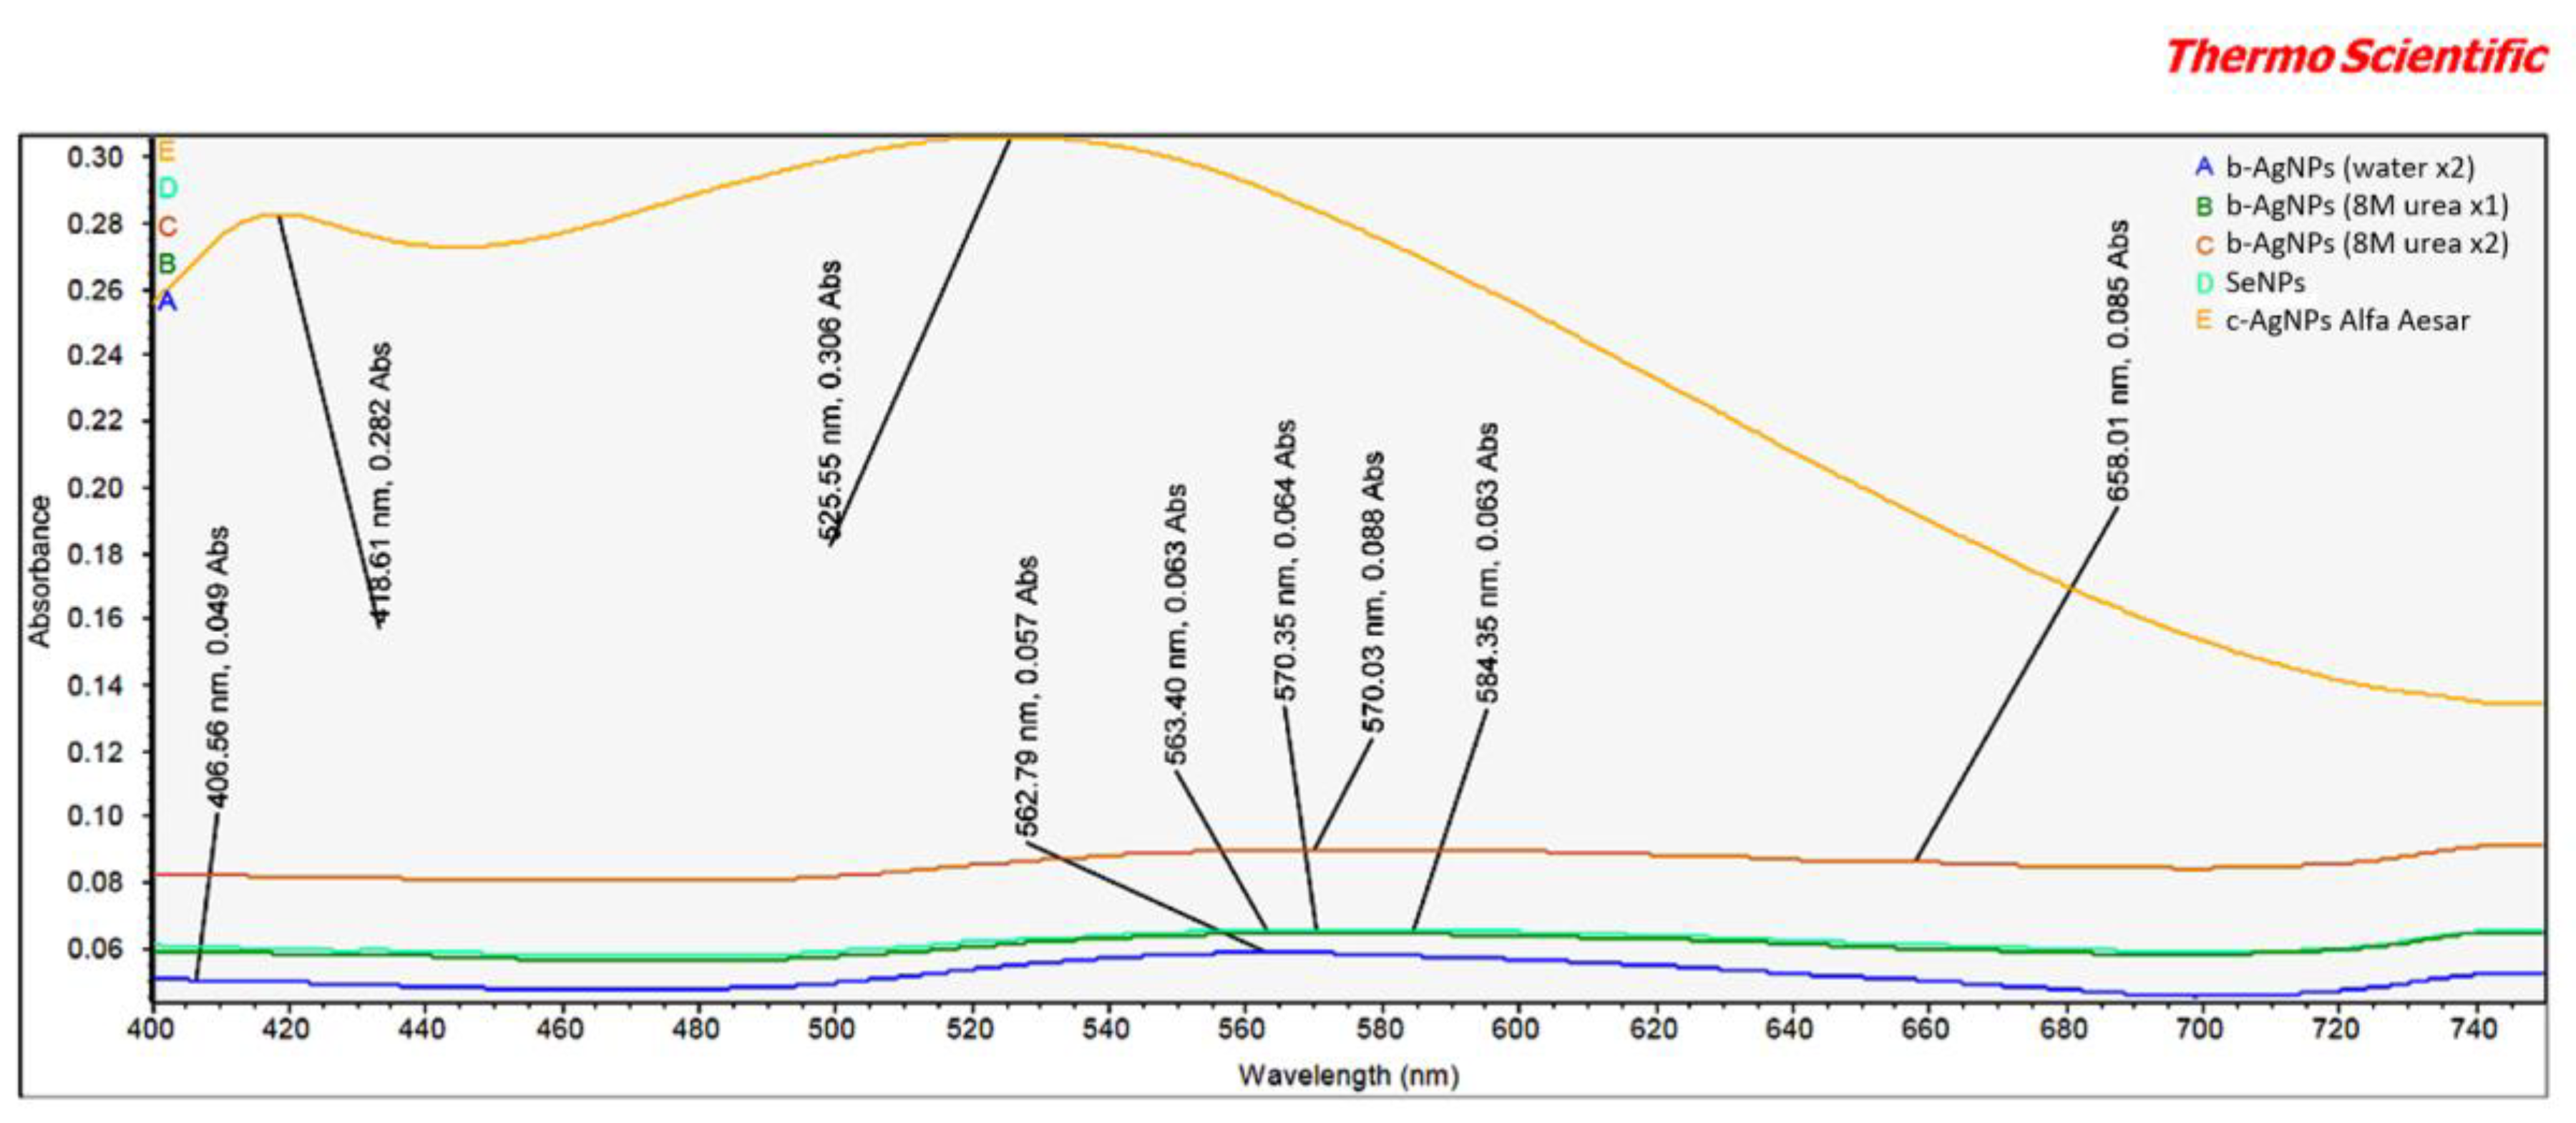
The vis-spectrum revealed two items of interest relating to the Alfa Aesar c-AgNPs (
Figure 2). First, the peak intensities at both 418.6 nm and 525.5 nm were markedly higher than any seen for b-AgNPs. This appears to indicate a relative difference in concentrations between the b-AgNPs and Alfa Aesar c-AgNPs. This finding correlates well with similar differences in peak amplitude between these two AgNPs demonstrated by FT-IR analysis. It lends support to the b-AgNPs, especially the b-AgNPs (8M urea ×2), being more bioactive than the Alfa Aesar c-AgNPs when used at a lower starting concentration. Second, there was an unexpected peak at 525.5 nm. An examination of the accompanying Alpha Aesar c-AgNP safety data sheet (SDS) listed water, sodium citrate (dihydrate), and silver as components [
15]. The significance of this peak remains unknown despite an inquiry sent to Alfa Aesar.
Another interesting finding was a peak at 658.0 nm for the b-AgNPs (8M urea ×2) that was absent in either b-AgNPs (water ×2) or b-AgNPs (8M urea ×1). Generally speaking, absorption by AgNPs depends on the particle size, particle shape, dielectric medium, and chemical surroundings [
16]. Ejbarah reported AgNP absorption peaks between 420 and 480 nm. These same peaks were seen to shift to a longer wavelength as particle size increased [
17]. Barbar et al. reported 400 nm absorption peaks for c-AgNPs made using different concentrations of AgNO
3 and 0.5 mM trisodium and 0.3 mM sodium borohydride stabilizers [
18]. In the current study, each of the tested AgNPs was suspended in 2 mM sodium citrate, which has a λ max near 210 nm [
19]. This lower wavelength tends to eliminate any possible contribution of the 2 mM sodium citrate stabilizer to the noted peaks.
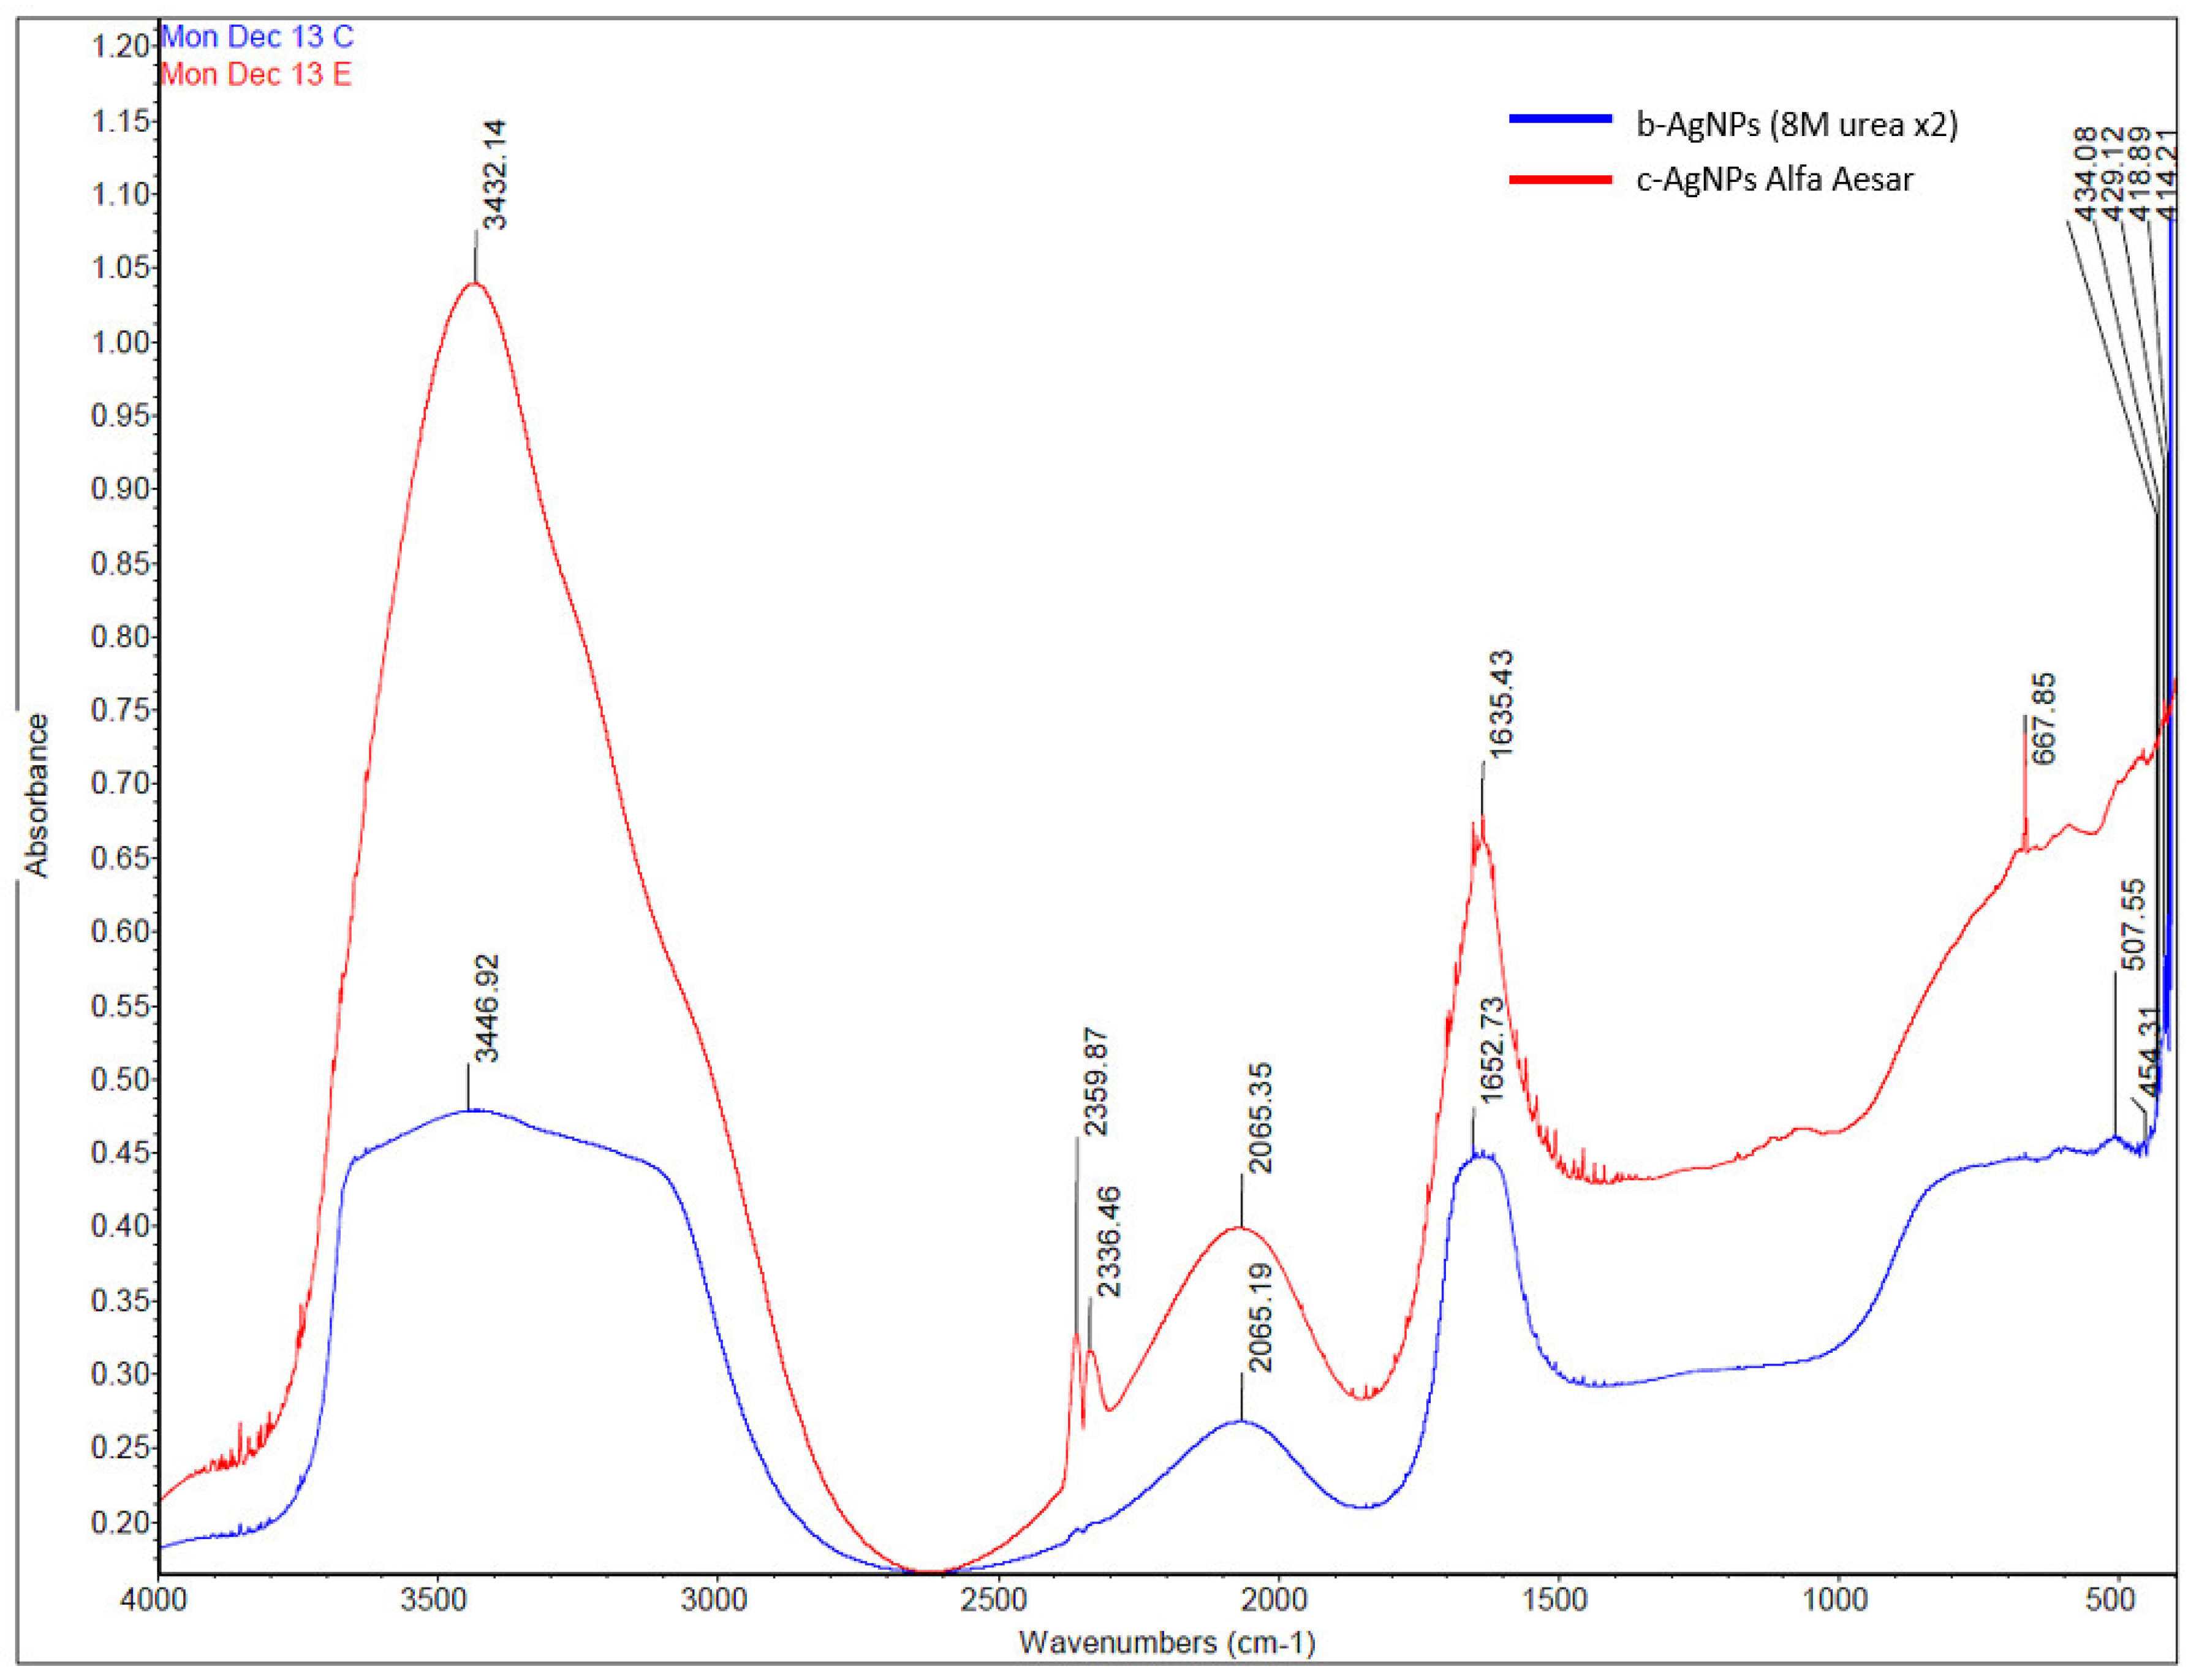
The presence of multiple absorbance bands detected by FT-IR for b-AgNP (8M urea ×2) and Alfa Aesar c-AgNP suggests that both have functional groups affixed to their surfaces (
Figure 3). For example, the broad absorbance band seen at 3446.92 cm
−1 for b-AgNP (8M urea) represents either a single peak N-H stretch, a hydrogen-bonded O-H stretch, or possibly both. As noted for vis-spectrum, the heights of the Alfa Aesar c-AGNP peaks recorded by FT-IR were noticeably higher than the peaks for b-AgNPs (8M urea ×2).
The detection of C, O, N, P and small amounts of Cl and S by EDS analysis suggests the presence of organic matter (
Figure 4). A minor amount of P was detected, which advocates that the silver nitrate did not react with the phosphate buffer to precipitate as salt but instead formed b-AgNPs. The organic matter may be residual cell lysate material still present after b-AgNP processing. It is more likely that some organic molecules in cell lysate became associated with AgNP surfaces while in contact with each other. The addition of 8M urea during processing may have further promoted the coating or functionalization of the b-AgNPs with free cell lysate molecules. An appropriate functional group expressed on AgNP surfaces is all that is required for binding available biomolecules [
1,
9].
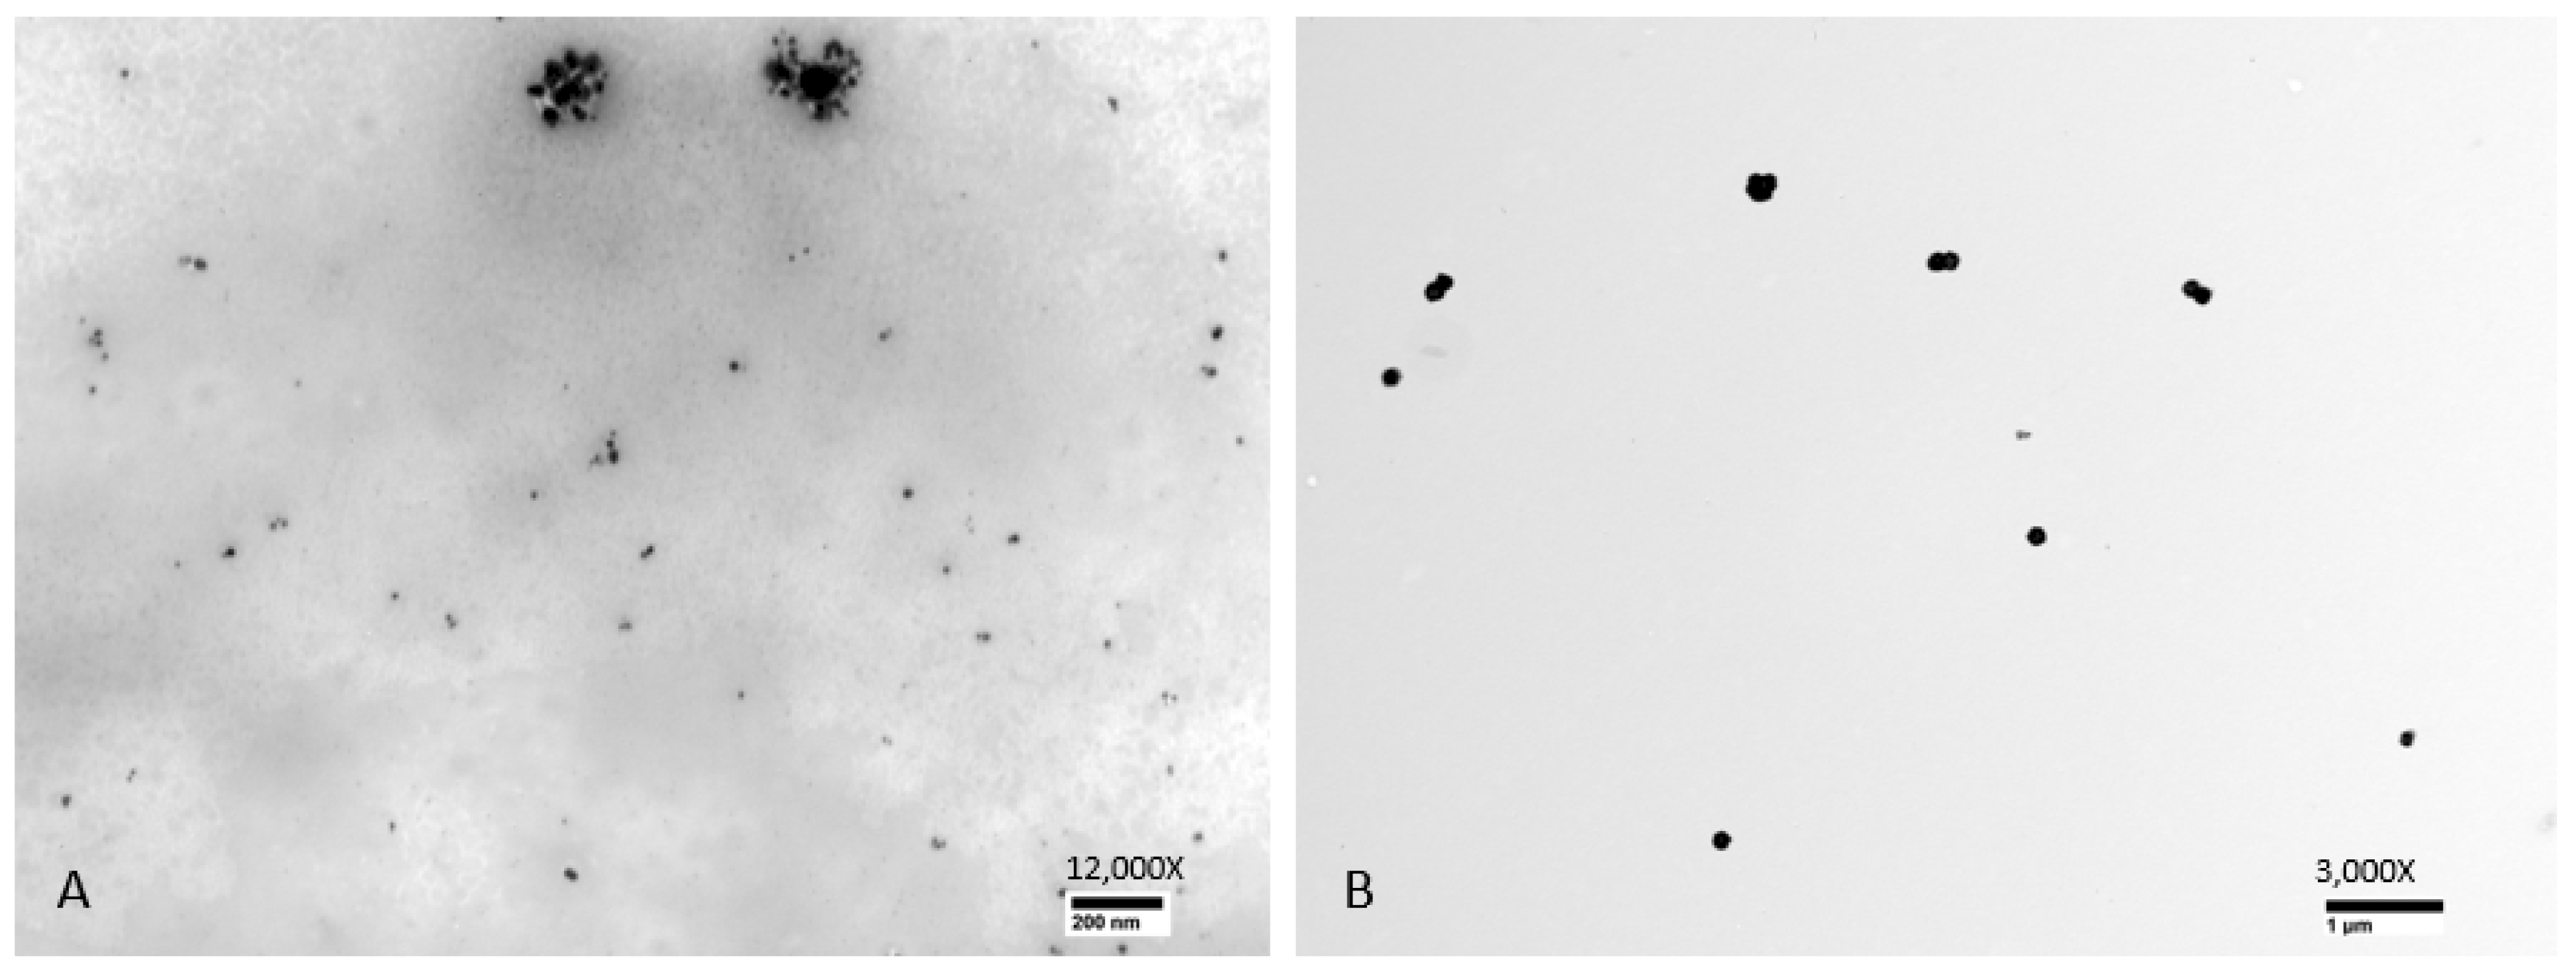
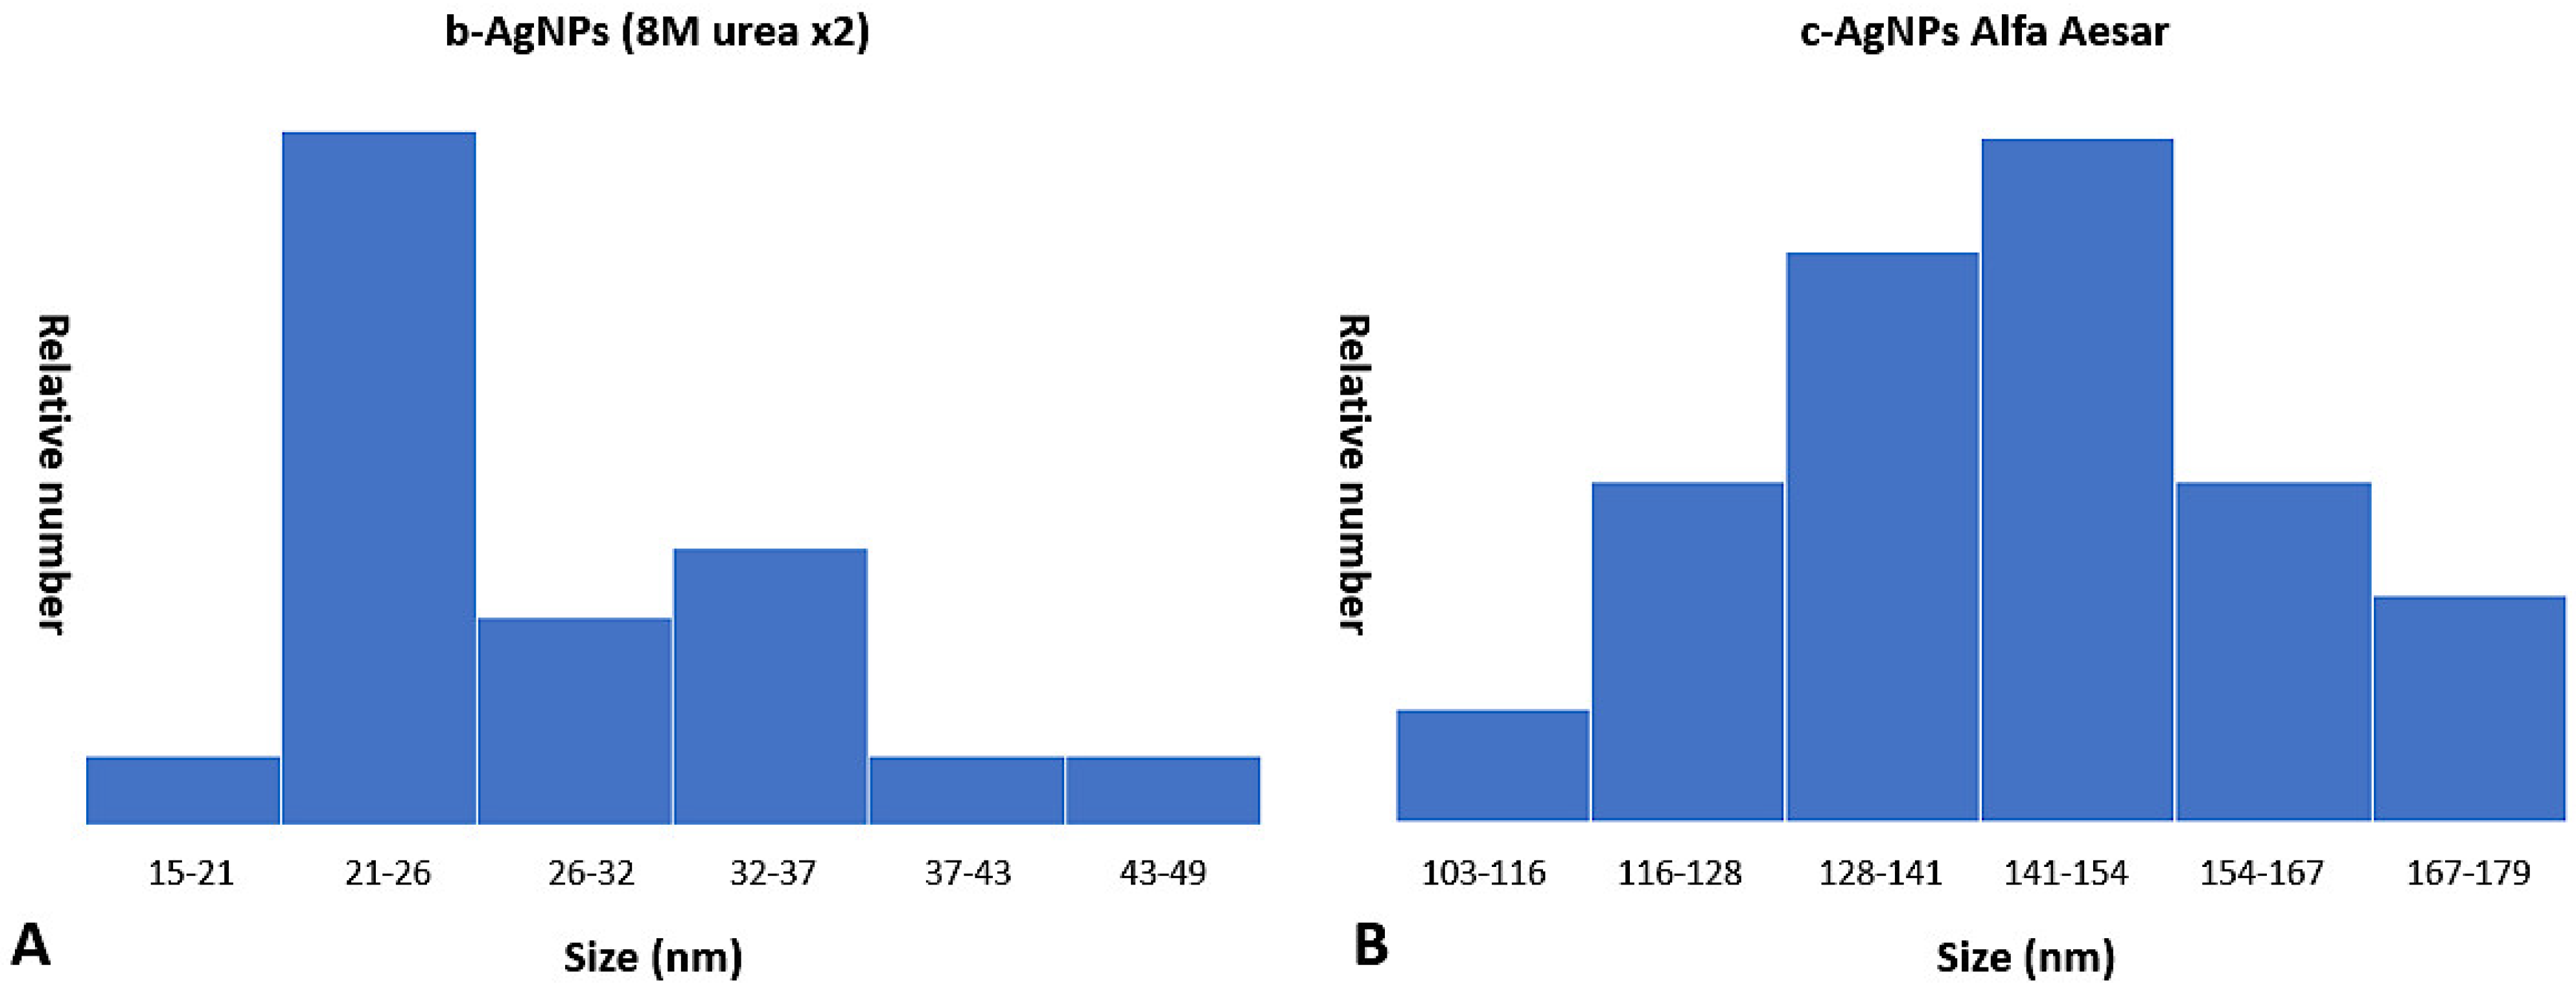
Examination of TEM photomicrographs of both b-AgNPs (8M urea ×2) and Alfa Aesar c-AgNPs revealed the presence of small particles in the expected nanoparticle range. The only noticeable difference between the two groups being the small aggregates seen in the b-AgNPs (8M urea ×2) photomicrographs that were absent in those for the Alfa Aesar c-AgNPs. The aggregates did not appear to have any negative impact on b-AgNP (8M urea ×2) antimicrobial activity. By direct measurement, the b-AgNPs (8M urea ×2) were noticeably smaller than those detected by Zetasizer measurements: 28.7 nm versus 156.1 nm, respectively (
Figure 6). Measurements of aggregates ranged from 148–170 nm. This suggests that the aggregates contributed more to the 156.1 nm b-AgNPs (8M urea ×2) Zetasizer measurements than did individual particles. This observation underlines the value of evaluating DLS results by performing a direct measurement of AgNPs using SEM or TEM photomicrographs to detect aggregates. This is especially true when using earlier, less sensitive DLS instrumentation.
Concerning bioactivity, all three b-AgNPs types were effective against 6/6 (100%) bacteria by MIC testing (
Table 3,
Table 4 and
Table 5). In all assays, the b-AgNPs (8m urea ×2) were the most effective at controlling bacterial growth. Both the b-AgNPs (8m urea ×1) and b-AgNPs (water ×2) showed mostly comparable values. Here, b-AgNPs (8M urea ×1) and b-AgNPs (water ×2) were equal in effectiveness in 4/6 (~67%) tested bacteria. The two exceptions to this equal effectiveness were
Staphylococcus aureus (MSSA) and ESBL
Escherichia coli. Here, the b-AgNPs (8M urea ×1) were seen to be more effective than b-AgNPs (water ×2). Similarly, all three b-AgNPs also showed good growth control of
Candida albicans yeast. The b-AgNPs (8M urea ×2) showed the best control with an MIC of 1.25 µg/mL followed by b-AgNPs (8M urea ×1) with an MIC of 2.50 µg/mL, and b-AgNPs (water ×2) with an MIC of 5.0 µg/mL.
An MIC concentration of 5.0 µg/mL was required for the b-AgNPs (8M urea ×2) to control
Aspergillus fumigatus growth. Most likely, a higher MIC concentration was needed for
Aspergillus fumigatus mold than
Candida albicans due to the presence of dormant fungal spores. Fungal spores have thick coats that make them generally resistant to most antimicrobial agents [
20]. The existence of spores in the test inoculum would also help to explain why both b-AgNPs (water ×2) and b-AgNPs (8M urea ×1) were ineffective at an MIC of 10 µg/mL. The lower MIC value of each of the 3 b-AgNPs was sufficient to inhibit
Candida albicans yeast since it is unable to form spores. The requirement for a higher b-AgNPs MIC concentration may have also been due to the fact that fungi have different cell walls than bacteria [
21]. Collectively, both the bacterial and fungal MIC results serve to illustrate the superior action of b-AgNPs (8M urea ×2) along with their potential to act as a broad-spectrum antimicrobial agent.
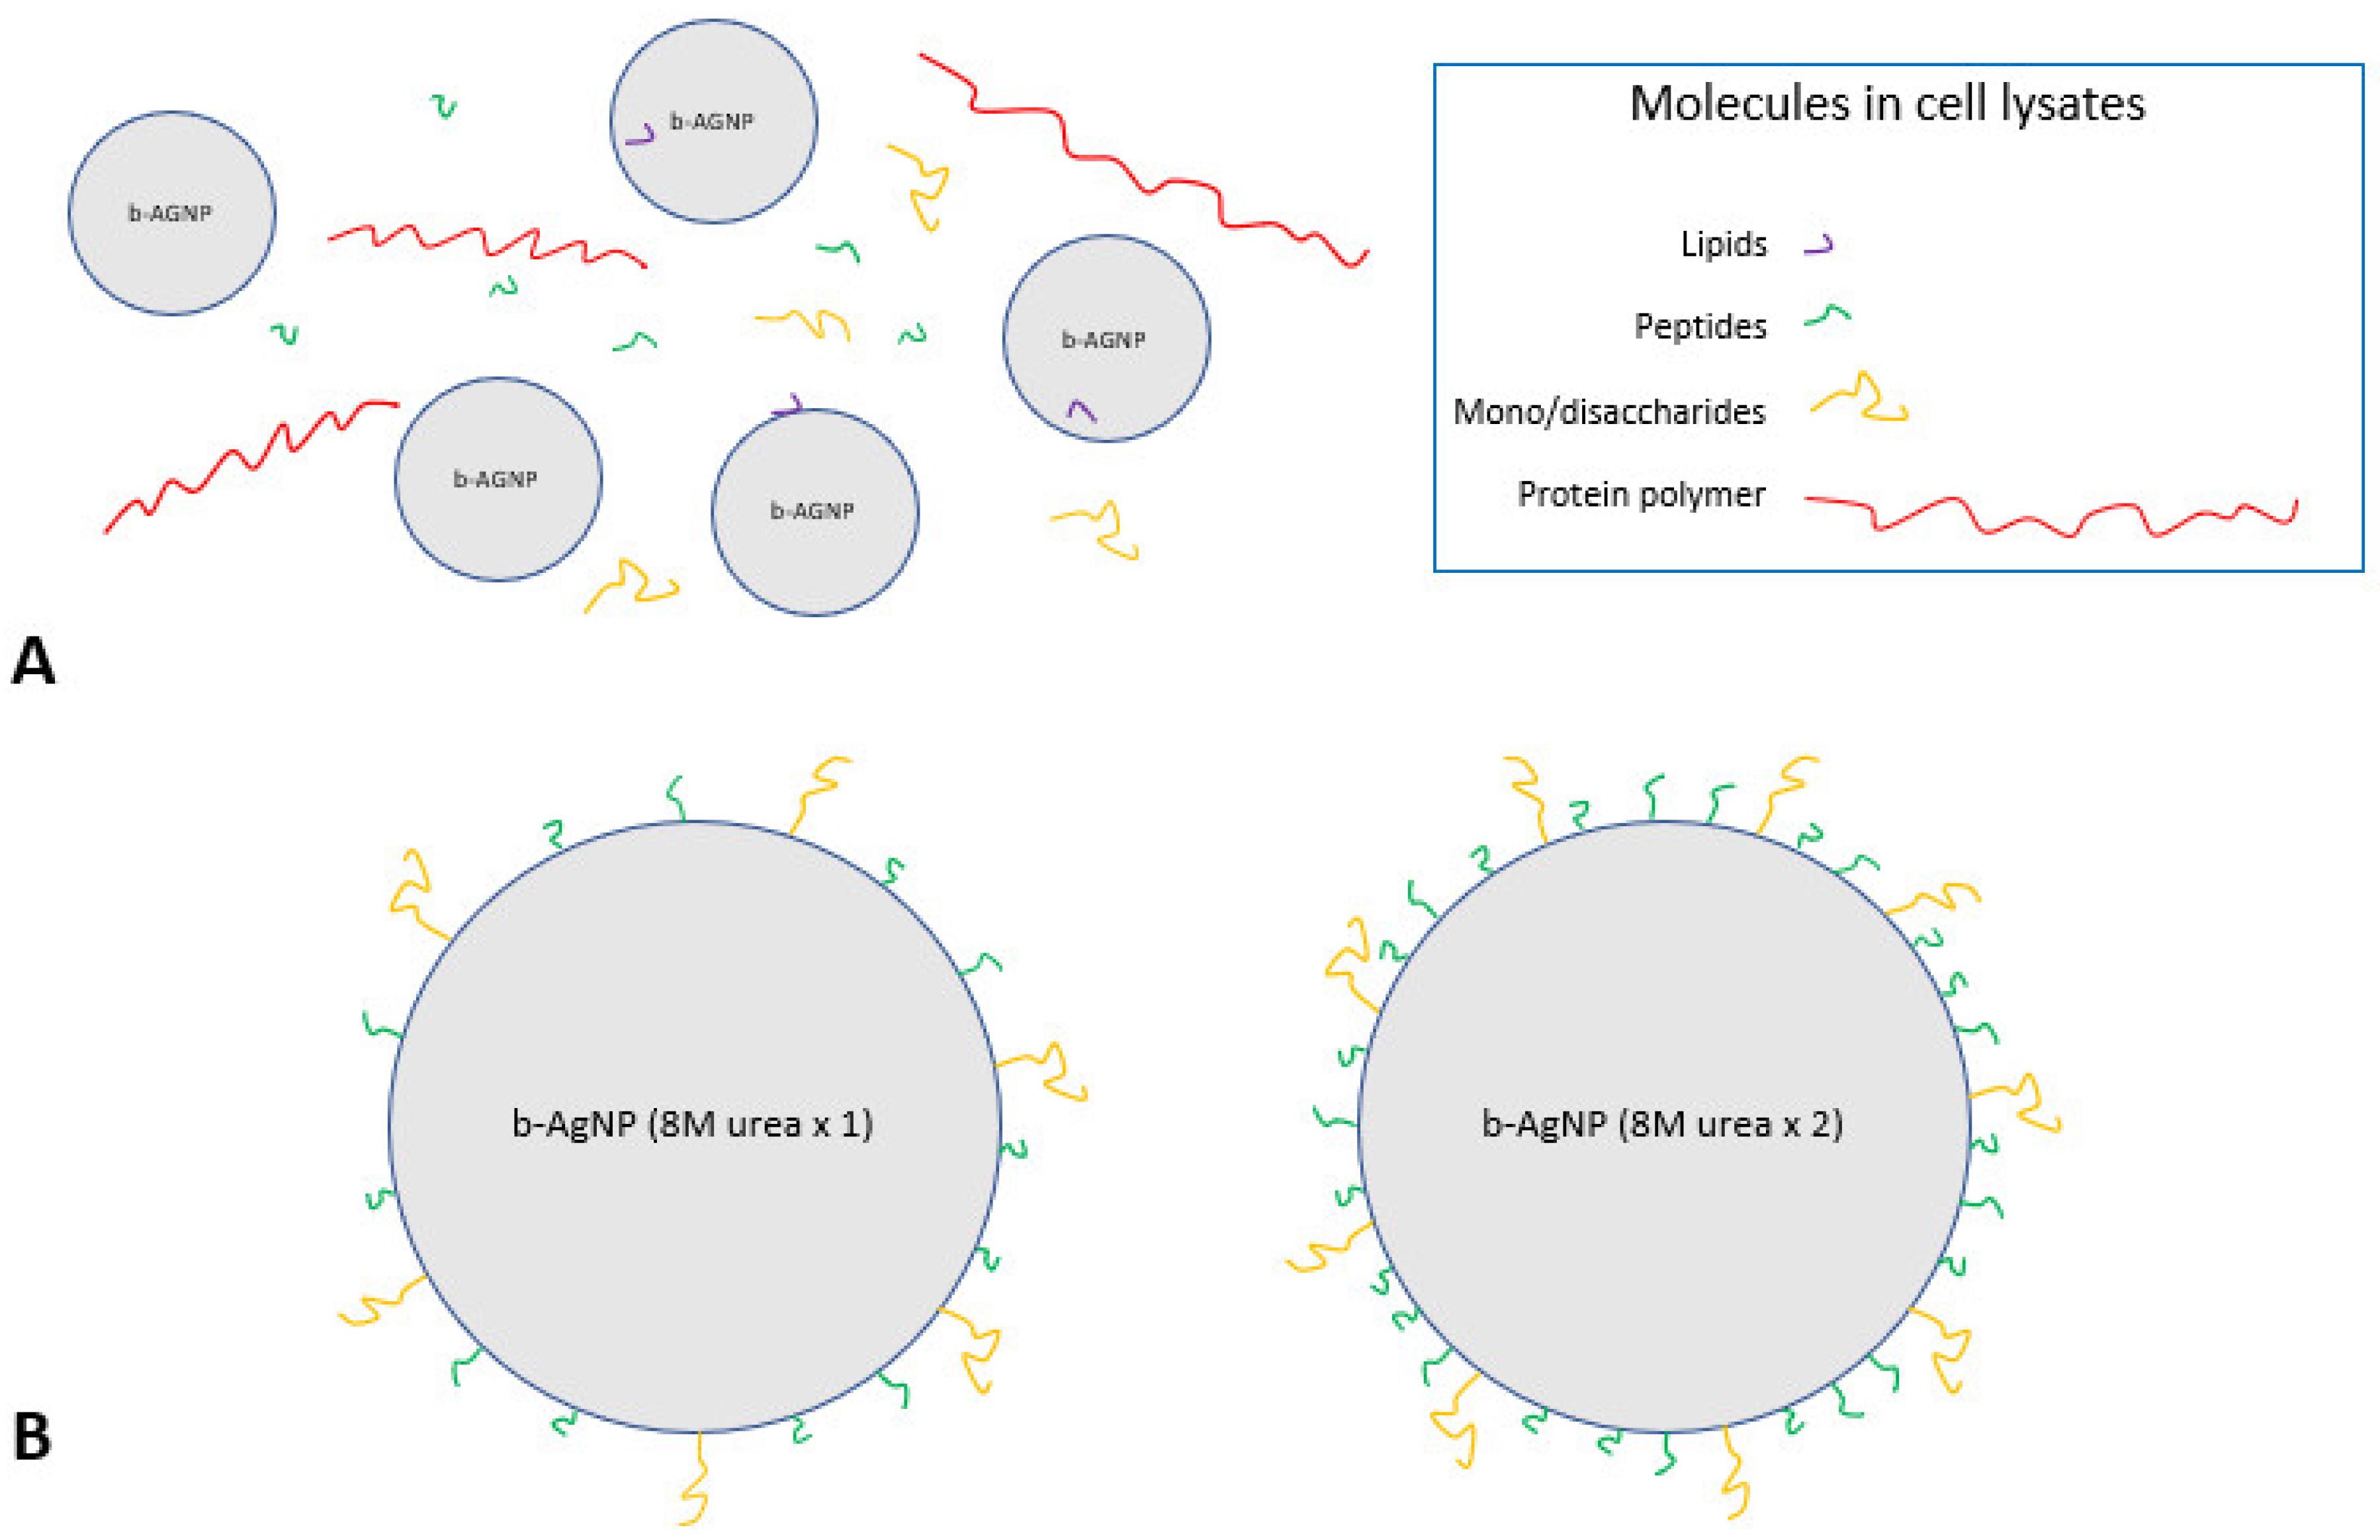
The increased antimicrobial activity of the b-AgNPs (8M urea ×2) is thought to be related to, at least in part, urea’s chemical action. Urea is a protein-denaturing agent that increases the solubility of hydrophobic molecules [
22]. It is capable of removing affixed insoluble molecules such as fatty acids and lipids from b-AgNPs treated once with 8M urea. This would expose more soluble functional groups, such as carboxyl (-COOH), amine (-NH2), amide (-NR2) and hydroxyls (-OH), thus making the 8M urea-treated b-AgNPs more soluble and more stable while in an aqueous solution. A second 8M urea wash would have acted to remove additional insoluble groups, allowing more soluble molecules present in the cell lysate to attach to its surface. Interactions occurring between soluble b-AgNPs surfaces and cell lysate molecules would have been greatly influenced by these forces while suspended in an aqueous environment [
23]. High-speed centrifugation during b-AgNPs processing would have reduced the distance between both entities, thereby increasing the potential number of interactions. In theory, a greater amount of functionalization with available soluble molecules occurred in the b-AgNPs (8M urea ×2) group receiving two separate 8M urea treatments, thereby enhancing its antimicrobial activity to a much greater degree than the b-AgNPs (8M urea ×1) receiving only a single 8M urea treatment (
Figure 7).
Organic molecules of different composition, size, and complexity can functionalize nanoparticle surfaces. These biomolecules can range from small molecules such as lipids, vitamins, peptides, sugars to much larger polymers including proteins, enzymes, and nucleic acids. Functionalizing nanoparticle surfaces with biomolecules changes their surface composition and overall structure but leaves their bulk properties intact [
24]. Molecule attachment can occur via a variety of chemical groups, including carboxylic acid, primary amine, alcohol, phosphate, and thiols. Theoretically speaking, any number of molecules can be attached to the nanoparticle’s surface. In this respect, biofunctionalized AgNPs show great potential to serve as delivery vehicles, including transport of chemotherapeutic agents and genes [
25]. Additionally, biofunctionalized AgNPs coated with either chitosan or bovine serum albumin (BSA) have been shown to be effective in controlling
Streptococcus mutans, a bacterium associated with plaque biofilms causing dental caries [
26]. Chitosan-coated AgNPs are also effective against gram-negative bacteria, exhibit low cytotoxicity, and may be useful in sustained drug release, such as the antifungal agent itraconazole [
27,
28,
29].
The proposed mechanisms for the increased antimicrobial activity of the b-AgNPs (8M urea ×2) are further related to the determined particle size and zeta potential. Regarding size, smaller metallic nanoparticles tend to interact more with microbe plasma membranes leading to their destruction [
30]. In this regard, AgNPs ≤100 nm in diameter are used in a wide range of applications, including antimicrobial agent coatings for biomedical device, drug-delivery vehicles, imaging probes, diagnostic devices, and optoelectronic components. This is mainly due to their well-known antimicrobial activity and exceptional electrical properties [
1]. Furthermore, nanoparticles must also be small enough to pass through the microbe’s outer cell wall before contacting the underlying plasma membrane. It is highly unlikely that the outer cell wall of tested microbes prevented any AgNPs from reaching the underlying plasma membrane. It cannot be readily explained why the Alfa Aesar c-AgNPs measuring ~129 nm did not demonstrate antimicrobial activity while the somewhat larger b-AgNPs (8M urea ×2) measuring ~156 nm did. This suggests two distinctive points. First, that functionalized b-AgNPs >100 nm in size can also exhibit considerable antimicrobial activity. Second, that AgNPs’ size alone was not a major determining factor of antimicrobial activity in the current study, as witnessed by a lack of Alfa Aesar c-AgNPs activity against test microbes. The measured −44.4 mV zeta potential for the b-AgNPs (8M urea ×2) indicates good particle stability even with the presence of some small aggregates while suspended in water.
Finally, retesting of the refrigerated AgNPs indicated that each of the three b-AgNPs had lost very little potency after a year in storage in amber microtubes protected from light (
Table 6). A greater loss in potency was noted for both the b-AgNPs (water ×2) and b-AgNPs (8M urea ×1) where at least a 4× decrease in their effectiveness was noted. However, the b-AgNPs’ (8M urea ×2) ability to control MSSA growth was minimally affected, changing from an MIC of 0.62 µg/mL to 1.25 µg/mL, effectively a doubling of its concentration. This finding suggests that 2 mM sodium citrate is a good choice for enhancing the long-term stability of stored AgNPs.


