

Dynamic Simulation of a Pneumatic Transport Plant Powered by PV Panels and Equipped with Electro-Chemical Storage

DIME—Department of Mechanical Engineering, University of Genova, 16145 Genoa, Italy
*
Author to whom correspondence should be addressed.
Electrochem 2023, 4(2), 239-254; https://doi.org/10.3390/electrochem4020016
Submission received: 6 March 2023
/
Revised: 14 April 2023
/
Accepted: 20 April 2023
/
Published: 23 April 2023
(This article belongs to the Special Issue Sustainable Integration of Renewable Power Generation Systems)
Abstract
:This paper focuses on an industrial application where renewable power produced by photovoltaic panels is exploited to feed a pneumatic transport plant. The proposed system requires the careful management of the energy flows involved since it includes the interaction with the electric grid and with an electrochemical storage (battery) rather than the correct choice of the photovoltaic panel and battery itself. A dedicated control system needs to be developed in order to accord together these energetic flows, also providing a degree of flexibility to implement different control logics. The methodology employed in the research is simulation, which through the construction of a model in Matlab Simulink is able to reproduce the behavior of the system components and their energetic interactions for a long time period. The aim of the research is to provide a tool for assessing the energetic convenience of different battery–PV panel combinations. Moreover, an economical assessment of the proposed system is provided and compared to the traditional setup. Simulation results show that the proposed system provides energy savings with respect to a traditional grid-powered plant. The economic assessment shows that the system becomes convenient over the traditional setup within a time frame compatible with an average PV panel’s useful life.
1. Introduction
The employ of renewable energy is rising both in the civil and in the industrial field. In particular, for local installation of small and medium power, photovoltaic plants are the most suitable. The main problem rising with photovoltaic power is the intermittency and variability of the production, which is particularly harmful in industrial processes requiring continuous energy supply [1,2,3,4,5]. In [1], the authors face the issue by the employ of sun irradiation forecasting methods so as to predict the PV plant’s behavior and act, consequently stabilizing the operation of the connected smart grid. In [2], the authors focus on the compensation of non-linear and unbalanced loads of the electric power system by the use of a line conditioner device. In [3], the authors consider the storage of energy in batteries or super-capacitors while defining proper algorithms for energy management. In [4], the approach is similar as that in [1], proposing a new short-term probabilistic forecasting method. In [5], a study on water-cooled PV panels performance is presented.
This paper proposes a system for renewable energy exploitation in connection with an industrial transport application. In particular, the focus is posed on a pressurized air pneumatic transportation plant [6,7,8,9,10,11,12], whose main energy-consuming component is the blower or compressor generating the air and material motion inside the pipelines. In most cases, such types of plant operate with an intermittent modality, switching on and off according to the frequency and timing of material loads arriving to the charging port of the pneumatic transport facility. The possibility of feeding the blower electric motor by a renewable energy source is investigated in this paper, and the source chosen is photovoltaic energy.
However, the employ of a photovoltaic system to power the pneumatic transporter requires a careful design for the entire management system of the energetic flows involved: in fact, the intermittent operation of the transportation plant combines with the also intermittent sun energy flow, and the two phenomena need to be fit together to obtain the desired transportation outcome. With this in mind, the proposed system is integrated with the connection to the electric grid, which is able to deliver or absorb the power flows in defect or in excess occurring during operation. Moreover, this paper investigates the possibility of installing an electrochemical storage (battery) in the system in order to operate as an energy reservoir to reduce the interactions with the electric grid. This particularity positions the proposed scheme in relation to the topic of smart grids [13,14,15,16,17,18]. In particular, papers [17,18] focus on the battery component with an experimental approach.
The system was investigated by simulation, with the aid of the Matlab Simulink software tool. Therefore, a model of the components constituting the system (pneumatic transport plant, photovoltaic panel, electric grid, and electrochemical storage) and that is able to calculate the energy exchanges between them was implemented with the aim to test different operational conditions and different sizes of the components. The energy flows involved are accorded together by a control system, physically located in an electronic component named “smart inverter”, in which the operational logics are included; such component was implemented in the Matlab Simulink model in order to easily change the operational logics. A similar simulation approach has been used in other previous works; for example, ref. [19] presents a Matlab Simulink model for simulating a combined PV panel–battery–supercapacitor system to smooth the electricity production peaks owing to unregulated energy demand and weather changes. Ref. [20] describes a hybrid wind–solar system in combination with battery storage. The model envisages a filter and hybrid forecast engine based on neural network and an intelligent evolutionary algorithm. Ref. [21] describes a neural-network-based simulator for domestic PV panel–battery systems aimed at assessing the battery sizing and the behavior with different control logics for managing the battery discharge methodologies. Finally, [22] presents a transient model of the panel–battery hybrid generation system connection using Matlab Simulink. Simulations have been employed to assess the system interaction with the electric grid to stabilize output in varying environmental conditions.
The system model was used to carry out a set of simulations aimed at finding an optimal combination of panel power and battery capacity from the energetic point of view while satisfying the user (pneumatic plant compressor) requirements. In particular, other than the “basic” plant with the only power feeding from the grid, eight other plant configurations with different combinations of panel power and battery capacity were simulated.
Simulations were protracted for a long time period, namely one year, in order to obtain sufficient data regarding the operation and the optimal combination of the components mentioned above.
In addition, an analysis from the economical point of view was performed by a comparison of the investment and running costs for the various plant solutions simulated.
The paper is organized as follows: Section 2 describes the proposed plant configuration, highlighting the system components and their interconnections and providing the operational modalities of exercise. Section 3 describes the simulation model, with particular focus on the modelling in Matlab Simulink of the different components of the system, including a description of the control logics adopted for managing the energetic flows among the components. In Section 4, we present the simulation results for eight cases tested, in particular two photovoltaic panels with different powers that were tested either without battery or combined with three batteries of different capacity. In the same section, an economic assessment for the different plant solutions is carried out, providing a comparison with the basic plant, which absorbs the electric power from the grid only. Finally, in Section 5, the conclusions are drawn.
2. Plant Configuration
Figure 1 shows the scheme of the proposed system for the pneumatic transport plant integrated with a photovoltaic energy source. As follows are listed and briefly described the items composing the system:
- PV panel: the photovoltaic panel converts the sunlight power into continuous current power; as known, sunlight power is discontinuous and depends on the meteorological conditions;
- Electric grid: in order to ensure power continuity to the plant, a connection to the national three-phase electric grid is required;
- Compressor and electric motor: the generator of the air flow employed for the transport of material particles in suspension; its operation is intermittent according to transport exigencies;
- Electro-chemical storage (battery): the energy storage employed to accumulate and release the sun energy by using appropriate logic algorithms turned to efficiency optimization;
- Smart inverter (power split): represents the heart of the system [23]. It provides the connection among all the energy sources (PV panel, DC mono-phase current, electric grid, and AC tree-phase current), the user (AC three-phase electric motor moving the compressor), and the electro-chemical storage, operating in DC. It contains the algorithms required to direct the various energy flows involved during the operation.
The pneumatic transportation plant is the final user of the air stream produced by the compressor, fed by the energy sources described above. In the present article, the pneumatic plant is considered of the pressurized type, so the blower was installed upstream of the transportation pipeline; the plant was set in order to transport only one type of material in a single pipeline; however, the same system could be easily modified in order to cope with several different materials and/or several different pipelines transporting the materials to various locations; this could be done by, e.g., modifying the rotational speed of the compressor (i.e., by setting the proper feeding frequency in the smart inverter) to provide the required flow rate and pressure for each material and for each pipeline.
The system is subjected to a double random variability:
- On the one side, the sun power, simply predictable by astronomical correlations, is however affected by the random behavior of the clouds, whose presence may abate the output of the PV panel whenever overcasting is particularly intense;
- On the other side, the amount of material to be transported, in the present article, was chosen to evaluate the operation of a pneumatic plant fed by cargos (e.g., trucks) of one material type, arriving with regular frequency for 12 h shifts (from 06:00 to 18:00), but the tons of material transported by each cargo are a random value; the pneumatic plant is exerted in order to blow a constant air flow rate value to move all the cargo material towards the discharge point; thus, the random variability of each cargo material mass translates into a variability of the time period in which the compressor is turned on in order to fulfill the transport.
3. Simulation Model
The model of the pneumatic plant equipped with panel and battery was implemented in the Matlab Simulink environment, which is ideal for monitoring the time-varying behavior of variables. The model sample time was set to 1 min [24]; this allows simulation of the system dynamics while keeping an acceptable simulation runtime. (The latter may be long owing to the one-year time period simulated for assessing the system performance.)
The model consists of sub-models:
- Material arrival and compressor activation: it provides random variability of the material mass incomings, and the latter provides the compressor switch-on for its transport to the destination point;
- Photovoltaic panel: described in detail in the further sections, it is configurable for the panel geographic position and orientation and provides a random cloud generator;
- Electro-chemical storage: this sub-model is also configurable concerning the capacity and the type (performance) of the battery;
- Control logics: contains the operational algorithms; in this sub-section, the input variables are compared to the configurable set-points to provide signals to the inverter-power split dedicated to manage the energy flows involved.
All the model sections are highly configurable: it is possible to simulate the real performance of the various hardware components thanks to the option of uploading the performance maps if available (e.g., it is possible to upload the real curves of battery efficiency in charging and discharging so as to determine the panel efficiency in function of the environmental temperature).
The model is operated in three phases:
- Pre-processing, which consists in the upload of the data for the simulations (e.g., panel area, battery capacity, load frequency, etc.);
- Processing, consisting of the simulator computations;
- Post-processing, in which the results are displayed; results consist of all the power flows and energy amounts related to the different system modules.
As follows, the various sub-models are described in detail.
3.1. Material Arrival
The material arrivals with each cargo were simulated by a combination of “Random Number Generator” (for the cargo material masses) and “Pulse Generator” (for the start and end of the 12 h shifts) Simulink blocks. The mass of each load in arrival has a normal distribution, with mean value of 8 tons and a variance of 2 Mg (tons).
The compressor is switched on as soon as the new cargo of material arrives and switched off as soon as all the material has been transferred to the pipeline discharge point. The simulator was set in order to operate with a fixed value of air flow rate and a fixed value of air to material mass ratio so that a higher amount of arriving material will involve a longer transfer cycle time. In the present case studied, the design material flow rate of the pneumatic plant was set to 10 Mg∙h−1.
For every simulation time step, the mass of incoming material and the integral of the transported flow rate (i.e., the current amount of transported mass) are constantly compared; as soon as the transported mass equals the mass of material arriving with the cargo, the compressor stops. In Figure 2 is shown the Simulink block scheme for simulating the compressor operation in the function of the incoming material.
The air flow rate required to transport the material was calculated by the well-known semi-empirical formula of Hudson (see Equation (1)) and in the function of the material density (in the present case, fixed and equal to 800 kg/m3) and of the plant design flow rate (10 Mg∙h−1).
where is expressed in Nm3∙h−1, with being the material density in the pile in kg∙m−3 and the material design flow rate of the plant in Mg∙h−1.
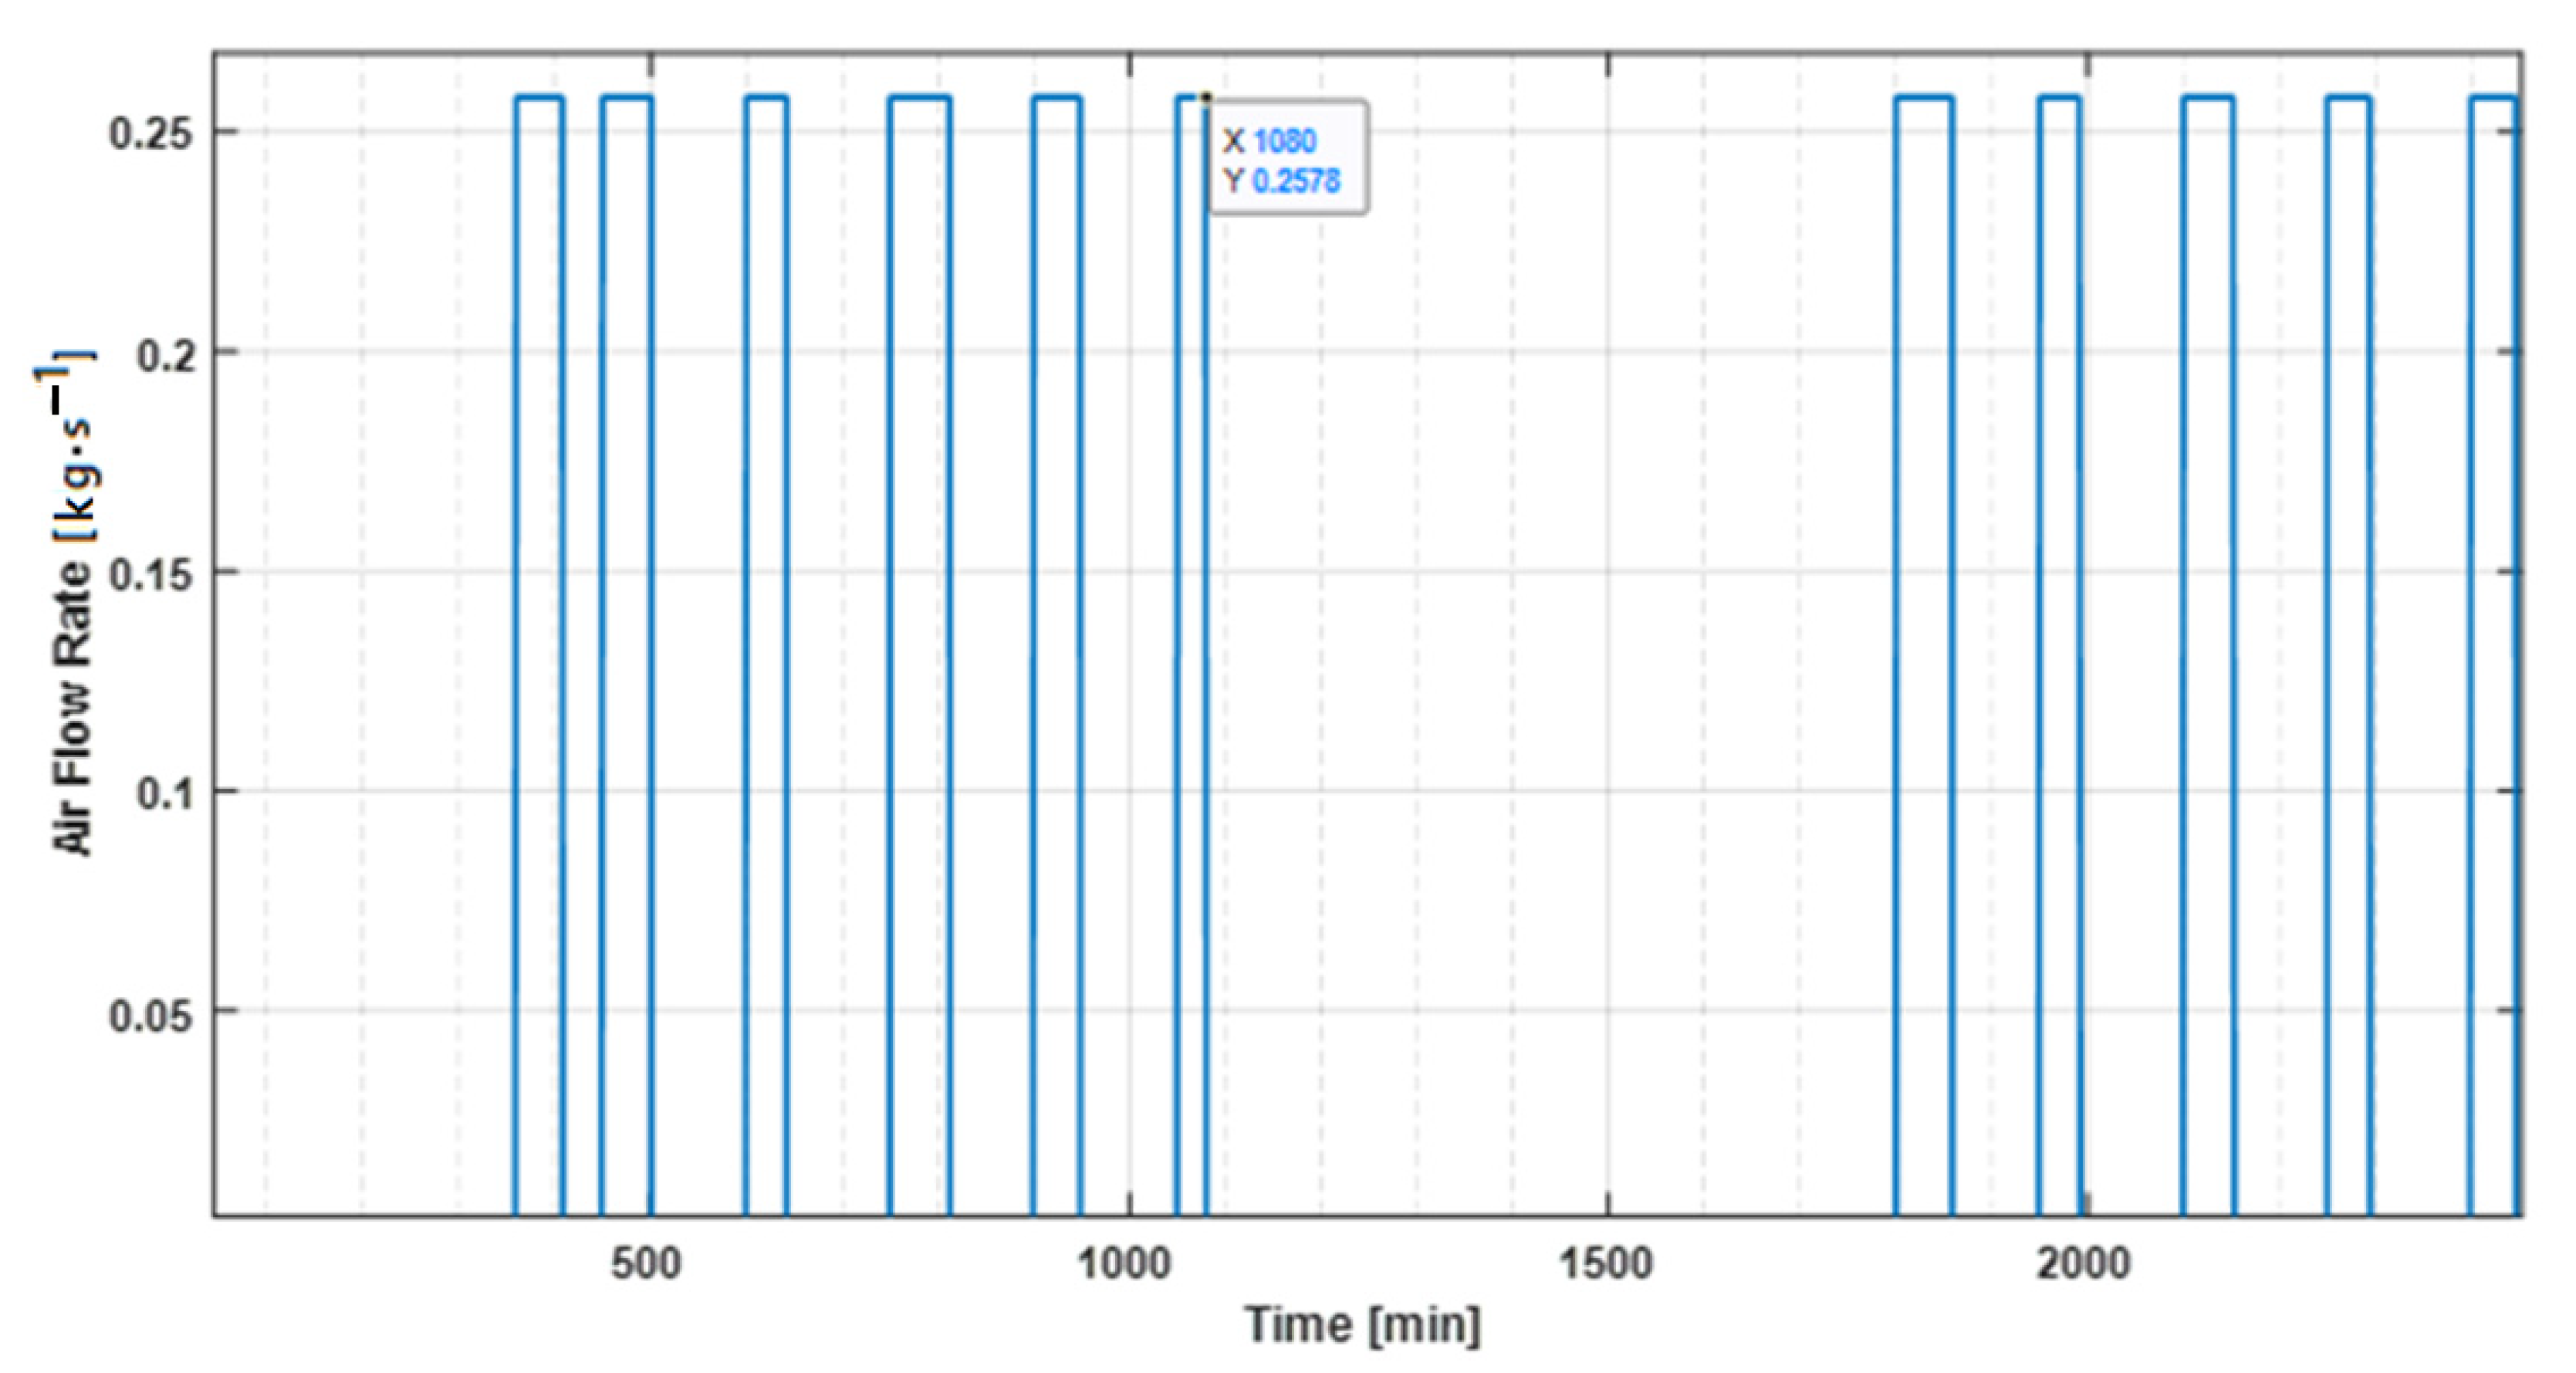
In Figure 3 is reported the operational cycle of the pneumatic plant for two shifts. As is visible, the air flow rate for the transport is always equal to 0.26 kg∙s−1, while the duration of the transport period is proportional to the mass of material on arrival.
3.2. Photovoltaic Panel
To reduce the computational effort and the duration of the runtime, the panel model was introduced in the simulator in the form of maps; the latter provide the values of voltage and current per panel square meter in function of sun irradiation and ambient temperature. These maps were derived by launching several times the photovoltaic panel model described in [25] with different input data. The maps can easily be changed, allowing, for example, to upload the model data coming from experimentally tested panels.
To account for sun irradiation, a mathematical model of the solar radiation on the ground [26] was employed; the latter takes as input the geographical position of the photovoltaic plant and its orientation with respect to the sun. The radiation model also accounts for the reduction of solar radiation on the ground due to the presence of clouds. This was carried out by the implementation of an algorithm based on the Simulink “Random numbers generator” blocks that simulate the presence, the intensity, and the duration of cloudy weather in the different seasons of the year.
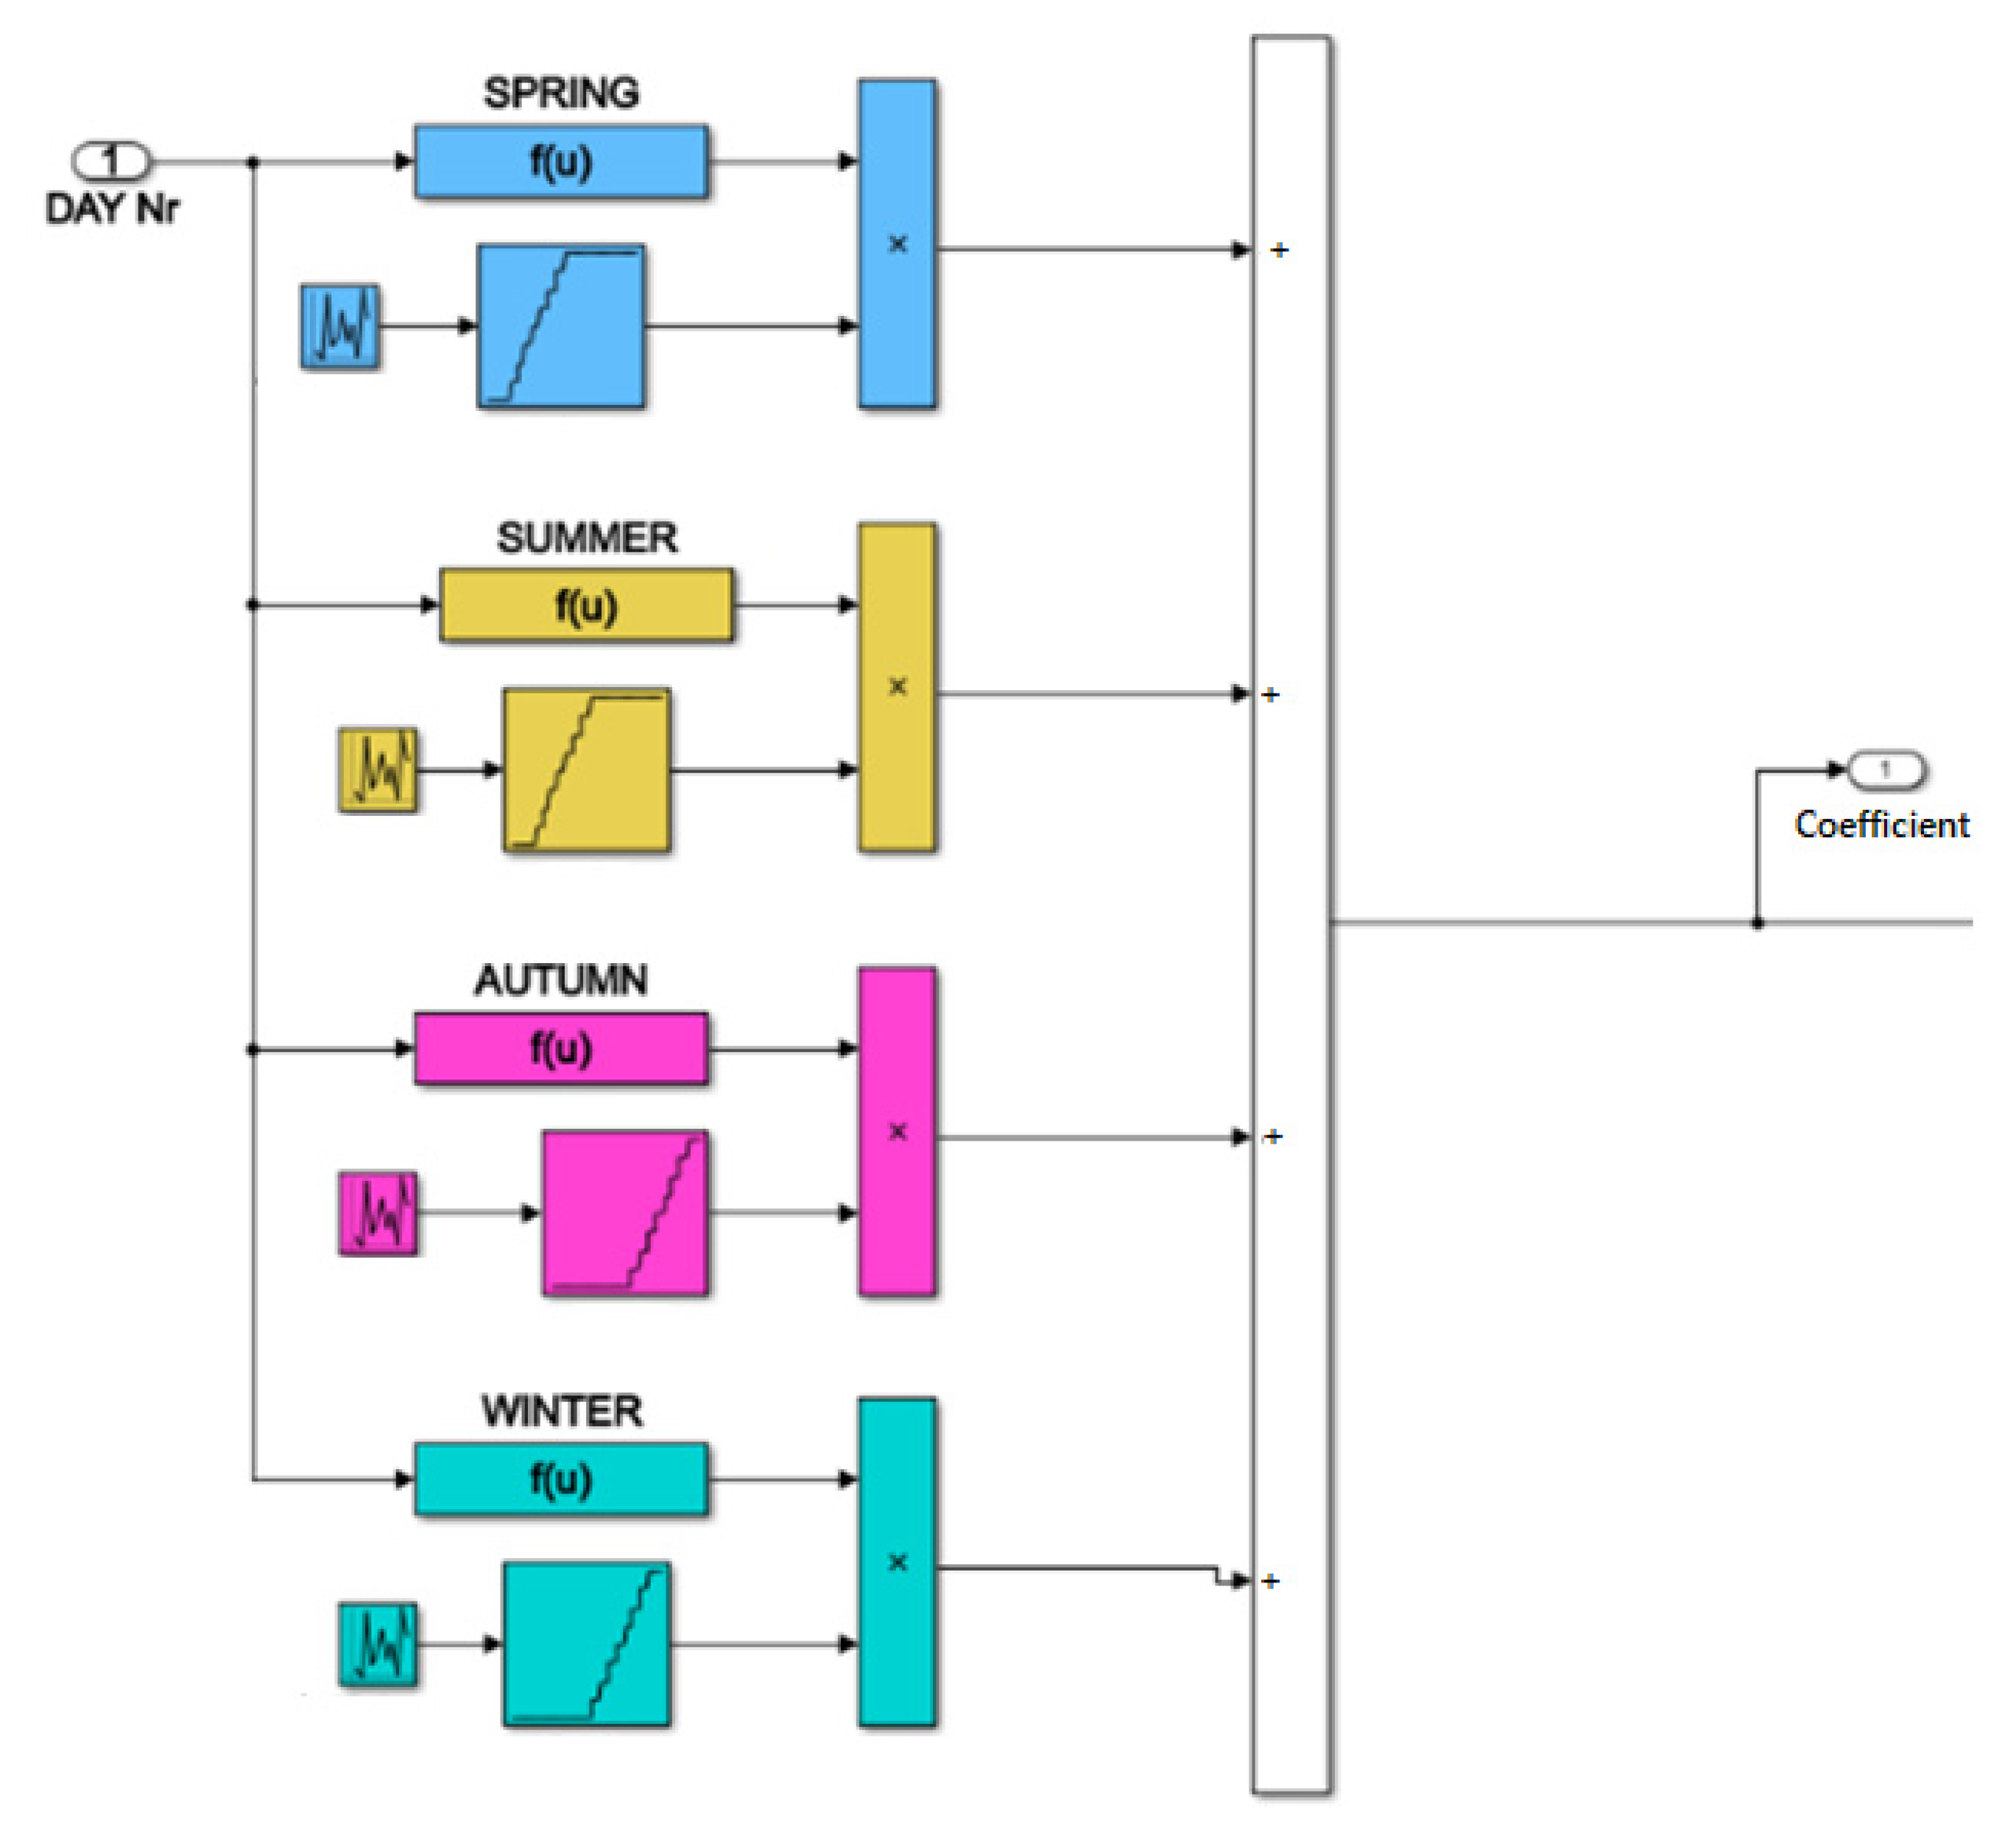
As visible in Figure 4, the random number generators (which give as output a number in the range 0–1) are one for each season and are connected to Simulink “Lookup-table” blocks, in which are set the curves of the weather coefficient; the latter assumes values between 0.2 (cloudy weather) and 1 (no clouds).
In this way, the weather coefficient is subjected to a random variation according to the weather conditions typical of each season. The so-calculated coefficient multiplies the sun irradiation and lowers it as the sky is cloudy.
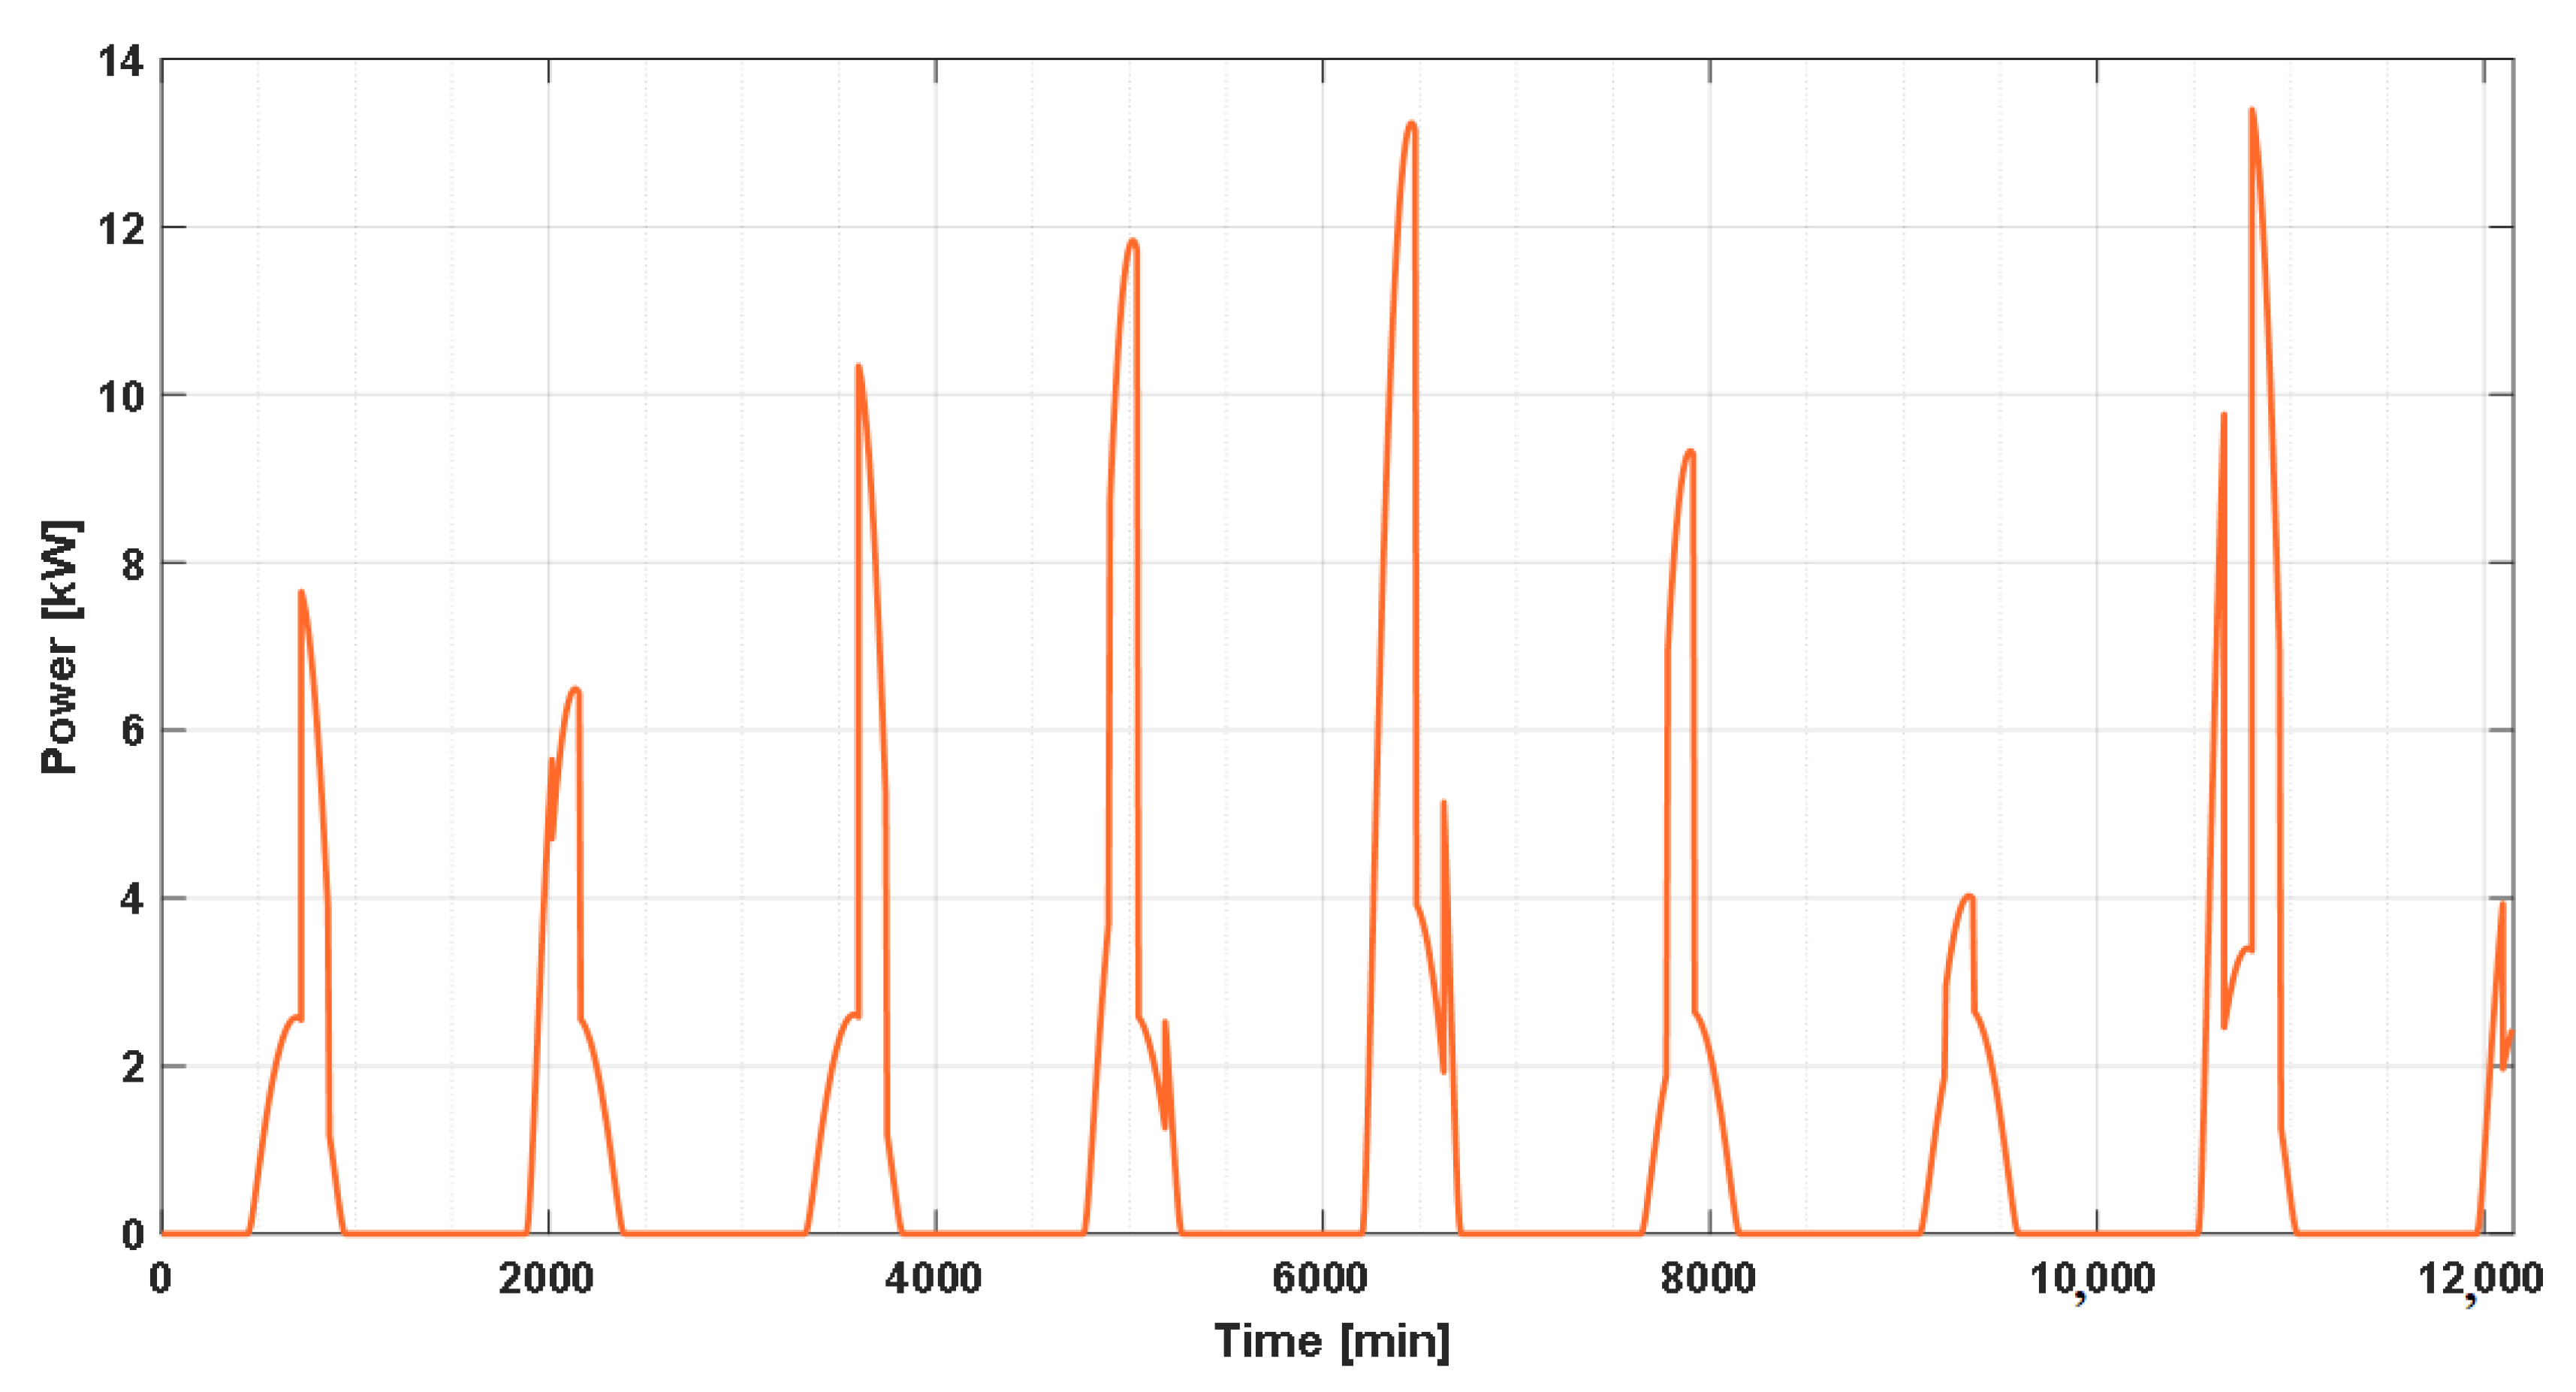
In Figure 5 is shown the PV panel output power for a nine-day winter period. As is visible, the random presence of clouds reduces the power produced by the panel.
3.3. Electrochemical Storage
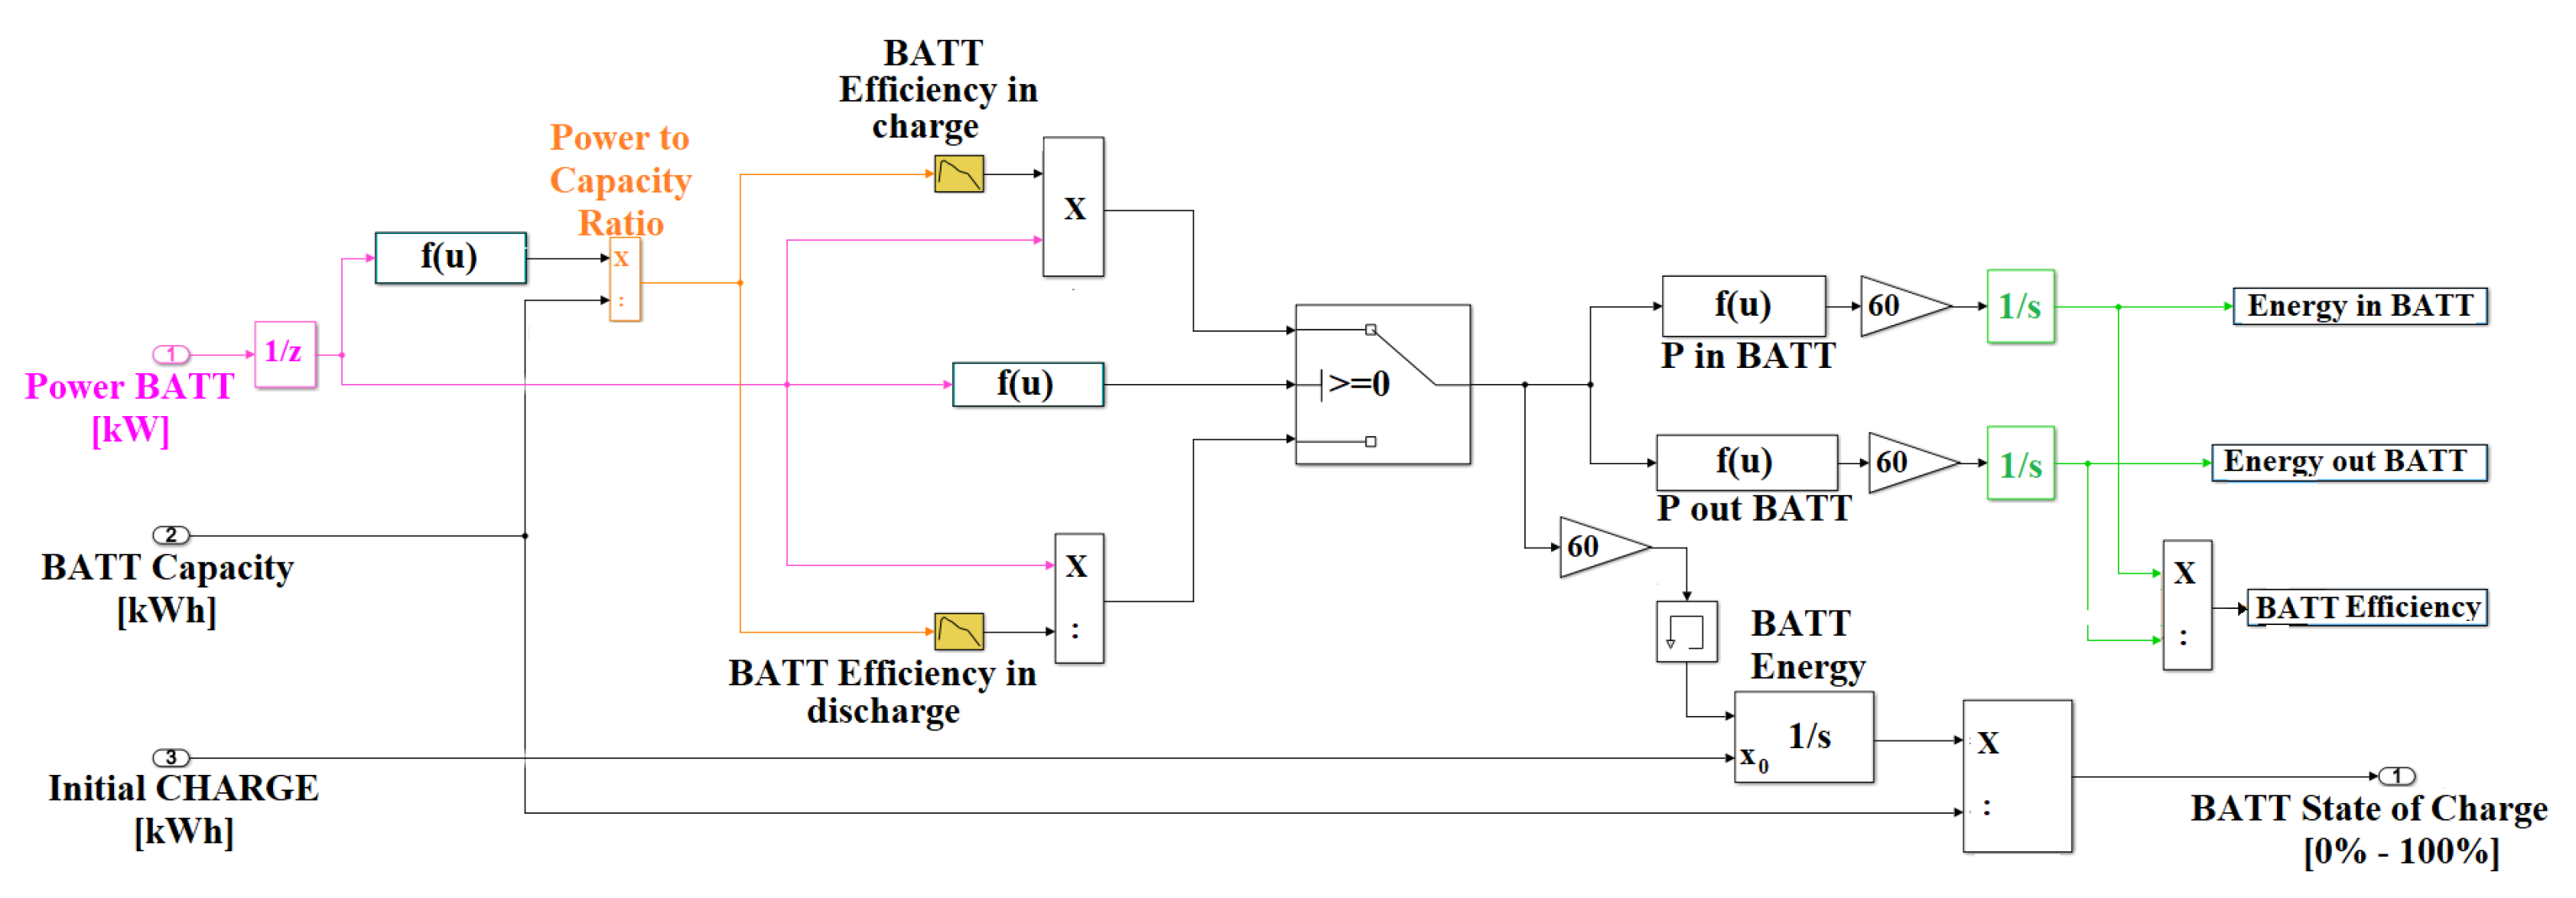
To calculate the instantaneous value of the energetic content, the storage was modeled as an “Integrator” Simulink block, for which the input is the chemical power to or from the battery, as reported in Figure 6.
The chemical power is derived from the instantaneous value of the gross power, which is given by the control algorithms. To obtain the chemical power from the gross power, it is essential to know the value of the battery efficiency.
The integrator needs as additional input the energy contained in the battery at the beginning of the simulation: in all the tests performed, this value was set to 50% of the gross capacity. The state of charge was then calculated by dividing the instantaneous energetic content by the gross capacity of the battery.
The simulation model was designed to receive as input the efficiency curves of the battery during charge and discharge; the efficiency values can be uploaded in the “Look-up table” Simulink blocks (highlighted in Figure 6 as “Charging Efficiency Curve” and “Discharging Efficiency Curve”) in function of the power-to-energetic-capacity parameter, expressed in kW/kWh units. In case said curves were not known, a single average value of the efficiency can be set for charge and discharge phases. In the present article, the curves of battery efficiency are determined by a separate Simulink model of the battery, described in [27,28,29,30,31]. It is, however, possible to upload the real efficiency performance of the battery from experimental measurements.
3.4. Control Logics
The control logics are intended to command the smart inverter–power split unit, providing the proper values of electric power from and to the connected components. The operation of the control logics is based on the values of the controlling variables, which were chosen as follows:
- Battery state of charge (SOC): to extend the battery life and allow its operation in optimal conditions, the SOC value should not drop below 40% and should not exceed 95%;
- Power produced by the panel: to properly command the system, it is important to monitor the power produced by the PV panel; the system source of power changes as the panel is not producing;
- Power absorbed by the compressor: the compressor on-off state is used to understand whether the final user is absorbing energy.
The controlled variables are the power to and from the grid and the power to and from the battery. The control system implemented is summarized in Table 1, where the values of the controlled variables are indicated in function of the possible combinations of the controlling variables.
The convention chosen for the power provides a positive sign as power enters in the battery and enters in the system from the grid and from the panel; the power sign is negative when power is required by the compressor.
The logics implemented in Table 1 are easily modifiable; it is possible, for example, to feed the grid with part of the energy stored in battery by discharging it with a previously decided power value; in that case, the battery should be near full. Furthermore, it could be interesting to assess the possibility of charging the battery directly from the grid, as its state of charge results as too low.
4. Simulation Results
The simulation model of the pneumatic plant powered by PV panel with electro-chemical storage was employed to calculate the energy balance of the system and evaluate the most apt size of the installed hardware for a plant having the operational cycle described above. The compressor was sized to overcome a total pressure drop of 2 bar, and during operation, it absorbs a gross electric power of 55.3 kW.
In particular, the simulations were turned to the determination of the optimal panel and battery size by launching six runs with different values of paneled area and battery capacity. Each run covers one year of operation (432,000 min).
For sake of comparison, the plant equipped with electro-chemical storage was simulated in parallel with a plant having the same configuration but not equipped with a battery: in this case, the power coming from the panel exceeding the requirements of the compressor cannot be stored and must be sent to the electric grid. This is not an issue from the plant management point of view, but it is from the grid management point of view; in fact, as stated in [1,32,33], renewable power introduced in the grid with non-controllable timing can provoke an increase in the grid power disturbances, affecting alternate current frequency. However, this is an issue that may affect a great number of distributed small power plants, such as those envisaging smart-grid installations spread all over a territory; from the authors’ point of view, installations as those objectively are not so numerous as to induce significant distortions to the grid frequency.
4.1. Overall Results
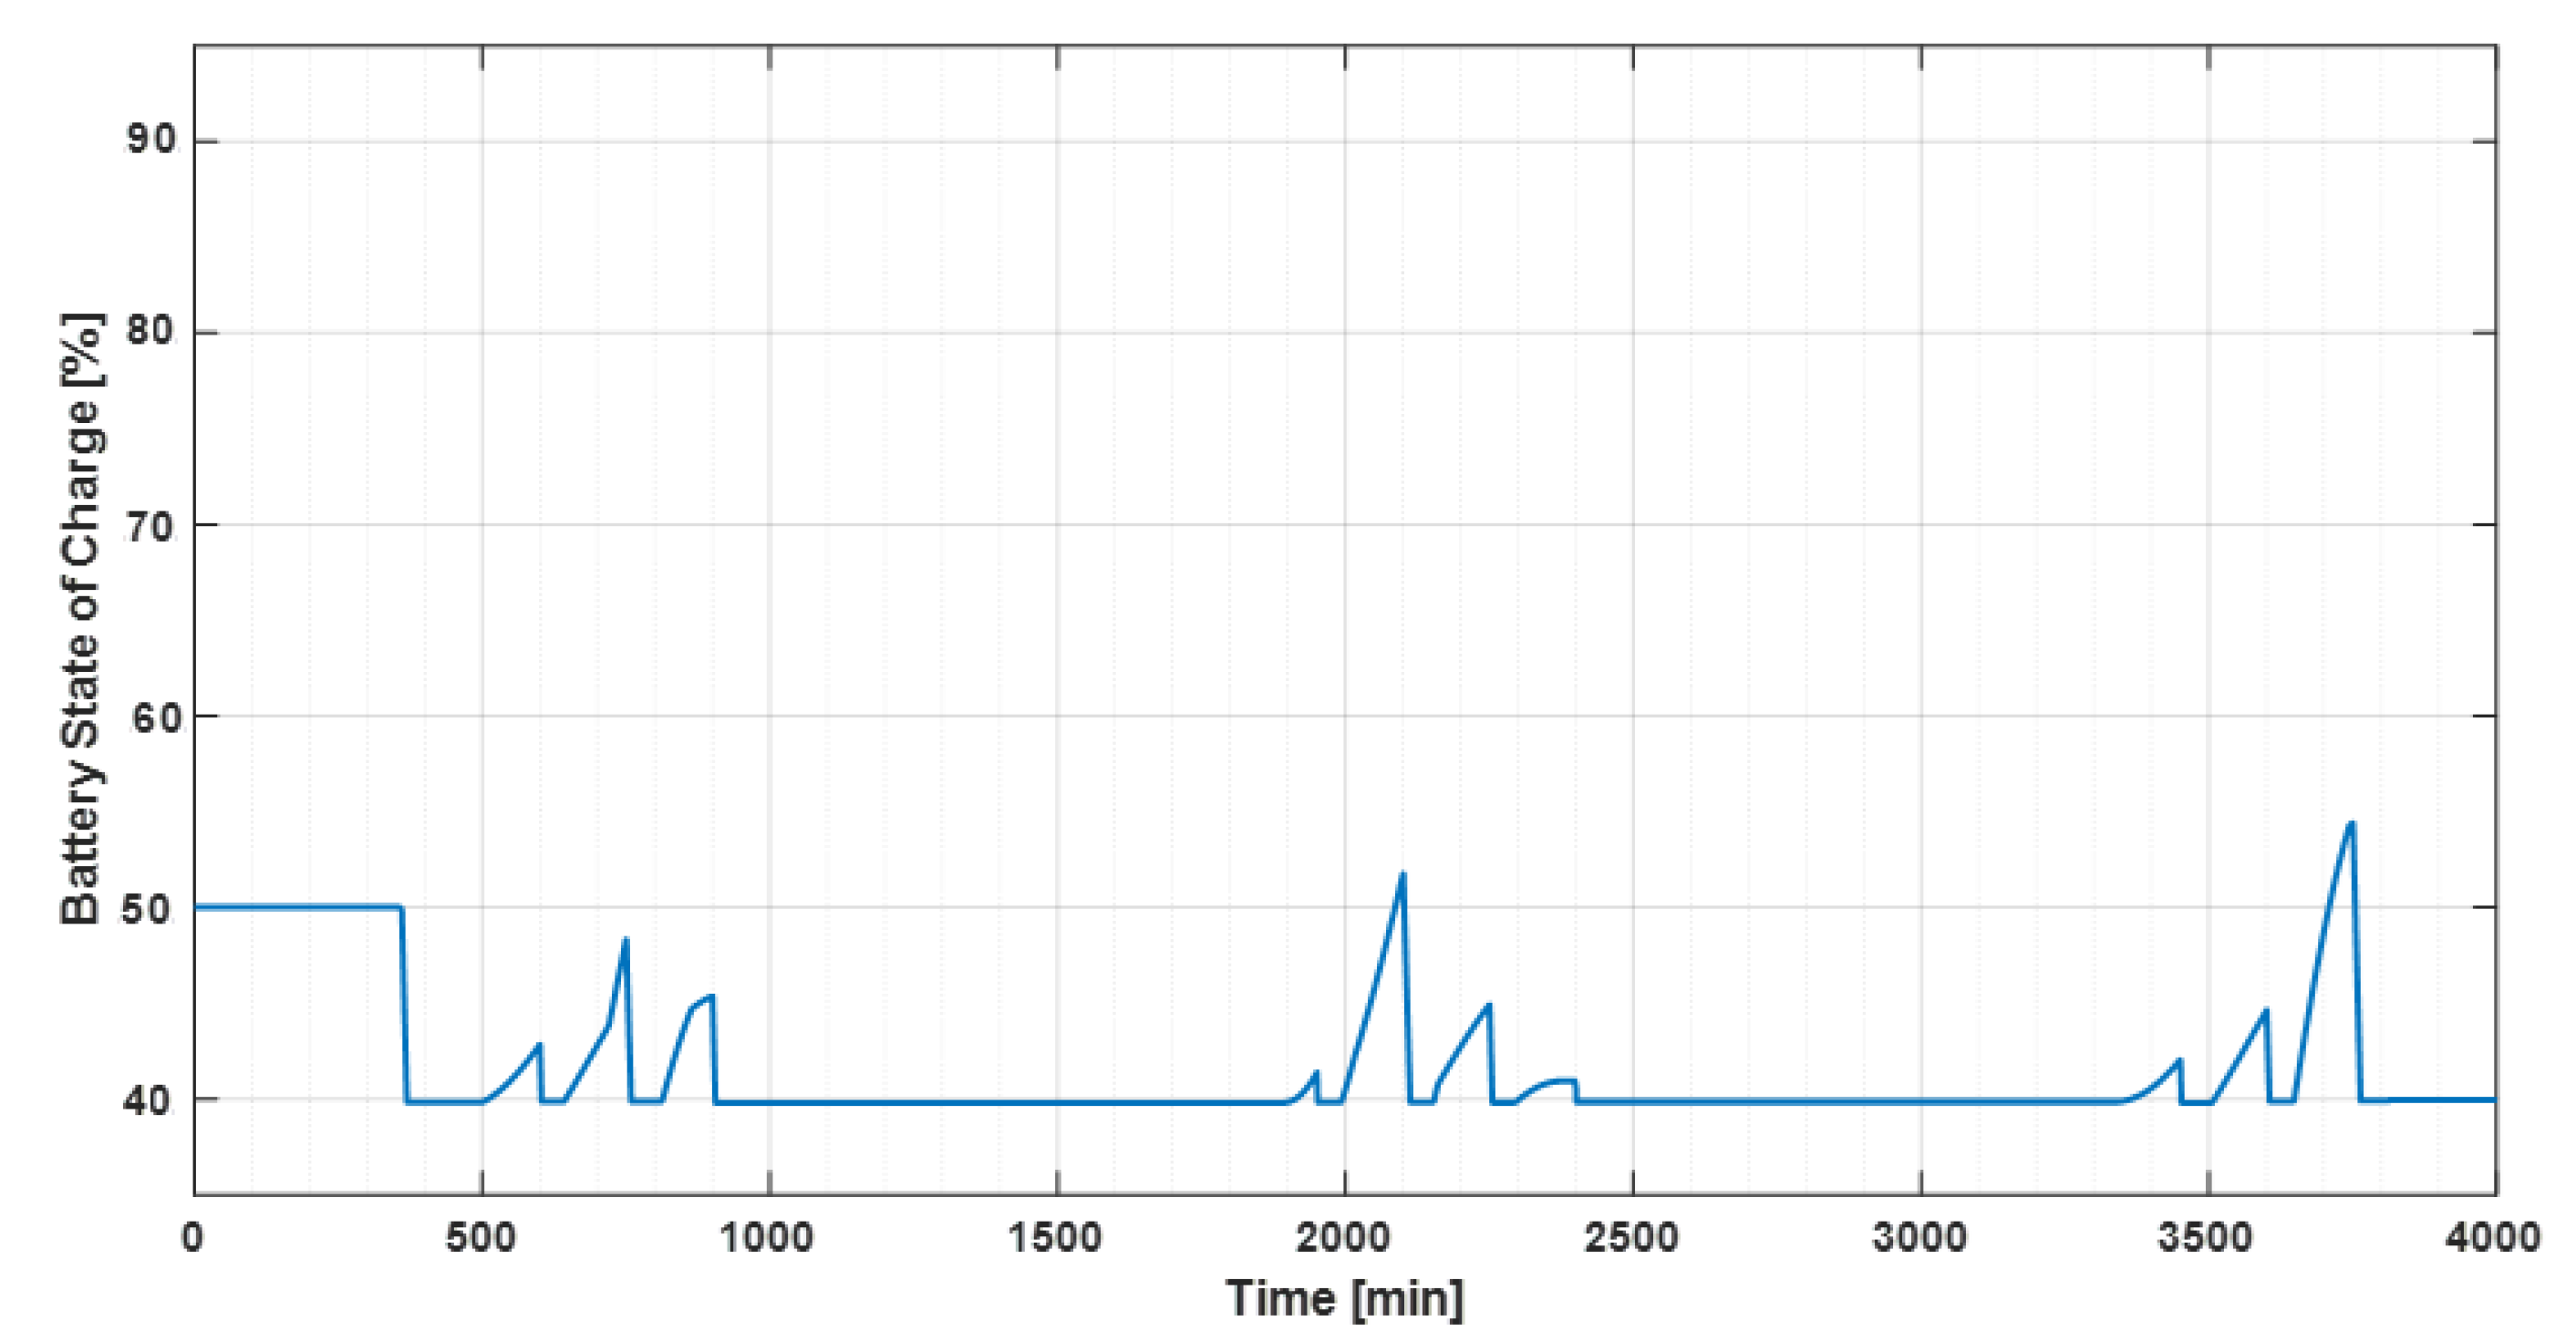
Figure 7 shows the variation with time of the power values involved in the simulation: power produced by the panel, power to and from the grid, power absorbed by the compressor, and power from and to the battery. As is visible, in the three days of operation reported in the diagram, the solar power is rather low since the data concern a winter period. Figure 8 shows the time variation of the battery state of charge for the same three days as shown above. The case presented in Figure 8 regards the configuration with 55 kW PV panel and 75 kWh battery. As is visible, the SOC values remain in the low range since on one side the incoming renewable power from the winter sun is still weak, while on the other side, the battery capacity is set to the highest value.
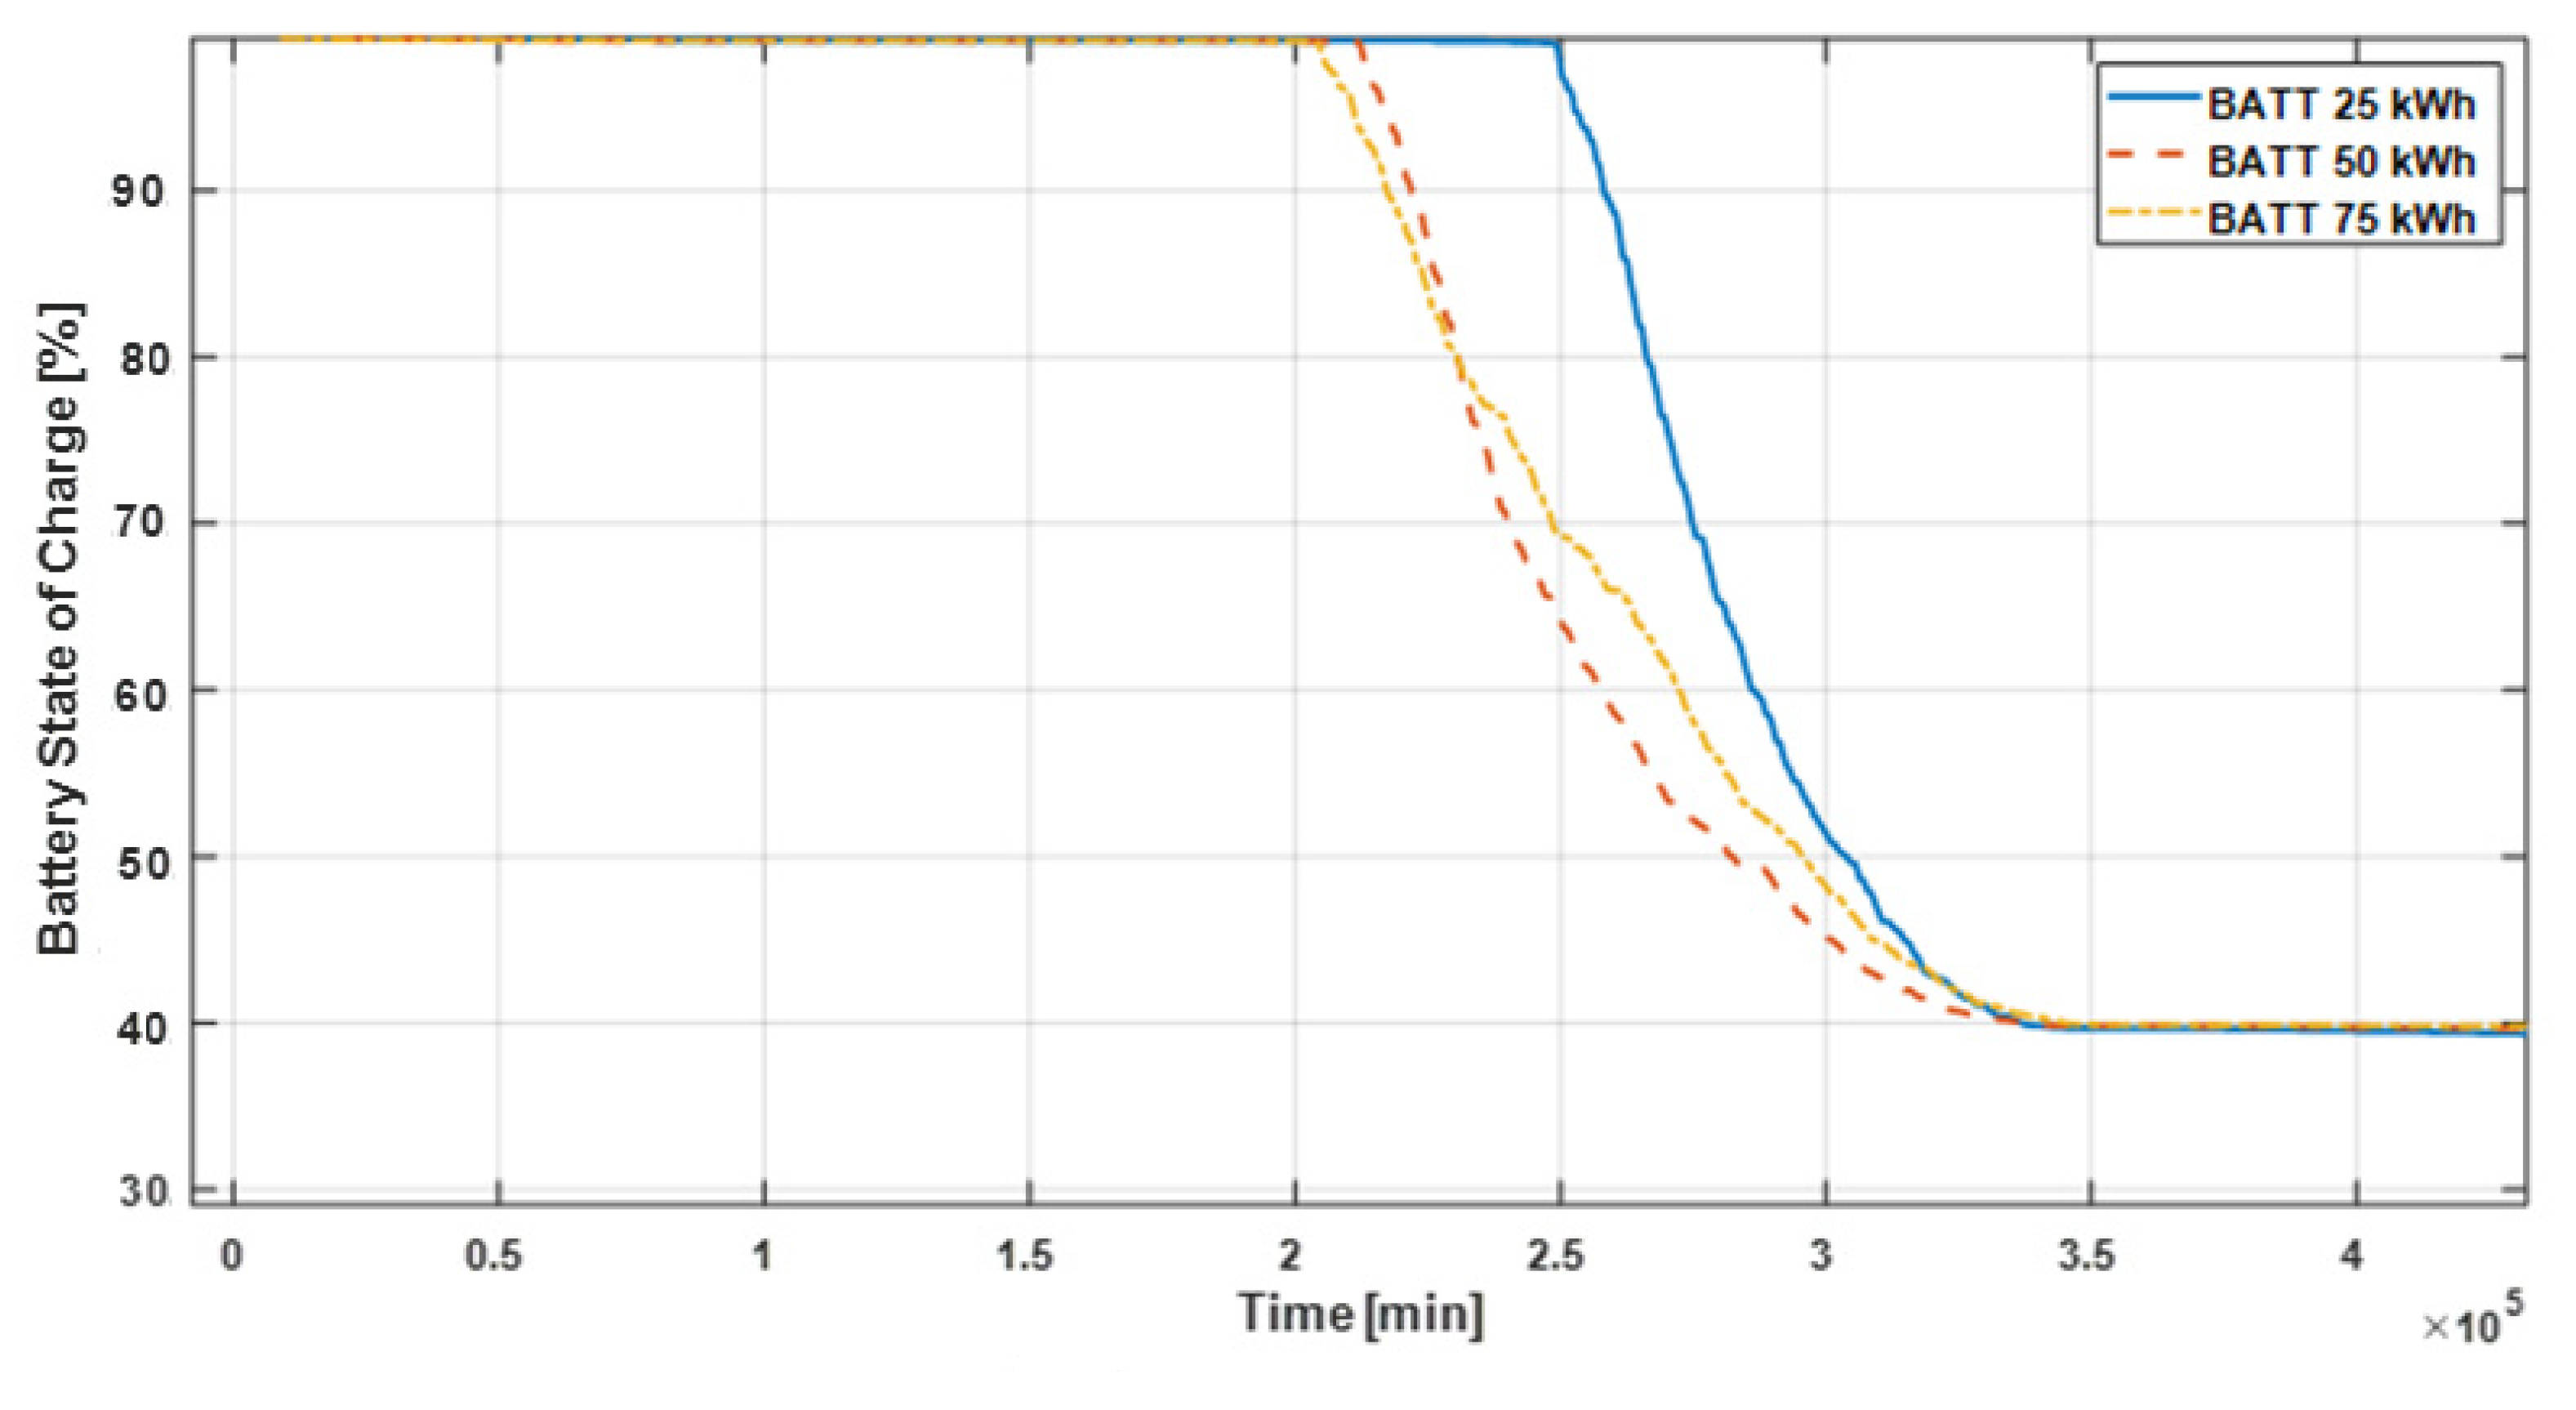
Figure 9 shows the utilization diagram of the battery for the simulated case with the 55 kW PV panel; this diagram indicates the amount of time for which each state of charge (SOC) value was maintained by the battery. This diagram comes from the sorting, in descending order, of the SOC versus time diagram values; from Figure 8, it is possible to state that, as expected, in the simulation regarding the battery with lower capacity (25 kWh), the SOC remains full for about 2.5 × 10⁵ min, whereas for the cases with higher capacities (respectively, 50 kWh and 75 kWh), the battery is available for a longer time period. From the diagram in Figure 8, it is also possible to state that the curves for the 50 and 75 kWh cases appear rather similar; therefore, from this point of view, it may not be economically convenient to choose the 75 kWh type.
4.2. Comparison between Different Battery–Panel Sizes Combinations
In order to carry out a sizing of the renewable energy-powered pneumatic transport system equipped with electro-chemical storage, a series of eight simulations were carried out with different combinations of batteries and panels. Their details are given as follows:
- 27 kW panel, no battery;
- 27 kW panel, 25 kWh battery;
- 27 kW panel, 50 kWh battery;
- 27 kW panel, 75 kWh battery;
- 55 kW panel, no battery;
- 55 kW panel, 25 kWh battery;
- 55 kW panel, 50 kWh battery;
- 55 kW panel, 75 kWh battery.
The panel power and battery capacity set for the tests were chosen in a way to match the features of the pneumatic plant compressor, which absorbs 55 kW of electric power. The PV panel sizes were chosen in order to have one setting with the same power of the compressor and another one with half the power of the compressor. The battery capacity range was chosen according to the compressor operational cycle: a 50 kWh battery would be able to feed, alone, the compressor for circa 1 h; beyond that, it would be totally charged by the full-power panel in about 1–2 h depending on the PV panel size.
The comparison was made on the basis of the energy values in kWh calculated by the model at the end of the one-year simulation time. In particular, the parameter on which the attention is focused is the energy amount received or provided from or to the electric grid to which the proposed system is connected.
Table 2 presents the energetic results of the simulations. In the case of 27 kW panel, the system is a net consumer since energy enters from the grid. (As previously stated in the sign conventions, positive values are entering from the grid to the system) The simulations made with the 27 kW panel highlight that the system equipped with the battery is not energetically sustainable because the amount of energy absorbed from the grid is higher than or equal to that of the system without the battery. Further considerations could be made with regards to the interferences and disturbances that a battery storage would avoid regarding the grid frequency, above all, in case of large power transportation plants. However, it is interesting to notice that the system equipped with a panel and 75 kWh battery absorbs from the grid an amount of energy circa equal to the system without battery; therefore, it would be interesting to assess the behavior of a system equipped with an even larger battery, e.g., a 100 kWh unit.
In the case of the 55 kW panel, the system is a net producer, as it provides energy to the grid. In particular, it is worth noting that the system equipped with a 25 kWh battery provides to the grid more energy than in the two other cases equipped with larger batteries. In addition, the energy output with the 25 kWh unit overcomes that of the system with no battery. This can be explained remarking that, in the case of no energy coming from the panel, the pneumatic plant compressor is fed by the energy stored in the battery. This situation could not be verified for the system without battery, in which case the energy required for moving the compressor would have to be absorbed from the grid. Additionally, it is worth noting that, when the panel is producing power, and the battery is over range, the panel power is discharged into the grid. The bigger the battery size, the less the over-range situation occurs; this explains why less net energy is provided to the grid with increasing battery size.
This analysis was made with the control logics for the inverter/power split unit indicated in Table 1. It would be interesting to provide, in further works, a comparison between different system control logics to evaluate the possibility of maximizing the system performance. It would also be meaningful to carry out tests with larger-sized batteries.
4.3. Economic Considerations
In addition, the authors considered it interesting to work out a simple economic assessment for the different plant solutions tested. This was carried out in order to determine the economical convenience of the employ of renewable energy with a complex management system in an industrial plant.
The economical assessment was carried out based on data for the investment cost and for the energy cost, assuming that the latter does not change over the years. Since the pneumatic transport plant (including electric motor, compressor, pipelines, and other accessories) is the same for all the examined cases, its initial cost was computed in the calculation. Therefore, the investment cost was determined assuming a PV panel cost of 3200 euro∙kW−1 [34] and a battery cost of 121 euro∙kWh−1 [35]. The cost of the inverter, which is proportional to the electric power elaborated, was set to 258 euro∙kW−1 [36]. The energy cost was set to 0.363 euro∙kWh−1 both for the energy entering the system and for the energy provided from the system to the grid. This value comes from the average electricity selling price in the four hourly bands considered in the Italian market. The analysis was protracted for a number of years in line with the average life of a photovoltaic panel, namely 25 years.
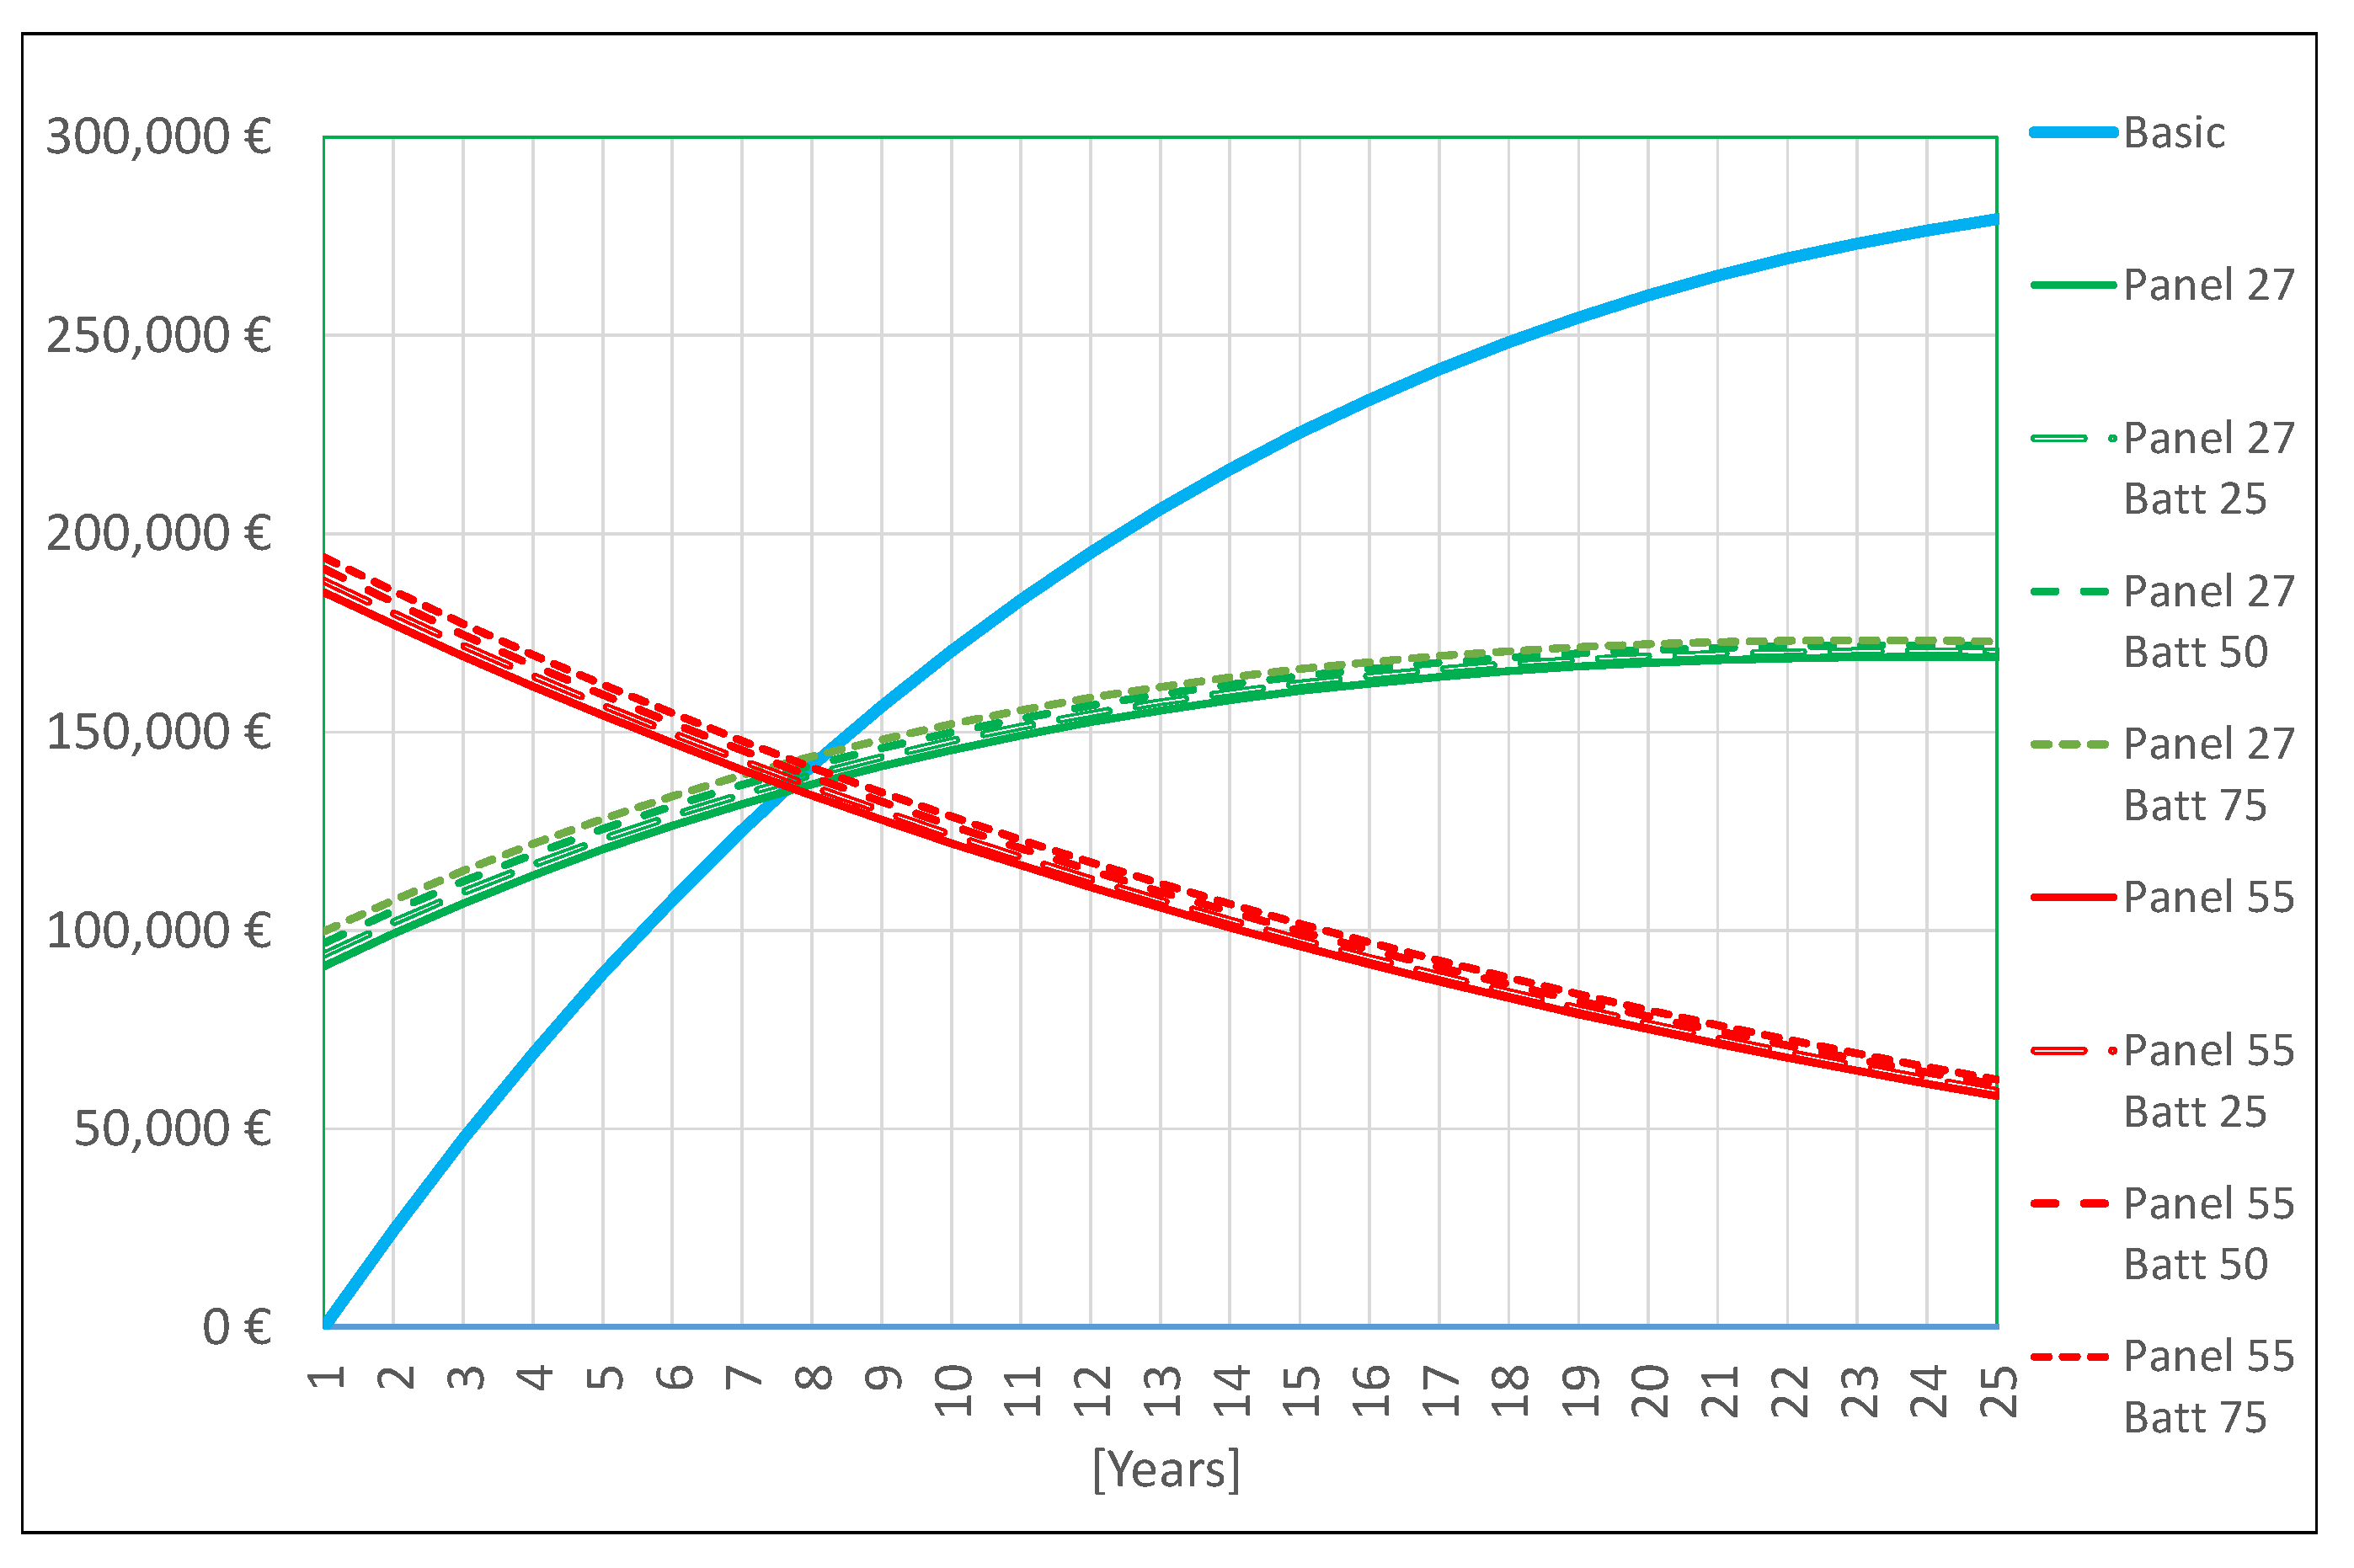
The analysis was set to compare the traditional pneumatic transport plant costs with the eight solutions described in the article’s previous sections. To obtain a sensate comparison, the actualized costs (at a current discount rate of 3.3% per year, according to EURIBOR) as well as the cumulative costs were calculated for the various solutions. The results are presented in two diagrams appearing, respectively, in Figure 10 (actualized costs) and Figure 11 (cumulative costs). In the diagrams, the label “Basic” refers to the traditional pneumatic transport plant fed by electric power coming from the grid.
According to Figure 10, the break-even point between the basic plant and the various innovative solutions occurs between the 7th and the 8th year, indicating that, from this moment on, the plant equipped with the innovative feeding system will provide an economic savings. In particular, the system equipped with the 55 kW panel shows a descending trend of the costs due to the selling of the extra power produced. It is worth noting that, with the present battery technological development and with the system management logics implemented here (see Table 1), the solutions including batteries do not provide a higher saving than the solutions equipped with only panels. Moreover, the impact produced on the results when changing the battery capacity is limited, whereas the panel power’s impact on the results appears much higher. This may be explicable by looking at Figure 9, which shows the utilization diagrams of the batteries, where it is possible to see that, even for the larger capacities (50 kWh and 75 kWh), the storage is full (thus unavailable) for about 50% of simulation time. This means that the energy flow in this component is small with respect to the energy flows of panel, grid, and compressor. This might be the reason that the economic impact of the different batteries on the system is not so important as expected, at least with the battery size range considered in this study. To research a condition in which the solution with batteries becomes economically convenient, other simulations should be carried out by changing the battery size range and setting the management logics of the system with an optimization purpose turned to maximum money saving.
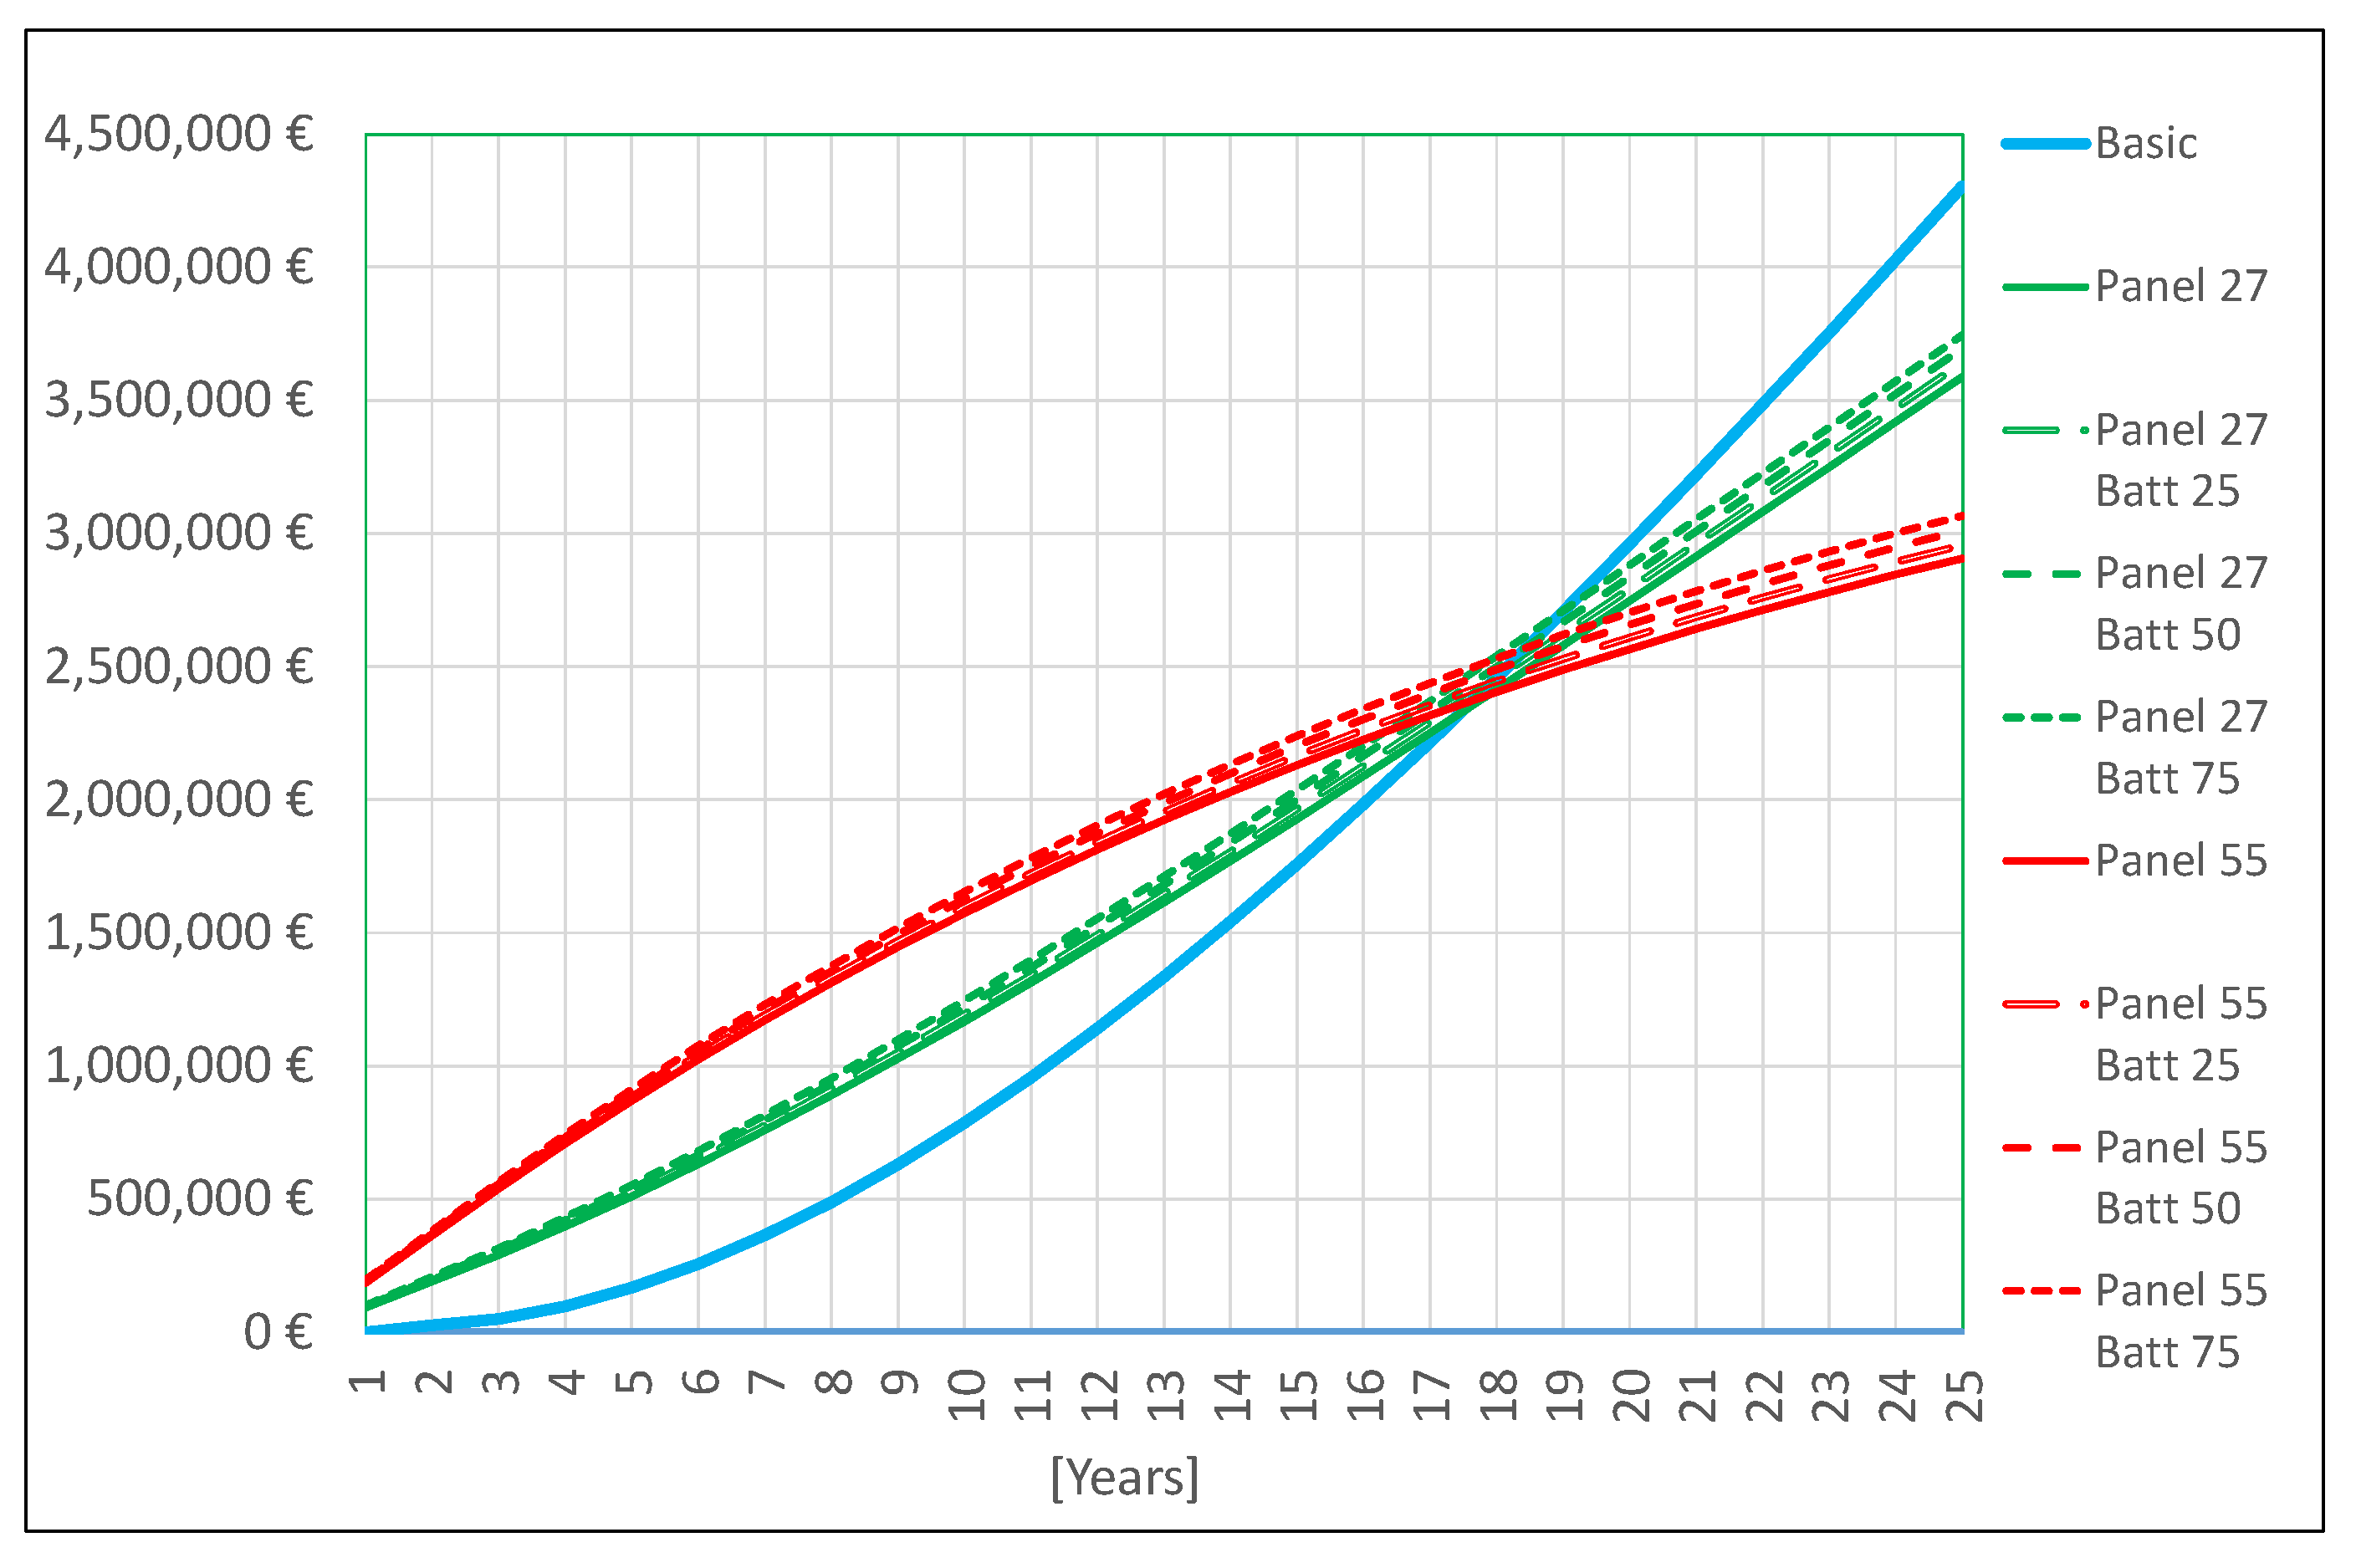
To investigate the effective convenience of the solutions, it is necessary to consider the cumulative costs diagram presented in Figure 11. According to the latter, it is possible to observe that the innovative solutions become more convenient than the traditional (basic) plant around the 18th year of operation.
An interesting evaluation of the investment should take into consideration the net saving (NS) of the plant’s useful life, which calculates the difference between the cumulative costs for the traditional plant and those for the most economical solution of the innovative plant at the 25th year of production. The NS value corresponds to EUR 1,619,147, considering as costs for the most economical solution those of the plant with 55 kW panel and no battery. Another meaningful parameter is the saving to investment ratio (SIR), which is the ratio between the previously calculated NS and the investment cost for the 55 kW panel plant solution. Considering an investment cost of EUR 185,286 for said plant, the SIR parameter assumes the value of 8.74. Moreover, it would be interesting to calculate the adjusted internal rate of return (AIRR), which accounts for a possible investment of the saved money in other profitable business. The AIRR can be calculated through the formula AIRR = (1 + r)∙SIR1/N − 1, where r is the re-investment rate (i.e., the percentage of the saved money that is re-invested in other relevant profitable activities, prudentially assumed in this case as 5.75%), and N is the number of years (25). Based on the afore-presented data, the AIRR assumes a value of 15.3%.
From the calculations presented, it is possible to judge the analyzed investment as profitable unless the photovoltaic panel should go out of order before 18 years of life.
5. Conclusions
This paper presents a proposal for a system combining a photovoltaic panel and a pneumatic plant to exploit sun power for material transport purpose. The system can be equipped with an electrochemical energy storage (battery), which is thought to improve, in certain conditions, the energetic performance. In any case, the system is connected to an electric grid with which exchanged electric energy flows.
In order to assess the performance of the system, a simulative approach was selected, and a Matlab Simulink model of the different parts (panel, grid, user, battery, and control algorithms) was implemented. The model is highly flexible, allowing to change the different components of the system and their main parameters as desired. Thus, the simulative approach highlights the advantage of allowing the performance assessment of the system in different configurations and with different sizes of the components.
Regarding the simulations carried out, two PV panel configurations (27 kW and 55 kW of electric peak power) and three battery configurations (25, 50, and 75 kWh of capacity) were tested in different combinations, taking as the basic case for comparison the system with no battery installed. The simulations, which were protracted for one year of functioning, highlight that the system with the 27 kW panel is a net energy absorber, while the system with the 55 kW panel is a net energy producer and provides energy to the grid. Simulations with varying battery size show that with the smaller panel, battery is not sustainable, as it requires more energy income than the system without battery, at least for the three capacity values tested; with the larger panel, instead, battery presence seems to have a beneficial influence in the 25 kWh capacity configuration since in this case, it provides to the grid more energy than in the case without a battery. In general, it can be observed that when the PV panel power is set to a similar value as the load power, the system becomes a producer, thus providing electric power towards the grid. Regarding the battery size, it is probable that the capacity values chosen for the research and the control logics implemented are not the most suitable to draw determinant conclusions about the battery’s role in the system.
Regarding the economic evaluation, the discussion is presented in Section 4.3. The assessment of the actualized costs for the different plant solutions (presented in Figure 10) shows that the proposed innovative solutions provide an economic saving from the 7th–8th year of operation on. In particular, the plant equipped with the larger PV panel (55 kW) provides a power surplus that can be sold in the market, and thus, its curves for the actualized costs show a descending trend. In this analysis, the battery size impact on the economic results is significantly less remarkable than the impact made by the panel size. This can be explained by the observation that the energy flowing in the battery is small with respect to the energies flowing in the other plant components, as the battery results as fully charged for about 50% of the simulation time (see Figure 9). Such observation suggests that future studies should consider a different choice of battery size range and a more careful assessment of the system control logics for managing the energy flows. The assessment of the cumulative costs for the different plant solutions (presented in Figure 11) points out that the solution of equipping the traditional pneumatic plant with a renewable power-feeding system interacting with the electric grid becomes more convenient than the basic grid-powered solution from the 18th year of plant operation on within a time frame in line with the average photovoltaic panel life, which normally is 25 years.
Author Contributions
Conceptualization, L.D. and R.R.; methodology, L.D.; software, L.D. and R.R.; validation, L.D. and R.R.; formal analysis, L.D.; investigation, L.D.; resources, R.R.; data curation, R.R.; writing—original draft preparation, L.D.; writing—review and editing, L.D.; visualization, L.D.; supervision, P.G.; project administration, P.G.; funding acquisition, P.G. All authors have read and agreed to the published version of the manuscript.
Funding
This research received no external funding.
Institutional Review Board Statement
Not applicable.
Informed Consent Statement
Not applicable.
Data Availability Statement
Not applicable.
Conflicts of Interest
The authors declare no conflict of interest.
References
- Wan, C.; Zhao, J.; Song, Y.; Xu, Z.; Lin, J.; Hu, Z. Photovoltaic and Solar Power Forecasting for Smart Grid Energy Management. CSEE J. Power Energy Syst. 2015, 1, 38–46. [Google Scholar] [CrossRef]
- Makdisie, C.; Haidar, B.; Haes Alhelou, H. An Optimal Photovoltaic Conversion System for Future Smart Grids. In Handbook of Research on Power and Energy System Optimization; IGI Global: Hershey, PA, USA, 2018; pp. 601–657. [Google Scholar] [CrossRef]
- Aktasa, A.; Erhan, K.; Özdemir, S.; Özdemir, E. Dynamic energy management for photovoltaic power system including hybrid energy storage in smart grid applications. Energy 2018, 162, 72–82. [Google Scholar] [CrossRef]
- Bracale, A.; Caramia, P.; Carpinelli, G.; Di Fazio, A.R.; Ferruzzi, G. A Bayesian Method for Short-Term Probabilistic Forecasting of Photovoltaic Generation in Smart Grid Operation and Control. Energies 2013, 6, 733–747. [Google Scholar] [CrossRef]
- Chin, C.S.; Gao, Z.; Han, M.; Zhang, C. Enhancing Performance of Photovoltaic Panel by Cold Plate Design with Guided Channels. IET Renew. Power Gener. 2020, 14, 1606–1617. [Google Scholar] [CrossRef]
- Morleus, O. Overview: Pneumatic Transport of Solids. Powder Technol. 1996, 88, 309–321. [Google Scholar] [CrossRef]
- Markauskas, D.; Platzk, S.; Kruggel-Emden, H. Comparative numerical study of pneumatic conveying of flexible elongated particles through a pipe bend by DEM-CFD. Powder Technol. 2022, 399, 117170. [Google Scholar] [CrossRef]
- Peng, B.Z.; Fang, X.H.; An, H.Q.; Liu, Z.; Li, Y.; Feng, Z.Y. Study on the Stability of High Pressure Pneumatic Transport of the Mixture of Pulverized Coal and Extraction Residue of Direct Coal Liquefaction Residue. In Clean Coal and Sustainable Energy. ISCC 2019. Environmental Science and Engineering; Lyu, J., Li, S., Eds.; Springer: Singapore, 2022. [Google Scholar] [CrossRef]
- Matchanov, R.; Rizaev, A.; Yuldashev, A.; Kuldoshev, D.; Mirzaeva, M. Methods for calculating the pressure loss of the air flow and energy consumed by the fan of the cotton harvester. In Proceedings of the E3S Web of Conferences, 264, International Scientific Conference on Construction Mechanics, Hydraulics and Water Resources Engineering, CONMECHYDRO 2021, Tashkent, Uzbekistan, 1–3 April 2021. [Google Scholar]
- Davydov, S.Y.; Apakashev, R.A.; Valiev, N.G.; Kostyuk, P.A. New Developments in Pneumatic Delivery of Building Material Binders and Inert Additives. Refract. Ind. Ceram. 2021, 61, 626–630. [Google Scholar] [CrossRef]
- Dikty, M.; Rieck, T. Operating experience with over 100 ceramic rotary valves for pneumatic transport. Cem. Int. 2021, 19, 34–39. [Google Scholar]
- Abdulmumini, M.M.; Zigan, S.; Bradley, M.S.A.; Lestander, T.A. Fuel pellet breakage in pneumatic transport and durability tests. Renew. Energy 2020, 157, 911–919. [Google Scholar] [CrossRef]
- Hossaina, M.S.; Madlool, N.A.; Rahima, N.A.; Selvaraj, J.; Pandey, A.K.; Khan, A.F. Role of smart grid in renewable energy: An overview. Renew. Sustain. Energy Rev. 2016, 60, 1168–1184. [Google Scholar] [CrossRef]
- Dhundhara, S.; Pal Verma, Y. Energy Storage for Modern Power System Operations; John and Wiley and Sons: Hoboken, NJ, USA, 2021. [Google Scholar] [CrossRef]
- Sechilariu, M.; Wang, B.; Locment, F. Building Integrated Photovoltaic System with Energy Storage and Smart Grid Communication. IEEE Trans. Ind. Electron. 2013, 60, 1607–1618. [Google Scholar] [CrossRef]
- Lim Nge, C.; Ranaweera, I.U.; Midtgård, O.M.; Norum, L. A real-time energy management system for smart grid integrated photovoltaic generation with battery storage. Renew. Energy 2019, 130, 774–785. [Google Scholar] [CrossRef]
- Chin, C.S.; Gao, Z.; Zhang, C.Z. Comprehensive electro-thermal model of 26650 lithium battery for discharge cycle under parametric and temperature variations. J. Energy Storage 2020, 28, 101222. [Google Scholar] [CrossRef]
- Chin, C.S.; Jin, J.; Chiew, J.H.C.; Toh, W.D.; Gao, Z.; Zhang, C.; McCan, J. System Design of Underwater Battery Power System for Marine and Offshore Industry. J. Energy Storage 2019, 21, 724–740. [Google Scholar] [CrossRef]
- Sahin, M.E.; Blaabjerg, F. A Hybrid PV-Battery/Supercapacitor System and a Basic Active Power Control Proposal in MATLAB/Simulink. Electronics 2020, 9, 129. [Google Scholar] [CrossRef]
- Mirzapour, F.; Lakzaei, M.; Varamini, G.; Teimourian, M.; Ghadimi, N. A new prediction model of battery and wind-solar output in hybrid power system. J. Ambient. Intell. Humaniz. Comput. 2019, 10, 77–87. [Google Scholar] [CrossRef]
- Olaszi, B.D.; Ladanyi, J. Comparison of different discharge strategies of grid-connected residential PV systems with energy storage in perspective of optimal battery energy storage system sizing. Renew. Sustain. Energy Rev. 2017, 75, 710–718. [Google Scholar] [CrossRef]
- Ding, F.; Li, P.; Huang, B.; Gao, F.; Ding, C.; Wang, C. Modeling and Simulation of Grid-connected Hybrid Photovoltaic/Battery Distributed Generation System. In Proceedings of the 2010 China International Conference on Electricity Distribution, Nanjing, China, 13–16 September 2010. [Google Scholar]
- Damiani, L.; Dellachà, J.; Pini Prato, A.; Revetria, R. Simulation Model of a Node for Smart Grid Applications, Equipped with Photovoltaic Panel, Energy Storage and Electric Vehicle. J. Technol. Innov. Renew. Energy 2014, 3, 199–213. [Google Scholar] [CrossRef]
- Cao, S.; Siren, K. Impact of simulation time-resolution on the matching of PV production and household electric demand. Appl. Energy 2014, 128, 192–208. [Google Scholar] [CrossRef]
- Crosa, G.; Lubiano, M.; Trucco, A. Modeling of PV-powered water electrolyzers. In Proceedings of the Turbo Expo: Power for Land, Sea, and Air, Barcelona, Spain, 8–11 May 2006; Volume 2. [Google Scholar]
- Hofierka, J.; Suri, M. The solar radiation model for open source GIS: Implementation and applications. In Proceedings of the Open Source GIS Grass Users Conference, Trento, NJ, USA, 11–13 September 2002. [Google Scholar]
- Tremblay, O.; Dessaint, L.A. Experimental validation of a battery dynamic model for EV applications. World Electr. Veh. J. 2009, 3, 289–298. [Google Scholar] [CrossRef]
- Tremblay, O.; Dessaint, L.A.; Dekkiche, A.I. A generic battery model for the dynamic simulation of hybrid electric vehicles. In Proceedings of the IEEE Vehicle Power and Propulsion Conference, Arlington, TX, USA, 9–12 September 2007. [Google Scholar]
- Shepherd, C.M. Design of primary and secondary cells—Part 2: An equation describing battery discharge. J. Electrochem. Soc. 1965, 112, 657. [Google Scholar] [CrossRef]
- Capasso, C.; Veneri, O. Experimental analysis on the performance of lithium based batteries for road full electric and hybrid vehicles. Appl. Energy 2014, 136, 921–930. [Google Scholar] [CrossRef]
- Scrosati, B.; Garche, J. Lithium batteries: Status, prospects and future. J. Power Source 2010, 195, 2419–2430. [Google Scholar] [CrossRef]
- Kroposki, B.; Johnson, B.; Zhang, Y.; Gevorgian, V.; Denholm, P.; Hodge, B.M.; Hannegan, B. Achieving a 100% renewable grid: Operating electric power systems with extremely high levels of variable renewable energy. IEEE Power Energy Mag. 2017, 15, 61–73. [Google Scholar] [CrossRef]
- Chawda, G.S.; Shaik, A.G.; Shaik, M.; Padmanaban, S.; Holm-Nielsen, J.B.; Mahela, O.P.; Kaliannan, P. Classificatio of Power Quality Disturbances in Utility Grid with Renewable Energy Penetration. IEEE Access 2020, 8, 146807–146830. [Google Scholar] [CrossRef]
- Solar.comTM Home Page. Available online: http://www.solar.com (accessed on 1 February 2023).
- pV Europe–Solar Technologies and Applications Home Page. Available online: https://www.pveurope.eu/solar-storage (accessed on 1 February 2023).
- Luxpower Tek Home Page. Available online: https://luxpowertek.com (accessed on 1 February 2023).
Figure 1.
Plant schematic configuration.

Figure 2.
Simulink scheme for air flow rate calculation in function of material arrivals.

Figure 3.
Air mass flow rate for each material income, in function of time. Operational cycles are represented for two 8 h shifts.
Figure 3.
Air mass flow rate for each material income, in function of time. Operational cycles are represented for two 8 h shifts.

Figure 4.
Simulink scheme for the random clouds generator.

Figure 5.
PV panel output power in function of time, shown for 9 winter days.

Figure 6.
Simulink block scheme for the electro-chemical storage.

Figure 7.
Power variation with time for electric grid, PV panel, battery, and compressor.

Figure 8.
Time variation of the battery state of charge for a three-day period in winter.

Figure 9.
Utilization diagram of the battery state of charge for three batteries with different capacities, and PV panel having 55 kW power.
Figure 9.
Utilization diagram of the battery state of charge for three batteries with different capacities, and PV panel having 55 kW power.

Figure 10.
Actualized costs for the simulated plant solutions compared to the basic plant fed by electric power from the grid.
Figure 10.
Actualized costs for the simulated plant solutions compared to the basic plant fed by electric power from the grid.

Figure 11.
Cumulative costs for the simulated plant solutions compared to the basic plant fed by electric power from the grid.
Figure 11.
Cumulative costs for the simulated plant solutions compared to the basic plant fed by electric power from the grid.


Table 1.
Synoptic table of the system control logics implemented.
| Controlling | Controlled | |||||
|---|---|---|---|---|---|---|
| Battery State of Charge | PV Panel | Compressor | Grid Power | Battery Power | ||
| Over Range | In Range | Under Range | ||||
| 1 | 0 | 0 | 0 | 0 | 0 | 0 |
| 1 | 0 | 0 | 1 | 0 | - P Panel | 0 |
| 1 | 0 | 0 | 0 | 1 | 0 | - P Compr |
| 1 | 0 | 0 | 1 | 1 | - (P Panel - P Compr) | 0 |
| 0 | 1 | 0 | 0 | 0 | 0 | 0 |
| 0 | 1 | 0 | 1 | 0 | 0 | P Panel |
| 0 | 1 | 0 | 0 | 1 | 0 | - P Compr |
| 0 | 1 | 0 | 1 | 1 | 0 | P Panel - P Compr |
| 0 | 0 | 1 | 0 | 0 | 0 | 0 |
| 0 | 0 | 1 | 1 | 0 | 0 | P Panel |
| 0 | 0 | 1 | 0 | 1 | P Compr | 0 |
| 0 | 0 | 1 | 1 | 1 | 0 | P Panel - P Compr |
P Panel = Panel power; P Compr = Compressor power.
Table 2.
Energetic results of the simulations.
| kWh ×104 | Panel 27 kW | Panel 55 kW | ||||||
|---|---|---|---|---|---|---|---|---|
| No Battery | 25 kWh | 50 kWh | 75 kWh | No Battery | 25 kWh | 50 kWh | 75 kWh | |
| Grid energy | 3.285 | 3.287 | 3.287 | 3.285 | −0.691 | −0.695 | −0.688 | −0.687 |
| Panel energy | 3.933 | 7.909 | ||||||
| Compressor energy | −7.218 | |||||||
Disclaimer/Publisher’s Note: The statements, opinions and data contained in all publications are solely those of the individual author(s) and contributor(s) and not of MDPI and/or the editor(s). MDPI and/or the editor(s) disclaim responsibility for any injury to people or property resulting from any ideas, methods, instructions or products referred to in the content. |
© 2023 by the authors. Licensee MDPI, Basel, Switzerland. This article is an open access article distributed under the terms and conditions of the Creative Commons Attribution (CC BY) license (https://creativecommons.org/licenses/by/4.0/).
Share and Cite
MDPI and ACS Style
Damiani, L.; Revetria, R.; Giribone, P. Dynamic Simulation of a Pneumatic Transport Plant Powered by PV Panels and Equipped with Electro-Chemical Storage. Electrochem 2023, 4, 239-254. https://doi.org/10.3390/electrochem4020016
AMA Style
Damiani L, Revetria R, Giribone P. Dynamic Simulation of a Pneumatic Transport Plant Powered by PV Panels and Equipped with Electro-Chemical Storage. Electrochem. 2023; 4(2):239-254. https://doi.org/10.3390/electrochem4020016
Chicago/Turabian StyleDamiani, Lorenzo, Roberto Revetria, and Pietro Giribone. 2023. "Dynamic Simulation of a Pneumatic Transport Plant Powered by PV Panels and Equipped with Electro-Chemical Storage" Electrochem 4, no. 2: 239-254. https://doi.org/10.3390/electrochem4020016