Article

Heterostructure of Metal Oxides Integrated on a GCE for Estimation of H2O2 Capacity in Milk and Fruit Juice Samples

Department of Chemistry, Cape Peninsula University of Technology, Tennant Street, Cape Town P.O. Box 652, South Africa
*
Author to whom correspondence should be addressed.
Electrochem 2023, 4(1), 56-67; https://doi.org/10.3390/electrochem4010006
Submission received: 25 November 2022 / Revised: 19 January 2023 / Accepted: 1 February 2023 / Published: 10 February 2023
(This article belongs to the Special Issue Emerging Trends of Electrochemical Sensors in Food Analysis)

Abstract

:
High levels of H2O2 in food can lead to oxidative stress. Which has been linked to a number of neurological diseases. Hence, its detection in beverages is essential. However, a complicated structure of the reaction medium of H2O2 makes the detection procedure very difficult. For this reason, sensitive strategic methods are required. In this study, quantification of H2O2 in milk and apple juice has been obtained via the electrochemical sensing platform based on GCE/SiO-CeONPs. Scanning Electron Microscopy (SEM), Cyclic voltammetry(CV), and electron impedance spectroscopy(EIS) were employed to characterize the composite. The kinetics investigation of the sensor with H2O2 revealed an a quasi-reversible one -electron adsorption process. Under optimized conditions, the Differential Pulse Voltammetry (DPV) in 0.1 M Phosphate buffer (PB) pH 5.5 of the H2O2 displayed a peak at 0.13 V vs. Ag/AgCl with the detection limits of 0.0004 µM, linearity range of 0.01–0.08 µM. The observed LOD values of this method for real samples were calculated to be 0.006 µM and 0.007 µM with LOQ of 0.02 µM for milk and apple juice, respectively. The recovery of the analyte was from 92 to 99%. Furthermore, due to good selectivity and stability, the benefit of this sensor is its applicability in multiple fields.

1. Introduction

The synthesis of novel functional nanomaterials with electro-catalytic properties for the development of sensors has resulted in an increase in these field of research. This is evident in the improvement of nanoscale materials in the food processing industry, medical, biological systems, paper bleaching process, textiles, disinfecting agents, and environmental protection [1,2,3]. Nowadays, semiconductors are of interest for commercial applications due to the high cost of coinage metals [4]. Metallic, polymeric materials and semiconductors have been reported to construct nonenzymatic hydrogen peroxide sensors. Mixed transition metal oxide nanoparticles results in good properties due to their different shapes, structures, and size [5]. Once the mixed oxide is formed, the acidic sites due to the excess negative or positive charge are displayed as a result of defects in the lattice [5,6]. The most important step in metal oxide synthesis is the metal–oxygen–metal bond creation. The working electrode surface can be modified with metal oxides and their mixtures using methods like physical adsorption, electro-polymerization, covalent bonding, and electrodeposition techniques.
Metal oxide semiconductors have been widely reported as the ideal substrate for significant electrochemical study due to the high degree of ionic bonding and possess anti-fouling properties [7]. Thus, there are very interesting and useful for the detection of the analyte of interest in real samples. The non-toxicity of rare earth cerium oxide makes it a special oxide, placing it among metal oxide semiconductors, it is a size-dependent electrically conductive material and its chemically inert. Cerium Oxide is ambiguous, containing multiple valences of which the most used are Cerium (III) Oxide, Ce2O3 otherwise called a Cerous Oxide and Cerium (IV) Oxide, CeO2, otherwise called Ceric oxide. Pure CeO2 has a fluorite-type structure, with a wide range in many applications in a variety of fields. The phase transition of CeO2-Ce2O3 is linked to the formation and migration of oxygen vacancies under conditions such as pressure and temperatures [8,9], as proposed by Skorodumova et al. (2002) [10]. Due to a high affinity of H2O2 for ceria, CeO2 can also be used as a very efficient electrocatalyst for the electroreduction of hydrogen peroxide in H2O2 sensors [11,12].
Silica also known as silicon dioxide (SiO2), is found in nature as quartz sand, however, amorphous silica which we will be concentrating on is industrially manufactured and the two main forms are fumed and colloidal silica. Colloidal silica particles are made in such a manner that the desired particle size, uniform size distribution, and particle porosity can all be controlled. It consists of nanosized particles dispersed in water, usually stabilized by alkalis or acids. When applied as a binder it makes processing easier, due to the nature of the bond formed [13], colloidal silica compositions are present preventing drying defects, such as cracks [14].
Hydrogen peroxide (H2O2) is the main transmitter of redox signals in biological processes and thus it’s determination is necessary for chemical, clinical, biological, pharmaceutical, environmental, and textiles [15]. In food and beverage industries, the use of H2O2 as a preservative, sterilization, and biocontamination agent represents a danger to human health, as it is linked to a wide range of diseases [16]. Consumption of harmful levels of hydrogen peroxide containing drinks and milk may put consumers’ lives at risk. The risk of H2O2 largely comes from too much oxygen in the blood leading to potential issues like reactive hydroxyl radicals (OH) [17].
According to research, some drinks and milk contain higher levels of hydrogen peroxide than those naturally produced by the human body. Conventional analysis routes have been reported for H2O2 detection, they comprises chromatography, mass spectrometry, atomic absorption/emission/fluorescence spectroscopy, electrochemical methods, and enzyme chemical methods. The simplest method in all the aforementioned is electrochemistry producing rapid and precise data and can be accomplished through analyte oxidation or reduction.
Most work in the literature is based on enzyme-based electrochemical sensors because of their excellent selectivity and high sensitivity. Although the enzyme chemical method is highly sensitive, good selectivity allows low detection limit, but it uses peroxidase whose usage is limited by denaturing owing to a lack of reproducibility, robustness, detection range, and sensitivity [18].
Electrochemical sensors that mimic enzymatic sensors have taken an opportunity for H2O2 detection as they are free from pH influence, have long-term stability fast response time, and are highly sensitive [19,20]. A combination of these sensors with voltammetry offers comparably superior merits over enzyme chemical methods.
Inspired by the advantages of the valuable properties of SiO2 and CeO2 nanoparticles, a simple, low-cost GCE/SiO-CeONPs sensor was synthesized via the chemical solution method and used for the first time for the detection of H2O2 in this study. According to our investigations, no studies have been conducted for H2O2 determination using this kind of sensor. The electroanalytical performance of the GCE/SiO-CeONPs sensor was investigated by Differential Pulse Voltammetry (DPV) mode for the detection of H2O2 in real samples of full cream milk and apple juice with acceptable analytical results. Therefore, this sensor is good for application in H2O2 detection in real samples.

2. Experimental

2.1. Reagents and Apparatus

The materials utilized to complete our experimental work were of analytical grade and used as received without further purification. Tetraethyl orthosilicate (TEOS) 98% as a precursor for SiONPs, Ammonium hydroxide (25%), NaH2PO4, Na2HPO4, ethanol, acetone, Cerium (III) nitrate hexahydrates (99%) as a precursor for CeO2NPs and H2O2 were purchased from Sigma (Cape Town, South Africa). NaH2PO4 and Na2HPO4 were the chemicals used to prepare phosphate-buffered saline (PB solution) at room temperature. A Milli-Q system with a resistivity of 18.2 MΩ cm was used to supply ultra-pure water for the preparation of all solutions. The particle size, morphology, and electron diffractive spectroscopy (EDS) of the samples were obtained by using JEOL 2100F scanning electron microscope (SEM) type field produced by Japan equipment operated at the working voltage of 100 keV. The electrochemical measurements were performed using Metrohm Mstat potentiostat (three-electrode system), and the obtained analytical data were integrated with dropsen software. A Glassy carbon electrode (GCE) was used as the working electrode while Ag/AgCl electrode and platinum wire were used as reference and counter electrode, respectively. A glass cell (20 mL) connected to ultrapure nitrogen gas (99.999%) source for deoxygenation. A Hanna pH meter (Hanna Instruments Brazil, São Paulo, Brazil) with a combined electrode was used to measure the solutions’ pH values. A magnetic stirrer with a stirrer bar was used for mixing of the solution. The ultrasonicate bath used was from Bransonic ultrasonic cleaner, Branson UL Transonics Corporation, Eagle Road, Danbury, CT 06813, USA.

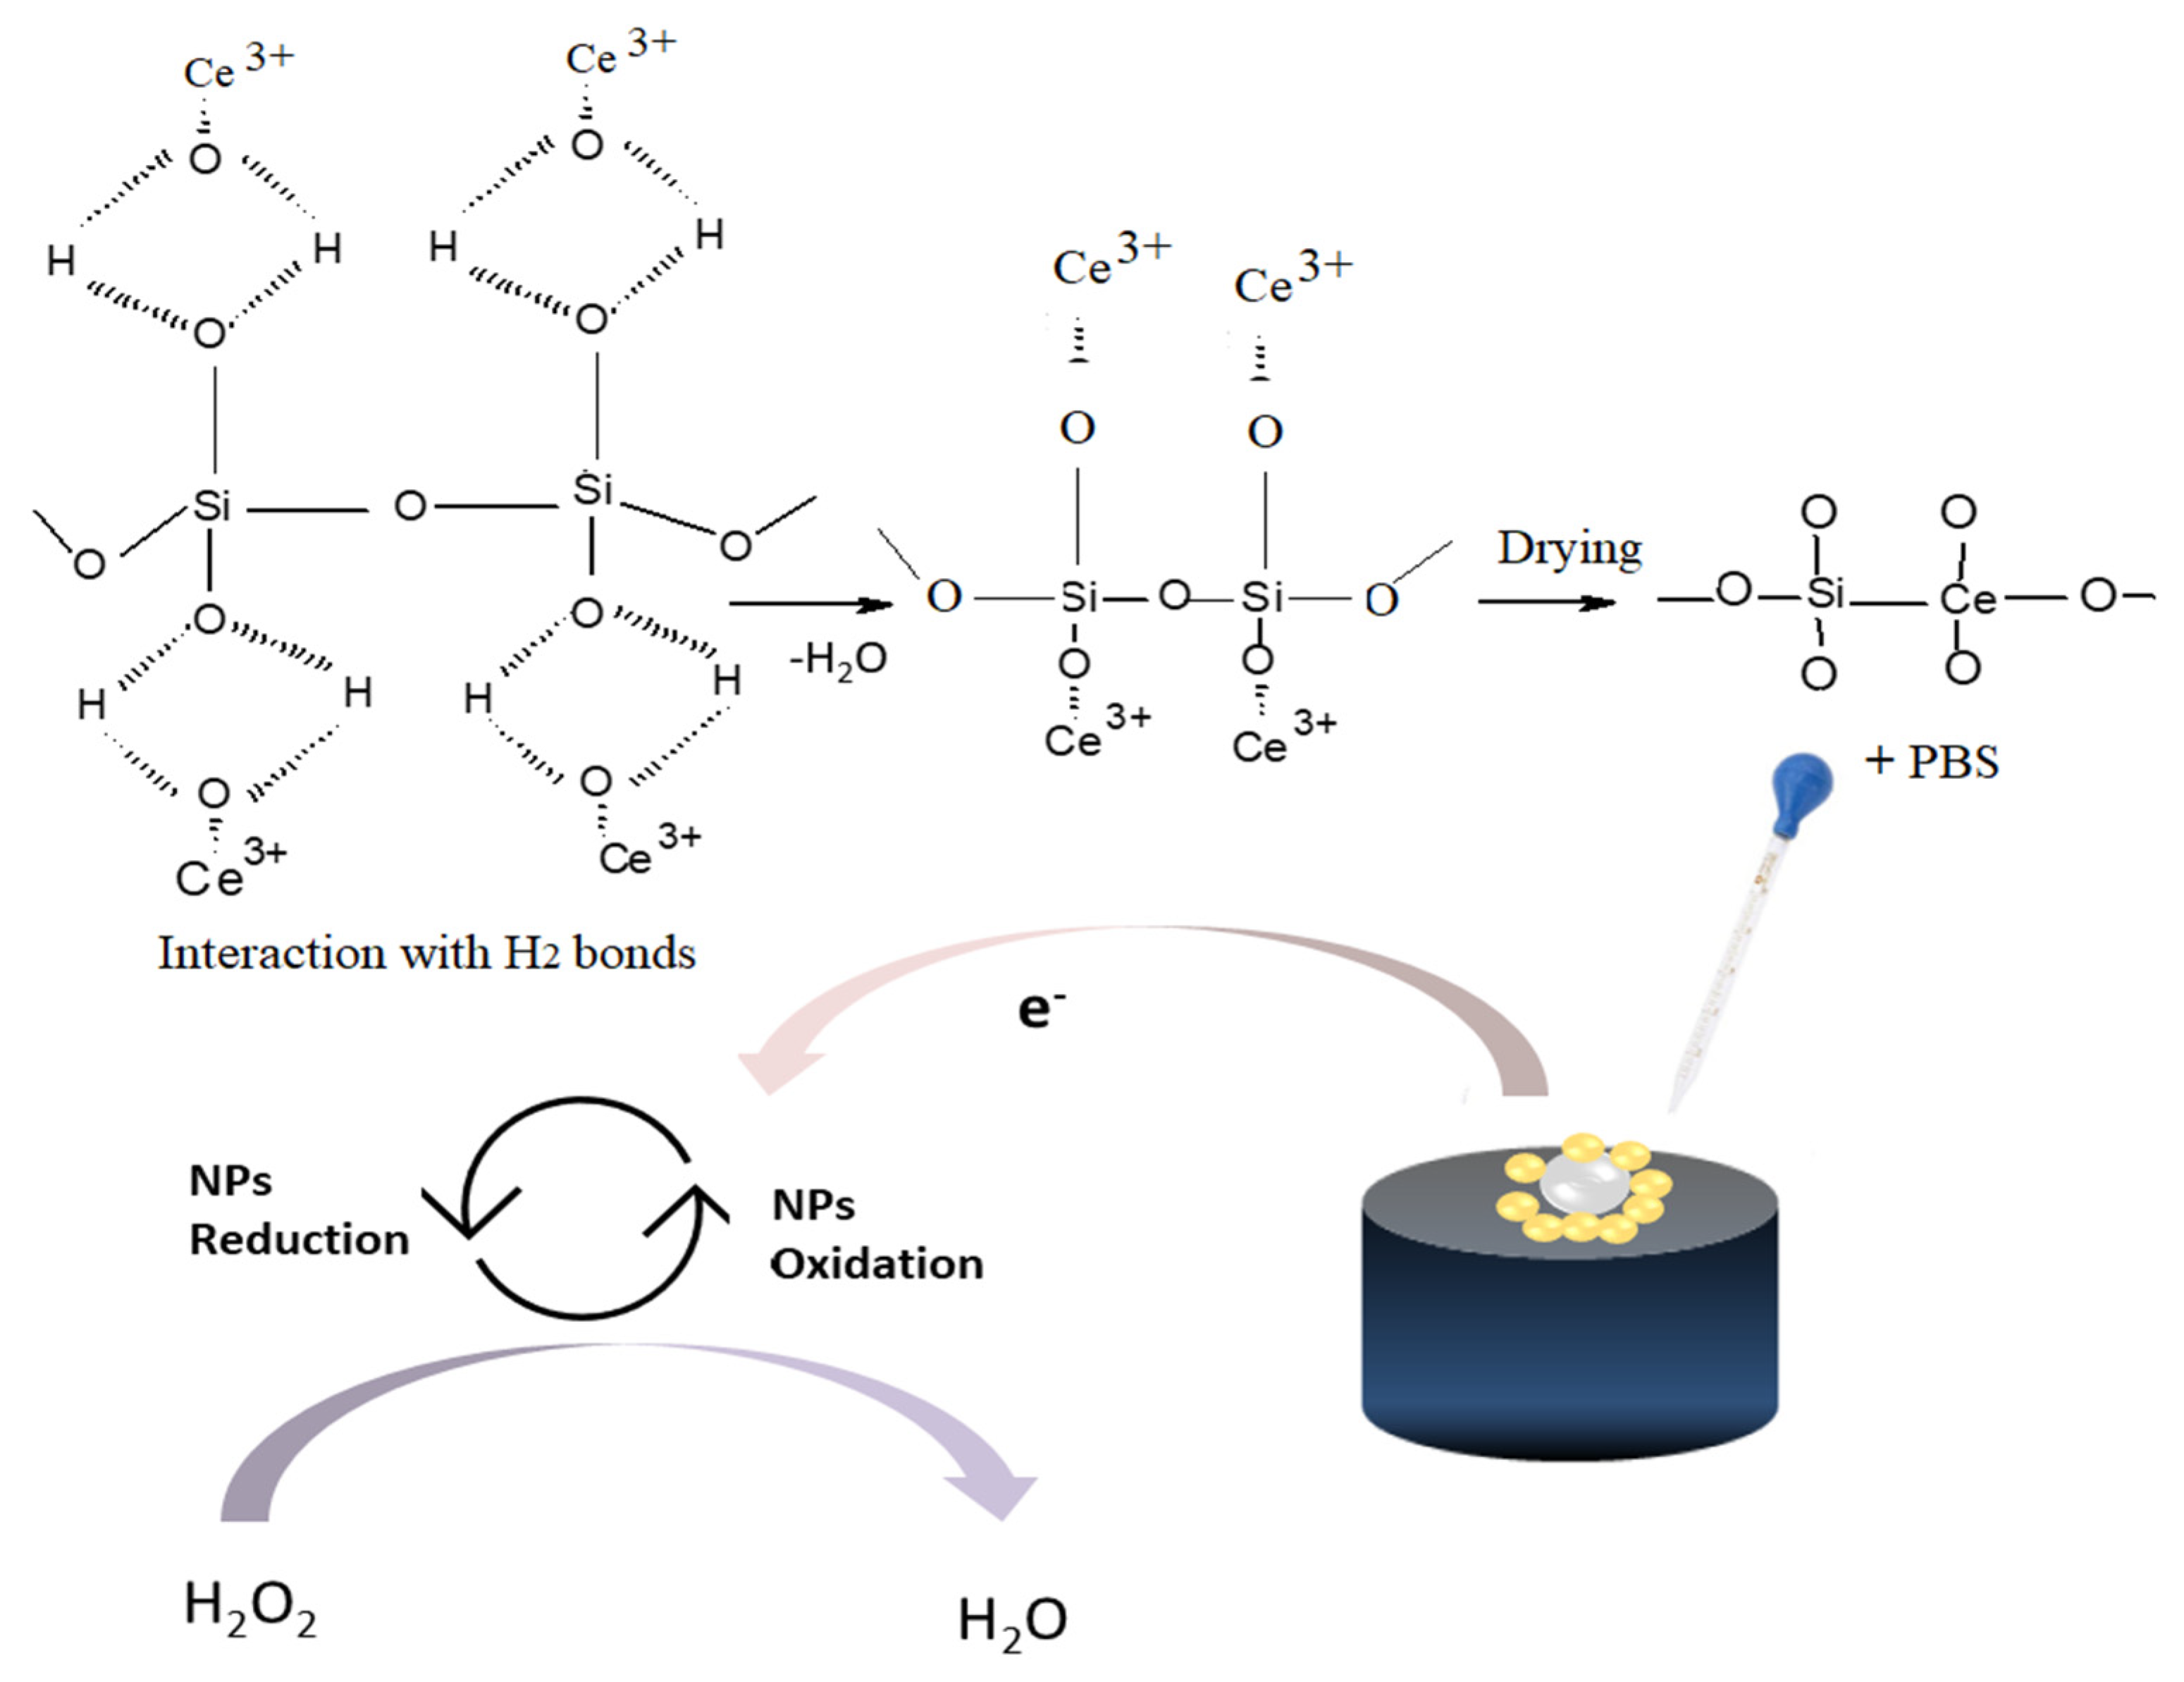
2.2. SiO-CeONPs Synthesis

The SiO-CeONPs were prepared by a solution chemical process adopted by Munusamy et al. (2014) with some slight modifications [21]. Briefly, the SiONPs have dissolved in cerium (III) nitrate suspension. The mixture was heated at 85 °C and stirred at 350 rpm for 3 h. The resultant light yellowish colour solution was centrifuged to isolate the precipitate obtained. The final composite material was collected, washed, and then dried at 60 °C for 5 h. SiO2-CeO2 composite particles were obtained by calcining the precipitates at 500 °C for 3 h.

2.3. Modification of GCE/SiO-CeONCs

Prior to each modification, the polishing of GCE was carried out with three particle sizes of alumni powder (1 µM, 0.3 µM, and 0.05 µM), and rinsed thoroughly with double-distilled water. Then it was ultrasonic washed in water for 5 min and dried under pure nitrogen gas. The next step was dispersing 1.0 mg of SiO-CeONCs composite into 1 mL of water. In the final step, 5 µL of the suspension was, then poured over the surface of freshly polished GCE. The resulting electrode was named GCE/SiO-CeONCs.

2.4. Preparation of Sample for Detection of H2O2 by DPV

The real samples were bought from the local store and adjusted to room temperature. These samples were prepared by dilution of 1ml sample with 0.1 M PB solution 10 times (pH 5.5). The samples were centrifuged and filtered. After that, different concentrations of H2O2 were added to the real samples and DPV measurements were carried out.

2.5. Electrochemical Measurements Procedure

Firstly, the GCE was cleaned and pre-treated in the blank supporting electrolyte without stirring to increase the hydrophilic properties via the introduction of oxygenated functionalities. The electrochemical reaction occurs in 0.1 M PB solution. 3 mL of PB solution was added to the glass cell and the blank solution was measured as well as the appropriate amount of the analyte solution. All the CV scan rates studies were measured between −0.3 and 0.6 V in the range of 15–300 mV s−1. The DPV was subsequently recorded employing the optimized conditions. DPV mode was used to quantify the unknown amount of analyte in the solution, CV, EIS, and SEM were also carried out to characterize the material.

3. Results and Discussion

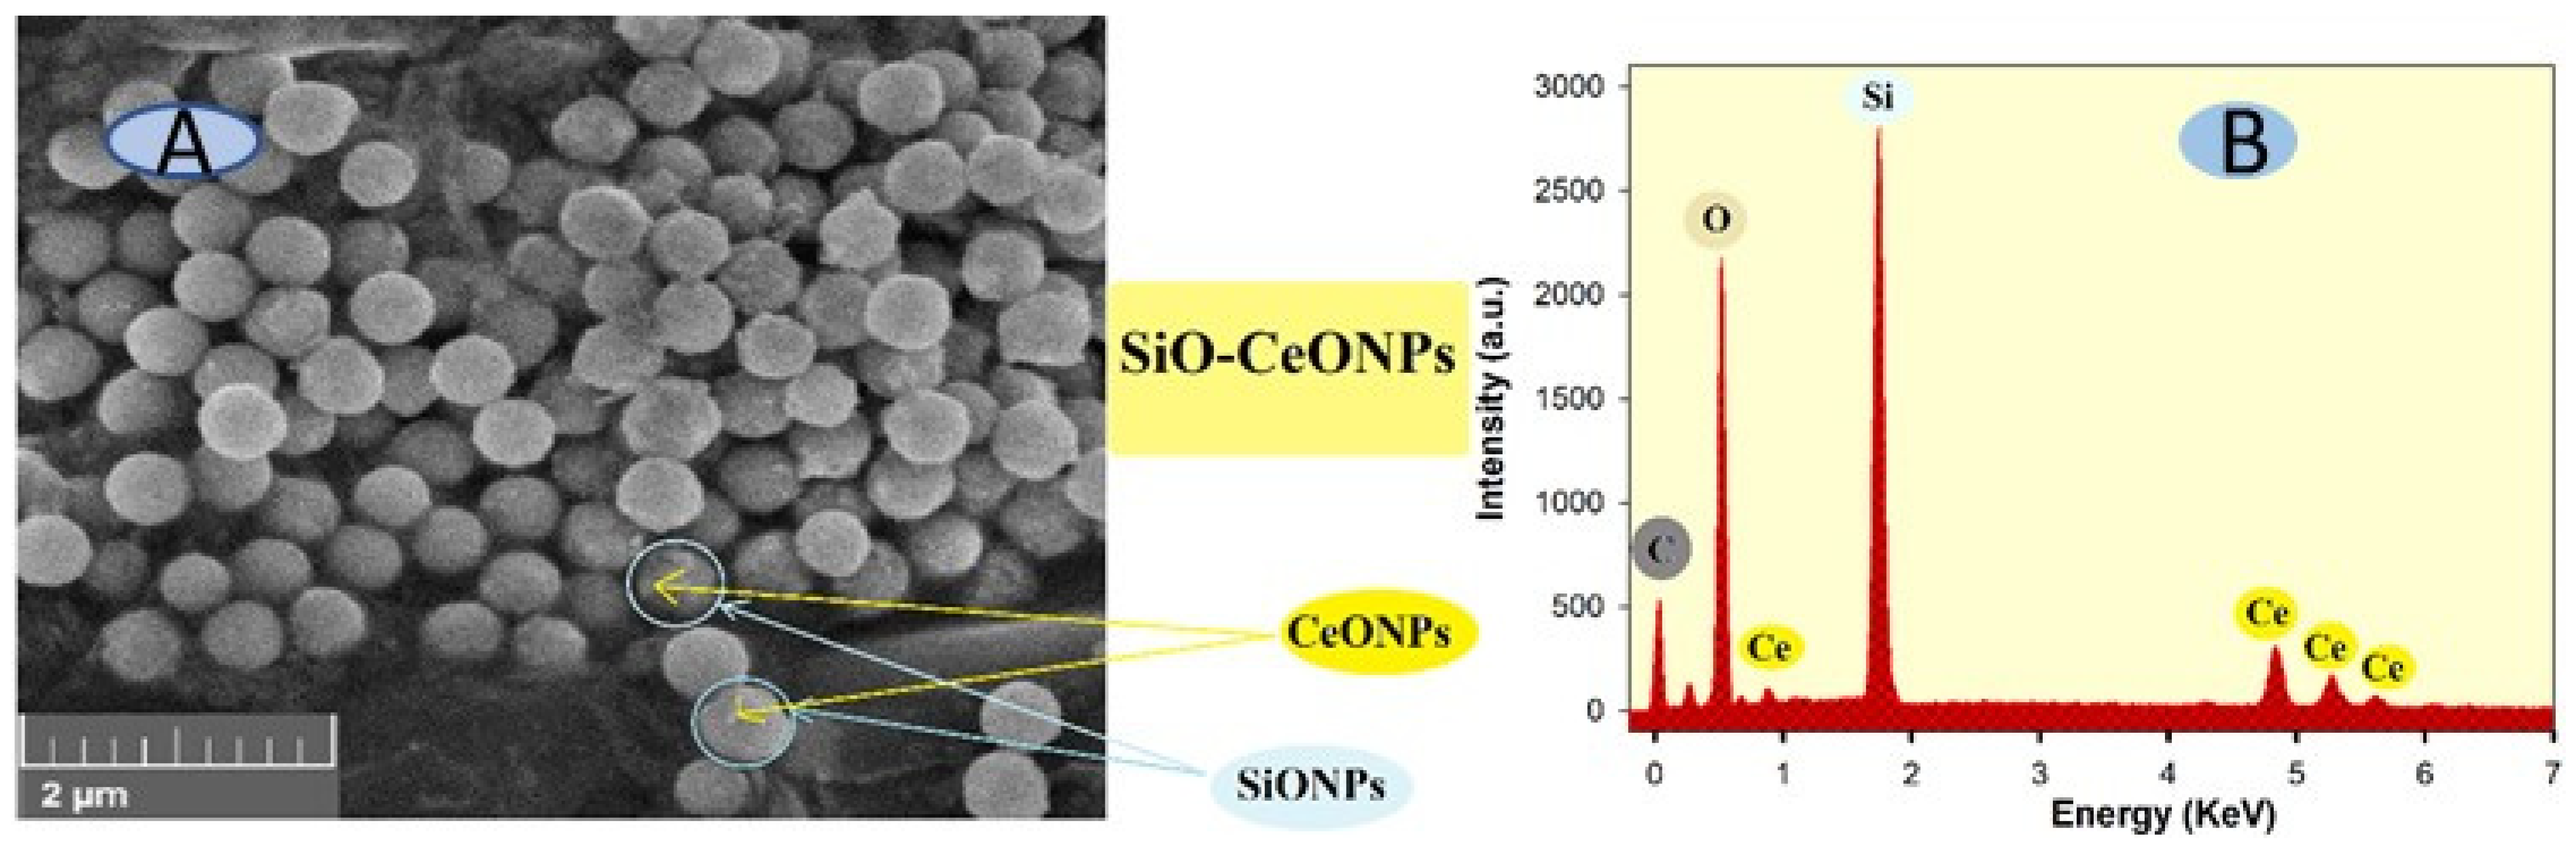
3.1. SEM of SiO-CeONPs

The size of nanoparticles plays a significant part in their properties and application. The morphology of synthesized SiO-CeONPs was observed using SEM with a scale bar of 1 μM. It can be seen in Figure 1A that the SEM image of SiO-CeONPs was relatively homogeneously distributed and spherical in shape. The particle size distribution of the SiO-CeONPs was measured for ∼50 particles (Figure not shown) by using ImageJ software. The particle size was 12 nm ± 5 nm, meaning that the more active sites were acquired with the expected large surface area. Furthermore, the composition of elements was studied by EDS which confirms the successful synthesis of SiO-CeONPs (Figure 1B). Only Ce, Si, O, and C, could be detected, indicating the purity of SiO-CeONPs.

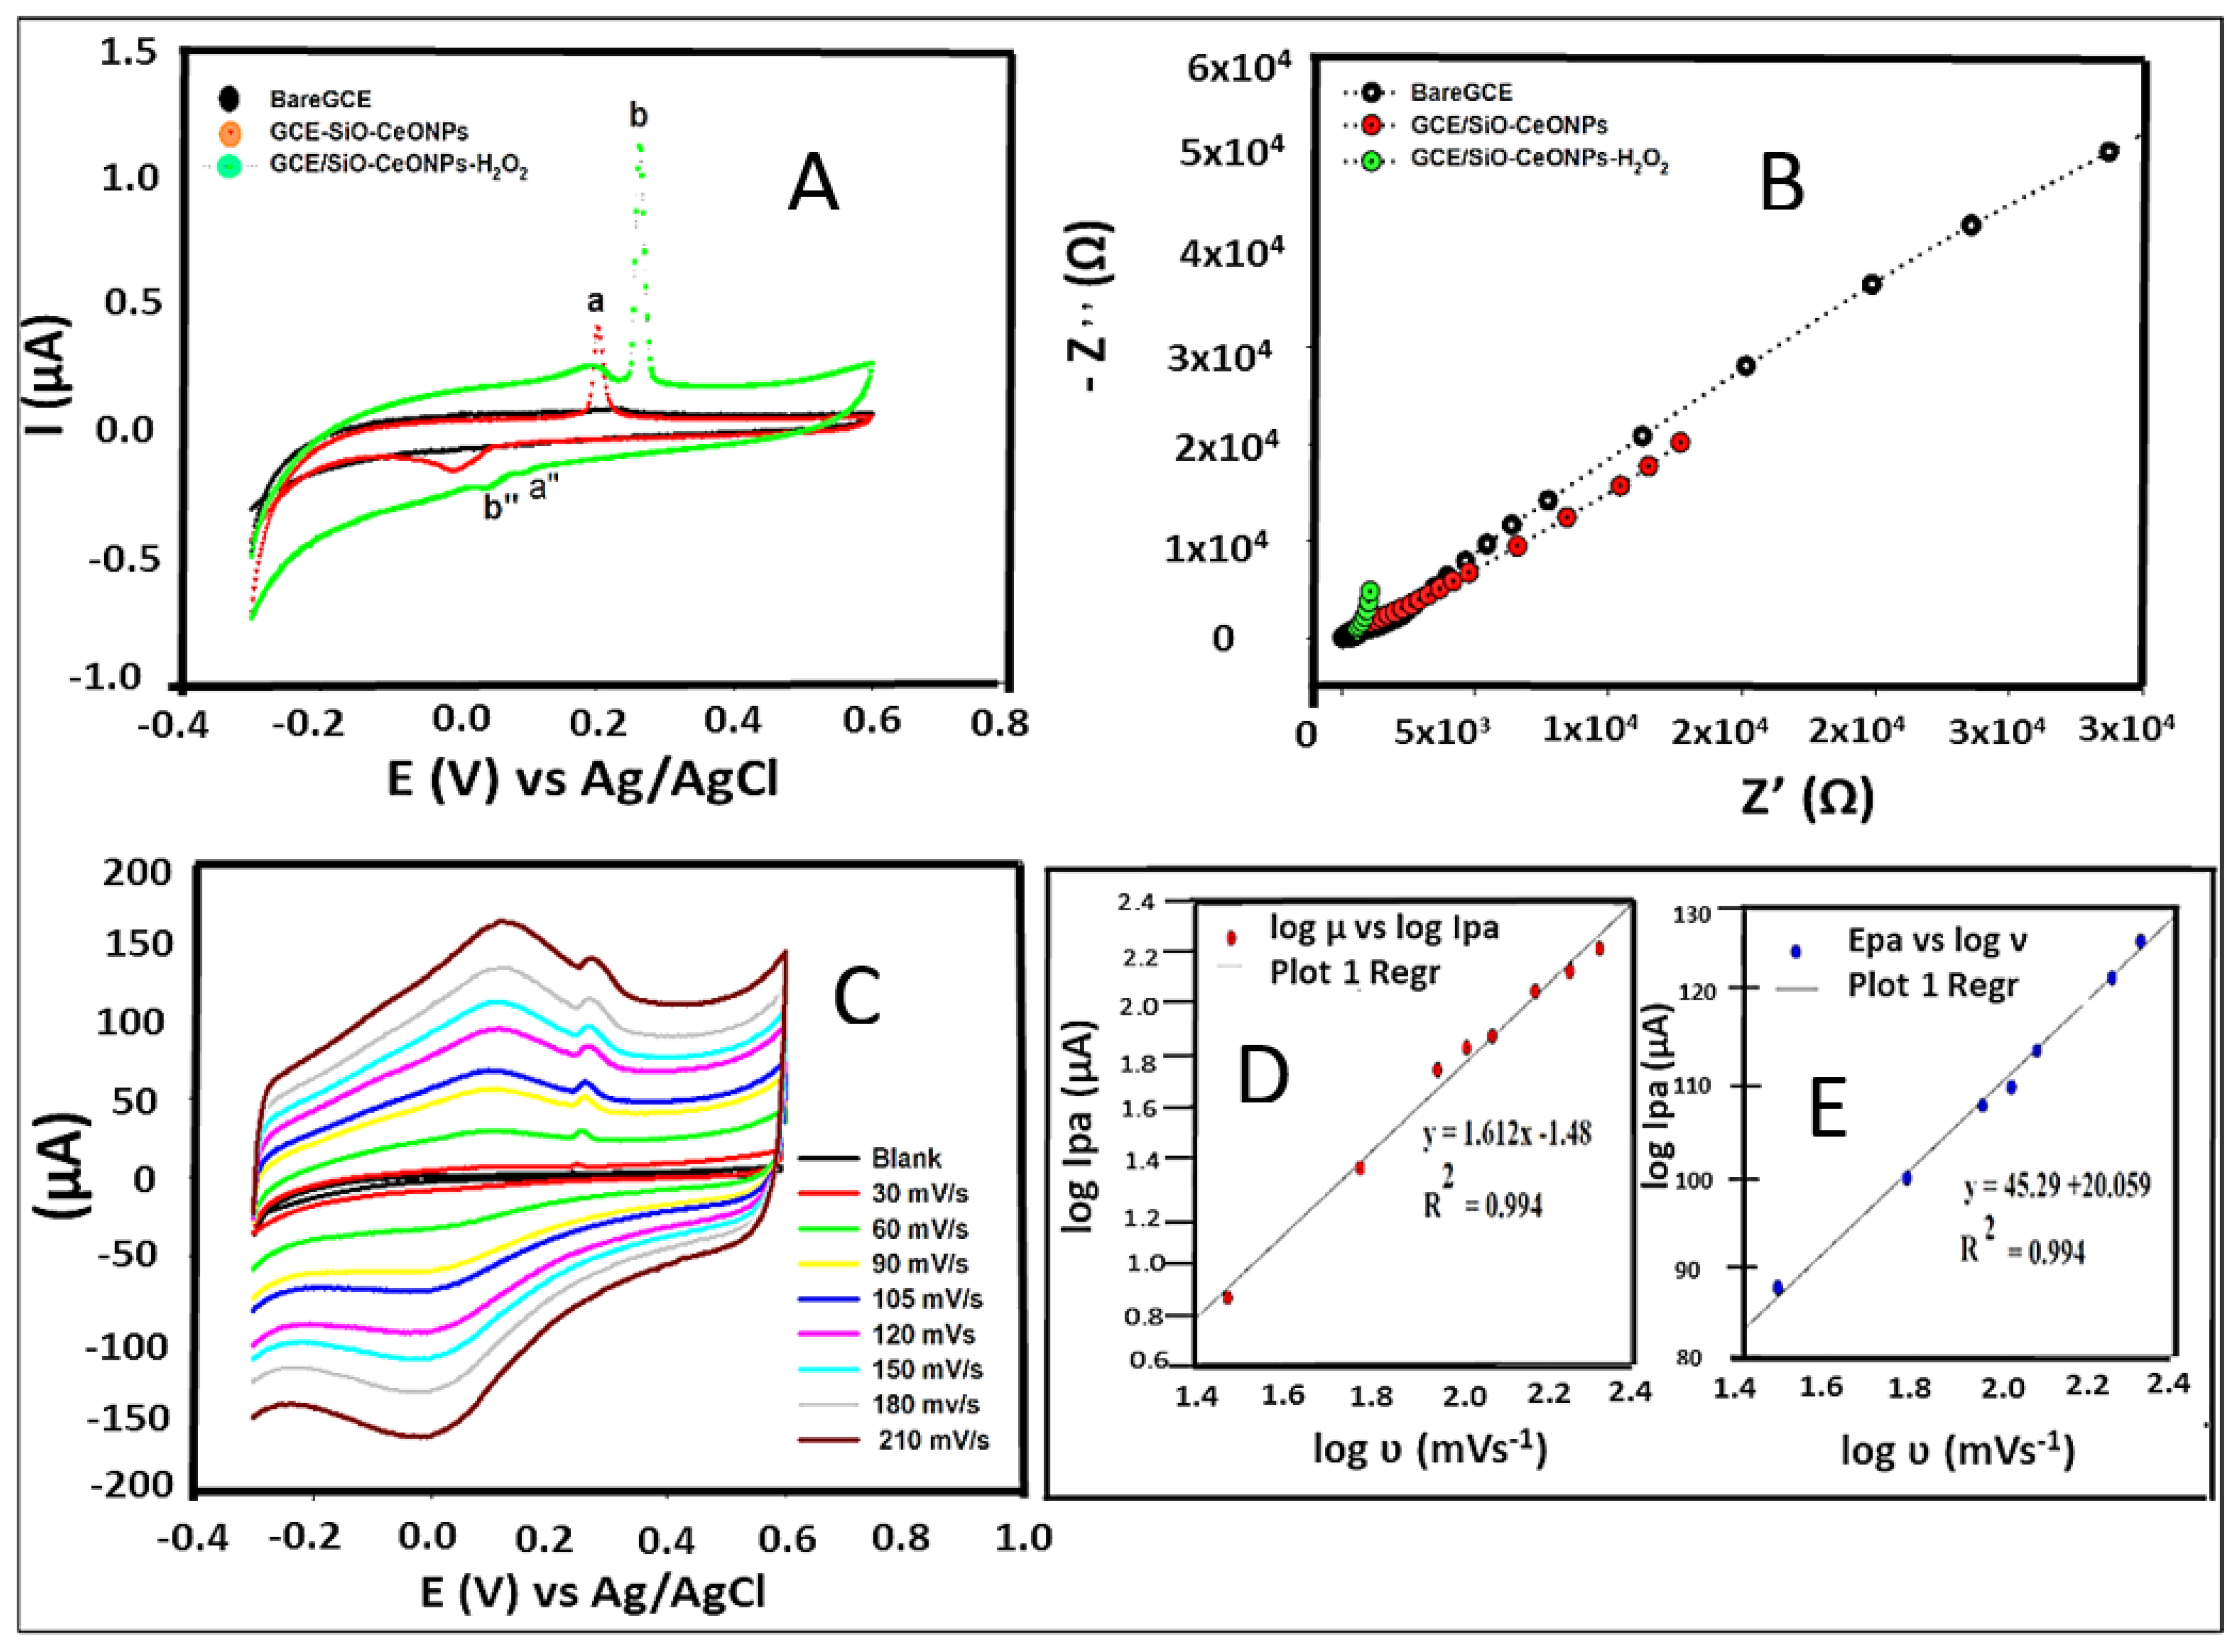
3.2. Electrochemical Characterization and Kinetics Studies

The electrochemical behaviour of 50 µL of 0.01 mM H2O2 in 0.1 M PB solution (pH 5.5) on GCE/SiO-CeONCs was checked via cyclic voltammetry and compared with bare and GCE/SiO-CeONPs as shown in Figure 2A.
GCE/SiO-CeONPs show a pair of quasi-reversible redox peaks (red curve) with no response appearing in bare GCE. The GCE/SiO-CeONPs in the presence of H2O2 shift the peak of the electroactive material to more positive potentials and exhibit superior catalytical ability toward hydrogen peroxide (green curve). Two pairs of obvious redox peaks appeared (a/a” and b/b”), with a/a” showing the activity of the modifier while b/b” shows the redox reaction originated from direct electrochemistry of H2O2 that took place on the working electrode. Furthermore, EIS investigations in Figure 2B were performed in 0.1M PB solution (pH 5.5) showing the largest value of 4220 kΩ (black curve), which decreased to 1.45 kΩ for GCE/SiO-CeONPs (red curve) and further declined to 0.22 kΩ after addition of H2O2 in solution (green curve). The Randle’s circuits data in Table 1 further highlights the electroactivity differences. This demonstrates that the increase in the electroactive surface area of GCE/SiO-CeONPs resulted in efficient electrocatalytic activity towards H2O2 which agrees with CV findings.
To investigate the kinetic process (diffusion or adsorption-controlled) of H2O2 on the GCE/SiO-CeONPs, the impact of different scan rates (ν) from 30 to 210 mVs−1, and the performance of the 0.1 PB solution containing H2O2 in the potential range from −0.3 to 0.6 V was measured (Figure 2A. Both oxidation and reduction peak currents of H2O2 linearly increased with the scan rate between 30 to 210 mVs−1, suggesting that the process is controlled by adsorption process. A confirmation of a straight line with a slope of 0.994 (Figure 2C) estimated by the plot of the log Ipa (peak current) versus log ν expressed an ideal reaction for the adsorption-controlled electrode process [22]. Based on the Laviron equation [23], Epa is dependent on log ν for quasi-reversible and reversible processes.
E p a = E 0 + ( 2.203 R T α n F ) n F log   ( R T K 0 α n F ) + ( 2.203 R T α n F ) log ν    
All the symbols in the above equation can be found in the electrochemistry literature. In this electrochemical reaction, the slope is 45.29, using T = 298 K, R = 8.314 J/K mol), and F = 96,480 C mol−1. Bard and Faulkner [22], proposed the value of α to be specified as between 0.5 and 0.7 for quasi-reversible reactions. The calculated α value is 0.578 which falls within the above-mentioned values for a quasi-reversible system.
The number of electrons transferred (n), and rate constant (Ks) were calculated as approximately 1.16. and 5.83 × 10⁻⁴ cm/s, respectively Table 1. The schematic mechanism showing interaction of SiONPs with CeONPs, as well as sensing mechanism of H2O2 is shown in Scheme 1.

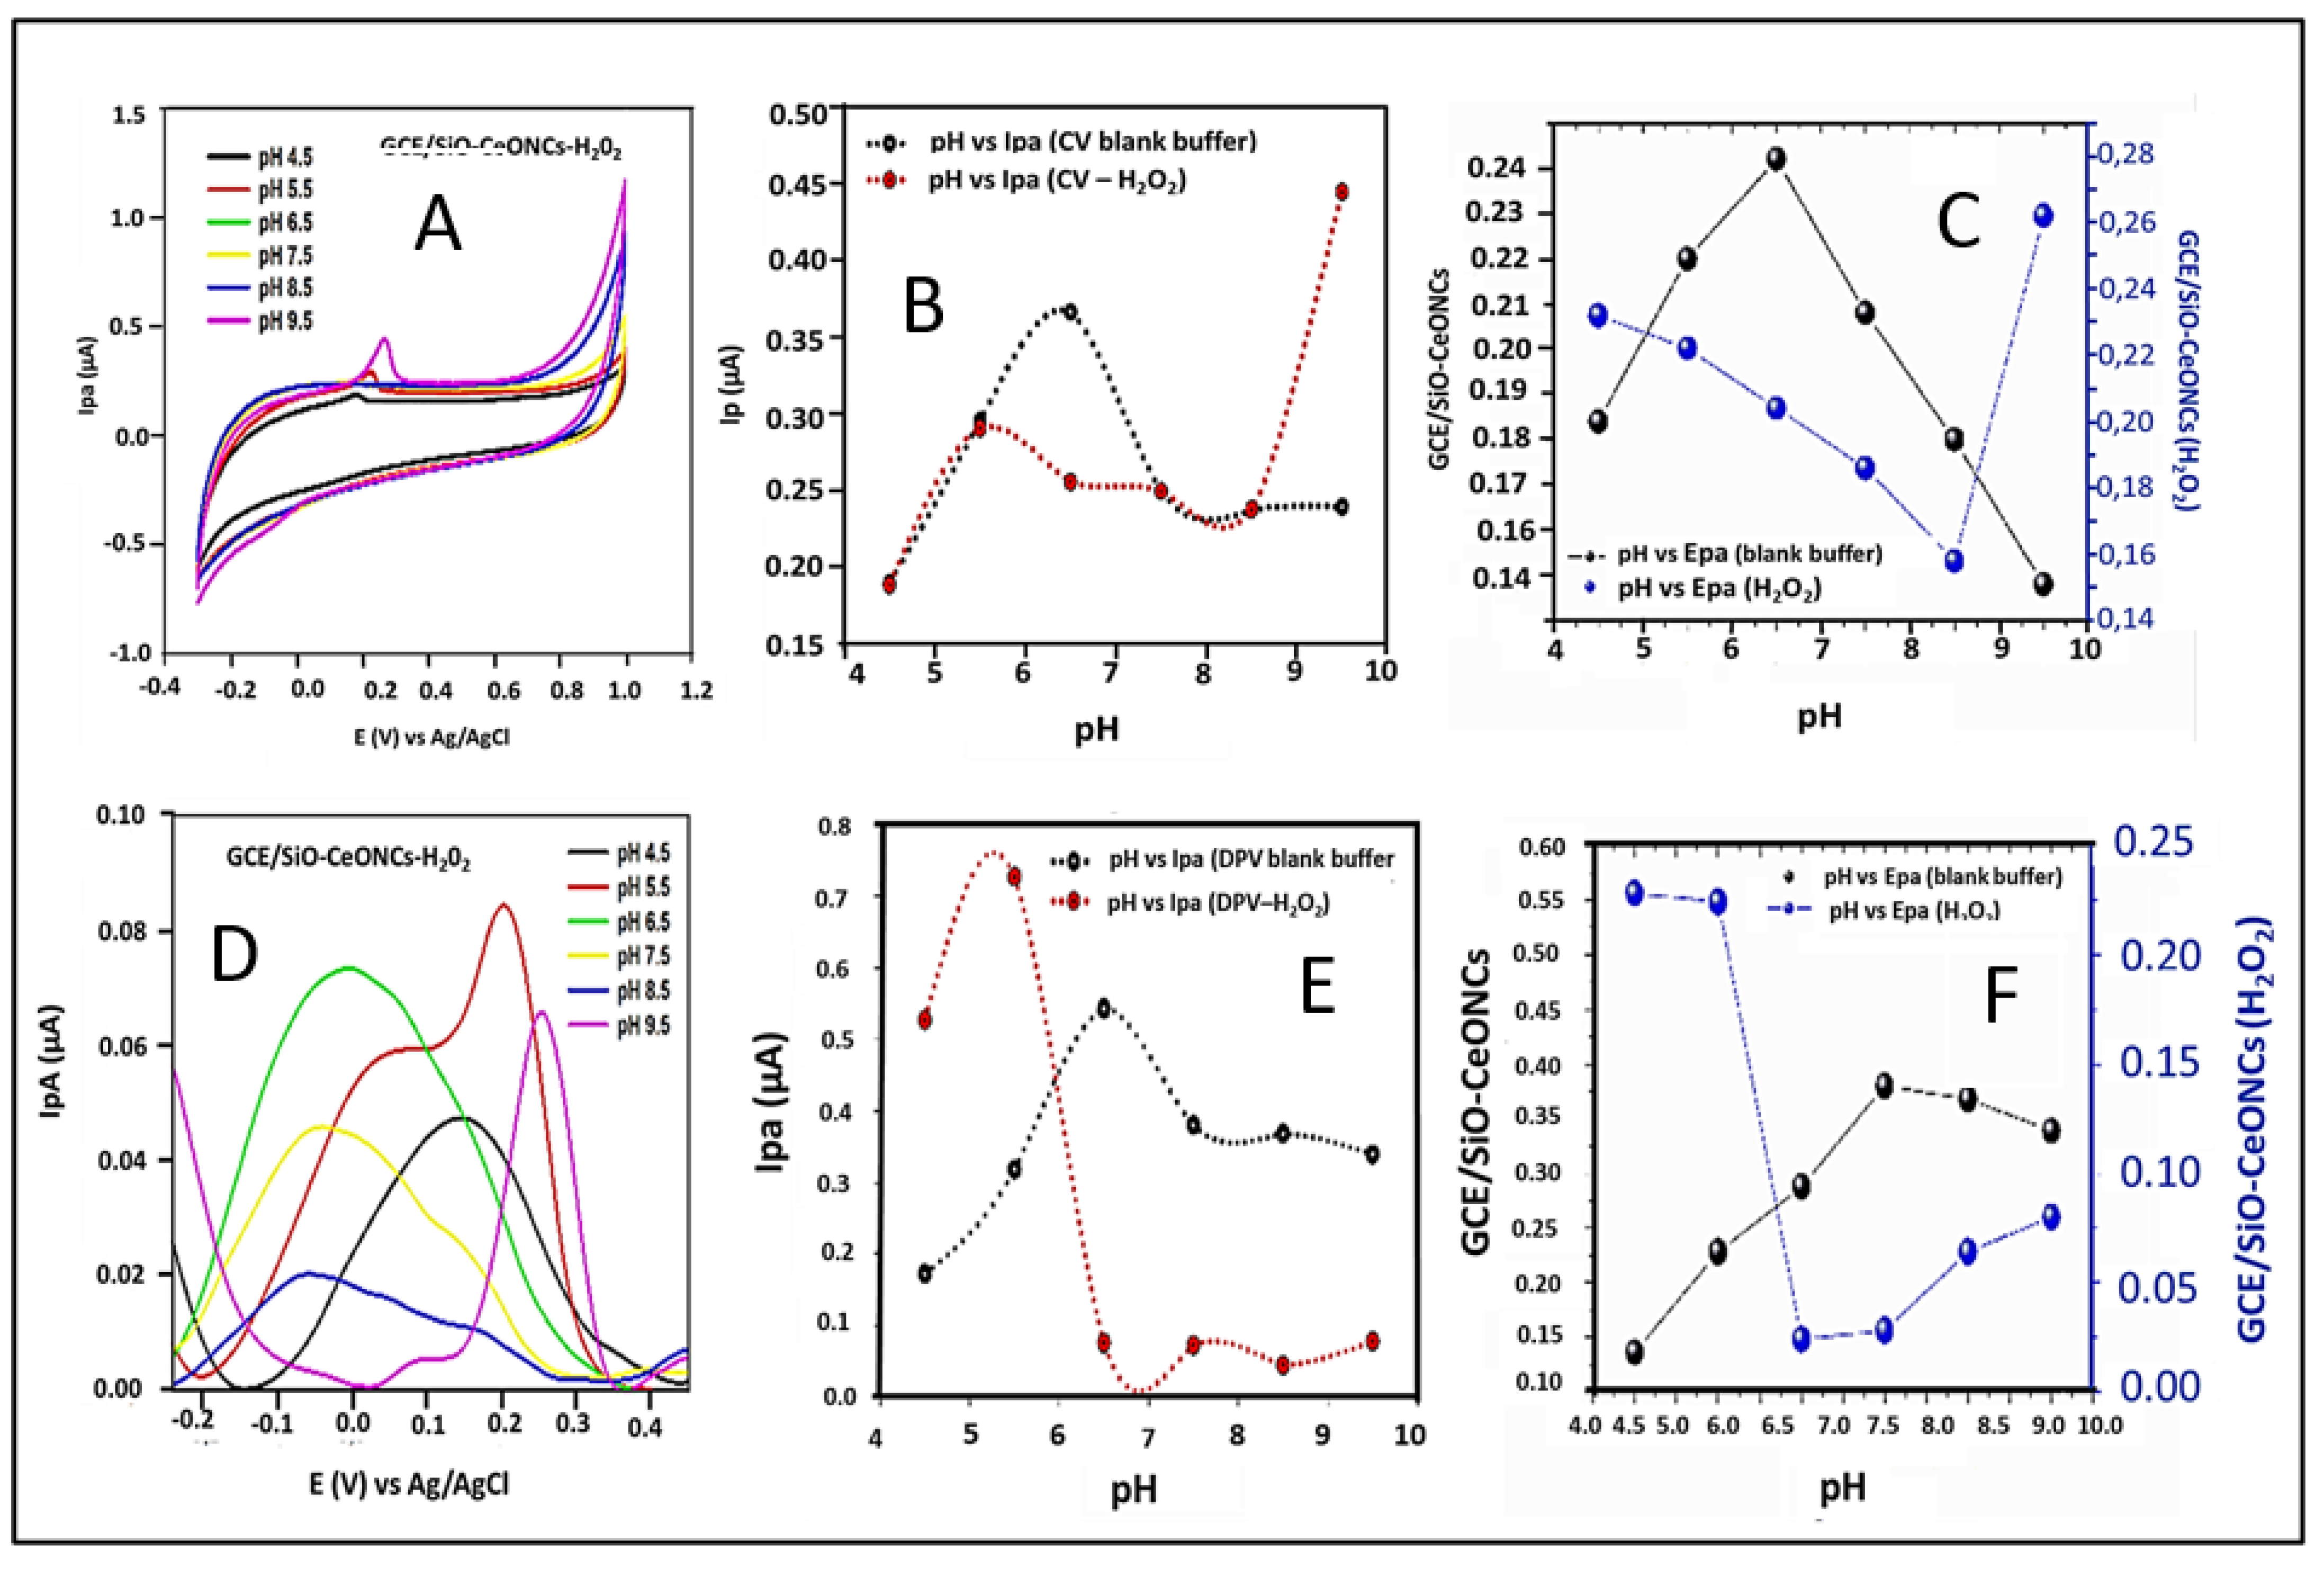
3.3. Evaluation of pH on Analytical Performance

The pH value of the electrolyte solution can have a significant impact on electrochemical reactions especially when the analyte has basic and acidic functional groups [24,25]. Therefore, it is necessary to determine an appropriate pH value. The pH dependence of the SiO-CeONPs was studied in 0.1M containing H2O2 and without H2O2.
The shift of the peak potential of H2O2 was observed as the pH values changed as depicted in Figure 3A,D. Variation of pH vs. peak current (Ipa) for both methods is presented in Figure 3B,C. To achieve a better electrocatalytic performance of H2O2, the optimal conditions were obtained at pH 9.5 and 5.5 for CV and DPV, respectively. Since the studies will be performed using the DPV technique, pH 5.5 was chosen as an optimal value which was used for further analyses. It is also noteworthy to mention that for blank PB solution the optimum pH values of 6.5 were observed for both CV and DPV (black curve, Figure 3B,E. Meanwhile, the relationship of pH vs. peak potential (Epa) is shown in (C) and (F), detailed inspection of (C) reveals that the trend of variation for peak potential (Epa) versus solution pH can be divided into two distinct regions. In the absence of H2O2 in the region between pH 4.5 and 6.5, there is a linear relation between pH and peak potential with a slope of about 31 mV per pH unit while in the presence of H2O2, the slope of 18 mV pH per unit was obtained. For both environmental conditions, the slope was closer to the theoretical Nernst’s value (21.0 mV/pH) for uneven involvement of electrons in the electrode reaction [26]. These finding, satisfies the Nernst equation, indicating one proton per two-electron redox process. As we aimed to determine hydrogen peroxide concentrations in milk and apple juice samples further investigations were carried out at pH 5.5.

3.4. Sensors Parameters

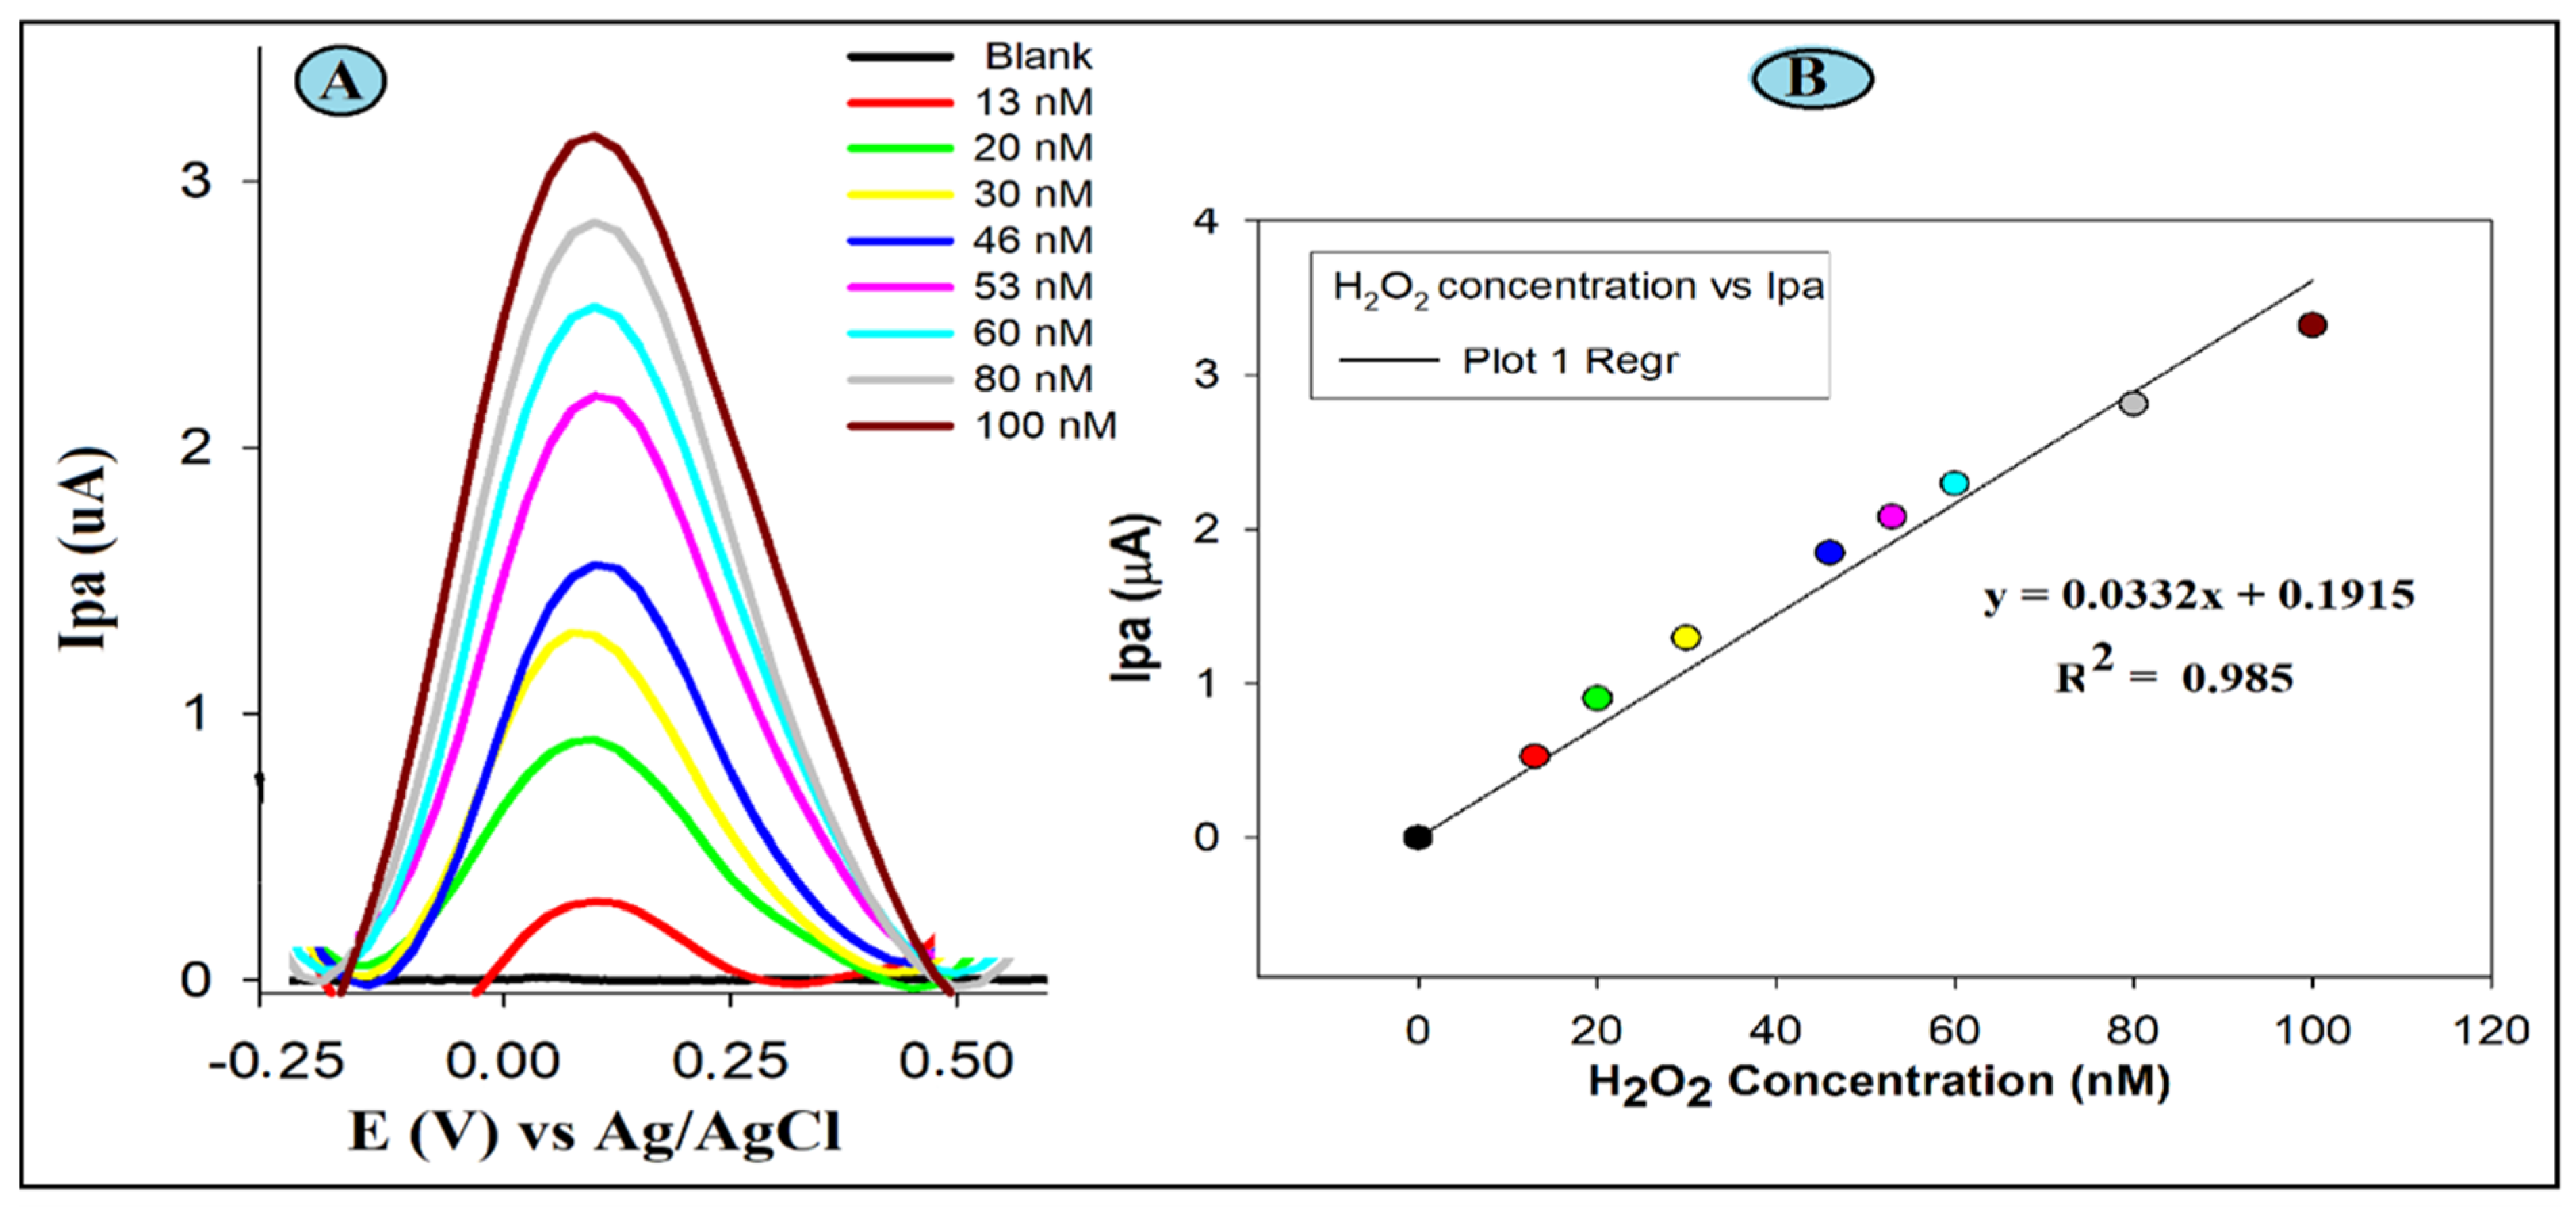
3.4.1. Linearity and Detection Limit

To further certify the feasibility of GC/SiO-CeONPs under optimal experimental conditions for the determination of H2O2, DPV was used. The increment trend of peaks from concentrations of 13 to 100 nM hydrogen peroxide is shown in Figure 4.
The acquired results illustrate that the H2O2 electrochemical detection signal appears at 0.1V on the SiO-CeONPs modified GCE in pH 5.5 PBS in close agreement with literature studies [27,28,29,30]. Upon successive additions to the H2O2 concentration, the anodic peak current (Ipa) correspondingly increased linearly, with a sensitivity of 0.033 μA nM−1, and an associated r2 value of 0.985. Using the calibration curve linear equation, LOD and LOQ were 0. 0004, and 0.002 µM, respectively. A comparison of the DPV studies of developed GCE-SiO-CeONPs sensor with other H2O2 sensors reported in the literature is shown in Table 2. The comparative studies reveal better results than those obtained at several electrodes reported recently.

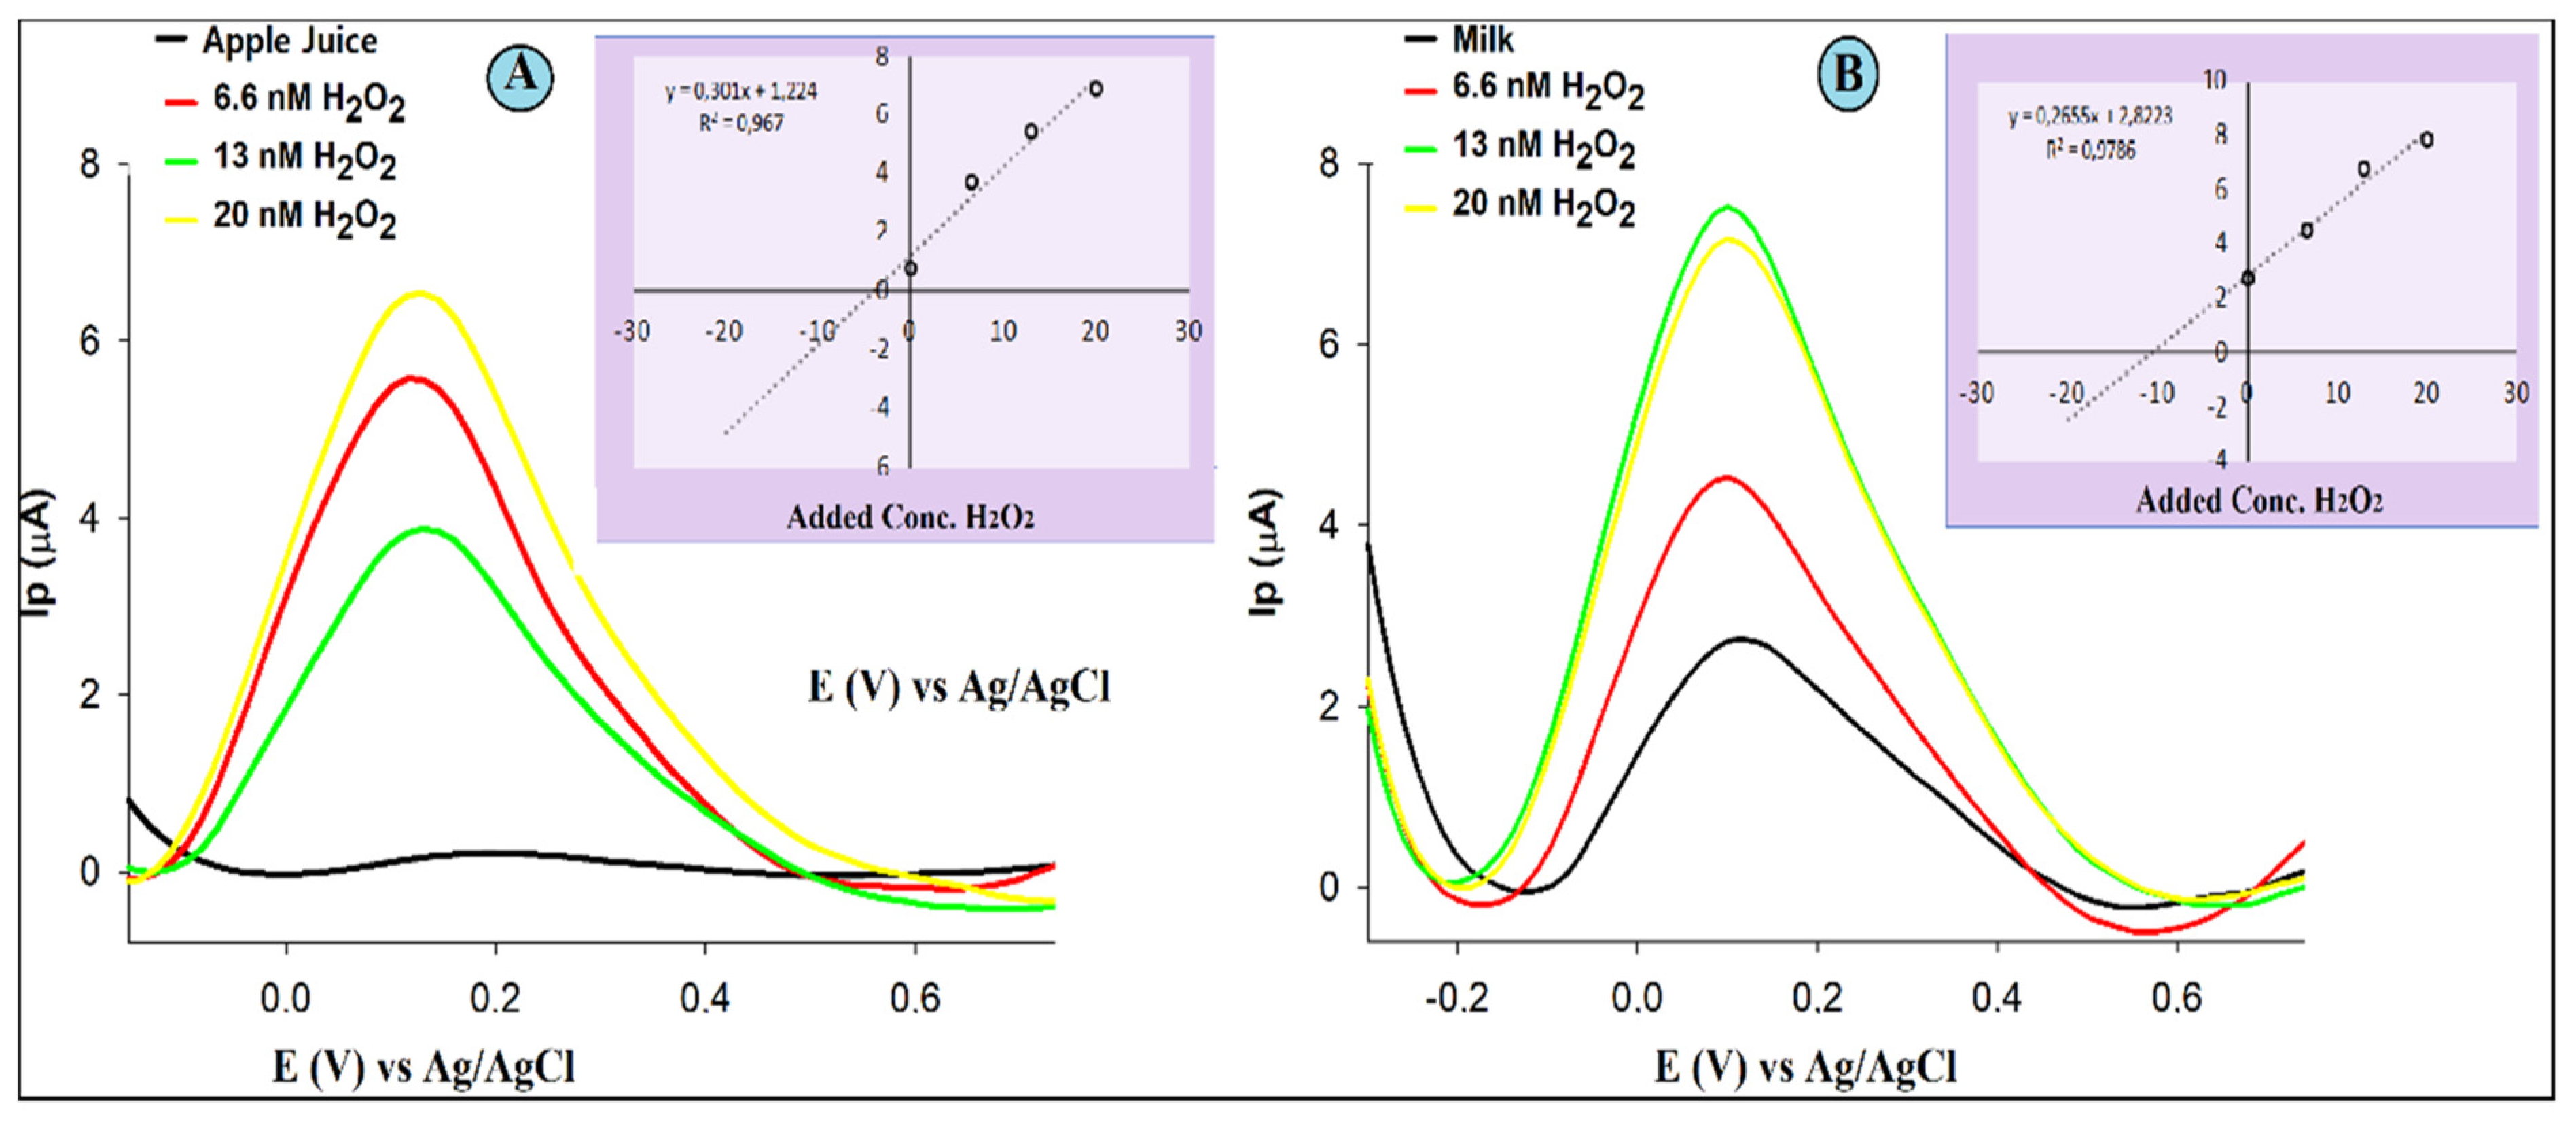
3.4.2. Detection of H2O2 in Real Samples and Recovery Tests

Investigating the practicability of the proposed GCE/SiO-CeONPs sensor, a standard addition was used for the analysis of H2O2 contents in apple juice (A) and milk samples (B). Representative voltammograms acquired in the analysis of the H2O2 in the real samples as well as calibration graphs (insets) using GCE/SiO-CeONPs are shown in Figure 5.
The detection limits of 0.0004 µM, and the calibration graph were linear in the range of 0.01–0.08 µM. 0.006 µM and 0.007 µM were calculated LOD values, while 0.02 µM LOQ was observed for milk and apple juice, respectively. The H2O2 content in the native sample was 0.17 and 1.62 µM for apple juice and milk samples, respectively with very good recovery values (92.35%, and 99.11%), and an RSD of 4.43 and 0.32 as in Table 3. These results suggested that the proposed sensors could satisfactorily be applicable for the detection of H2O2 in real sample analysis.

3.4.3. Sensor Validation

For the practical application of any sensor, stability, reproducibility, and interferences are of crucial importance. The stability is related to shelf life and necessary for prolonged usage. Also, interferences can affect the size of the final measurement either, positively or negatively.
The bar diagram with error bars is associated with the data points corresponding to the standard deviation obtained in Figure 6. (A) shows the current changes obtained in stability studies on day 1 and after days 5, 10, 15, 20, and day 30 of measurement. Analysis of the bar diagram from Figure 6A, shows the sensor with good stability up to the 15th day because there was a negligible decrease in the electrode response from the 10th and 15th days, while there was a severe decrease in current on the 25th and 30th day.
For the evaluation of possible interferences of GCE-SiO-CeONPs for H2O2 detection, the influences coexisting substances, such as glucose, ascorbic acid, and sodium chloride were investigated by DPV under the same experimental conditions. Figure 6C illustrates a bar graph of less, equal, and doubled concentrations of interferences in ratios 1:2, 1:1, and 2:1 (Interference: H2O2). It was found that all the ratios exhibit an increase in peak intensity with negligible influence when NaCl ions were used. Moreover, one more peak very close to the H2O2 peak was observed when ascorbic acid was added. However, this did not interfere with the quantification of H2O2. Reproducibility was evaluated by DPV studies in the presence of 40 nM H2O2, as displayed in Figure 6C. A series of three electrodes coated with SiO-CeONPs prepared in the same manner were also tested and the RSD was 2.9%. Based on these results, the GCE-SiO-CeONCs showed good selectivity, reproducibility, and stability for up to 15 days for H2O2 detection at pH 5.5.

4. Conclusions

In summary, SiO-CeONPs as a modifier for the voltammetric detection of H2O2 in food samples was explored. The GCE/SiO-CeONPs showed a comparable limit of detection with good stability and reproducibility. The performance of GCE/SiO-CeONPs was not affected by inorganic and biological ions that are suspectable to interfere with H2O2. More significantly, the modified GCE exhibited a wide linear range from 0.10 µM to 0.80 µM and a low detection limit of 0.0007 µM with good reproducibility. These experimental results indicates the applicability of GCE/SiO-CeONPs for the detection of H2O2 in real food products. Furthermore, by virtue of its ease of operation, simplicity, and high efficiency, the sensor could provide a new platform for expanding the application in other fields.

Author Contributions

The work Conceptualization, methodology, formal analysis Validation, data interpretation software and drafting were executed by B.S.; While resources, Supervision, project administration, funding acquisition and manuscript review were responsibilities of M.M. All authors have read and agreed to the published version of the manuscript.

Funding

This research received no external funding.

Institutional Review Board Statement

Not applicable.

Informed Consent Statement

Not applicable.

Data Availability Statement

The data relating to this manuscript can be found from the corresponding author on request.

Conflicts of Interest

The authours involved declare that there is no conflict of interest with any institution on this publication.

References

  1. González-Sánchez, M.I.; González-Macia, L.; Pérez-Prior, M.T.; Valero, E.; Hancock, J.; Killard, A.J. Electrochemical Detection of Extracellular Hydrogen Peroxide in Arabidopsis Thaliana: A Real-Time Marker of Oxidative Stress. Plant Cell Environ. 2013, 36, 869–878. [Google Scholar] [CrossRef] [PubMed]
  2. Chen, W.; Cai, S.; Ren, Q.Q.; Wen, W.; Zhao, Y.D. Recent advances in electrochemical sensing for hydrogen peroxide: A review. Analyst 2012, 137, 49–58. [Google Scholar] [CrossRef] [PubMed]
  3. Zhang, P.; Wang, Y.; Yin, Y. Facile Fabrication of a Gold Nanocluster-Based Membrane for the Detection of Hydrogen Peroxide. Sensors 2016, 16, 1124. [Google Scholar] [CrossRef]
  4. Niu, X.; Lan, M.; Zhao, H.; Chen, C. Highly sensitive and selective Nonenzymatic detection of glucose using three-dimensional porous nickel nanostructures. Anal. Chem. 2013, 85, 3561–3569. [Google Scholar] [CrossRef]
  5. Tanabe, K.; Yamaguchib, T. Acid-base bifunctional catalysis by ZrO2 and its mixed oxides. Catal. Today 1994, 20, 185–197. [Google Scholar] [CrossRef]
  6. Soled, S.; McVicker, G. Acidity of silica-substituted zirconia. Catal. Today 1992, 14, 189–194. [Google Scholar] [CrossRef]
  7. He, H. Metal oxide semiconductors and conductors. Solut. Process. Met. Oxide Thin Film. Electron. Appl. 2020, 1, 7–30. [Google Scholar] [CrossRef]
  8. Gangopadhyay, S.; Frolov, D.D.; Masunov, A.E.; Seal, S. Structure and properties of cerium oxides in bulk and nanoparticulate forms. J. Alloys Compd. 2014, 584, 199–208. [Google Scholar] [CrossRef]
  9. Sun, C.; Hong, L.; Chen, L. Nanostructured ceria-based materials: Synthesis, properties, and applications. Energy Environ. Sci. 2012, 5, 8475. [Google Scholar] [CrossRef]
  10. Skorodumova, N.V.; Simak, S.I.; Lundqvist, B.I.; Abrikosov, I.A.; Johansson, B. Quantum origin of the oxygen storage capability of ceria. Phys. Rev. Lett. 2002, 89, 166601. [Google Scholar] [CrossRef]
  11. Polina, A.; Tabachkova, N.Y.; Stenina, I.A.; Yaroslavtsev, Y.B. Properties of ceria nanoparticles with surface modified by acidic group. J. Nanopart. Res. 2020, 22, 318. [Google Scholar] [CrossRef]
  12. Bracamonte, M.V.; Melchionna, M.; Giuliani, A.; Nasi, L.; Tavagnacco, C.; Prato, M.; Fornasiero, P. H2O2 sensing enhancement by mutual integration of single walled carbon nanohorns with metal oxide catalysts: The CeO2 case. Sens. Actuators B Chem. 2017, 239, 923–932. [Google Scholar] [CrossRef]
  13. Iler, R.K. Adsorption of colloidal silica on alumina and of colloidal alumina on silica. J. Am. Ceram. Soc. 1964, 47, 194–198. [Google Scholar] [CrossRef]
  14. Ismael, M.R.; Anjos, R.D.; Salomão, R.; Pandolfelli, V.C. Colloidal Silica as a Nanostructured Binder for Refractory Castables. Refract. Appl. News 2006, 11, 16–20. [Google Scholar]
  15. Zhao, H.; Ju, H. Multilayer membranes for glucose biosensing via layer-by-layer assembly of multiwall carbon nanotubes and glucose oxidase. Anal. Biochem. 2006, 350, 138–144. [Google Scholar] [CrossRef]
  16. Pravda, J. Hydrogen peroxide and disease: Towards a unified system of pathogenesis and therapeutics. Mol. Med. 2020, 26, 41. [Google Scholar] [CrossRef]
  17. Halliwella, B.; Clement, M.V.; Long, L.H. Hydrogen peroxide in the human body. FEBS Lett. 2000, 486, 10–13. [Google Scholar] [CrossRef]
  18. Yang, L.; Xu, C.; Ye, W.; Liu, W. An electrochemical sensor for H2O2 based on a new Co-metal-organic framework modified electrode. Sens. Actuators B Chem. 2015, 215, 489–496. [Google Scholar] [CrossRef]
  19. Zhao, B.; Liu, Z.; Liu, Z.; Liu, G.; Li, Z.; Wang, J.; Dong, X. Silver microspheres for application as hydrogen peroxide sensor. Electrochem. Commun. 2009, 11, 1707–1710. [Google Scholar] [CrossRef]
  20. Wang, S.; Zhang, T.; Zhu, X.; Zu, S.; Xie, Z.; Lu, X.; Zhang, M.; Song, L.; Jin, Y. Metal-Organic Frameworks for Electrocatalytic Sensing of Hydrogen Peroxide. Molecules 2022, 27, 4571. [Google Scholar] [CrossRef]
  21. Munusamy, P.; Sanghavi, S.; Varga, T.; Suntharampilla, T. Silica supported ceria nanoparticles: A hybrid nanostructure to increase stability and surface reactivity of nano-crystalline ceria. RSC Adv. 2014, 4, 8421. [Google Scholar] [CrossRef]
  22. Mohd Bakhori, N.; Yusof, N.A.; Abdullah, J.; Wasoh, H.; Ab Rahman, S.K.; Abd Rahman, S.F. Surface enhanced CdSe/ZnS QD/SiNP electrochemical immunosensor for the detection of Mycobacterium tuberculosis by combination of CFP10-ESAT6 for better diagnostic specificity. Materials 2020, 13, 149. [Google Scholar] [CrossRef] [PubMed]
  23. Laviron, E.; Roullier, L.; Degrand, C. A Multilayer Model for the Study of Space Distributed Redox Modified Electrodes: Part II. Theory and Application of Linear Potential Sweep Voltammetry for a Simple Reaction. J. Electroanal. Chem. Interfacial Electrochem. 1980, 112, 11–23. [Google Scholar] [CrossRef]
  24. Bard, A.J.; Faulkner, L.R. Electrochemical Methods: Fundamentals and Applications, 2nd ed.; Wiley: New York, NY, USA, 2000. [Google Scholar]
  25. Abdelaziz, M.A.; Mansour, F.R.; Danielson, N.D. A gadolinium-based magnetic ionic liquid for dispersive liquid–liquid microextraction. Anal. Bioanal. Chem. 2021, 413, 205–214. [Google Scholar] [CrossRef] [PubMed]
  26. Amini, N.; Abdolahi, S.S.; Naderi, K.; Maleki, P.; Mohammadi, S.; Mandoumi, N. Construction of a sensitive electrochemical sensor for diphenhydramine and 8-chlorotophylline as a dimenhydrinate drug based on copper nanoparticles and polyalizarin yellow at two applied potentials. J. Appl. Electrochem. 2022, 52, 617–626. [Google Scholar] [CrossRef]
  27. Mohammad Ali Kamyabi, M.A.; Hajari, N. Low Potential and Non-Enzymatic Hydrogen Peroxide Sensor Based on Copper Oxide Nanoparticle on Activated Pencil Graphite Electrode. J. Braz. Chem. Soc. 2017, 28, 808–818. [Google Scholar] [CrossRef]
  28. Tang, J.; Huang, L.; Cheng, Y.; Zhuang, J.; Li, P.; Tang, D. Nonenzymatic sensing of hydrogen peroxide using a glassy carbon electrode modified with graphene oxide, a polyamidoamine dendrimer, and with polyaniline deposited by the Fenton reaction. Mikrochim. Acta 2018, 185, 569. [Google Scholar] [CrossRef]
  29. Benvidi, A.; Nafar, M.T.; Jahanbani, S.; Tezerjani, M.D.; Rezaeinasab, M.; Dalirnasab, S. Developing an electrochemical sensor based on a carbon paste electrode modified with nano-composite of reduced graphene oxide and CuFe2O4 nanoparticles for determination of hydrogen peroxide. Mater. Sci. Eng. C 2017, 75, 1435–1447. [Google Scholar] [CrossRef]
  30. Yang, L.; Yang, W.; Cai, Q. Size-Controllable Fabrication of Noble Metal Nanonets Using a TiO2 Template. Inorg. Chem. 2006, 45, 9616–9618. [Google Scholar] [CrossRef]
  31. Song, H.; Ma, C.; You, L.; Cheng, Z.; Zhang, X.; Yin, B.; Ni, Y.; Zhang, K. Electrochemical hydrogen peroxide sensor based on a glassy carbon electrode modified with nanosheets of copper-doped copper (II) oxide. Microchim. Acta 2015, 182, 1543–1549. [Google Scholar] [CrossRef]
  32. Ojani, R.; Raoof, J.B.; Norouzi, B. Carbon paste electrode modified by cobalt ions dispersed into poly (N-methylaniline) preparing in the presence of SDS: Application in electrocatalytic oxidation of hydrogen peroxide. J. Solid State Electrochem. 2010, 14, 621–631. [Google Scholar] [CrossRef]
  33. Islam, M.F.; Islam, M.T.; Hasan, M.M.; Rahman, M.M.; Nagao, Y.; Hasnat, M.A. Facile fabrication of GCE/Nafion/Ni composite, a robust platform to detect hydrogen peroxide in basic medium via oxidation reaction. Talanta 2022, 240, 123202. [Google Scholar] [CrossRef] [PubMed]
  34. Li, X.; Du, X. Molybdenum disulfide nanosheets supported Au-Pd bimetallic nanoparticles for non-enzymatic electrochemical sensing of hydrogen peroxide and glucose. Sens. Actuators B Chem. 2017, 239, 536–543. [Google Scholar] [CrossRef]
  35. Song, H.; Ni, Y.; Kokot, S. A novel electrochemical sensor based on the copper-doped copper oxide nanoparticles for the analysis of hydrogen peroxide. Coll. Surf. A Physicochem. Eng. Asp. 2015, 465, 153–158. [Google Scholar] [CrossRef]
Figure 1. (A) Scanning electron morphology (SEM) of the SiO-CeONPs with (B) electron dispersive spectroscopy (EDS).
Electrochem 04 00006 g001
Figure 2. CV results of bare GCE, GCE/SiO-CeNPs, and GCE/SiO-CeONPs after addition of H2O2, (A); EIS results (B); Scan rate studies in the presence of H2O2 in 0.1 M PBS (pH 5.5) (C); Linear logarithm correlation of peak current vs. scan rate, (D). The linear curve of peak potential vs. the logarithm of scan rate, (E).
Electrochem 04 00006 g002
Scheme 1. Schematic representation of detection mechanism of H2O2 using GCE/SiO-CeONPs sensor.
Electrochem 04 00006 sch001
Figure 3. Effect of pH (A,D), variation of current vs. pH (B,E), and potential vs. pH (C,F) in PB solution using CV and DPV at GCE/SiO-CeONCs. H2O2 concentration, 30 nM; scan rate, 30 mV s–1; pulse amplitude, 50 mV; pulse width, 30 s.
Electrochem 04 00006 g003
Figure 4. DPV (A) experiments of H2O2 in 0.1 M PB solution (pH 5.5); the linear relationship of the currents vs. the concentrations (B) for the GCE/SiO-CeONCs sensor. Scan rate, 0.03 V/s; Epulse, 50 mV; tpulse, 30 ms.
Electrochem 04 00006 g004
Figure 5. DPV measurements with GCE/SiO-CeONCs in 0.1 M PBS 0.01 for apple juice and milk sample before and after three successive additions of a standard solution of H2O2, and the insets are corresponding standard addition plots, apple juice (A) and milk samples (B).
Electrochem 04 00006 g005
Figure 6. (A) Stability of electrodes—Bar diagram with error bars representing the changes in current obtained after storing for weeks; (B) 3D DPV graph showing reproducibility of the method, (C) Interference studies—Bar diagram showing changes in current obtained after adding different ratios of interfering species.
Electrochem 04 00006 g006
Table 1. Nyquist plot parameters in the presence and absence of H2O2with χ2 values between 1.5 and 2.5%.
SensorRsRct (1 & 2)CPEQ (1,2 & 3)Q2Zw
GCE8204220 1.06
GCE/SiO-CeONPs48.71.43, 1.42 28.2, 2.32, 6.30
GCE/SiO-CeONPs-H2O233.70.223.952.641.11900
Table 2. Comparison of the proposed methodology with other DPV-reported methods and previous results for the determination of H2O2.
SensorLinear Range (µM)LOD (µM)Potential (V)Reference
Cu@CuO nanosheets3–8000210−0.46[31]
CuO/APGE5.0–16000.210.05[27]
PNMA(SDS)/Co/CPE5–483.000.25[32]
GCE/Nafion/Ni5–5001.80-------[33]
GCE/MoS2/Au-Pd0.8–10,0000.16−0.03[34]
GCE/Go-PAMAM-Fe3+0.5–20000.180.05[28]
GCE/Cu@CuO5–80000.23−0.50[35]
GCE/SiO-CeONPs0.01–0.080.00040.13This study
Table 3. Recovery and precision data for hydrogen peroxide determination in milk and apple juice samples in phosphate buffer solution at GCE-SiO-CeONPs.
SampleMeasured
(µM)
Added H2O2 (µM)Found (µM)Recoveries (%)%RSD
Apple Juice0.170.0070.16496.474.30
0.0130.15792.355.00
0.0200.15088.234.00
Milk1.620.0071.61099.380.32
0.0131.60799.200.31
0.0201.60098.770.34
Disclaimer/Publisher’s Note: The statements, opinions and data contained in all publications are solely those of the individual author(s) and contributor(s) and not of MDPI and/or the editor(s). MDPI and/or the editor(s) disclaim responsibility for any injury to people or property resulting from any ideas, methods, instructions or products referred to in the content.

