
Impact of Ni Content on the Electrochemical Performance of the Co-Free, Li and Mn-Rich Layered Cathode Materials


Abstract
:
1. Introduction
2. Experimental
2.1. Synthesis of LLC Materials
2.2. Slurry Mixing and Electrode Coating
2.3. Cell Fabrication and Testing
2.4. Characterization
3. Results and Discussion
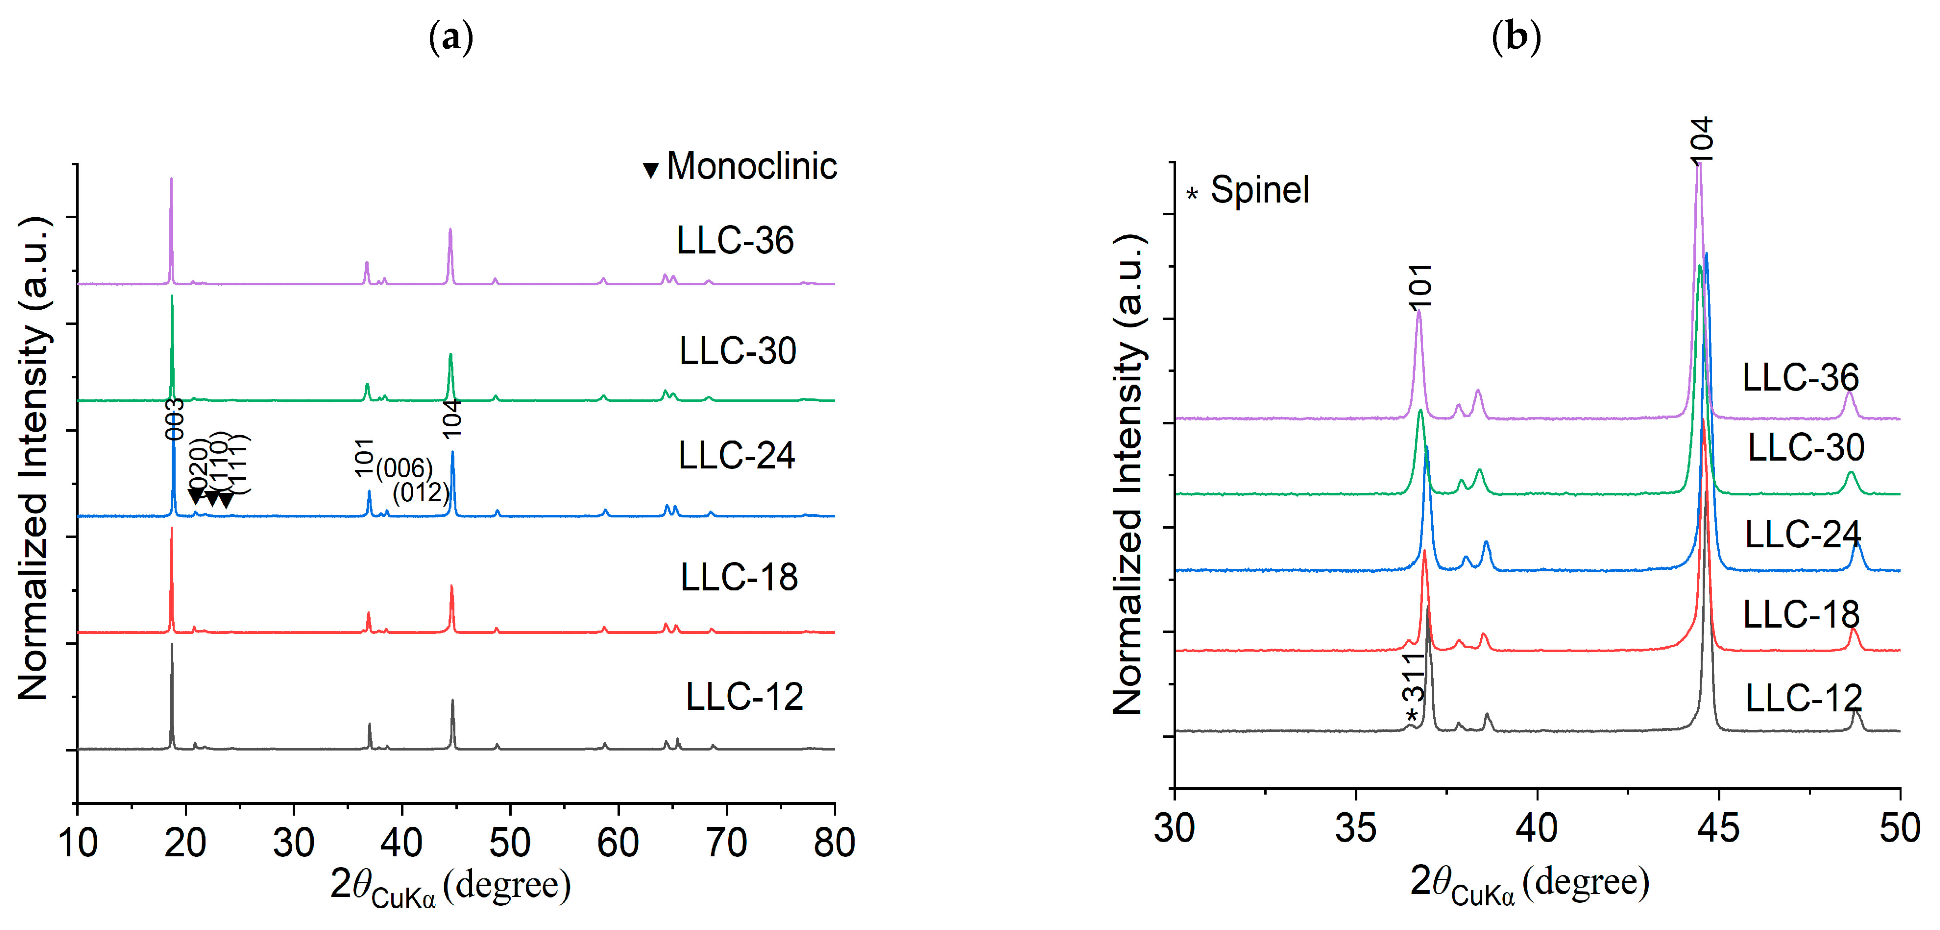
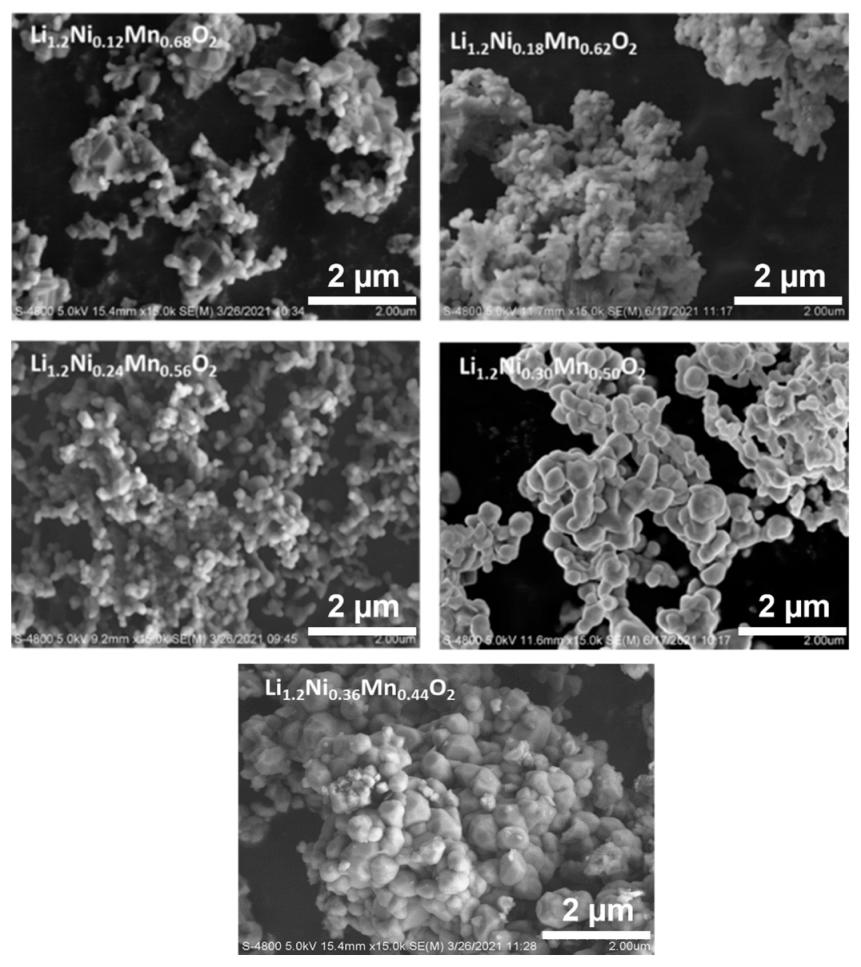
3.1. Cathode Active Material Structure and Morphology
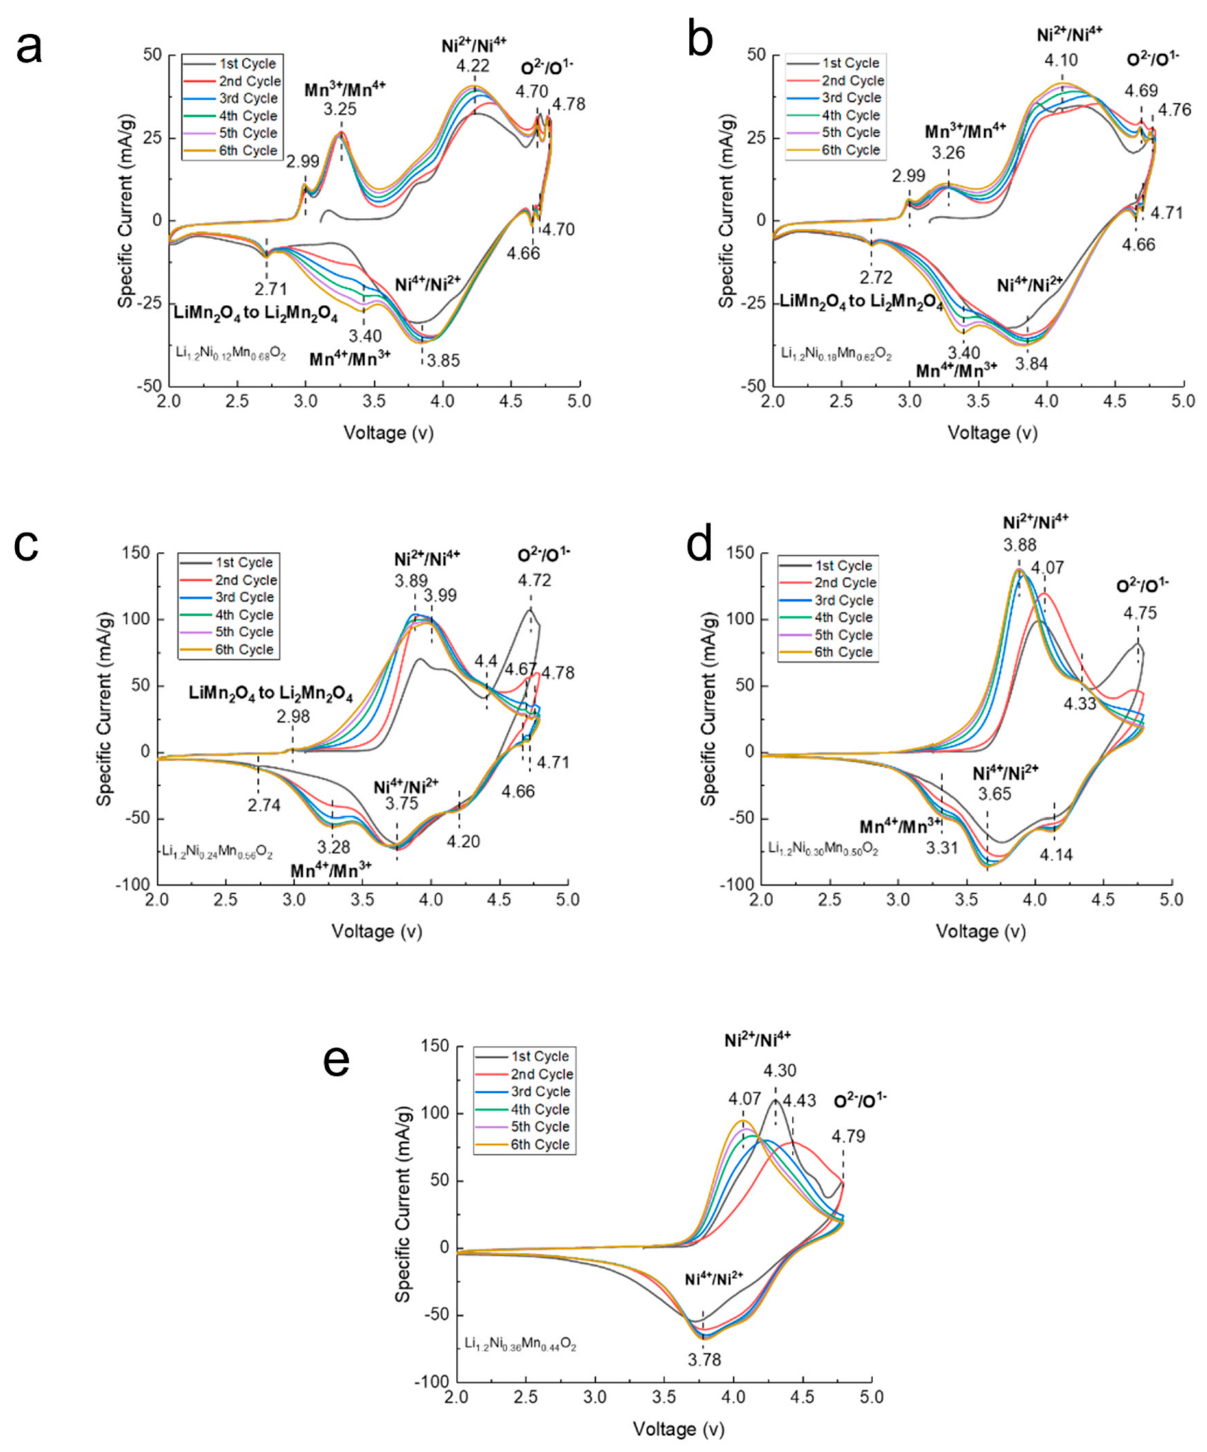
3.2. Electrochemical Evaluation for LLCs
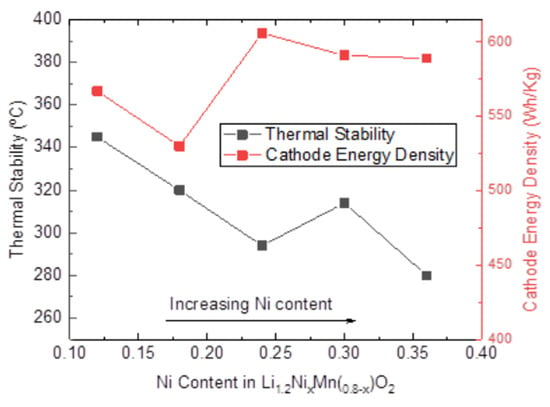
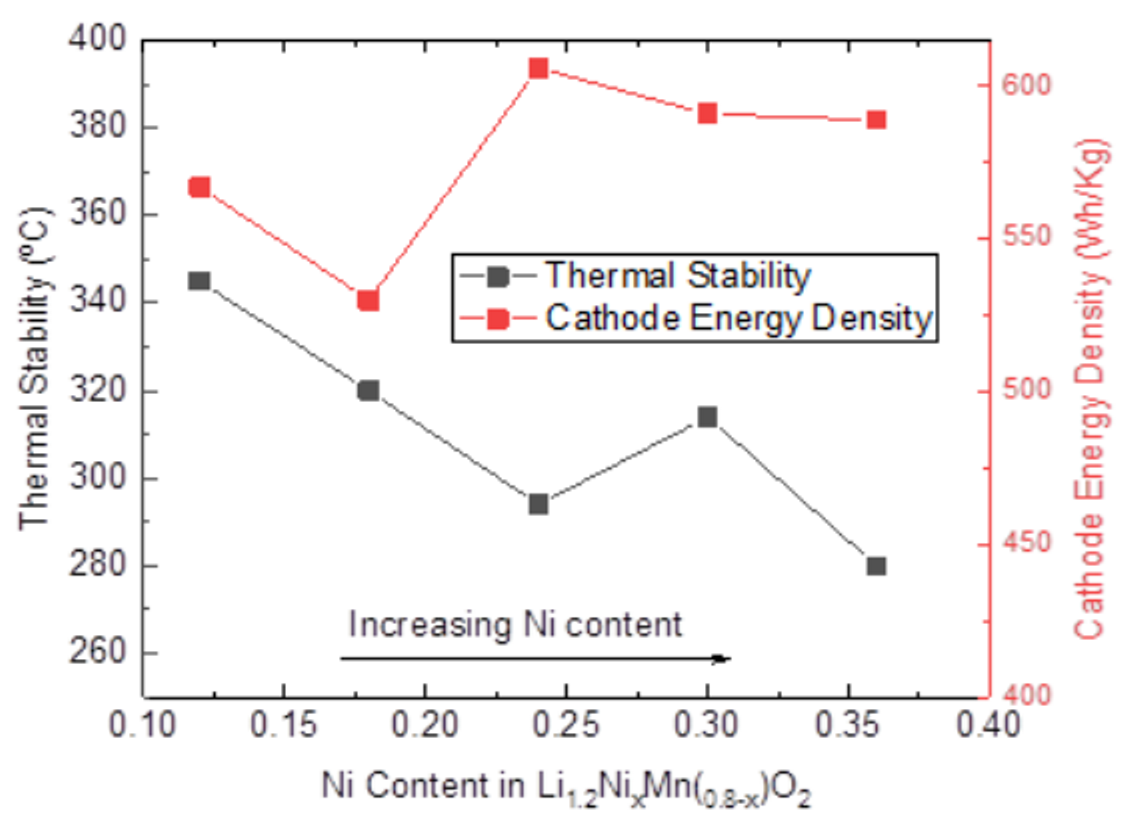
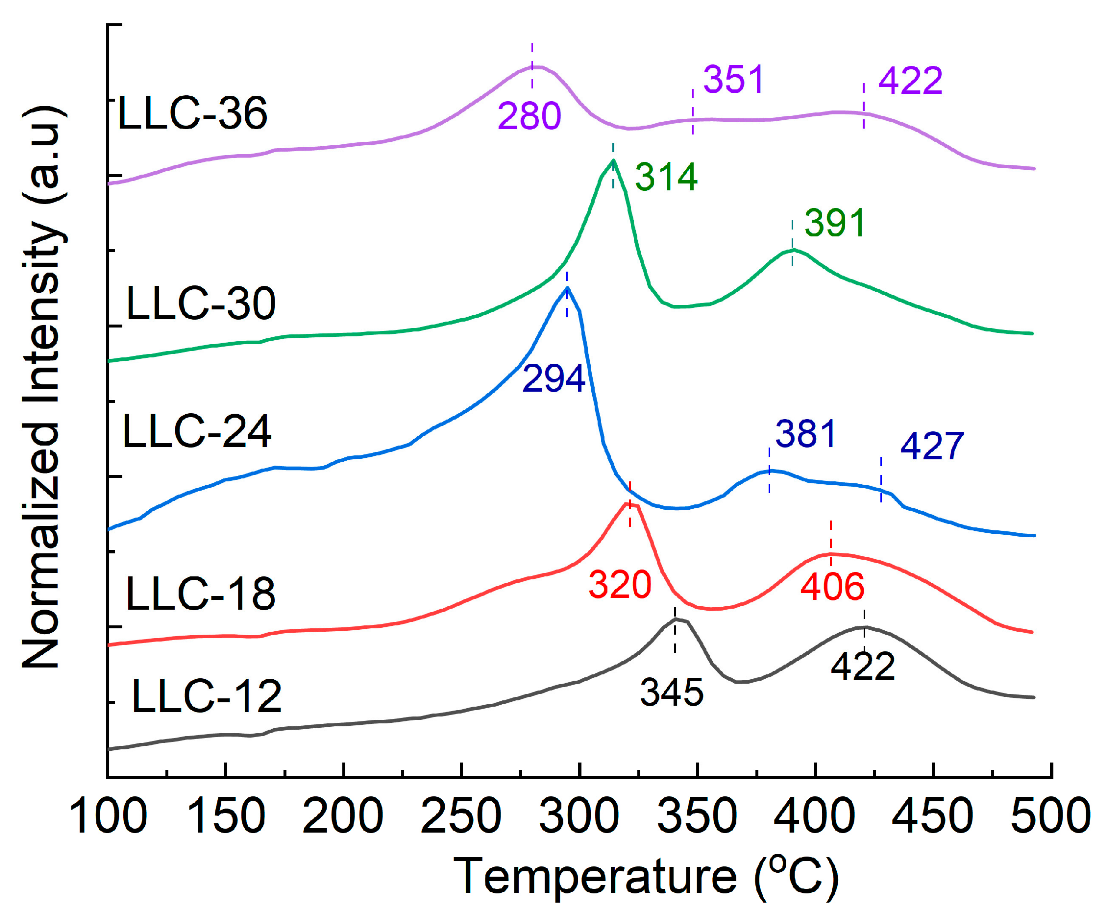
3.3. Thermal Stability of LMR Electrodes with Different Ni Contents
4. Conclusions
Author Contributions
Funding
Institutional Review Board Statement
Informed Consent Statement
Data Availability Statement
Acknowledgments
Conflicts of Interest
References
- Muratori, M.; Alexander, M.; Arent, D.; Bazilian, M.; Dede, E.M.; Farrell, J.; Gearhart, C.; Greene, D.; Jenn, A.; Keyser, M.; et al. The rise of electric vehicles—2020 status and future expectations. Prog. Energy 2021, 3, 022002. [Google Scholar] [CrossRef]
- Ding, Y.; Cano, Z.P.; Yu, A.; Lu, J.; Chen, Z. Automotive Li-Ion Batteries: Current Status and Future Perspectives. Electrochem. Energy Rev. 2019, 2, 1–28. [Google Scholar] [CrossRef]
- Armand, M.; Tarascon, J.-M. Building better batteryies. Nature 2008, 451, 652. [Google Scholar] [CrossRef] [PubMed]
- Choi, J.U.; Voronina, N.; Sun, Y.-K.; Myung, S.-T. Recent progress and perspective of advanced high-energy Co-less Ni-rich cathodes for Li-ion batteries: Yesterday, today, and tomorrow. Adv. Energy Mat. 2020, 10, 2002027. [Google Scholar] [CrossRef]
- Manthiram, A. A reflection on lithium-ion battery cathode chemistry. Nat. Commun. 2020, 11, 1–9. [Google Scholar] [CrossRef] [PubMed] [Green Version]
- Hong, J.; Gwon, H.; Jung, S.-K.; Ku, K.; Kang, K. Review—Lithium-Excess Layered Cathodes for Lithium Rechargeable Batteries. J. Electrochem. Soc. 2015, 162, A2447–A2467. [Google Scholar] [CrossRef]
- He, W.; Guo, W.; Wu, H.; Lin, L.; Liu, Q.; Han, X.; Xie, Q.; Liu, P.; Zheng, H.; Wang, L.; et al. Challenges and Recent Advances in High Capacity Li-Rich Cathode Materials for High Energy Density Lithium-Ion Batteries. Adv. Mater. 2021, 33, e2005937. [Google Scholar] [CrossRef] [PubMed]
- Pan, H.; Zhang, S.; Chen, J.; Gao, M.; Liu, Y.; Zhu, T.; Jiang, Y. Li- and Mn-rich layered oxide cathode materials for lithium-ion batteries: A review from fundamentals to research progress and applications. Mol. Syst. Des. Eng. 2018, 3, 748–803. [Google Scholar] [CrossRef]
- Ji, X.; Xia, Q.; Xu, Y.; Feng, H.; Wang, P.; Tan, Q. A review on progress of lithium-rich manganese-based cathodes for lithium ion batteries. J. Power Sources 2021, 487, 229362. [Google Scholar] [CrossRef]
- Thackeray, M.M.; Kang, S.-H.; Johnson, C.S.; Vaughey, J.T.; Benedek, R.; Hackney, S.A. Li2MnO3-stabilized LiMO2 (M = Mn, Ni, Co) electrodes for lithium-ion batteries. J. Mater. Chem. 2007, 17, 3112. [Google Scholar] [CrossRef]
- Jarvis, K.A.; Deng, Z.; Allard, L.F.; Manthiram, A.; Ferreira, P.J. Atomic Structure of a Lithium-Rich Layered Oxide Material for Lithium-Ion Batteries: Evidence of a Solid Solution. Chem. Mater. 2011, 23, 3614–3621. [Google Scholar] [CrossRef]
- Darbar, D.; Self, E.C.; Li, L.; Wang, C.; Meyer, H.M.; Lee, C.; Croy, J.R.; Balasubramanian, M.; Muralidharan, N.; Bhattacharya, I.; et al. New synthesis strategies to improve Co-Free LiNi0.5Mn0.5O2 cathodes: Early transition metal d0 dopants and manganese pyrophosphate coating. J. Power Sources 2020, 479, 228591. [Google Scholar] [CrossRef]
- Manthiram, A.; Song, B.; Li, W. A perspective on nickel-rich layered oxide cathodes for lithium-ion batteries. Energy Storage Mater. 2017, 6, 125–139. [Google Scholar] [CrossRef]
- Rozier, P.; Tarascon, J.M. Review—Li-Rich Layered Oxide Cathodes for Next-Generation Li-Ion Batteries: Chances and Challenges. J. Electrochem. Soc. 2015, 162, A2490–A2499. [Google Scholar] [CrossRef]
- Xu, J.; Sun, M.; Qiao, R.; Renfrew, S.E.; Ma, L.; Wu, T.; Hwang, S.; Nordlund, D.; Su, D.; Amine, K.; et al. Elucidating anionic oxygen activity in lithium-rich layered oxides. Nat. Commun. 2018, 9, 1–10. [Google Scholar] [CrossRef] [Green Version]
- Assat, G.; Foix, D.; Delacourt, C.; Iadecola, A.; Dedryvère, R.; Tarascon, J.-M. Fundamental interplay between anionic/cationic redox governing the kinetics and thermodynamics of lithium-rich cathodes. Nat. Commun. 2017, 8, 1–12. [Google Scholar] [CrossRef] [PubMed] [Green Version]
- Kim, D.; Croy, J.R.; Thackeray, M.M. Comments on stabilizing layered manganese oxide electrodes for Li batteries. Electrochem. Commun. 2013, 36, 103–106. [Google Scholar] [CrossRef]
- Croy, J.R.; Gallagher, K.G.; Balasubramanian, M.; Long, B.; Thackeray, M.M. Quantifying hysteresis and voltage fade in xLi2MnO3 ● (1-x) LiMn0.5Ni0.5O2 electrodes as a function of Li2MnO3 content. J. Electrochem. Soc. 2014, 161, A318. [Google Scholar] [CrossRef]
- Hy, S.; Cheng, J.-H.; Liu, J.-Y.; Pan, C.-J.; Rick, J.; Lee, J.-F.; Chen, J.-M.; Hwang, B.J. Understanding the role of Ni in stabilizing the Lithium-rich high-capacity cathode material Li[NixLi(1−2x)/3Mn(2−x)/3]O2 (0 ≤ x ≤ 0.5). Chem. Mater. 2014, 26, 6919. [Google Scholar] [CrossRef]
- Darbar, D.; Malkowski, T.; Self, E.C.; Bhattacharya, I.; Reddy, M.V.; Nanda, J. An overview of cobalt-free, nickel-containing cathodes for Li-ion batteries. Mater. Today Energy 2022, 30, 101173. [Google Scholar] [CrossRef]
- Ding, X.; Luo, D.; Cui, J.; Xie, H.; Ren, Q.; Lin, Z. An ultra-long-life Lithium-rich Li1.2Mn0.6Ni0.2O2 cathode by three in-one surface modification for lithium-ion batteries. Angew. Chem. 2020, 132, 7852. [Google Scholar] [CrossRef]
- Noh, H.-J.; Youn, S.; Yoon, C.S.; Sun, Y.-K. Comparison of the structural and electrochemical properties of layered Li[NixCoyMnz]O2 (x = 1/3, 0.5, 0.6, 0.7, 0.8 and 0.85) cathode material for lithium-ion batteries. J. Power Sources 2013, 233, 121. [Google Scholar] [CrossRef]
- Johnson, C.S.; Kim, J.S.; Lefief, C.; Li, N.; Vaughey, J.T.; Thackeray, M.M. The significance of the Li2MnO3 component in composite xLiMnO3 ·(1-x) LiMn0.5Ni0.5O2 electrodes. Electrochem. Commun. 2004, 6, 1085. [Google Scholar] [CrossRef]
- Pan, L.; Xia, Y.; Qiu, B.; Zhao, H.; Guo, H.; Jia, K.; Gu, Q.; Liu, Z. Synthesis and electrochemical performance of micro-sized Li-rich layered cathode material for Lithium-ion batteries. Electrochimica Acta 2016, 211, 507–514. [Google Scholar] [CrossRef] [Green Version]
- Teufl, T.; Strehle, B.; Muller, P.; Gasteiger, H.A.; Mendez, M.A. Oxygen release and surface degradation of Li- and Mn-rich Layered oxides in variation of the Li2MnO3 Content. J. Electrochem. Soc. 2018, 165, A2718. [Google Scholar] [CrossRef] [Green Version]
- Nayak, P.K.; Grinblat, J.; Levi, M.; Levi, E.; Kim, S.; Choi, J.W.; Aurbach, D. Al Doping for Mitigating the Capacity Fading and Voltage Decay of Layered Li and Mn-Rich Cathodes for Li-Ion Batteries. Adv. Energy Mater. 2016, 6, 1502398. [Google Scholar] [CrossRef]
- Long, B.R.; Croy, J.R.; Park, J.S.; Wen, J.; Miller, D.J.; Thackeray, M.M. Advances in stabilizing ‘layered-layered’ xLi2MnO3 · (1-x)LiMO2 (M = Mn, Ni, Co) electrodes with a spinel component. J. Electrochem. Soc. 2014, 161, A2160. [Google Scholar] [CrossRef]
- Mohanty, D.; Kalnaus, S.; Meisner, R.A.; Rhodes, K.J.; Li, J.; Payzant, E.A.; Wood, D.L., III; Daniel, C. Structural transformation of a lithium-rich Li1.2Co0.1Mn0.55Ni0.15O2 cathode during high voltage cycling resolved by in situ X-ray diffraction. J. Power Sources 2013, 229, 239. [Google Scholar] [CrossRef]
- Erickson, E.M.; Schipper, F.; Penki, T.R.; Shin, J.-Y.; Erk, C.; Chesneau, F.-F.; Markovsky, B.; Aurbach, D. Review-recent advances and remaining challenges for lithium ion battery cathodes II. Lithium-rich, xLi2MnO3.(1-x)LiNiaCobMncO2. J. Electrochem. Soc. 2017, 164, A6341. [Google Scholar] [CrossRef]
- Shi, J.-L.; Zhang, J.-N.; He, M.; Zhang, X.-D.; Yin, Y.-X.; Li, H.; Guo, Y.-G.; Gu, L.; Wan, L.-J. Mitigating Voltage Decay of Li-Rich Cathode Material via Increasing Ni Content for Lithium-Ion Batteries. ACS Appl. Mater. Interfaces 2016, 8, 20138–20146. [Google Scholar] [CrossRef]
- Abdel-Ghany, A.; Hashem, A.M.; Mauger, A.; Julien, C.M. Lithium-Rich Cobalt-Free Manganese-Based Layered Cathode Materials for Li-Ion Batteries: Suppressing the Voltage Fading. Energies 2020, 13, 3487. [Google Scholar] [CrossRef]
- Zhou, S.; Mei, T.; Li, J.; Pi, W.; Wang, J.; Li, J.; Wang, X. Hierarchical LiNi0.5Mn1.5O4 micro-rods with enhanced rate performance for lithium-ion batteries. J. Mater. Sci. 2018, 53, 9710. [Google Scholar] [CrossRef]
- Cui, S.-L.; Wang, Y.-Y.; Liu, S.; Li, G.-R.; Gao, X.-P. Evolution mechanism of phase transformation of Li-rich cathode materials in cycling. Electrochimica Acta 2019, 328, 135109. [Google Scholar] [CrossRef]
- Geder, J.; Song, J.H.; Kang, S.H.; Yu, D.Y. Thermal stability of lithium-rich manganese-based cathode. Solid State Ionics 2014, 268, 242–246. [Google Scholar] [CrossRef]
- Chong, S.; Liu, Y.; Yan, W.; Chen, Y. Effect of valence states of Ni and Mn on the structural and electrochemical properties of Li1.2NixMn0.8-xO2 cathode materials for lithium-ion batteries. RSC Adv. 2016, 6, 53662. [Google Scholar] [CrossRef]


| Samples | R-3m Phase | Fd3m Spinel Phase | ||||
|---|---|---|---|---|---|---|
| a (Å) | c (Å) | Vol (Å^3) | TM Mixing | a (Å) | Vol (Å^3) | |
| LLC−12 | 2.8537 | 14.293 | 100.80 | <0.1% | 8.1906 | 549.47 |
| LLC−18 | 2.8584 | 14.280 | 101.04 | 1.5% | 8.1948 | 550.31 |
| LLC−24 | 2.8672 | 14.273 | 101.62 | 3.2% | Not observed | |
| LLC−30 | 2.8721 | 14.290 | 102.09 | 4.3% | Not observed | |
| LLC−36 | 2.8682 | 14.268 | 101.65 | 3.2% | Not observed | |
| Samples | Composition Measured (%) | Theoretic Composition (%) | ||||
|---|---|---|---|---|---|---|
| Li | Ni | Mn | Li | Ni | Mn | |
| LLC−12 | 9.78 | 7.88 | 44.2 | 9.83 | 8.3 | 44.1 |
| LLC−18 | 9.84 | 12.3 | 41.6 | 9.80 | 12.4 | 40.1 |
| LLC−24 | 9.47 | 15.9 | 40.1 | 9.78 | 16.5 | 36.1 |
| LLC−30 | 9.35 | 21.6 | 33.1 | 9.75 | 20.6 | 32.2 |
| LLC−36 | 9.62 | 25.7 | 29.6 | 9.73 | 24.7 | 28.2 |
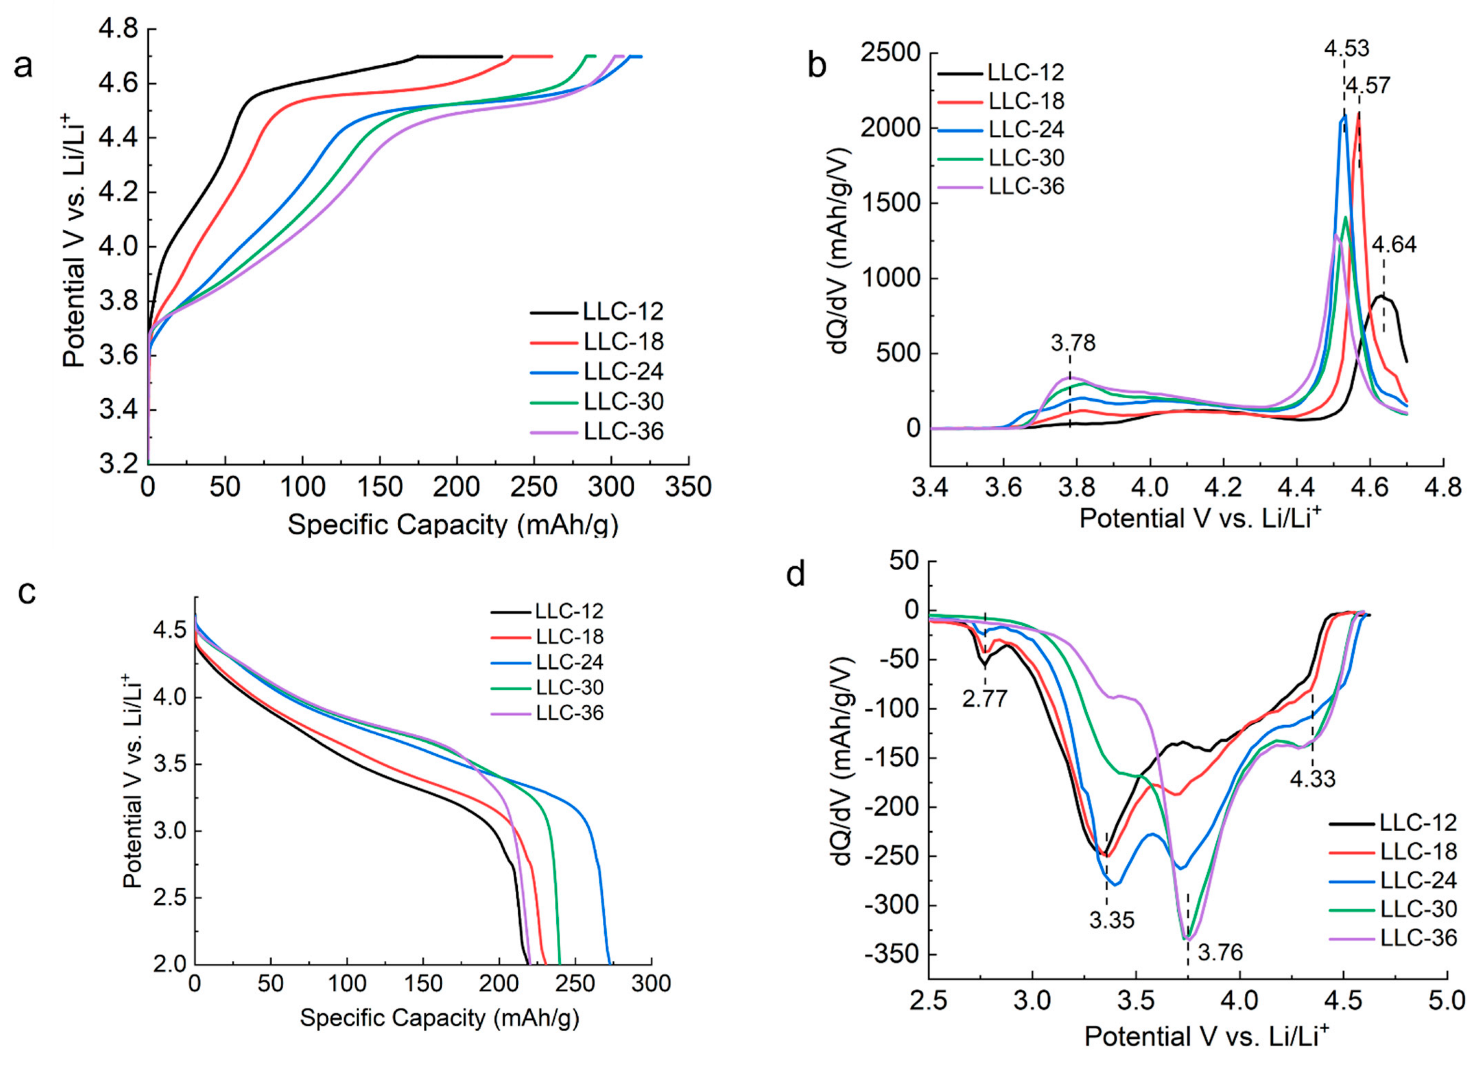
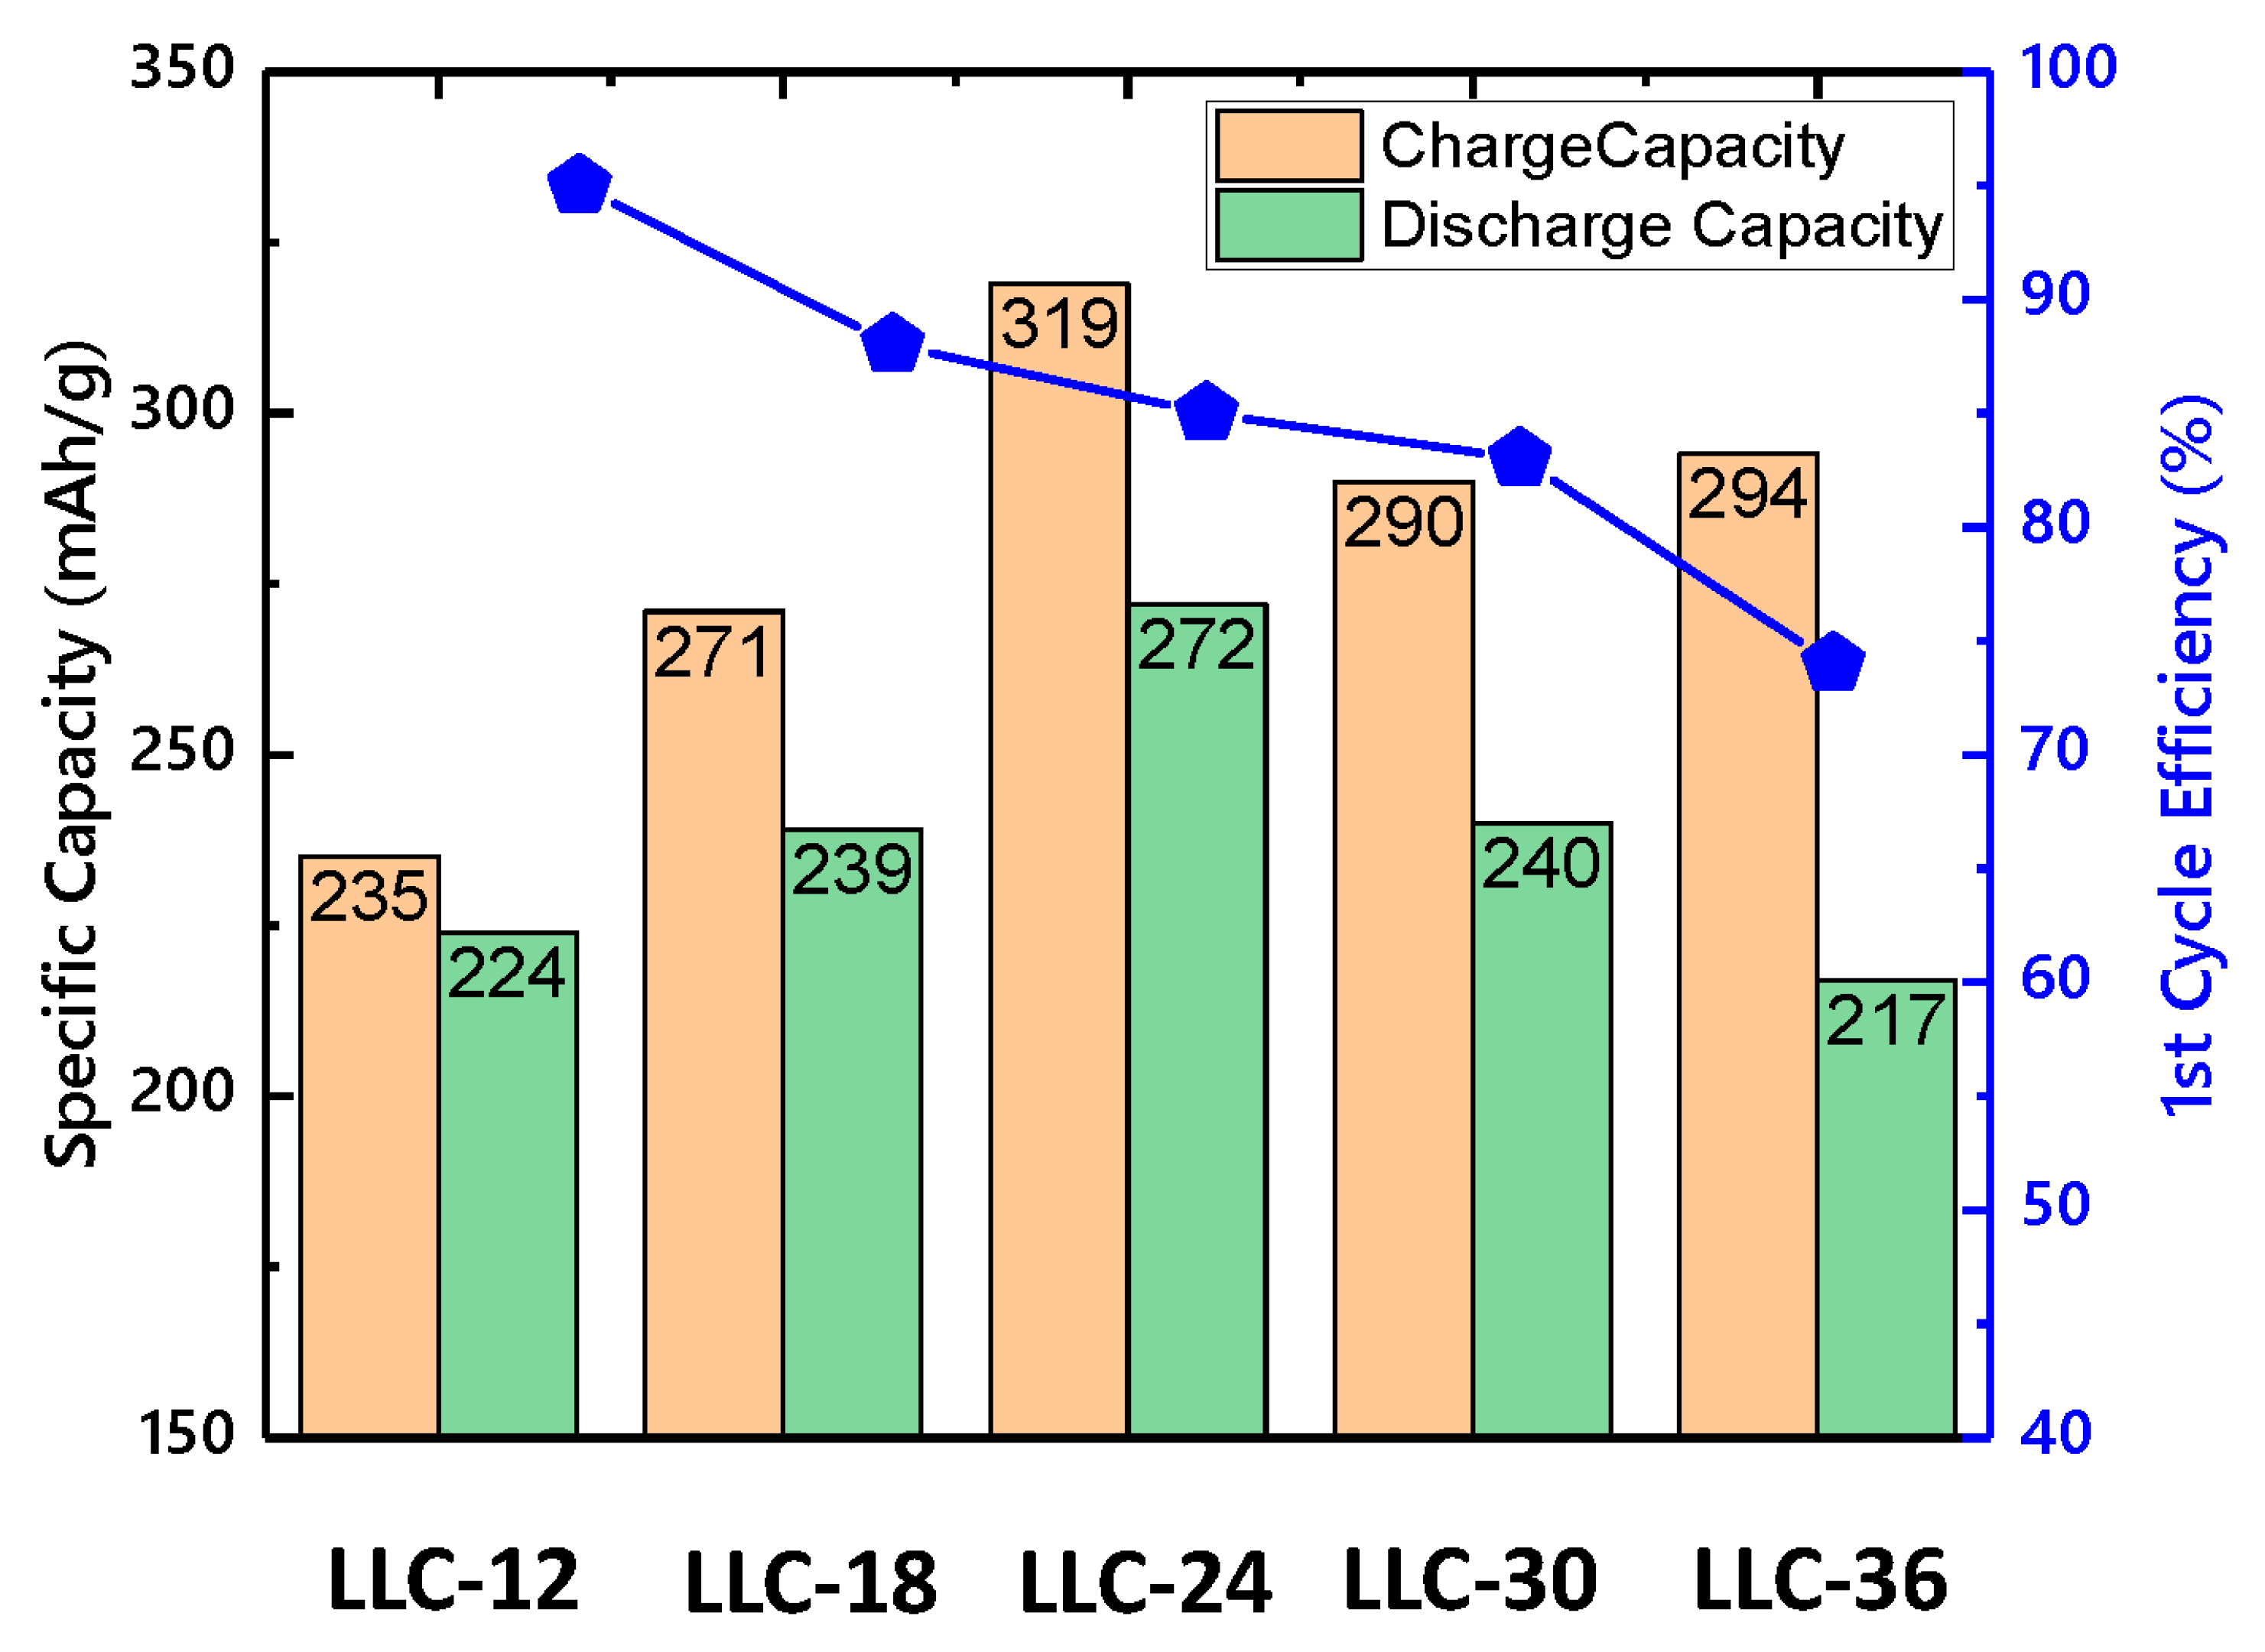
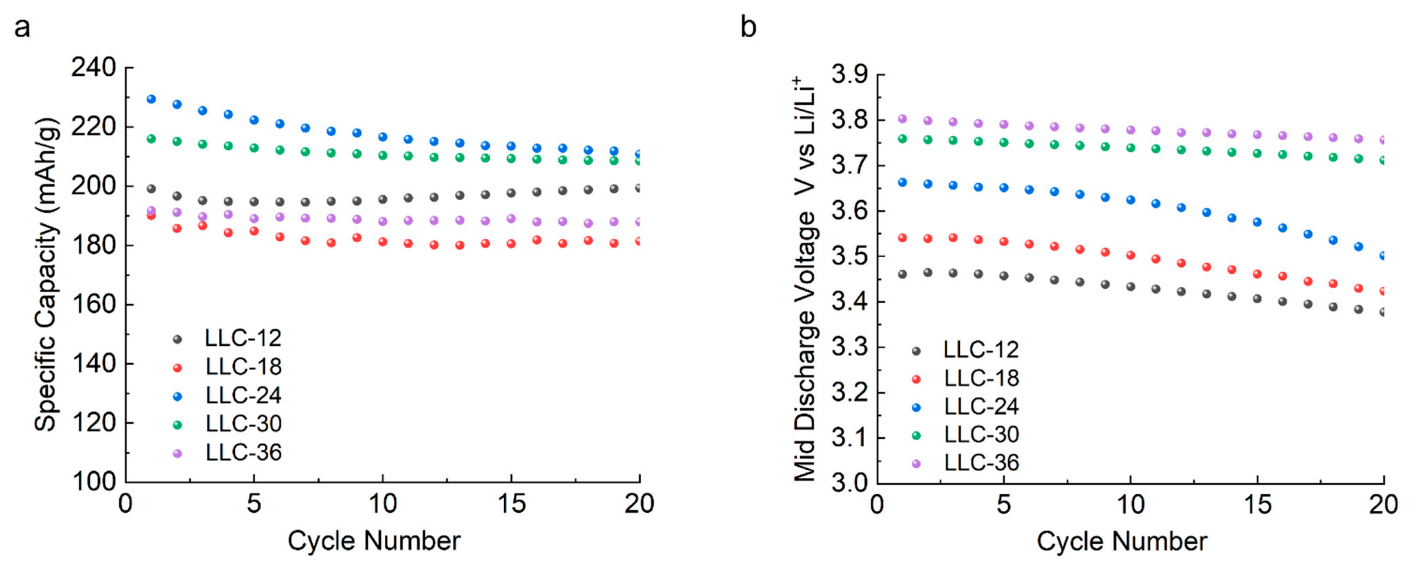
| Samples | 1st Cycle Specific Charging Capacities from Ni2+ Oxidation (mAh/g) | 1st Cycle Specific Charging Capacities from Li2MnO3 (mAh/g) | 1st Cycle Total Specific Charging Capacities (mAh/g) | 1st Cycle Specific Discharging Capacities (mAh/g) | 1st Cycle Coulombic Efficiencies (%) | Specific Discharging Capacities (mAh/g) after 20th Cycle |
|---|---|---|---|---|---|---|
| LLC−12 | 61 | 174 | 235 | 224 | 95.3 | 191 |
| LLC−18 | 87 | 184 | 271 | 239 | 88.2 | 181 |
| LLC−24 | 158 | 161 | 319 | 272 | 85.2 | 210 |
| LLC−30 | 172 | 118 | 290 | 240 | 82.8 | 208 |
| LLC−36 | 210 | 84 | 294 | 217 | 73.8 | 187 |
| Samples | 1st Exothermic Peak Temperature/°C | 2nd Exothermic Peak Temperature/°C | Total Heat Released (J/mg) |
|---|---|---|---|
| LLC−12 | 345 | 422 | 0.89 |
| LLC−18 | 320 | 406 | 1.11 |
| LLC−24 | 294 | 381/427 | 1.77 |
| LLC−30 | 314 | 391 | 1.14 |
| LLC−36 | 280 | 351/422 | 1.23 |
Disclaimer/Publisher’s Note: The statements, opinions and data contained in all publications are solely those of the individual author(s) and contributor(s) and not of MDPI and/or the editor(s). MDPI and/or the editor(s) disclaim responsibility for any injury to people or property resulting from any ideas, methods, instructions or products referred to in the content. |
© 2023 by the authors. Licensee MDPI, Basel, Switzerland. This article is an open access article distributed under the terms and conditions of the Creative Commons Attribution (CC BY) license (https://creativecommons.org/licenses/by/4.0/).
Share and Cite
Qi, G.; Hu, J.; Balogh, M.; Wang, L.; Darbar, D.; Li, W. Impact of Ni Content on the Electrochemical Performance of the Co-Free, Li and Mn-Rich Layered Cathode Materials. Electrochem 2023, 4, 21-30. https://doi.org/10.3390/electrochem4010002
Qi G, Hu J, Balogh M, Wang L, Darbar D, Li W. Impact of Ni Content on the Electrochemical Performance of the Co-Free, Li and Mn-Rich Layered Cathode Materials. Electrochem. 2023; 4(1):21-30. https://doi.org/10.3390/electrochem4010002
Chicago/Turabian StyleQi, Gongshin, Jiazhi Hu, Michael Balogh, Lei Wang, Devendrasinh Darbar, and Wei Li. 2023. "Impact of Ni Content on the Electrochemical Performance of the Co-Free, Li and Mn-Rich Layered Cathode Materials" Electrochem 4, no. 1: 21-30. https://doi.org/10.3390/electrochem4010002