Article

Separation Process of Biodiesel-Product Mixture from Crude Glycerol and Other Contaminants Using Electrically Driven Separation Technique with AC High Voltage

by
Rossarin Ampairojanawong
1,
Ajalaya Boripun
1,
Sayan Ruankon
2,
Thanapong Suwanasri
2,
Kraipat Cheenkachorn
3 and
Tawiwan Kangsadan
1,*
1
Chemical and Process Engineering Program, The Sirindhorn International Thai-German Graduate School of Engineering (TGGS), King Mongkut’s University of Technology North Bangkok (KMUTNB), 1518 Pracharat 1 Road, Bangsue District, Bangkok 10800, Thailand
2
Electrical Power and Energy Engineering Program, The Sirindhorn International Thai-German Graduate School of Engineering (TGGS), King Mongkut’s University of Technology North Bangkok (KMUTNB), 1518 Pracharat 1 Road, Bangsue District, Bangkok 10800, Thailand
3
Department of Chemical Engineering, Faculty of Engineering, King Mongkut’s University of Technology North Bangkok (KMUTNB), 1518 Pracharat 1 Road, Bangsue District, Bangkok 10800, Thailand
*
Author to whom correspondence should be addressed.
Electrochem 2023, 4(1), 123-144; https://doi.org/10.3390/electrochem4010011
Submission received: 3 February 2023 / Revised: 9 March 2023 / Accepted: 13 March 2023 / Published: 21 March 2023

Abstract

:
Electrically driven separation (EDS) technology with a high voltage (HV) alternating current source (AC) was used to remove glycerol and other contaminants from biodiesel in order to meet the ASTM D6751 and EN 14214 standards. Biodiesel was produced from a transesterification of refined palm oil and methanol using sodium methylate as a homogeneous catalyst. The effects of an Iron (Fe) electrode, including types of electrode configurations, vertical distance between electrodes, applied voltage, and separation time, were studied. Furthermore, the effects of the remaining catalyst and soap content in biodiesel phase were also investigated to improve the separating performance using the EDS technique. The EDS using HVAC and low amperage with a point-to-point electrode configuration showed the highest separation efficiency of 99.8%. The optimum vertical distance between electrodes was 3 cm, while the optimum applied voltage was 3 kV. The separation time of 240 s yielded the best separating performance, completely eliminating the unreacted catalyst, and the lowest of the normalized remaining soap value content was obtained. Considering all of this, the EDS technique had higher efficiency to remove glycerol and other contaminants than a conventional separation of gravitation settling. The final biodiesel product was produced with the high purity of 98.0 wt% after purification and met all standard specifications.

1. Introduction

Biodiesel is a proven alternative diesel fuel consisting of the alkyl monoesters of fatty acids from sustainable natural feedstocks, such as vegetable oils (e.g., palm oil, soybean, coconut oil, rapeseed oil), animal fats, and waste cooking oils. It is one of the renewable energy sources that has gained interest worldwide because it can replace diesel fuel in engines without modification, and in some cases, it can even be blended with diesel fuel, and still be qualified for use in diesel engines. It also shows advantages over conventional diesel in terms of its easier biodegradability, lower toxicity, and fewer pollutant emissions (such as SOx, HC, PM, COx, and smokiness) [1]. Commercially, biodiesel is produced via a transesterification of triglycerides and short-chain alcohol (e.g., methanol or ethanol) in the presence of homogenous alkali-catalysts at low temperature and pressure to yield up to 98% conversion [1,2,3]. The transesterification of biodiesel production is known to follow a three-step reaction mechanism, which is shown in Figure 1. The reactions start with the conversion of triglyceride (TG) to diglyceride (DG), then to monoglyceride (MG) and finally to Alkyl Ester and glycerol (GL). In each step, the reaction requires one mole of alcohol to produce one mole of alkyl ester. In general, the overall reaction (Figure 2) shows that, corresponding to the stoichiometric ratio, it requires 1 mol of oil to react with 3 mol of alcohol, to obtain 3 mol of alkyl esters and 1 mol of glycerol as a by-product. Since this reaction is reversible, it must be exploited to drive the reaction forward to completion. According to Le Chatelier’s principle [4], there are several ways to increase the conversion by overcoming the equilibrium limitation. These include an excess of alcohol [5], removing one of the products (or by-products) or reactants [6] from the reaction mixture to shift the equilibrium to the product side, and increasing the temperature of the reaction system [7].
After the completion of the reaction, the product mixture contains mainly unpurified biodiesel and various impurities such as crude glycerol or free glycerol, unreacted methanol, remaining catalyst, total glycerol (i.e., unreacted triglyceride (TG), diglyceride (DG) and monoglyceride (MG)), as well as small amounts of soap and traces of water. Therefore, it is necessary to remove these impurities, especially free glycerol, and total glycerol, as these compounds affect the quality of the final biodiesel product and cause problems during storage by forming gums and deposits. In addition, the remaining impurities can affect combustion, cause corrosion, and the quality of the fuel is so poor that it cannot be burned effectively in diesel engines and damages the fuel filter. The maximum values for free glycerol and total glycerol according to ASTM D6751 and EN 14214 are 0.02% mass and 0.25% mass, respectively. Since the difference in the density of biodiesel and glycerol is significant [8], gravitational settling is commonly used as a separation method (conventional separation process). The biodiesel mixture is allowed to cool down at room temperature and settle in the settling tank. The dispersion of polar solvents, including crude glycerol, unreacted methanol and any remaining catalyst, settles at the bottom, while the non-polar solvent of oil with ester-rich phase forms the upper layer. However, this process takes a long time to separate biodiesel from other products and impurities, and the long settling time leads to a reverse reaction, resulting in a decrease in product yield.
To meet the standard requirements, the additional purification of the biodiesel by warm-water washing is necessary. Nevertheless, water washing has drawbacks because it is a time-consuming process for settling biodiesel from water in order to achieve complete separation. Large amounts of water are consumed for the process. Consequently, this method creates the controversial topic of wastewater treatment and environmental sustainability. Moreover, water washing must eventually be followed by an evaporation process at a high temperature in order to remove the remaining water during the biodiesel phase, resulting in high capital and operation costs. In addition, the biodiesel is neutralized with acidified water to eliminate soap, free glycerol, and catalyst residue. Common acids used in this method include hydrochloric acid (HCl), phosphoric acid (H3PO4), and citric acid (C6H8O7) [9,10,11,12,13]. This neutralization method can lead to remaining acid, where it is possible to obtain a total acid number higher than the maximum limit of EN 14214 (the maximum value of 0.5 mg KOH/g) [14]. It also leads to environmental issues in terms of wastewater generation. It is challenging to investigate a separation process that is effective and less environmentally damaging.
The electrically driven separation (EDS) process has been widely used for a variety of separation multi-components, emulsion solvents, and treatment wastewater. This application is an efficient technique because it can also remove various small colloidal particles from aqueous media, which charge and neutralize the ion small particles with the aggregation of tiny, destabilized particles by applying an electric current to form the massive particles into larger groupings of enough density to be settled out under the force of gravity. The EDS operation modes include low voltage, high direct current (DC), high voltage, low alternating current (AC), and pulse mode of DC or AC. Previous studies [15,16,17,18,19] have shown that the overall separation efficiency of AC and DC was comparable. Vasudevan et al. (2011) investigated the effect of AC and DC in the electrocoagulation process on the removal of cadmium from wastewater, and showed that AC was preferred due to a shorter separation time, high removal efficiency, effective energy consumption, and low corrosion rate of electrodes. Cerqueira et al. [17] applied the electroflocculation application for oily water separation and found that AC was suitable for this system with impressive removal efficiency in terms of color and turbidity. However, the major drawback of DC voltage is that the formation of an oxide film during electrolysis can lead to metal passivation, which decreases ionic transfer and separation efficiency. Meanwhile, the AC system can prevent electrode passivation and show a more effective lowering of energy consumption than the DC system. Therefore, the AC mode is preferred for application in the EDS process.
The concept and mechanism of electrical separation, called electrocoagulation (EC) or electroflotation (EF), has been applied with high current density to enhance the dissolution of metal ions from the oxidized metal anode by increasing the cumulative charge, resulting in the accumulation of floating ions or solids such as free metals, suspended waste or dissolved particles in liquid phase. The size of the coagulated particles then grows and is continuously separated from another phase by precipitation and subsequent floating on the surface by rising electro-generated hydrogen bubbles at the cathode. This process could achieve a recovery efficiency of more than 80% [20,21,22].
Moreover, the electrocoagulation behavior could be influenced by applying the electrical field as described in five steps (Figure 3): (1) compression of the diffuse double layer with an increase of the ionic strength, (2) drops approaching each other and neutralization by adsorption of charge ions, (3) precipitation charge neutralization, (4) linking of bridging drops, and finally (5) the formation of large settable by agglomerated small drops being prompted for precipitation as enmeshment (flocs formation) [23]. Other mechanisms that relate to the electrical separation are electrocoalescence, the chain formation of drops, the formation of intermolecular bonds, dipole–dipole interaction (DDI), dipole–induced-dipole interaction (DID), electrohydrodynamic, electrophoresis, dielectrophoresis, and random collision electrolytic refining [24,25].
In addition, many studies have explained the phenomena of ions and molecules under the influence of the electrical field, especially between the gap of point and plate electrodes, by dividing the gap between the electrodes into three regions consisting of the ionization region, the plasma or attachment region and the unipolar drift region [26,27,28], as illustrated in Figure 4. At the beginning of the discharge from the point electrode in the ionization region, the electrons move close to the positive point electrode, while the positive ions move away from the point electrode due to electrostatic repulsion. Then, the electrons collide with the neutral molecule under the action of a strong electric field. The neutral molecules are ionized into positive ions and electrons, then the positive ions move towards the opposite side of the negative electrode under the action of a strong electric field. The number of electrons increases significantly in a noticeably short time as the external current density considerably increases [29]. This phenomenon is called an electronic avalanche. Later, the high electric field region is formed as an ion-sphere near the point electrode. Once the electrons in this region are accelerated and reach sufficient energy, they can collide with the neutral molecules and detach (separate) another electron as a result of generated ionization. The neutral molecules are ionized into positive ions and electrons. Then, positive ions and electrons are produced, whose movement depends on the polarity of the point electrode. In the case of the negative electrode, the positive ions move toward the negative point electrode and the electrons continue to ionize other neutral molecules. When the electrons finally leave the high electric field region, their energy is insufficient to ionize more molecules. Subsequently, the electrons enter the plasma region with insufficient energy. The electric field in the plasma region cannot provide enough energy for the electrons to complete the ionization process. As a result, the electrons combine with the neutral molecules and form negative ions in the plasma region, which are then transported into the drift region and approach the ground electrode. The electrons flow naturally from the high potential to the low potential. It can be concluded that there are two regions between the gap of the electrodes, which can be referred to as the high electric field ionization region and the low electric field drift region or unipolar drift region [30].
Therefore, it can be assumed that the efficiency of energy and ion transfer to the discharge gap increases when the gap distance between two electrodes is further reduced. Moreover, a large number of ions are generated due to the greater ionization with the short discharge gap [31]. Since the discharge under the action of a high electric field, possibly with a non-uniform field, depends on many parameters, such as electrode configurations, electrode geometries, material of the electrode, applied voltage, type of current flow (AC [32,33] and DC [34,35]), gap distance between electrodes and the polarity of the applied potential difference, which may be positive and negative, it would be worthwhile to deepen the understanding of this phenomena.
Although EDS finds an application in wastewater treatment, especially for removal of heavy metal from polluted water, because of its various advantages such as high efficiency, low cost, simple techniques, no chemical addition, short separation time, etc., the application of EDS in biodiesel–glycerol separation has been rarely investigated. Abbaszadeh et al. [11,23] applied EDS for the separation of crude glycerin from biodiesel. Still, the results were not fully explained. Therefore, the full investigation of the EDS application for biodiesel separation should be studied in detail.
The application of the EDS process can accelerate the destabilization and coagulation of a natural, organic or multi-component mixture through induced droplets. According to the aforementioned concept of discharge between two electrodes, the partial discharge can be generated by applying a high electrical voltage with non-uniform electric stress of a small radius of curvature or sharp electrode. This can increase the surface charge of the droplets, allowing them to coalescence and separating glycerol and other impurities from the biodiesel phase faster and more easily. Therefore, the application of EDS for biodiesel production offers a lot of benefits compared to the conventional separation process. The main objectives of the present study were to study biodiesel–glycerol separation using the EDS technique, applying high voltage alternating current (HV-AC) and low ampere by varying factors, including the type of electrode arrangements, the distance (gap) between the electrodes, and applying high voltage (kV). Moreover, the effects of the remaining catalyst and soap before purification were investigated, which were reported to have normalized concentration value. The final product after the purification of biodiesel (B100) was also studied in order to perform according to ASTM D6751 and EN 14214 standards.

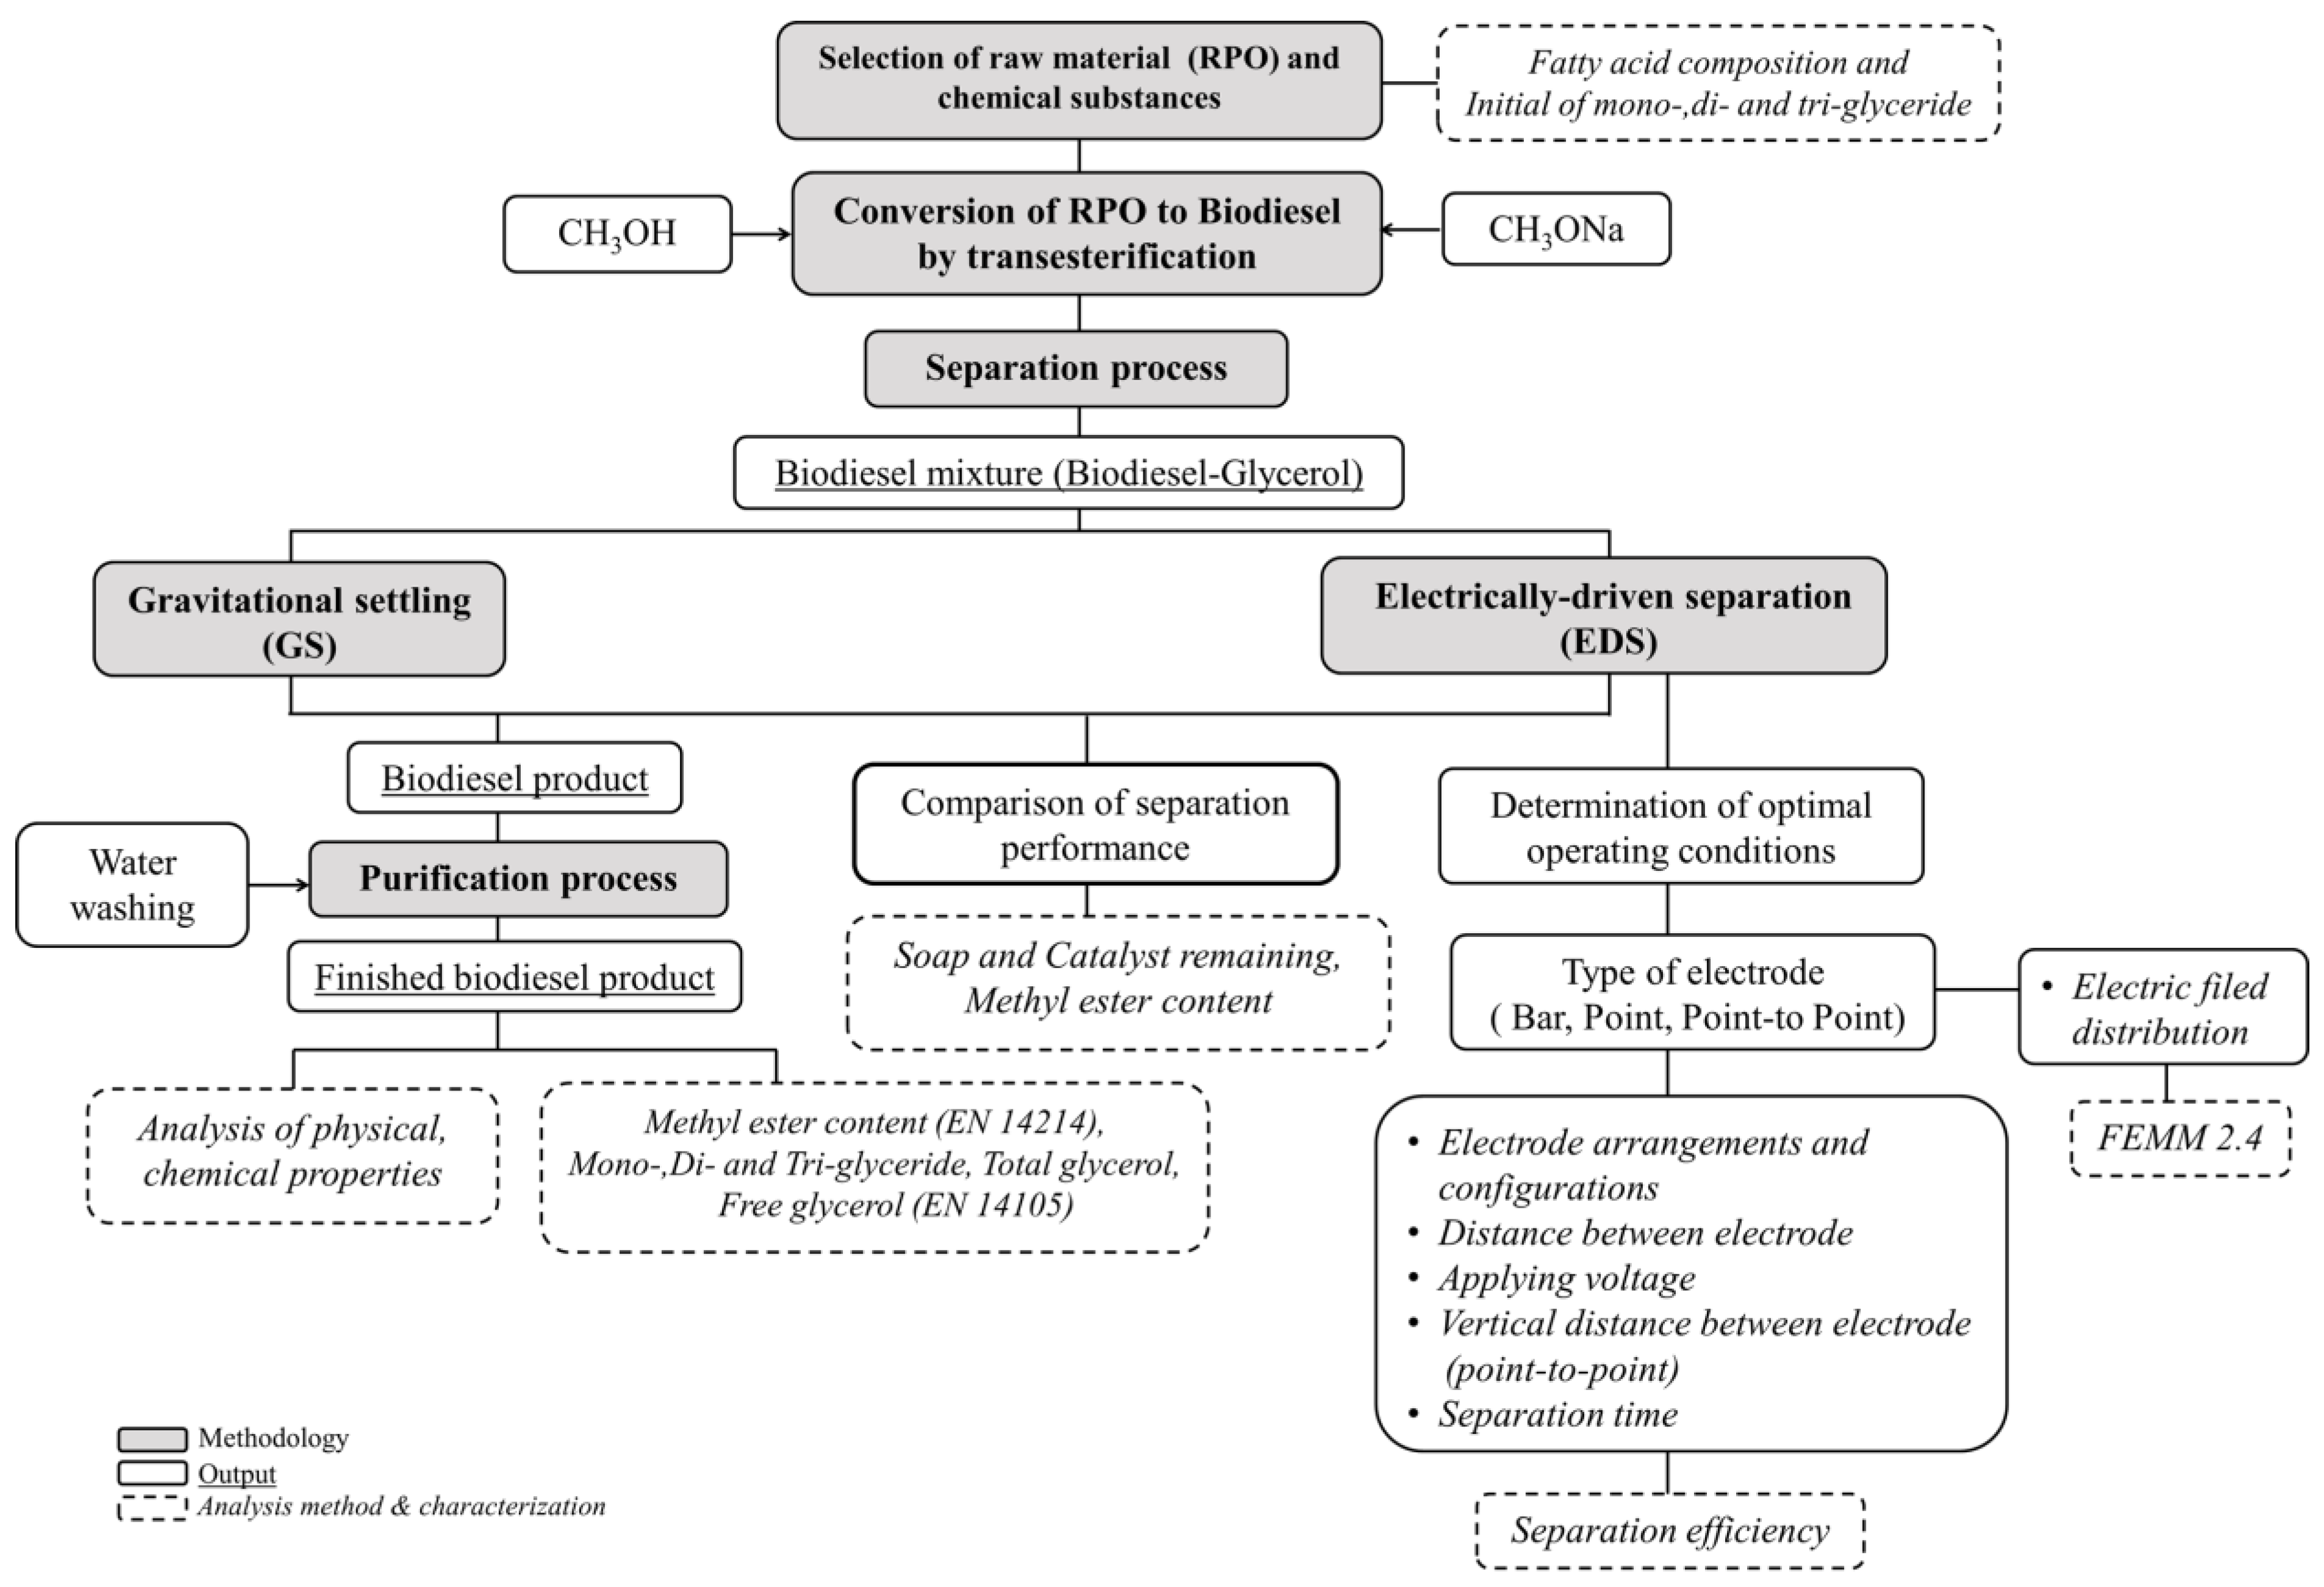
2. Materials and Methods

The experimental procedure starts with the transesterification reaction to produce biodiesel from refined palm oil via conventional heating, followed by a separation process, a purification process, and analysis of the product. After transesterification, crude glycerol is formed and must be separated from the biodiesel. Glycerol removal results were compared between electrically driven separation (EDS) and conventional separation of gravitational settling (GS). The separation efficiency of both separation processes was investigated in terms of soap and catalyst remaining in the biodiesel phase. Finally, the final biodiesel product was analyzed for the purity in terms of methyl ester content (%wt), mono-, di- and tri-glyceride content, and free and total glycerol according to the standard EN14103 and EN 14105. The interrelated research activities are summarized and illustrated in Figure 5.

2.1. Raw Material and Catalyst for Biodiesel Production

Refined palm oil (RPO) and sodium methylate, which were used as a raw material and a catalyst, respectively, for a transesterification reaction, were obtained from a non-disclosure local biodiesel producer in Thailand. The fatty acid composition of RPO was composed of a total saturated fatty acid content of 49.87%, a monounsaturated fatty acid of 40.90%, and a polyunsaturated fatty acid content of 9.34%, as shown in Table 1. The unsaturated fatty acid as palmitic acid was observed to be the main component of RPO. The initial compositions of Triacylglycerol (TAG) or Triglyceride (TG), Diacylglycerols or Diglyceride (DG) and monoacylglycerols or monoglyceride (MG) in RPO were 93.70 ± 0.54, 6.22 ± 0.65 and 0.08 ± 0.05 wt%, respectively. A commercial-grade methanol and sodium methylate were purchased from a local chemical supplier (RCI Labscan Co., Ltd., Bangkok, Thailand).

2.2. Chemical Analysis

According to EN 14105 [36], glycerin, monoolein, diolein, triolein, 1,2,4-Butanetriol (internal standard No. 1), and tricaprin (internal standard No. 2), and N-methyl-N-trimethylsilytrifluoroacetamide (MSTFA; derivatization agent) were used as chemicals for the fatty acid composition, including mono-, di-, tri-glycerides, and free glycerol and total glycerol of biodiesel analysis. These chemicals were obtained from Sigma-Aldrich Chemicals Company (Singapore). EN 14103 [37] was followed to analyze the percentage of methyl ester content using methyl heptadecanoate (C17:0) (Sigma-Aldrich Chemicals Company, Singapore) as a standard and analytical grade n-heptane (RCI Labscan Co., Ltd., Bangkok, Thailand) as a solvent. The chemicals of titration for soap and the remaining catalyst content, consisting of hydrochloric acid (HCl), potassium hydroxide (KOH), acetone, ethanol, isopropanol, and indicators (bromophenol blue and phenolphthalein), were purchased from RCI Labscan Co., Ltd., Bangkok, Thailand.

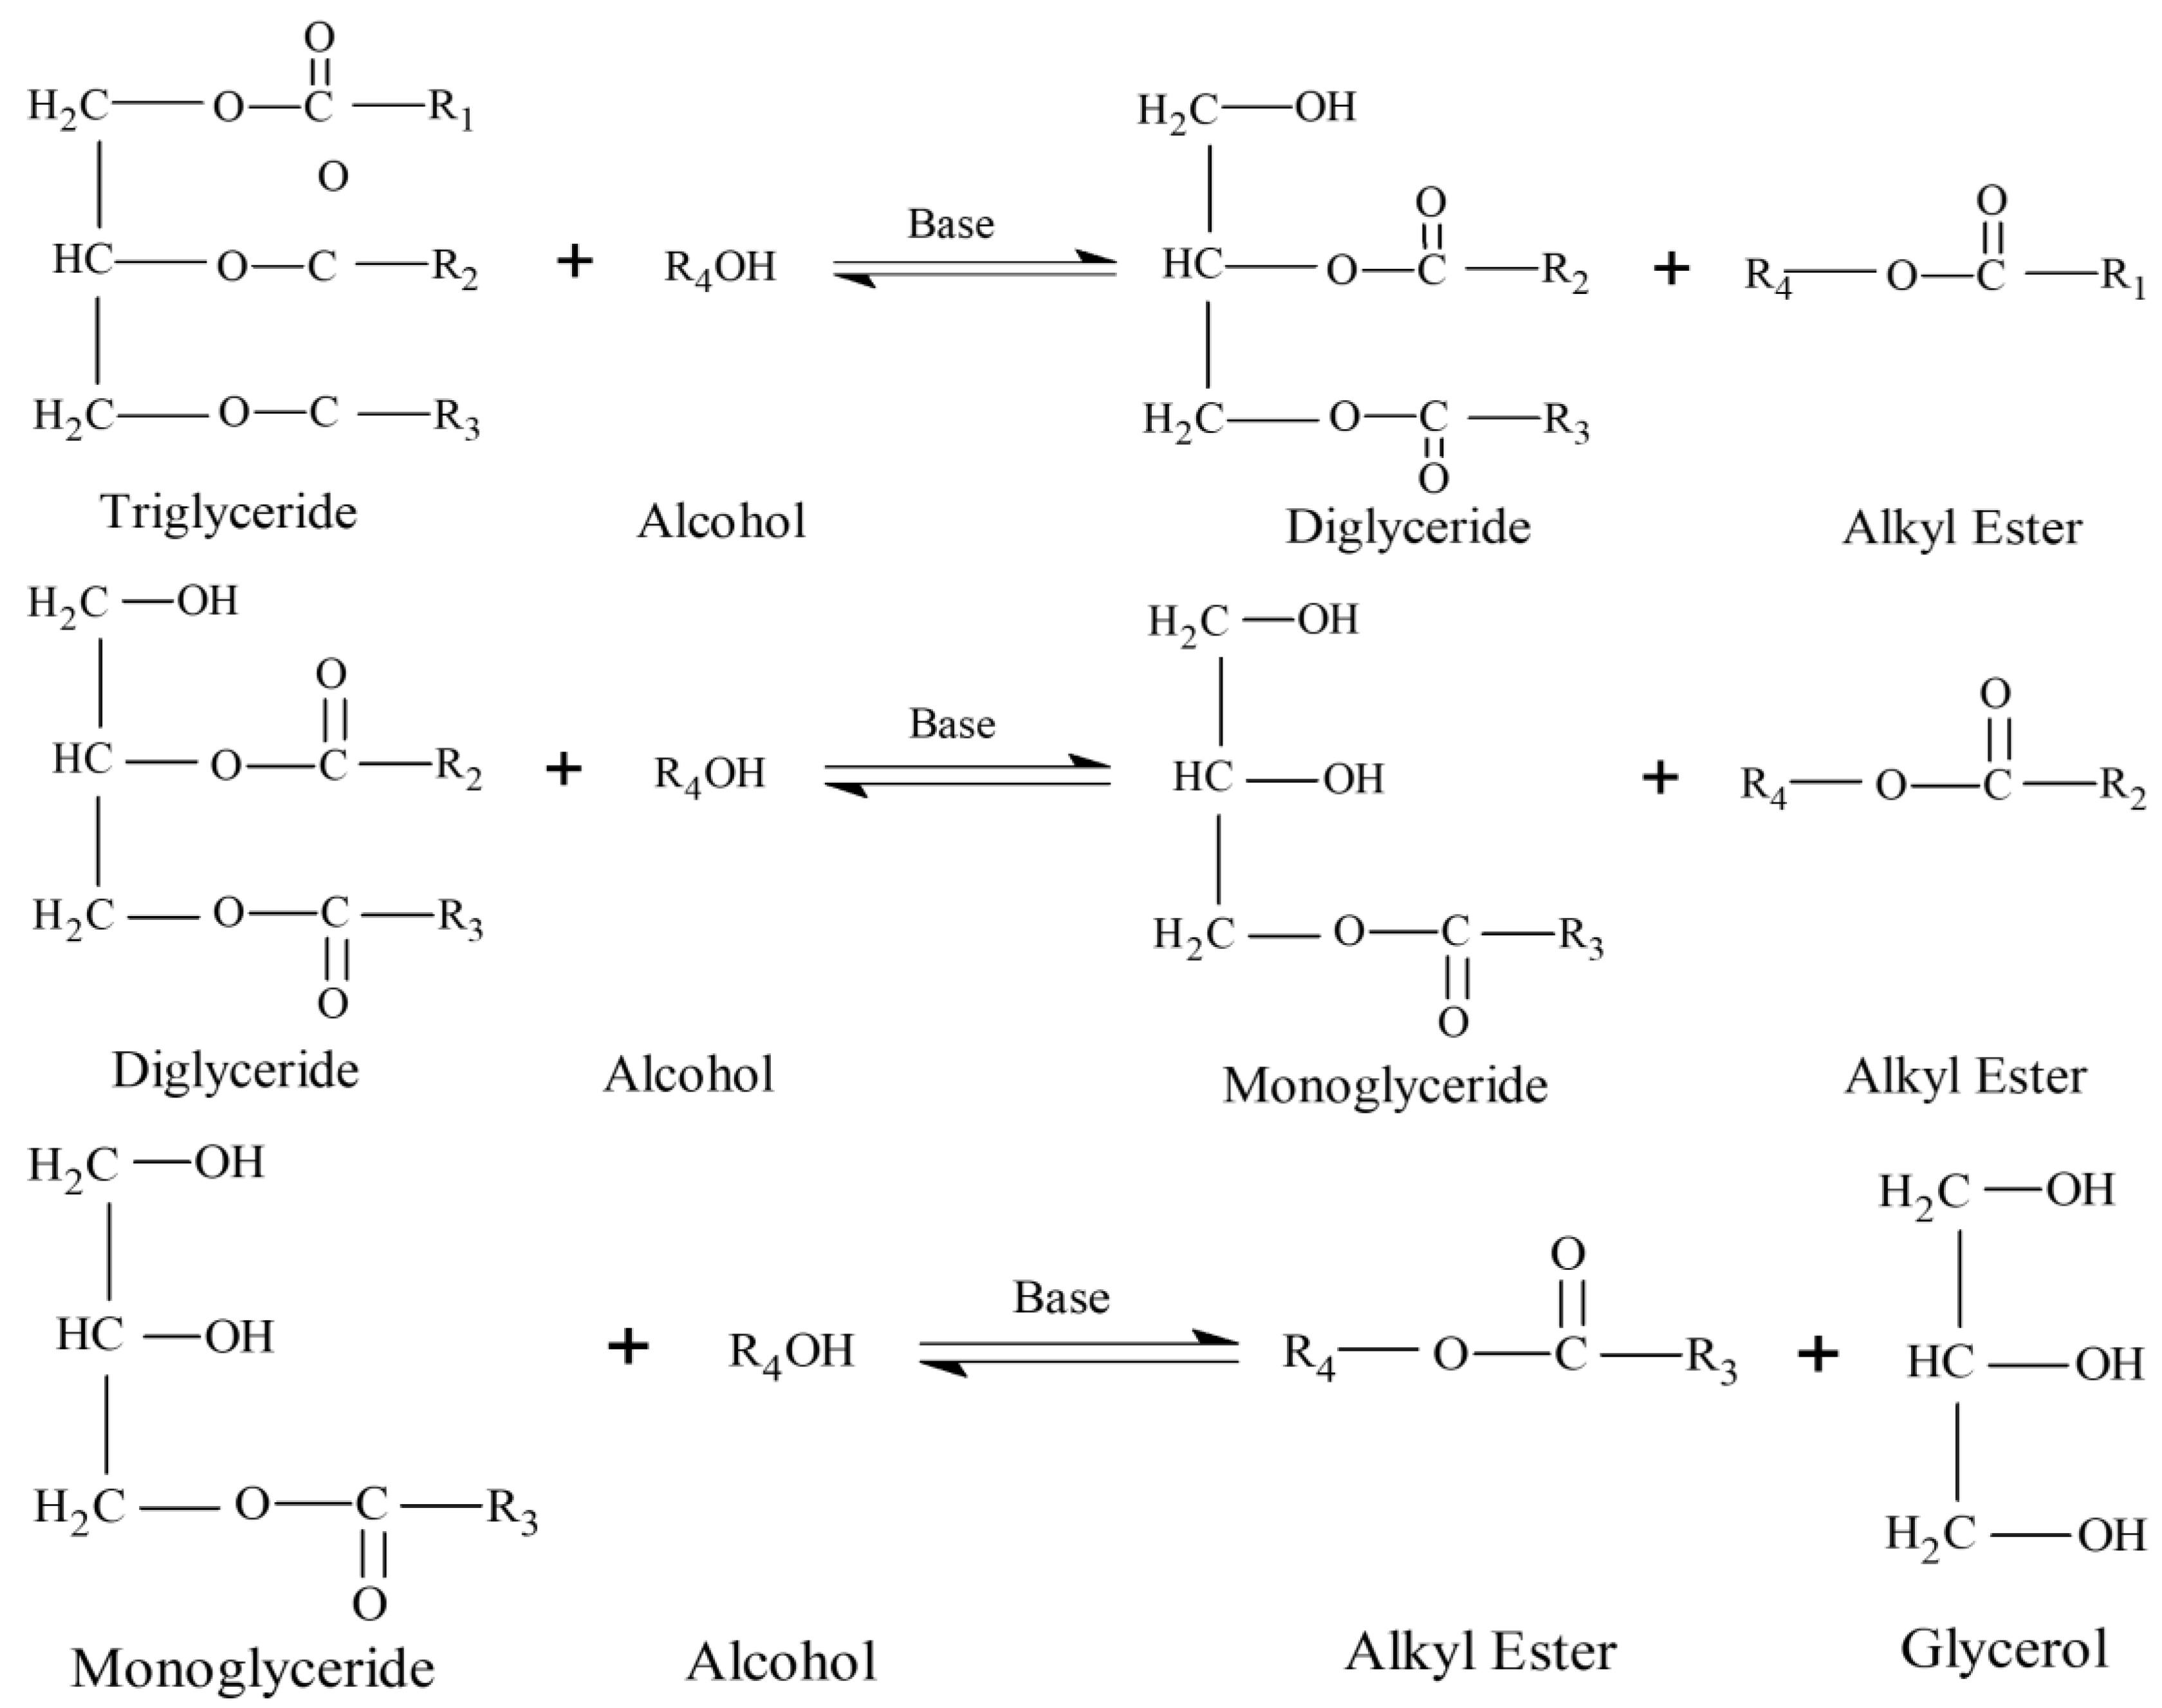
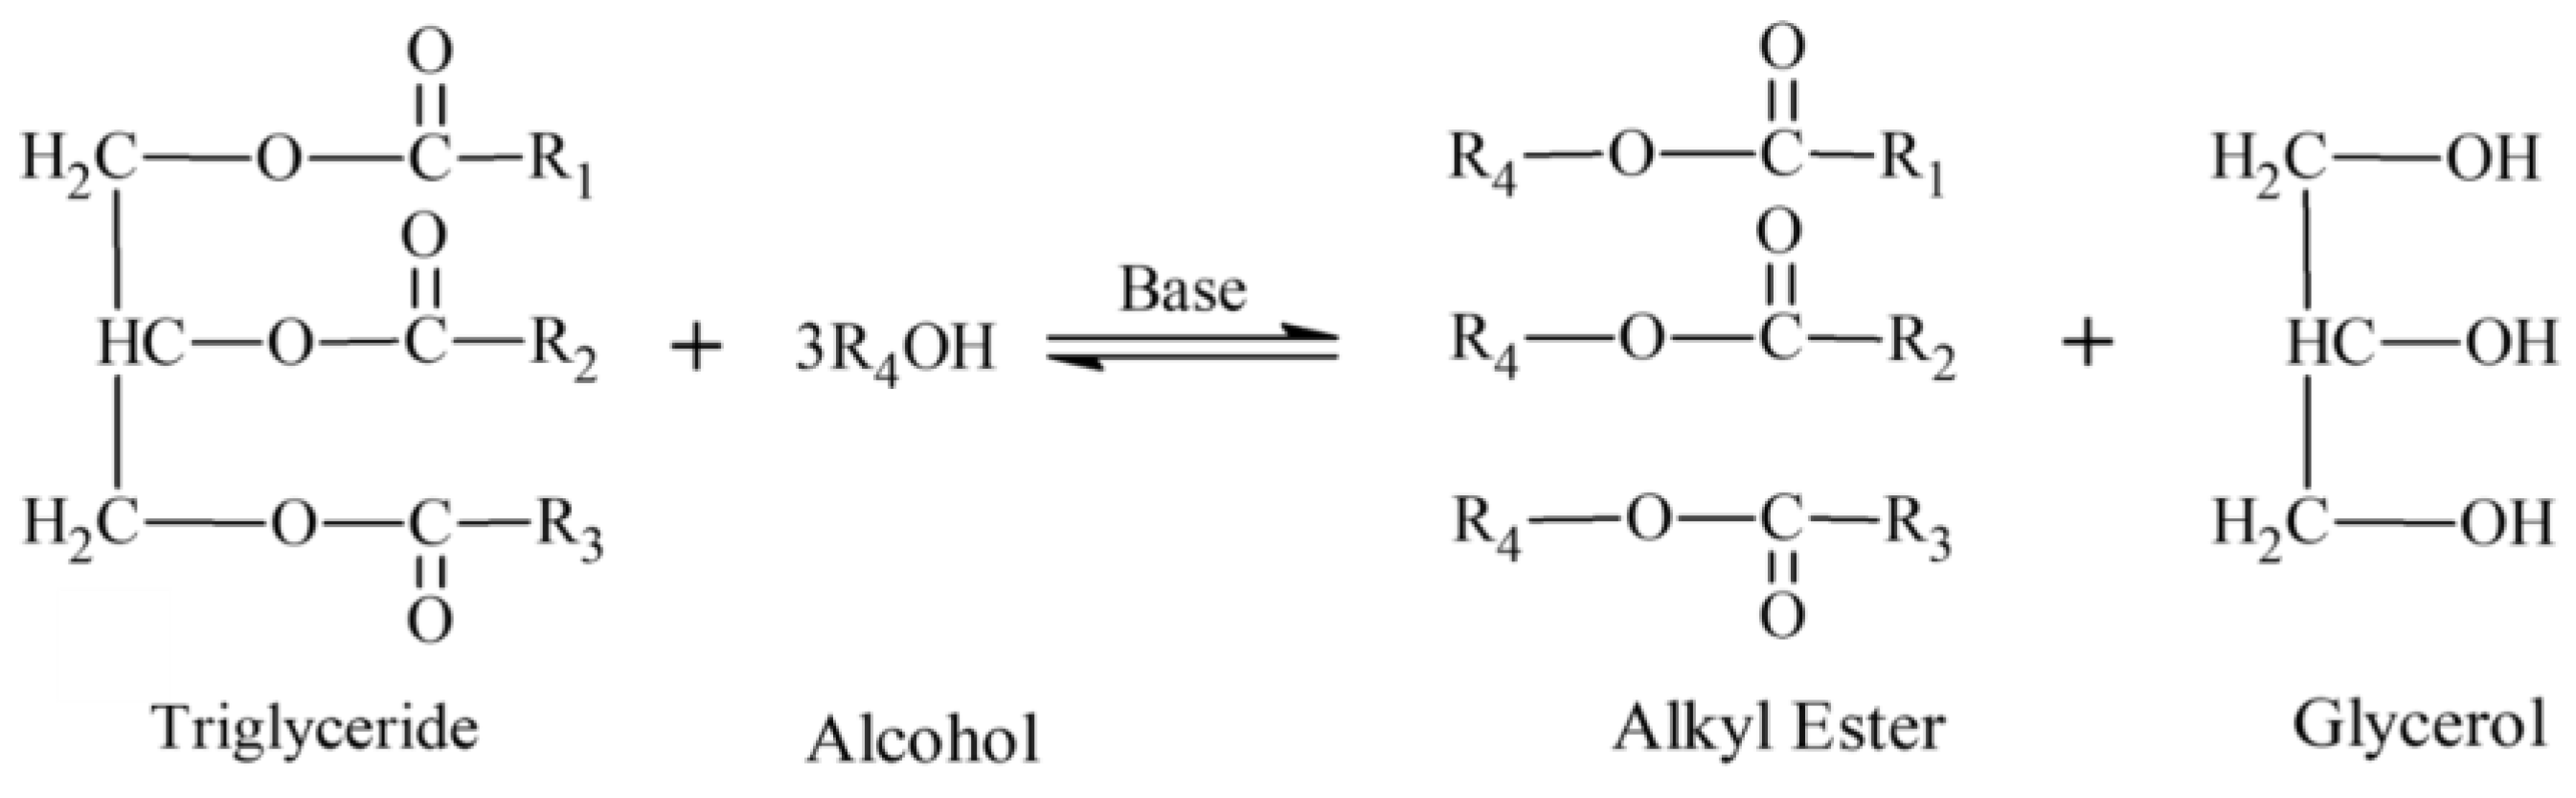
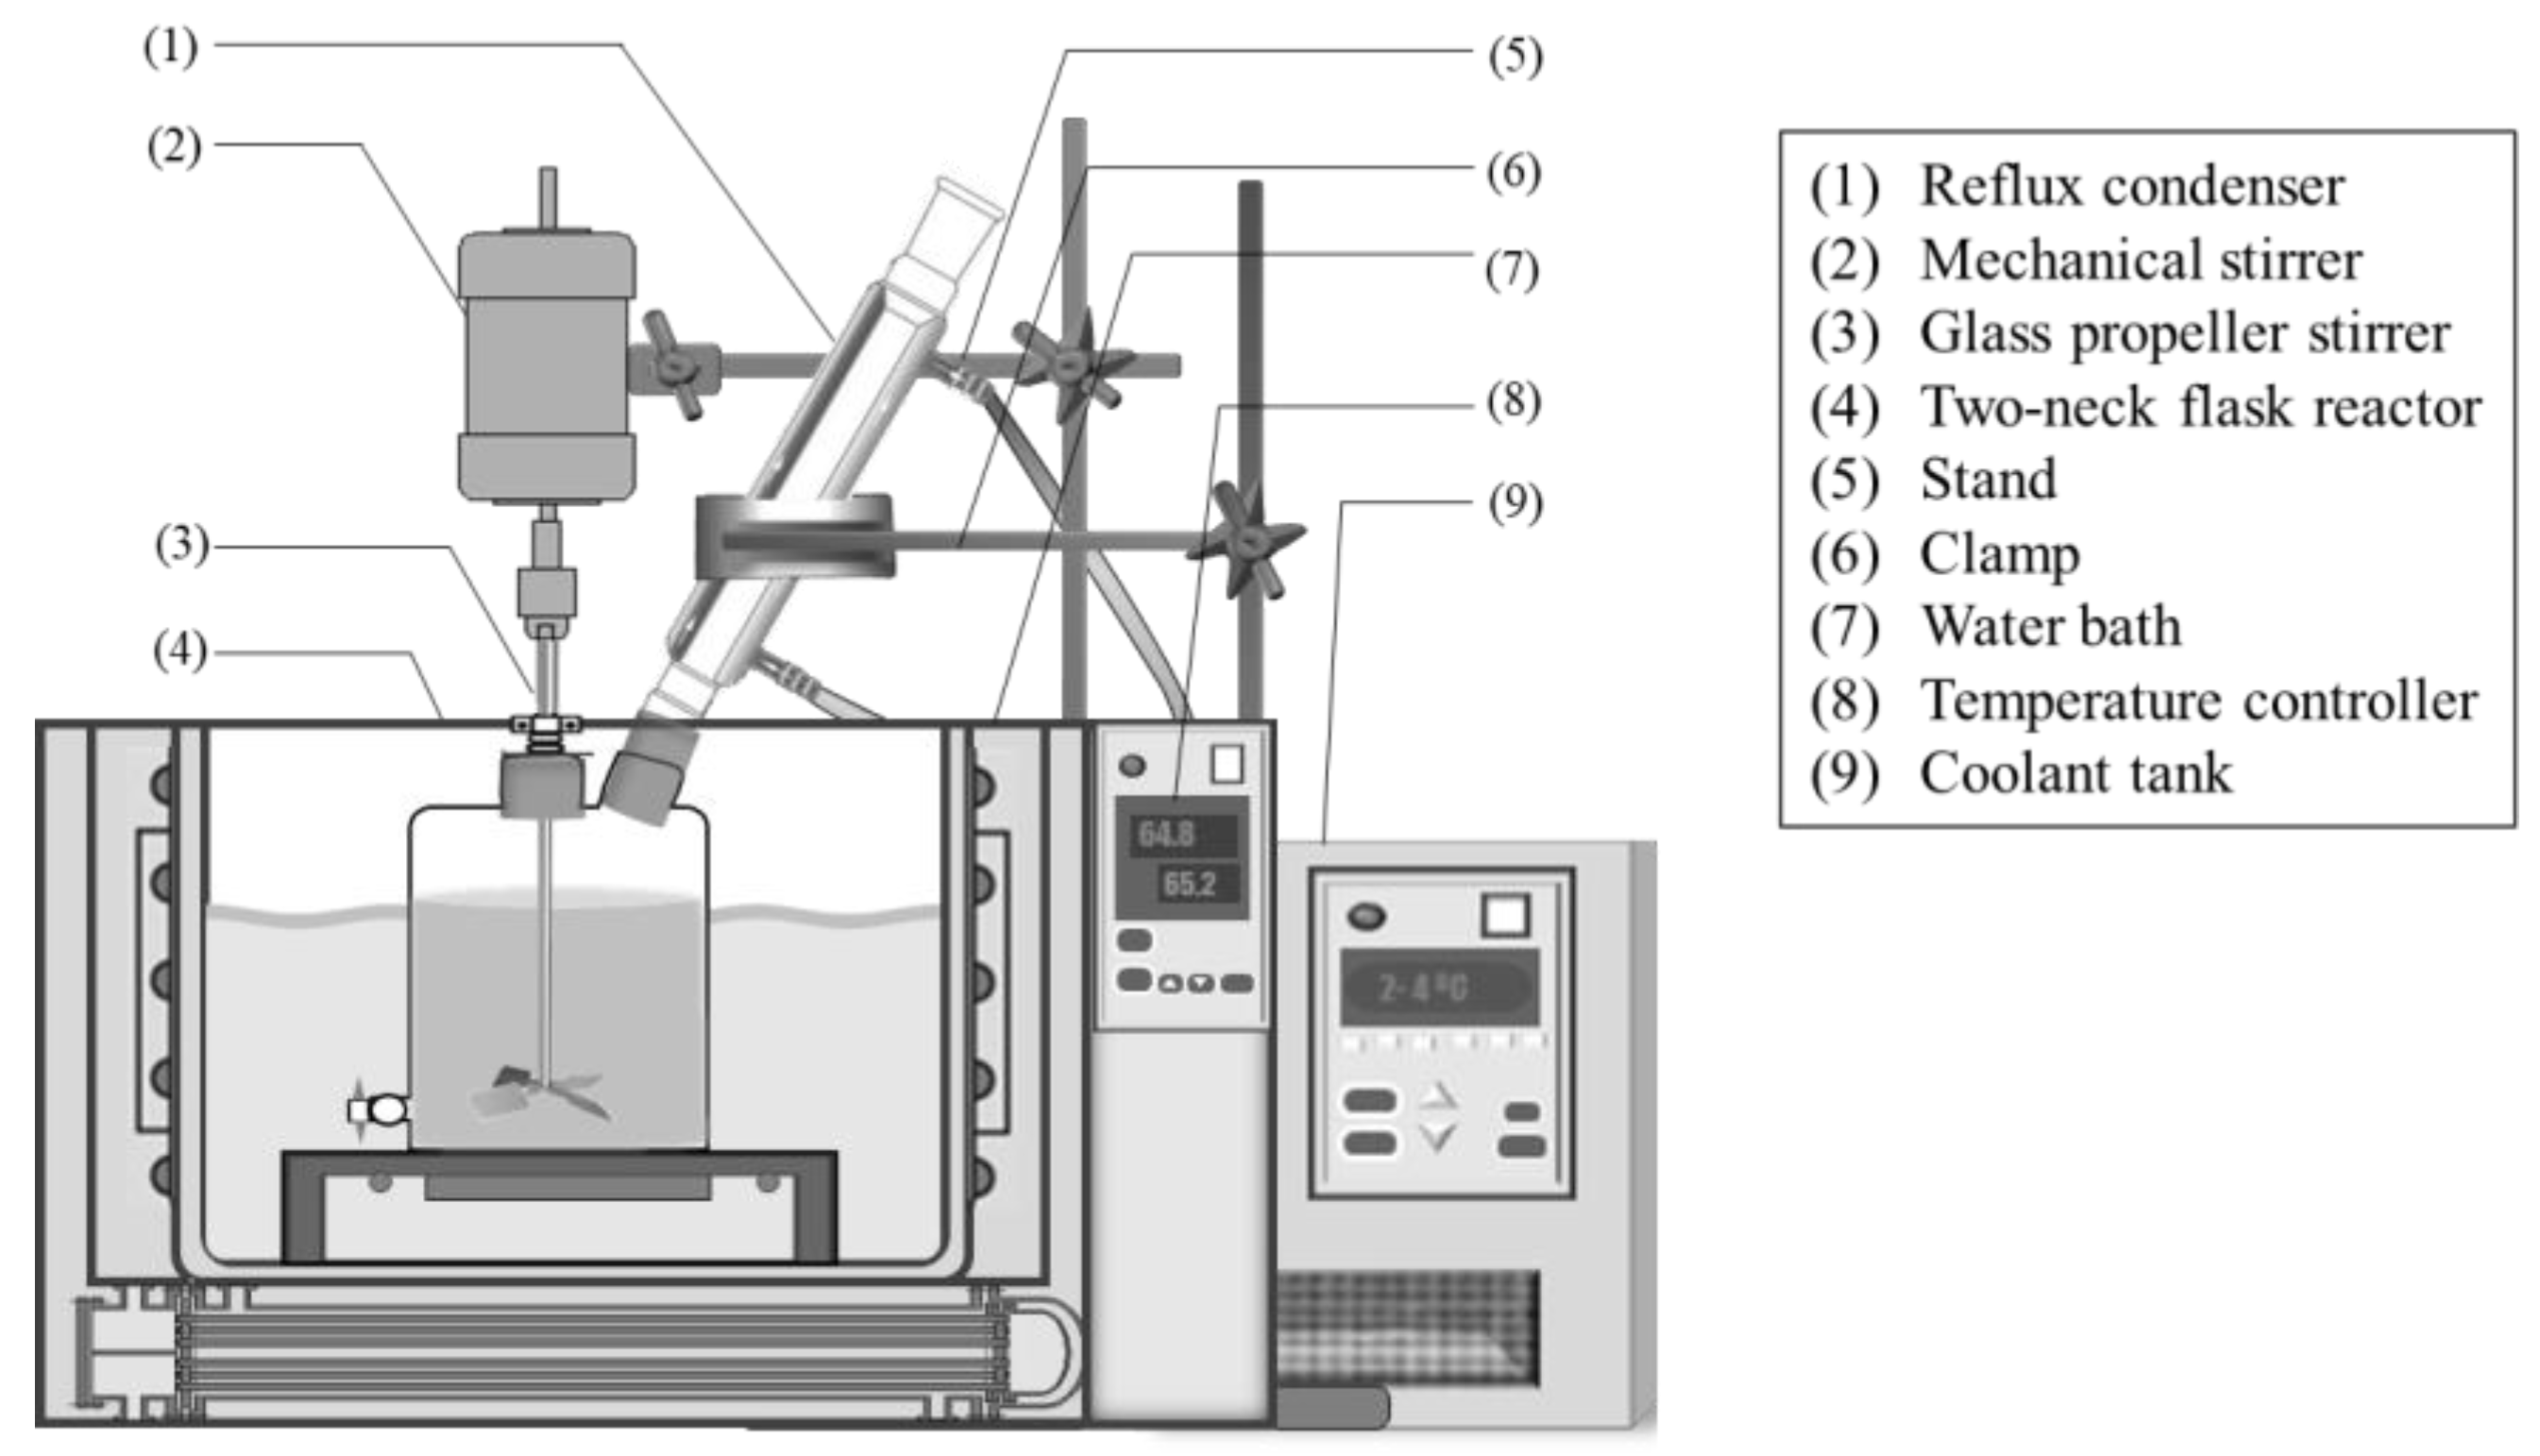
2.3. Transesterification Reaction

The transesterification reaction was carried out to produce biodiesel and by-products, including glycerol and remaining reactants. Sodium methylate was used as a homogeneous catalyst. The reaction temperature was controlled by thermal bath (±2 °C). Initially, 500 g of refined palm oil was preheated in a thermal bath until the temperature reached 60 °C, before adding the methanol and catalyst solution. The reaction operated at the optimum condition, which obtained an excess methanol/oil molar ratio of 6:1, sodium hydroxide derivative as the catalyst (2.16 wt%), constant stirring speed of 500 rpm, and 60 °C temperature for reaction time per hour. Figure 6 shows a schematic diagram of the lab-scale biodiesel production setup. At the end of the reaction, the product mixture containing biodiesel, glycerol, methanol, remaining catalyst, and unreacted reactants was then separated using gravitational settling (GS) and the EDS. The GS was conducted by pouring it into a separating cylinder to allow a clear interfacial separation between the biodiesel and glycerol layers. The same separating cylinder was also used for the EDS technique. The settling times were measured for a comparison with those obtained from the EDS.

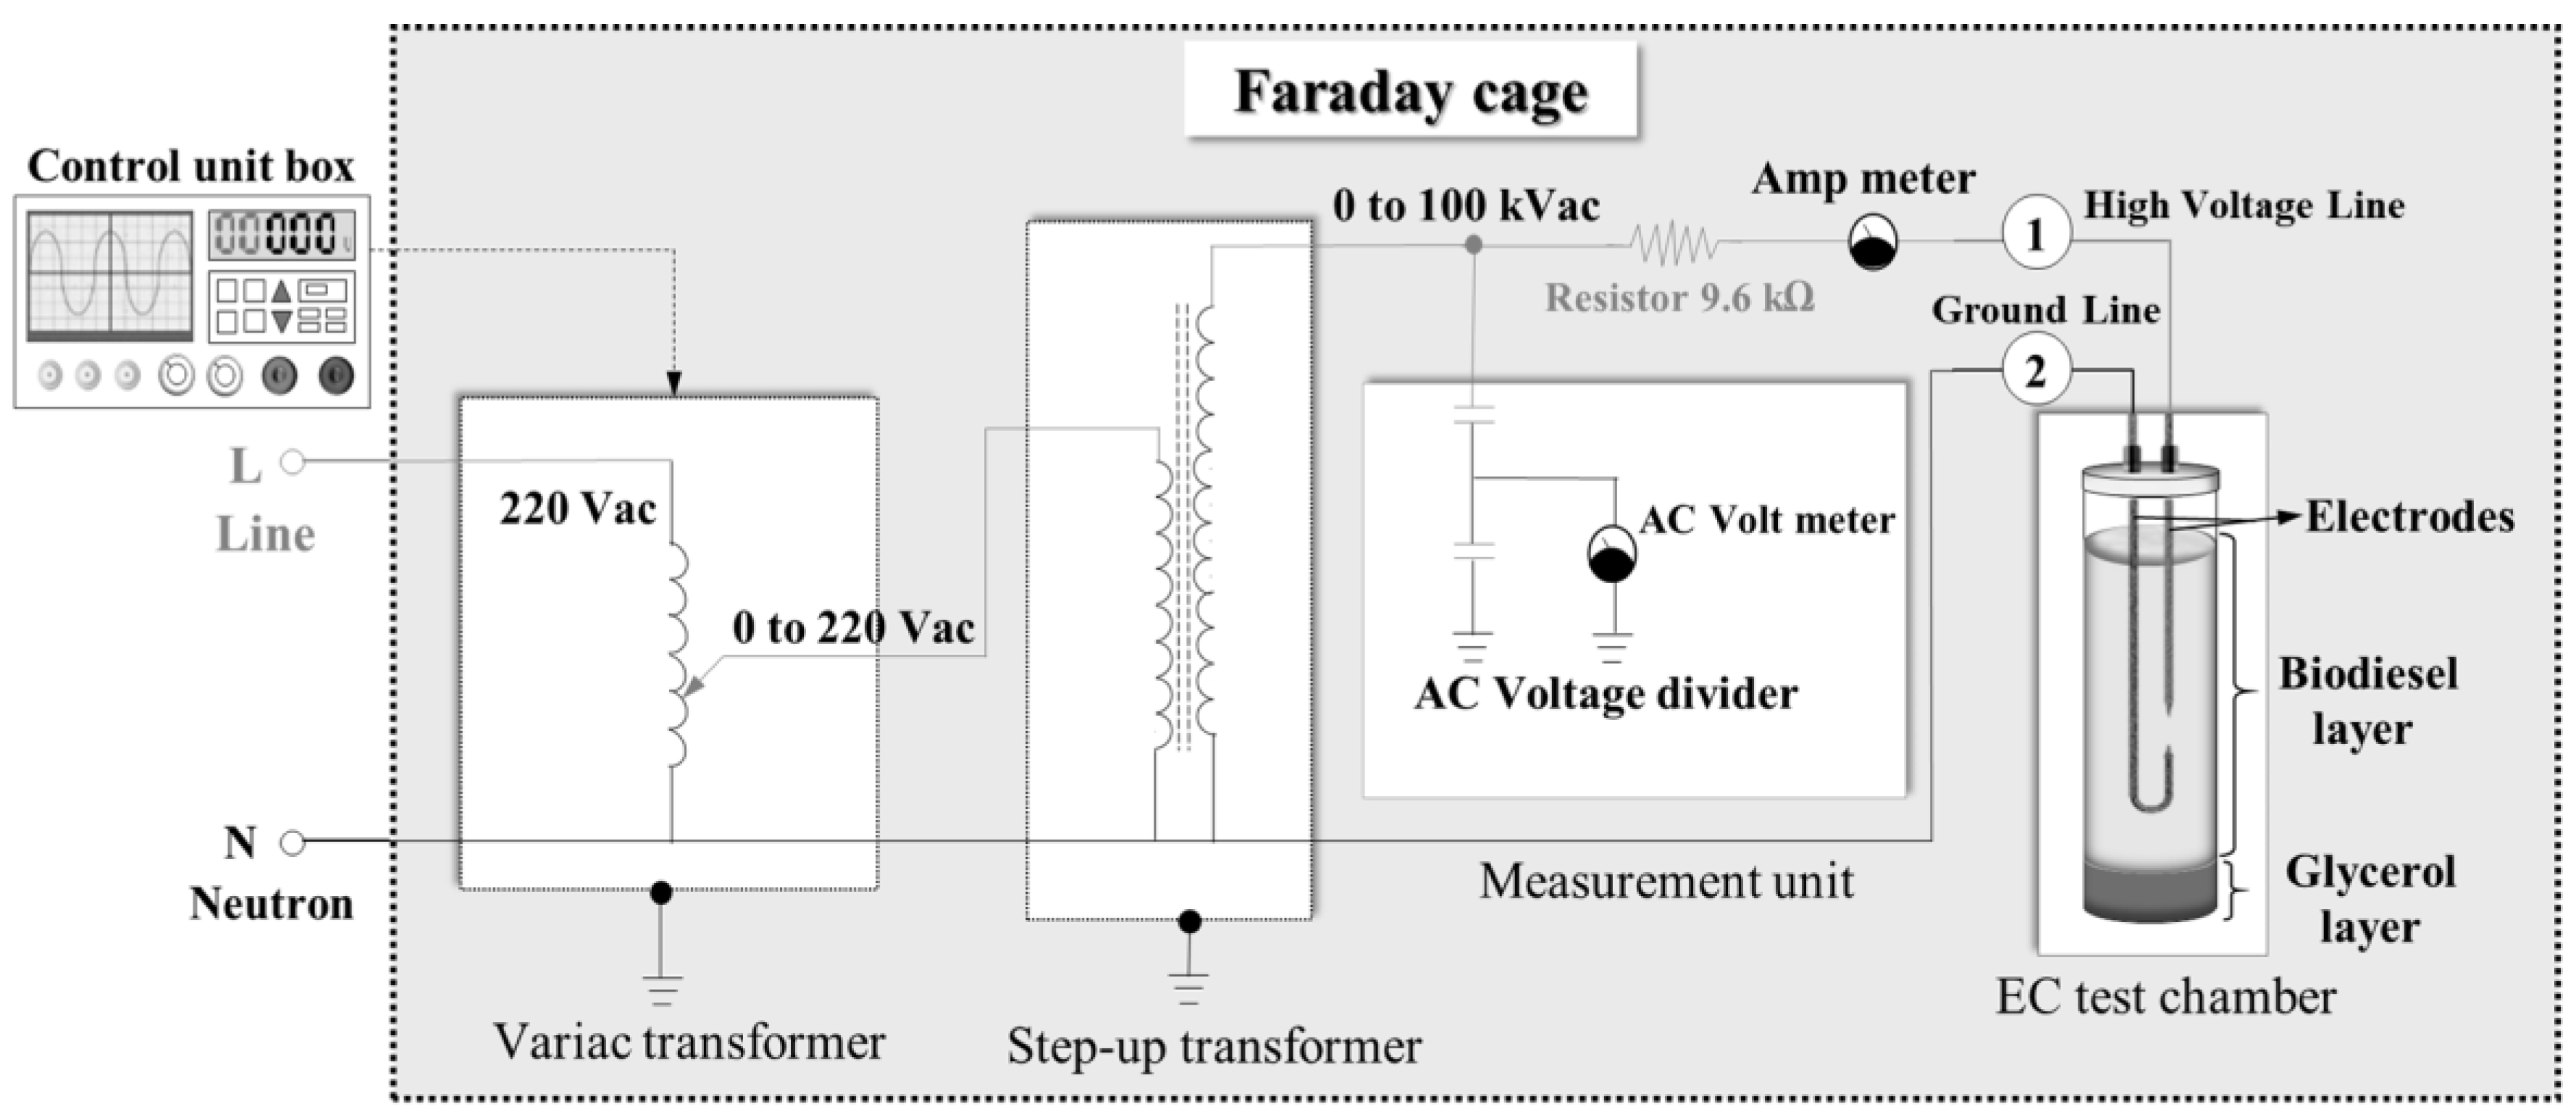
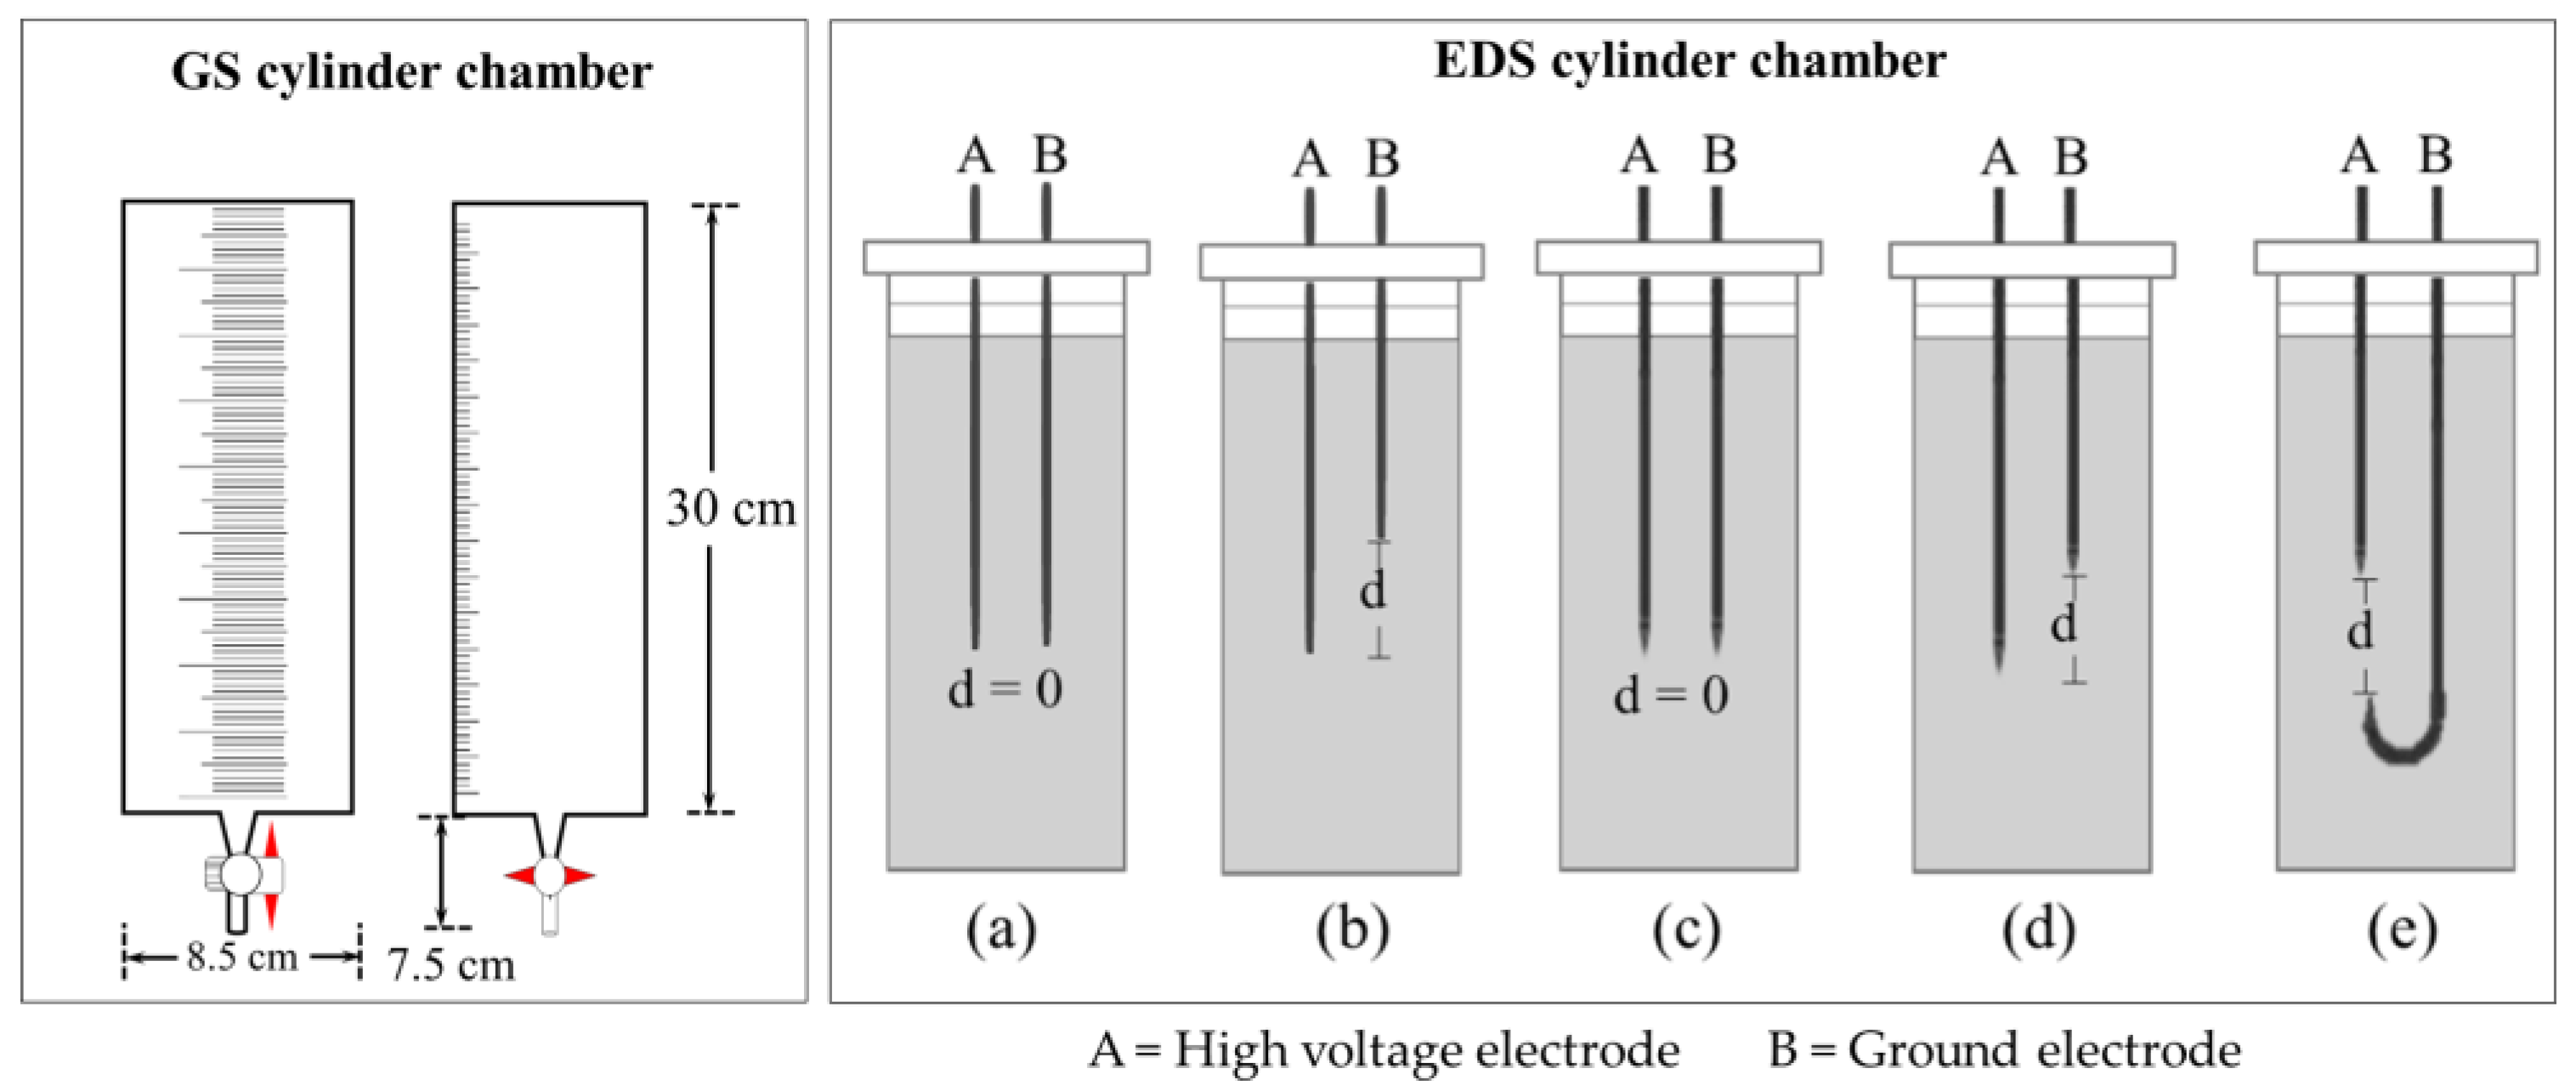
2.4. Electrically Driven Separation Process

Figure 7 shows the schematic diagram of the EDS setup. The EDS setup consists of a testing chamber, a transformer unit, and a control unit. An AC source of 50 Hz and 220 V from the electrical system line in a house was transmitted to an autotransformer. Variation of input voltage (0–220 V) was initially required for a variac transformer to adjust the AC power to the desired level of the AC voltage. Then, a step-up transformer was used to increase the voltage primary side (0–220 V) to the secondary side (0–100 kV). Finally, the desired high voltage in the range of kilo voltage (kVac) was applied to the test chamber. The test chamber consisted of a pair of electrodes that were filled with the product mixture for the separation test. The first electrode (No. 1) was connected to a 220 V/100 kV high-voltage transformer through a 9.6 kΩ resistor in order to control the current. The second electrode (No. 2) was grounded, and then the voltage across the electrode system was measured. The desired voltage was adjusted by a control box. The experiments were conducted at room temperature in a Faraday cage for safety consideration and operation.

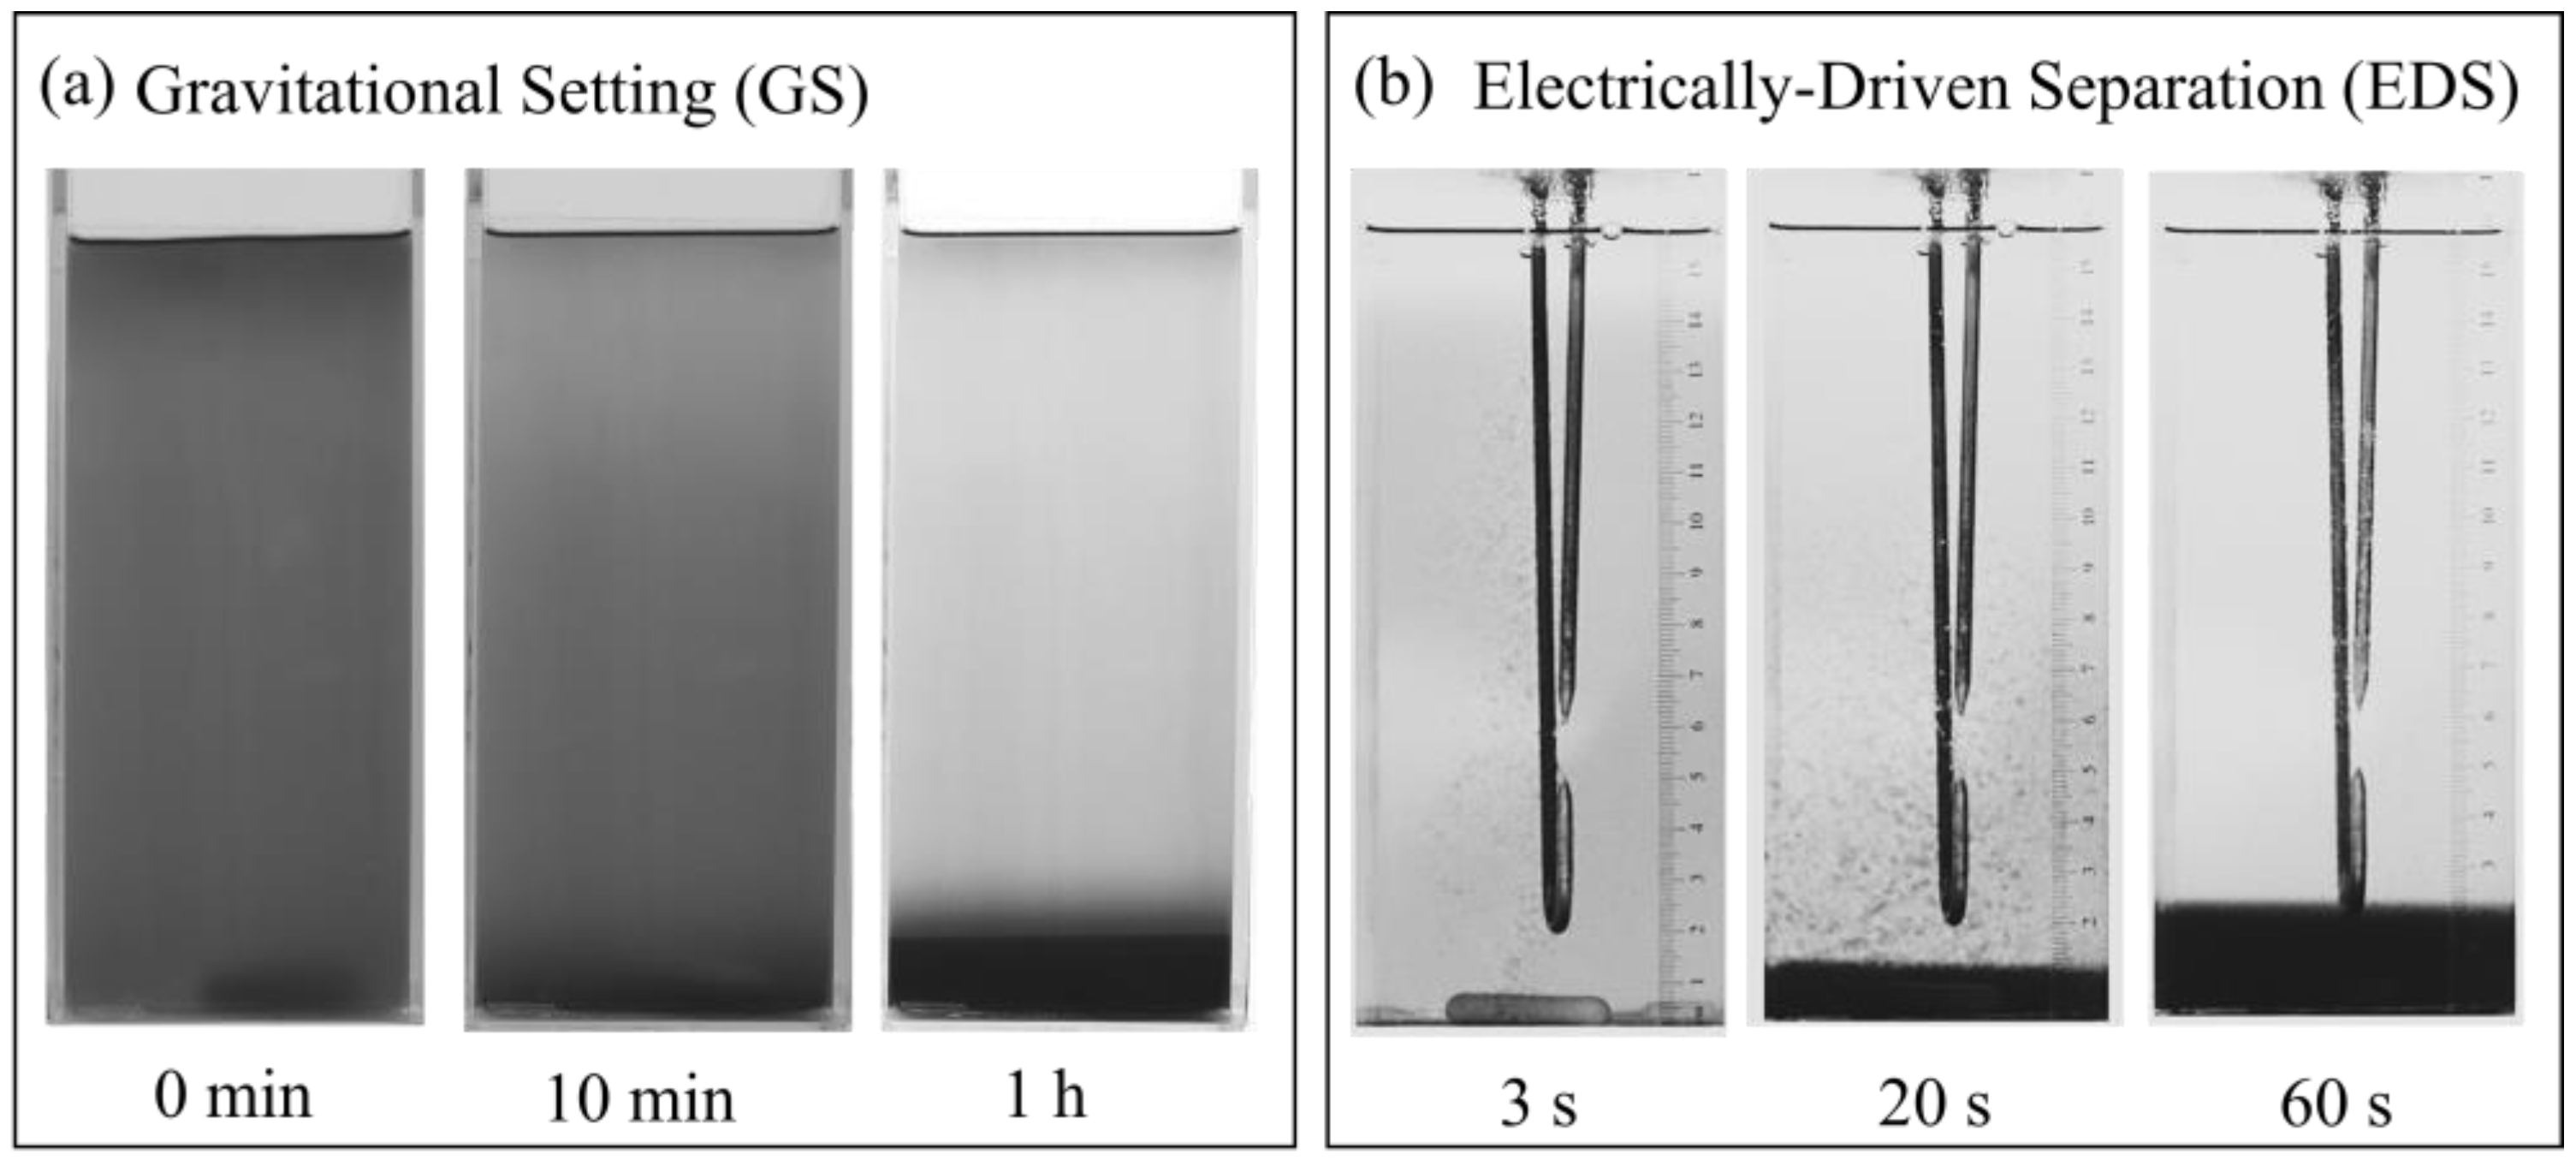
2.5. Comparison on Separation Performance between EDS and GS

After the completion of the transesterification process, the product mixture of biodiesel–glycerol was poured into two test cylinder chambers for the EDS and GS separation experiments. The capacity of each cylinder was 1700 mL, with a diameter of 8.5 cm and a height of 30 cm, as shown in Figure 8. The separation time was measured when the clear interface could be observed. Then, the inferior phase, which comprises glycerol, catalyst, soap, and contaminants, was removed from the bottom and the superior phase of biodiesel was collected for further analysis.

2.6. Varying Factors

2.6.1. Type of Electrode Arrangements

Electrodes were made from iron (Fe) in a rod 3.2 mm in diameter and the tips of the electrode were in bar and point shapes. Five different electrode configurations are shown in Figure 8. The horizontal distance between electrodes A and B was fixed at 3.5 cm, while the vertical distances between the ends of the electrodes (d) varied in a range of 0–9 cm.

2.6.2. Applying High Voltage

The applied high AC electrical voltage varied from 1 kV to 9 kV in order to observe the separation efficiency of the EDS process. At a fixed applied voltage of 3 kV, the electrical fields were simulated using Finite Element Method Magnetics (FEMM) for different configurations of the electrode arrangements in order to observe the highest electric stress distribution between the two electrodes.

2.6.3. Separation Time

The effect of the separation time of the EDS process varied from 30 s to 600 s. For this test, the vertical distance of 3 cm (d), applied voltage of 3 kV, and point-to-point type of electrode configuration were chosen.

2.7. Analysis Method

2.7.1. Separation Efficiency

After transesterification, the finished product from the reaction was transferred to a measuring cylinder for separation using EDS and GS. Separation efficiency was calculated based on the separated volume of glycerol at the end of each experiment. The percentage of separation efficiency is expressed in Equation (1).
Separation efficiency = (Vf/Vi) × 100%
where Vi is the initial volume of glycerol (mL) and Vf is the final volume of glycerol (mL).

2.7.2. Soap and Catalyst Remaining Content

The presence of residual soap and catalyst concentration was determined using the AOCS Cc 17–95 titration methods. The details of each method can be found elsewhere [38]. Phenolphthalein and bromophenol blue were used as indicators in order to determine the catalyst concentration and the soap concentration, respectively. Since the soap and catalyst concentrations change with each batch due to the reversible transesterification reaction, the final soap and catalyst concentrations were normalized to the initial values. The normalized concentration value of the residual soap (Nv, soap) was reported based on the initial soap of crude biodiesel, and could also be performed on the residual of the catalyst (Nv, catalyst) as shown in Equation (2).
Nv, soap or Nv, catalyst = Ct/Co
where Ct is the normalized concentration value of the catalyst or soap content at time (t) and Co is the normalized concentration value of the initial catalyst or soap content in the crude biodiesel.

2.7.3. Methyl Ester Content

The percentage of fatty acid methyl ester (FAME) content was analyzed using gas chromatography (Shimadzu CG-2010) with a flame ionization detector (FID), a DB-WAX capillary column with a length of 30 m, an internal diameter of 0.250 mm and a coating of 0.25 µm thickness. Nitrogen was used as a carrier gas, as well as a make-up gas with a constant flow rate of 1 mL/min and 30 mL/min, respectively. For the FID detector, UHP-grade hydrogen and air were fed at flow rates of 45 mL/min and 450 mL/min, respectively. The injector and detector were set at 250 °C. The initial oven temperature was held at 210 °C for 13 min and then increased to 230 °C at a heating rate of 5 °C/min and held at a final temperature for 15 min, hence resulting in a total analytical time of about 27 min. A sample volume of 0.5 µL was injected using the split mode with a split ratio of 1:50.

2.7.4. Free and Total Glycerol and Mono-, Di-, and Tri-Glycerides in Fatty Acid Methyl Esters

According to the EN 14105 method, the total glycerol, the free glycerol, and the mono-, di-, and tri-glyceride contents were determined before and after purification using gas chromatography (GC). The total glycerol content was obtained by the summation of the free glycerol, mono-, di-, and tri-glycerides. The calculation details can be obtained elsewhere [39]. A capillary column (MXT-Biodiesel TG, Agilent, Santa Clara, CA, USA) with a length of 15 m, including a 2 m guard column with a 0.53 mm internal diameter (total length 17 m), an internal diameter of 0.32 mm, and coated with a film thickness of 0.10 µm, was used to analyze the free glycerol and mono-, di-, and tri-glycerides. Helium was used as carrier gas, with a constant of a 5 mL/min flow rate. The GC program was stabilized at an oven temperature of 50 °C for 1 min. Then, it was heated at a heating rate of 15 °C/min to 180 °C. From 180 °C to 230 °C the heating rate was used at 7 °C /min, and finally the heating rate of 30 °C/min was used for a final temperature of 380 °C and held for 5 min. The detector was set at a temperature of 380 °C, hence yielding a total analytical time of about 26.81 min. The sample volume of 1.0 µL was injected into the GC column.

3. Results and Discussion

3.1. Electrode Arrangements and Electrode Configurations

Since an electrode arrangement shows an effect on a corona discharge resulting in different separation efficiency, the characteristics of corona discharges from different types of electrodes (sharp, bar, and point-to-point electrodes) of high voltage supply were investigated. In the present study, only the iron electrode (Fe) was used. As mentioned above, five types of electrode arrangements were investigated.

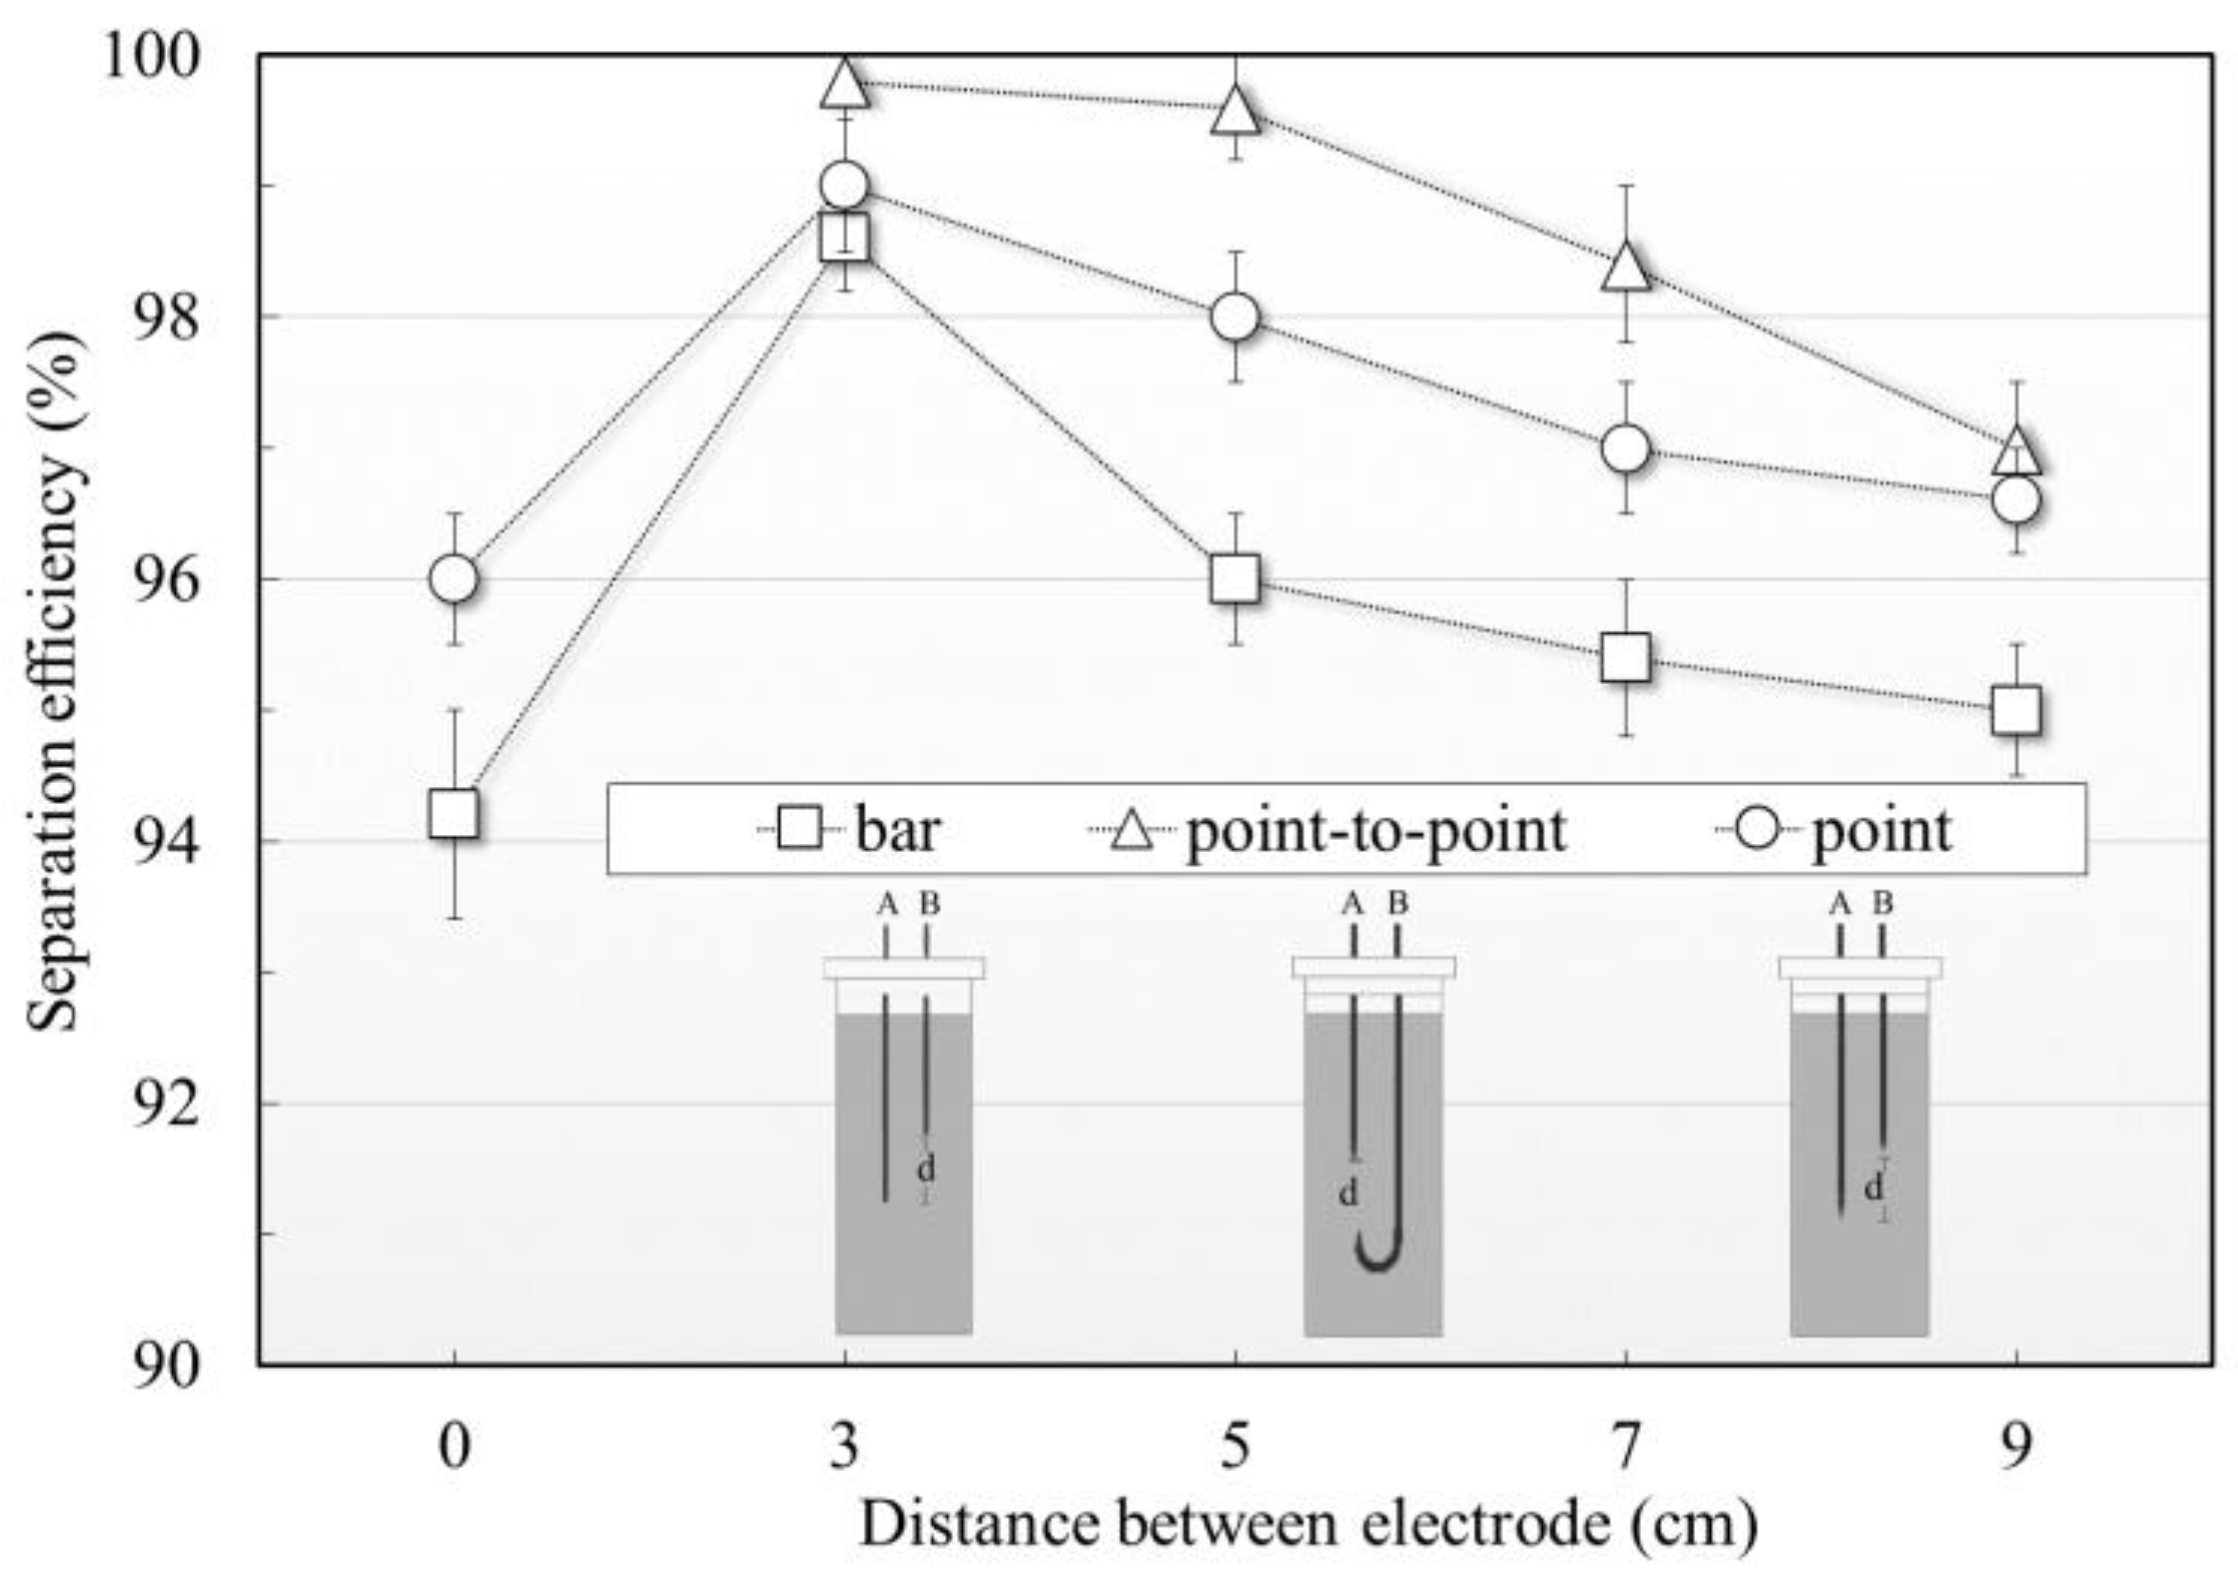
3.1.1. Effect of Distance between Electrodes on Separation Efficiency

Figure 9 shows the effect of electrode types and vertical distance between electrodes on the separation efficiency of the EDS process, with applied AC at 3 kV for a separation time of 240 s; the distance between electrodes varied in the range of 0 to 9 cm. It is noteworthy that the horizontal distance of a position at the same height between two electrodes (d = 0 cm) was only applied for the bar and point electrodes. In order to avoid electrical sparking and a short circuit, the minimum distance for the point-to-point configuration had to be kept at d = 3 cm. As the vertical distance (d) between two electrodes increases, separation efficiency decreases. This is due to the fact that, for a smaller gap distance, ions or electrons take a shorter time to reach another electrode, resulting in the enhanced negative and positive charges of the electrical potential of the glycerol molecules. This results in a reduction of the repulsive force of glycerol and unreacted reactant molecules, leading to increased polarity. Molecular adsorption then causes neutralization of the superficial charges, leading to agglomeration of the neutralized molecules followed with the precipitation of these molecules. Moreover, they further produce individual bridging by linking with surrounding molecules. Finally, a large enough agglomerate is generated and precipitated to the bottom of the cylinder [40]. As shown in the figure, the highest separation efficiency was 99.8% at d = 3 cm for the point-to-point electrode. For a distance (d) between 3 and 9 cm, the point-to-point configuration shows higher separation efficiency compared to the point and bar configurations. This is because of the fact that the corona discharge was likely to occur in the case of the point-to-point configuration.

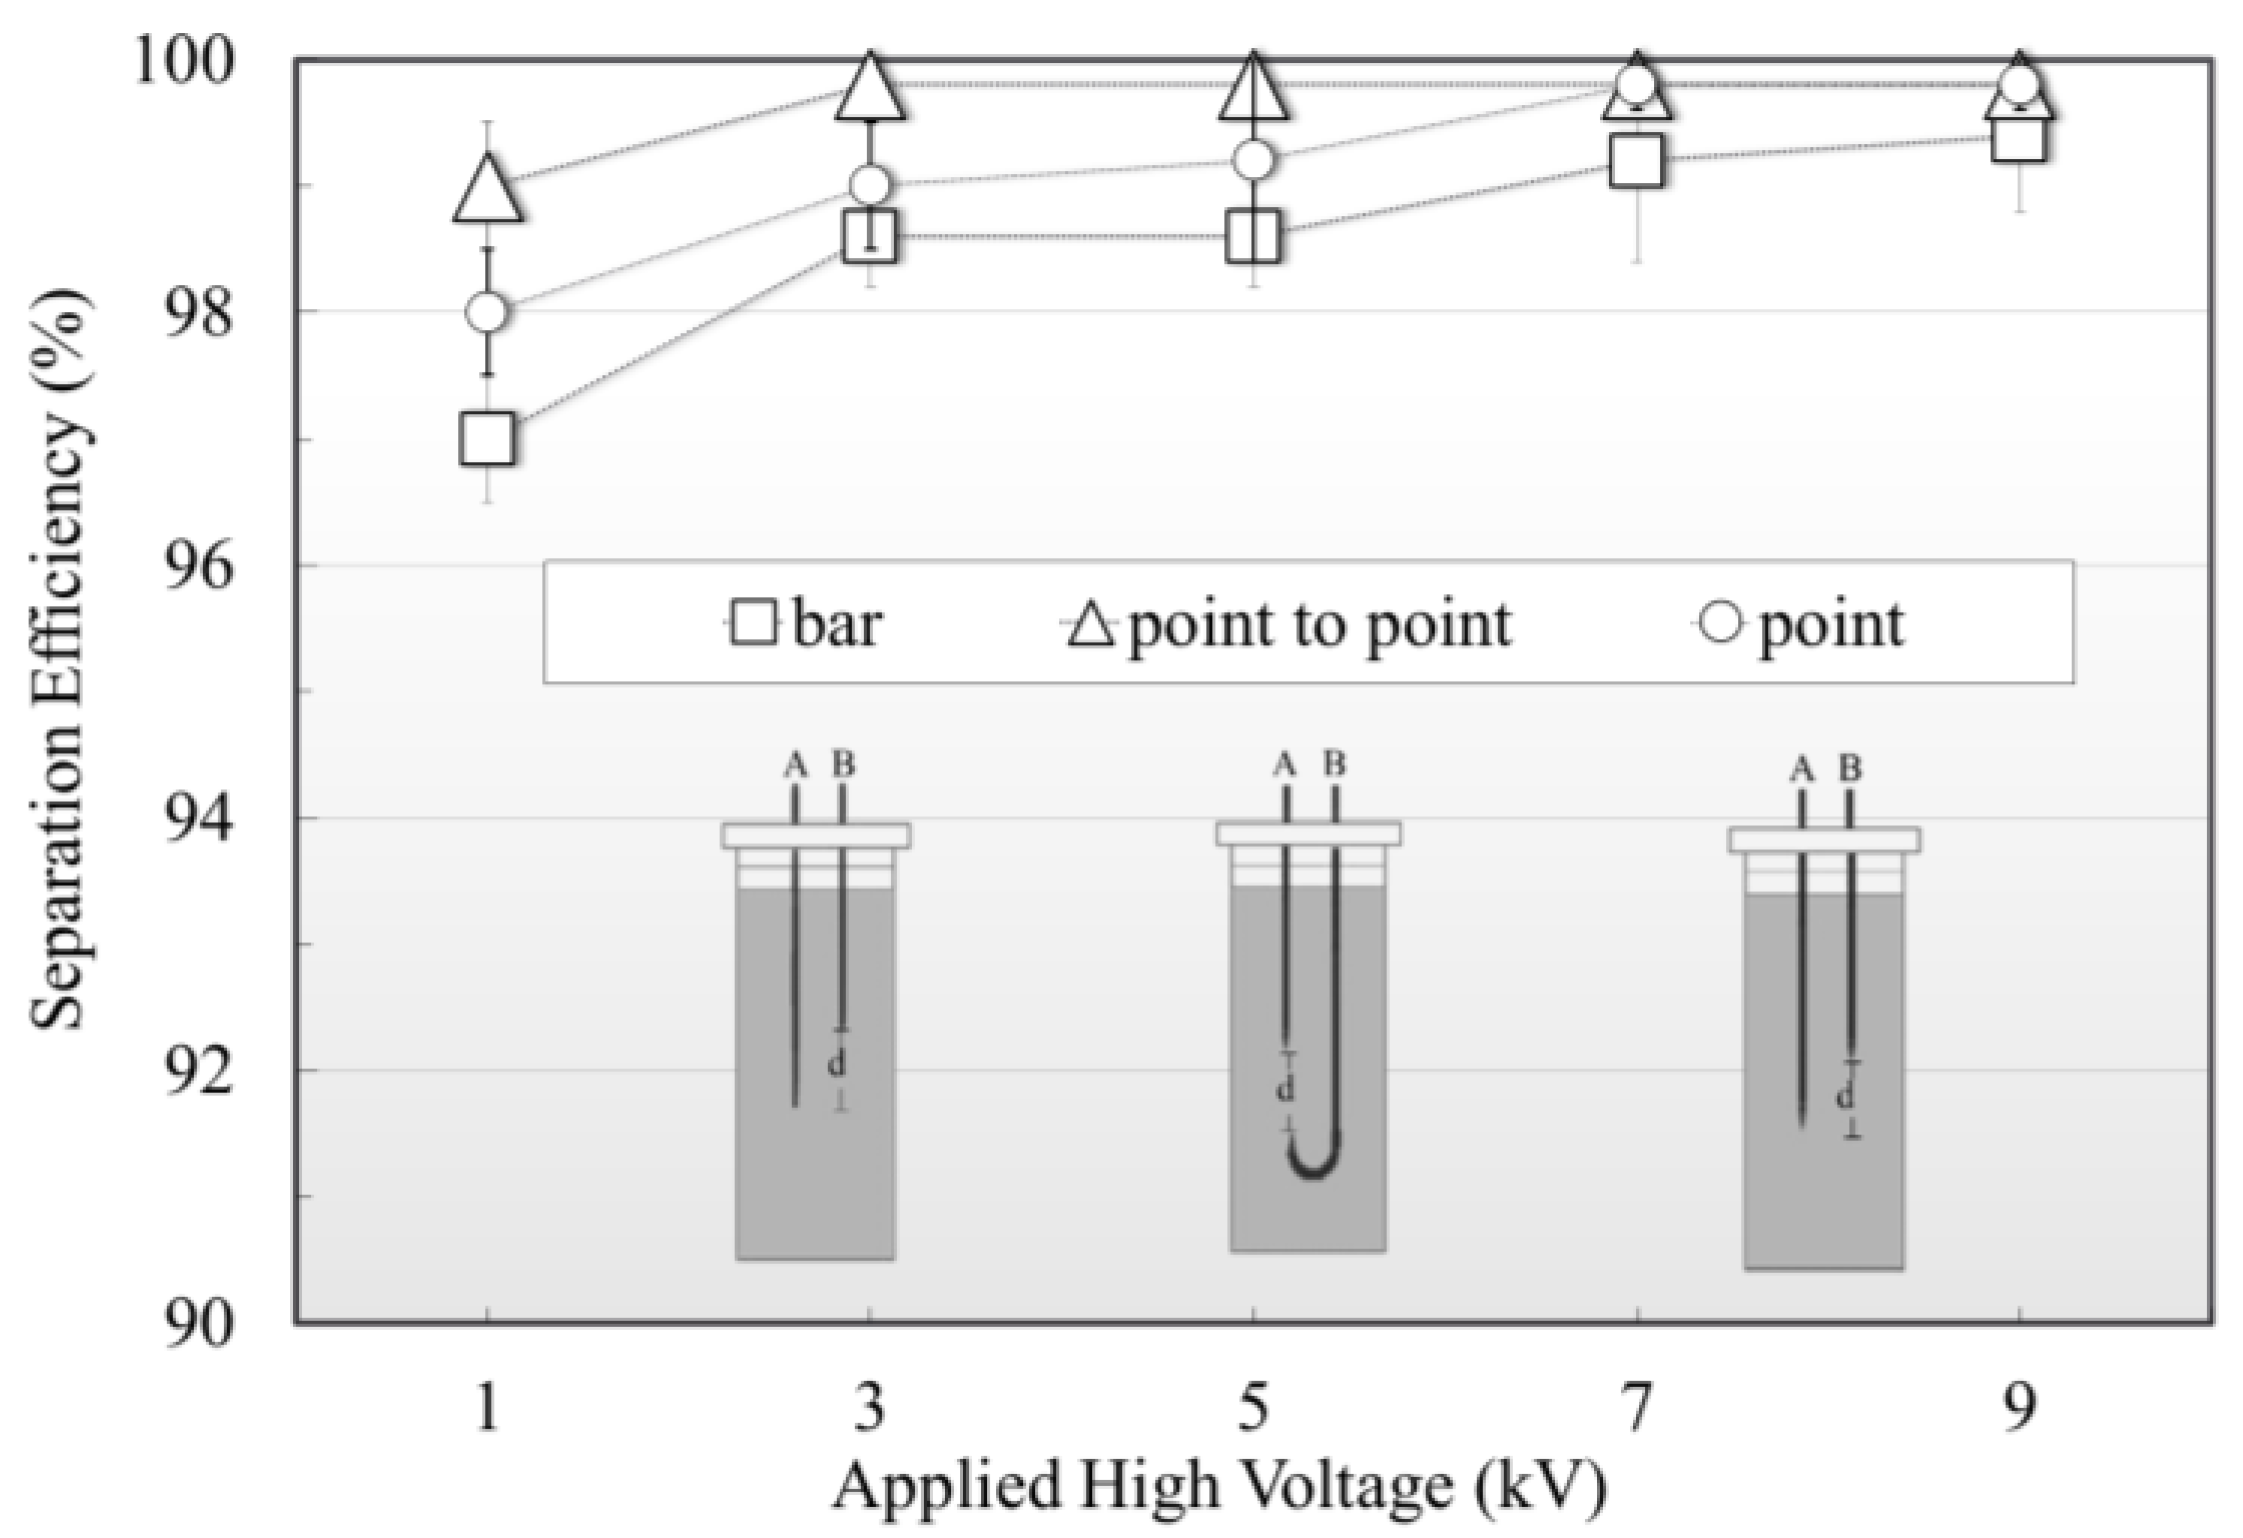
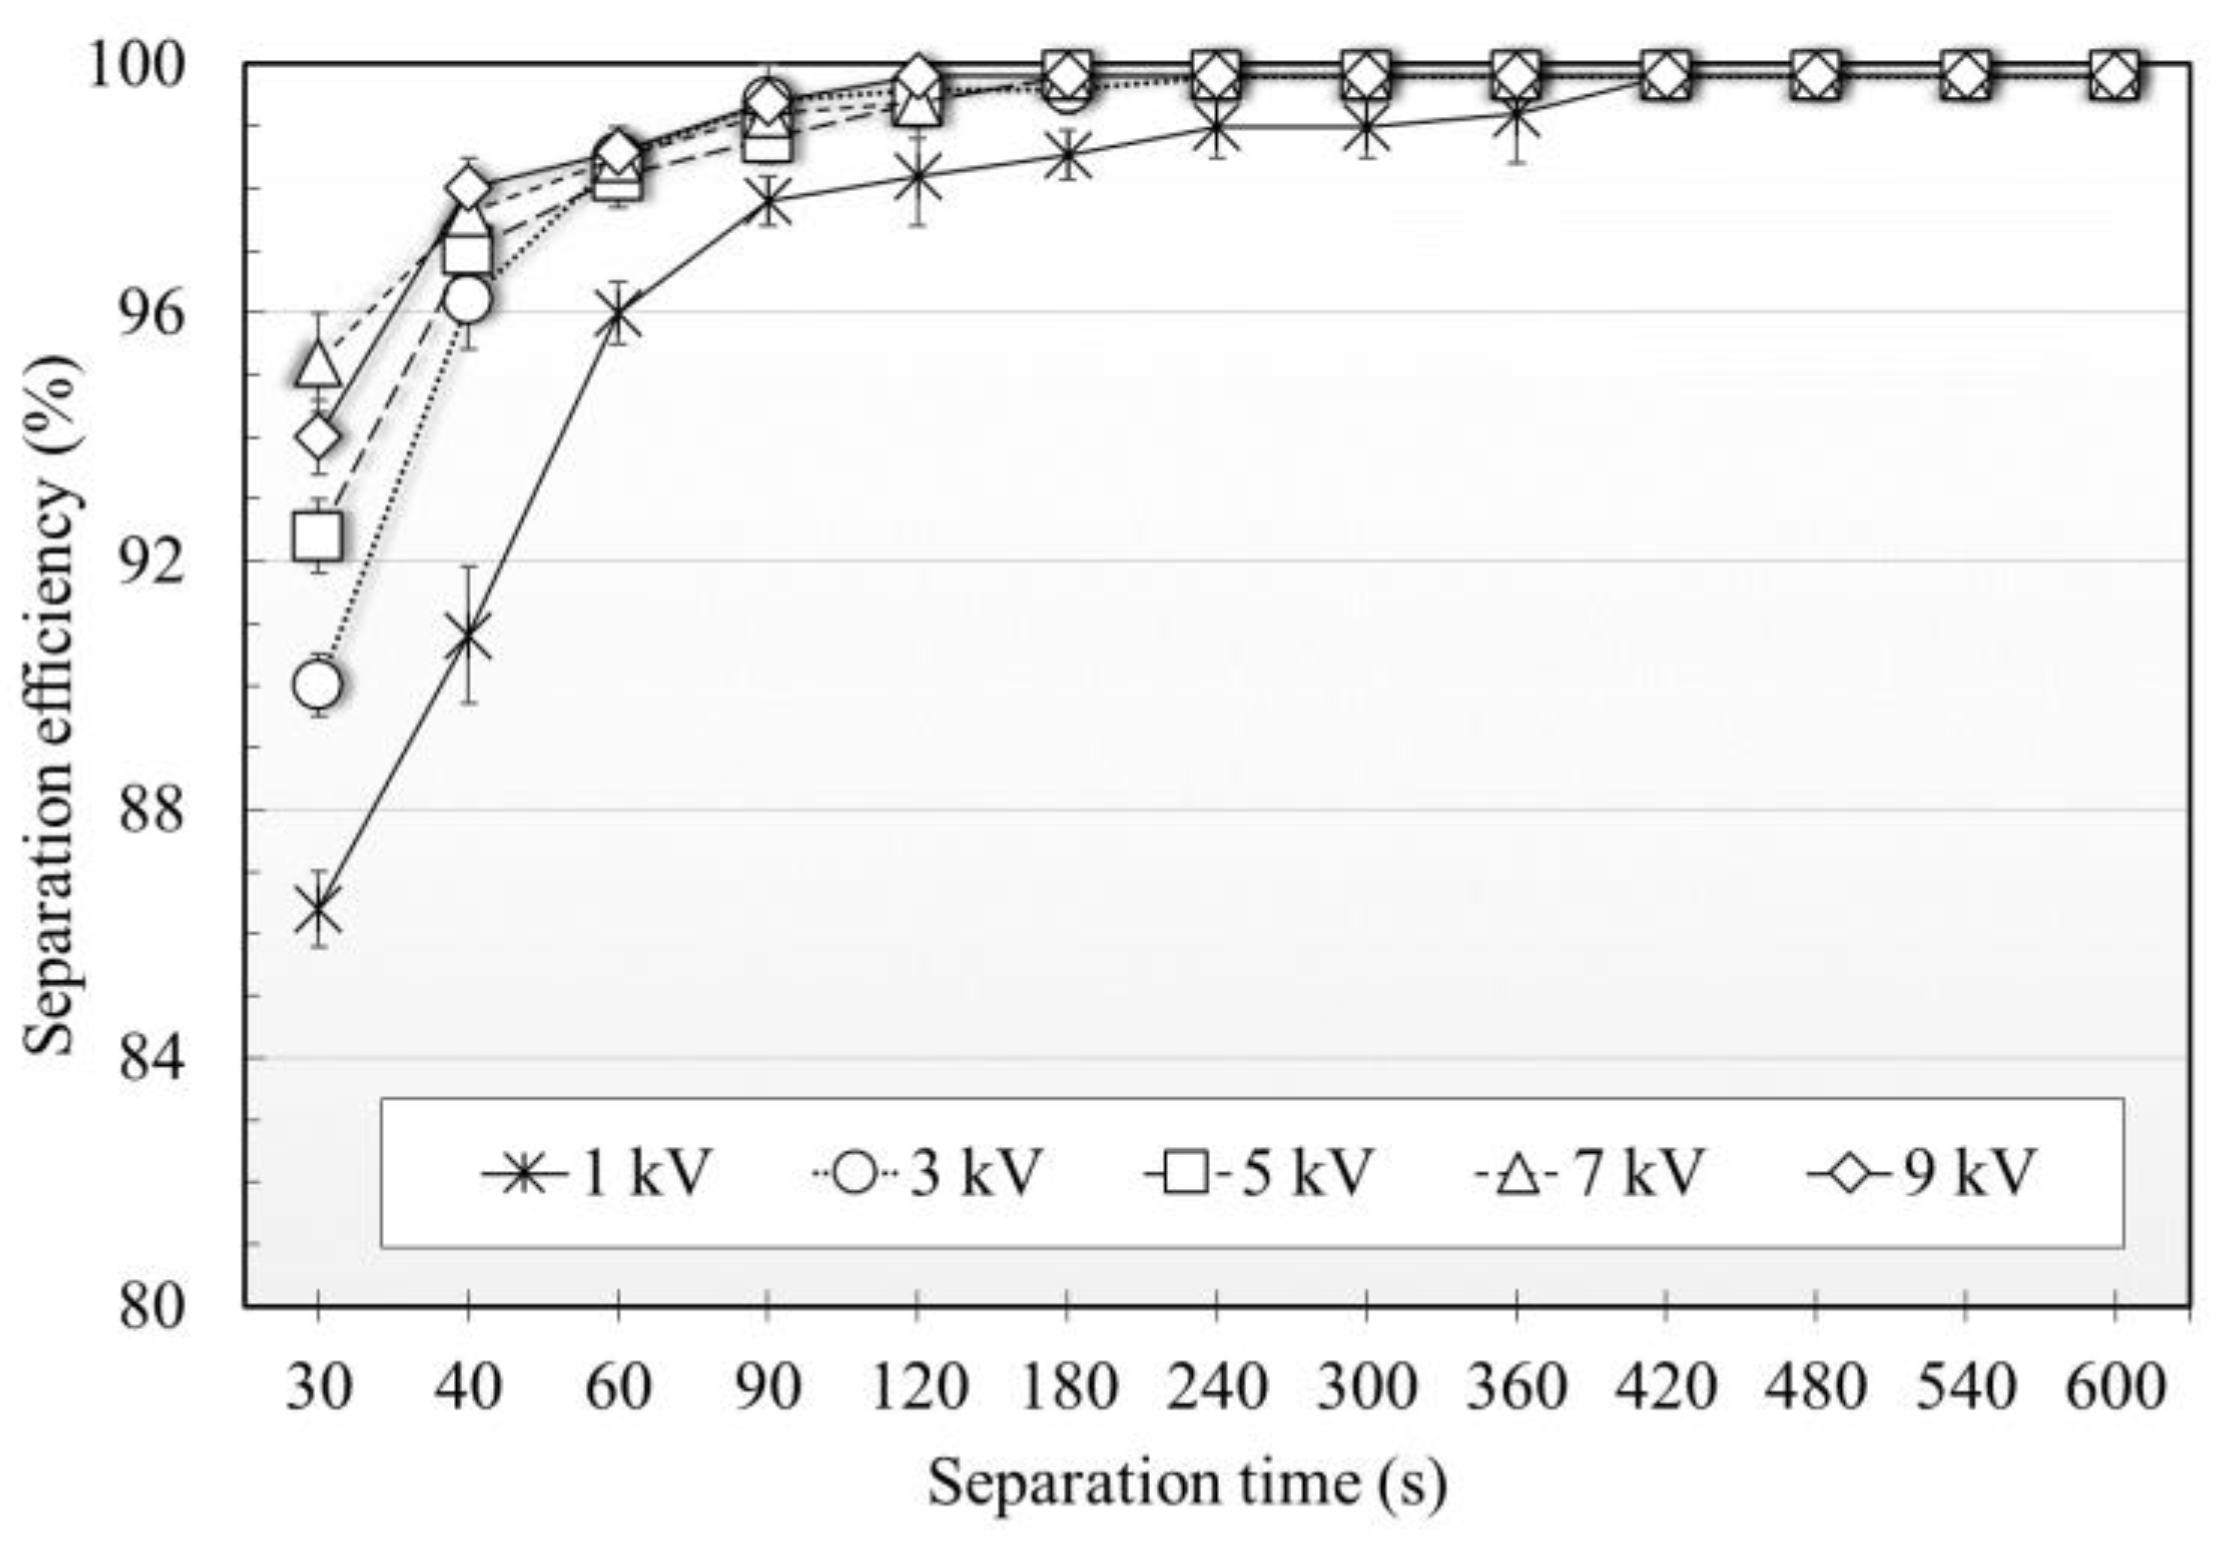
3.1.2. Effect of Applied AC at High Voltage on Separation Efficiency

The effect of applied high voltage on the separation efficiency of the EDS process is shown in Figure 10. As seen from the figure, the separation efficiency is directly proportional to the high voltage applied. The point-to-point configuration shows higher separation efficiency compared to the bar and point electrodes. The highest separation of 99.8% was obtained from the point-to-point electrode at an applied voltage higher than 3 kV. From 1 kV to 3 kV, the separation efficiency increased significantly for all types of electrode configurations. On the other hand, from 3 kV to 9 kV the separation efficiency did not show significant improvement. This was because the application of high voltage generates higher electric field strength around the point of the electrode, leading to more ionization and, consequently, greater agglomeration of glycerol particles [32,41]. As a result, the attractive force becomes more dispersed and increases the rate of aggregation and coalescence due to the raised ionization level of ions affecting the distribution of the ion charges of the glycerol particles in the biodiesel–glycerol mixture [42].

3.1.3. Effect of Vertical Distance between Point-to-Point Electrodes

Since the vertical distance (d) between electrodes shows an effect on the separation efficiency of the EDS process, especially with the point-to-point electrode type, the experiment was performed with the iron (Fe) point-to-point electrode type in order to investigate the effect of vertical distance and separation time on separation efficiency. As seen in Figure 11, the separation efficiency decreases while the distance electrode increases. A higher operation time results in higher separation efficiency compared to a shorter operation time. The difference is more pronounced at a higher distance between electrodes. The vertical distance between electrodes of 2 cm and 3 cm shows the highest separation efficiency of 99.8% at the operation time of 240 s. Since electrical stress is inversely proportional to the distance between electrodes along the same axis, higher distance shows less electric stress, resulting in the decreased induction of free particles and released charges between electrodes [43]. Hence, the conductive zone between electrodes was reduced and the EDS process did not show a significant effect on the sedimentation of the glycerol particles. It is worth noting that at the distance of 1 cm between electrodes, the experiment could not be performed. It could pose a risk of electrical discharge, sparking (lighting) and breakdown. The optimal position of the barrier is approximately 20% of the gap distance between sharp or point electrodes to avoid sparking and breakdown voltage, as previous studies have shown [44,45]. Therefore, for this study, a distance of 3 cm between the electrodes was chosen as the optimal condition to avoid the propagation of free charges across the gap between the electrodes as a result of spark over voltage when the distance between the point electrodes was small.

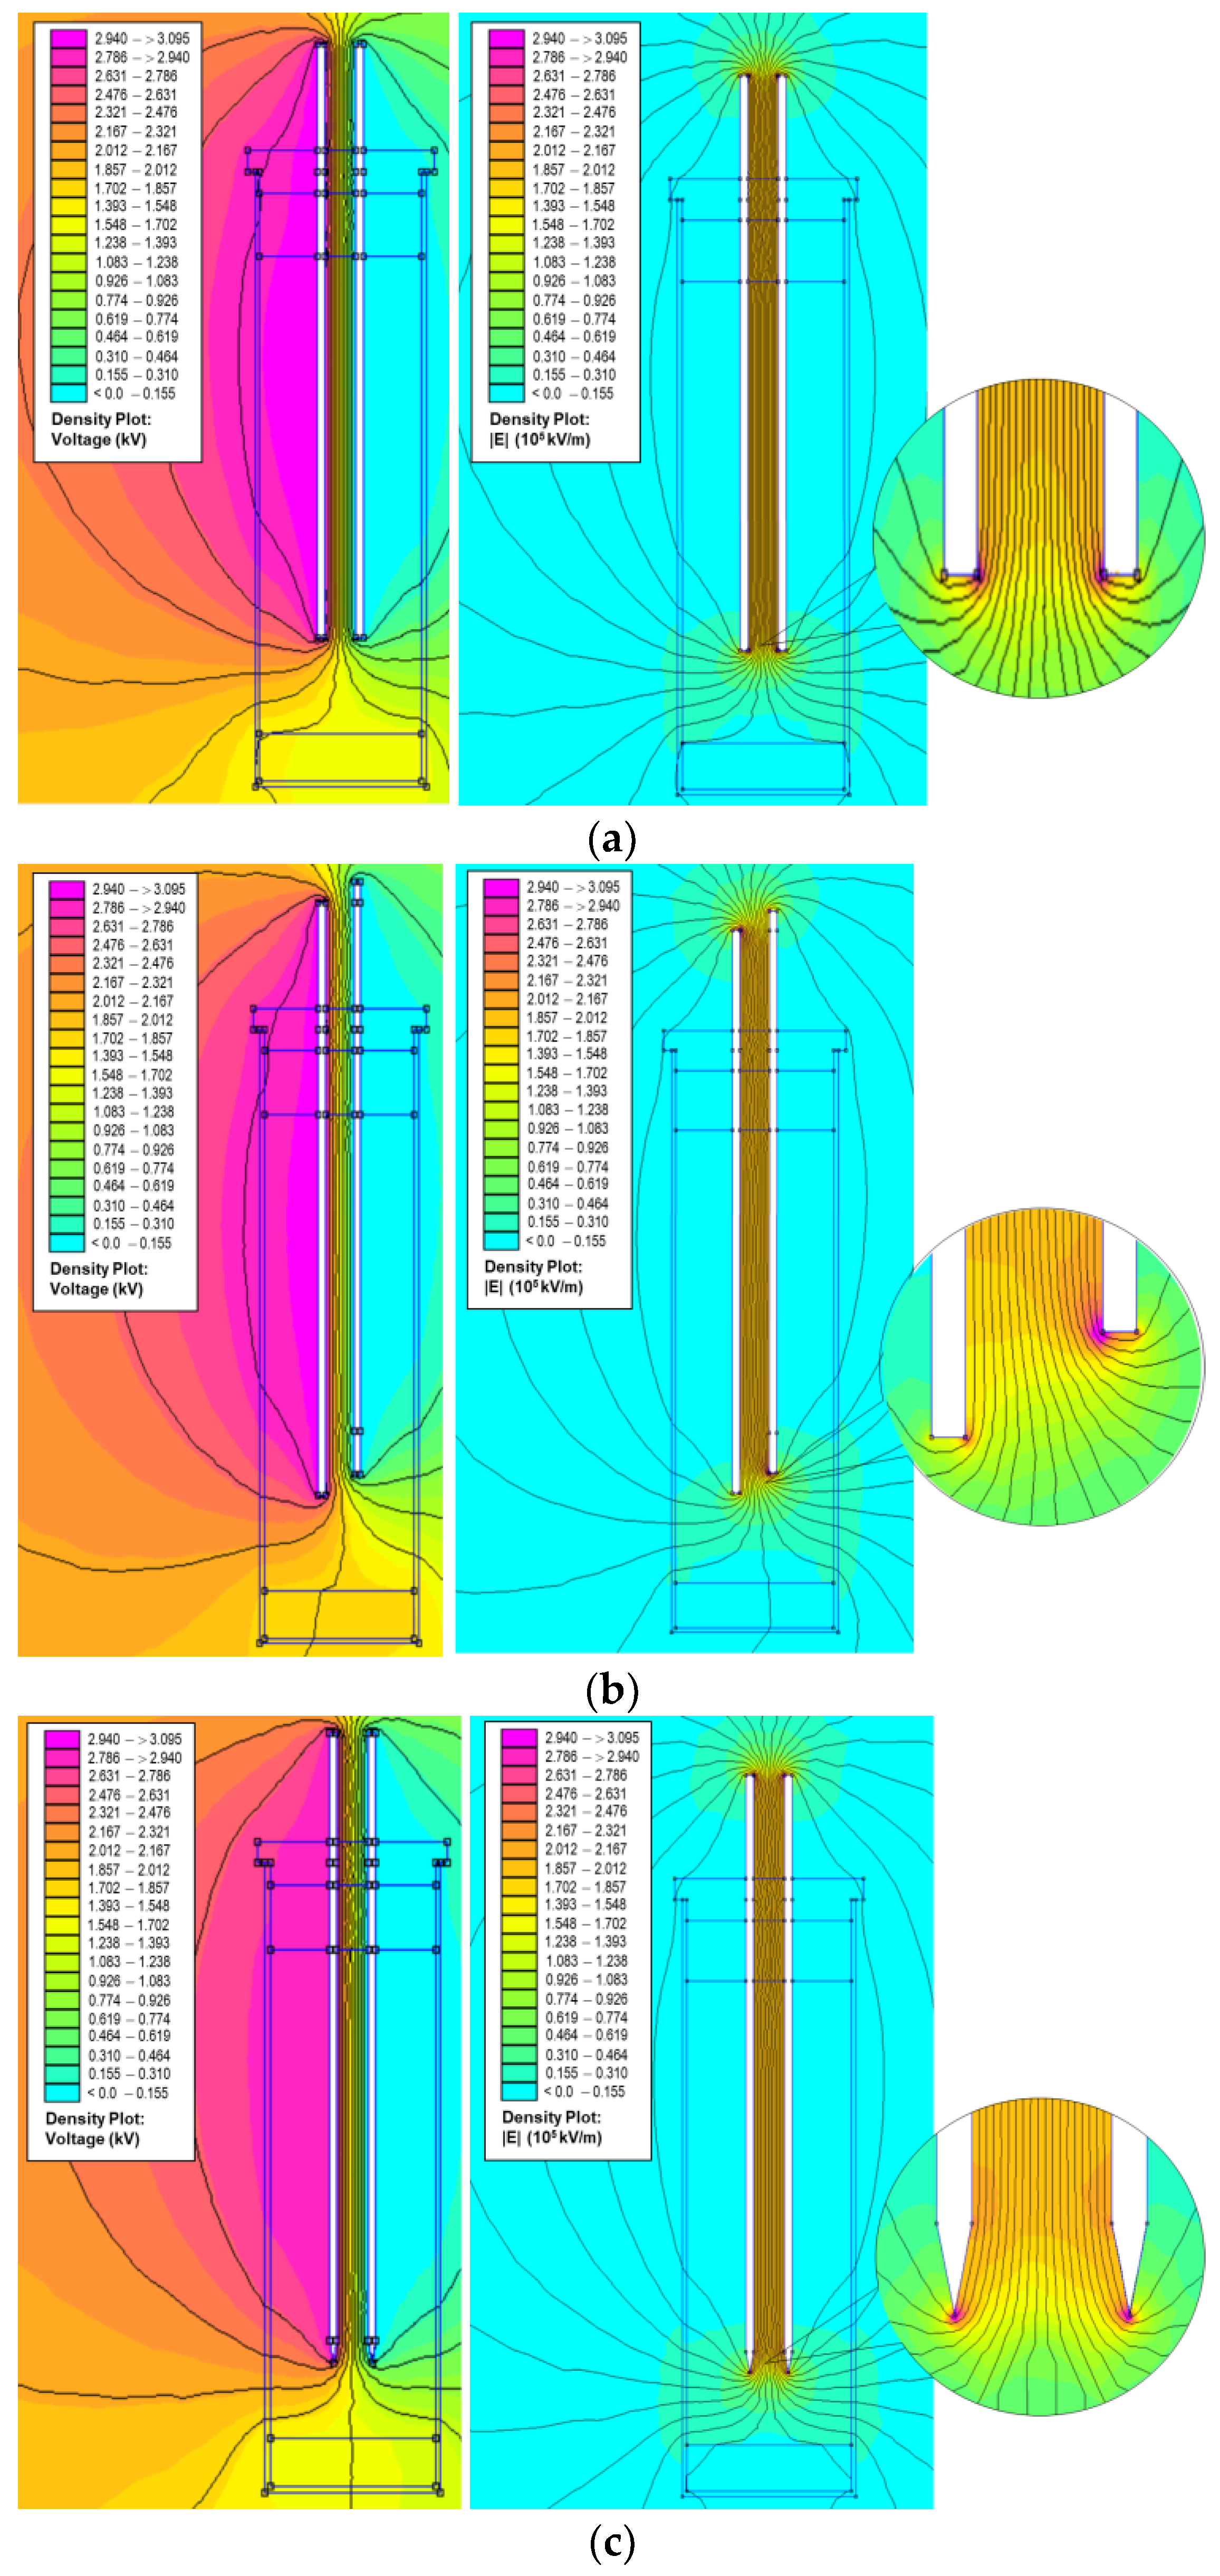
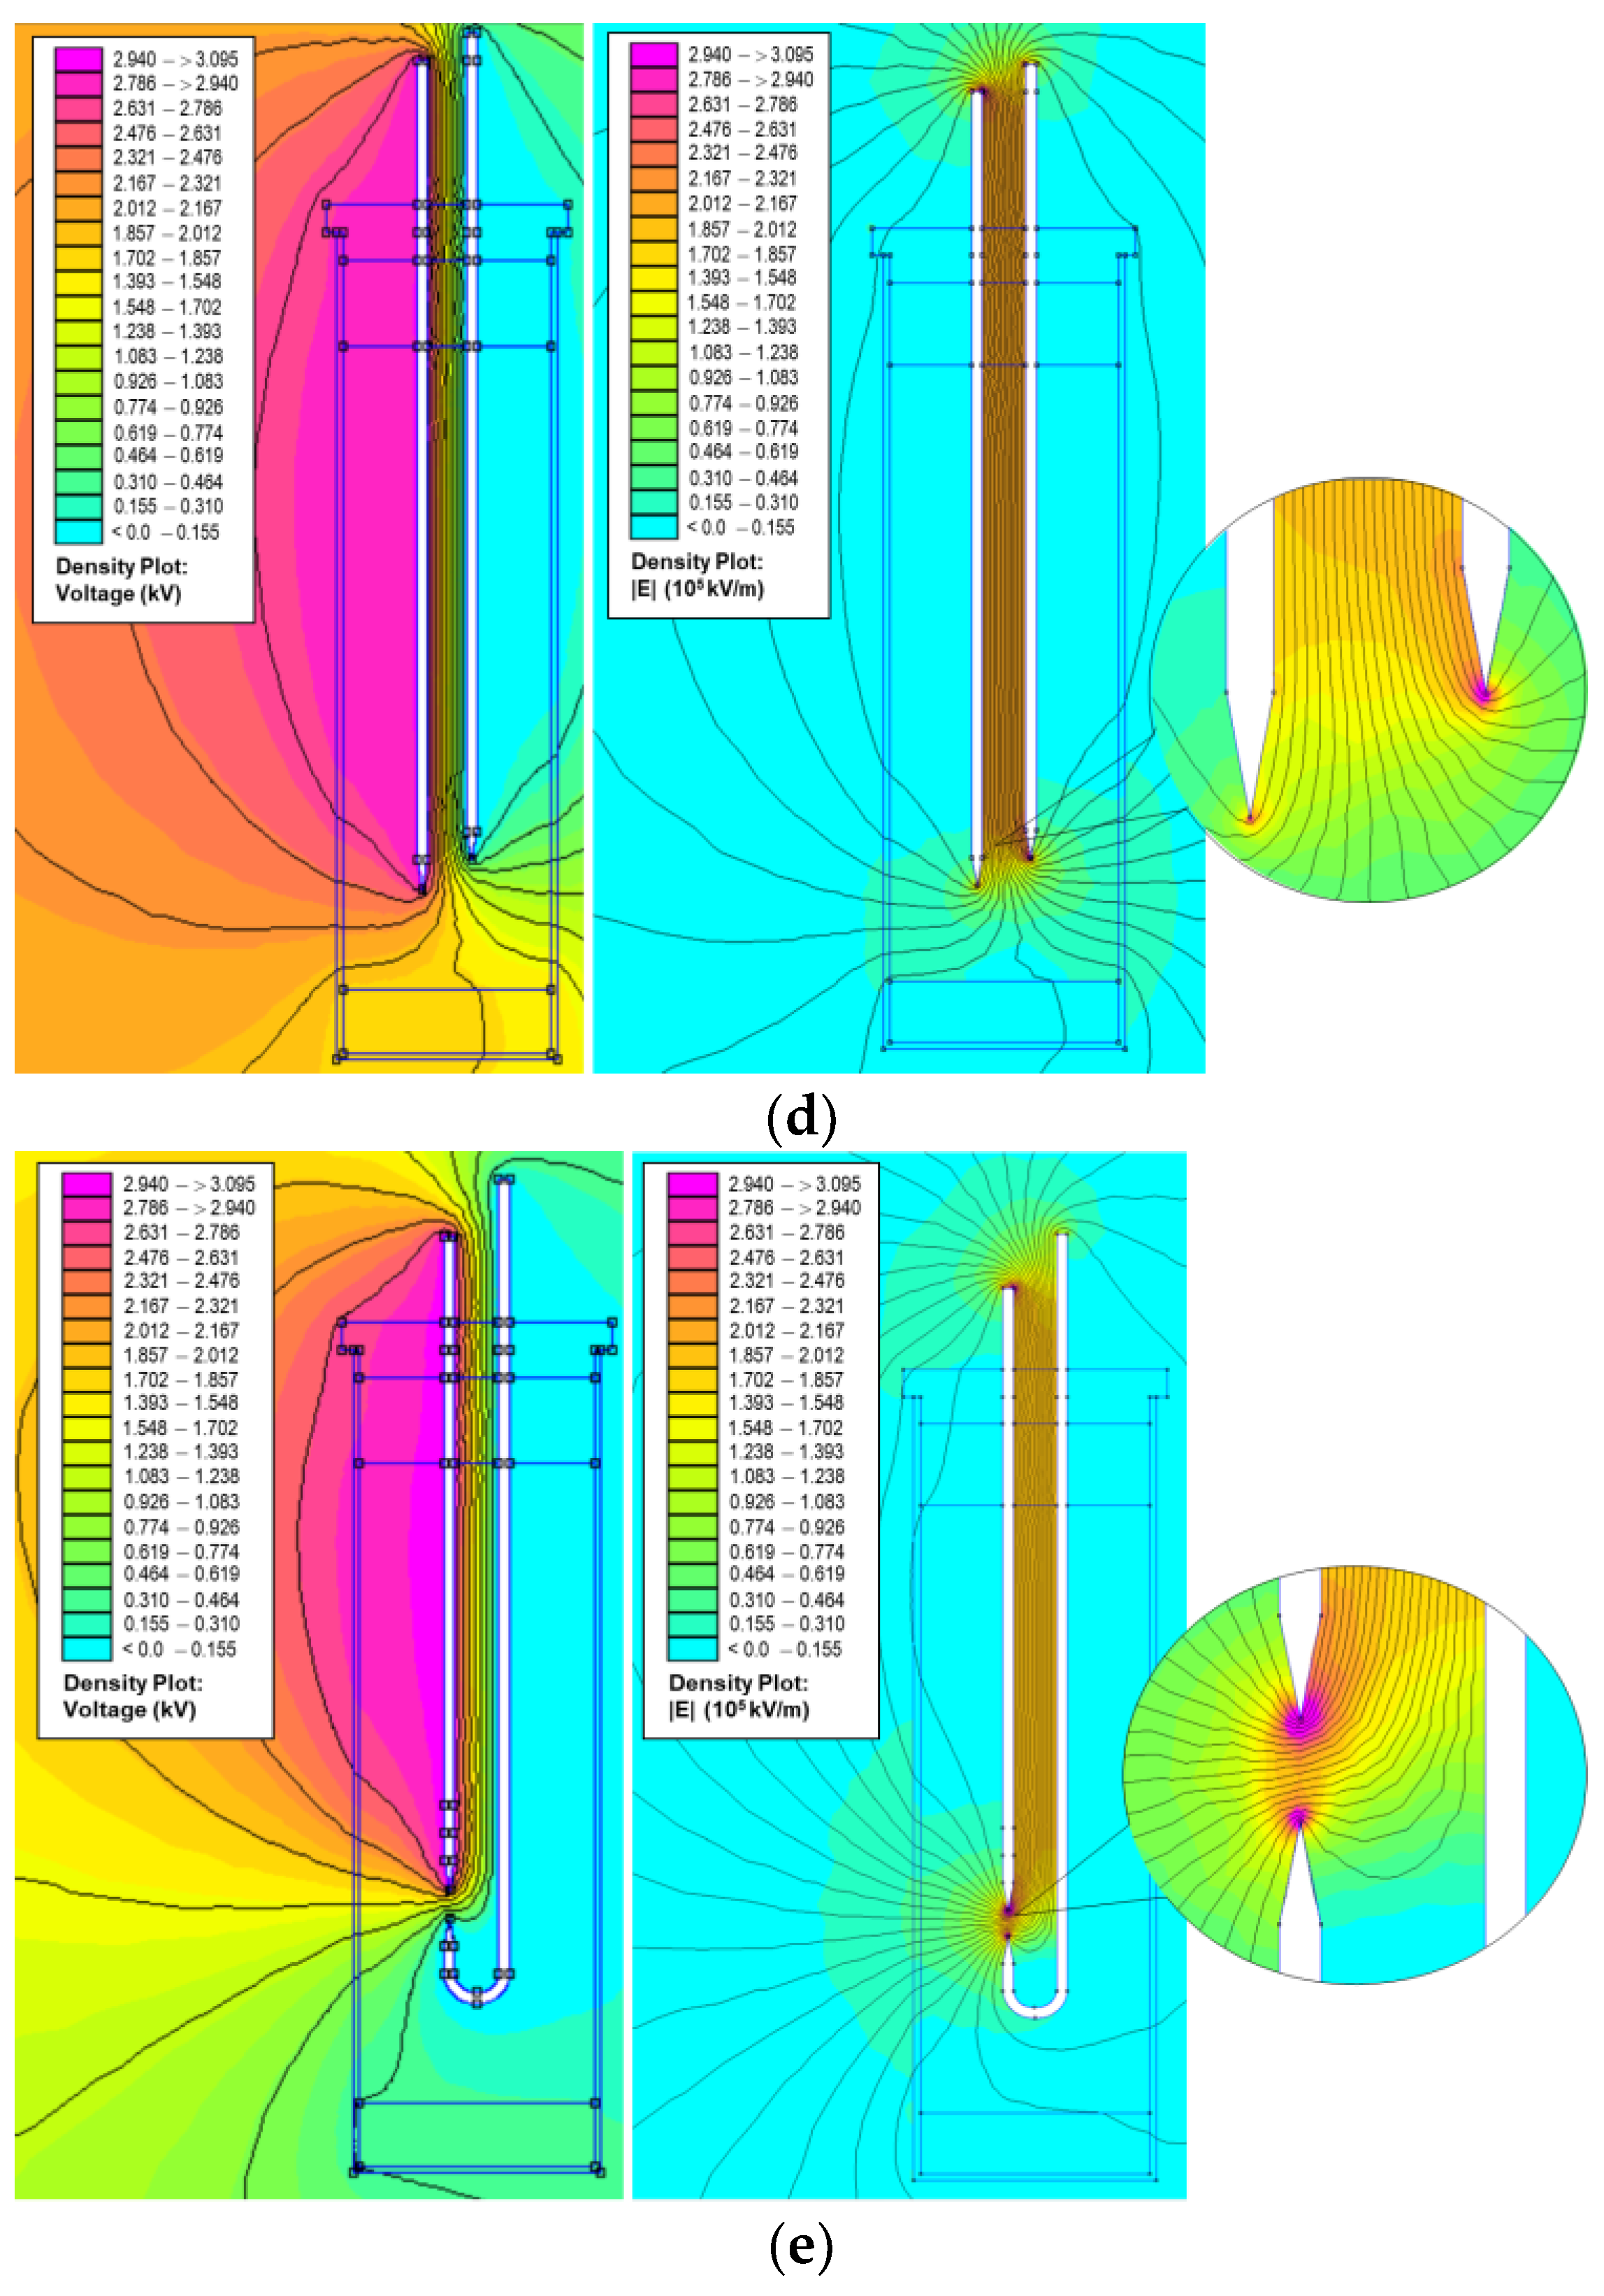
3.1.4. Electric Field Distribution Using Finite Element Method Magnetics Simulation

The electric field strength and corona discharge of five different electrode configurations in the EDS process with applied AC at 3 kV and the distance between electrodes of 3 cm were investigated using the Finite Element Method Magnetics (FEMM 4.2) simulation. The simulation results are shown in Figure 12, in which the lines represent the equipotential lines and shades of color represent the electric field distribution and electric field strength (V/m). The dark pink color corresponds to the highest electric field strength, whereas the blue color corresponds to the lower one. As shown in Figure 12a–d, the electric field distribution is uniform for bar and point electrode configurations, while the non-uniform electric field distribution is observed with the point-to-point electrode configuration (Figure 12e). In a uniform electric field, the equipotential lines are parallel and evenly spaced, so that the electric field vector has the same magnitude and direction at every point. However, in a non-uniform electric field, the equipotential lines tend to be curved and are more concentrated near the tip of electrodes where the charges are generated, resulting in a stronger electric field stress. As shown in all figures, the high intensity of the electric field is located near the tips of electrodes, especially with the sharp point electrodes. However, the highest electric field stress is observed in the point-to-point configuration. Under a high electric field strength, electron pairs are generated because of the ionization. With sufficient energy in a kV range, chemical bonds can be broken, promoting electrons from the valence band into the conduction band. Then, electrons are freely moved from one region to another region as free electrons. Hence, the number of free electrons generated between two metal electrodes is directly proportional to the electric field strength. Finally, the separation efficiency is increased with the electric field strength. Therefore, the point-to-point configuration was suitable for the EDS process and selected for further investigations.

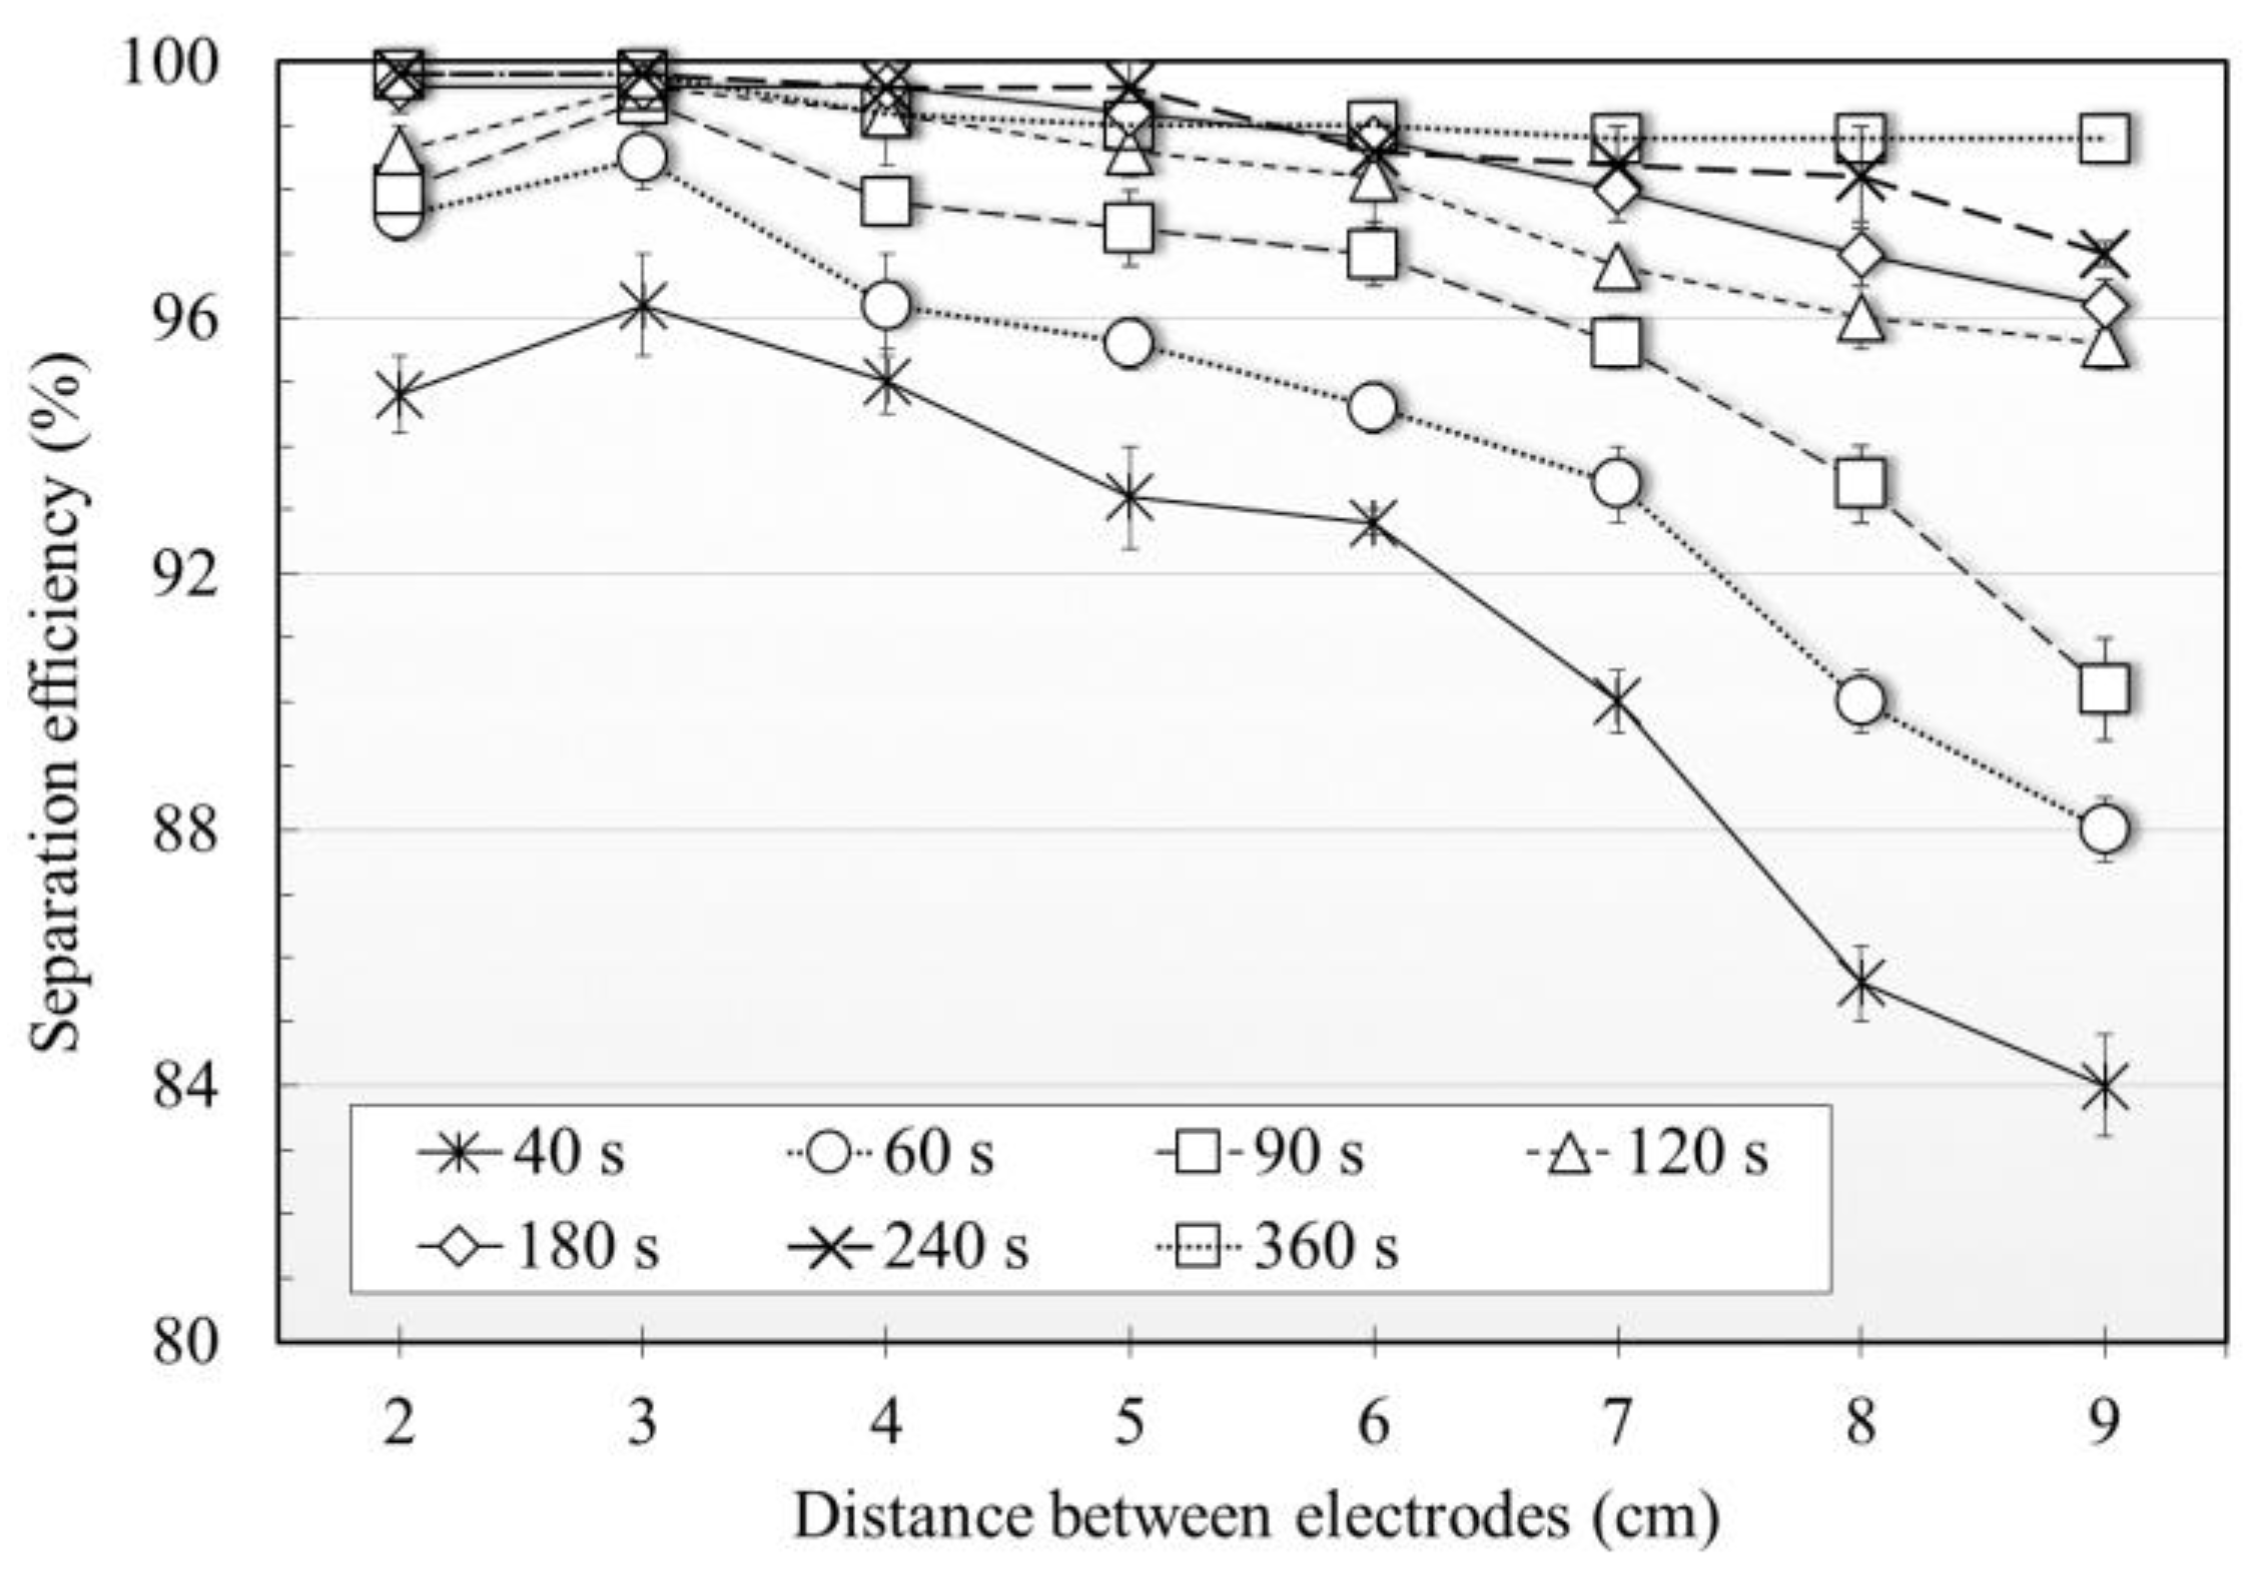
3.2. Effect of Separation Time

By applying the EDS with the AC electrical current at high voltage to the biodiesel-glycerol mixture, a clear interface between the biodiesel and glycerol layers was first observed at a short separation time within 40–60 s. However, the purity of the final biodiesel product did not meet the standards, and the remaining catalyst and soap contents were still high. In order to meet the standards and to reduce the remaining catalyst, the separation time was, therefore, extended to 600 s. Figure 13 shows the effect of the separation time (30 s to 600 s) on the separation efficiency in the variation of applied AC voltages using the point-to-point electrode configuration and a distance between the two electrodes of 3 cm. As seen in the figure, the removal of glycerol was faster for the applied AC voltages higher than 3 kV. In order to achieve more than 99% separation efficiency, the separation time had to be longer than 120 s for an applied AC voltage greater than 3 kV. The optimal condition for the EDS separation process with the maximum separation efficiency of 99.8% was determined at the shortest separation time and low energy consumption (low applied AC voltage). It was found that the optimum condition for point-to-point electrode configuration was 3 kV, and a separation time of 240 s. After 240 s, the separation efficiency was not significantly different for a 3 to 9 kV applied voltage because of the destabilizing effect at low particle concentration of glycerol in the biodiesel-rich phase, as is visually clear in the upper phase. For the 1 kV applied voltage, it took more than 420 s to reach the separation efficiency of 99.8%. At an optimum voltage of 3 kV, the operation is safe and the risk of sparking and breakdown voltage is lower. Note that, in other applications in oil [46,47,48,49], the applied high voltage in the range of 20 kV to 200 kV at high frequency (kHz) with a small distance between electrodes in millimeters (mm) posed a substantial risk of sparkling and dielectric breakdown.
As shown in Figure 14, the clear interface between biodiesel and glycerol layers of EDS was observed faster than GS. In GS, only the intensity of the color change can be observed, but in EDS the different sizes of the crude glycerol droplets were produced under the influence of high electric field and then settled down. However, it would not be certain that glycerol was completely separated from the biodiesel phase until the detailed chemical composition was analyzed. Therefore, the remaining soap and catalyst values, including the methyl ester content, were determined and correlated with the separation time.

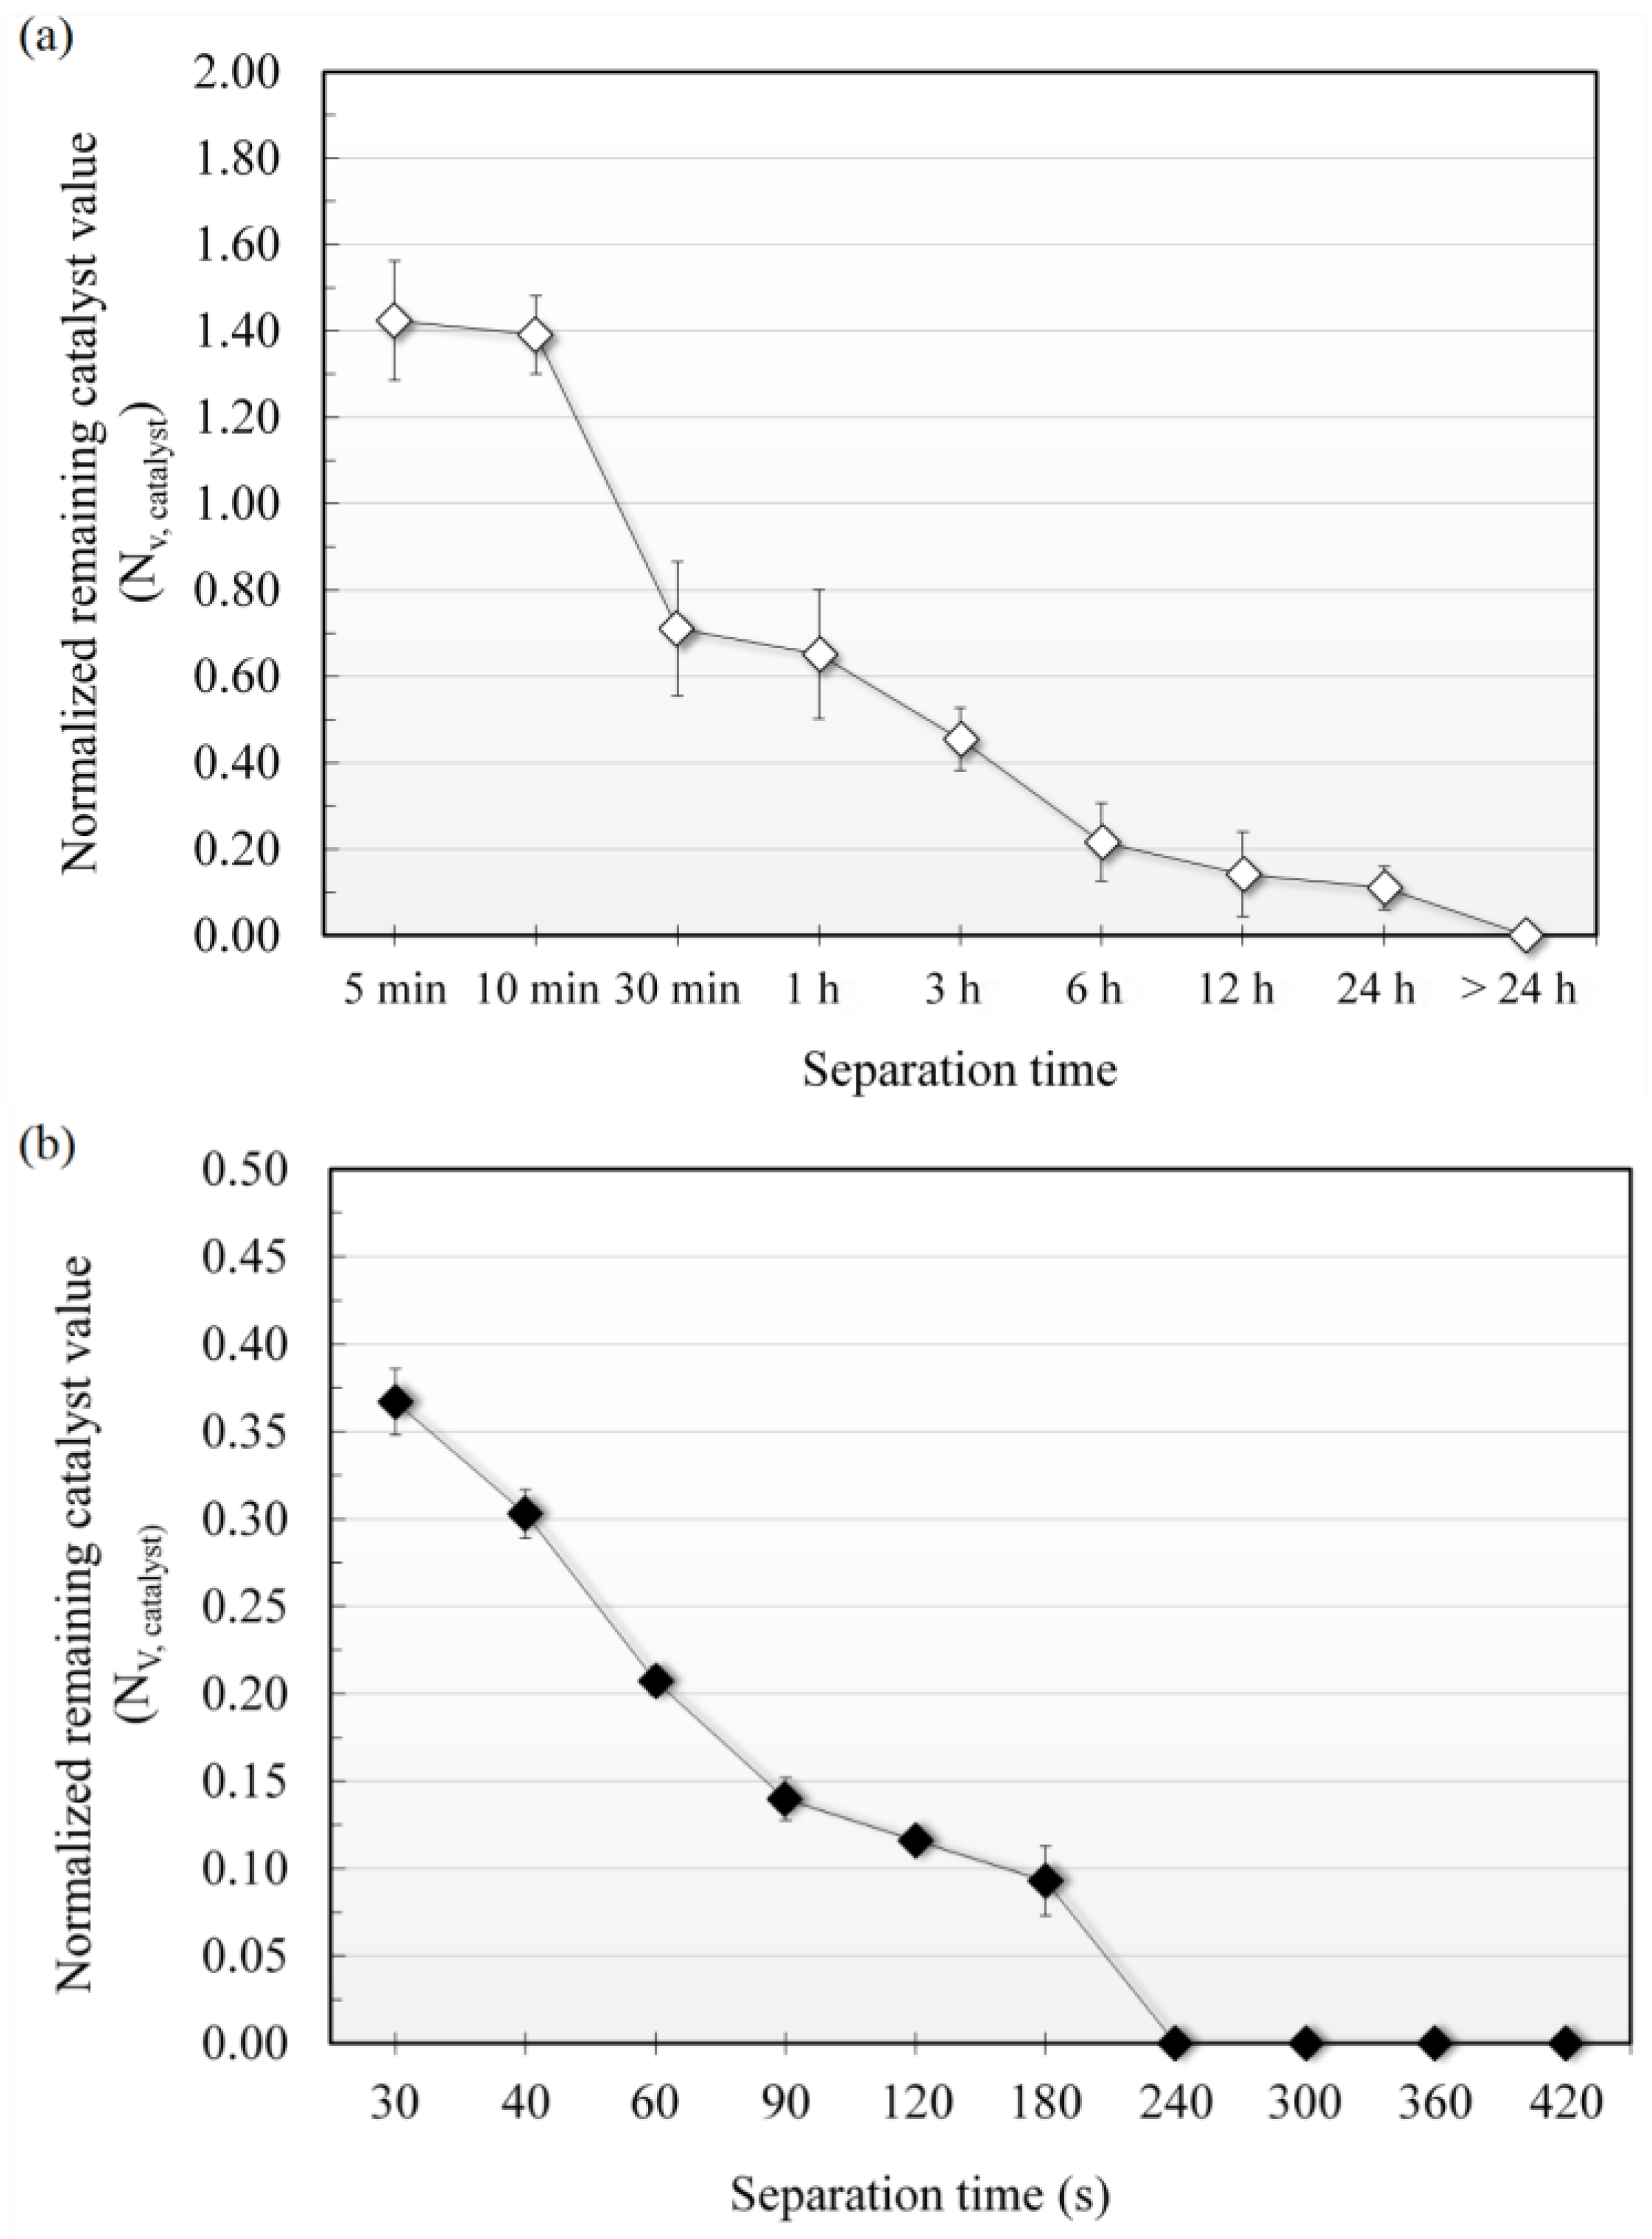
3.3. Effect of Remaining Catalyst Content

For a conventional biodiesel production process, biodiesel can be contaminated with glycerol, the homogenous catalyst, and the remaining excess methanol. It is essential to remove these chemicals in order to meet the acceptable standards. Generally, the catalyst is simultaneously removed from biodiesel via the precipitation of glycerol using the gravitational method, because of the polarity of both species. However, the trace amount of catalyst still remains in the biodiesel phase. Figure 15a,b show the normalized remaining catalyst value versus separation time for gravitational settling (GS) and electrically driven separation (EDS), respectively. As shown in Figure 15a, for GS a longer separation time results in a decrease in the normalized remaining catalyst value. It takes more than 24 h to totally eliminate the remaining catalyst from the biodiesel. As show in Figure 15b, in contrast to the GS method, EDS shows much shorter separation time compared to the GS method. Hence, the EDS significantly improved the catalyst removal process. The remaining catalyst was totally removed from biodiesel within 240 s due to the fast separation of the glycerol from the biodiesel using EDS, as previously discussed.

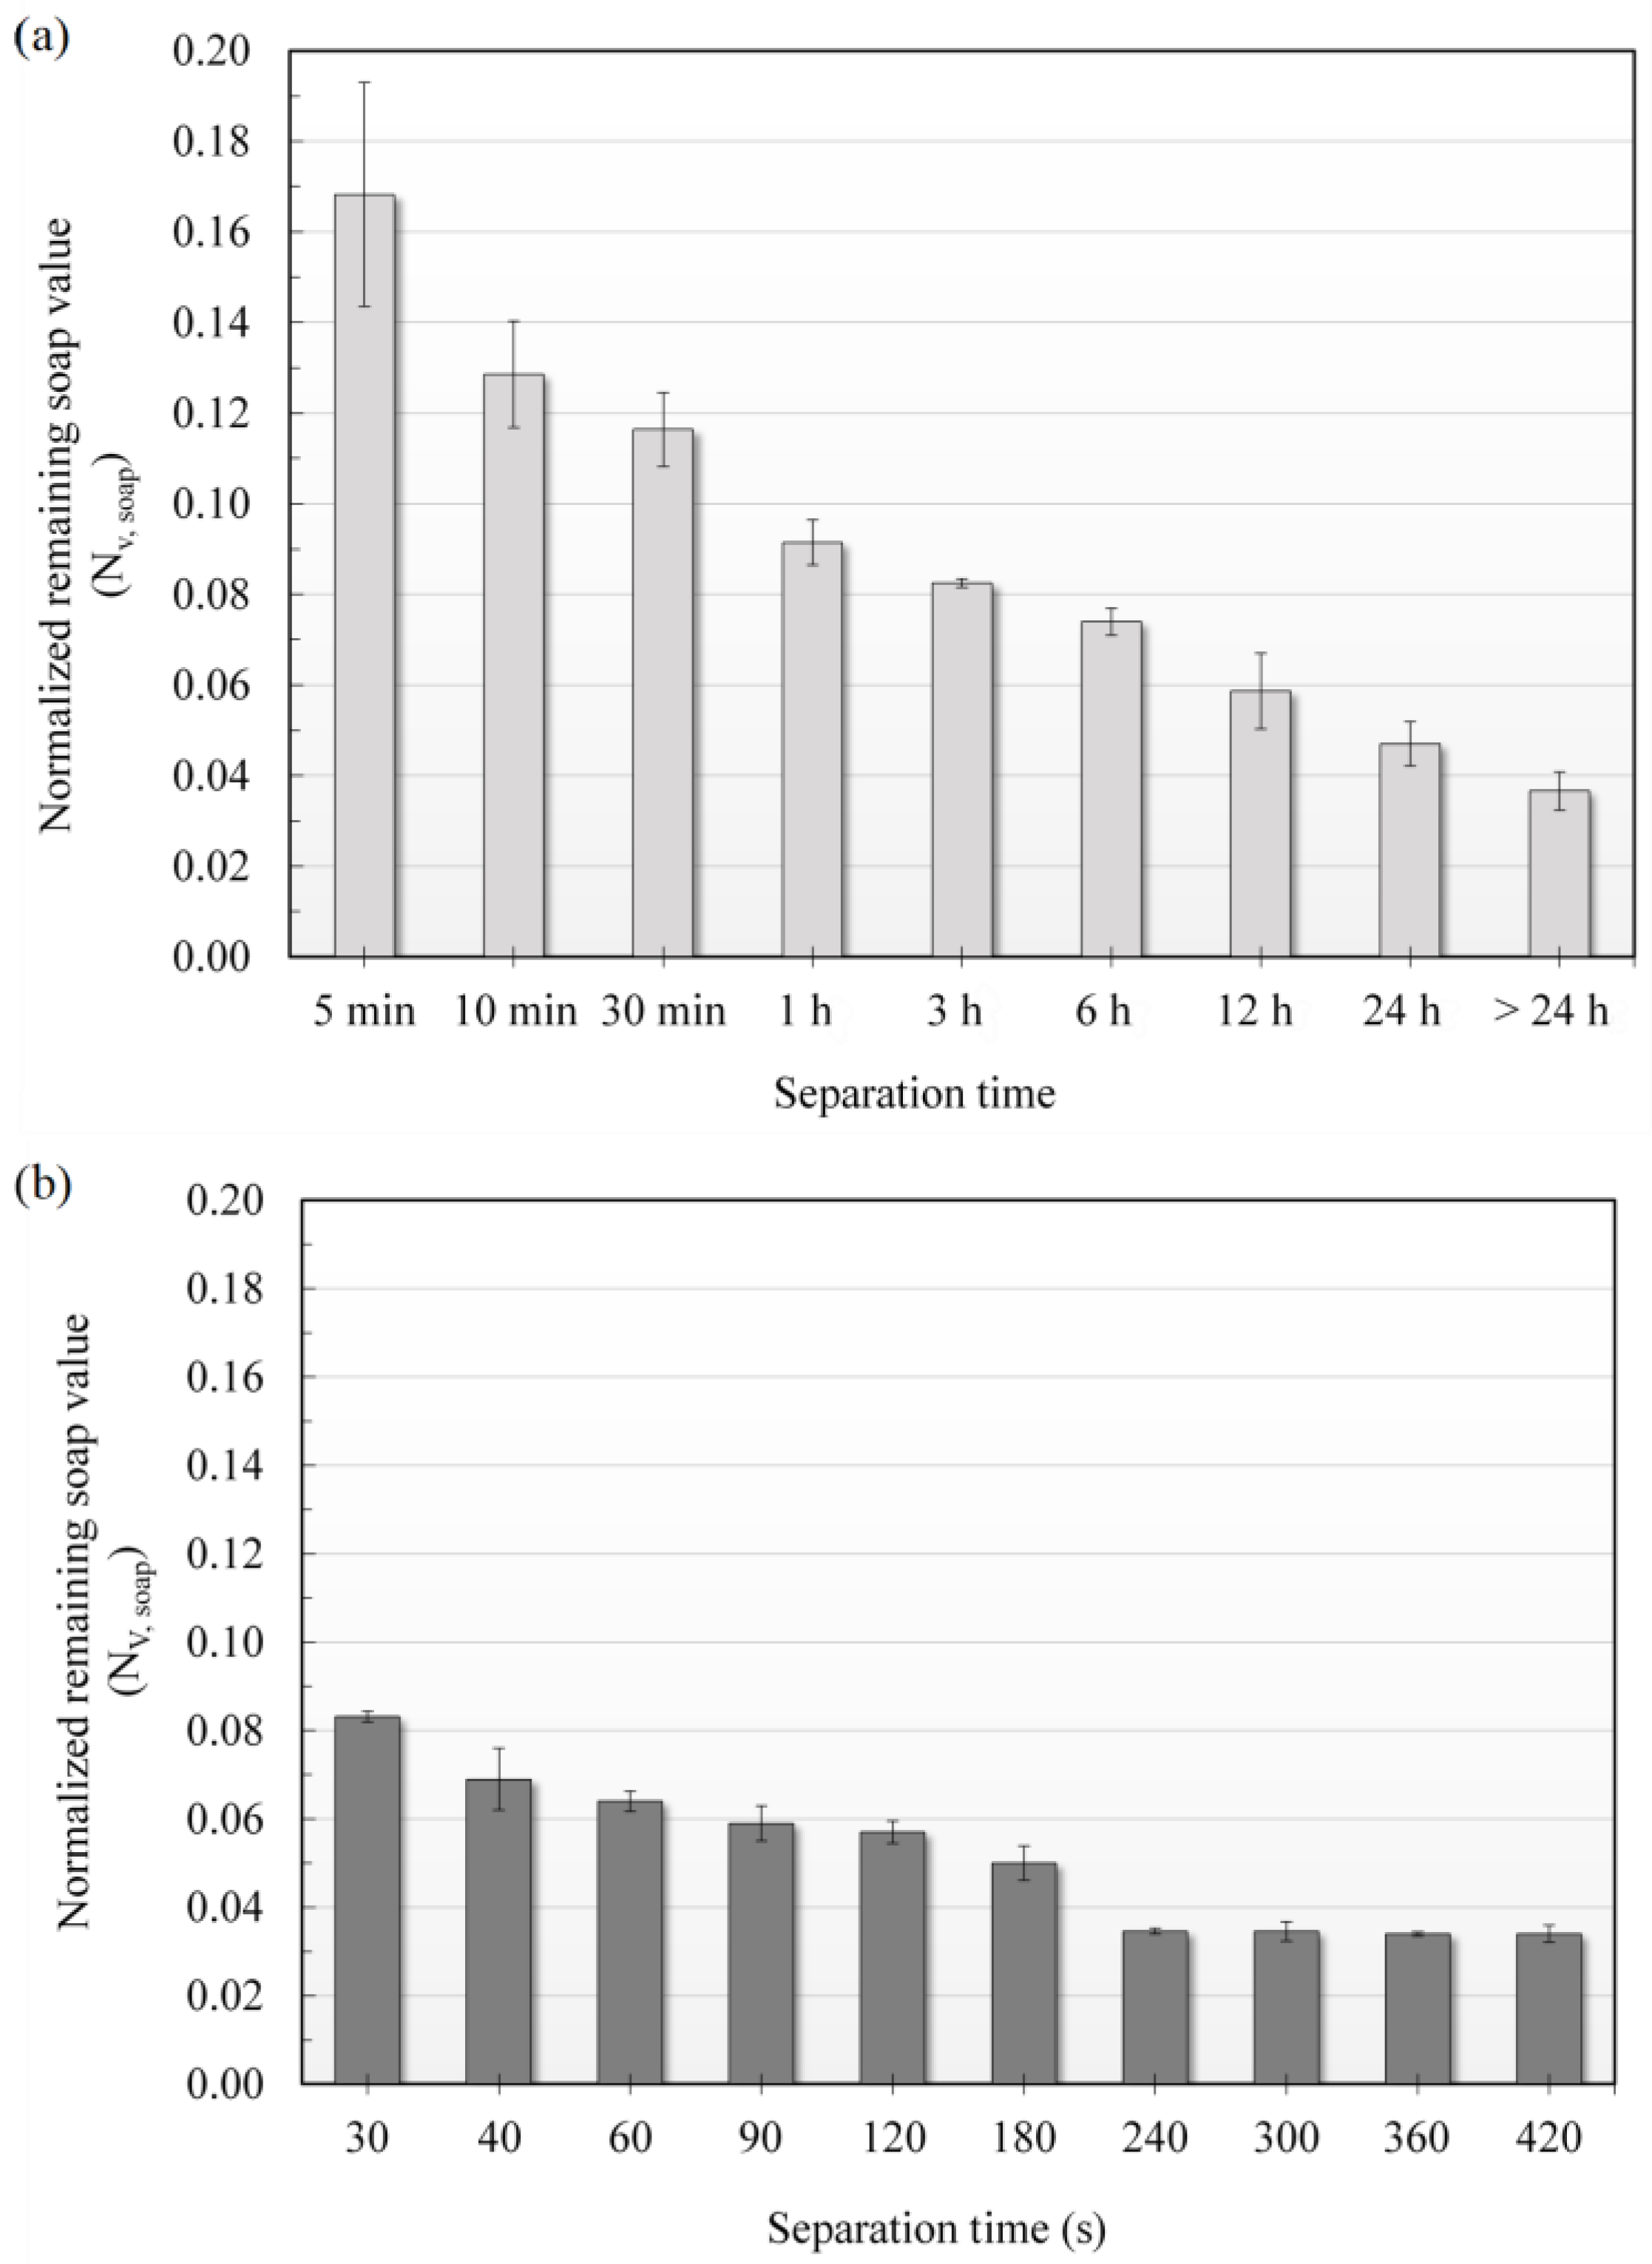
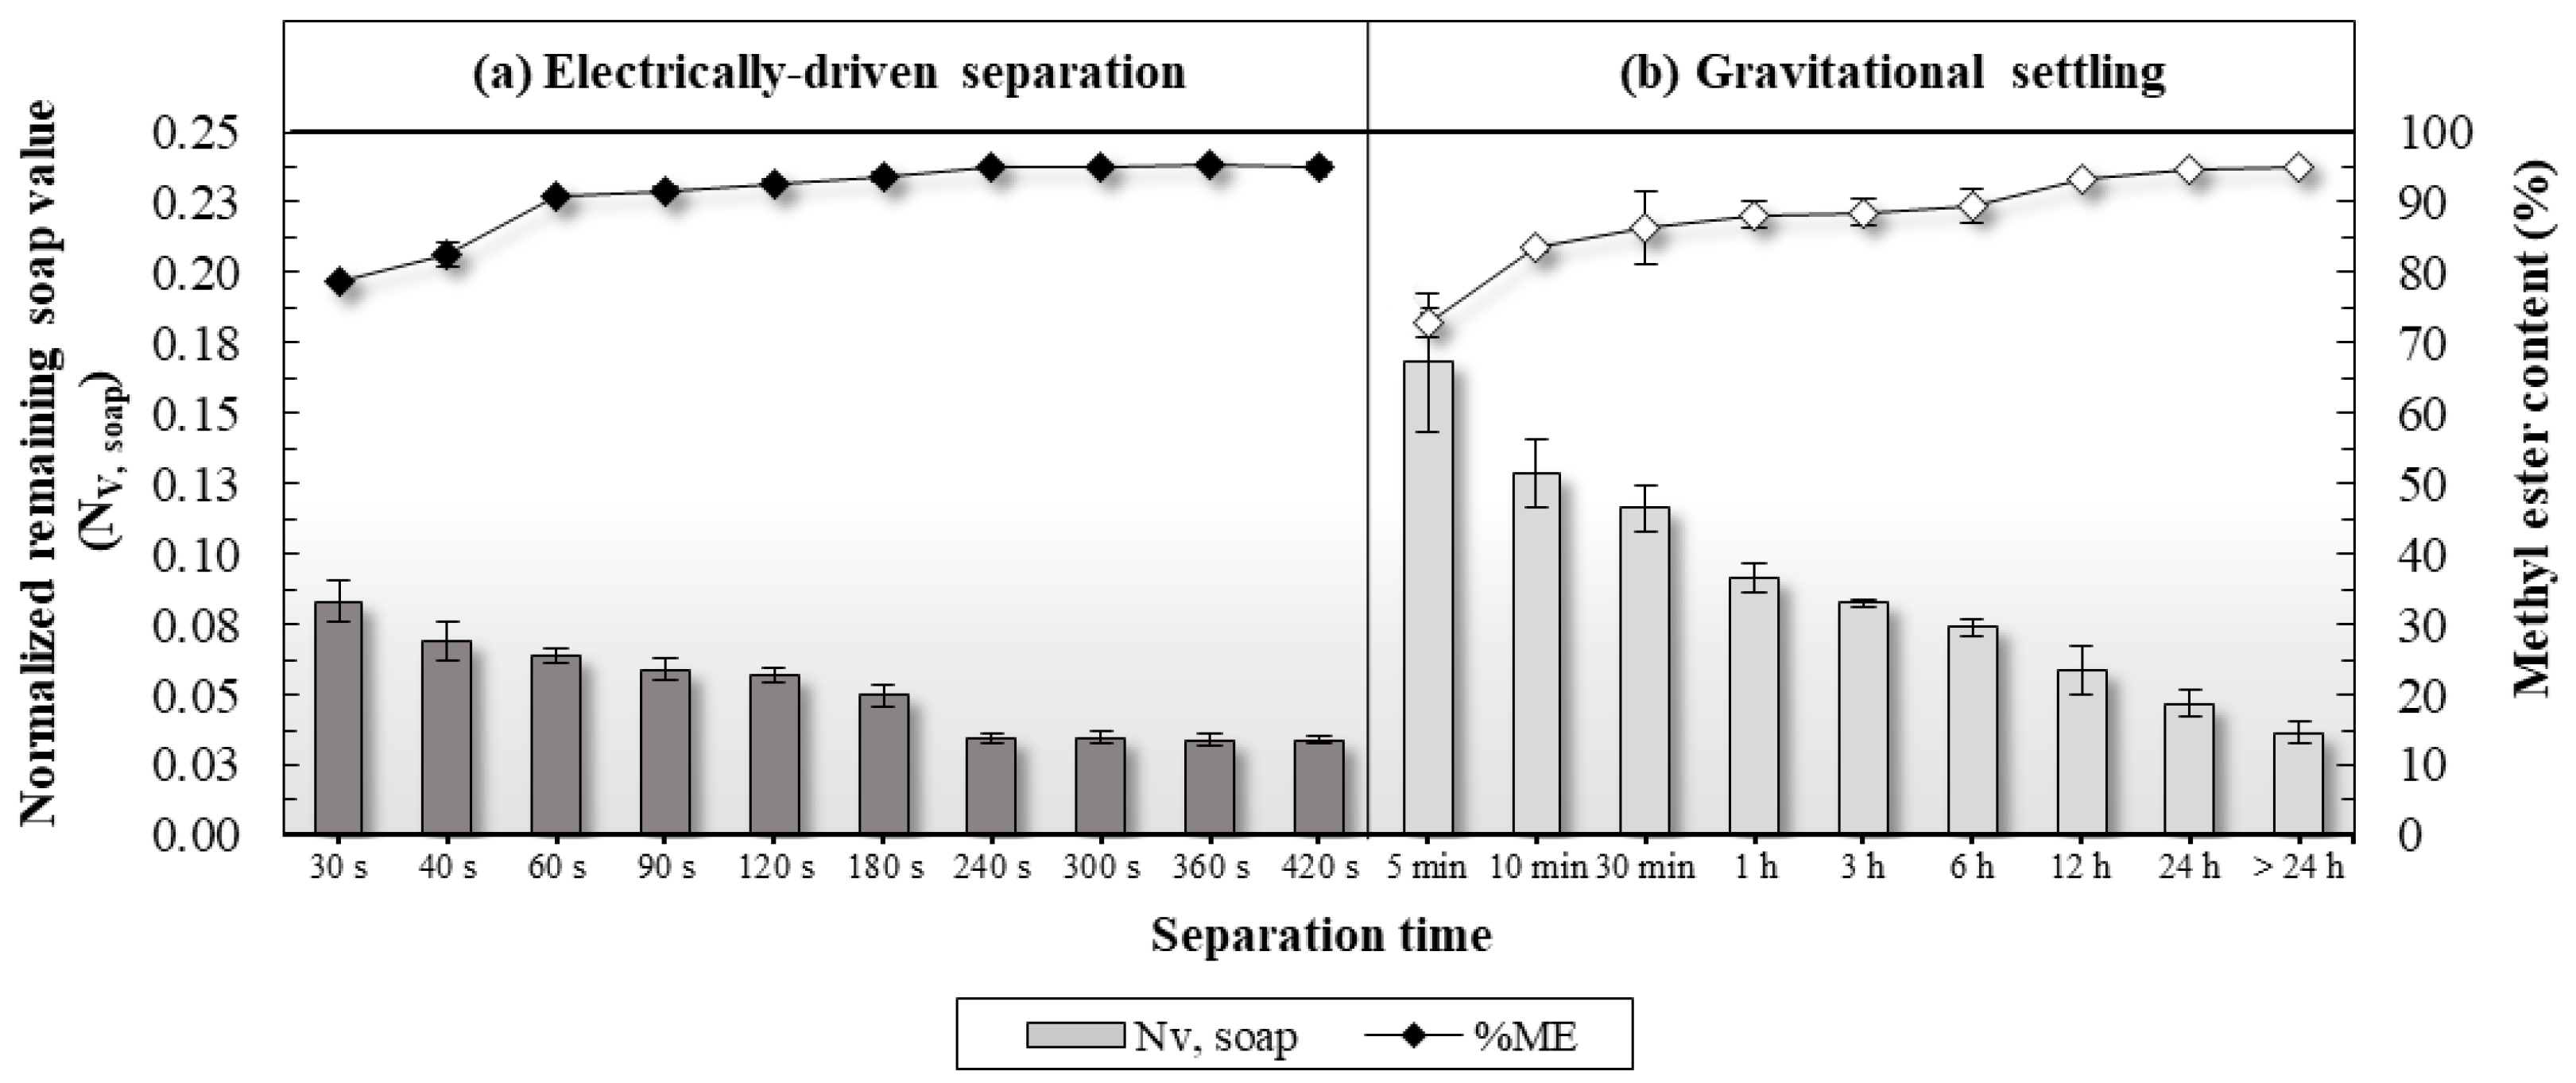
3.4. Effect of Remaining Soap Content

In the biodiesel production process, soap can be formed from the reaction of the remaining catalyst and glycerol in the presence of water. The soap must be removed from the biodiesel by washing with water, because the soap can lead to an emulsion formation in the biodiesel, requiring longer washing time, and resulting in a loss of biodiesel yield during purification during the washing process. Therefore, the removal of glycerol and catalyst from the biodiesel is a crucial step in preventing a saponification reaction. This study investigated the soap value content using the titration method, as depicted in Figure 16a,b, which show the normalized remaining soap value versus the separation time for GS and EDS, respectively. As shown in Figure 16a, GS required a separation time of more than 24 h in order to obtain the lowest normalized concentration of remaining soap value of 0.037. For the EDS separation process, the normalized concentration of remaining soap value in the biodiesel layer gradually decreased from 0.083 at a separation time of 30 s to 0.050 at a separation time of 180 s. After that, it obviously decreased to 0.035 at the separation time of 240 s. However, the separation time showed no significant decrease in the normalized concentration of the remaining soap value after 240 s. This is due to the fact that the catalyst and glycerol were efficiently eliminated from the biodiesel during the EDS process, resulting in less soap formation, as discussed in the previous section.

3.5. Effect of Methyl Ester Content

Figure 17 shows the methyl ester content at various times of EDS (a) and GS (b), respectively. For EDS, the percentage of methyl ester content increased with the separation time. It is good to remember that, for the biodiesel production process, the methyl ester content of 90% before purification is considerably high. For the EDS process it takes only 60 s to meet the ester content of 90.9 ± 0.5%, as shown in Figure 17a, whereas for GS it takes more than 12 h to meet the ester content of 93.3 ± 0.2%, as shown in Figure 17b. This is because most of the contaminants were removed for the EDS process, resulting in a more purified product. According to Thai commercial standards [50] and international standards [14,51], the required methyl ester content should be at least 96.5 wt%. Though the ester content from the EDS process did not meet the requirements, a further purification process is necessary for a higher percentage of methyl ester content, such as water washing, etc.

3.6. Characterization of Biodiesel from RPO

The specifications of biodiesel obtained from the EDS separation process are shown in Table 2. The results show that all of the main properties meet the standards using either the ASTM or EN methods. Interestingly, after washing only three times with warm water, the ester content of the biodiesel from the EDS separation process was 98.5 ± 0.25 wt%, which is notably high compared to the conventional process after washing five times with warm water. The acid value of such a product was also low. Generally, all parameters met the requirements. Moreover, the contents of the mono-, di-, and tri-glycerides, the total glycerol and free glycerol met the standard requirements. The present research has demonstrated that the EDS process shows high separation efficiency, and is a time-saving process. This method can also be applied to other multi-component mixtures such as oil-in-water, biodiesel mixture, phase separation during solvent extraction, metals recycle with hydrometallurgical methods of reactive extraction, in-situ product removal from fermentation, and many others.

4. Conclusions

In summary, the separation of biodiesel from glycerol and other components was conducted using the EDS separation process by applying AC high voltage and low current. The iron (Fe) point-to-point electrodes, with the vertical distance (d) between electrodes of 3 cm, yielded the highest separation efficiency of 99.8% within the separation time of 240 s. The EDS process can eliminate the catalyst and reduce soap content in the biodiesel product, which is much better than using the GS method. Based on the standard methods of ASTM and EN, the final properties of the biodiesel product met the requirements, with two times of water washing being sufficient. Table 3 provides a summary of the performance between the gravitational setting and the electrically driven separation process, and it is confirmed that the EDS process has proven to be a novel method for separating biodiesel from glycerol and other components.
For commercialization, the electrically driven separation technology must be further explored and the optimized condition must be determined for the scale-up. Our research laboratory has intensively investigated the correlation between electrical, chemical, and material parameters that affect separation efficiency, as well as the coalescence–sedimentation model for the liquid–liquid separation. These results will be presented in future articles.

Author Contributions

Conceptualization, T.K.; methodology, R.A.; validation, R.A. and T.K.; formal analysis, R.A. and A.B.; investigation, R.A., A.B. and S.R.; resources, T.S. and K.C.; data curation, R.A., A.B. and S.R.; writing—original draft preparation, R.A.; writing—review and editing, K.C. and T.K.; visualization, R.A.; supervision, T.K.; project administration, T.K.; funding acquisition, T.K. All authors have read and agreed to the published version of the manuscript.

Funding

The authors would like to thank King Mongkut’s University of Technology, North Bangkok (Research Grant Contract No. KMUTNB-GOV-58-17), and the non-disclosure local biodiesel producer in Thailand for the financial support.

Institutional Review Board Statement

Not applicable.

Informed Consent Statement

Not applicable.

Conflicts of Interest

The authors declare no conflict of interest.

References

  1. Barnwal, B.K.; Sharma, M.P. Prospects of biodiesel production from vegetable oils in India. Renew. Sustain. Energy Rev. 2005, 9, 363–378. [Google Scholar] [CrossRef]
  2. Fukuda, H.; Kondo, A.; Noda, H. Biodiesel fuel production by transesterification of oils. J. Biosci. Bioeng. 2001, 92, 405–416. [Google Scholar] [CrossRef] [PubMed]
  3. Musa, I.A. The effects of alcohol to oil molar ratios and the type of alcohol on biodiesel production using transesterification process. Egypt. J. Pet. 2016, 25, 21–31. [Google Scholar] [CrossRef] [Green Version]
  4. Ma, F.; Hanna, M.A. Biodiesel production: A review. Bioresour. Technol. 1999, 70, 1–15. [Google Scholar] [CrossRef]
  5. Da Silva, N.D.L.; Garnica, J.A.G.; Batistella, C.B.; Maciel, M.R.W.; Filho, R.M. Use of experimental design to investigate biodiesel production by multiple-stage Ultra-Shear reactor. Bioresour. Technol. 2011, 102, 2672–2677. [Google Scholar] [CrossRef] [Green Version]
  6. Baroutian, S.; Aroua, M.K.; Raman, A.A.A.; Sulaiman, N.M.N. A packed bed membrane reactor for production of biodiesel using activated carbon supported catalyst. Bioresour. Technol. 2011, 102, 1095–1102. [Google Scholar] [CrossRef]
  7. Moyo, L.B.; Iyuke, S.E.; Muvhiiwa, R.F.; Simate, G.S.; Hlabangana, N. Application of response surface methodology for optimization of biodiesel production parameters from waste cooking oil using a membrane reactor. S. Afr. J. Chem. Eng. 2021, 35, 1–7. [Google Scholar] [CrossRef]
  8. Pitt, F.D.; Domingos, A.M.; Barros, A.A.C. Purification of residual glycerol recovered from biodiesel production. S. Afr. J. Chem. Eng. 2019, 29, 42–51. [Google Scholar] [CrossRef]
  9. Mendow, G.; Querini, C.A. High performance purification process of methyl and ethyl esters produced by transesterification. Chem. Eng. J. 2013, 228, 93–101. [Google Scholar] [CrossRef]
  10. Predojević, Z.J. The production of biodiesel from waste frying oils: A comparison of different purification steps. Fuel 2008, 87, 3522–3528. [Google Scholar] [CrossRef]
  11. Abbaszadeh, A.; Ghobadian, B.; Najafi, G.; Yusaf, T. An experimental investigation of the effective parameters on wet washing of biodiesel purification. Int. J. Automot. Mech. Eng. 2014, 9, 1525–1537. [Google Scholar] [CrossRef]
  12. KoohiKamali, S.; Tan, C.P.; Ling, T.C. Optimization of Sunflower Oil Transesterification Process Using Sodium Methoxide. Sci. World J. 2012, 1–8. [Google Scholar] [CrossRef] [Green Version]
  13. Gomes, M.C.S.; Arroyo, P.A.; Pereira, N.C. Influence of acidified water addition on the biodiesel and glycerol separation through membrane technology. J. Membr. Sci. 2013, 431, 28–36. [Google Scholar] [CrossRef]
  14. EN 14214; Liquid Petroleum Products—Fatty Acid Methyl Esters (FAME) for Use in Diesel Engines and Heating Applications—Requirements and Test Methods. European Committee for Standardization: Brussels, Belgium, 2012.
  15. Eyvaz, M.; Kirlaroglu, M.; Aktas, T.S.; Yuksel, E. The effects of alternating current electrocoagulation on dye removal from aqueous solutions. Chem. Eng. J. 2009, 153, 16–22. [Google Scholar] [CrossRef]
  16. Vasudevan, S.; Lakshmi, J.; Sozhan, G. Effects of alternating and direct current in electrocoagulation process on the removal of cadmium from water. J. Hazard. Mater. 2011, 192, 26–34. [Google Scholar] [CrossRef]
  17. Cerqueira, A.A.; Souza, P.S.A.; Marques, M.R.C. Effects of direct and alternating current on the treatment of oily water in an electroflocculation process. Braz. J. Chem. Eng. 2014, 31, 693–701. [Google Scholar] [CrossRef] [Green Version]
  18. Kamaraj, R.; Ganesan, P.; Lakshmi, J.; Vasudevan, S. Removal of copper from water by electrocoagulation process—Effect of alternating current (AC) and direct current (DC). Environ. Sci. Pollut. Res. 2012, 20, 399–412. [Google Scholar] [CrossRef]
  19. Xu, T.; Zhou, Y.; Hu, B.; Lei, X.; Yu, G. Comparison between sinusoidal AC coagulation and conventional DC coagulation in removing Cu2+ from printed circuit board wastewater. Ecotoxicol. Environ. Saf. 2020, 197, 110629. [Google Scholar] [CrossRef]
  20. Prica, M.; Adamovic, S.; Dalmacija, B.; Rajic, L.; Trickovic, J.; Rapajic, S.; Becelic-Tomin, M. The electrocoagulation/flotation study: The removal of heavy metals from the waste fountain solution. Process Saf. Environ. Prot. 2015, 94, 262–273. [Google Scholar] [CrossRef]
  21. Ehsani, H.; Mehrdadi, N.; Asadollahfardi, G.; Bidhendi, G.N.; Azarian, G. A new combined electrocoagulation-electroflotation process for pretreatment of synthetic and real Moquette-manufacturing industry wastewater: Optimization of operating conditions. J. Environ. Chem. Eng. 2020, 8, 104263. [Google Scholar] [CrossRef]
  22. Nasrullah, M.; Singh, L.; Wahid, Z.A. Treatment of sewage by electrocoagulation and the effect of high current density. Energy Environ. Eng. 2012, 1, 27–31. [Google Scholar] [CrossRef]
  23. Gregory, J. Flocculation Fundamentals. In Encyclopedia of Colloid and Interface Science; Tadros, T., Ed.; Springle: Berlin/Heidelberg, Germany, 2013; pp. 459–491. [Google Scholar]
  24. Eow, J.S.; Ghadiri, M.; Sharif, A.O.; Williams, T.J. Electrostatic enhancement of coalescence of water droplets in oil: A review of the current understanding. Chem. Eng. J. 2001, 84, 173–192. [Google Scholar] [CrossRef]
  25. Wang, Z.; Dong, K.; Tian, L.; Wang, J.; Tu, J. Numerical study on coalescence behavior of suspended drop pair in viscous liquid under uniform electric field. AIP Adv. 2018, 8, 85215. [Google Scholar] [CrossRef] [Green Version]
  26. Bashkir, I.; Defraeye, T.; Kudra, T.; Martynenko, A. Electrohydrodynamic Drying of Plant-Based Foods and Food Model Systems. Food Eng. Rev. 2020, 12, 473–497. [Google Scholar] [CrossRef]
  27. Sun, A.; Zhuang, J.; Huo, C. Formation mechanism of streamer discharges in liquids: A review. High Volt. 2016, 1, 74–80. [Google Scholar] [CrossRef]
  28. Tian, J.; Zhao, T.; Zhou, Z.; Chen, B.; Wang, J.; Xiong, J. Isolated moving charged droplet evaporation characteristics in electrostatic field with highly volatile R134a. Int. J. Heat Mass Transf. 2021, 178, 121583. [Google Scholar] [CrossRef]
  29. Chen, J.; Davidson, J.H. Model of the Negative DC Corona Plasma: Comparison to the Positive DC Corona Plasma. Plasma Chem. Plasma Proc. 2003, 23, 83–102. [Google Scholar] [CrossRef]
  30. Goldman, M.; Goldman, A.; Sigmond, R. The corona discharge, its properties and specific use. Pure Appl. Chem. 1985, 57, 1353–1362. [Google Scholar] [CrossRef] [Green Version]
  31. Vaddi, R.S.; Guan, Y.; Mamishev, A.; Novosselov, I. Analytical model for electrohydrodynamic thrust. Proc. R. Soc. A Math. Phys. Eng. Sci. 2020, 476, 20200220. [Google Scholar] [CrossRef]
  32. Johansson, K.S. Surface Modification of Plastics. In Applied Plastics Engineering Handbook; William Andrew Publishing: Norwich, NY, USA, 2017; pp. 443–487. [Google Scholar]
  33. Florkowski, M.; Krześniak, D.; Kuniewski, M.; Zydroń, P. Partial Discharge Imaging Correlated with Phase-Resolved Patterns in Non-Uniform Electric Fields with Various Dielectric Barrier Materials. Energies 2020, 13, 2676. [Google Scholar] [CrossRef]
  34. Basiry, M.; Esehaghbeygi, A. Electrohydrodynamic (EHD) drying of rapeseed (Brassica napus L.). J. Electrost. 2010, 68, 360–363. [Google Scholar] [CrossRef]
  35. Abdul Madhar, S.; Mráz, P.; Rodrigo Mor, A.; Ross, R. Study of Corona Configurations under DC Conditions and Recommendations for an Identification Test Plan. Int. J. Electr. Power Energy Syst. 2020, 118, 105820. [Google Scholar] [CrossRef]
  36. EN 14105; Fat and Oil Derivatives. Fatty acid Methyl Esters (FAME). Determination of Free and Total Glycerol and Mono-, di-, Triglyceride Contents (Reference Method). European Committee for Standardization: Brussels, Belgium, 2011.
  37. European Standard of EN 14103; Fat and Oil Derivatives–Fatty Acid Methyl Esters (FAME)—Determination of Ester and Linolenic Acid Methyl Ester Contents. European Committee for Standardization, Management Centre: Brussels, Belgium, 2003.
  38. AOCS. Official and Tentative Methods of the American Oil Chemists’ Society, 4th ed.; Methods Cc 15-60 and Cc17-95; AOCS: Champaign, IL, USA, 1989; Volume 4. [Google Scholar]
  39. Okullo, A.; Ogwok, P.; Temu, A.K.; Ntalikwa, J.W. Gas Chromatographic Determination of Glycerol and Triglycerides in Biodiesel from Jatropha and Castor Vegetable Oils. Adv. Mater. Res. 2013, 824, 436–443. [Google Scholar] [CrossRef]
  40. Baruah, N.; Maharana, M.; Nayak, S.K. An Electrode Model to Ascertain the Effects of Voltage and Tip Radius with Gap Distance on Electric Field of Transformer Oil. In Proceedings of the 2018 2nd International Conference on Power, Energy and Environment (ICEPE): Towards Smart Technology, Shillong, India, 1–2 June 2018. [Google Scholar]
  41. Takahashi, K.; Takaki, K.; Hiyoshi, I.; Enomoto, Y.; Yamaguchi, S.; Nagata, H. Development of a Corona Discharge Ionizer Utilizing High-Voltage AC Power Supply Driven by PWM Inverter for Highly Efficient Electrostatic Elimination. In Modern Applications of Electrostatics and Dielectrics; IntechOpen: London, UK, 2020. [Google Scholar]
  42. Ji, J.-H.; Hwang, J.; Bae, G.-N.; Kim, Y.-G. Particle charging and agglomeration in DC and AC electric fields. J. Electrost. 2004, 61, 57–68. [Google Scholar] [CrossRef]
  43. Kupershtokh, A.L.; Palchikov, E.I.; Karpov, D.I.; Vitellas, I.; Agoris, D.P.; Charalambakos, V.P. Stochastic model of breakdown initiation in dielectric liquids. J. Phys. D Appl. Phys. 2002, 35, 3106–3121. [Google Scholar] [CrossRef]
  44. Guerbas, F.; Zitouni, M.; Boubakeur, A.; Beroual, A. Barrier effect on breakdown of point–plane oil gaps under alternating current voltage. IET Gener. Transm. Distrib. 2010, 4, 1245. [Google Scholar] [CrossRef]
  45. Lee, J.-C.; Kim, W.-Y. Experimental Study on the Dielectric Breakdown Voltage of the Insulating Oil Mixed with Magnetic Nanoparticles. Phys. Procedia 2012, 32, 327–334. [Google Scholar] [CrossRef] [Green Version]
  46. Hao, J.; Feng, D.; Yang, L.; Liao, R.; Chen, X.; Li, J. Comparison of AC Breakdown Characteristics on Insulation Paper (Pressboard) Impregnated by Three-element Mixed Insulation Oil and Mineral Oil. High Voltage 2020, 5, 298–305. [Google Scholar]
  47. Gao, B.; Yu, R.; Hu, G.; Liu, C.; Zhuang, X.; Zhou, P. Development Processes of Surface Trucking and Partial Discharge of Pressboards Immersed in Mineral Oil: Effect of Tip Curvatures. Energies 2019, 12, 554. [Google Scholar] [CrossRef] [Green Version]
  48. Koppisetty, K.; Sozer, E.B.; Kirkici, H.; Schweickart, D.L. Helium Breakdown Characteristics under 100 kHz Range Pulsed Voltages in Partial Vacuum for Point-to-point Electrode Geometry. In Proceedings of the Conference Record of the 2006 Twenty-Seventh International Power Modulator Symposium, Arlington, VA, USA, 14–18 May 2006. [Google Scholar]
  49. Mo, W.; Song, H.; Huang, Q.; Chen, Y.; Wang, W. Differences in Characteristics of Long-Gap Lightning Impulse Breakdown between Vegetable and Mineral Insulating Oil. Trans. Electr. Electron. Mater. 2020, 22, 301–309. [Google Scholar] [CrossRef]
  50. Eppo Annual Report Energy Policy and Planning Office, Ministry of Energy, Characteristics and Specifications of Fatty Acid Methyl Ester. (FAME)-Typed Biodiesel of 2019. Available online: https://www.mtec.or.th/wp-content/uploads/MFE_1.pdf (accessed on 1 August 2020).
  51. ASTM D6751-09; Standard Specification for Biodiesel Fuel Blend Stock (B100) for Middle Distillate Fuels. ASTM International: West Conshohocken, PA, USA, 2009. Available online: https://www.astm.org/d6751-09.html (accessed on 2 October 2020).
Figure 1. Three consecutive reversible reactions of the transesterification reaction.
Electrochem 04 00011 g001
Figure 2. Overall transesterification reaction of biodiesel production.
Electrochem 04 00011 g002
Figure 3. Coagulation and/or destabilization mechanism.
Electrochem 04 00011 g003
Figure 4. Schematic diagram of the discharge between the point and plate electrodes under applied high electrical voltage.
Electrochem 04 00011 g004
Figure 5. Flow chart of research methodology activities.
Electrochem 04 00011 g005
Figure 6. Experimental set up for transesterification of biodiesel production from refined palm oil in a batch reactor.
Electrochem 04 00011 g006
Figure 7. Schematic diagram of EDS setup with AC electrical current at high voltage for glycerol separation from biodiesel.
Electrochem 04 00011 g007
Figure 8. Schematic of configurations of electrode arrangement (A = High voltage electrode and B = Ground electrode): (a) bar electrodes at the same level (d = 0); (b) bar electrodes at different levels with electrode distance (d); (c) point electrodes at the same level (d = 0); (d) point electrodes at different levels with electrode distance (d); and (e) point-to-point electrodes with electrode distance (d).
Electrochem 04 00011 g008
Figure 9. Effect of vertical distance between electrodes (d) with different electrode configurations on separation efficiency of EDS process using iron (Fe) electrodes with applied AC voltage of 3 kV for a separation time of 240 s. (A = High voltage electrode and B = Ground electrode).
Electrochem 04 00011 g009
Figure 10. Effect of applied AC high voltage with different electrode configurations on the separation efficiency of the EDS process using iron (Fe) electrodes with vertical distance between electrodes of 3 cm (d = 3 cm) for separation time of 240 s. (A = High voltage electrode and B = Ground electrode).
Electrochem 04 00011 g010
Figure 11. Effect of vertical distance between electrodes (d) with different separation time on the separation efficiency of the EDS process using iron (Fe) electrodes with point-to-point electrode configuration and applied AC voltage of 3 kV.
Electrochem 04 00011 g011
Figure 12. FEMM simulation results of electric field strength distribution with density plots in voltage (V) and electric field strength (V/m) of iron (Fe) electrodes with different electrode configurations and applied AC voltage of 3 kV: (a) bar electrodes at the same level; (b) bar electrodes at different level with vertical distance between electrodes of 3 cm; (c) point electrodes at the same level; (d) point electrodes at different level with vertical distance between electrodes of 3 cm; and (e) point-to-point electrodes with vertical distance between electrodes of 3 cm.
Electrochem 04 00011 g012aElectrochem 04 00011 g012b
Figure 13. Effect of separation time at various applied AC voltages on the separation efficiency of the EDS process using iron (Fe) point-to-point electrodes with a vertical distance between electrodes of 3 cm.
Electrochem 04 00011 g013
Figure 14. Observation on the formation of a clear interface between biodiesel and glycerol by-product over the separation time using two separation processes: (a) gravitational settling (GS) and (b) electrically driven separation (EDS).
Electrochem 04 00011 g014
Figure 15. Normalized concentrations of remaining catalyst in the biodiesel final product from the EDS process using iron (Fe) point-to-point electrodes, with a vertical distance between electrodes of 3 cm and applied AC voltage of 3 kV: (a) gravitational settling (GS) and (b) electrically driven separation (EDS) process.
Electrochem 04 00011 g015
Figure 16. Normalized concentrations of remaining soap in the biodiesel final product from the EDS process using iron (Fe) point-to-point electrodes, with a vertical distance between electrodes of 3 cm and applied AC voltage of 3 kV: (a) gravitational settling (GS) and (b) electrically driven separation (EDS) process.
Electrochem 04 00011 g016
Figure 17. Effect of methyl ester (%ME) and normalized remaining soap content (NV, soap) by comparing the separation performance between the GS and EDS process using iron (Fe) point-to-point electrodes, with a vertical distance between electrodes of 3 cm and applied AC voltage of 3 kV.
Electrochem 04 00011 g017
Table 1. Fatty acid composition of refined palm oil (RPO).
Type of Fatty AcidsFatty Acid NameFormulaComposition (%)
Saturated groupLauric acidC12:00.80
Myristic acidC14:01.10
Palmitic acidC16:043.45
Stearic acidC18:04.23
Arachidic acidC20:00.16
Behenic acidC22:00.06
Erucic acidC24 isomer0.07
Unsaturated groupOleic acidC18:140.90
Linoleic acidC18:29.10
Linoleic acidC18:30.24
Average molar mass (g mol−1)270.22
Average molecular weight (g mol−1)848.70
Saturated carbons49.87
Monounsaturated carbons40.90
Polyunsaturated carbons9.34
Table 2. Characterization of biodiesel product from refined palm oil (RPO).
ParametersUnitsMethodLimitsResults
ASTM D6751EN14214
Ester content % EN14103 N/S ≥96.5 98.50 ± 0.25
Free glycerol %mass EN14105 - 0.02 max 0.03
Monoglyceride %mass EN14105 - 0.8 max 0.19
Diglycerides %mass EN14105 - 0.2 max 0.19
Triglyceride %mass EN14105 - 0.2 max 0.01
Total glycerol %mass EN14105 - 0.25 max 0.11
Acid value mg KOH/g of sample ASTM D664 N/S 0.50 max 0.043
Iodine value (Wijs) g iodine/100 g EN14111-03 N/S 120 max 53.0
Kinematic viscosity; 40 °C mm2/s ASTM D445-17a 1.9–6.0 3.5–5.0 4.781
Pour point °C ASTM D5950-14 N/S N/S 11
Cloud point °C ASTM D5771-17 N/S N/S 12
Flash point °C ASTM D98-16a (method C) 130 min 101 min 163
Fire point °C 130 min N/S 168
Density at 50 °C g cm−3 N/S N/S 860–900 877
Cetane number ASTM D613 47 min 51 min 54 min
Sulfur content %mass ASTM D2622 0.05 max N/S 0.02
Note: N/S = Not specified.
Table 3. Summary of the performance and optimum conditions of the separation process of biodiesel product mixture from crude glycerol by GS and EDS techniques.
ParametersGravitational Setting (GS)Electrically Driven Separation (EDS)
Separation Process
Electrode configuration - Point-to-point
Distance between electrode - 3 cm
Applying voltage - 3 kV
Separation time (clear interface *) 1 h 40 s
Separation efficiency 94.8% 98.4%
Separation time 30 m 60 s
Normalized catalyst remaining 0.710 0.207
Normalized soap remaining 0.116 0.064
Methyl ester content (%) 86.4 ± 0.2 90.9 ± 0.5
Separation efficiency 99.8% 99.8%
Separation time >24 h 240 s
Normalized catalyst remaining Not found Not found
Normalized soap remaining 0.037 0.035
Methyl ester content (%) 95.1 ± 0.2 95.2 ± 0.2
Purification with water wash
Number of washing times 5 times 2 times
Methyl ester content (%) 97.50 ± 1.22 (STD) 97.77 ± 0.80 (STD)
Number of washing times 3 times 3 times
Methyl ester content (%) 95.1 ± 0.62 98.50 ± 0.25 (STD)
Note: Clear interface * indicates that the clear interface between biodiesel and glycerol layers without cloudy solution in an upper biodiesel-rich phase was firstly observed with time. STD indicates that the biodiesel standard EN14214 meets a minimum acceptable content of methyl ester at 96.5% (m/m).
Disclaimer/Publisher’s Note: The statements, opinions and data contained in all publications are solely those of the individual author(s) and contributor(s) and not of MDPI and/or the editor(s). MDPI and/or the editor(s) disclaim responsibility for any injury to people or property resulting from any ideas, methods, instructions or products referred to in the content.

