1. Introduction
Advances in radiology in recent decades have made the non-invasive diagnosis of hepatic malignancies the preferred method for the screening, assessment, and monitoring of liver disorders. Ultrasound (US), contrast-enhanced Computed Tomography (CT) and Magnetic Resonance (MR) are routinely used to detect and characterize lesions growing in the liver parenchyma; nevertheless, the specificity and sensitivity of these techniques vary dramatically with the size of the lesion, tumor differentiation grade and presence of a cirrhotic liver condition [
1,
2]. These factors often pose challenges for the image-based early diagnosis of liver disorders, as lesions may not have a definitive characterization under radiological exams, and, consequently, patients are often referred to a biopsy [
3].
Liver biopsies allow for the histopathological evaluation of hepatic tissue samples through the percutaneous sampling of the tumor. This procedure remains the gold standard method to characterize the nature of a lesion, helping to determine the stage of disease, identify the primary location of metastatic tumors, or perform genotypic analysis. However, uncertainty in needle positioning while conducting a biopsy can lead to a false-negative result, with devastating consequences for the patient. To minimize complications and improve accuracy, biopsy procedures are often guided by imaging techniques to ensure proper needle positioning and increase confidence in the sampling location [
4,
5].
The use of CT and US imaging to assist the interventionist in advancing and confirming the position of the needle in percutaneous image-guided biopsies has shown limited performance when targeting small lesions (<20 mm) [
5]. The lack of image contrast, heterogeneity in the parenchyma, nodular morphology, or image artifacts may hinder the identification of the tumor, increasing the uncertainty of the procedure. In addition, real-time guidance is typically achieved with US, which is a technique with a lower resolution and contrast, especially in patients with obesity.
The FDA-approved near-infrared (NIR) fluorescent agent Indocyanine Green (ICG) has traditionally been used to assess liver function, tumor labeling during resection surgeries [
6,
7], and, recently by this group, in liver biopsies to confirm the needle’s position [
8,
9]. Differences in biliary excretion of ICG between healthy and malignant liver tissue or retention in neoplastic cells lead to a higher accumulation in the latter. The resulting fluorescence emission of the tumor can be detected with a thin optical endoscope introduced through a coaxial biopsy needle cannula.
The optical confirmation of needle positioning through the detection of fluorescence from ICG in liver biopsies was achieved using a clinical cystoscope coupled to a camera [
8,
10]. The acquired images were weighted for the exposure time to obtain absolute-intensity pixel values at the tumor site. Although the study found significant tumor-to-healthy-liver-tissue intensity ratios at the biopsy site, diffuse and out-of-focus light prevented the formation of sharp images, precluding an assessment of structural features of the tumor [
8,
11,
12]. In addition, fluctuations in the tumor-to-healthy-liver intensity ratio can be observed when sampling multiple locations of the lesion cross-section [
8,
11,
12]. In hepatocellular carcinomas (HCC), only well-differentiated lesions present solid homogeneous fluorescence emission, whereas in poorly differentiated HCC and metastases, the fluorescence intensity is highly heterogeneous, often presenting rim-like emission distributions.
For these reasons, instead of relying on images, the temporal fluctuations of the detected intensity as the endoscope is advanced towards the lesion can reveal the presence of a lesion in the vicinity of the tip. However, the use of scientific cameras to perform the temporal sampling of light intensity in high-dynamic-range scenarios is unreliable, since these devices usually lack a metering system to estimate the brightness of the scene prior to the exposure. Instead, automatic exposure algorithms estimate the integration time for each image based on the intensity from previous frames, which introduces a lag until the correct value for the exposure is found. This lag causes an under-sampling of rapid intensity fluctuations, limiting the temporal resolution of the readings and introducing inaccuracies to the measured data.
In contrast, single-pixel photodetectors produce an instantaneous voltage output that is linearly correlated to the incident intensity. Furthermore, these devices can be extremely light and compact, improving the handling experience of the operator in the surgery room.
In this paper, we report a modified version of our biopsy-guidance endoscope that uses a photodiode to improve the ability to register fluorescence fluctuations in real time. The performance of the new-generation scope is compared against our previous camera-based device. We investigate the temporal response and accuracy in registering rapid light variations and assess the sensitivity to low concentrations of ICG, performance in detecting deep lesions, and robustness against the presence of background fluorescence. Additionally, we explore whether the multispectral detection of NIR I and NIR II light can retrieve distance information from lesions due to spectral changes in the optical properties of the liver.
2. Materials and Methods
2.1. Endoscope Design
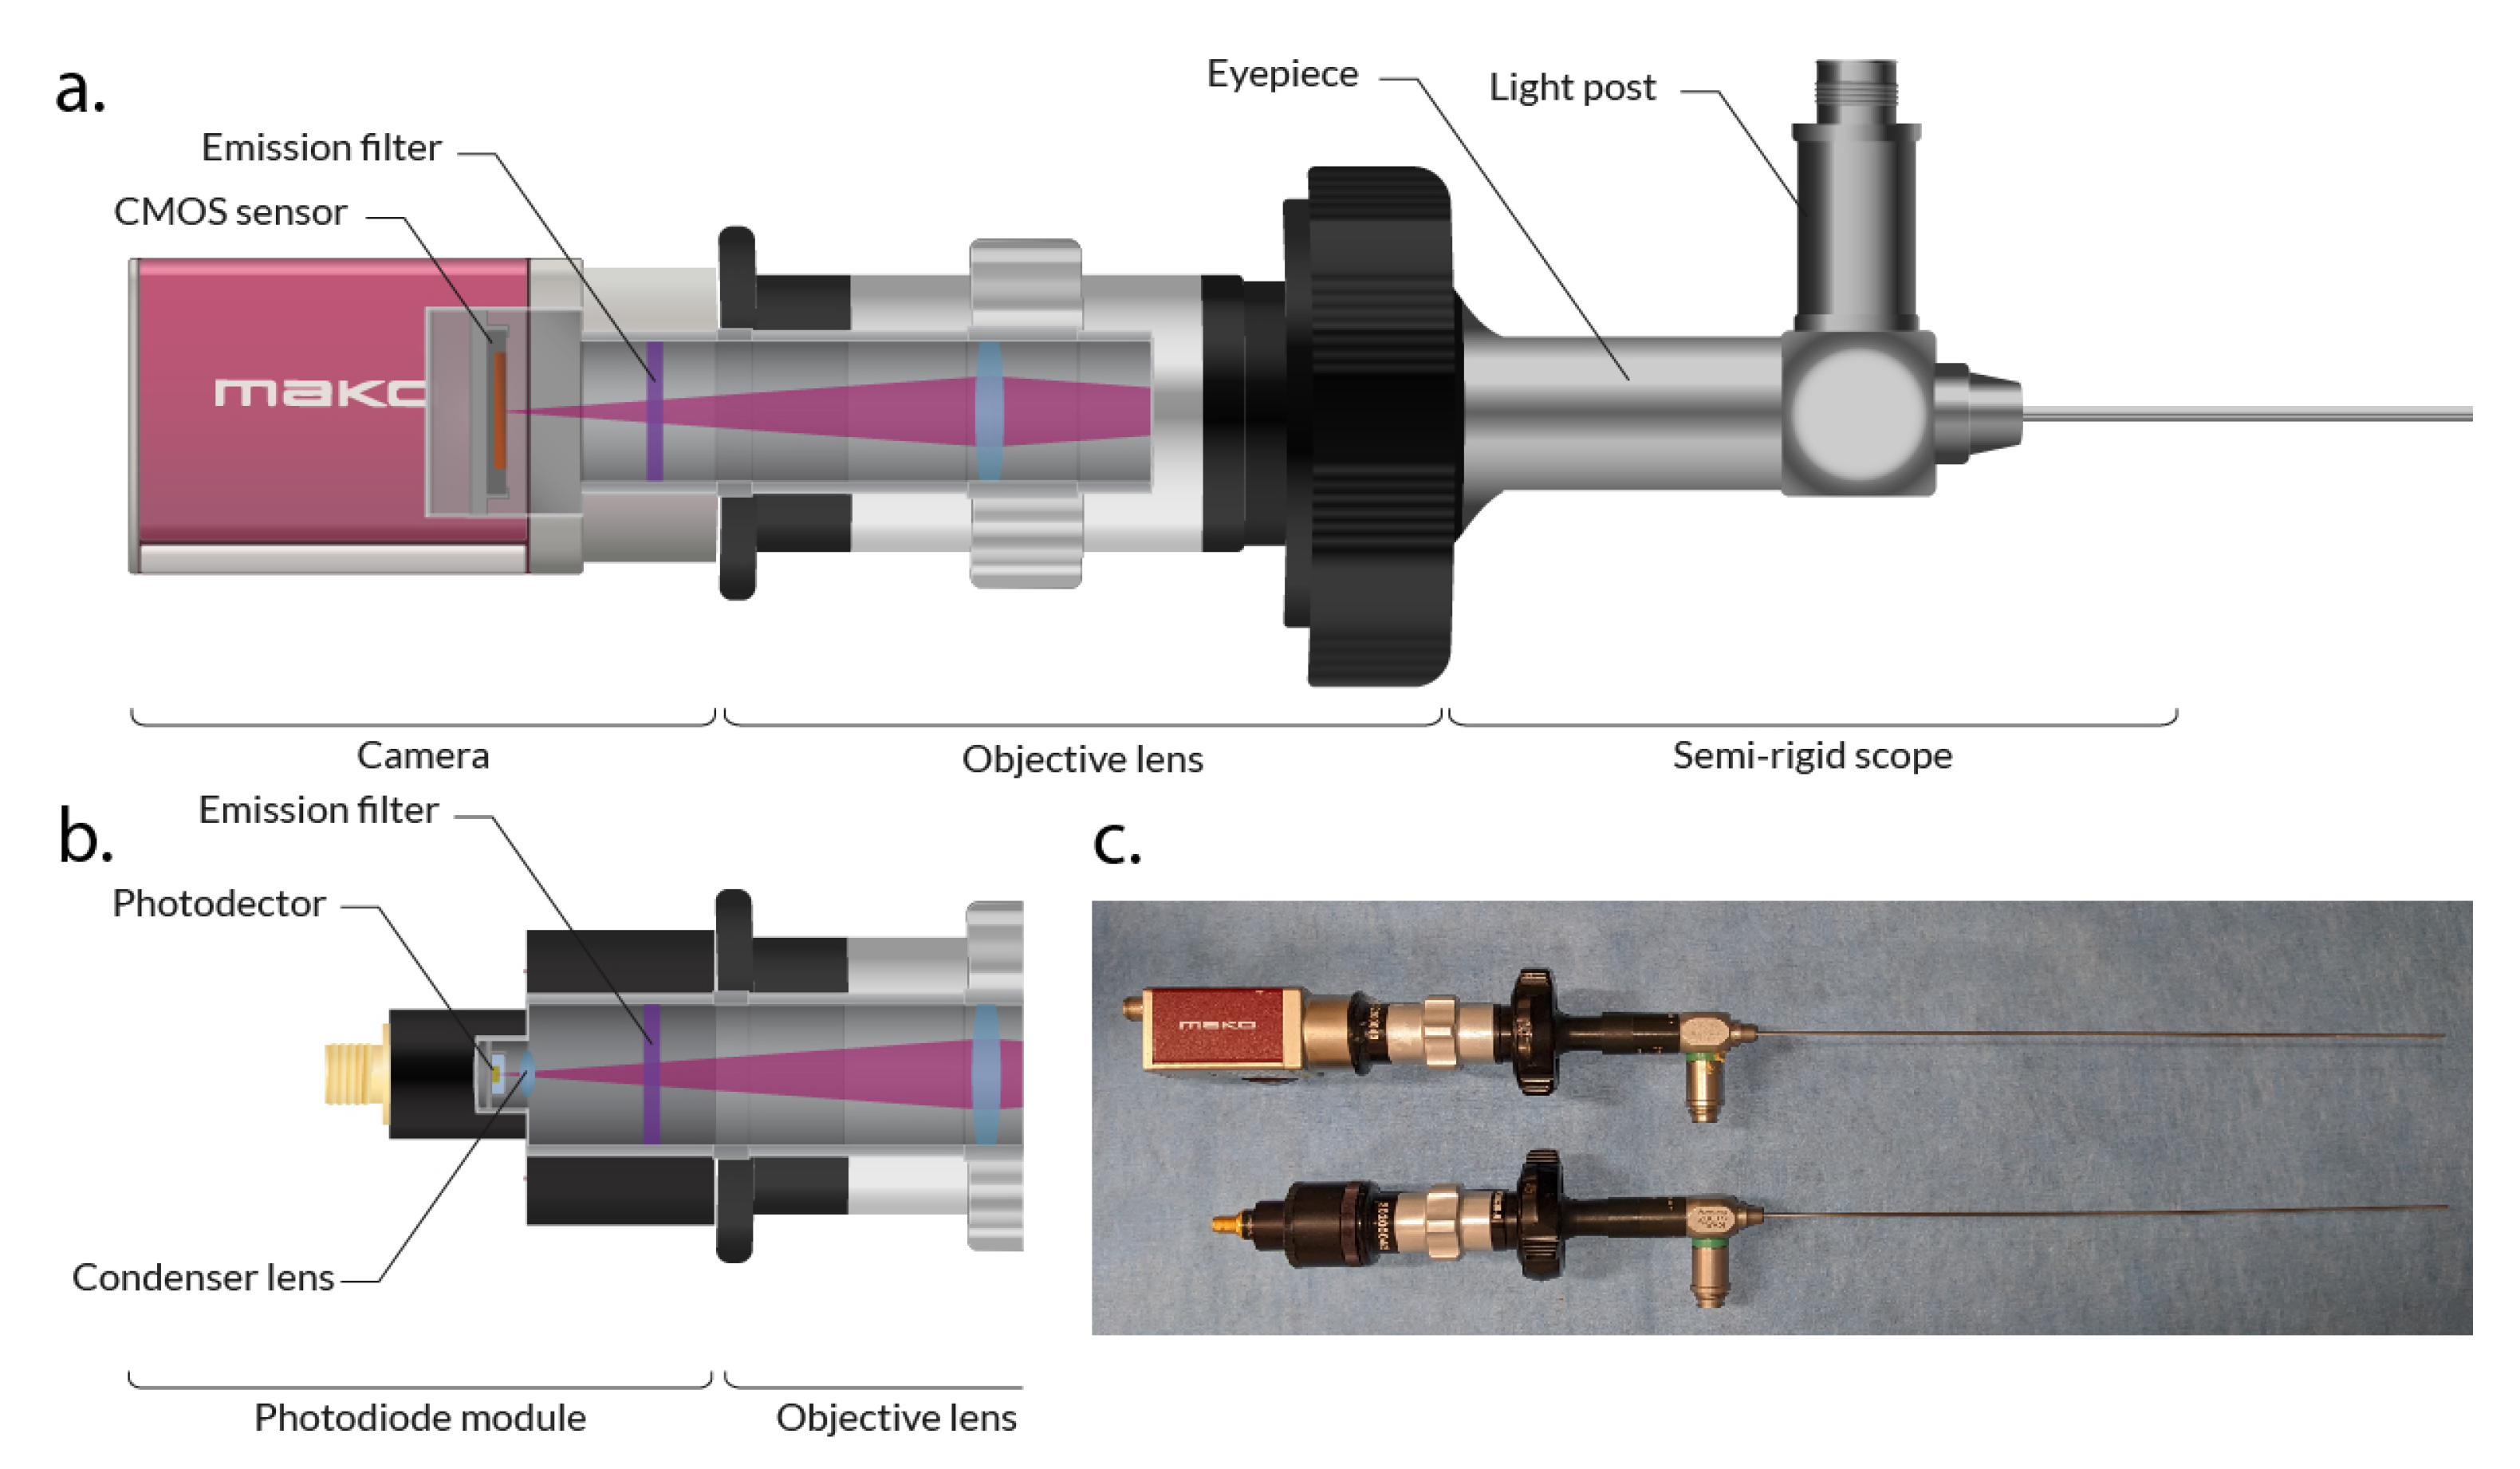
The camera-based scope hardware remains as described in our previous works [
8]. Shown in
Figure 1a, the system employs a clinical-grade cystoscope (27033 AA Karl Storz, Tuttlingen, Germany) to deliver the excitation light and collect the fluorescence intensity. The scope shaft has a diameter of 1.2 mm to fit through a standard 16 Gauge coaxial biopsy needle cannula. The excitation of ICG was performed using an 808 nm Coherent (Santa Clara, CA, USA) OBIS LX 150 mW laser coupled to the light post of the cystoscope.
The endoscope’s eyepiece is coupled to a Karl Storz (Tuttlingen, Germany) 38 mm c-mount objective lens to transmit the collected light to a near-infrared camera (Allied Vision Mako 223B, Exton, PA, USA) equipped with a Semrock (Lake Forest, IL, USA) 830 nm high-pass emission filter to eliminate the excitation light.
2.2. Photodiode-Based Endoscope Design
The new detection module, replacing the camera by a photodetector to sense ICG fluorescence light, is shown in
Figure 1b. NIR I light is detected with a Si photodiode (SM05PD1A, Thorlabs Inc., Newton, NJ, USA) equipped with a Semrock 830 nm high-pass emission filter. Alternatively, fluorescence emission in the NIR II can be detected by mounting an InGaAs photodiode (SM05PD5A, Thorlabs Inc., Newton, NJ, USA) with a 1000 nm high-pass emission filter. Both detection modules have the same design and can be coupled to the objective lens of the endoscope (see
Figure 1c).
The output current from the photodiode is connected to a transimpedance amplifier, and the resulting voltage signal is sampled by a DAQ (USB-6002, National Instruments, Austin, TX, USA) acquisition board.
2.3. Acquisition Testbench
For the tests and experiments described below, the endoscope is mounted on a micrometric-precision motorized linear stage. This allows one to control the relative position between the tip of the scope and the target.
2.4. Acquisition and Display Software
A custom software was developed to acquire and display the temporal evolution of the fluorescence intensity readings. The software is compatible with the camera and the photodetector modules and used throughout the experimental tests. The images from the camera and the signal from the photodetectors are read, processed and displayed in a graphical user interface developed in Java that runs over a set of C++ libraries that control the hardware. All the intensity and positioning data are saved into a timestamped log for further postprocessing.
The signal from the photodetector is sampled at 1 kHz, and the data stream is averaged with buffers of 100 samples to result in a data stream of 10 Hz. The framerate of the camera is variable since the exposure time determines the actual sampling frequency.
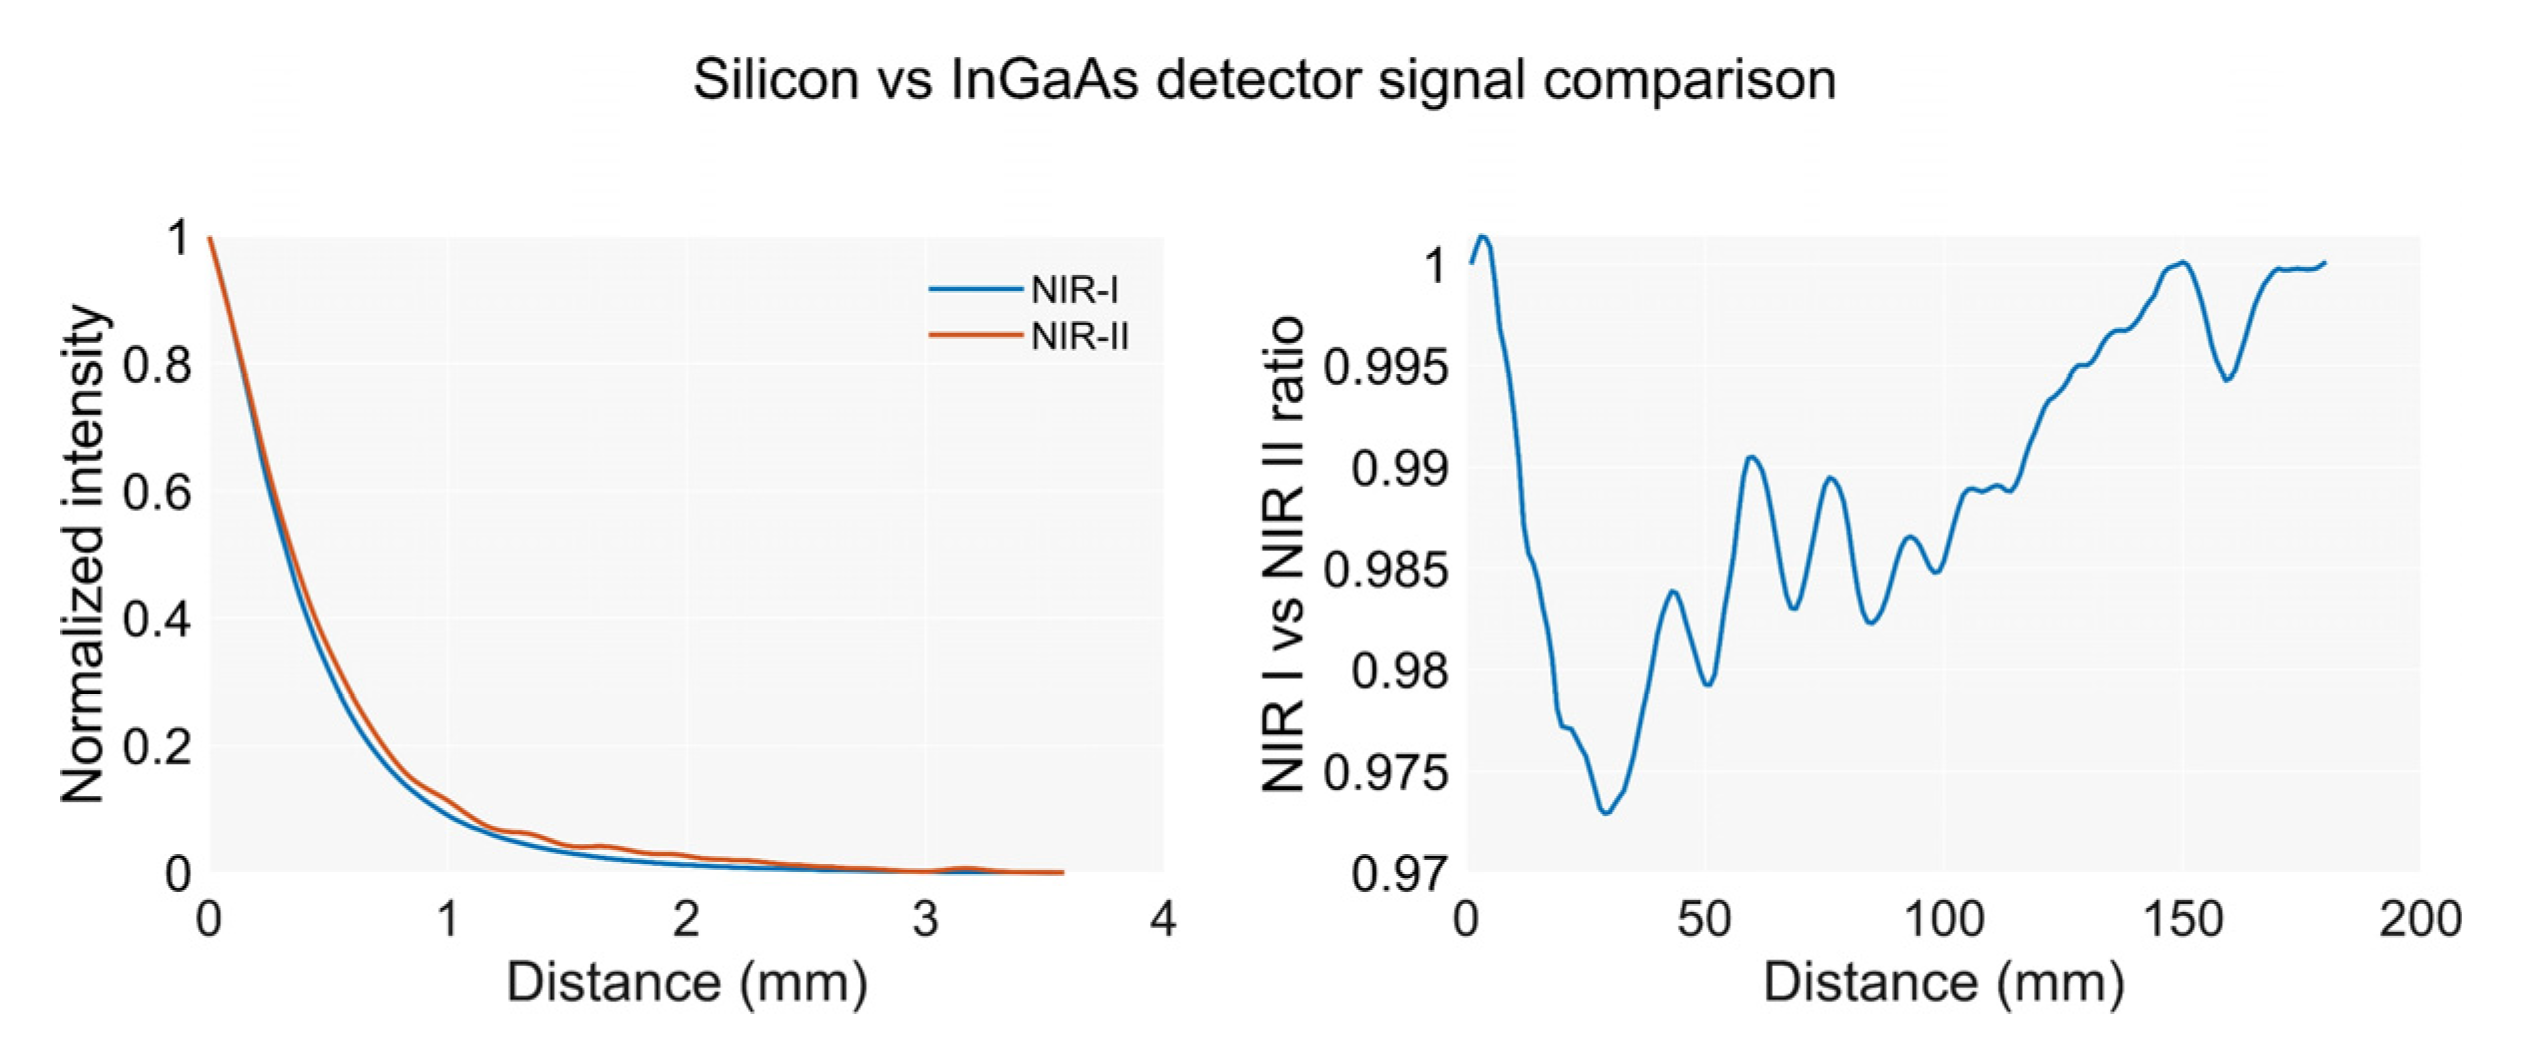
2.5. Selection of Spectral Working Window
An advantage of single-pixel detectors is the variety of substrate choices that confer different spectral responses. ICG fluorescence peaks at around 830 nm; therefore, silicon is the best option to maximize signal detection. However, the ICG emission tail in the NIR-II window can be detected by InGaAs [
13,
14,
15]. Unlike cameras, InGaAs photodetectors are very affordable and thus worth exploring for investigations if the differences in the detected intensity in the NIR I and NIR II, due to changes in the optical properties, can be used to retrieve information on the distance to the emitter. Intensity readings in both spectral windows are compared to evaluate if distance information can be retrieved from the NIR I-to-NIR II ratios.
2.6. Performance Assessment
The performance of the photodetector detection module is evaluated against the camera version in terms of sensitivity, temporal response, and performance in detecting fluorescent lesions at multiple depths and concentrations. The metrics used to evaluate the new device include detector linearity and dynamic range, sensitivity to low concentrations of ICG, and sensitivity to distant lesions.
2.6.1. Detector Linearity and Dynamic Range
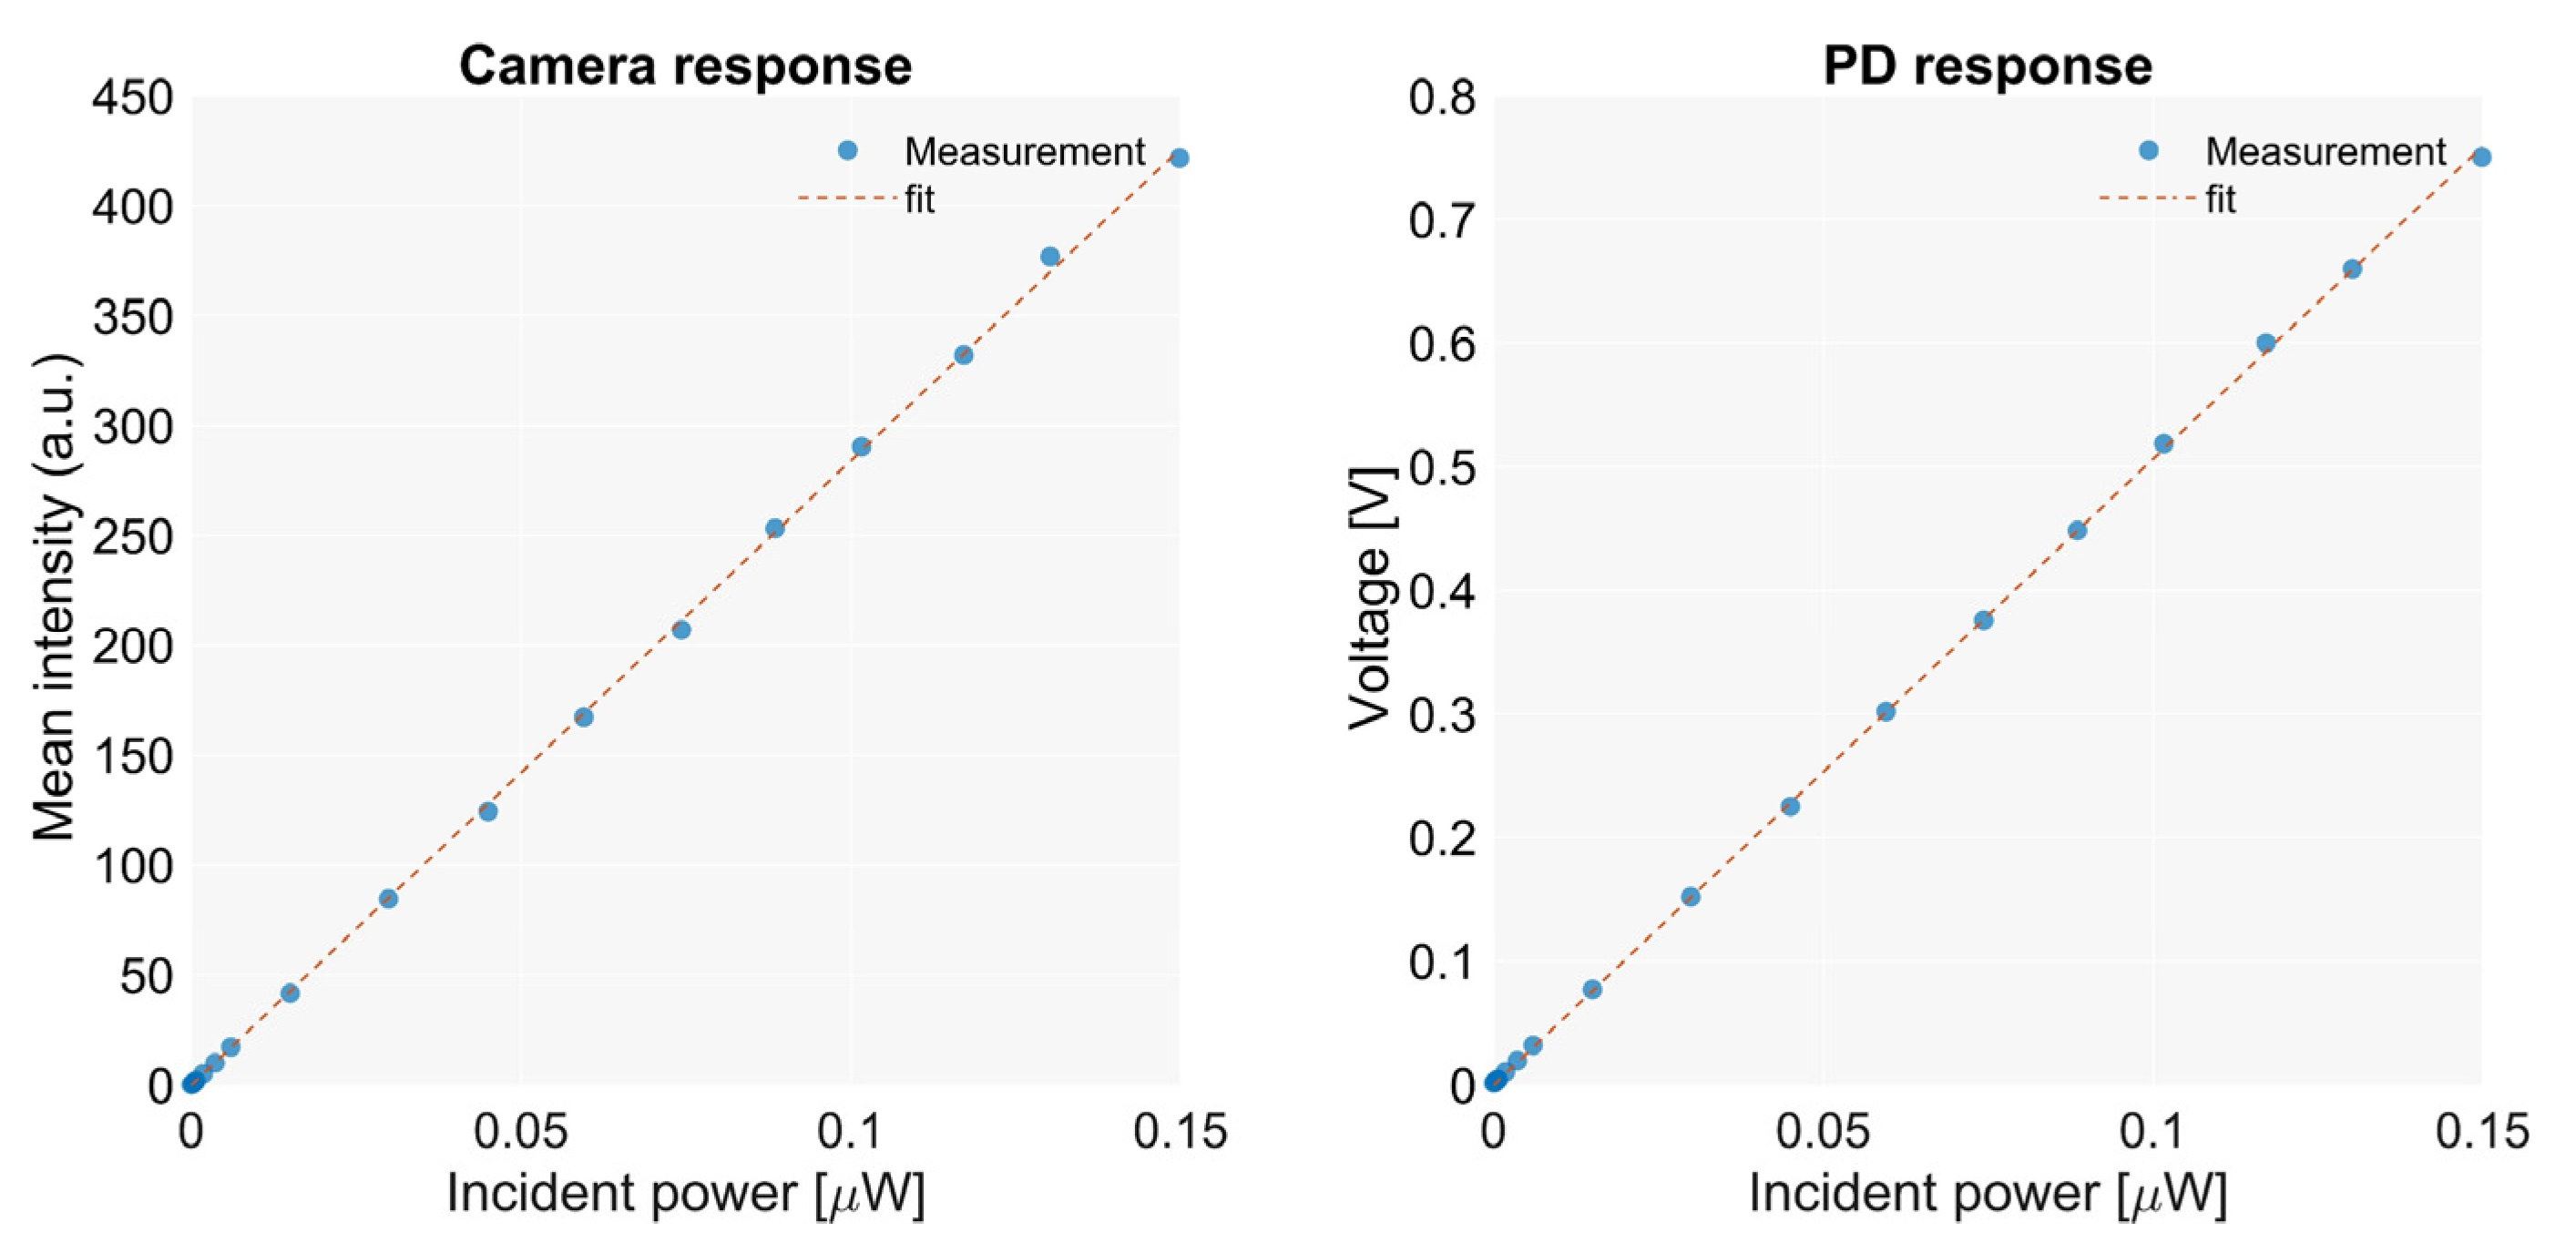
The linearity and dynamic range of the sensors are evaluated by measuring the response to illumination at multiple known incident power values. The scope is illuminated with laser light at 808 nm, which is passed through a diffuser for homogenization. The incident power at the back focal plane of the objective lens is measured with a power meter (PM400K1, Thorlabs Inc., Newton, NJ, USA). Measurements are taken for multiple power values, covering the range of intensities that were registered in previous works from this group [
8]. The ability to cover the entire range of powers used for illumination and the deviation from the calibrated values is measured.
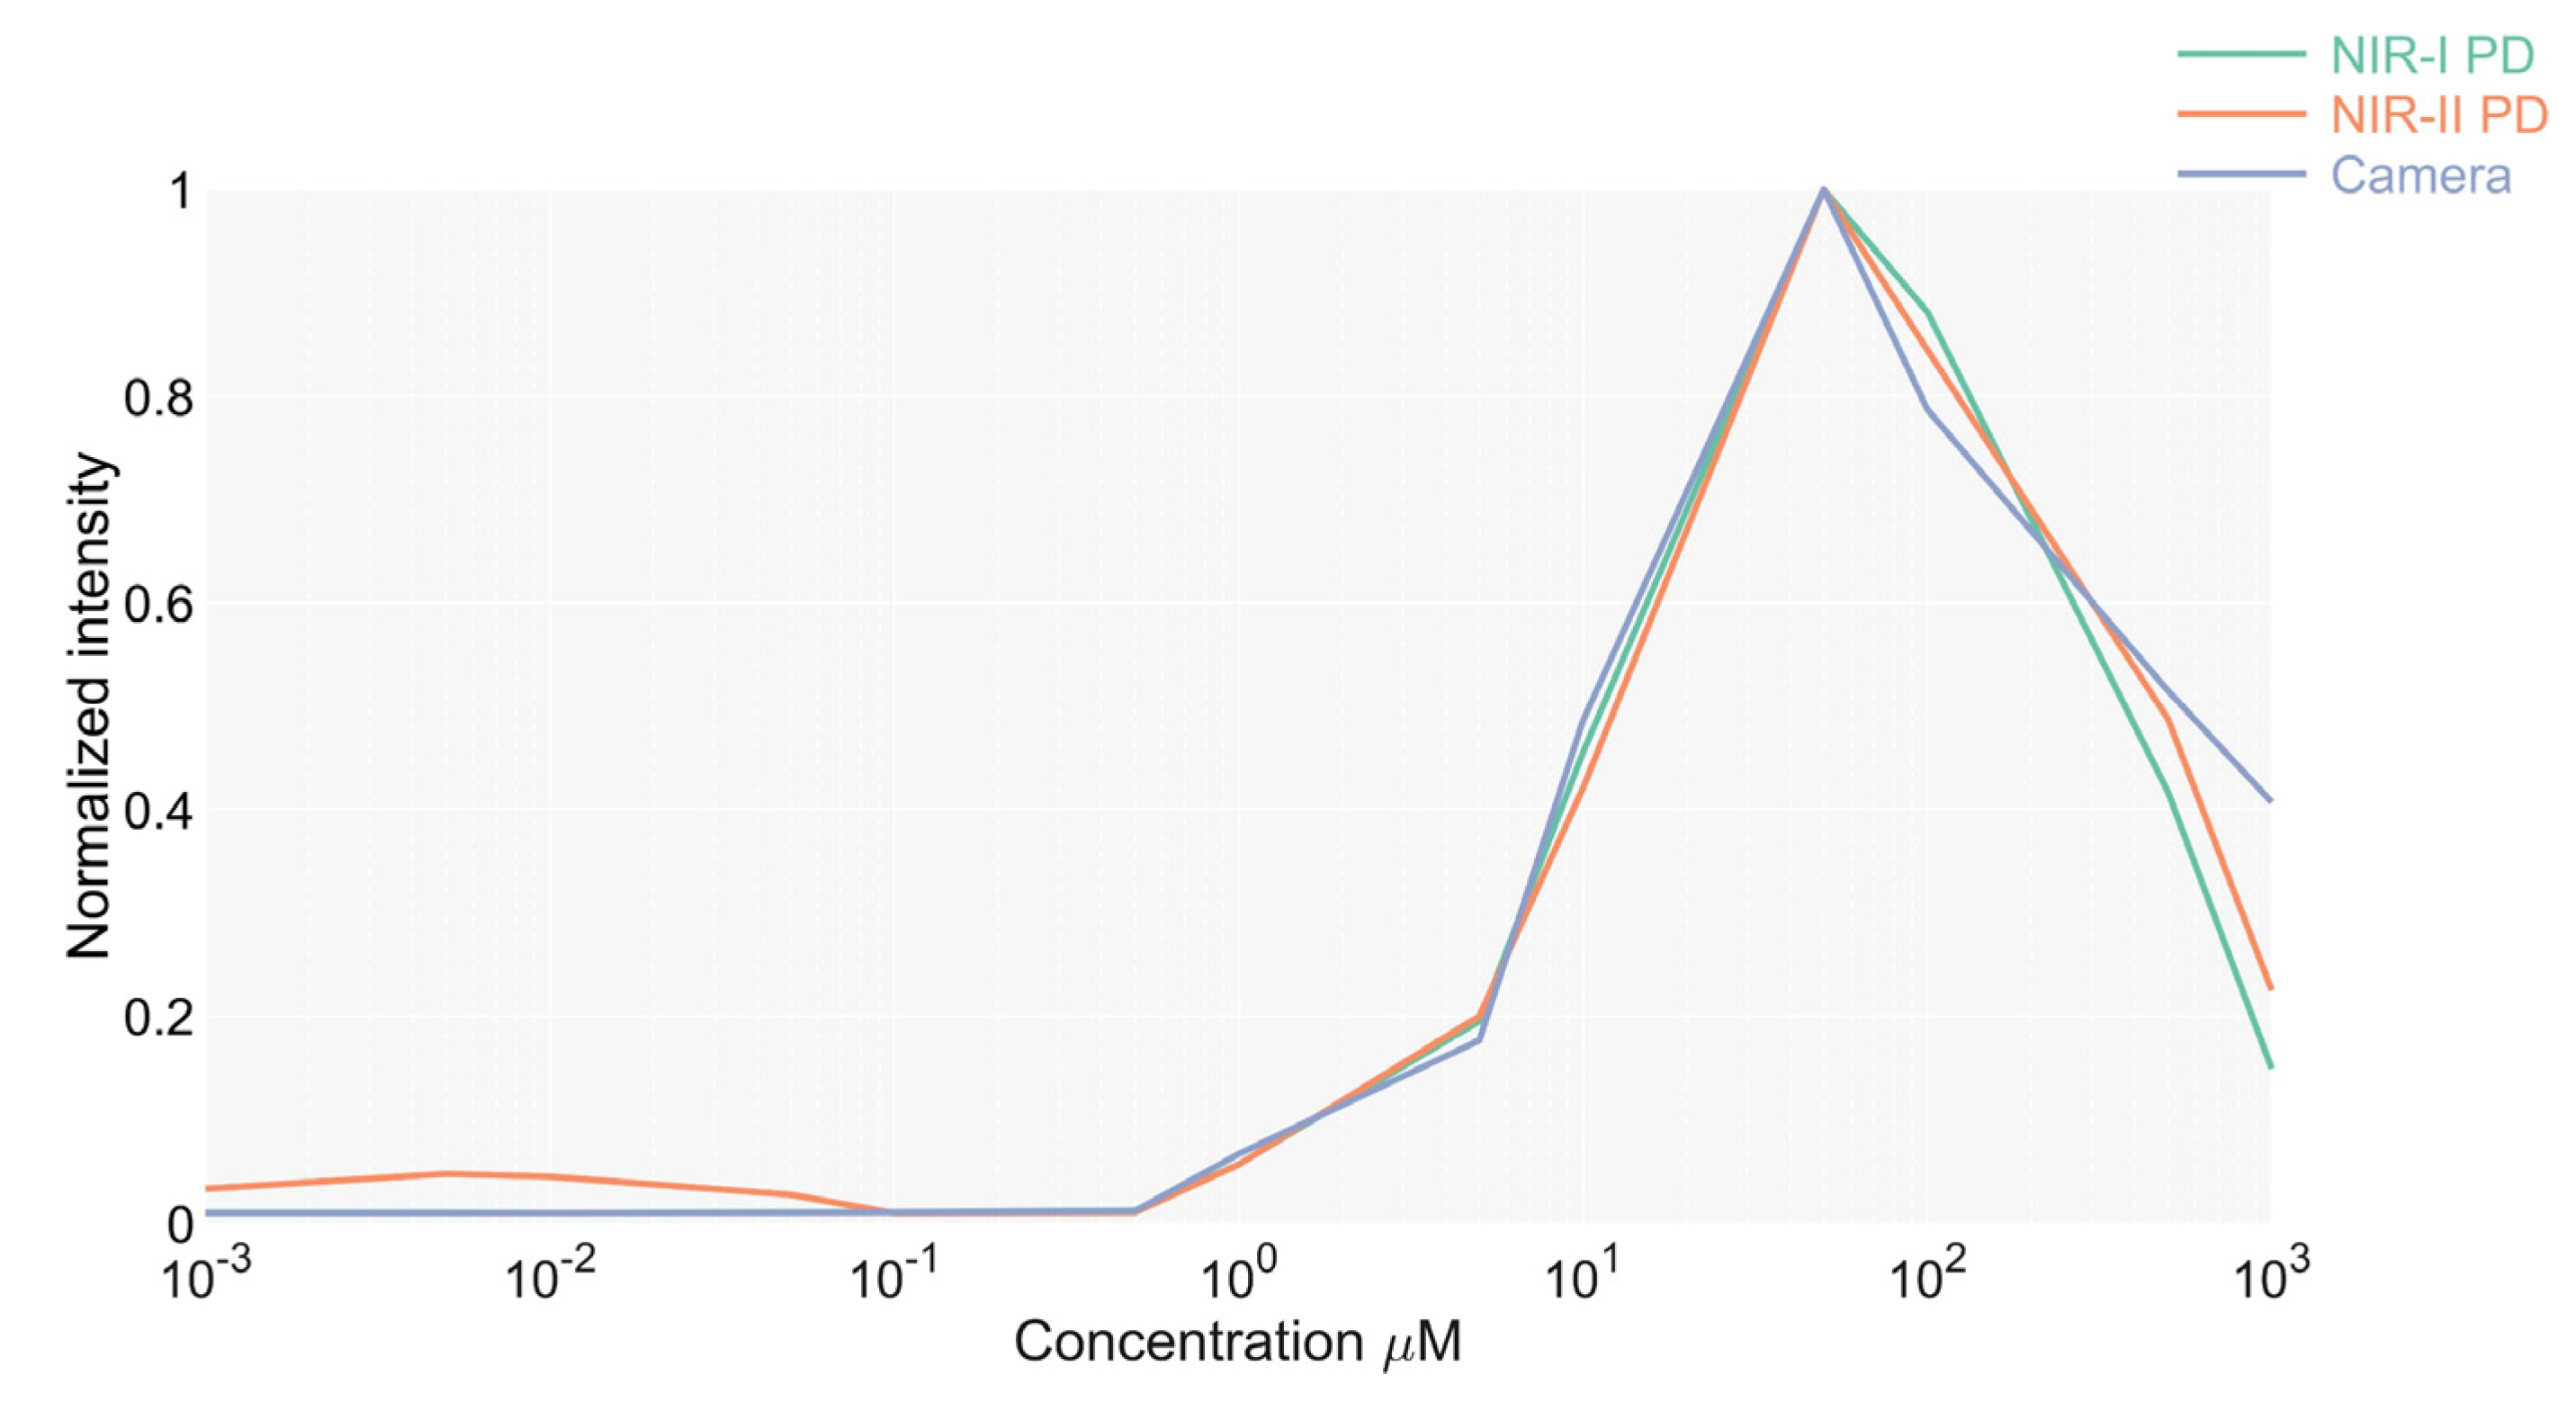
2.6.2. Sensitivity to Low Concentrations of ICG
To test the sensitivity of the device in detecting low concentrations of ICG, the output produced by the sensors to the fluorescence intensity from multiple concentrations of ICG was measured. Measurements are taken for the camera and photodetectors in the NIR I and II windows. The minimum concentration that emits a detectable fluorescence is then determined.
The targets are prepared with a mix of homogenized porcine liver and a fresh ICG at a known concentration. Measurements are carried out by placing the tip of the endoscope into the mix.
2.6.3. Sensitivity to Distant Lesions
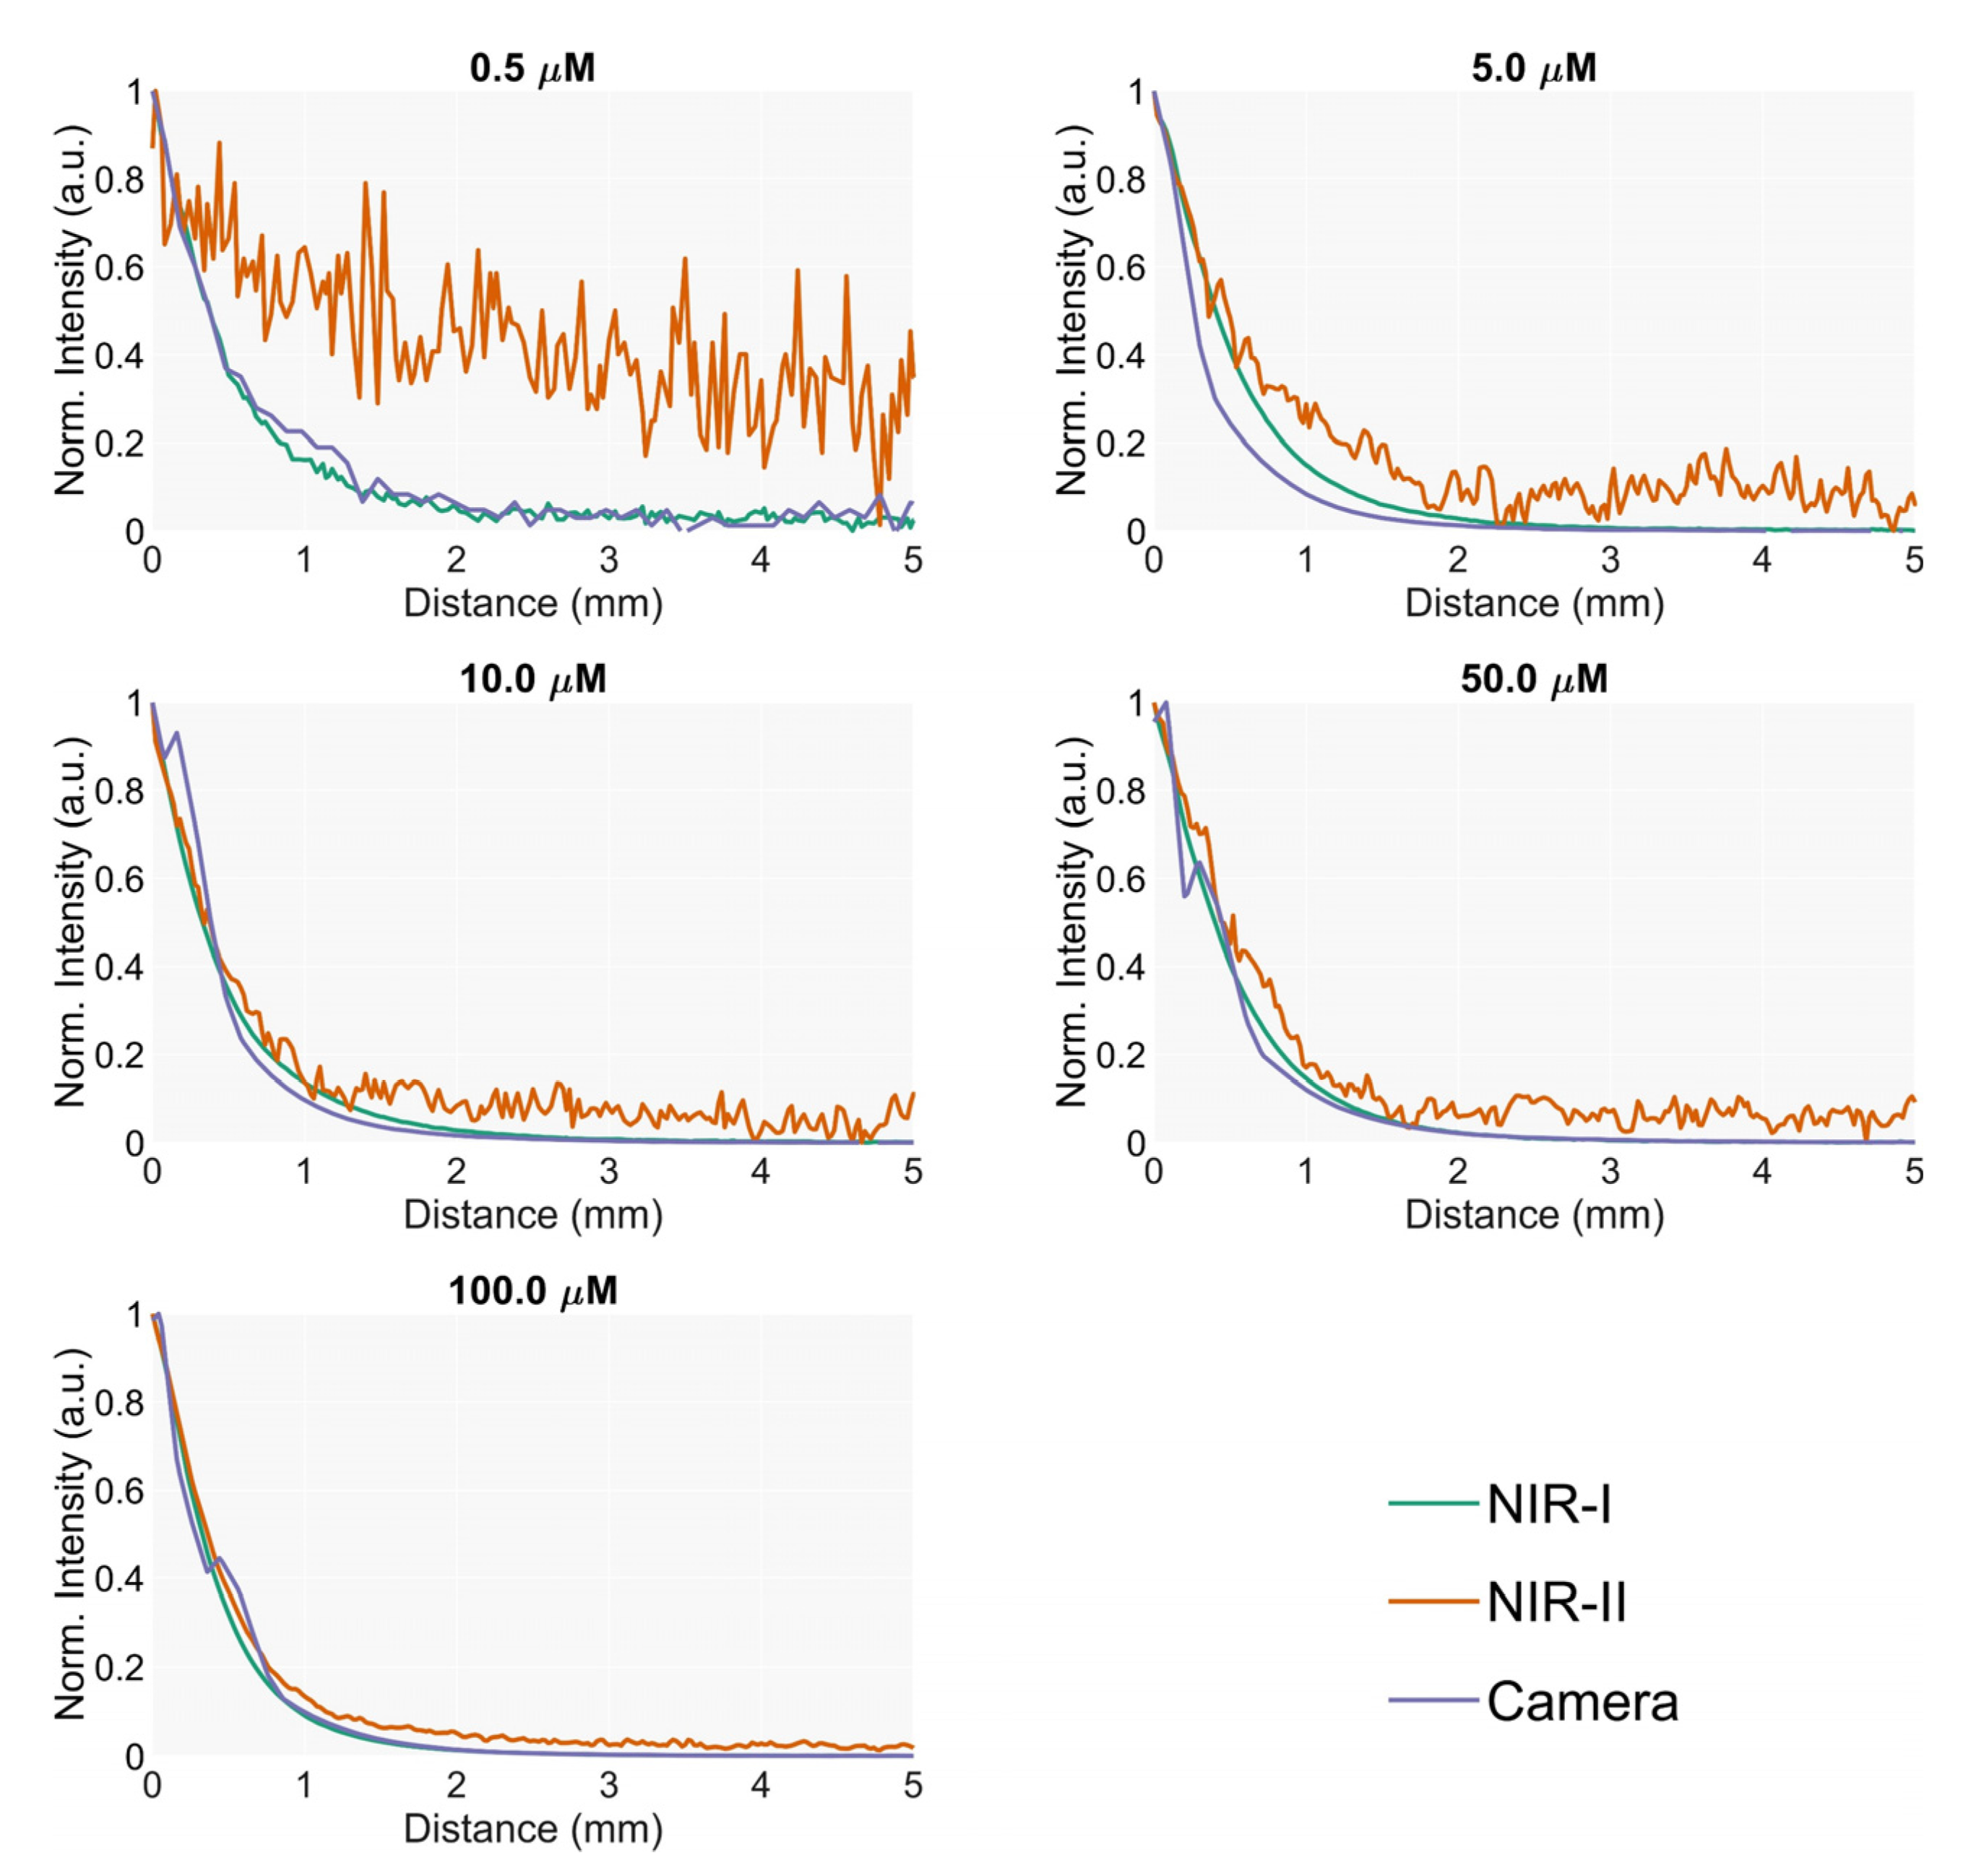
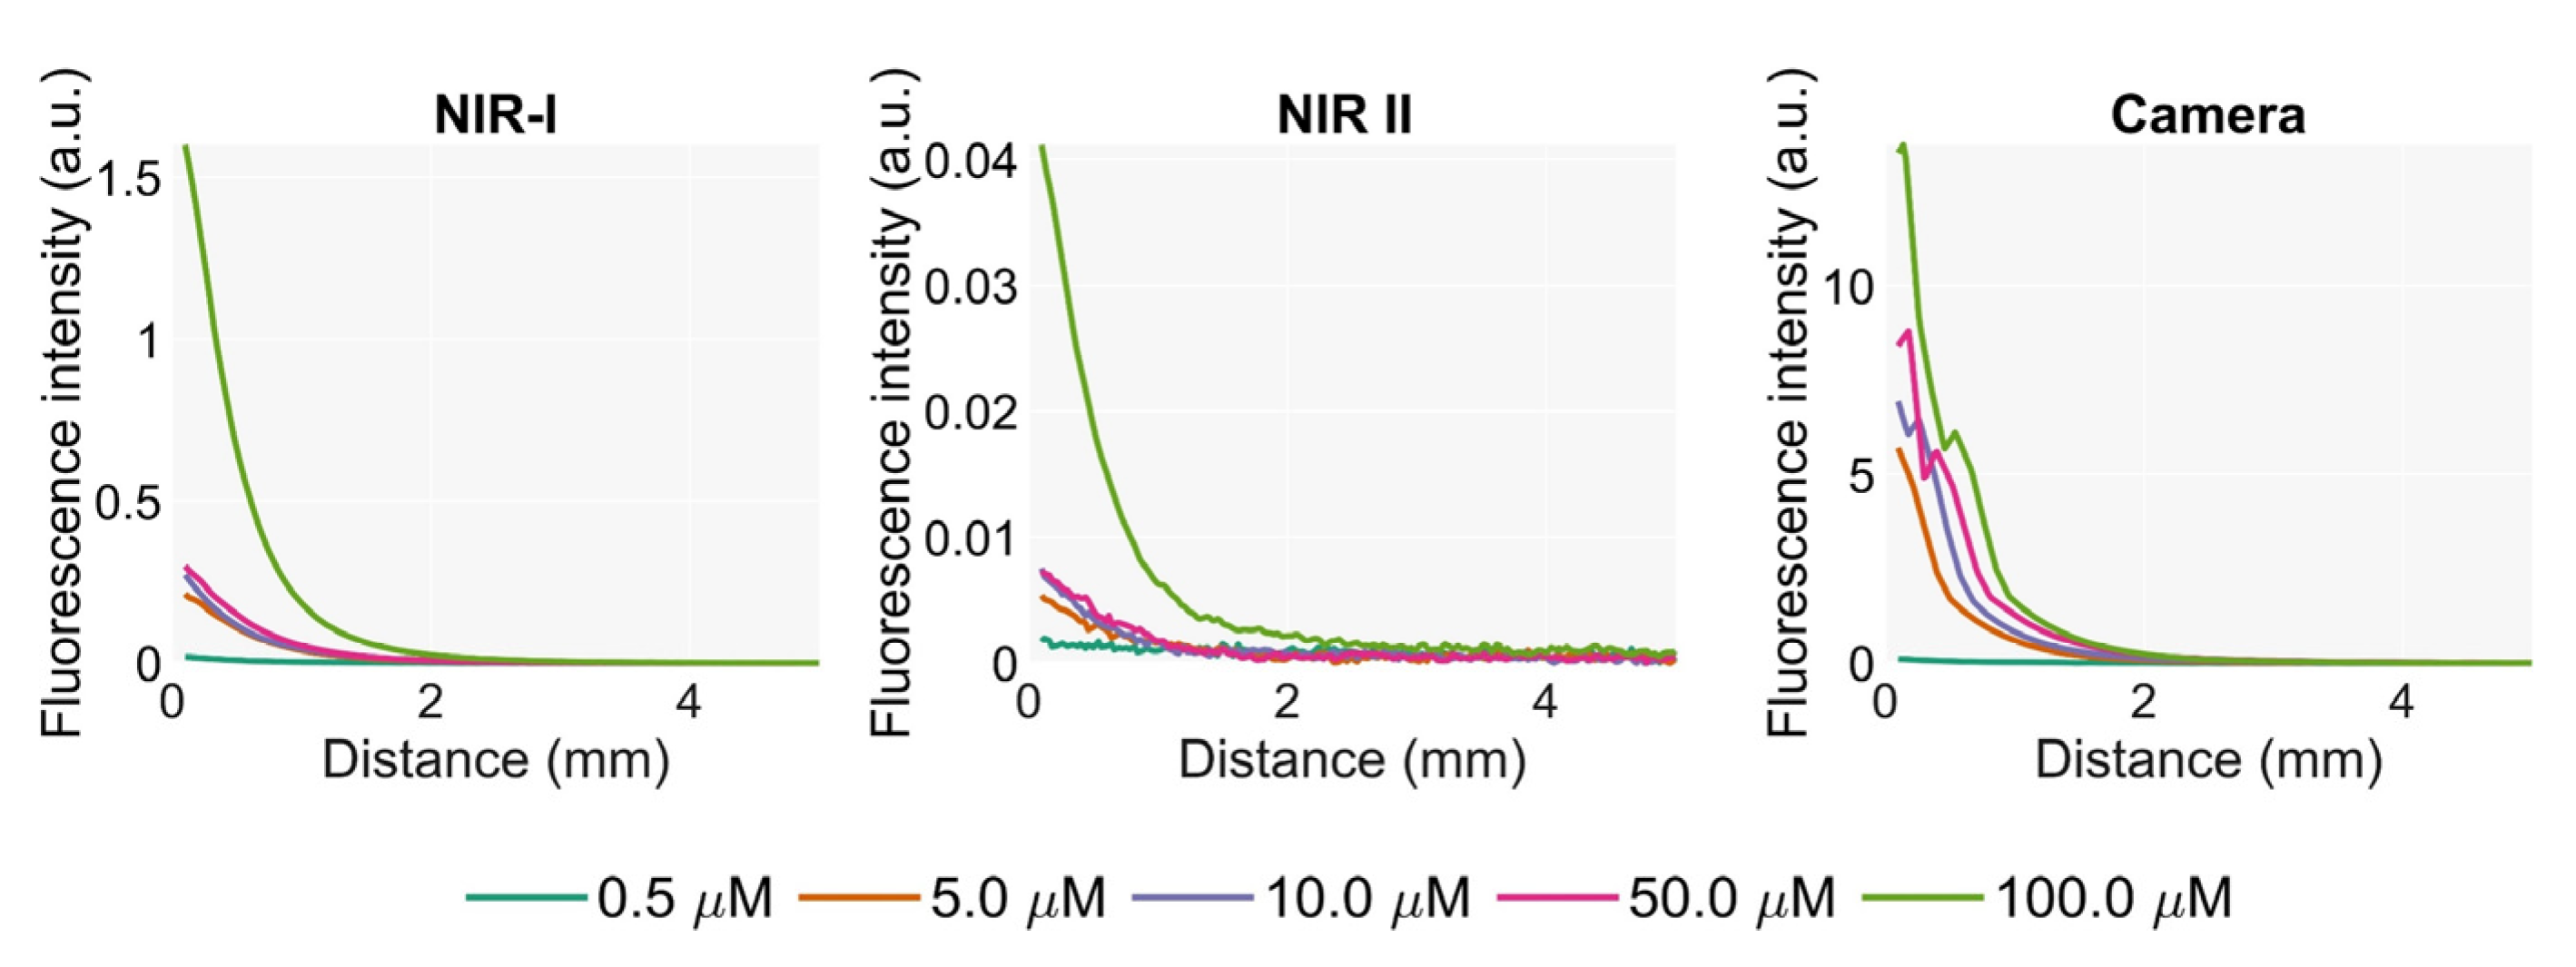
The sensitivity of the scope in detecting fluorescence from distant lesions in the liver is evaluated by measuring the intensity registered by the scope at several distances from an emitter target embedded in homogenized liver.
The phantom for this experiment consists of a cubic 30 mm quartz cuvette filled with homogenized liver that emulates liver parenchyma. A smaller cuvette filled with a mix of ICG and liver was placed at the bottom to simulate the lesion. This secondary cuvette had a rounded shape, a diameter of 1 cm and a height of 5 mm. The top is covered with a coverslip to avoid contamination of the non-fluorescent homogenized liver while maintaining optimal optical transmission.
The signal measured by the endoscope is recorded while translating it towards the target for a range of 20 mm at very low speed (0.2 mm/s).
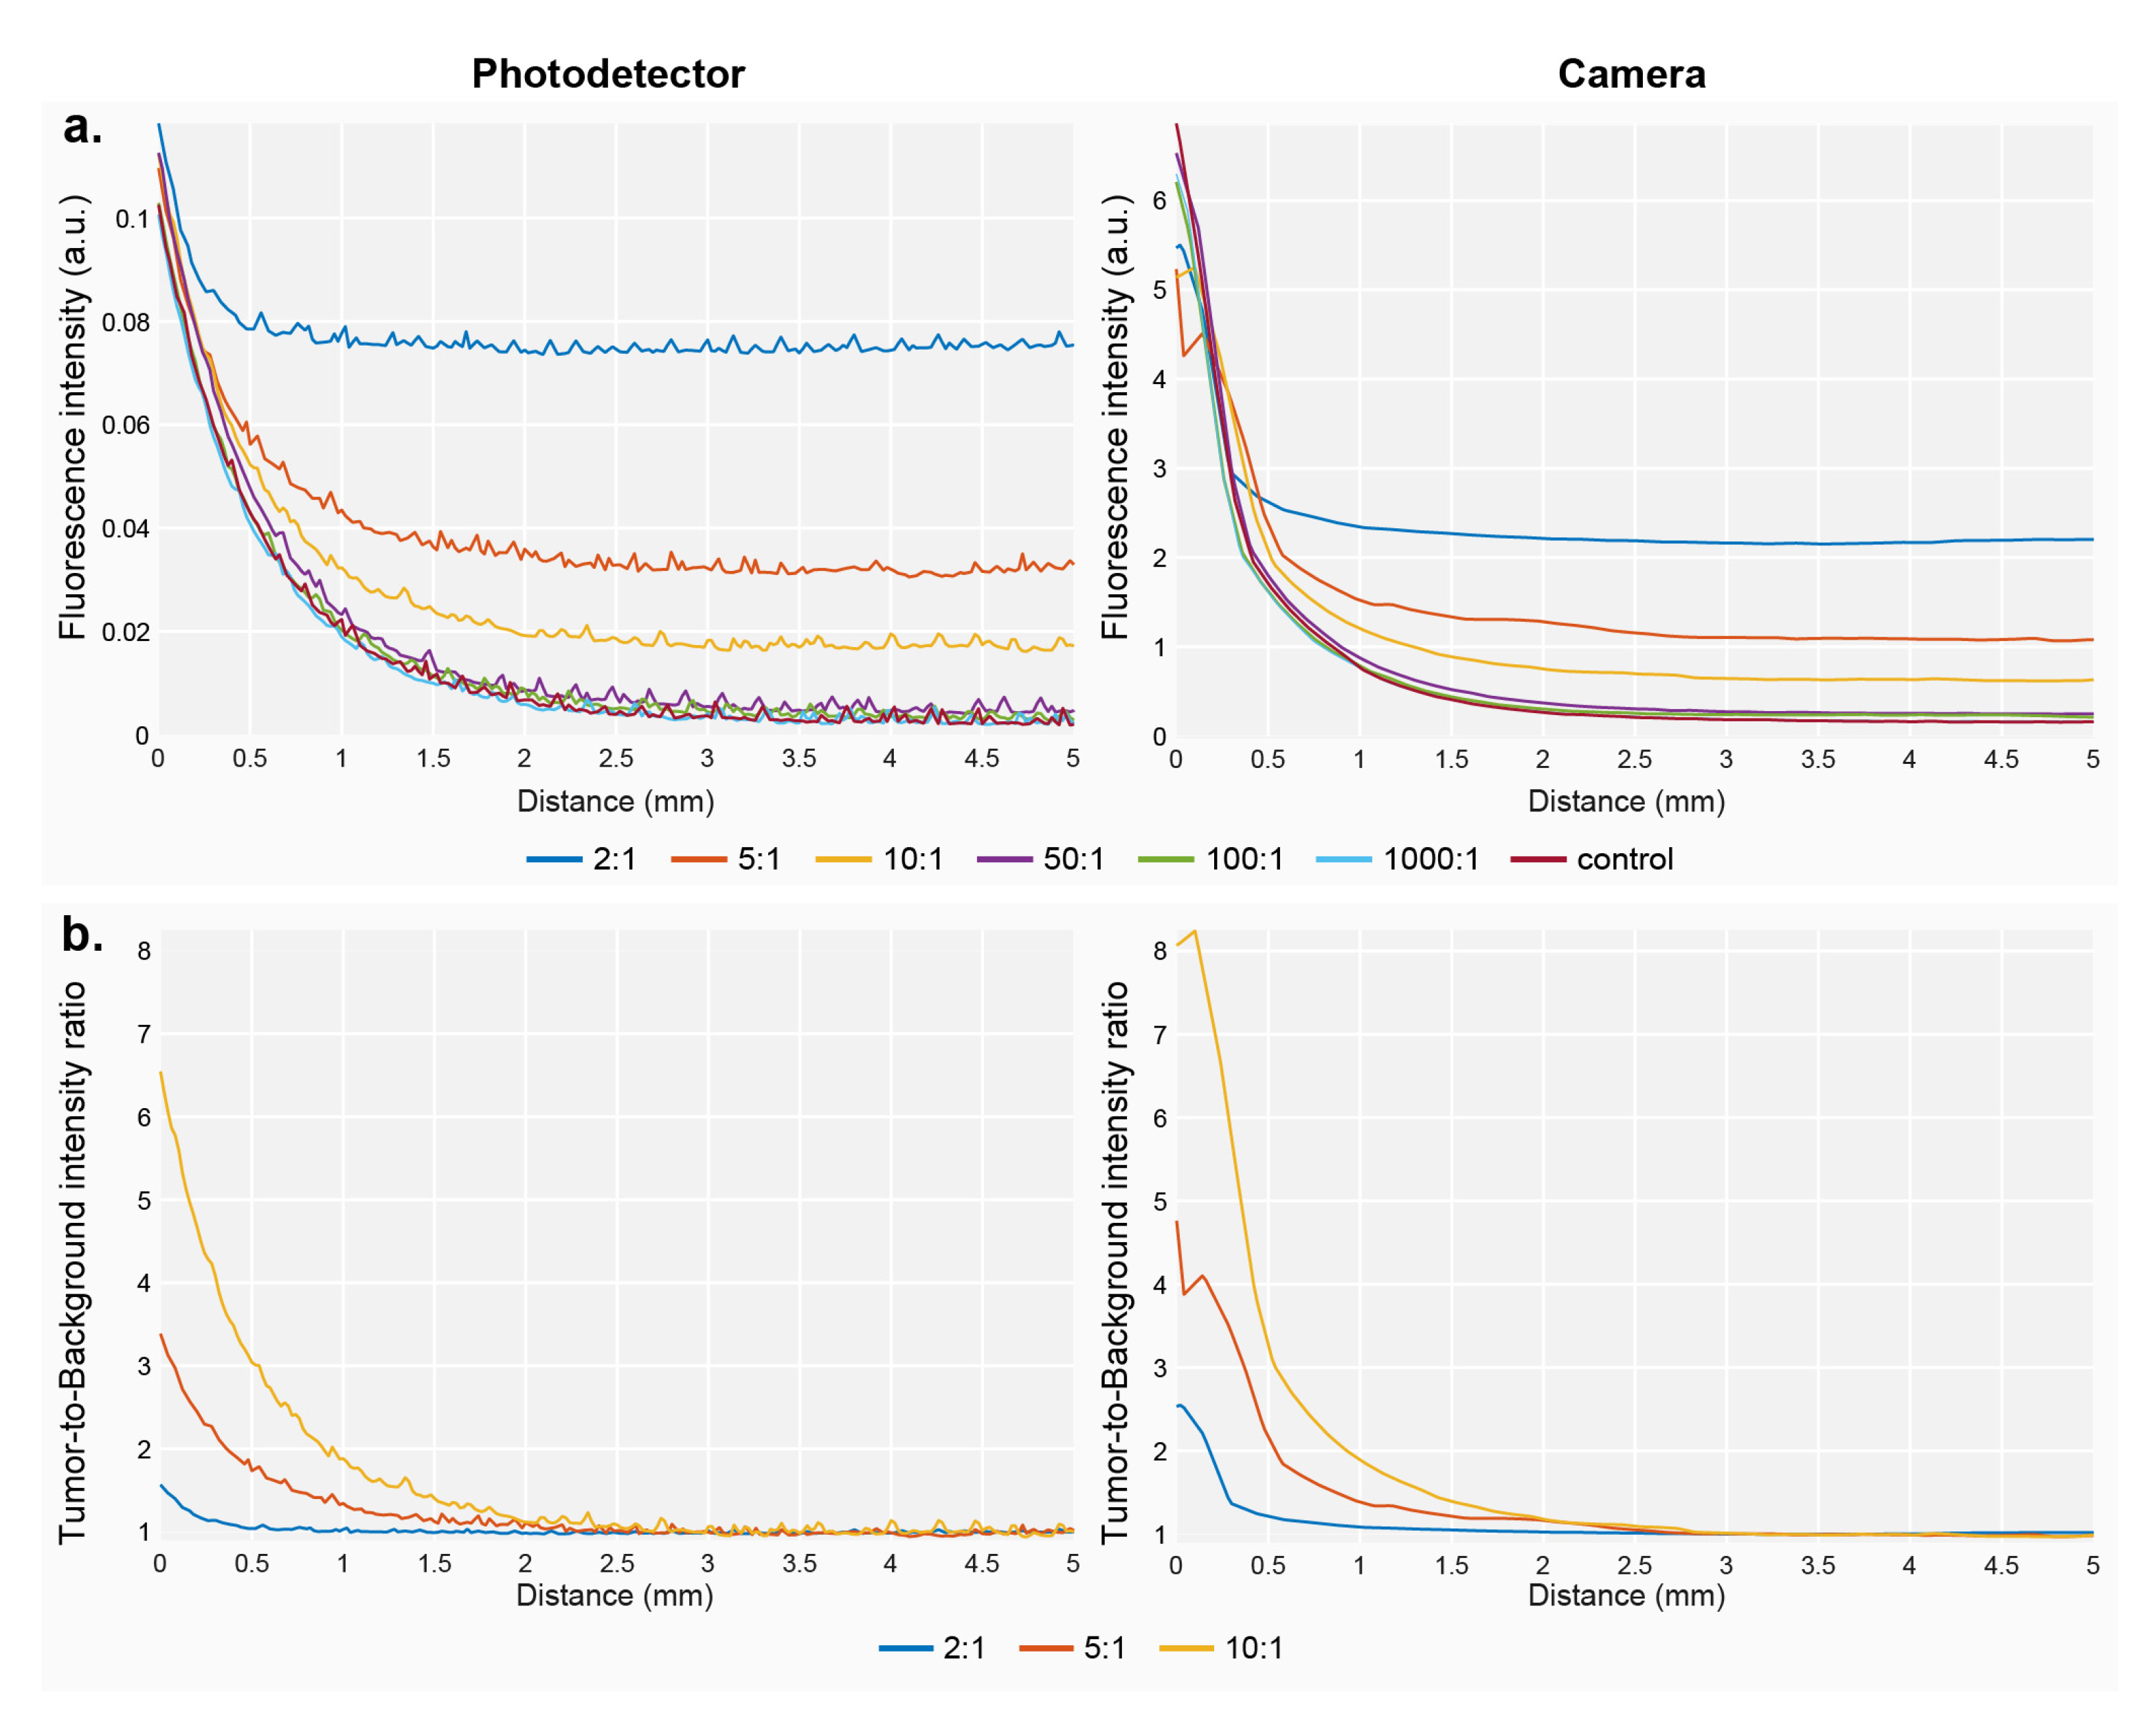
2.6.4. Sensitivity to the Presence of Background Fluorescence
This experiment evaluates the effect of the presence of background fluorescence from the parenchyma on the sensitivity of the scope in detecting distant lesions. During liver procedures using ICG, the healthy tissue is expected to clear most of the dye, while the concentration in the tumor remains higher. The remaining ICG in the parenchyma emits a background intensity that affects the ability of the endoscope to detect lesions. The amount of remaining ICG in the parenchyma depends on the elapsed time between the injection and the procedure and on the liver function [
16] of the patient.
The ability to detect distant lesions in the presence of background fluorescence was evaluated using the same experimental setup as in the previous section. To simulate background fluorescence, known amounts of ICG were added to the liver parenchyma portion of the phantom, which in this case was prepared using a mix of intralipid solution to improve the homogenization of the medium. ICG background concentrations are calculated as target-to-background ratios with respect to a base concentration of 50 μM for the target. The intralipid mix was prepared according to the literature [
17] to mimic the optical properties of liver tissue at 830 nm, aiming for a scattering coefficient of 1.2 mm
−1 [
18].
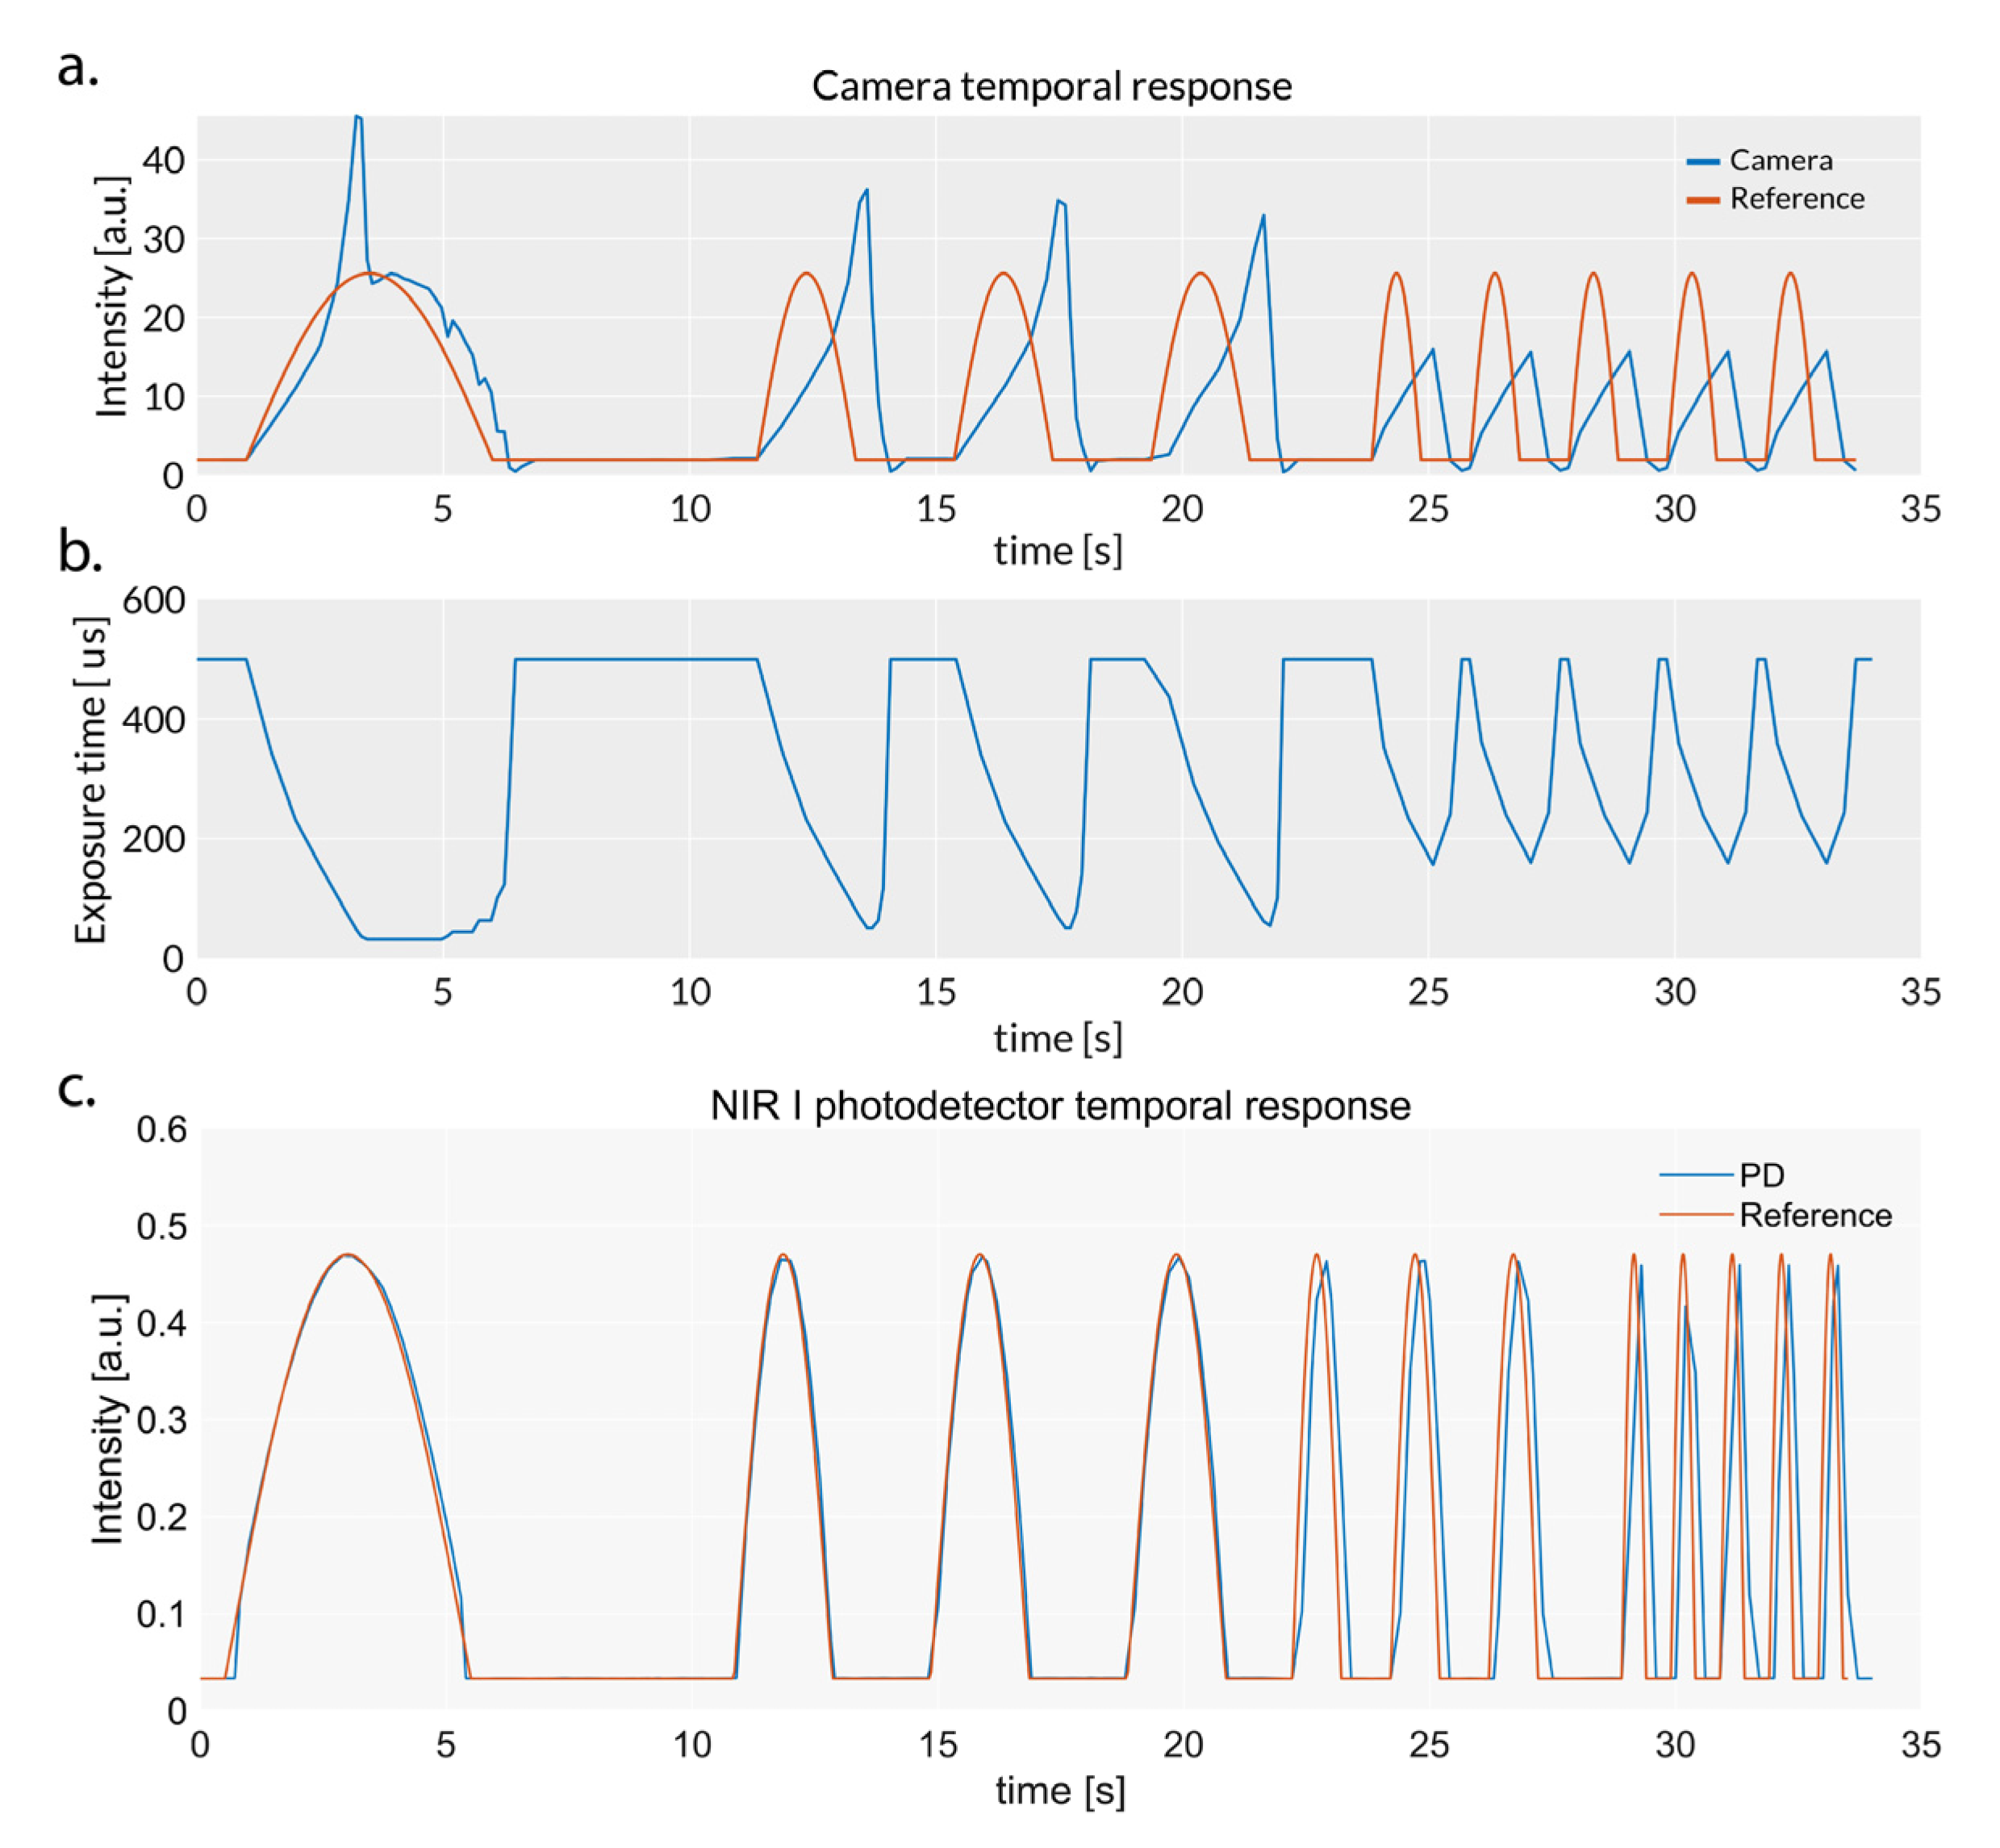
2.6.5. Temporal Response
The temporal response of the photodiode-based detection module is evaluated by measuring the accuracy of the device in detecting fast variations in the incident intensity. Data recorded by the photodetector are compared with the results from the camera. The illumination is carried out by modulating the laser intensity with half sine waveforms of increasing frequencies (0.1, 0.25, 0.5 and 1 Hz). Light is passed through a diffuser for homogenization. An offset was added to the signal to simulate a minimum amount of background fluorescence.
4. Discussion
Intraprocedural confirmation of the accurate positioning of a biopsy needle tip at the location of the lesion constitutes critical information during image-guided percutaneous biopsies. Fluorescence detection of ICG that has accumulated in liver tumors is a key milestone in identifying whether the needle is close to a lesion. The fluorescence pattern of lesions cannot be easily predicted by radiological imaging, and thus the detection technology must acquire data with a sufficient temporal resolution and sensitivity to provide reliable information to the radiologist. In this work, we introduce a new version of our endoscope that is capable of detecting light from fluorescent liver tissue with a photodiode through a clinical semirigid endoscope.
The photodetector module showed a comparable sensitivity in detecting both small concentrations of ICG and the fluorescence intensity from deep lesions. In contrast to a camera, this technology had a significantly superior temporal response, demonstrating reliability and accuracy when registering rapid changes in light intensity. Therefore, this device should be considered as a better alternative to recording temporal fluctuations of ICG intensity during biopsy procedures, especially under scenarios where weak fluorescence requires long integration times for the camera.
The results in this manuscript demonstrate that the silicon photodetector outperformed the InGaAs photodiode in terms of detecting ICG fluorescence. Moreover, the combination of measurements in the NIR I and II windows as a ratio did not reveal information about the distance from the tip of the needle to the lesion. The use of more specific spectral windows could potentially enable one to retrieve this information in the future, if the optical properties of the liver are sufficiently different at specific spectral points in such a way that differences are measurable. We believe that this approach might still be complicated to implement, unless the windows are close to the emission peak of ICG or a more sensitive detector technology for detection is used.
Background fluorescence in the liver is shown to be a problematic issue that dramatically reduces the distance threshold for fluorescence detection. Since the endoscope tip is embedded in the medium, background fluorescence prevents the detection of any increase in intensity until the tip is close enough to the lesion to detect an intensity above the background level. For concentration ratios below 50:1, the detected tumor-to-background ratio dropped by up to 3-fold, impeding the detection of fluorescent lesions over up to 1 mm away from the lesion. We believe that the development of spectral methods to distinguish background fluorescence from lesion-emitted fluorescence will be a step towards a more robust detection of tumors during fluorescence-guided biopsies.


