
Self-Contained Reference Sensors to Reduce Nuisance Alarm Rate in φ-OTDR-Based Fence Intrusion Detection System

1
Institute for Infocomm Research (I2R), Agency for Science, Technology and Research (A*STAR), 1 Fusionopolis Way, #21-01, Connexis South Tower, Singapore 138632, Singapore
2
ST Engineering Urban Solutions Ltd., 6 Ang Mo Kio Electronics Park Road, Singapore 567711, Singapore
*
Author to whom correspondence should be addressed.
Optics 2023, 4(2), 330-339; https://doi.org/10.3390/opt4020024
Submission received: 1 March 2023
/
Revised: 1 May 2023
/
Accepted: 10 May 2023
/
Published: 15 May 2023
(This article belongs to the Topic Advances in Optical Sensors)
Abstract
:Nuisance alarm rate (NAR) is one of the key performance parameters in a phase-sensitive optical time domain reflectometry (φ-OTDR)-based fence intrusion detection system. Typically, the vibrations caused by ambient environmental conditions, such as heavy rain, strong wind, and passing vehicles, easily result in many nuisance alarms. Significant research efforts have been undertaken to suppress the NAR. In this paper, we propose to utilize short segments of the sensing fiber as reference sensors for significant reduction in the NAR in φ-OTDR for the first time, to the best of our knowledge. According to our field trial results, the proposed approach can reduce the NAR by more than 90%. The proposed approach is very simple, practical, and cost-effective, which can be easily integrated with the existing methods of reducing NAR and act as an additional level of decision-making algorithm for triggering alarms.
1. Introduction
As one of the most important types of distributed optical fiber sensors, phase-sensitive optical time domain reflectometry (φ-OTDR) has attracted considerable attention in the past two decades due to the high sensitivity of monitoring vibration based on single-mode fibers (SMFs) over a long distance [1,2,3]. It has been widely used for fence intrusion detection. Any successful fence intrusion detection system depends on a high event detection rate (EDR), low nuisance alarm rate (NAR), and low false alarm rate (FAR) [4]. In this paper, EDR, NAR, and FAR refer to the probability of event detection, the generated nuisance alarms per hour, and generated false alarms per hour, respectively. Nuisance alarms refer to the alarms triggered by events that are not of interest. False alarms are not related to any vibration event; they are caused by the hardware of the interrogator, such as a laser source and pulse generator with a large jitter, or bugs in the software. For any successful fence intrusion detection system, false alarms cannot be tolerated.
In a φ-OTDR system, a highly coherent optical pulse is launched into the fiber under test (FUT), and the light reflected from a great number of different scattering centers due to Rayleigh backscattering (RB) will interfere coherently at the receiver. In the time domain, the backscattered light is a speckle-like trace during the duration corresponding to the whole fiber length. The phase and intensity of the backscattered light are sensitive to the local vibration. When vibrations are applied to the FUT, the collected signal corresponding to the vibration location varies with the time. By distinguishing the signal variation of the speckle-like trace, the vibration can be monitored. Therefore, in φ-OTDR-based fence intrusion detection systems, when intrusion events occur, the generated vibrations will trigger the alarms. However, the background vibrations caused by the ambient environmental conditions, such as heavy rain, strong wind, as well as traffic crossings and industrial noises, can also result in signal variations of the backscattering trace and lead to nuisance alarms. Previously, to reduce the nuisance alarms, a variety of approaches have been demonstrated. One approach is using signal processing methods, including filtering and noise reduction, to improve the signal to noise ratio (SNR), which can only suppress the NAR caused by the random noises [5,6,7]. It is difficult to reduce the NAR induced by the background vibrations, such as heavy rain and strong wind. The second approach is improving the pattern recognition accuracy of different vibrations with artificial intelligence (AI) methods [8,9], which require high-performance computational resources. The third approach is multiplexing optical pulses with different widths [10]. However, the maximum detectable frequency is reduced by times of the pulse multiplexing number. The fourth approach is constructing hybrid sensing systems consisting of φ-OTDR and other sensors, such as Michelson interferometer [11], Mach–Zehnder interferometer [12], or polarization-sensitive OTDR [13]. However, this approach increases the hardware complexity of the system. The above approaches can dramatically suppress the NAR, but there is still room for improvement.
Recently, a pattern recognition method using self-reference features was demonstrated, in which one segment of the FUT after the vibration position was used as a reference; the signal features at the vibration position and reference position were combined as the self-reference features. The pattern recognition accuracy of tapping, bending, trampling, blowing, and five types of mining equipment can be effectively improved after using the self-reference features [14]. However, this work did not investigate the NAR reduction by using self-reference features. In addition, it is only suitable for an AI-based pattern recognition method.
In this paper, we propose and demonstrate one simple, practical, and cost-effective approach for reducing the NAR of a φ-OTDR-based fence intrusion detection system. In the proposed approach, one or a few segments of the sensing fiber are used as reference sensors for dynamically adjusting the threshold of triggering alarms. According to our field trial results, the NAR can be reduced by more than 90%. It should be noted that the function of the reference sensors in our proposed approach is different from that used for constructing self-reference features in [14]. In our proposed approach, the reference sensors are used for monitoring the surrounding environment conditions, and they can locate before or after the monitored fences. Meanwhile, in [14], the reference segment of the FUT can only locate after the vibration position, which is used for collecting the reference signal features related to the event vibration. Our proposed approach can be easily integrated with all the previously reported ones. It is straightforward that combining two different approaches is able to further decrease the NAR. By using the proposed approach, most of the nuisance alarms caused by the environmental conditions can be avoided; only a small part of the suspected alarms needs to be transferred to the existing decision-making algorithm. It should be noted that the polarization fading problems are not the focus of this paper. Our proposed approach can be used in all ϕ–OTDR systems with or without polarization fading mitigation techniques.
2. Operating Principle
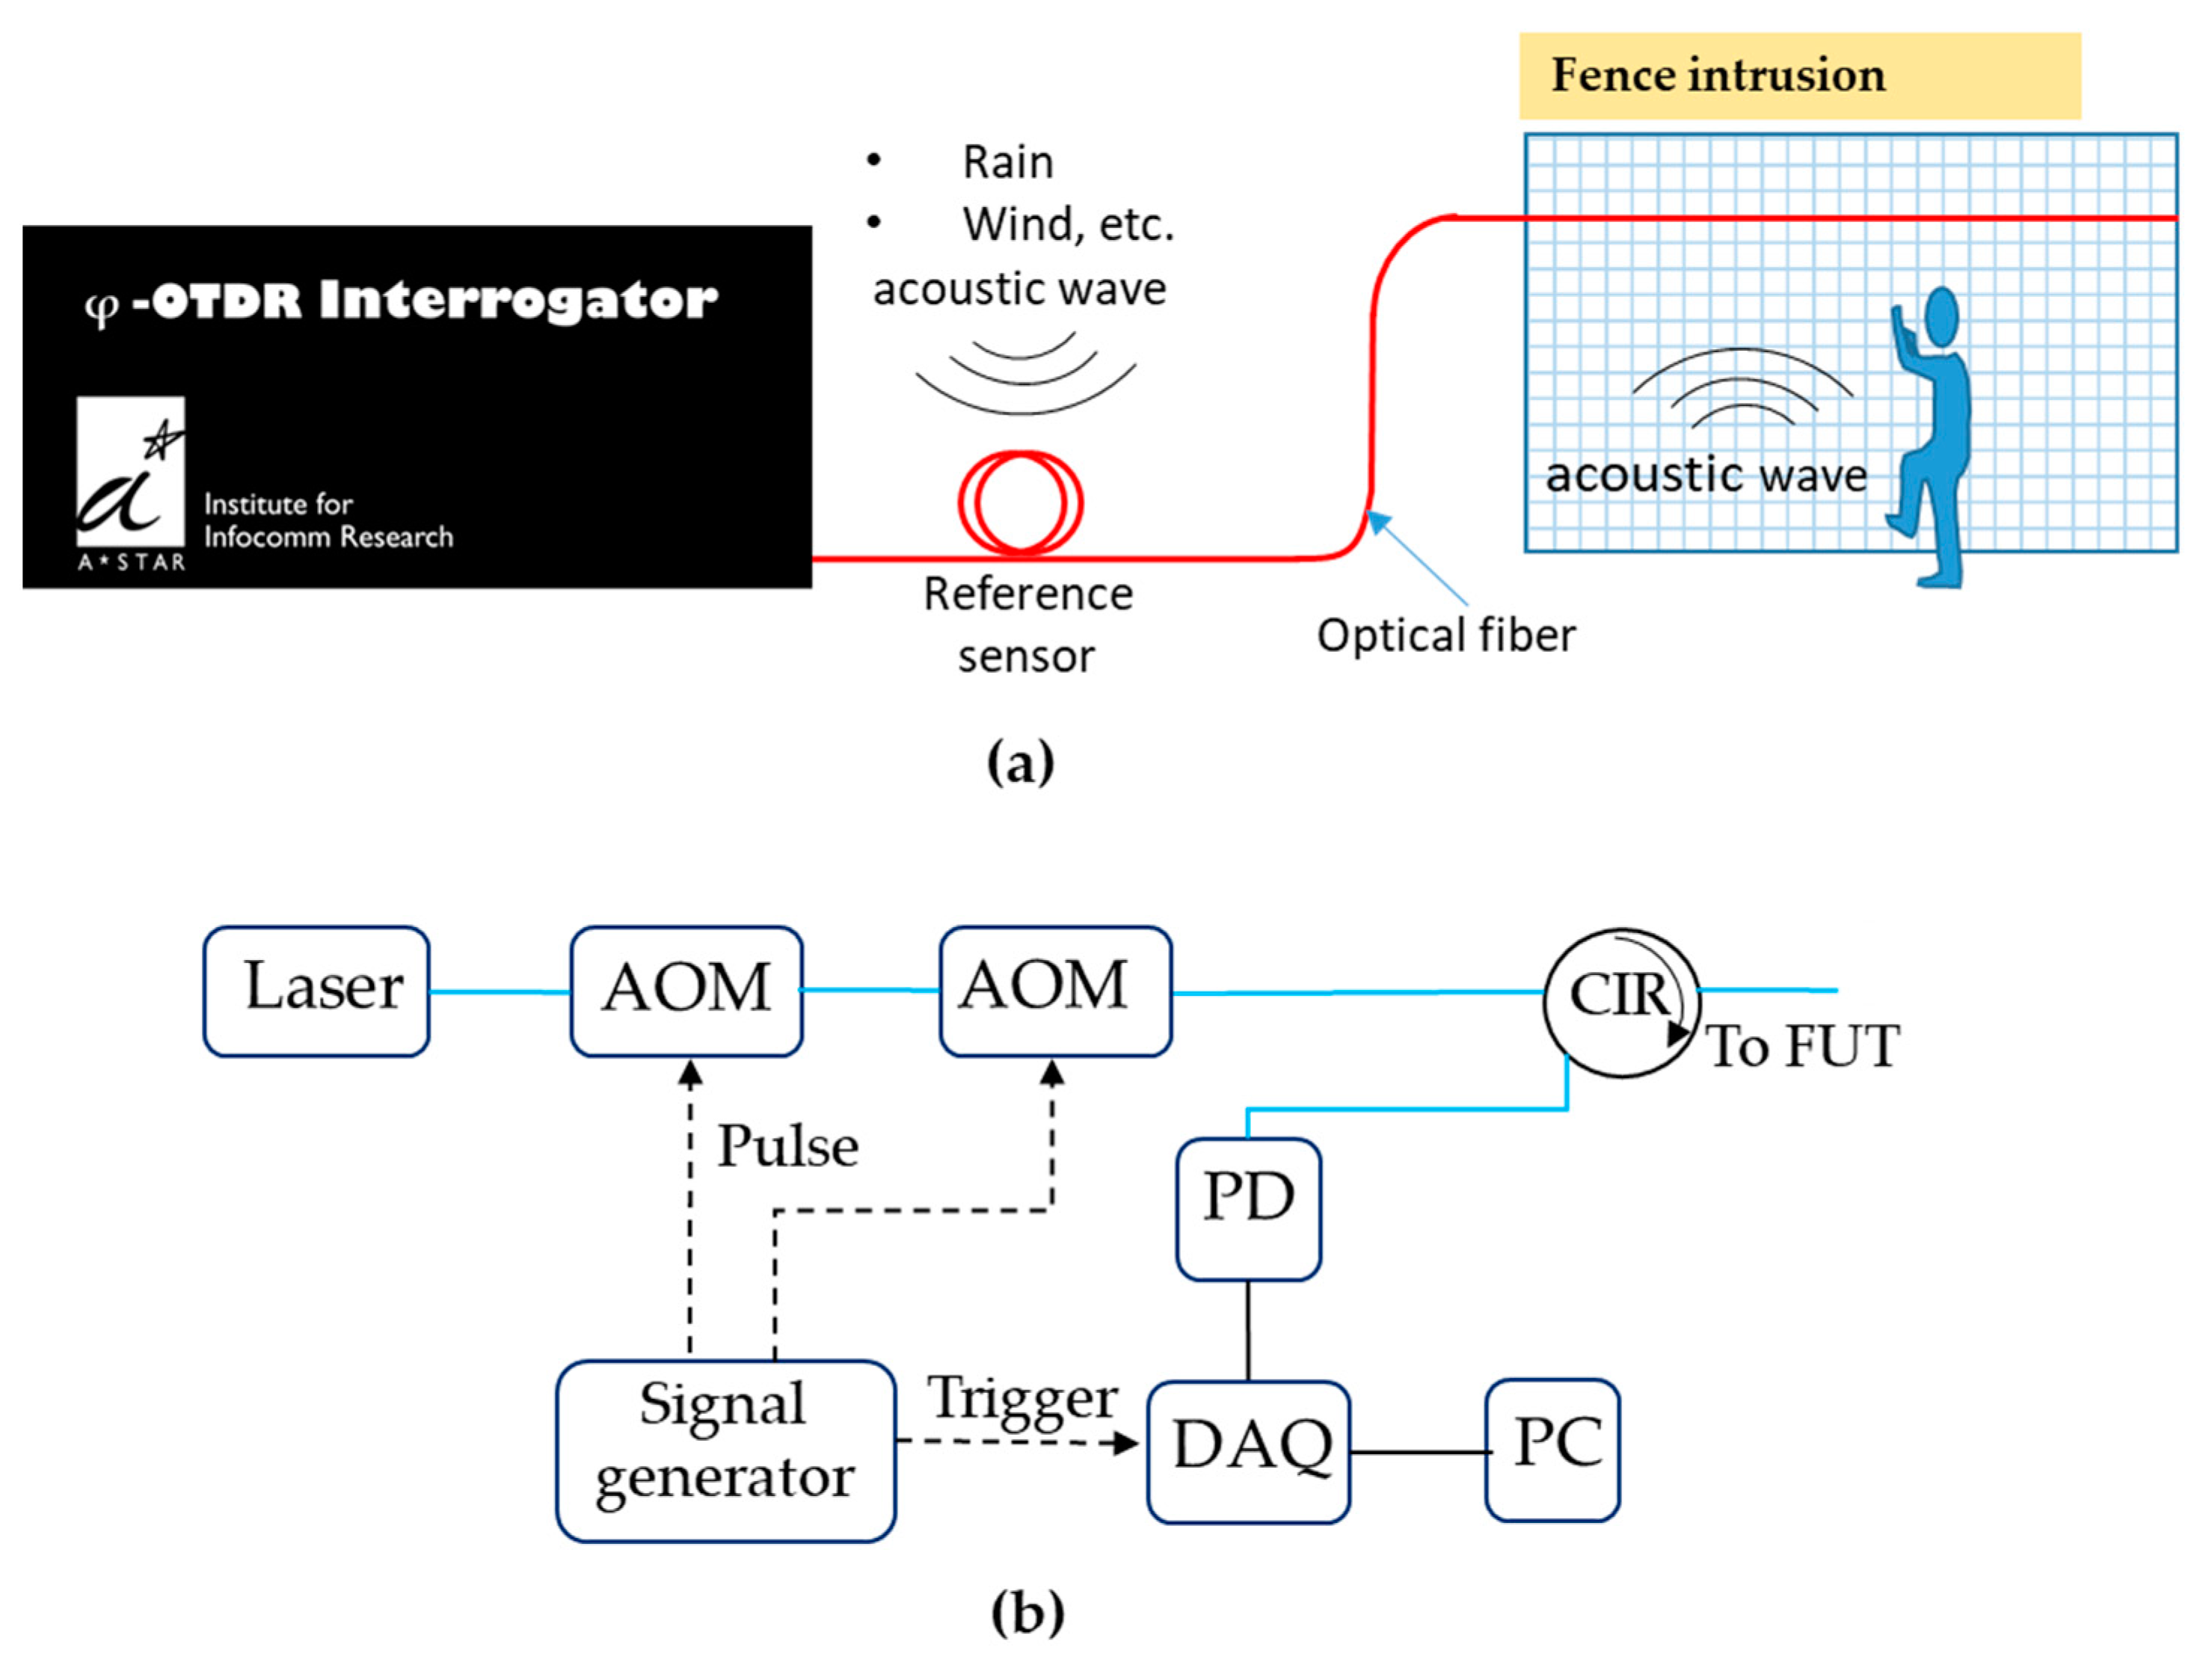
Figure 1a shows the schematic diagram of the proposed approach for reducing the NAR due to background vibrations in a φ-OTDR-based fence intrusion detection system. A segment of the sensing fiber that is not mounted on the fences can be used as the reference sensor. Therefore, it is not influenced or affected by vibrations generated by fence intrusions but only influenced by weak ambient vibrations. In real-world applications, the reference sensor should be installed in an outdoor environment for monitoring the environmental conditions. To avoid the situation that the system is compromised or defeated by triggering the reference sensor on purpose, the reference sensor is preferably installed within the perimeter of the fence and disposed on the ground. In addition, one or more reference sensors can be used in one sensing site.
The φ-OTDR interrogator used in this paper was based on intensity-based direct detection, as shown in Figure 1b. The laser source was an external cavity low-noise laser (RIO Grande high-power laser). The operation center wavelength and line width were 1550.12 nm and less than 1 kHz, respectively. Two acousto-optic modulators (AOMs) were used to modulate the CW light into optical pulses with a very high extinction ratio, larger than 100 dB. The RB light from the FUT was detected by a photodetector (PD) with a 3 dB bandwidth of 10 MHz and recorded by a DAQ card.
The collected data were shaped into a data matrix every second. Each row of the data matrix represents an RB trace, and each column corresponds to the RB light intensity of one local position in the time domain [15]. As the total RB trace is a speckle-like trace, i.e., the direct current (DC) component of the signals corresponding to different local positions are different, it needs to be filtered out [16]. In addition, the low frequency component of the signal in the time domain is also filtered out to reduce the influence of the environmental noise. Normally, a band pass filter or high pass filter is used to pre-process each column of the raw data. If vibrations happen, there will be peaks corresponding to the vibration positions in the filtered RB trace. Root mean square (RMS) values of the filtered RB signal can be calculated to monitor the vibrations.
To directly and intuitively demonstrate the feasibility of the proposed approach for reducing the NAR, we did not use any advanced signal processing methods; only the RMS values of the signal were calculated, and the peaks of the RMS curve were used for triggering the alarm. The system alarm will be triggered if the RMS values of the peaks exceed a certain threshold. It should be noted that one alarm means one peak exceeding the threshold within one second. Therefore, one event may consist of many continuous alarms.
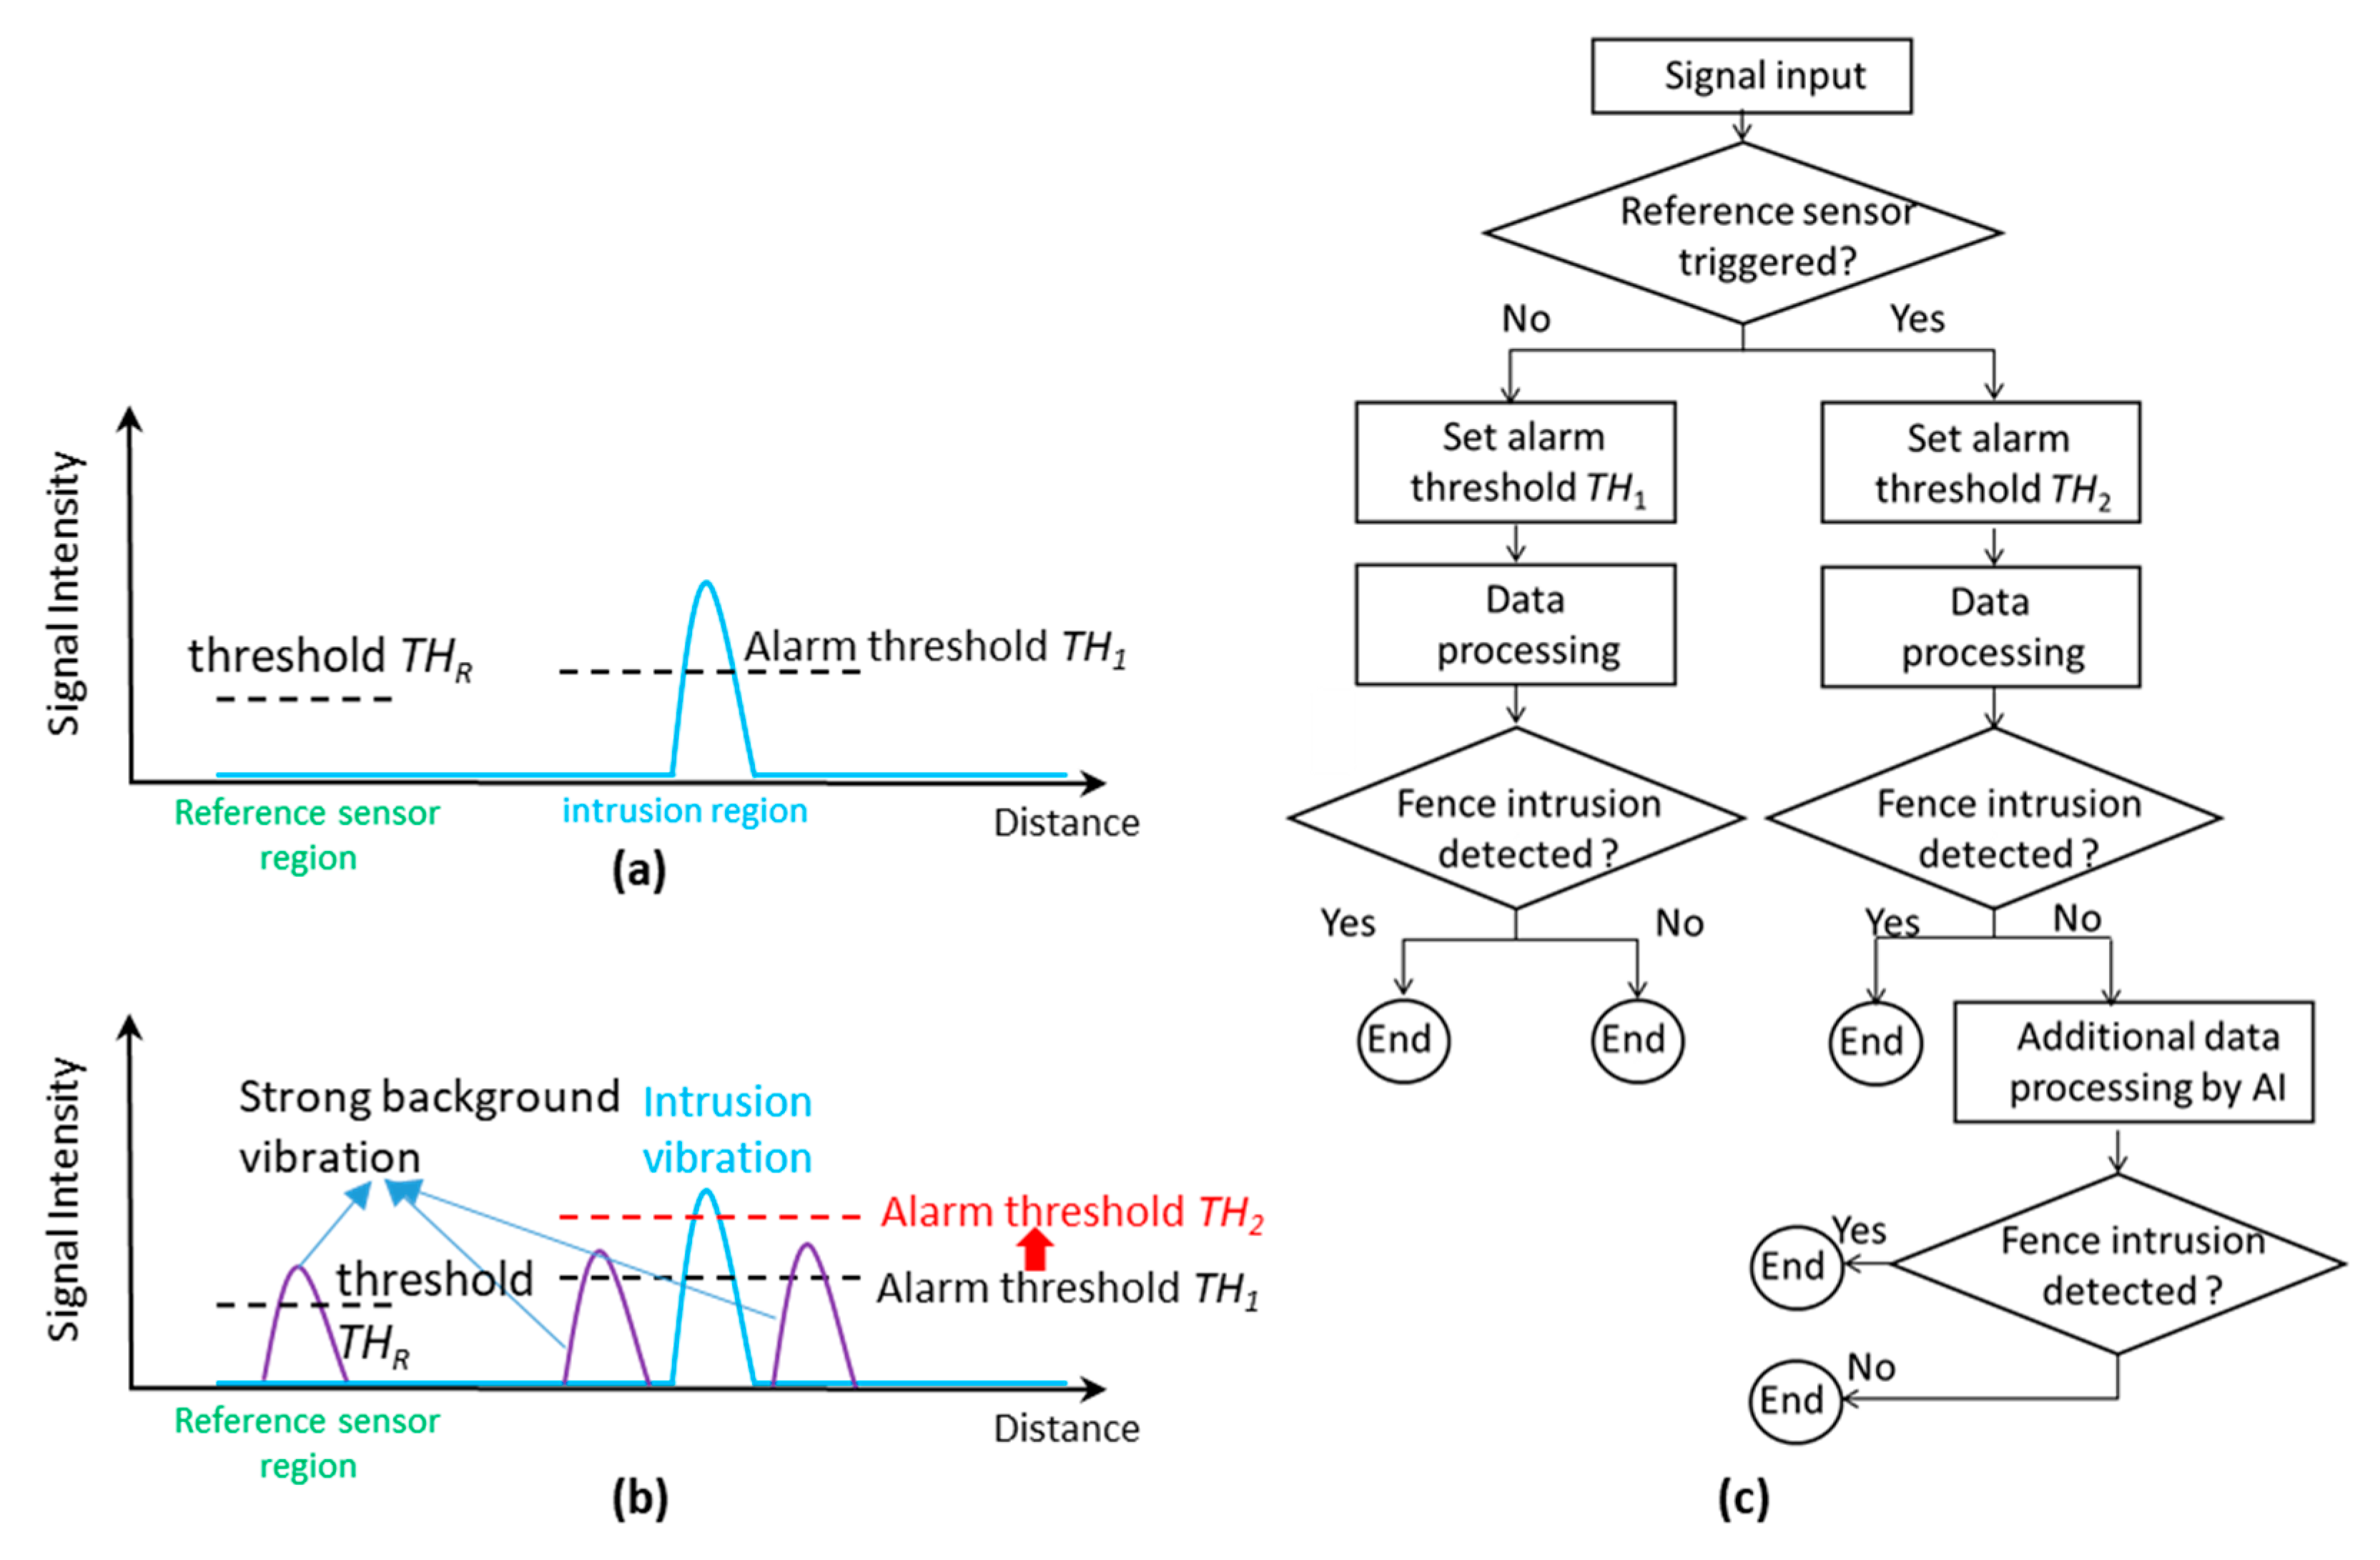
Figure 2 illustrates the working principle of the reference sensor. For example, if there are no strong background vibrations at the reference sensor, the signal intensity will not reach the reference sensor threshold THR. In this scenario, the threshold of triggering the system alarm is threshold TH1, as shown in Figure 2a. In another scenario, when there is heavy rain or strong wind, almost all the fibers mounted on the fence will have strong vibration signals even without intrusions. The signal intensity of the reference sensor will also largely increase and exceed the threshold THR, and then the threshold of triggering the system alarm will multiply times by N, i.e., increasing from TH1 to TH2. Alarm threshold TH2 is larger than most of the signal intensity caused by the rain or wind, as shown in Figure 2b. Thus, the nuisance alarms caused by the rain or wind can be significantly suppressed. It should be noted that N mainly depends on the RMS value of the intrusion events and strong background vibrations caused by ambient environmental conditions, such as heavy rain. The value of multiplier N depends on the specific projects, and it does not have to be an integer. Figure 2c illustrates the algorithm flow chart of the reference sensor working principle. In real-world applications, the proposed approach can be combined with other methods of reducing the NAR, such as AI-based methods, as illustrated in the flow chart. It should be noted that the results presented in this paper are only based on the reference sensor without combining other methods. One of the advantages of the proposed approach for reducing NAR is simplicity. Advanced signal processing schemes such as AI-based methods are suggested to be included only when it is really necessary.
3. Results of Field Trial Demonstration
Field trials were executed in Singapore to demonstrate the proposed approach of reducing the NAR in a fence intrusion detection system by using the developed φ-OTDR interrogator. In Singapore, it rains very frequently, with an average of 167 days in one year [17]. Thus, the reference sensor in this paper was used as a rain sensor. The data were processed in real time. The power of the CW light output from the laser source was 29 dBm. The width and repetition rate of the generated optical pulses were about 100 ns and 10 kHz, respectively. The sampling rate of data collection was 100 MS/s. A Butterworth band-pass filter with a frequency range from 2 kHz to 4.5 kHz was used to filter the raw data.
The fiber cable was mounted on the fences by flowing the layout, as shown in Figure 3a [18]. The total length of the fiber was about 1250 m. The lengths of the lead fiber cable between the interrogator and the fence and the fiber cable mounted on the fence were about 645 m and 90 m, respectively. The optical pulse width was 100 ns, which corresponds to a spatial resolution of 10 m. To avoid fence intrusions influencing the reference sensor, its length must be longer than the spatial resolution. Therefore, the length of the fiber cable section used as a reference sensor was about 20 m. The reference sensor was hung on a rack. The last 500 m fiber cable was mounted on other fences, which were not used in the field trials. One CCTV camera was installed beside the fences for verifying the alarms. Figure 3b shows the fiber cable used in this work. There are two standard G652D single-mode fibers (SMFs) in the fiber cable, and only one was used as the sensing fiber. The outer diameters of the outer jacket, spiral armored tube, and tight buffer of the fiber cable are about 4.8 mm, 2.8 mm, and 0.9 mm, respectively.
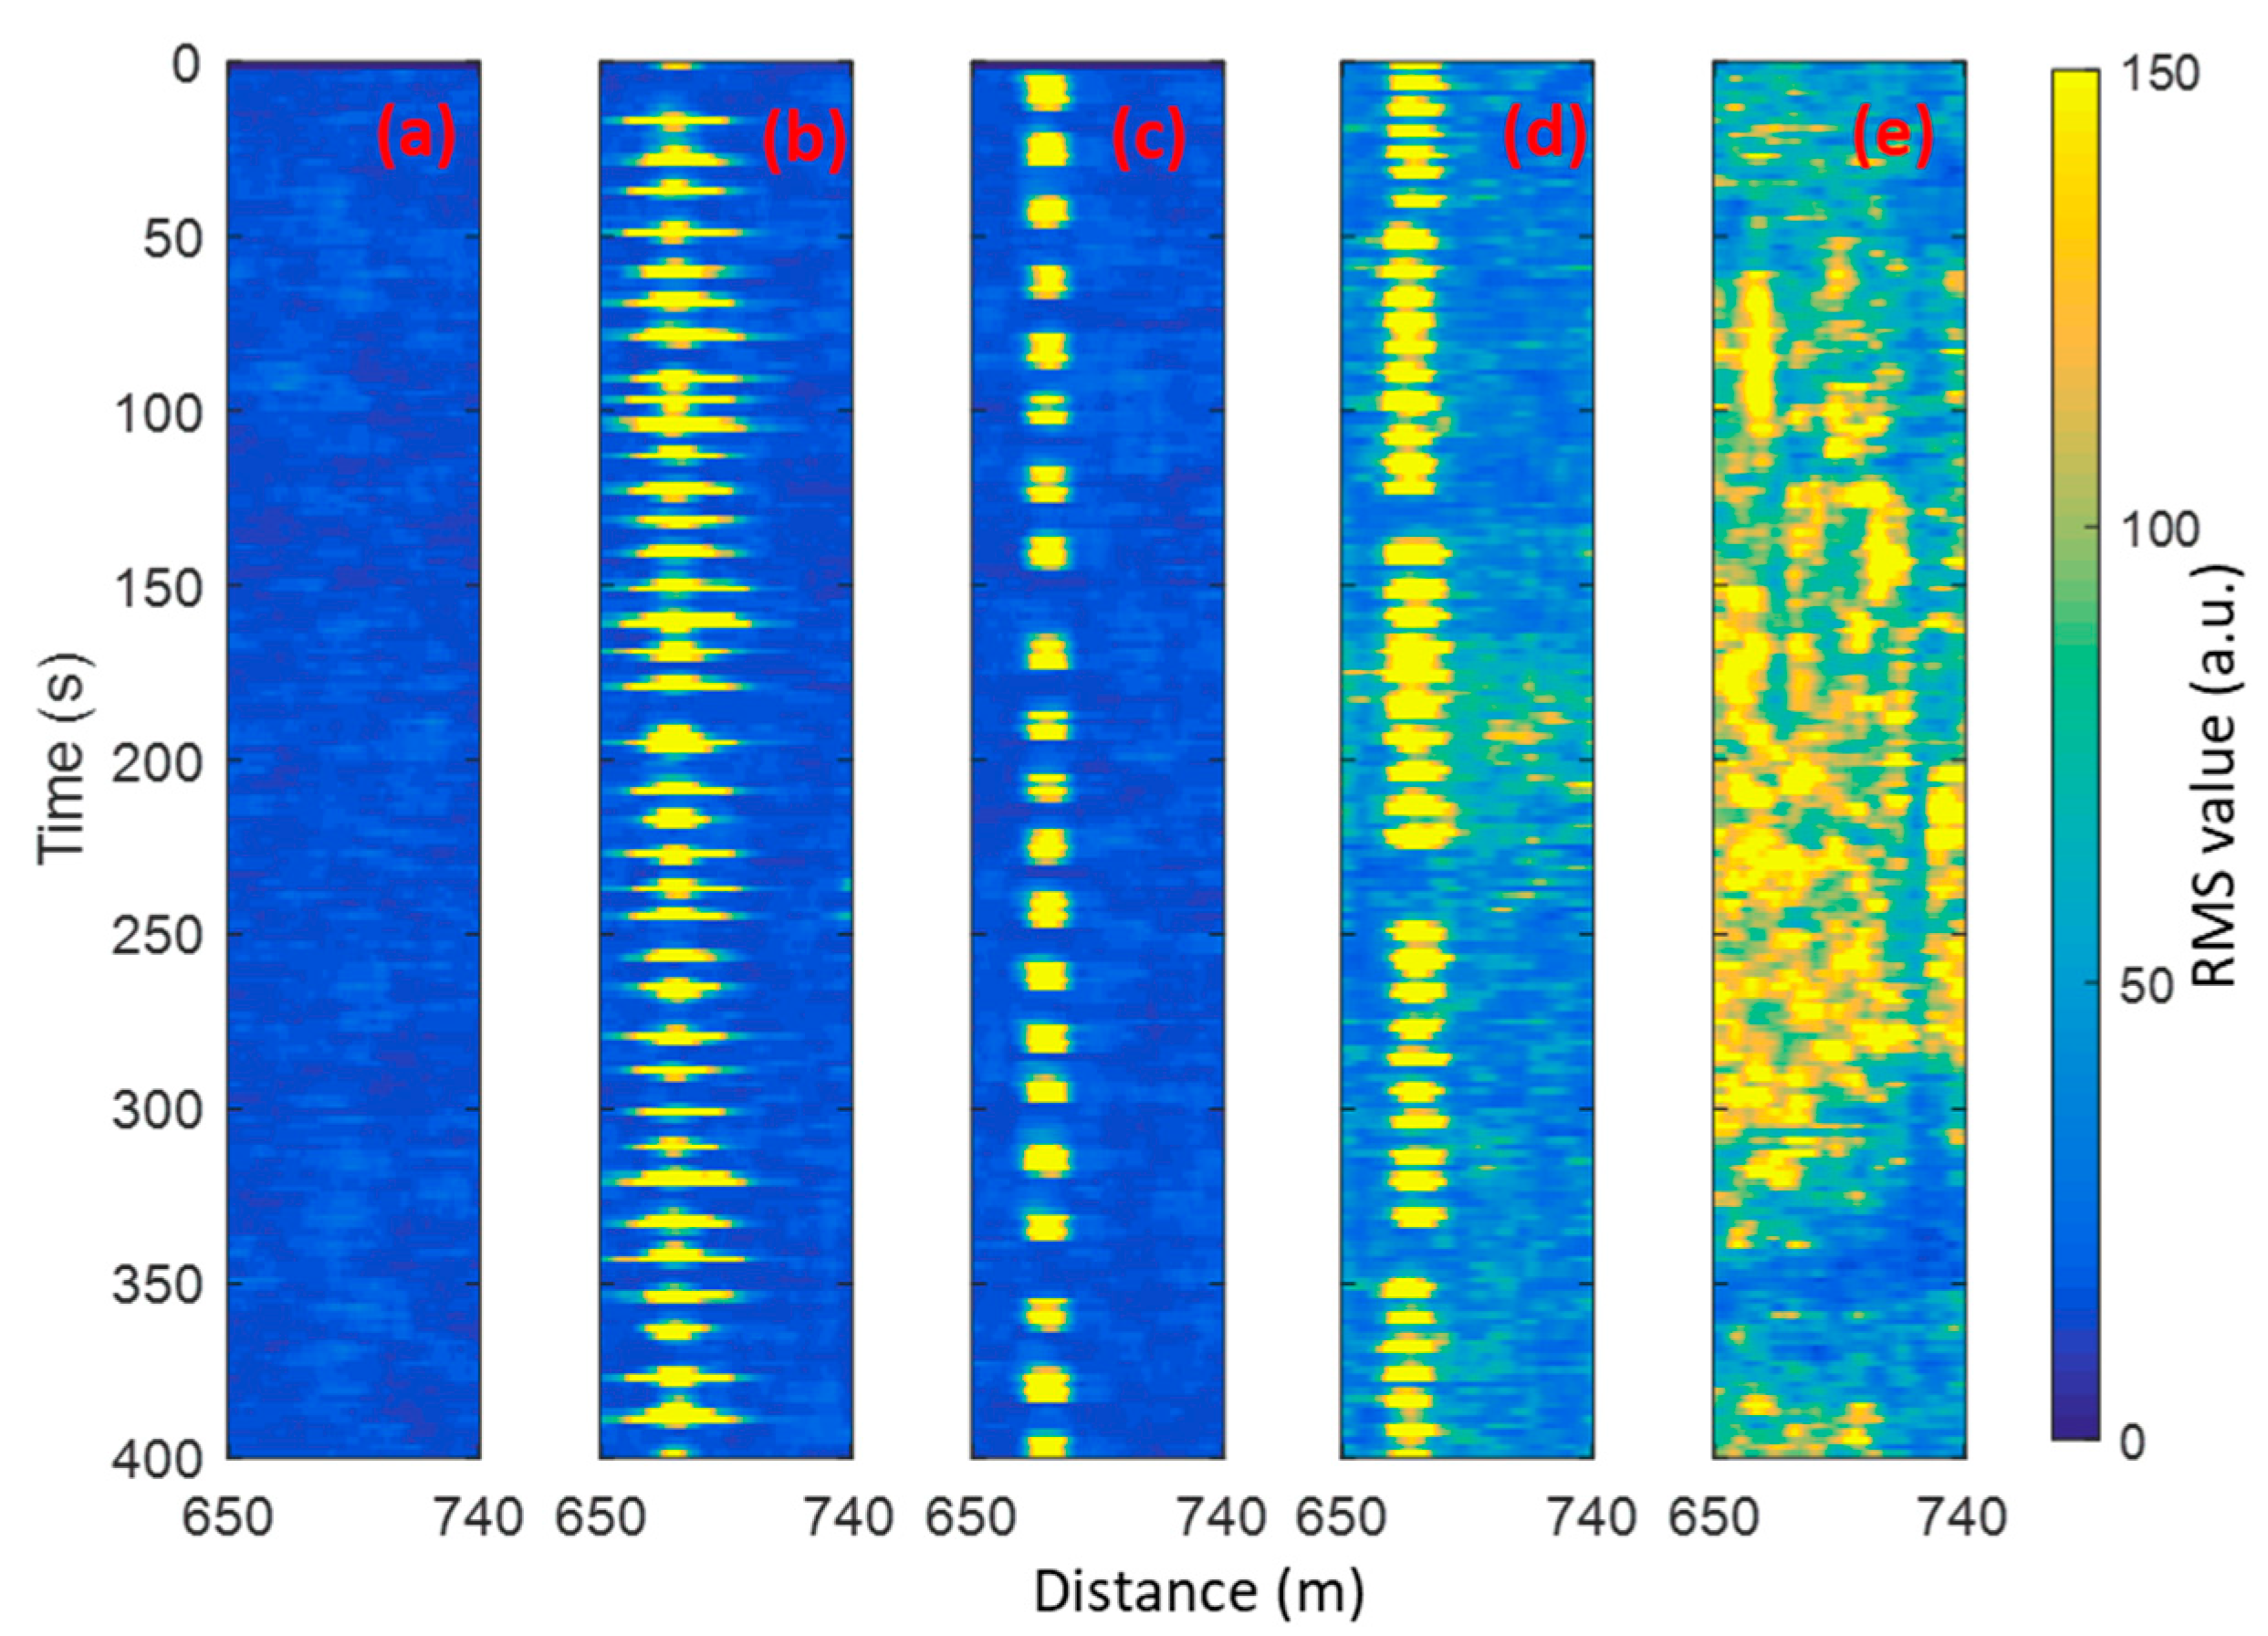
The RMS value of the background on a sunny day was less than 70. For the work in this paper, three activities for fence intrusion (i.e., aided climbing on fence, unaided climbing on fence, fence cutting) were considered. Generally, these activities would cause very strong vibrations compared to rain/wind. After a large number of tests for the three types of intrusion events, the alarm threshold TH1 was set to be 150. Aided climbing on the fence means placing a ladder against the fence, then scaling up the ladder. Unaided climbing on fence means scaling up the fence physically without using a ladder. To demonstrate the reasonability of this threshold value, the three types of intrusion events were repeated 100 times. According to the field trial results, all the simulated intrusion events were detected. The position of the events was located around 675 m of the fiber cable. Figure 4 shows the waterfall plots of the background on a sunny day, the three intrusion events, and the background in heavy rain. Further, the x and y axis represent distance and time, respectively. It should be noted that the RMS values that are larger than or equal to 150 map to the last color (yellow) of the color bar in Figure 4. As shown in Figure 4a, all the RMS values of the background on sunny days were very small, i.e., less than 60. Fence cutting and aided climbing on fence were performed on a sunny day, the event signals with yellow color were very obvious, and the waterfall plots of the RMS values are illustrated in Figure 4b,c, respectively. Unaided climbing was performed in moderate rain. The event signal of unaided climbing can be observed obviously; there was some background vibration caused by the rain, as shown in Figure 4d. Figure 4e shows the results in heavy rain; as can be seen, there were very strong vibrations on all the fences, which can generate many alarms.
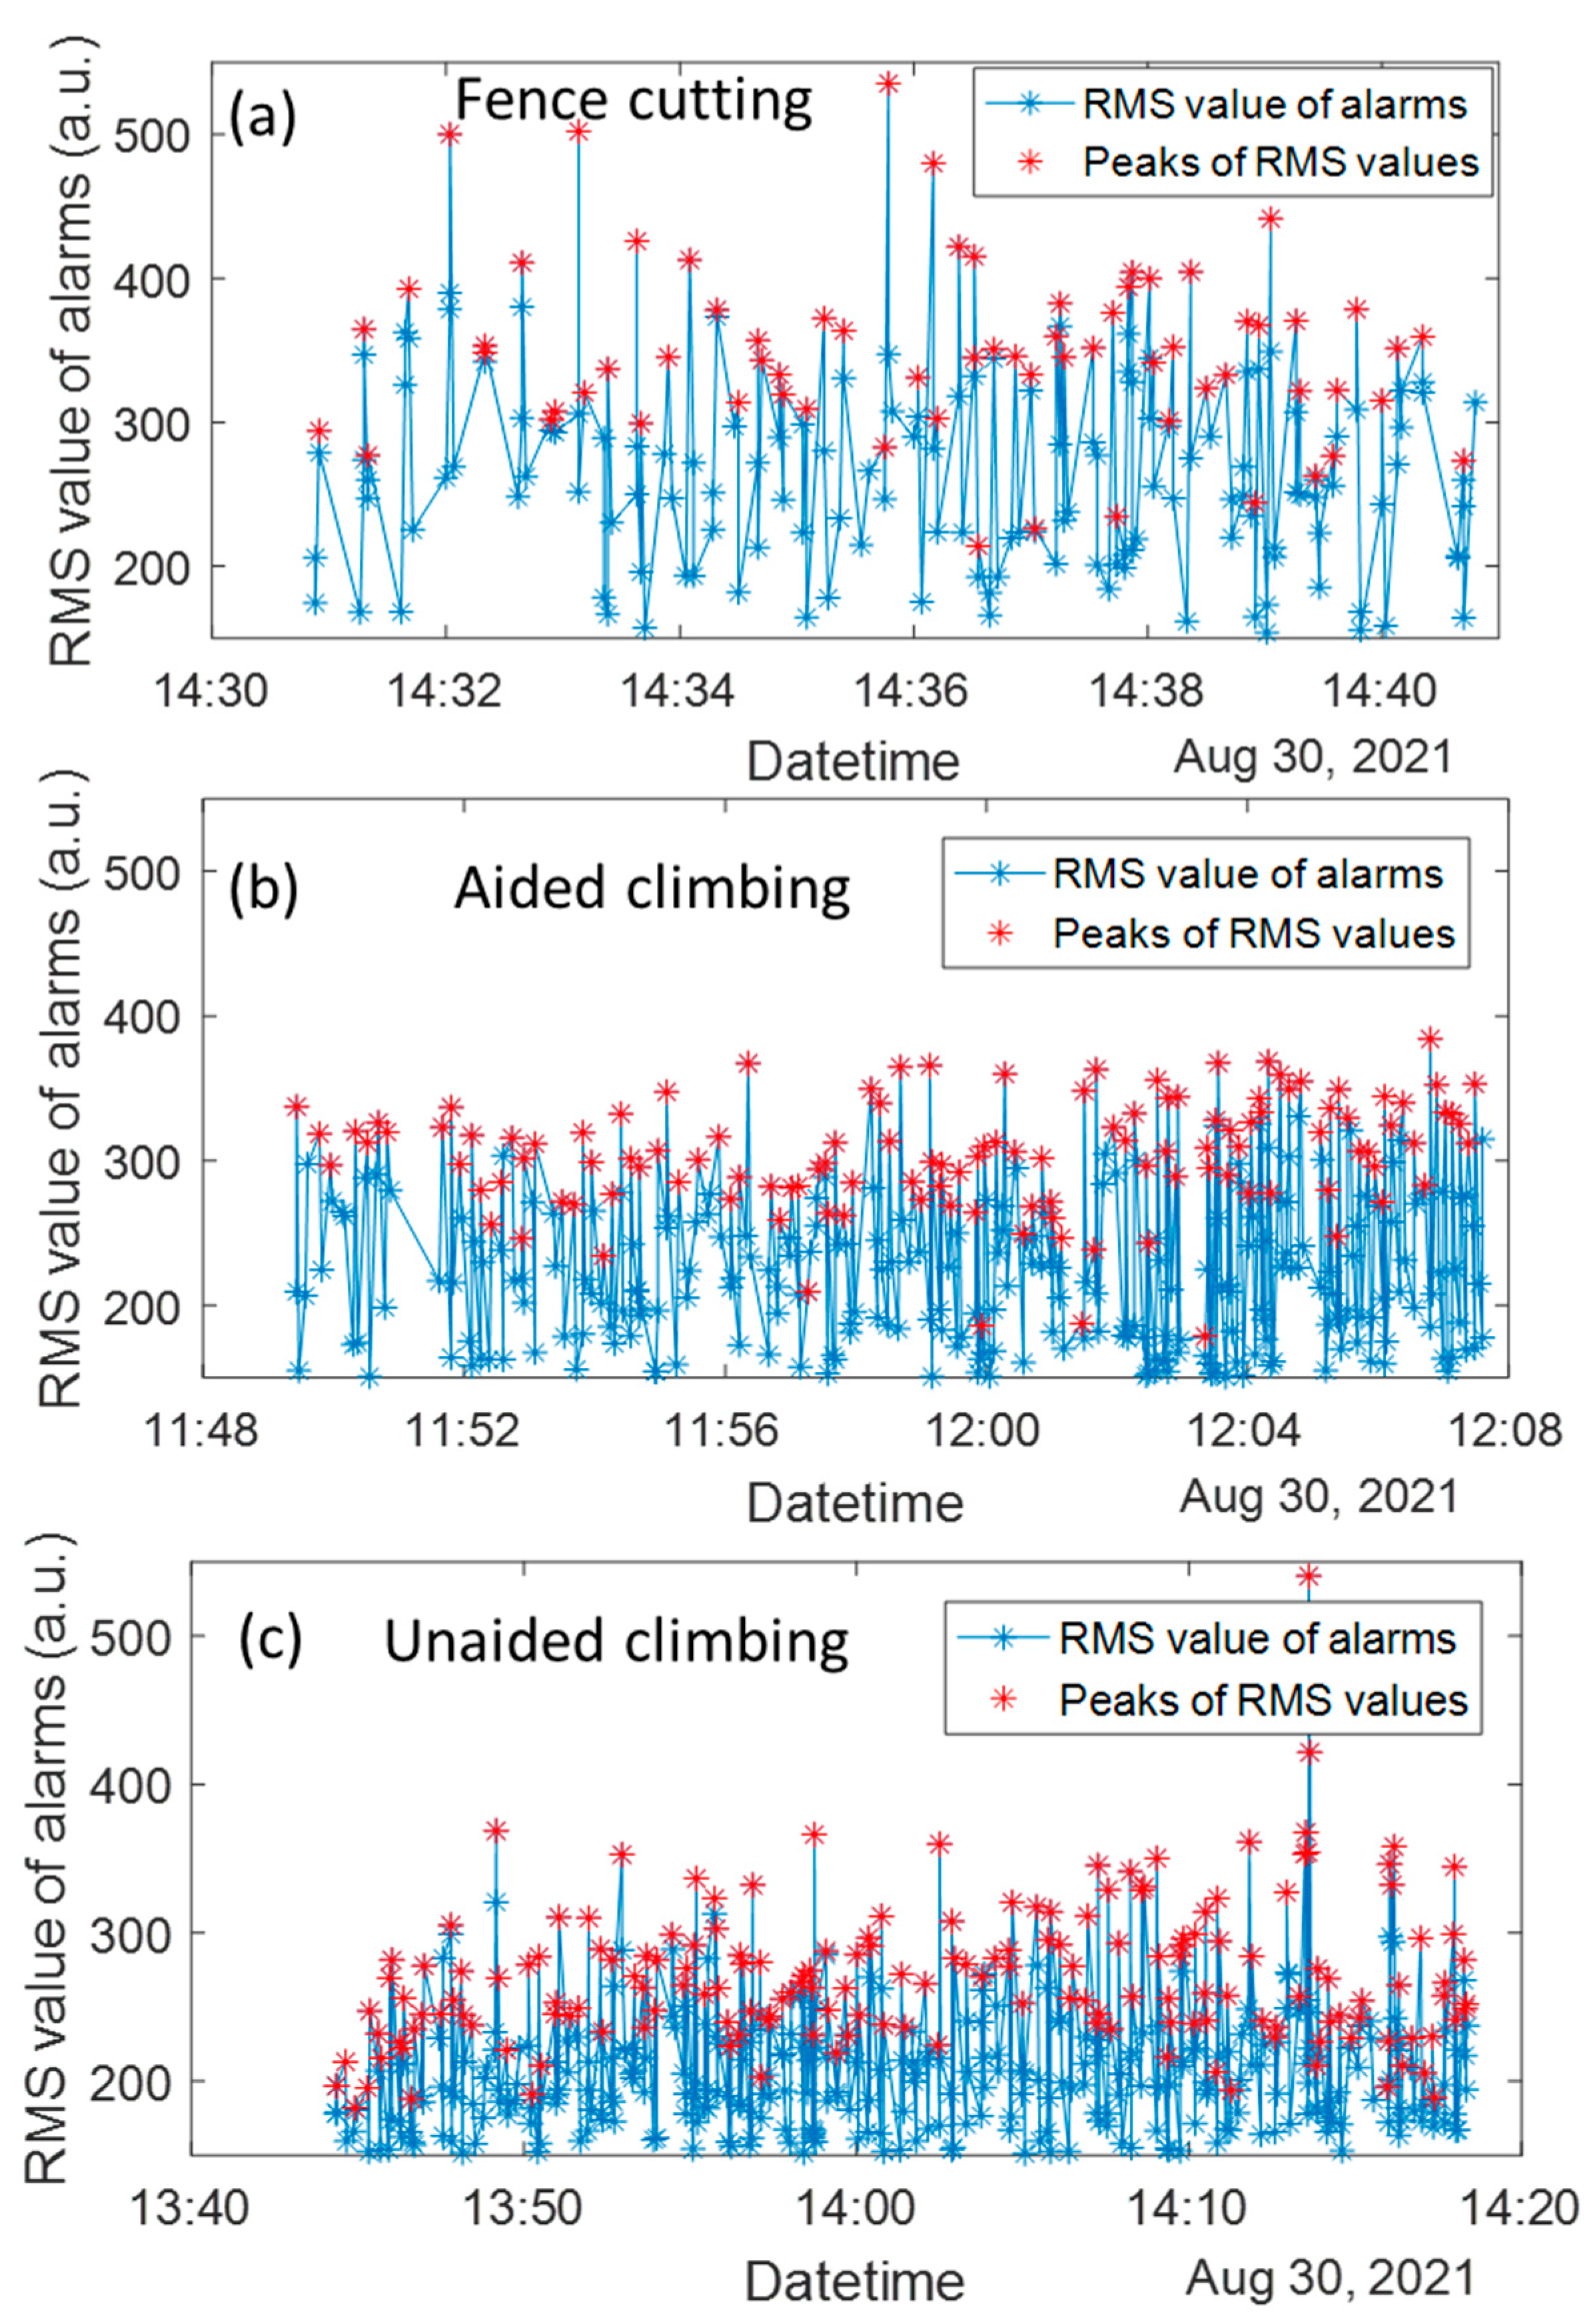
Figure 5 shows the RMS values of the alarms for the three types of events with TH1 = 150. Figure 5a–c corresponds to fence cutting on a sunny day, aided climbing on fence on a sunny day, and unaided climbing on fence in moderate rain, respectively. The blue stars in the figures represent all the RMS values of the alarms. As the vibration caused by each event lasted for a few seconds, each event can trigger alarms with a few RMS values in a continuous period. The red stars in the figures represent the peaks of the RMS values for different events. As can be seen in Figure 5b,c, the RMS values of a few peaks are around 180. To make sure that all events can be detected on sunny days, TH1 was set to be 150.
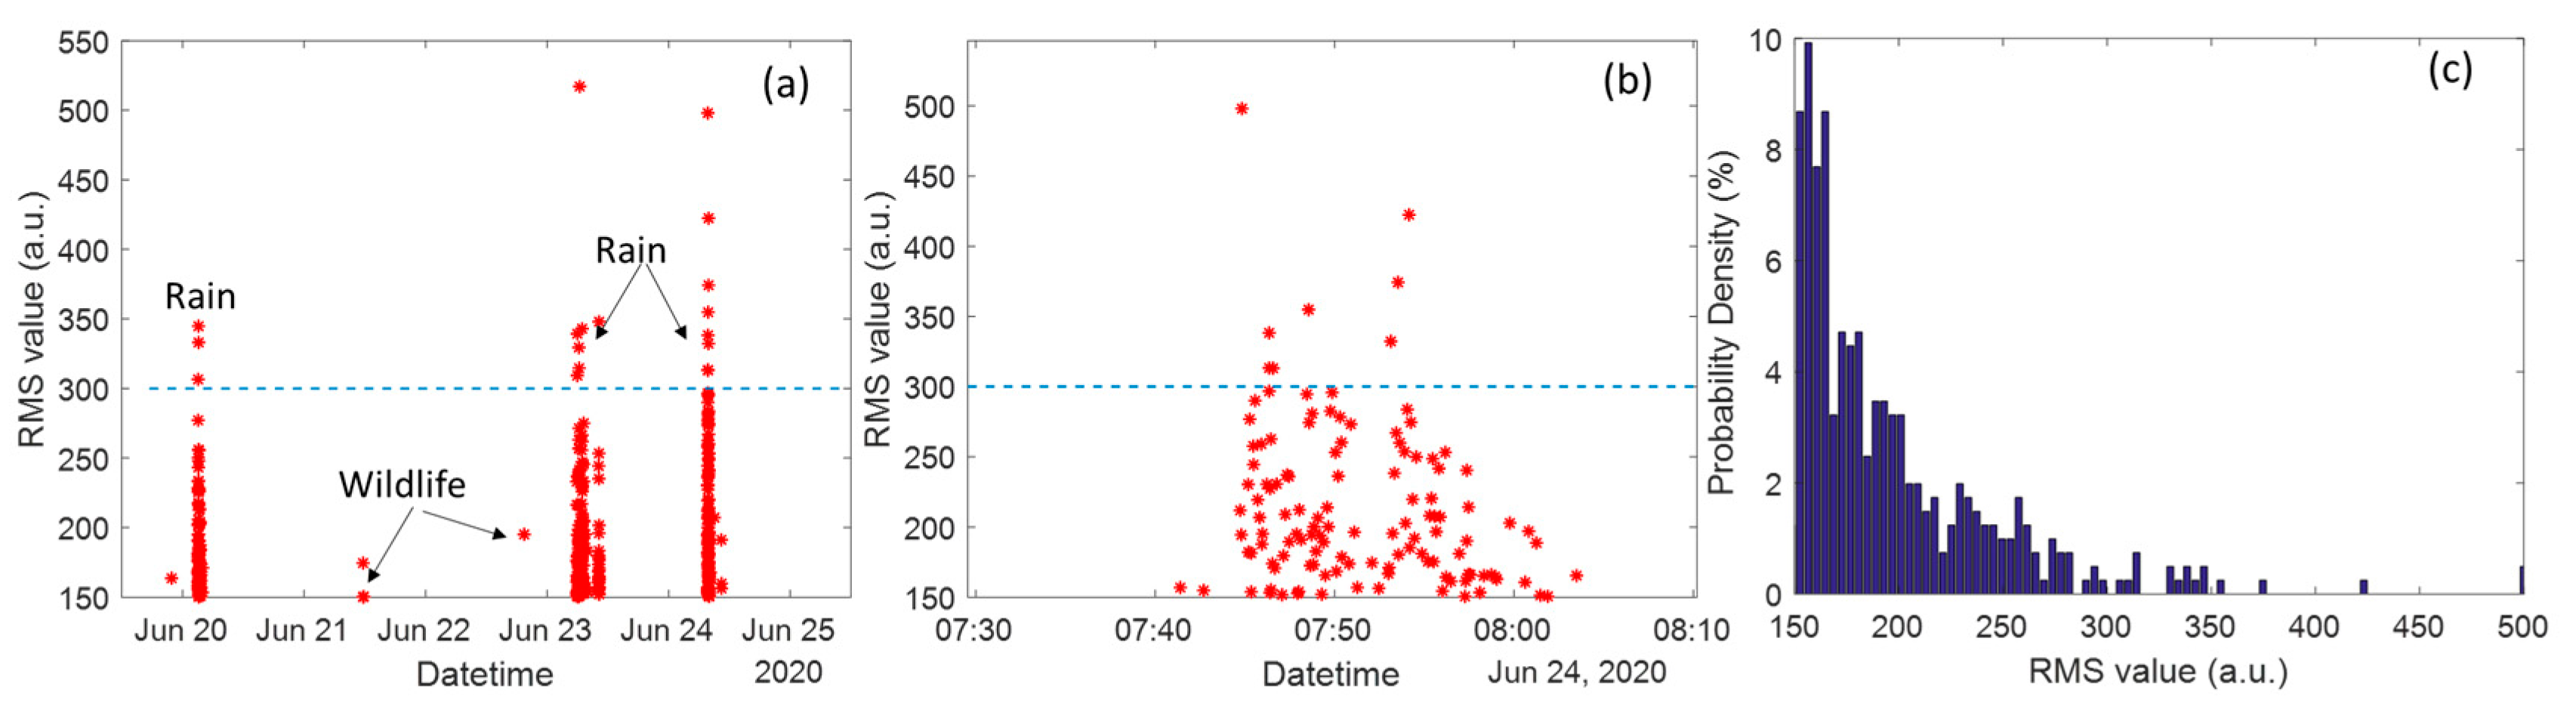
To investigate the performance of the proposed approach for reducing the NAR, two field trials for recording the background-caused alarms were conducted. The first and second field trials were without and with using a reference sensor, respectively. Figure 6a shows the alarms recorded without using a reference sensor. The duration of the field trial was 137.5 h, which was from 5:30 on 19 June 2020 to 11:00 on 25 June 2020. The total nuisance alarms number was 403. By checking the video footage, most of the alarms were identified to be induced by heavy rains, and some were caused by wildlife, such as birds. The total raining duration was about 4 h. Figure 6b is the zoomed in part of Figure 6a for the duration from 7:30 to 8:10 on 24 June 2020; all the alarms were induced by the rain. As can be seen, it generates many alarms in a very short time. The probability histogram of the RMS values of all the recorded alarms is illustrated in Figure 6c. If the alarm threshold is increased to 300 from 150, the number of alarms decreases to 18. Therefore, based on the recorded alarms, if adding a reference sensor, the nuisance alarm number can be decreased theoretically by about 95.5% from 403 to 8.
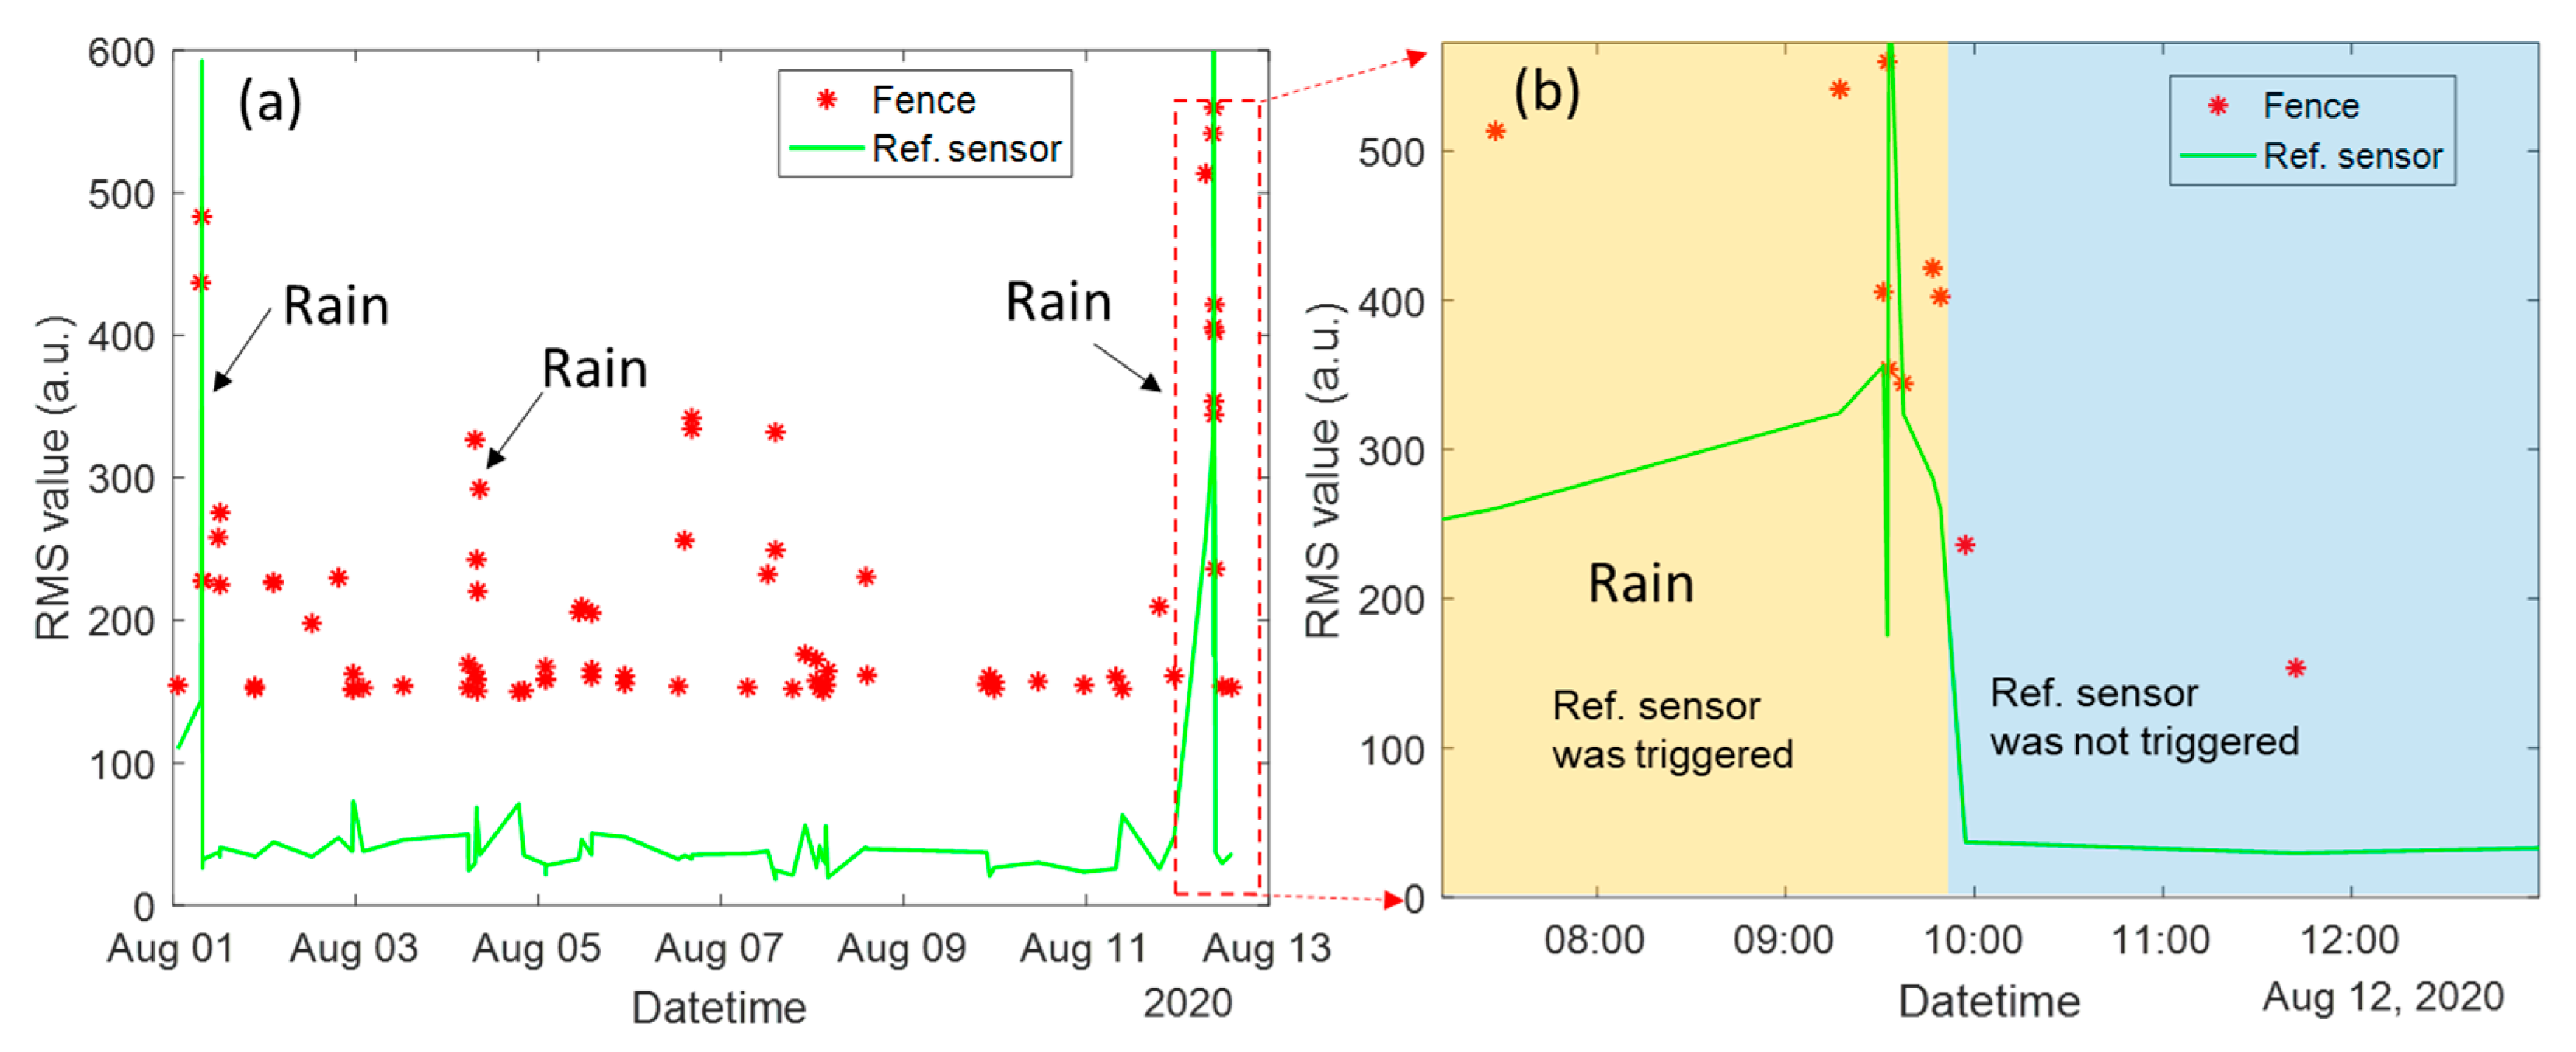
Another field trial using a reference sensor was conducted to further demonstrate the performance of the proposed approach. The reference sensor threshold THR was 110, and N = 2, TH1 = 150. Other settings of the interrogator were kept unchanged. The fences were monitored in real time from 18:00 on 31 July 2020 to 24:00 on 12 August 2020; i.e., the field trial duration was 294 h. The total alarm number was 80. The NAR of this field trial was 0.272/hour. The alarms’ records are shown in Figure 6; the red asterisks represent the recorded RMS values of the alarms generated by the fiber mounted on the fences, and the green curve represents the RMS values of the reference sensor. Figure 7a shows all the alarm records in 294 h. Figure 7b is the zoomed in part of Figure 7a for the duration from 7:00 to 13:00 on 12 August 2020. As can be seen in Figure 7b, when the RMS value of the reference sensor was larger than 110, the reference sensor was triggered and the threshold of triggering alarm was increased to TH2, i.e., 300; only the vibrations with RMS values larger than 300 were recorded, which coincides with the threshold settings. When the rain stopped, the RMS value of the reference sensor decreased to less than 60; vibrations with an RMS value larger than 150 were recorded. Between 4 August and 8 August 2020, as the rain was not so heavy, the RMS values of the rain sensor were less than THR; thus, the threshold of the system was TH1, and the system generated some alarms with RMS values larger than 150.
4. Discussion
According to the field trial results presented above, the alarm numbers can be dramatically reduced after using a reference sensor. In the field trial without using a reference sensor, as shown Figure 6b, the system alarmed 116 times in only 20 min from 7:40 to 8:00 on 24 June 2020. As a contrast, on 12 August 2020, the system only alarmed seven times in 40 min from 9:00 to 9:40 with a reference sensor. It should be noted that there were similar heavy rains during these two periods. If roughly calculating the nuisance alarm times per minute during the period of heavy rain, the value decreased by about 97.0% from 5.8/minute to 0.175/minute. As the reference sensor may not be triggered at the start and end of the rain and the vibrations caused by the wildlife cannot be monitored by the reference sensor, the practical NAR reduction is lower than 97.0%. Table 1 summarizes the results of field trials without and with using a reference sensor. The calculated NAR based on the alarm records in the long term is more reasonable. After using a reference sensor, the NAR can be reduced by 90.7% from 2.931/hour to 0.292/hour. By further optimizing the reference sensor threshold THR and the amplified time N, the NAR can be further decreased.
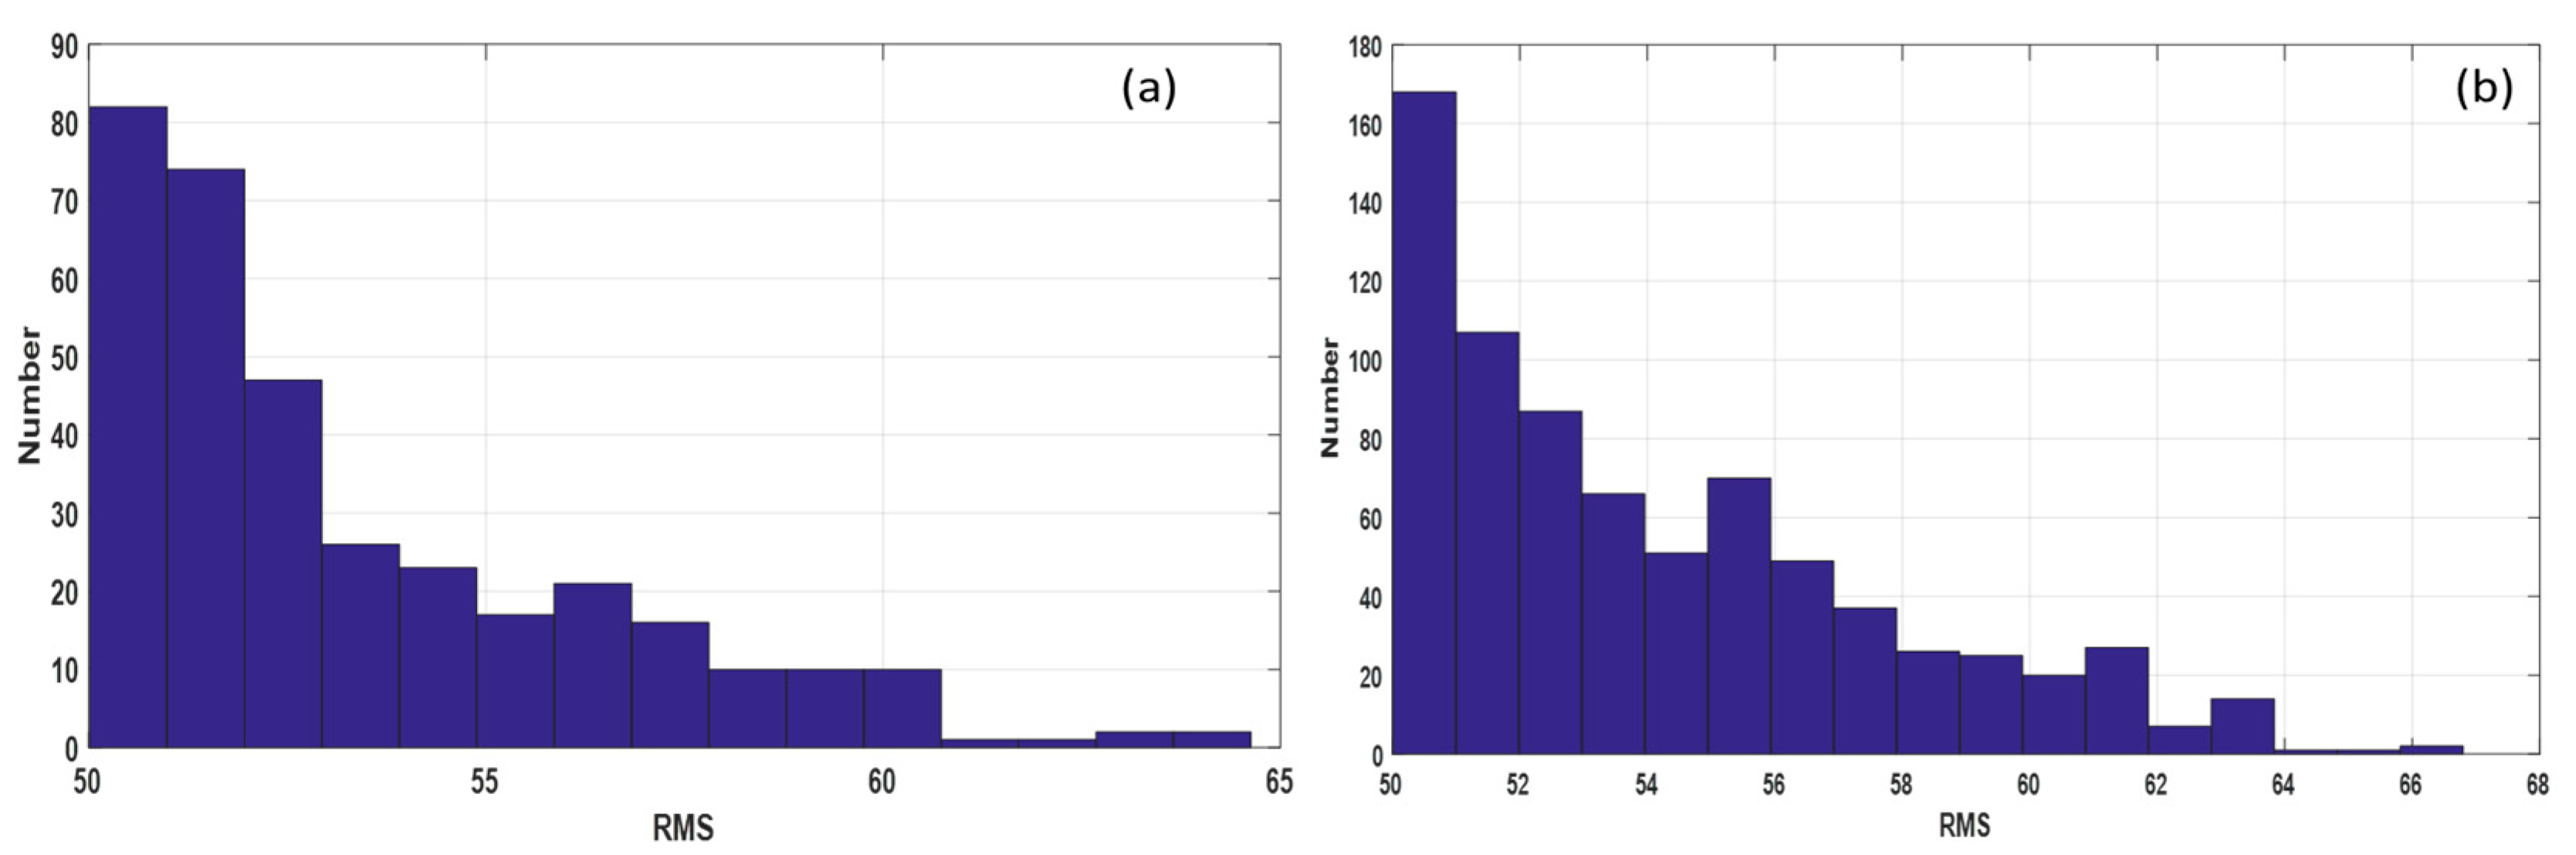
If some of the alarms are false alarms, the NAR reduction will be unreliable. Two lab tests were conducted to demonstrate that all the alarms of the field trials were nuisance alarms but not false alarms. In the first lab test, the FUT was a 1.9 km long SMF, which was put in a box to isolate the ambient vibrations. The signal of the fiber from 200 m to 1800 m was monitored in real time. In the second lab test, the FUT was a 150 m long sensing cable, which was the same as that used in the field trials. The 100 m sensing cable in the middle part was monitored. The first and second lab tests lasted for 20 days and 21 days, respectively. The thresholds in the two tests were set to be 50. Figure 8a,b shows the histogram distributions of the alarms’ RMS values. All the alarms were caused by the noise of the interrogator and the surrounding weak vibrations. As can be seen, the maximum RMS values were less than 70 in the two tests. The lab test results indicate that all the alarms in the field trials were generated by real vibrations but not the interrogator itself. In other words, there is no false alarm affecting the result of the NAR reduction.
Vibrations caused by climbing on fence and cutting fence are already very strong; they would be statistically stronger under rainy conditions. After the threshold is amplified, the system should still be able to detect most of these events. However, for fence intrusion activities, which induce weak vibrations, under heavy rain or strong wind conditions, after the threshold is raised, alarms will not be triggered. In addition, the proposed approach based on RMS values of the reference sensors can only reduce the NAR caused by the surrounding environment conditions, such as heavy rain and strong wind; it cannot distinguish the alarms caused by wildlife. Therefore, in real-world applications, the proposed method needs to be combined with other advanced signal processing methods, such as an AI-based method, and act as the first decision making level in the algorithm, which can further reduce the NAR. The EDR of the proposed approach will decrease after the threshold is amplified, but the event detection can be determined by the other advanced signal processing methods. Therefore, the negative effect of the EDR reduction caused by the reference sensor will not reduce the overall EDR of the combined method. In addition, by using the proposed reference sensor, parts of the events can still be detected, which can contribute to increasing the EDR of other existing methods. Hence, the proposed reference sensors can make a significant contribution to real-world applications. The combination of using more sophisticated signal processing methods (e.g., machine learning) and the reference sensor will be investigated in further work.
The proposed approach is not limited to adding a reference sensor for rain and wind in the φ-OTDR-based fence intrusion detection system. It can also be used for other scenarios. For example, the loud sound of low-flying air fighters can result in strong vibrations on all the fences simultaneously. The reference sensor can be used for reducing the nuisance alarms caused by the air fighters. As another example, the vibrations caused by the occasionally passing vehicles close to the fence may trigger the system alarm. As with adding a rain sensor, a segment of the sensing fiber can be buried under the side of the road to act as the reference sensor. When the vibration signal intensity of the reference sensor increases suddenly and exceeds its threshold, the alarm threshold of the system will be amplified by N times. The value of N depends on the particular project.
5. Conclusions
In this paper, we proposed and demonstrated a simple, practical, and cost-effective approach to dramatically reduce the NAR of the φ-OTDR system for fence intrusion detection by utilizing a segment of the sensing fiber as a reference sensor. According to our field trial results, the NAR can be reduced by more than 90%. The dynamic alarm threshold of the system depends on the vibration signal intensity monitored at the reference sensor. The proposed approach can be easily integrated with all the existing methods of suppressing NAR in the existing φ-OTDR system. The overall EDR of the system will not be reduced as it can be mainly determined by the combined methods. In addition, there is almost no additional cost, and the algorithm is very simple, which will not increase the computational requirement.
Author Contributions
Conceptualization, H.Z., H.D. and J.H.N.; methodology, H.D. and J.H.N.; software, H.Z.; validation, H.Z., H.D., D.J.J.H. and J.H.N.; formal analysis, H.Z., H.D. and D.J.J.H.; investigation, H.Z. and H.D.; resources, H.D. and J.H.N.; data curation, H.Z.; writing—original draft preparation, H.Z.; writing—review and editing, H.Z., H.D. and D.J.J.H.; visualization, H.Z.; supervision, H.D.; project administration, H.D.; funding acquisition, H.D. All authors have read and agreed to the published version of the manuscript.
Funding
This research was funded by Agency for Science, Technology and Research (A*STAR) A*ccelerate GAP Funding (PG/20191108/014).
Data Availability Statement
Not applicable.
Acknowledgments
We acknowledge the support of ST Engineering Urban Solutions Ltd. for conducting field trials, and the project collaboration agreement between the company and our institute.
Conflicts of Interest
The authors declare no conflict of interest.
References
- Juarez, J.C.; Taylor, H.F. Field test of a distributed fiber-optic intrusion sensor system for long perimeters. Appl. Opt. 2007, 46, 1968–1971. [Google Scholar] [CrossRef] [PubMed]
- Peng, F.; Wu, H.; Jia, X.-H.; Rao, Y.-J.; Wang, Z.-N.; Peng, Z.-P. Ultra-long high-sensitivity Φ-OTDR for high spatial resolution intrusion detection of pipelines. Opt. Express 2014, 22, 13804–13810. [Google Scholar] [CrossRef] [PubMed]
- Zhang, H.; Dong, H.; Hu, D.J.J.; Hao, J. Overcoming the Lead Fiber-Induced Limitation on Pulse Repetition Rate in Distributed Fiber Sensors. Photonics 2022, 9, 965. [Google Scholar] [CrossRef]
- Mahmoud, S.S.; Visagathilagar, Y.; Katsifolis, J. Real-time distributed fiber optic sensor for security systems: Performance, event classification and nuisance mitigation. Photonic Sens. 2012, 2, 225–236. [Google Scholar] [CrossRef]
- Qin, Z.; Chen, L.; Bao, X. Wavelet denoising method for improving detection performance of distributed vibration sensor. IEEE Photonics Technol. Lett. 2012, 24, 542–544. [Google Scholar] [CrossRef]
- Qin, Z.; Chen, L.; Bao, X. Continuous wavelet transform for non-stationary vibration detection with phase-OTDR. Opt. Express 2012, 20, 20459–20465. [Google Scholar] [CrossRef] [PubMed]
- Ölçer, İ.; Öncü, A. Adaptive temporal matched filtering for noise suppression in fiber optic distributed acoustic sensing. Sensors 2017, 17, 1288. [Google Scholar] [CrossRef] [PubMed]
- Tejedor, J.; Macias-Guarasa, J.; Martins, H.F.; Pastor-Graells, J.; Corredera, P.; Martin-Lopez, S. Machine learning methods for pipeline surveillance systems based on distributed acoustic sensing: A review. Appl. Sci. 2017, 7, 841. [Google Scholar] [CrossRef]
- Wu, H.; Xiao, S.; Li, X.; Wang, Z.; Xu, J.; Rao, Y. Separation and determination of the disturbing signals in phase-sensitive optical time domain reflectometry (Φ-OTDR). J. Light. Technol. 2015, 33, 3156–3162. [Google Scholar] [CrossRef]
- Zhong, X.; Zhao, S.; Deng, H.; Gui, D.; Zhang, J.; Ma, M. Nuisance alarm rate reduction using pulse-width multiplexing Φ-OTDR with optimized positioning accuracy. Opt. Commun. 2020, 456, 124571. [Google Scholar] [CrossRef]
- Liang, S.; Sheng, X.; Lou, S.; Feng, Y.; Zhang, K. Combination of phase-sensitive OTDR and michelson interferometer for nuisance alarm rate reducing and event identification. IEEE Photonics J. 2016, 8, 1–12. [Google Scholar] [CrossRef]
- Zhang, Y.; Xia, L.; Cao, C.; Sun, Z.; Li, Y.; Zhang, X. A hybrid single-end-access MZI and Φ-OTDR vibration sensing system with high frequency response. Opt. Commun. 2017, 382, 176–181. [Google Scholar] [CrossRef]
- Rao, Y.J.; Li, J.Z.; Ran, Z.L.; Xie, K.L. Distributed Intrusion Detection Based on Combination of phi-OTDR and POTDR. In Proceedings of the 19th International Conference on Optical Fibre Sensors, SPIE, Perth, Australia, 15–18 April 2008; Volume 7004. [Google Scholar]
- Huang, Y.; Zhao, H.; Zhao, X.; Lin, B.; Meng, F.; Ding, J.; Lou, S.; Wang, X.; He, J.; Sheng, X.; et al. Pattern recognition using self-reference feature extraction for φ-OTDR. Appl. Opt. 2022, 61, 10507–10518. [Google Scholar] [CrossRef] [PubMed]
- Zabihi, M.; Chen, Y.; Zhou, T.; Liu, J.; Shan, Y.; Meng, Z.; Wang, F.; Zhang, Y.; Zhang, X.; Chen, M. Continuous fading suppression method for Φ-OTDR systems using optimum tracking over multiple probe frequencies. J. Light. Technol. 2019, 37, 3602–3610. [Google Scholar] [CrossRef]
- Shi, Y.; Wang, Y.; Zhao, L.; Fan, Z. An event recognition method for Φ-OTDR sensing system based on deep learning. Sensors 2019, 19, 3421. [Google Scholar] [CrossRef] [PubMed]
- Climate of Singapore. Available online: http://www.weather.gov.sg/climate-climate-of-singapore/ (accessed on 1 January 2023).
- Tabi Fouda, B.M.; Han, D.; An, B.; Chen, X. Research and software design of an Φ-OTDR-based optical fiber vibration recognition algorithm. J. Electr. Comput. Eng. 2020, 2020, 1–13. [Google Scholar] [CrossRef]
Figure 1.
(a) The schematic diagram of the φ-OTDR system with a reference sensor for fence intrusion detection. (b) The schematic diagram of the developed φ-OTDR interrogator. AOM: acousto-optic modulator; CIR: circulator; FUT: fiber under test; PD: photodetector; DAQ: data acquisition card; PC: computer.

Figure 2.
The working principle of the φ-OTDR interrogator with a reference sensor. (a) Without strong background vibrations caused by heavy rain or wind, the reference sensor is not triggered; the system alarm threshold is TH1. (b) With strong background vibrations, the reference sensor is triggered, and the system alarm threshold will be multiplied by N, increasing from TH1 to TH2. (c) Algorithm flow chart of the reference sensor working principle. In real-world applications, the proposed approach can be combined with other methods of reducing the NAR.

Figure 3.
(a) The fiber cable installation layout on the fences. (b) Picture of the sensing fiber cable.
Figure 3.
(a) The fiber cable installation layout on the fences. (b) Picture of the sensing fiber cable.

Figure 4.
Waterfall plots of the filtered RB signal for background on a sunny day, three different intrusion events, and background in heavy rain. (a) Background on a sunny day; (b) fence cutting on a sunny day; (c) aided climbing on fence on a sunny day; (d) unaided climbing on fence in moderate rain; (e) background in heavy rain.

Figure 5.
The RMS values of the alarms for the three types of events. (a) Fence cutting on a sunny day; (b) aided climbing on fence on a sunny day; (c) unaided climbing on fence in moderate rain.
Figure 5.
The RMS values of the alarms for the three types of events. (a) Fence cutting on a sunny day; (b) aided climbing on fence on a sunny day; (c) unaided climbing on fence in moderate rain.

Figure 6.
Alarm records of the field trial without using the reference sensor for 137.5 h. (a) The recorded RMS values and times of the alarms generated during the field trial period; the threshold was 150. (b) Zoom in of the alarm records induced by heavy rain in the duration from 7:40 to 8:04 on 24 June 2020. (c) Probability histogram of the RMS values of the alarms.

Figure 7.
Alarm records of the field trial with using the reference sensor for 294 h. (a) All the recorded alarms generated during the field trial period; the threshold TH1 was 150, N = 2, and the reference sensor threshold THR was 110. The red asterisks represent the recorded RMS values of the alarms generated by the fiber mounted on the fences; green curve represents the RMS values of the reference sensor. (b) Zoom in of the alarm records in the duration from 7:00 to 13:00 on 12 August 2020.

Figure 8.
RMS values distribution of the alarms in lab tests. (a) FUT was 1.9 km SMF. (b) FUT was 150 m sensing cable used in the field trials.
Figure 8.
RMS values distribution of the alarms in lab tests. (a) FUT was 1.9 km SMF. (b) FUT was 150 m sensing cable used in the field trials.


Table 1.
Results of field trials without and with using a reference sensor.
| Parameters | Without a Reference Sensor | With a Reference Sensor |
|---|---|---|
| Field trial duration | 137.5 h | 294 h |
| Raining time | ~4 h | ~5 h |
| Nuisance Alarm times | 403 | 80 |
| NAR (/hour) | 2.931 | 0.272 |
Disclaimer/Publisher’s Note: The statements, opinions and data contained in all publications are solely those of the individual author(s) and contributor(s) and not of MDPI and/or the editor(s). MDPI and/or the editor(s) disclaim responsibility for any injury to people or property resulting from any ideas, methods, instructions or products referred to in the content. |
© 2023 by the authors. Licensee MDPI, Basel, Switzerland. This article is an open access article distributed under the terms and conditions of the Creative Commons Attribution (CC BY) license (https://creativecommons.org/licenses/by/4.0/).
Share and Cite
MDPI and ACS Style
Zhang, H.; Dong, H.; Hu, D.J.J.; Ng, J.H. Self-Contained Reference Sensors to Reduce Nuisance Alarm Rate in φ-OTDR-Based Fence Intrusion Detection System. Optics 2023, 4, 330-339. https://doi.org/10.3390/opt4020024
AMA Style
Zhang H, Dong H, Hu DJJ, Ng JH. Self-Contained Reference Sensors to Reduce Nuisance Alarm Rate in φ-OTDR-Based Fence Intrusion Detection System. Optics. 2023; 4(2):330-339. https://doi.org/10.3390/opt4020024
Chicago/Turabian StyleZhang, Hailiang, Hui Dong, Dora Juan Juan Hu, and Jun Hong Ng. 2023. "Self-Contained Reference Sensors to Reduce Nuisance Alarm Rate in φ-OTDR-Based Fence Intrusion Detection System" Optics 4, no. 2: 330-339. https://doi.org/10.3390/opt4020024