1. Introduction
The frequency conversion practicability of the sampling mixers plays a momentous part in systems dependent on radio frequency (RF) and millimeter-wave (MMW). Recently, sampling optoelectronic mixers have enticed great solicitude owing to their impacts of the capacious band, soft loss, and immunity to electromagnetic interference (EMI) [
1], which are difficult to acquire by adopting imitative electric mixers.
Semiconductor optical amplifier Mach-Zehnder interferometer (SOA-MZI) that exploits cross gain modulation (XGM) [
2] and cross phase modulation (XPM) [
3,
4,
5,
6] can be employed for frequency shifting in the formation of a stand-alone apparatus. SOA-MZIs provide a considerable extinction ratio (ER), low optical input power, up and down frequency mixing simultaneously, and positive conversion gains (CGs) [
5,
6]. The principle of parallel SOA-MZIs that have congruous characteristics and operating points can also be adopted for frequency mixing [
7,
8,
9,
10,
11] and execute simultaneously the up-conversion of many input optical signals by applying a sampling method.
Recently, experimental and simulated considerations of frequency mixing predicated on a monocular SOA-MZI and a cascaded SOA-MZIs relation [
12,
13,
14,
15] exhibited well performances through the quality and efficacy of the optical transference system. Specifically, a data signal at 0.5 GHz was sampled at target frequencies between 8.3 GHz, which was adjacent to the frequency of the sampling signal called the first harmonic, and 157 GHz, which was adjacent to the frequency of the sampling control signal entitled the tenth harmonic. The mixing gain fulfilled in this domain of target frequencies declined from 43 to 21 dB.
In this paper, we employ a sampling SOA-MZIs system built in parallel combinations to accomplish simultaneous up mixing of three IF signals dependent on a standard modulation architecture for the first time by employing Virtual Photonics Inc. (VPI) software. The highest conversion gain (CG) is reached for optical mixed signals after photo-detection from 0.5 to 97.5 GHz associated with the fifth harmonic frequency of the sampling signal. Moreover, we examine the quality of the optical mixing system using intricate modulated signals that move orthogonal frequency division multiplexing (OFDM) data in order to identify its goodness, which to our knowledge, this work is a pioneer one. In fact, this approach is considered the first for sampling of parallel SOA-MZIs link. The stimulated and theoretical CGs, error vector magnitude (EVM), and bit error rate (BER) are determined in order to analyze the performance characterizations of the optical three parallel SOA-MZIs system. This system, which is a novel principle based on the sampling of parallel SOA-MZIs to attain simultaneous frequency shifting up to 99 GHz, is also realized as an excellent performance in comparison with the previous systems that relied on a single SOA-MZI and a cascaded SOA-MZIs link [
12,
13]. The following sections of the paper are organized as follows: In
Section 2, we depict the small-signal analysis of the three parallel SOA-MZIs link for the standard modulation mode. In
Section 3, the operating point and physical parameters of the conducted simulations are analyzed, and the theoretical and simulated conversion gains (CGs) that have the identified values are achieved. Then, in
Section 4, the simulation and theoretical outcomes for the up-conversion process to higher frequencies of intricate OFDM data by utilizing the sampling of the three parallel SOA-MZIs link against the EVM and BER parameters are presented. Finally, in
Section 5, the conclusions dependent on the significant outcomes of this simulation study are presented.
2. Practicability of Frequency Mixing Dependent on an Optical Three Parallel SOA-MZIs Linkage
The two parallel SOA-MZIs technique was already interpreted for all-optical multiple logic gates in [
16,
17] and for wavelength conversion in [
7,
8,
9,
10,
11]. The main novelty in the present assignment lies in applying a sampling approach in the three parallel SOA-MZIs link to attain simultaneous mixing to higher frequencies with excellent efficacy of the optical three parallel SOA-MZIs system. The up and down frequency conversion processes depending on a cascaded SOA-MZIs relation were achieved in [
12]. In addition, the simultaneous two intermediate frequency (IF) signals that are up-converted at the outer port of a monocular sampling SOA-MZI are performed in [
13]. The schematic diagram of the used SOA-MZI in simulations and the SOA-MZI static and dynamic merits are demonstrated in [
14].
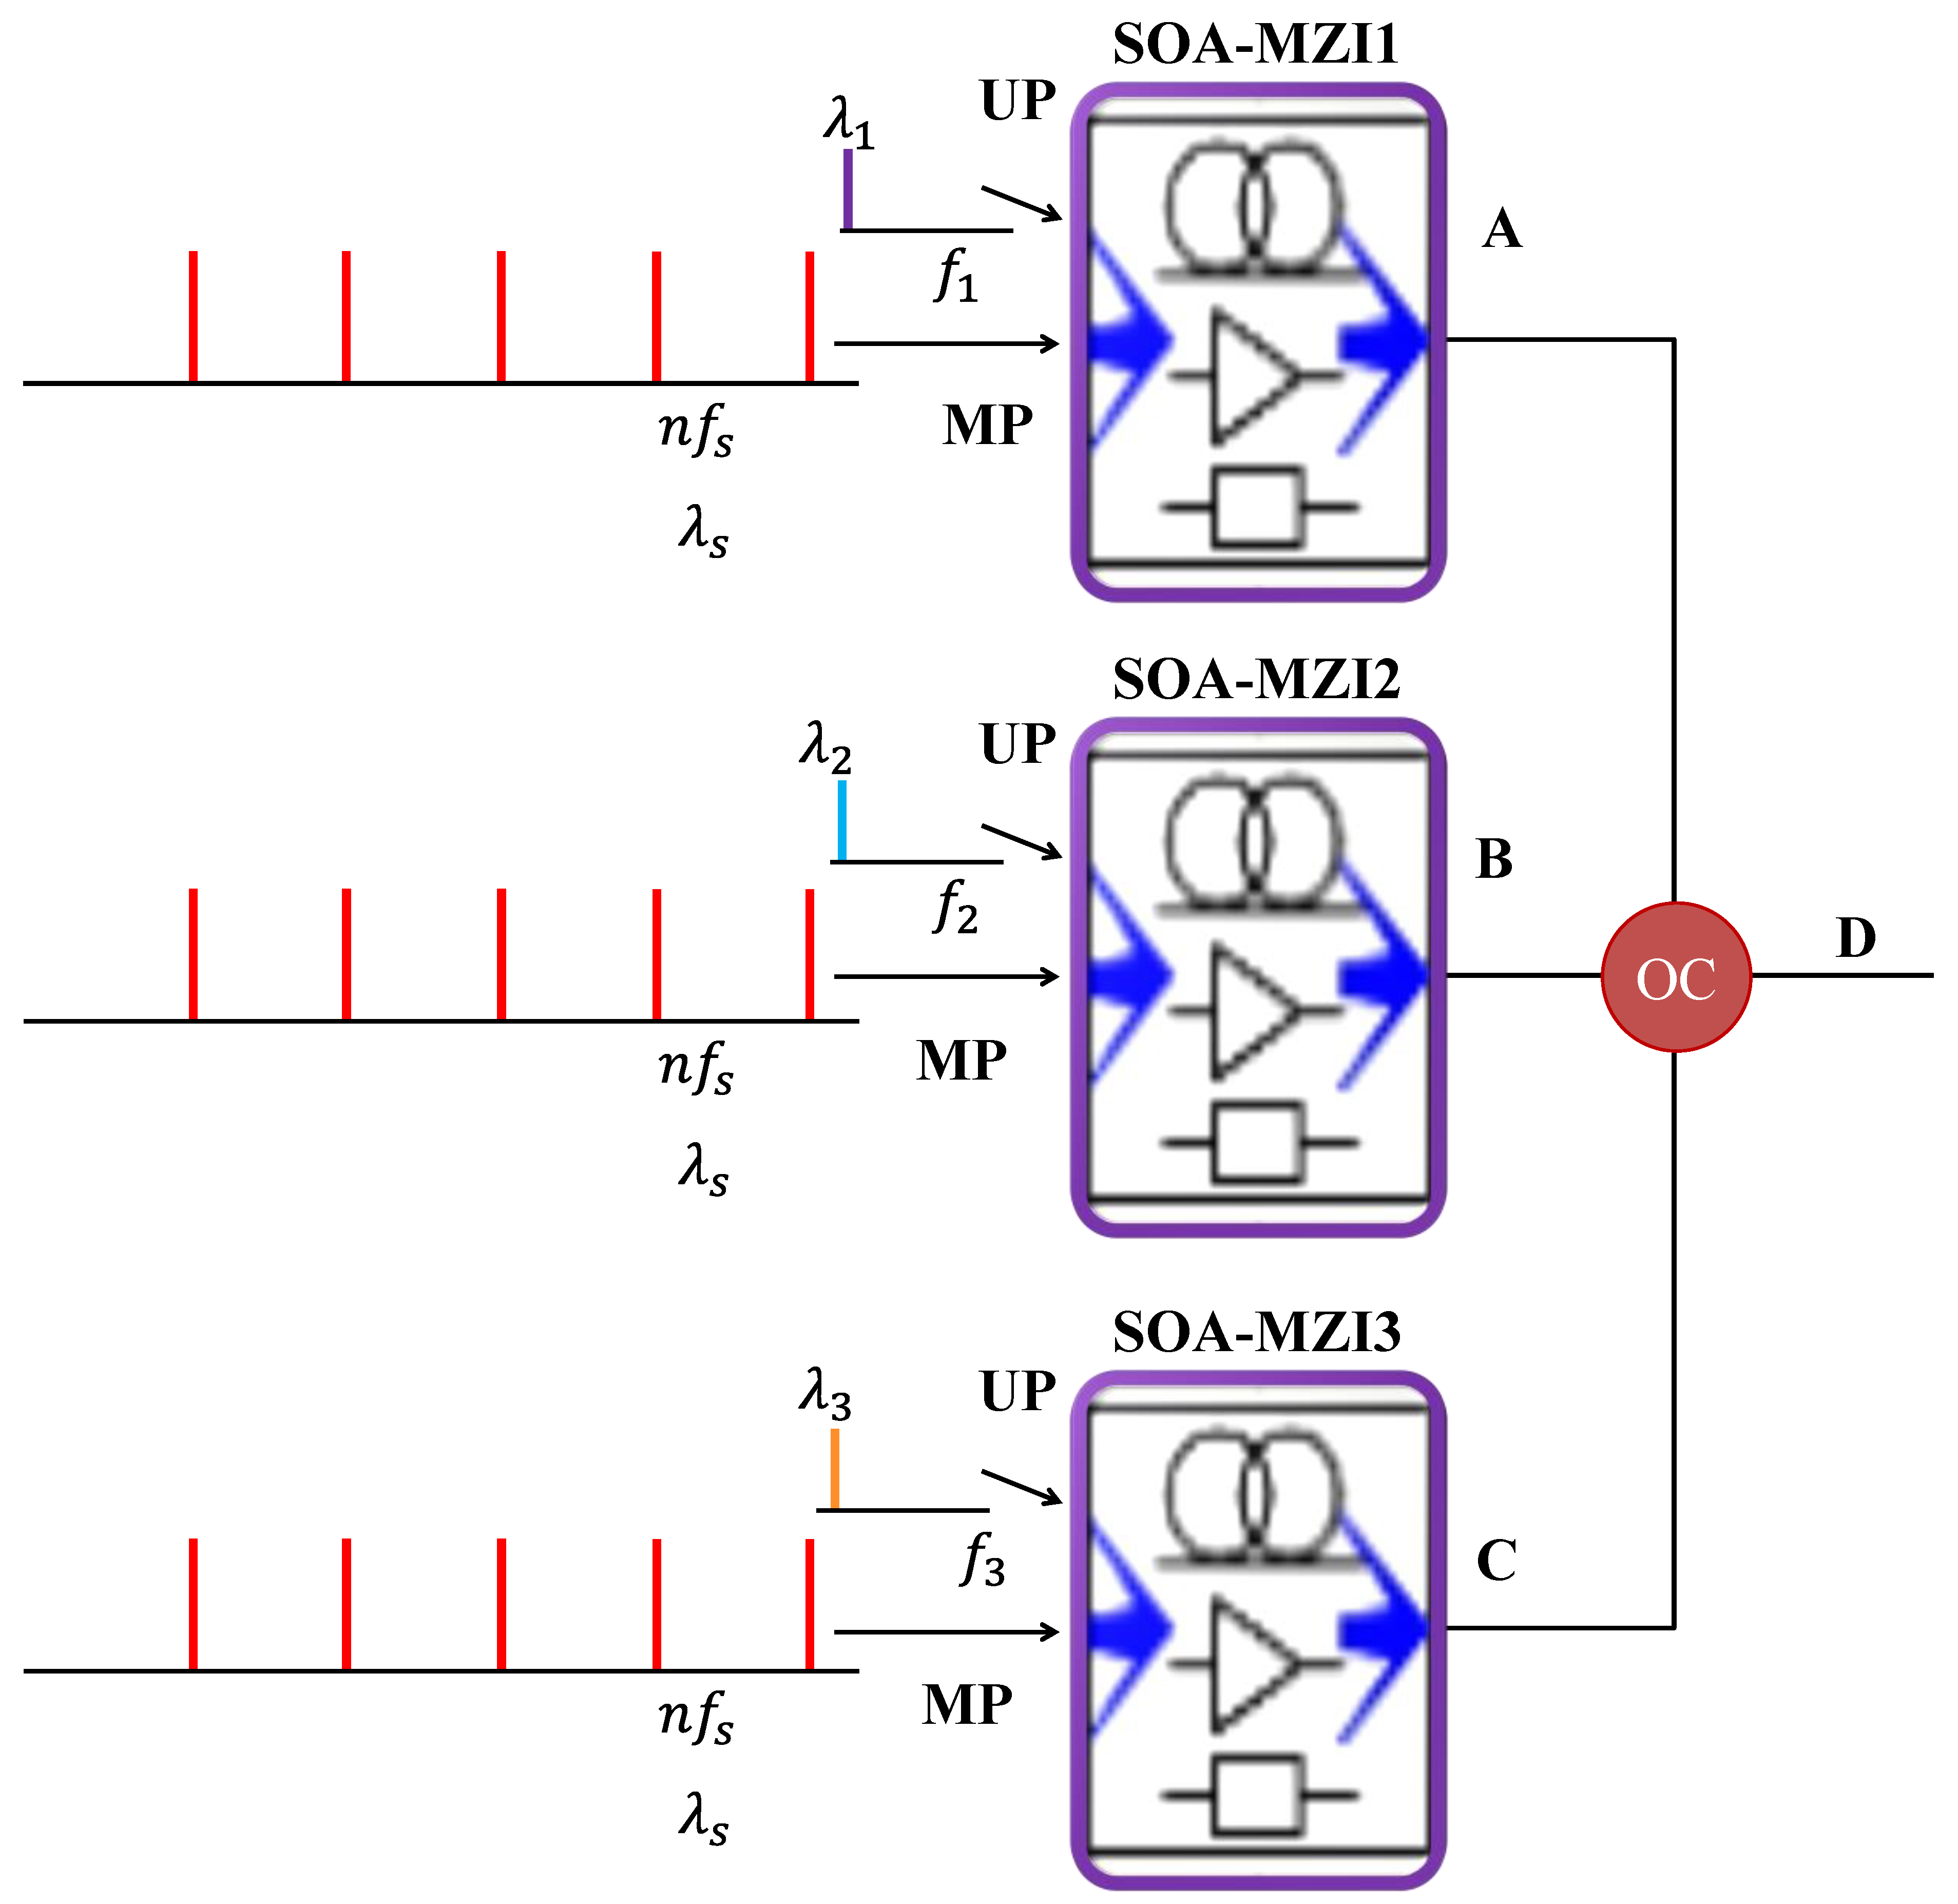
The proposed system dependent on the sampling SOA-MZIs connected in parallel employing standard modulation mode corresponds to a novel system to achieve mixing to higher frequencies. This unprecedented system relied on a cross-phase modulation (XPM) of input control and data signals in the MZI created by utilizing SOAs for each SOA-MZI as seen in
Figure 1. In this architecture, for each SOA-MZI, the inward signal is placed in the topmost SOA through the upper port (UP). In addition, the optical pulsed signal at a sampling frequency
, at the wavelength
is entered to the middle port (MP) input and then it is split into two equal signals, which are passed through supernormal and inferior arms jointly by plying an optical coupler (OC). The explanation of the operation of sampling methods through each SOA-MZI is the same and was already clarified in [
12,
13,
14,
15]. Therefore, the output signals after shifting are effectuated at the external port of each SOA-MZI. These shifted signals are well upgraded at the outer port of SOA-MZIs thanks to enhancing the quality of the optical pulsed signal, where its harmonics have higher power levels particularly at higher harmonic rank
.
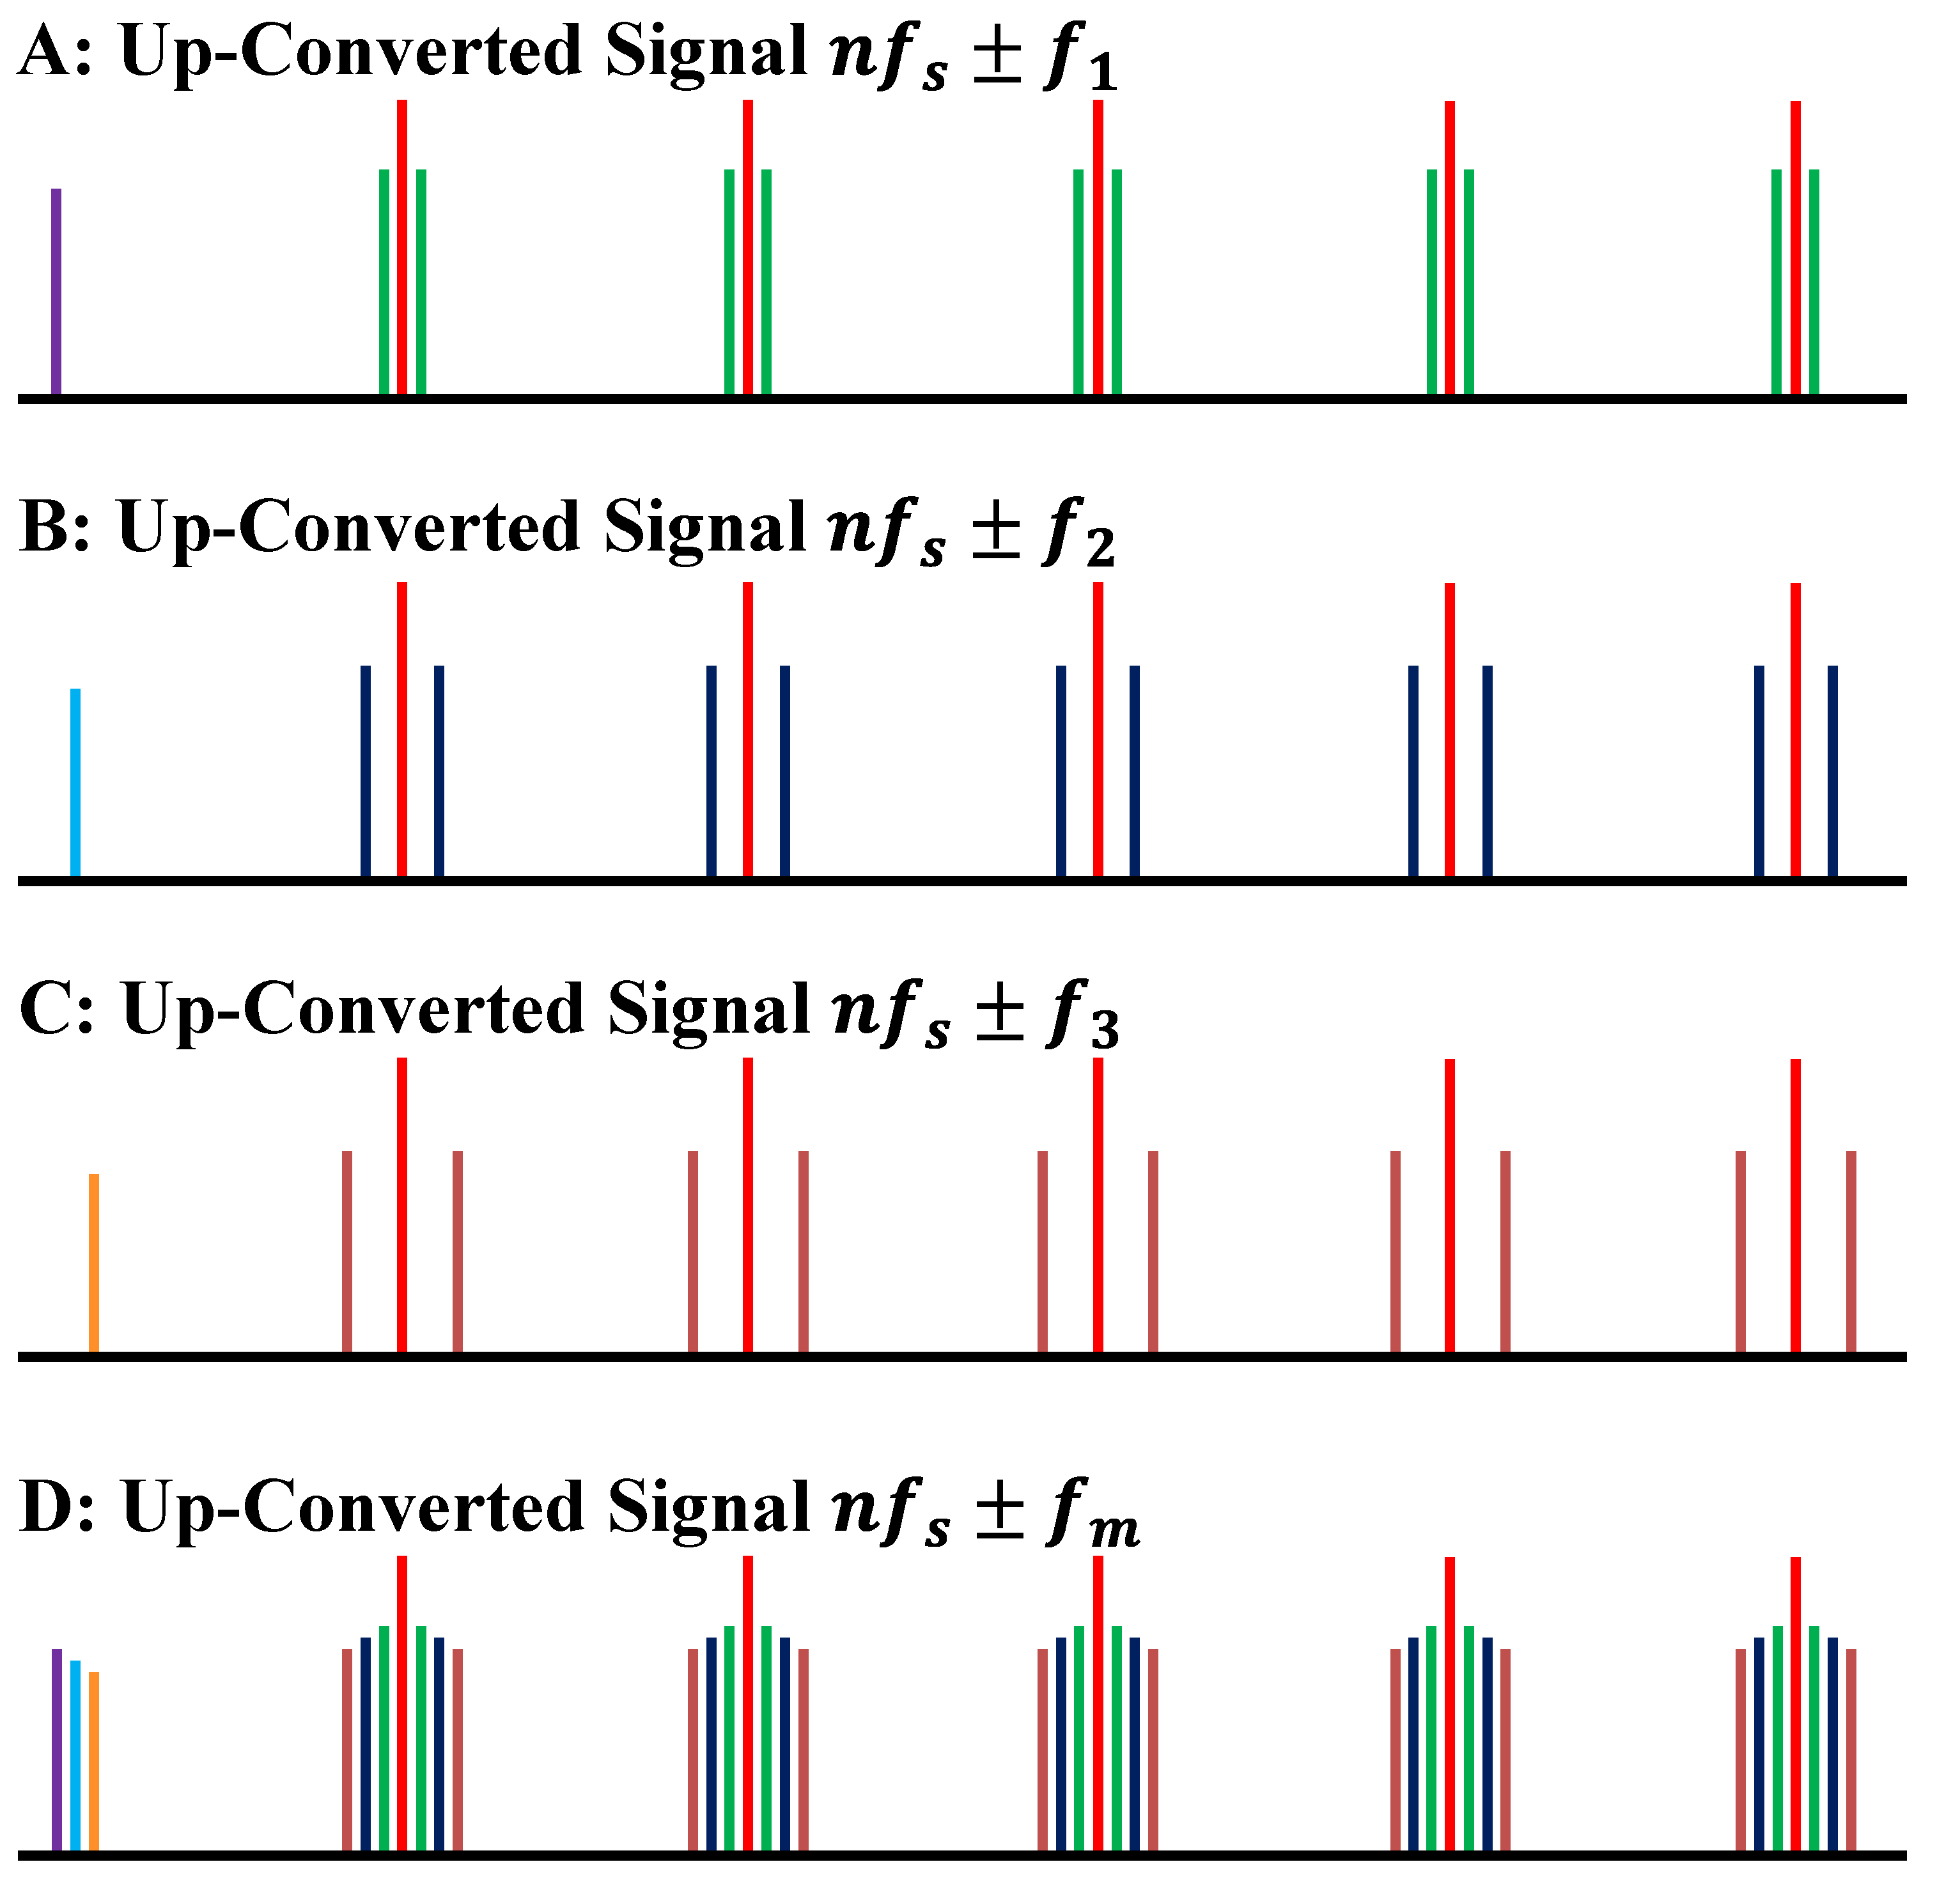
As we can monitor from the output spectrum of the shifted signal that is identified after optical filtering adjusted at
in
Figure 2A, the low frequency signal at
is shifted to the high frequency signal at
due to the sampling operation, where
corresponds to the order of pulsed signal harmonics. In addition,
is an integer that extends from 1 to 5 in our investigation since the quality of the sampled signal degrades considerably with the augmentation of
. Furthermore, the second low frequency signal at
is mixed at
at the SOA-MZI2 output as displayed in the electrical spectrum in
Figure 2B, and the third signal is up-converted from
to
at the SOA-MZI3 output as illustrated in
Figure 2C. Consequently, these radio frequency (RF) signals at the extrinsic port of the SOA-MZIs are integrated through an OC to accomplish simultaneous up-conversion at distinct facsimiles at
, as provided in the electrical spectrum in
Figure 2D.
This prestigious approach can be drawn in plenty of optical transmission systems, such as on wireless communication networks, radio over fiber (RoF) networks, and millimeter (mm) wave systems as the approaches assumed from a monosyllabic SOA-MZI and a cascaded SOA-MZIs connection [
12,
13,
14]. The novel system based on the sampling SOA-MZIs connected in parallel entices many avenues for wideband frequency networks and satellite and radar systems due to its significant profits achieved in this disquisition. The fundamental merits of simultaneous mixing at the outward port of the sampling parallel SOA-MZIs system are remote mixing, sprightly weight, tiny dimension, and multi-wavelength treatment.
3. Small-Signal Analysis of Sampling Parallel SOA-MZIs Link
The frequency up-conversion theoretical responses for three parallel sampling SOA-MZIs mixers are determined by analyzing the small signal in contemplation of comparing its results with the simulation work using the standard modulation scheme. The analysis of the small-signal for each SOA-MZI sampling mixer is subedited by debriefing the powers, gains, and phases as the aggregate of a stationary expression and a variation one. Therefore, three output powers at each SOA-MZI are merged in order to fulfill the overall power, which is the optical power of the simultaneous up-conversion principle established on the three parallel SOA-MZIs link. The analytical study of the mixing process to higher frequencies based on an unattached SOA-MZI is previously explored in [
15] for the architectures entitled switching and modulation. In this novel study, we are only interested in the power equality of the output signal to higher frequencies at the external port of the SOA-MZI. In addition, the theoretical explanation of this power is elucidated minutely in [
15]. The output mixed power after modulation, mixing, photo-detection, and amplification at the outer port of each SOA-MZI at frequencies
can be prescribed as:
where
25 ps is called the differential carrier lifetime;
is the cut-off frequency of the used SOA-MZI;
is the modulated power at the SOA-MZI input at frequencies ;
2.5 dB is the attenuation coefficient of the input modulated power;
30 dB is the gain of SOA1 in the upper position of the used SOA-MZI;
0.86 A/W is the responsivity of the used photodiode;
33 dB is the gain of the low-noise amplifier;
50 Ω is the load resistance of the photodetector;
is the power of the pulsed signal at the SOA-MZI input;
is the harmonic electrical power at ;
15 dB is the electrical power at ; and
8 dB is the electrical power at .
It is worth bearing in mind that the three SOA-MZIs have the same construction, physical specifications, and running point. The only difference is the frequency of the data signal at
. For parallel configuration, the relation between the three optical powers is expressed as:
where
is the radian frequency of the first low frequency signal;
is the radian frequency of the second low frequency signal;
is the radian frequency of the third low frequency signal;
is the modulated power at at the input of the SOA-MZI1 topmost port;
is the modulated power at at the input of the SOA-MZI2 topmost port; and
is the modulated power at at the input of the SOA-MZI3 topmost port.
4. Simultaneous Up-Conversion Characterization
To revise the performances of the concurrent mixing to higher frequencies developed on three parallel SOA-MZIs, we have appraised the conversion gain (CG) in the electrical domain obtained after photo-detecting. The CG is specified as the squared modulus of the ratio between the modulated power at frequencies
at the external port of the SOA-MZI (
) and the modulated power (
) at
at the input port of the used SOA-MZI.
As we have observed in the technique of the simultaneous mixing to higher frequencies dependent on the three parallel SOA-MZIs linkage, the mixed signal has many replicas at frequencies
. Therefore, the CGs can be calculated in Equations (4)–(6) for each replica at
,
, and
, respectively, as follows:
The CGs parade a low-pass frequency behavior, with the corner frequency occurring at
[
15,
18]. The increment of the radian frequency
from
to
guides to a slight decline in the electrical power of the harmonic as well as the electrical power of the replicas, where
is extremely higher than
, while
is subordinate
. In this case, the CG never persuades the dynamic response of the SOA-MZI for the standard modulation constitution [
13,
14] attributable to the amplification of the sampled control signal when the optical filter is filtered at the wavelength
.
The CG of each replica of the mixed signal derived from the parallel SOA-MZIs link was computed using the equations mentioned previously. Then, it is achieved by simulations carried out by applying a VPI Transmission Maker [
19] with a focus on comparing the simulation results with the theoretical ones. The data signal is up-converted simultaneously from
0.5 GHz to
98 GHz,
1 GHz to
98.5 GHz, and
1.5 GHz to
99 GHz. In addition, the CG is calculated for a variety of target frequencies
associated with the harmonics of the sampling signal. The CGs are chosen in the following results at
.
The system built in the VPI software in order to identify the CG is propounded in
Figure 3 for the three parallel SOA-MZIs linkage. In addition, the spectrum of the high frequency signal after sampling is provided through an electrical spectrum analyzer (ESA) after light-sensing by a photodiode (PD) and augmentation by a low-noise amplifier (LNA) with the intention to calculate the CG and approve the technique of the jointly high frequency signals interpreted above.
The pulsed signal is galvanized from an optical pulse clock (OPC), which coincides with the Pritel model, which was previously adopted in the experimental work [
6], at a sampling frequency
equal to 19.5 GHz and provides a 2 ps pulse width duration of the optical pulse train at full width at half maximum (FWHM). The wavelength of the OPC is 1550 nm. The peak of the pulsed control signal is controlled to be
1 dBm as explained in the changeless characteristics of the employed SOA-MZI. The OPC corresponds to a sampling signal that has harmonics at frequencies
. The three OPCs displayed in
Figure 3 have identical structures, physical parameters, and operating points. These optical devices are used at the middle port for each SOA-MZI.
The low frequency signal is assembled by a continuous-wave (CW) laser source. In addition, an optical MZM impelled by a module is used to modulate the low frequency signal at frequencies . This module is used to establish a variety of data types, such as the orthogonal frequency division multiplexing (OFDM) at . These optically low frequency signals are then shifted at higher frequencies subsequent to the harmonics of the pulsed signal at . The low frequency signals have the same average power of −10 dBm at the upper port of the SOA-MZI at wavelengths , where is the whole number that spans from one to three. The wavelength of the signal to be up-converted publicizes from 1445 nm to 1447 nm. The bias current inside the used SOA-MZIs for each SOA is 350 mA.
The output mixed signals emerging from the external port of the SOA-MZIs are combined in an effort to achieve simultaneous up-conversion formulated on the three parallel SOA-MZIs. This simultaneous signal is optically filtrated by a filter called the optical band pass filter (OBPF) regulated at the wavelength of the sampling control signal of 1550 nm. At the receiver, the filtered signal is subsequently converted to the electrical one by a 100 GHz photodiode (PD) whose responsivity is 0.86 A/W. The low-noise amplifier (LNA) that has 33 dB gain is used to augment the power of the electrical mixed signal, which is monitored in an ESA to compute the conversion gain (CG) or through BER_EL-M-QAM module to identify the bit error rate (BER) values. Then, the error vector magnitude (EVM) is calculated from BER values as expounded in [
20].
To corroborate the concept of the jointly mixing process dependent on the three parallel SOA-MZIs, the electrical spectrum measured by an ESA is propounded in
Figure 4. It is noteworthy that the low frequency signals at
at the inner port of the employed SOA-MZIs are up-converted at
.
In
Figure 4, we can recognize thirty replicas at various mixing frequencies travelling from
18 GHz to
99 GHz. Moreover, we can detect that the high frequency signals after shifting comprehend up to the fifth harmonic of the control pulsed signal. As cited in the mixing concept, the source IF signal at
at the inner port of the SOA-MZI1,
at the input of the SOA-MZI2, and
at the upper port of the SOA-MZI3 are shifted at
drawn on the three parallel SOA-MZIs relevance.
The efficacious of the simultaneous shifted signals developed on the parallel SOA-MZIs link is assessed by measuring the conversion gain (CG). The simulated CG is delineated as the dissimilarity between the electrical power of the high frequency signals after mixing in dBm at
and the one of the low frequency signal of each SOA-MZI in dBm at
. It is only calculated for replicas at
linked to the fifth harmonics of the pulsed signal as presented in
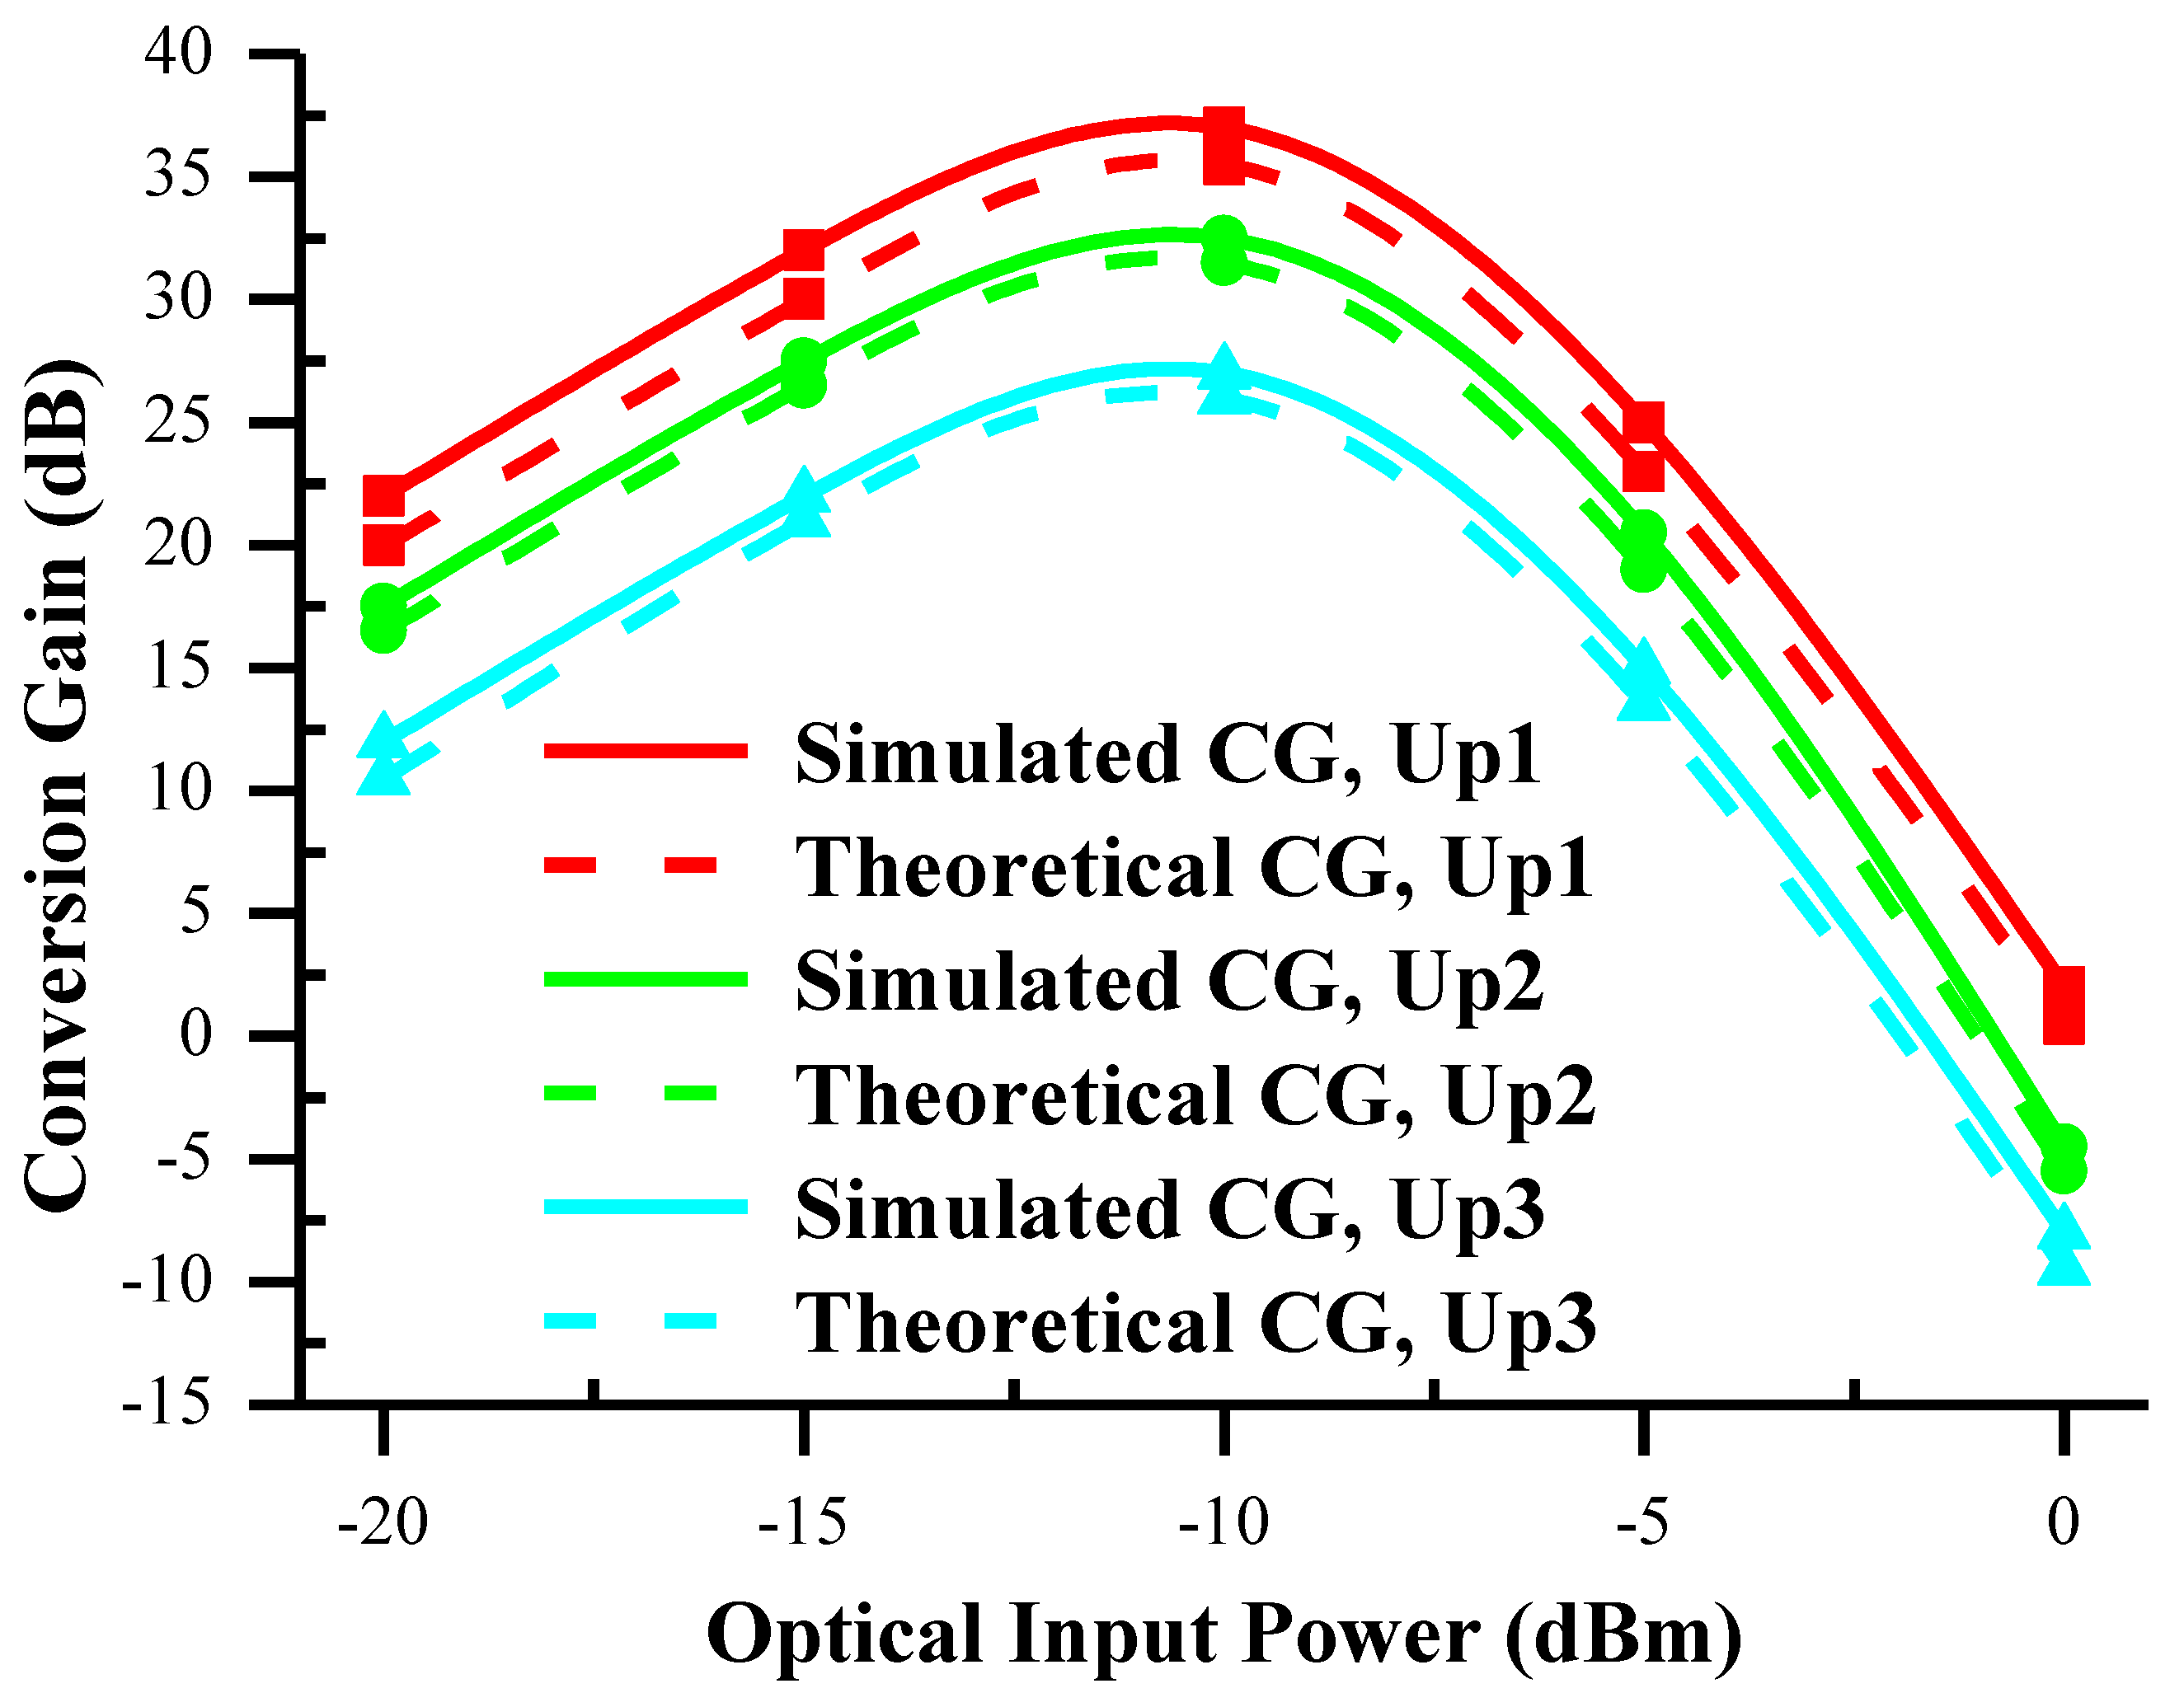
Figure 4. In order to compare fairly with the theoretical work, the theoretical CG in Equations (4)–(6) is computed separately for each replica generated from different data signals. In Equation (2), the combined optical output power can be computed. The simulated and theoretical CGs are displayed in
Figure 5, which shows a good arrangement between them.
The CG substantiates the veracity and reliability of the theoretical work and its outcomes with the simulation one. In addition, the CGs at
reach the peak values at the input power of
10 dBm of the low frequency signals. They reached 37, 32.5, and 27 dB at
10 dBm at
98 GHz,
98.5 GHz, and
99 GHz, respectively, linked to the fifth harmonic of the control pulsed signal. Therefore, the apical CGs are achieved at
10 dBm for any replica of the high frequency signal at the outer port of the three parallel SOA-MZIs displayed in
Figure 4. The augmentation of the input power surmounting
10 dBm leads to degradation of the CGs highly in comparison with the ones at the optical power lower than
10 dBm. Furthermore, the variation in CGs between the frequency shifting up to 98 GHz related to the first data signal and 99 GHz related to the third data signal is 10 dB. The CGs verified in the theoretical and simulated results propound a low-pass behavior, in which the corner frequency ensues at
[
15].
The attributes of the simultaneously high frequency OFDM signals dependent on the three parallel SOA-MZIs system is assessed by measuring the values of the error vector magnitude (EVM) and the bit error rate (BER) parameters
20 at different bit rates. The characteristics of the OFDM data for 64 subcarriers generated by the detection and generation module at the electrical port of each MZM with the 25% cyclic prefix (CP) are demonstrated in [
21]. It is important to mention that each subcarrier carries quadrature phase shift keying (QPSK) data.
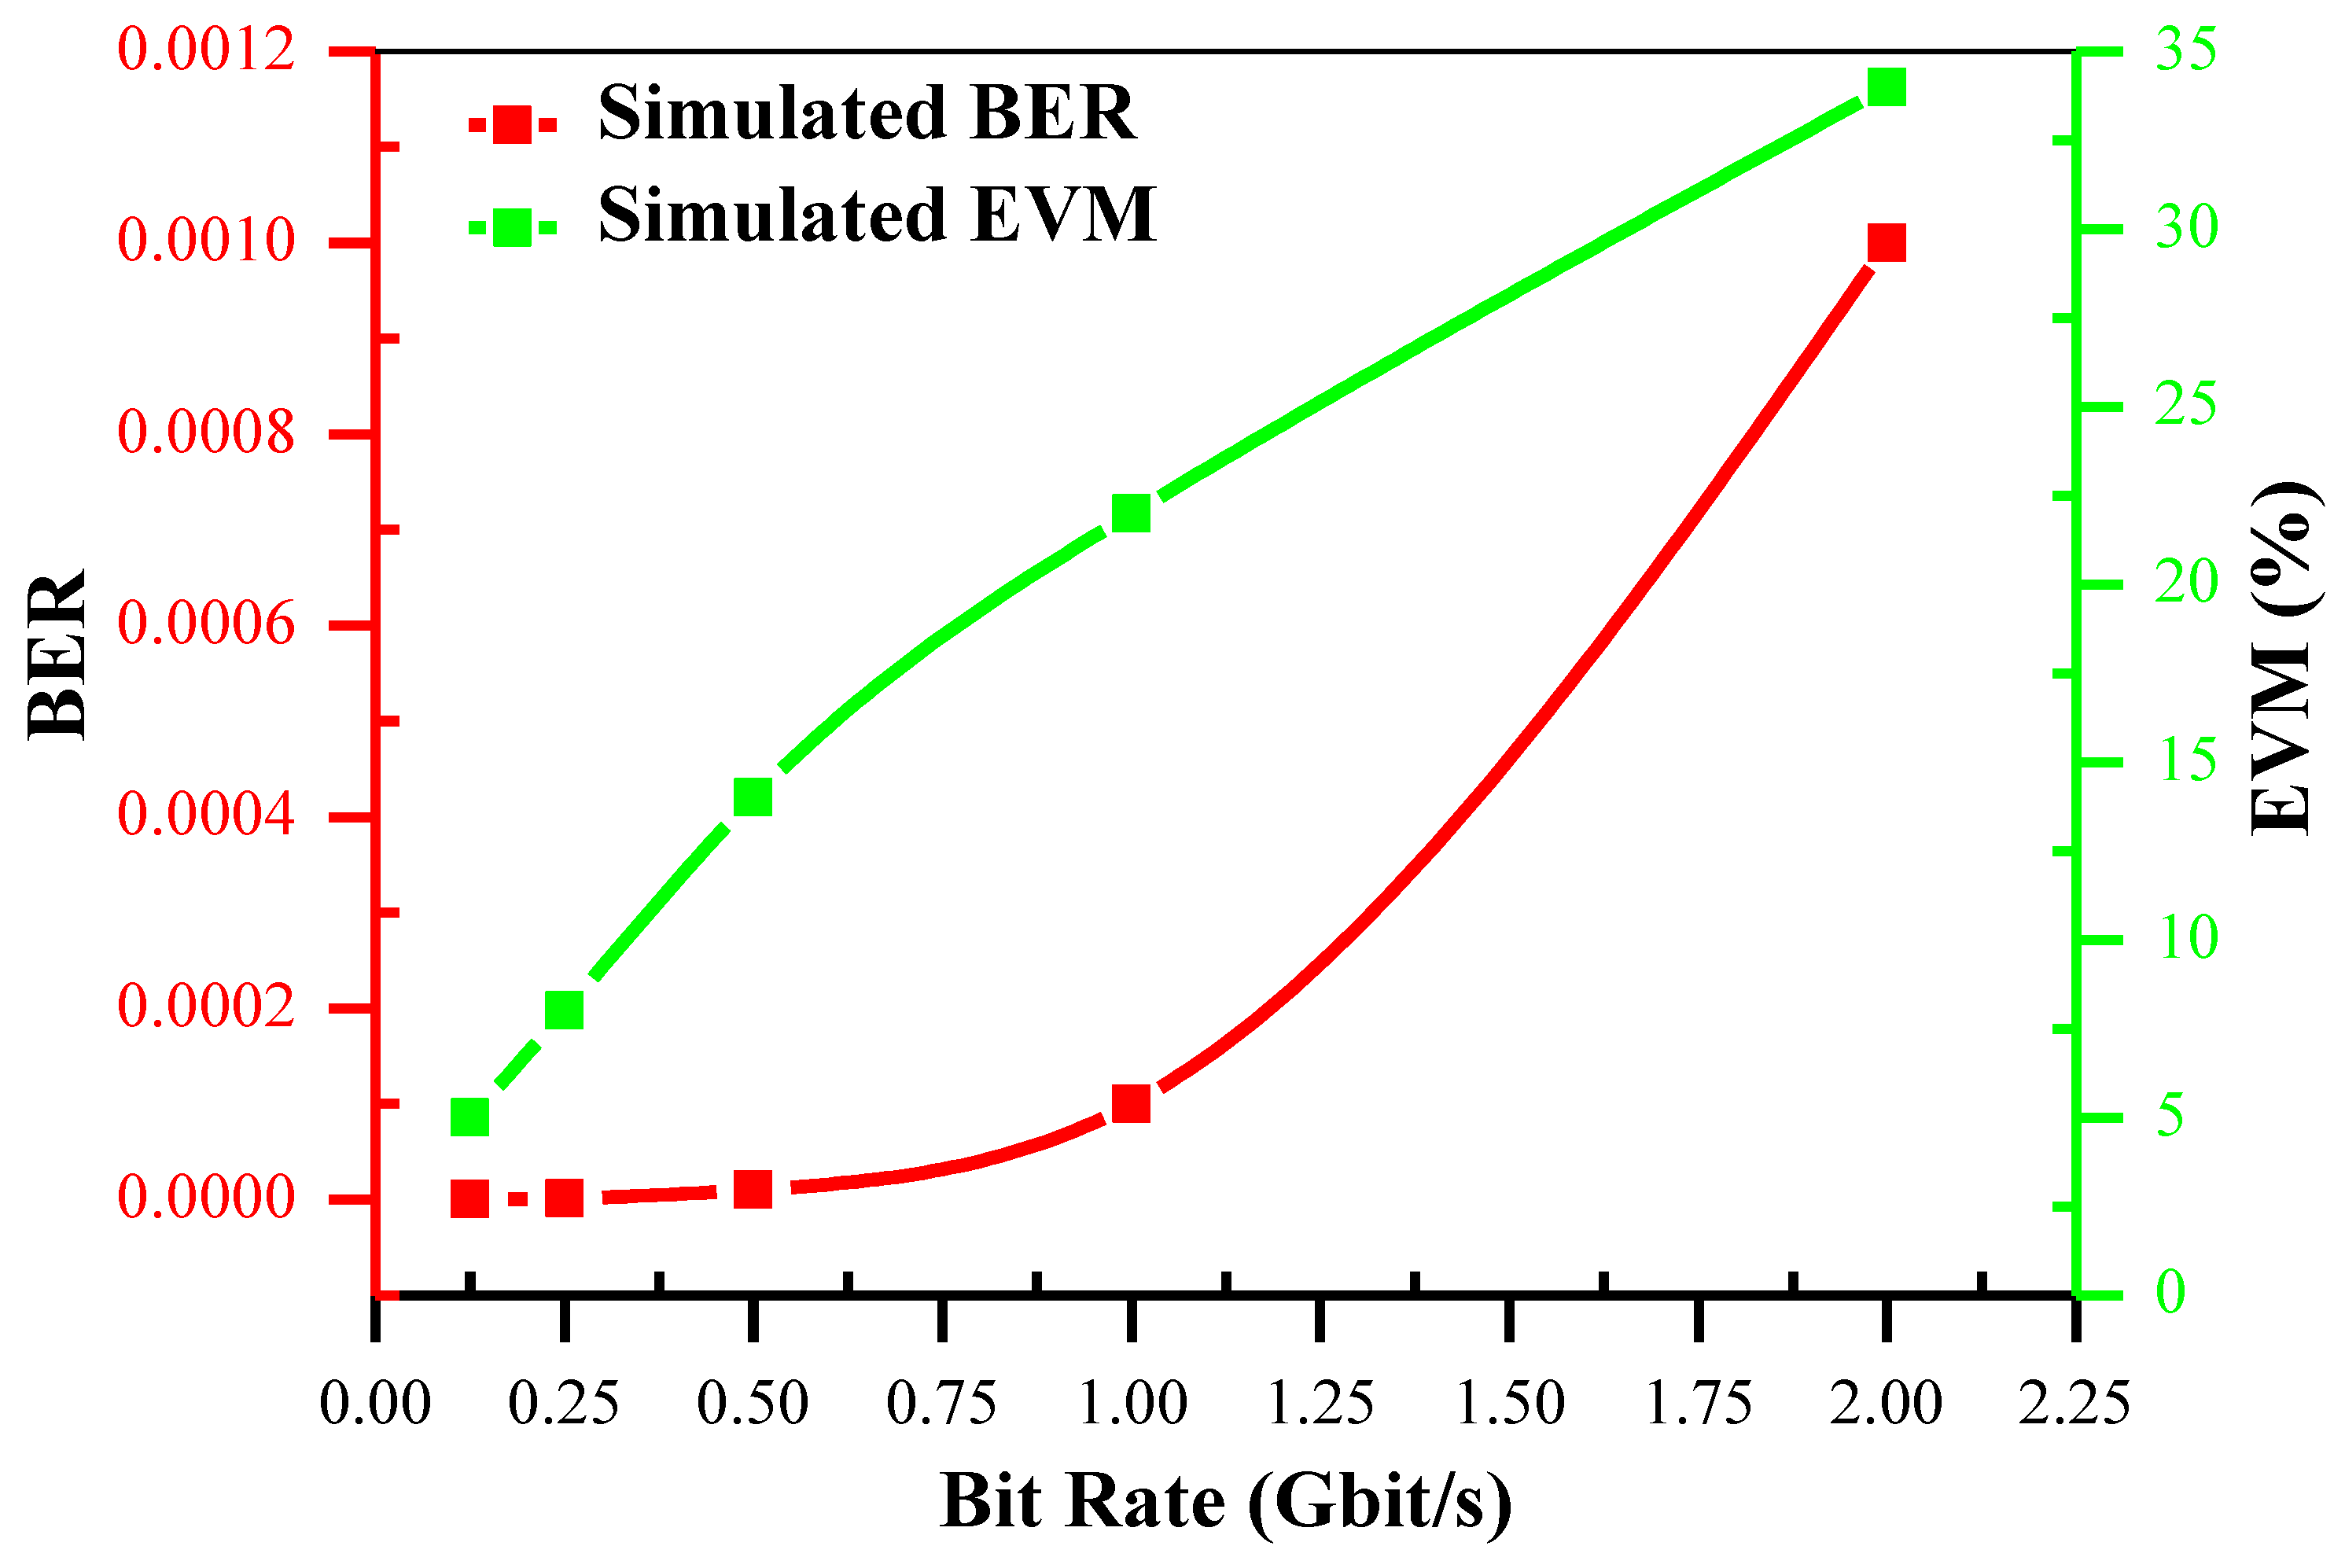
Figure 6 propounds the simulated EVM and BER results of the high frequency signal after mixing at
99 GHz, which are acquired for a variety of bit rates ranging from 0.125 to 2 Gbit/s at the outer port of the three parallel SOA-MZIs link.
Figure 6 also displays the dependence of BER on EVM for OFDM modulation that obtains a passable BER equal to
for EVM of 34% at the bit rate of 2 Gbit/s at 99 GHz for simulation results. The EVM and BER values are procured when the optical input power of IF data signals is
10 dBm. Moreover, the exploitation of the forward error correction (FEC) allows for reducing BER values [
22]. This analysis is compliant with CG measurements propounded in
Figure 5 where the CG of the mixed OFDM signal at
can be approximately evaluated up to 27 dB. Therefore, the decrease in the CG of the up-converted OFDM signal at
leads to augmenting the BER values along with the EVM ones, especially at 99 GHz presented in
Figure 6. As a result, the optical conversion system depended on the three parallel SOA-MZIs link induces a very low distortion on mixed signals, leading to premium performance characterizations of the simultaneous up-conversion system.


