

Spectral Optical Properties of Gray Matter in Human Male Brain Tissue Measured at 400–1100 nm


Science Department, Borough of Manhattan Community College, The City University of New York, 199 Chambers St., New York, NY 10007, USA
Optics 2023, 4(1), 1-10; https://doi.org/10.3390/opt4010001
Submission received: 29 October 2022
/
Revised: 21 November 2022
/
Accepted: 19 December 2022
/
Published: 21 December 2022
Abstract
:Gray matter, in the outermost layer of the cerebral cortex, plays a significant role in processing important information, such as when reasoning and planning, in addition to influencing intelligence, emotion, memory, and language. In this paper, measurements of the optical properties, such as the attenuation coefficients, scattering coefficients, scattering efficiency, and penetration depth of gray matter in the cerebral cortex were measured in the fresh brain tissue of a healthy human male at a spectral range of 400–1100 nm. Determining the optical properties of gray matter is important for developing NIR noninvasive diagnostic imaging techniques and therapy. The absorption spectra of the gray matter tissues obtained here showed clear peaks at 550 and 580 nm due to HBO2 and 970 nm due to water. The attenuation coefficient, transport length, and penetration depth for the gray matter were measured at 800 nm. The possible NIR optical imaging depth was roughly 3.8 mm, determined by the theoretical limit resulting from ballistic and snake photons. Using Beer’s law and the Mie model, the structural properties, such as the density of neurons, in the gray matter of human brain tissue, were investigated for the first time. The density of neurons in the examined gray matter tissue sample was estimated as roughly 40,000 neurons/mg.
1. Introduction
The human brain is the most complex organ in the human body, which makes it challenging to understand how the brain functions and communicates. Gray matter is the outermost surface of the cerebral cortex of the human brain. The gray color is a result of the high concentration of neuron cell bodies [1,2]. Gray matter in the cerebral cortex of the human brain remains understudied and not clearly understood. It contains many neurons that facilitate information processing through the axons found in white matter. Thus, gray matter plays a significant role in how humans function, enabling individuals to control their movement, memory, touch, vision, breathing, hunger, and emotions [2,3]. Understanding the properties of neurons, such as conductivity and secretion [4], in the gray matter of the cerebral cortex might lead to a better understanding of how the neurons function within the brain and how they affect the state of the healthy brain. Since gray matter is the outermost layer of the brain, early damage may occur to neurons in this region. Investigating the healthy state of gray matter will lead to a better understanding of the early changes in the development of neurodegenerative disorders and cancer [5,6,7,8], and this may help to find solutions at the early stage of these diseases. In numerous brain diseases, neurons, synapses, and glial cells become dysfunctional, and the damage or loss can contribute to disability and cognitive dysfunction, including in multiple sclerosis (MS), Parkinson’s disease, Alzheimer’s disease, Huntington’s disease, epilepsy, and other neurodegenerative disorders [9,10,11,12]. All neurodegenerative disorders start with changes in the neurons and glial cells.
Understanding the optical properties of gray matter, such as the scattering and absorption coefficients, will give a clear idea of the critical imaging depth in the brain using optical imaging techniques. Optical spectroscopy is a standard tool in laboratory analysis, used to detect and monitor the concentration of substances, such as oxygen, by measuring the absorption, fluorescence, or Raman spectra [13,14,15]. The use of optical techniques is complicated because of high light scattering in tissue [13,14,15]. Neurons cells are the main light-scattering component found within the gray matter of the cerebral cortex [16,17]. In a highly scattering medium, such as brain tissue, photons will essentially follow a random path and become highly diffuse. Diffuse photons provide little information about the tissue. If the problems associated with scattering can be overcome, optical imaging techniques could represent a cheaper technology able to provide high spatial and temporal resolution.
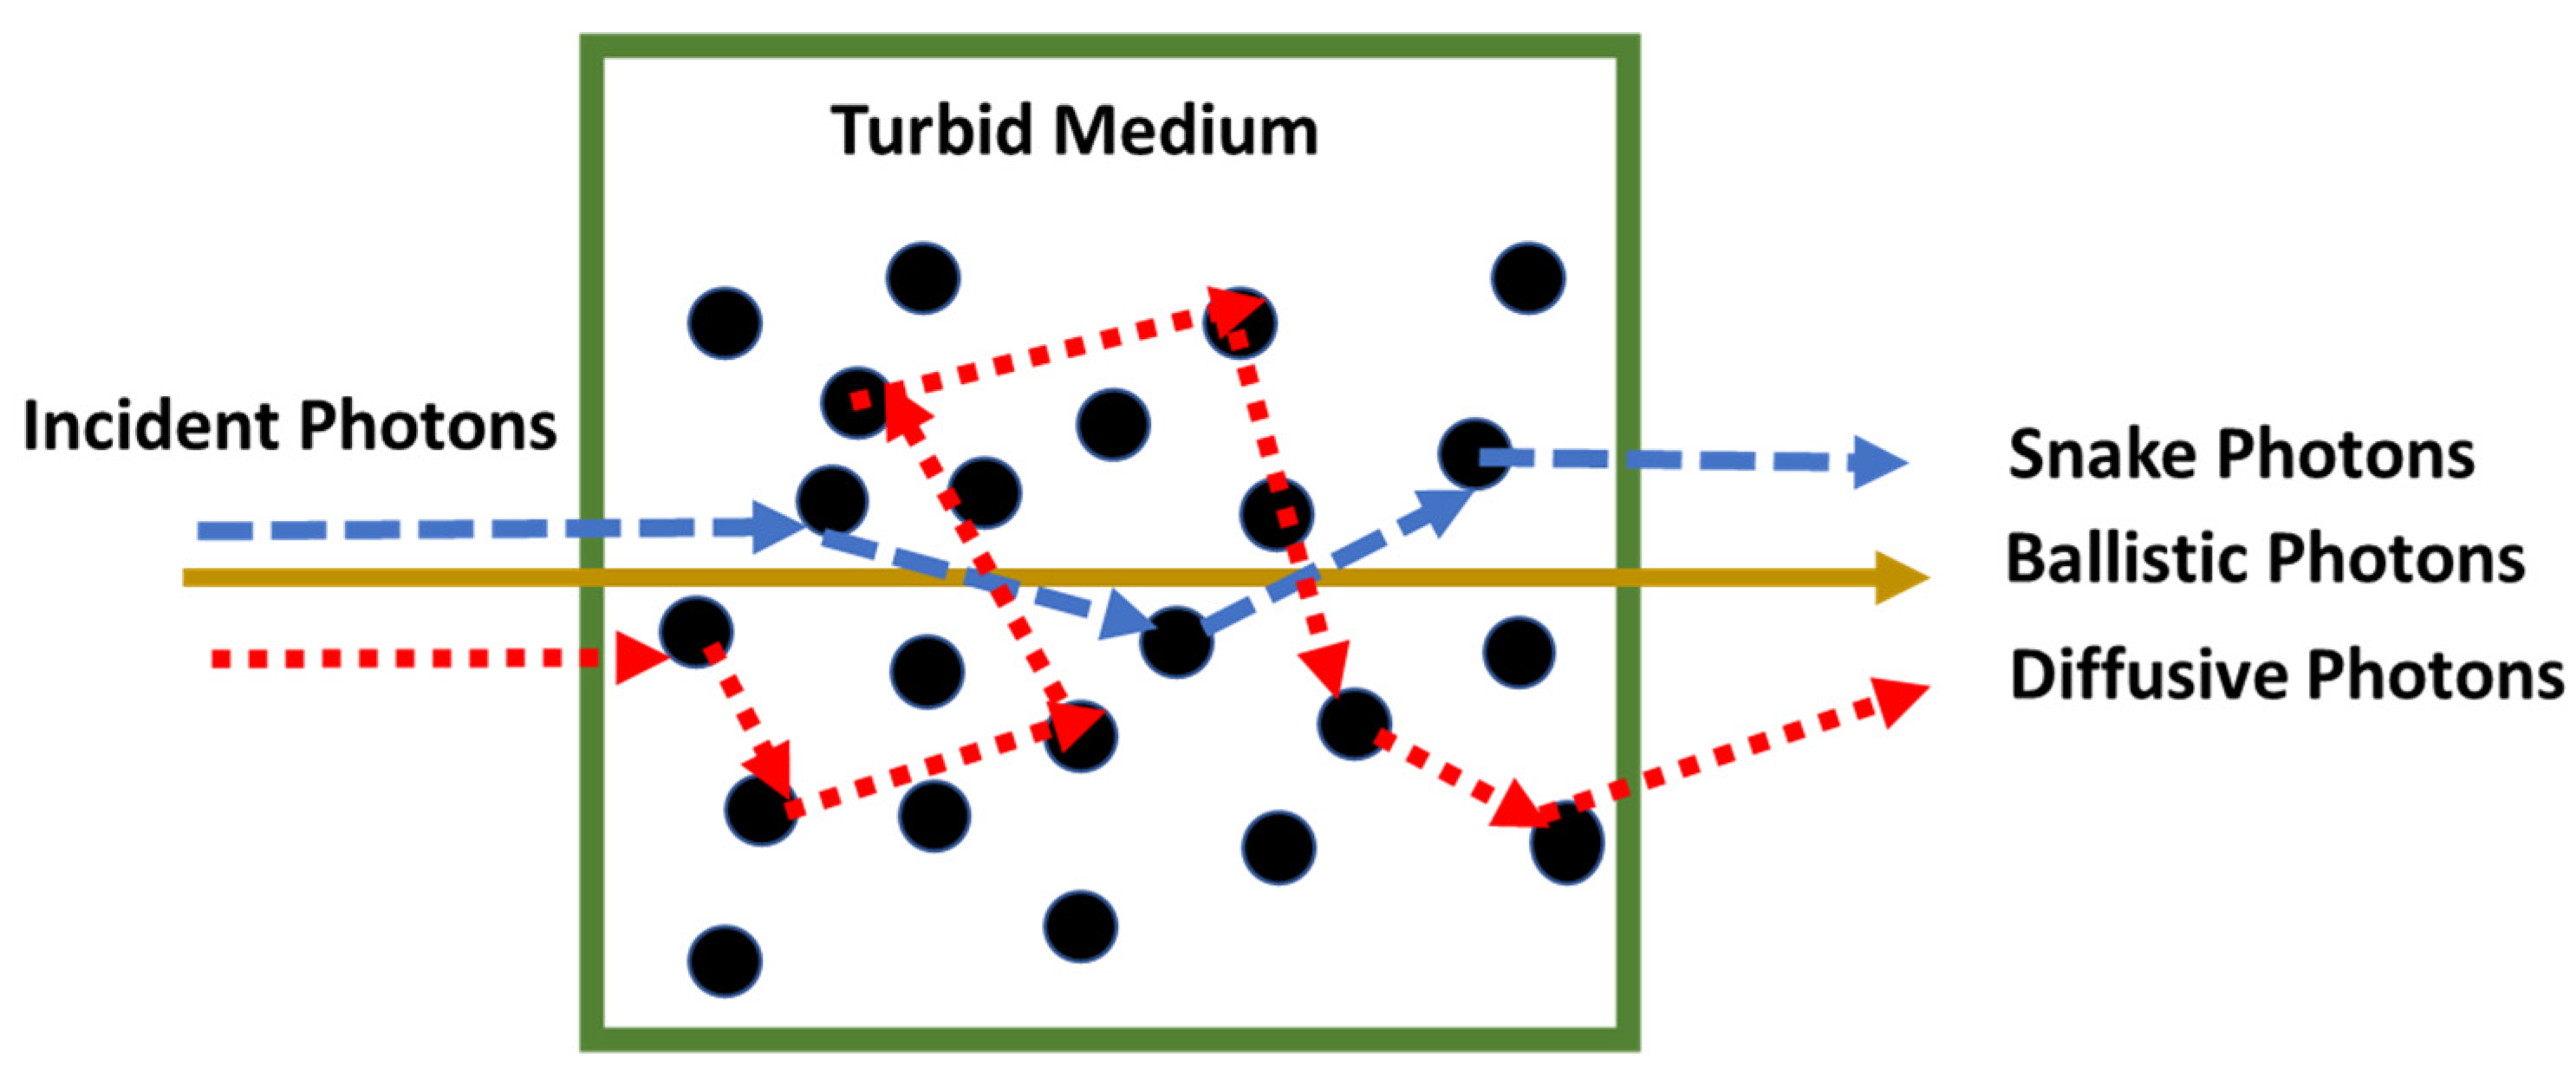
Light transmitted through tissues is classified into three categories: ballistic light, snake ballistic light, and diffuse light, as shown in Figure 1. Ballistic and snake photons carry good information from within the tissue, while multiple scattered photons are randomized and carry little information about the tissue. If only ballistic and snake photons are detected in a particular imaging technique, then it is considered a ballistic imaging technique. It has been shown that ballistic imaging is feasible only for a tissue with a thickness less than roughly 3 mm, and most ballistic imaging techniques reported in the literature have achieved approximately 30 scattering lengths in the NIR [18,19,20,21]. In all optical imaging techniques, the critical depth is roughly determined by the scattering length in the NIR, excluding water absorption peaks. It is important to investigate the optical properties of the tissue to develop an optical imaging technique to noninvasively image the cerebral cortex.
The intensity of ballistic light decays exponentially with depth and can be accurately approximated following the Beer–Lambert law [22]:
where I0 is the incident intensity and I(x) is the intensity of the ballistic light at depth x, attenuation length ℓe, or inverse attenuation or extinction coefficient . In fact, is the sum of the scattering coefficient ( and absorption coefficient , which is given by [22]:
The reduced scattering coefficient ( is related to the scattering coefficient by the following equation [22,23]:
where g is the anisotropy factor, the average cosine of the scattering angle. It is important to define the transport mean free path, which is given by the following equation [22]:
This parameter determines the critical penetration depth in tissues for the ballistic and diffusion regions. The transport length can be written in terms of the scattering length as shown in Equation (4). The scattering length, , is the inverse of the scattering coefficient. The theoretical penetration depth ( is predicted by diffusion theory and is given by [22]:
The penetration depth is an important parameter for optical imaging and determining the correct irradiation dose in photothermal and photodynamic therapy of various diseases [23].
If the size factor, is greater than 0.2, then we apply Mie scattering, where r is the radius of the particle, is the index of refraction of the medium, and is the incident wavelength. The Mie scattering efficiency Qs factor is derived from the Mie scattering amplitudes () [22]:
where are written in terms of the spherical Bessel functions of the first and second kind respectively [22]. The scattering cross section is related to the scattering efficiency by the neuron cross-section area ( according to the following equation:
The interactive Mie Scattering Calculator by Scott Prahl was used to determine the value of the scattering efficiency [24]. The density of neurons can be estimated from [12]:
Noninvasive monitoring of the density of neurons in the cerebral cortex is an essential early step in diagnosing brain diseases and has the potential to be developed into a brain therapy system.
The optical properties—such as the absorbance, attenuation and scattering coefficients, as well as the scattering length at different wavelengths in the visible to NIR range—are measured and calculated. The calculated penetration depth is roughly forty-two times the scattering length and this result provides the potential to noninvasively image the entirety of the gray matter tissue in the cerebral cortex of the human brain. Furthermore, the scattering cross-section and the scattering efficiency at 800 nm are calculated. Through the use of a noninvasive technique, the approximate number of neurons per mg in the gray matter of human brain tissue samples is calculated using the absorbance spectrum and Mie scattering model.
2. Methods and Samples
2.1. Methods
The optical properties and neuron sizes and densities in gray matter of human cerebral cortex tissues were investigated using a double-beam spectrophotometer. The spectral properties were investigated from 400 to 1100 nm. A UV–Vis double-beam spectroscopy system (U-2910 Hitachi Medical Systems, Hitachi High-Tech Corporation, New York City, NY, USA), was used in the absorption measurements. The working concept of this spectrophotometer is shown in Figure 2. The incident or reference beam () and the transmitted beam () are measured by the detector. The software calculates the transmittance (T) or/and absorbance (A).
2.2. Tissues Sample
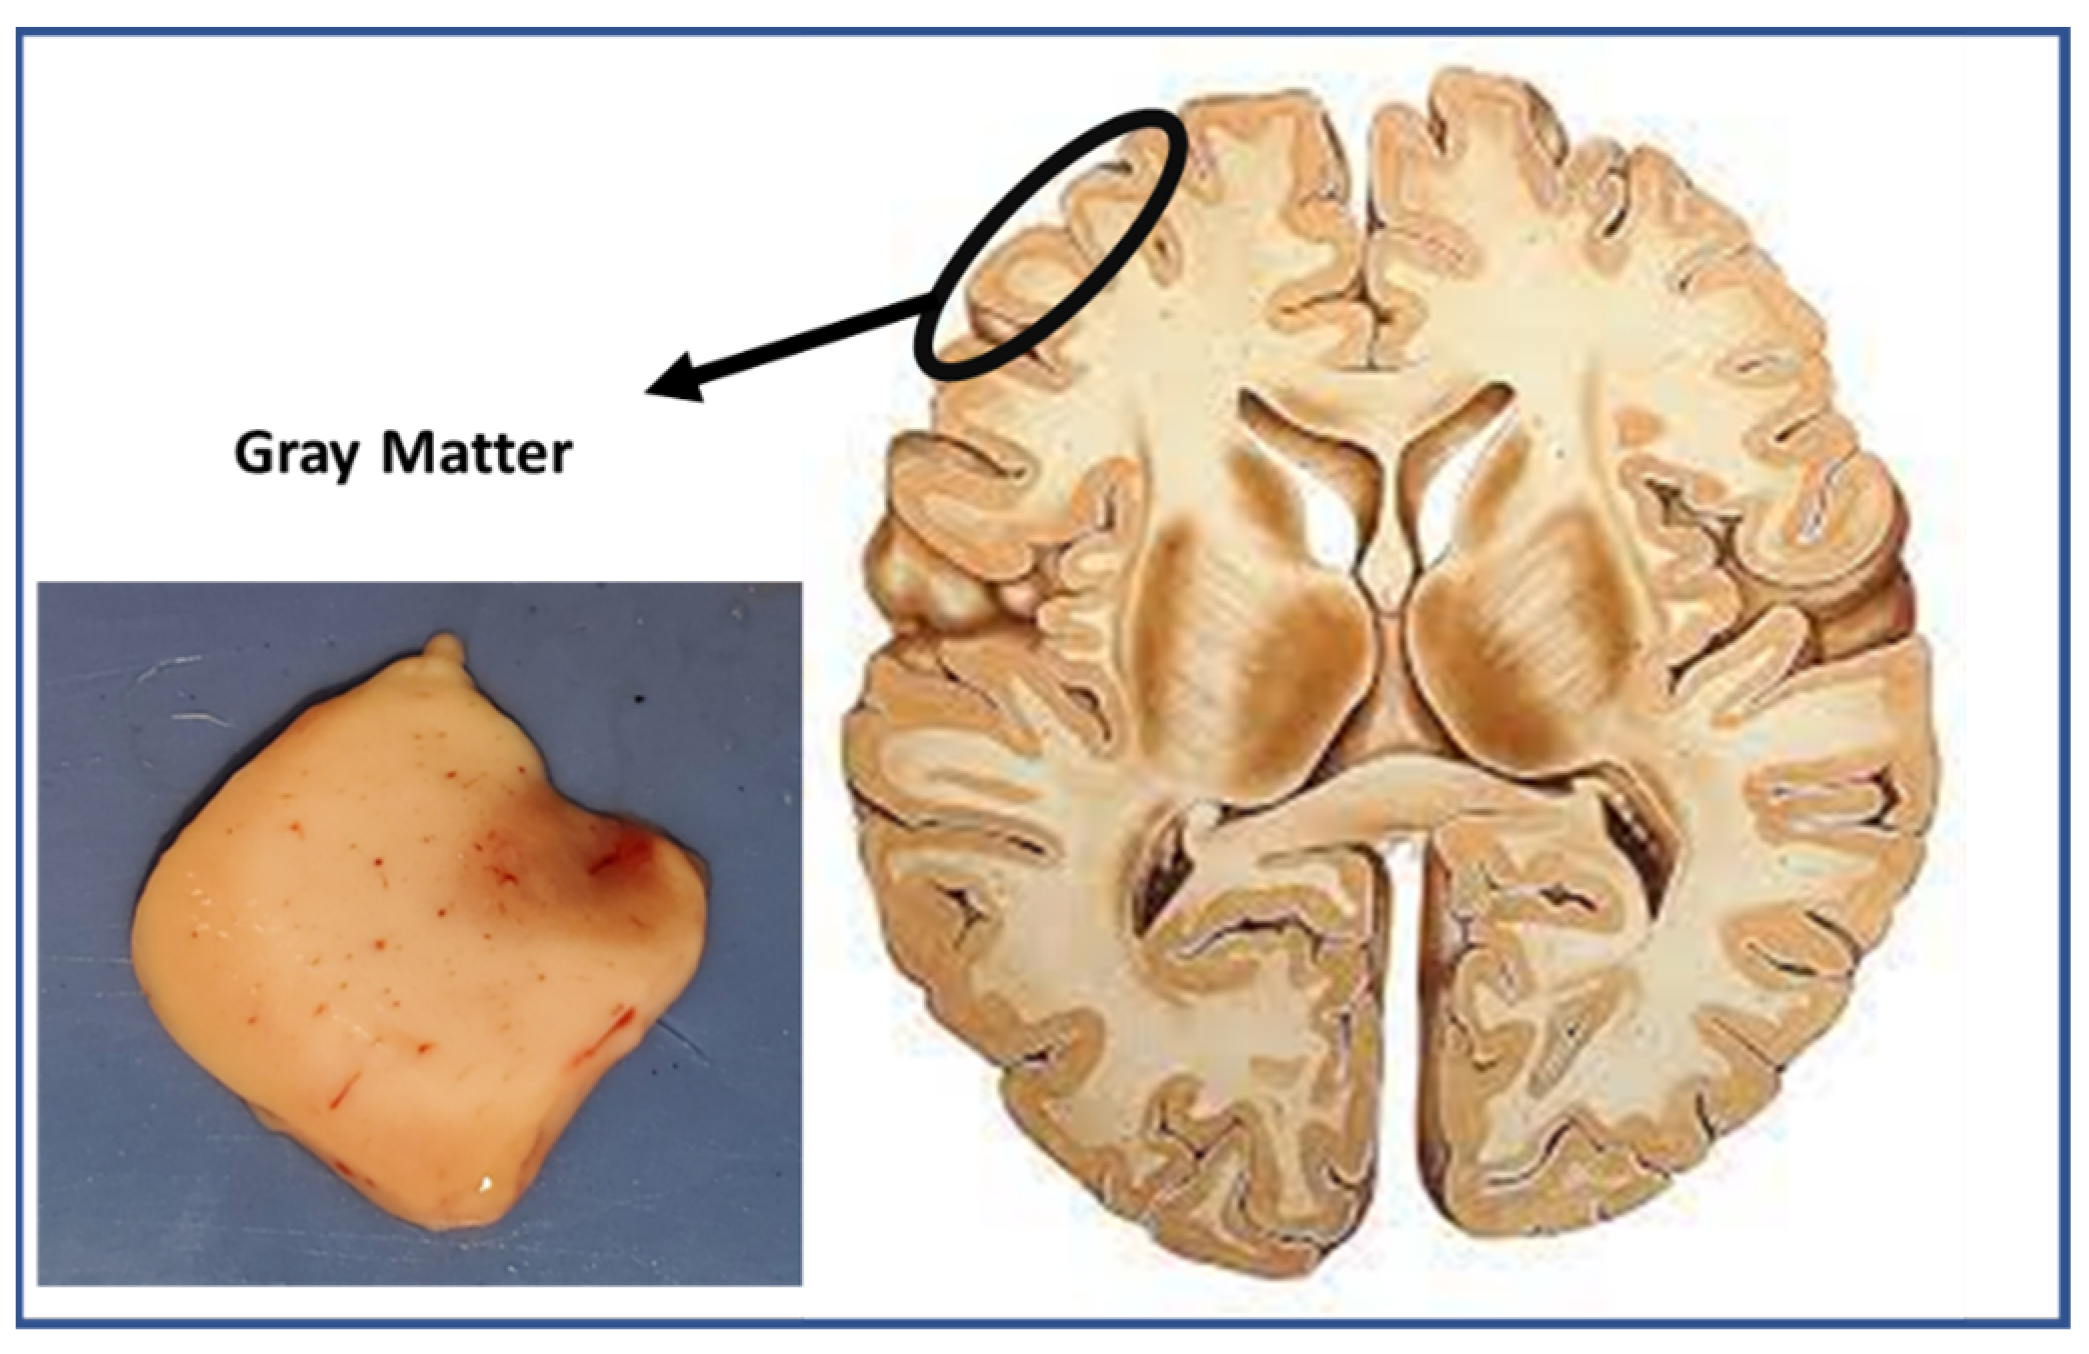
A frozen gray matter sample of human male brain tissue with a thickness of 1 cm and an area of 1 cm2 was used in the experiment. An image of the actual sample, pinkish-gray in color, is shown in Figure 3 and was captured using a conventional camera. The fresh samples were obtained from NDRI and kept at 4 °C. The healthy cerebral cortex tissues under investigation were taken from a deceased Caucasian male, age 48, with cardiovascular problems. The deceased person died of non-neurological causes and had no signs of brain diseases such as due to diabetes. The tissues were fresh and not treated with chemicals. Sections of gray matter male brain tissue of 300 μm thickness were obtained for the absorption measurements to evaluate the optical properties. Use of the NIR optical imaging technique to image this same sample will be reported in another paper.
3. Results and Discussion
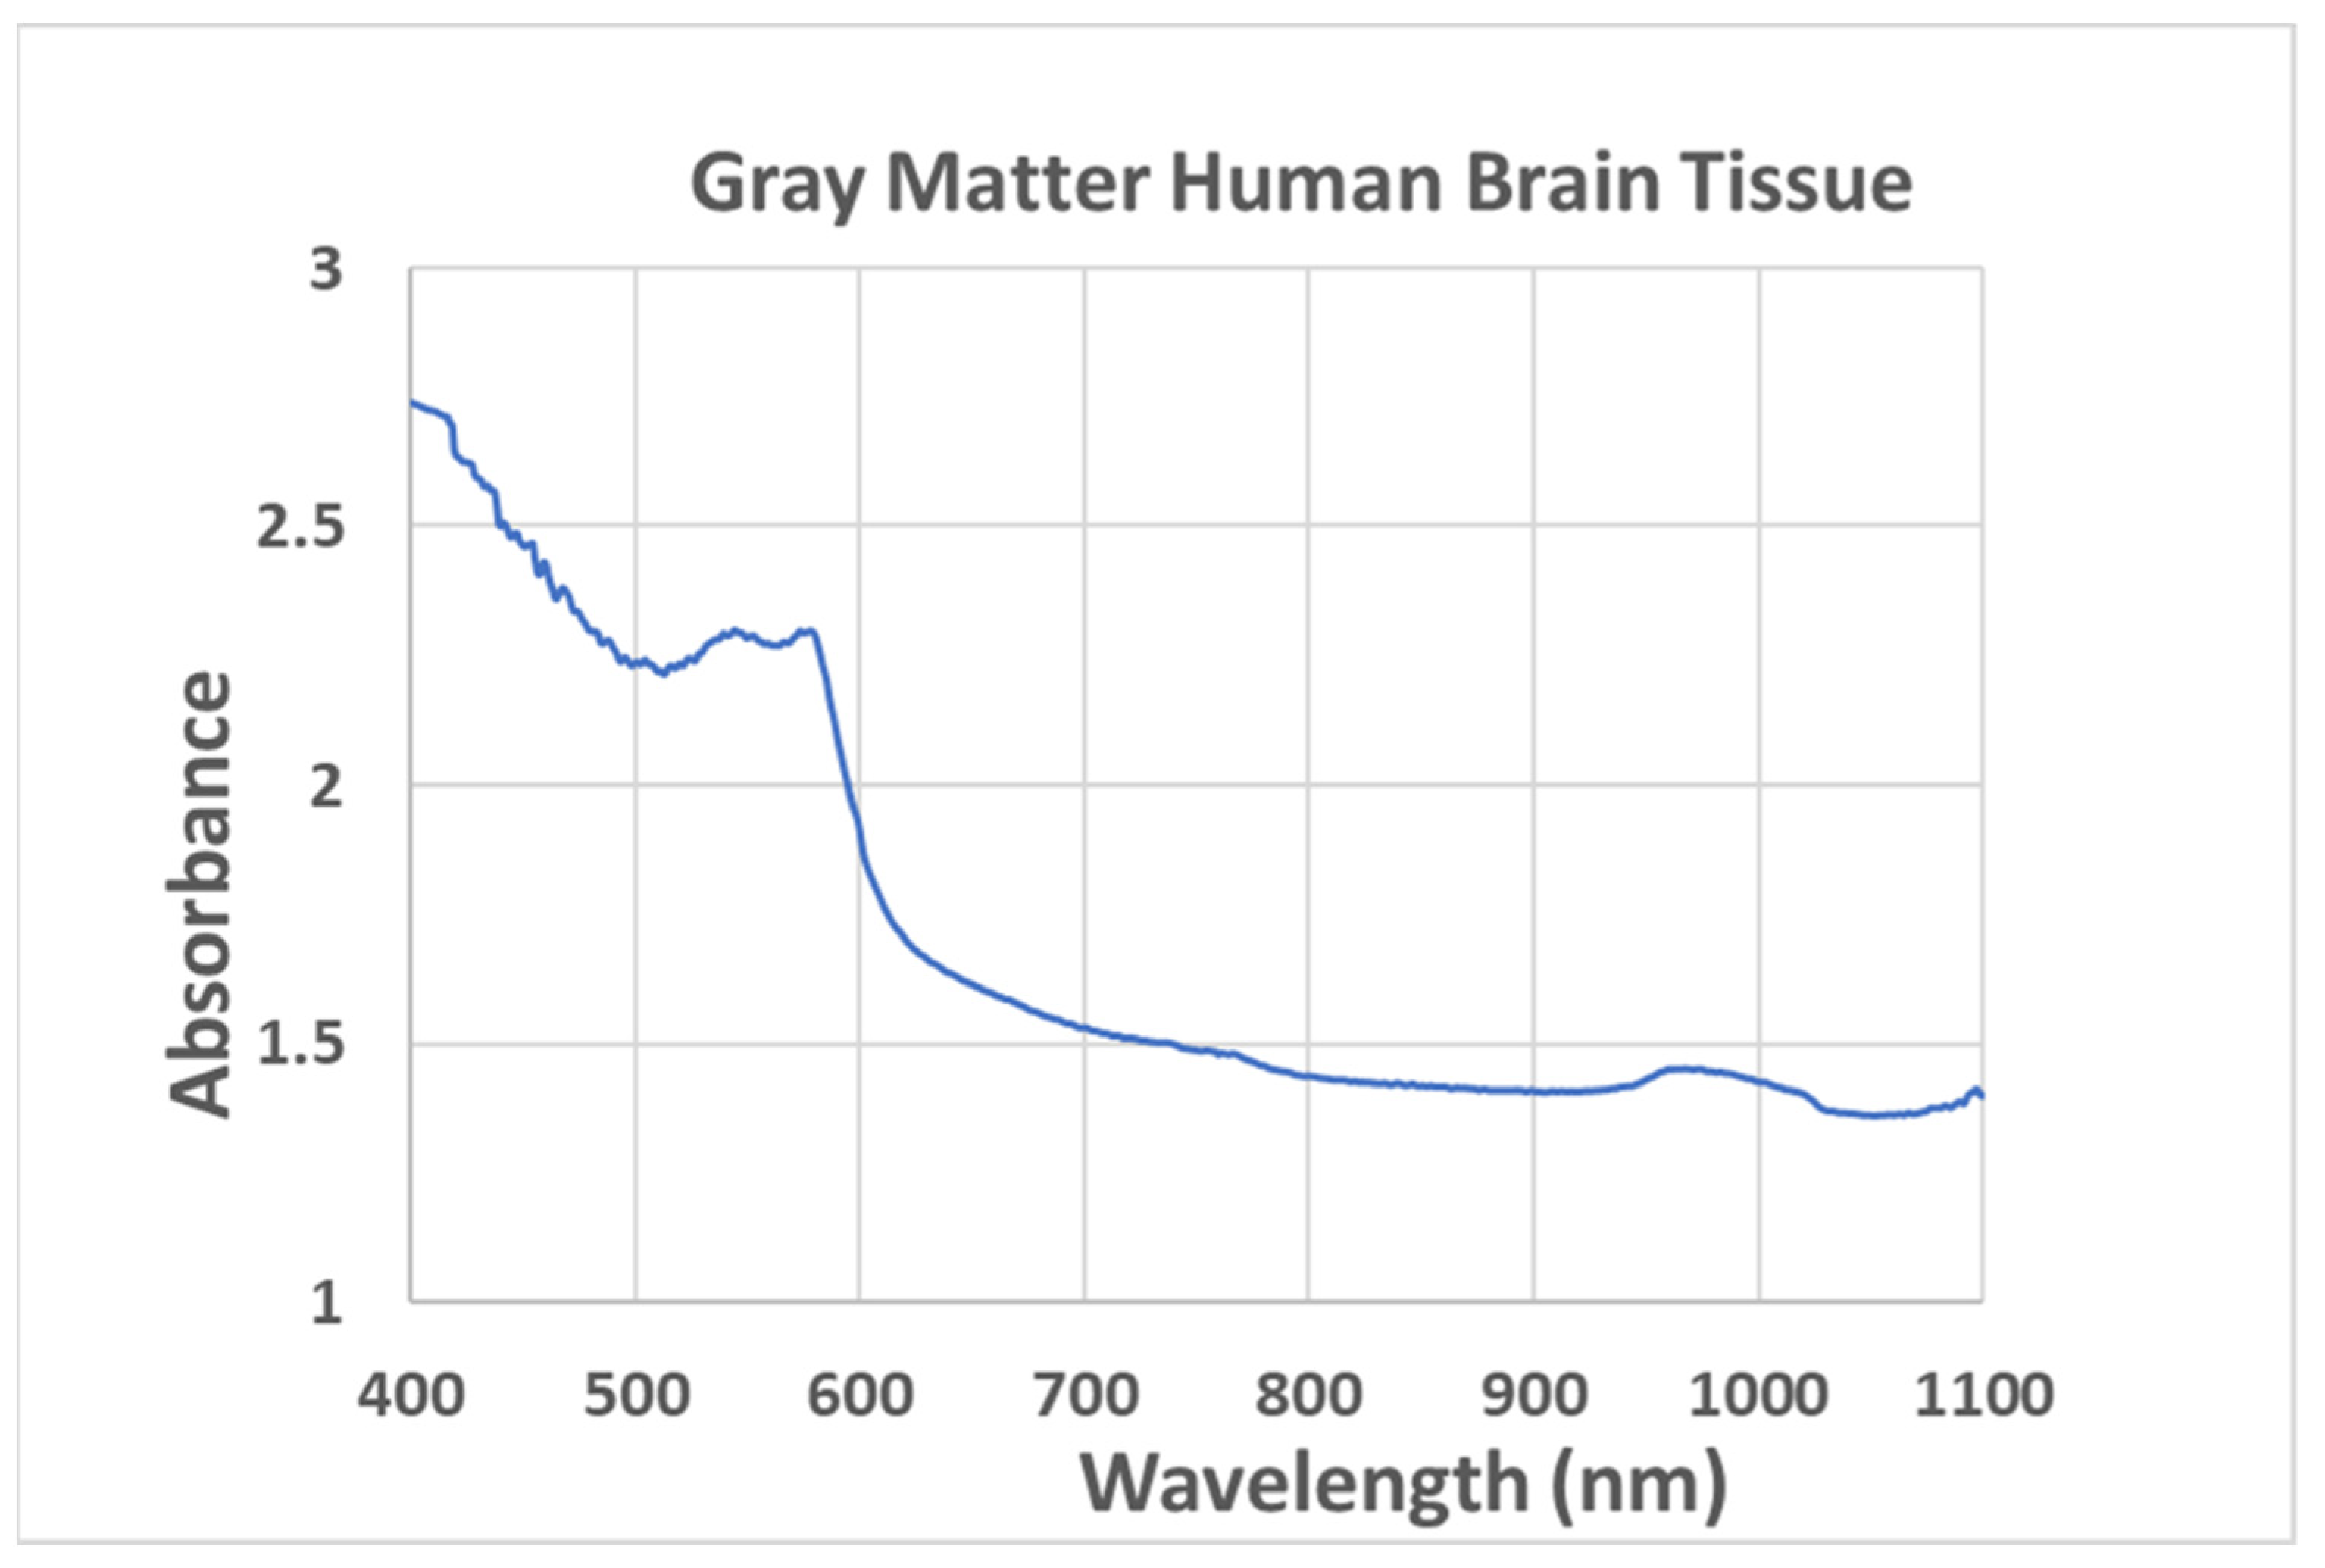
Figure 4 shows the absorption spectra for the 300 μm section of the cerebral cortex brain tissue gray matter. A UV–Vis double-beam spectroscopy system, U-2910 Hitachi Medical Systems, was used in the absorption measurements.
Figure 4 shows clear scattering in the visible and NIR region with some absorption at 540, 580, and 980 nm. There is a small peak at 780 nm due to blood absorption. Figure 4 shows that the scattering decreases at longer wavelengths, with greater penetration into the brain tissue. Based on this observation, it is expected that higher image quality can be obtained when imaging at longer wavelengths, such as over 800–900 nm, which allows avoiding the strong scattering between 400 and 700 nm with strong absorption at 540 nm and 580 nm. The two peaks at 540 and 580 nm are due to oxyhemoglobin (HbO2) [25,26]. The tissue sample looks pinkish-gray in color due to the presence of numerous tiny blood vessels, capillaries, and neurons in the gray matter. The peak at 980 nm was due to the absorption of water in the brain tissues [27,28]. Water is an important fingerprint related to the state of healthy tissues [29,30]. At these peaks, the signal is a mixture of scattering and absorption but with stronger scattering. In the cerebral cortex brain tissues, the absorption was dominated by hemoglobin in the visible range and by water in the near infrared, as shown in Figure 4. The brain is composed of approximately 90% water. Water absorption is observed at all wavelengths (400 to 1100 nm), with a strong signal at roughly 980 nm.
Using the data in Figure 4, we estimated the extinction or scattering coefficient at different wavelengths. For thin tissues or ballistic photons, we use Beer–Lambert law . The transmission is defined as or T = . The absorbance (A) is defined as . Finally, we use:
to calculate the attenuation coefficient. Knowing the values for the absorbance (A) and thickness (x) of the sample, we used Equation (9) to calculate at the desired wavelength. As shown in Figure 4, the peak at 580 represented the scattering and absorption. We calculated the attenuation coefficient for the gray matter at this wavelength. The absorbance at 580 nm was equal to 2.29, and the thickness of the tissue was 300 μm. From these values, we calculated . Similarly, we calculated the attenuation coefficient at other wavelengths and obtained and . A good signal or imaging contrast at 800 nm was expected due to the lower scattering and minimal absorption. The signal at 800 nm represents mainly the scattering effect, while that at 980 nm represents both scattering and absorption. Moreover, the signal at 800 nm is an isosbestic point, where the oxyhemoglobin (HbO2) and deoxyhemoglobin (HbR) have the same extinction coefficient [31]. Brain tissues at 800 nm have three important chromophores: HbO2, HbR, and water. At 800 nm, the water absorption is minimal, and scattering will dominate over the three chromophores. At the same time, scattering at 800 is lower than at any other shorter wavelength (400–800 nm). Therefore, this wavelength, 800 nm, is a desirable wavelength for further spectral and imaging investigations. The anisotropy g value for brain tissues is roughly equal to 0.9 according to the literature [22,23]. If we assume that the g value is 0.9, then the reduced scattering coefficient may be found for the 800 nm wavelength because it mainly comprises scattering (). Assuming the is mainly due to scattering and very low absorption, then we have . The scattering length (), which is the inverse of the scattering coefficient (), is then 0.09 mm. The reduced scattering coefficient is related to the scattering coefficient by Equation (3): . Then, the reduced scattering coefficient for gray matter at 800 nm is roughly equal to 1.12 . The transport mean free path is given by Equation (4): . By substituting the values into the equation, we obtain for . Some publications show that a clear image can be up to 40 [32,33,34]. From the literature, it is possible to enhance the optical imaging to a critical depth of roughly 3.6 mm within the gray matter in the brain. Theoretically, the penetration depth is defined by Equation (5): . The absorption coefficient ( for brain tissue is also reported in the literature. The most commonly reported value for brain tissues at 800 nm is 0.02 mm−1 [35,36]. If we substitute the values of the scattering coefficient 11.16 mm−1, g for most biological tissues, and the absorption coefficient of 0.02 mm−1 at 800 nm, then we obtain
The theoretical penetration depth is roughly forty-two times the scattering length, . This means that we may image the whole gray matter of the cerebral cortex (less than 4 mm thickness) noninvasively using NIR optical techniques. Table 1 shows the summary of the above discussion.
The parameters needed to calculate are the neuron diameter, the index of refraction for the medium and the neurons, and the incident wavelength. The index of refraction is given by:
where is the real index of refraction, and K is the imaginary part. The imaginary part of the index of refraction is related to the wavelength and absorption coefficient by [37]:
From the literature, the absorption coefficient of the cerebral cortex of human brain tissues at 800 nm can be around 0.02 [35,36], and its imaginary index of refraction is very small, approximately 0.0000013. So, we may ignore the value of K since it is below 0.00001, as the scattering efficiency will not change that much. The index of refraction of the cytoplasm medium and gray matter in human brain tissues are roughly 1.34 and 1.4, respectively [38,39]. The average size of neurons in this sample was roughly 12 µm, which were measured using SEM and NIR imaging techniques. The images of these neurons will be published in a separate paper. It is also known from the literature that the sizes of neurons are roughly between 5 and 100 µm [40,41]. The needed parameters are listed in Table 2, as shown below with the value from the Mie calculator [24].
By substituting the value of the scattering efficiency (1.89) in Equation (7) (, we obtain:
Now, substituting the scattering cross section and scattering coefficient at 800 nm into Equation (8), we obtain the density of neurons for the used sample in this experiment:
This is an approximate number of neurons in the gray matter of human brain tissue in our sample. This number lies within the valid reported numbers for neurons, 10,000 to 90,000 neurons/mg, in the cerebral cortex using different techniques [41,42,43]. These numbers could vary from one site to another and from one person to another [41,42,43].
All the major techniques used to estimate neuron density, such as DNA extraction, histology, flow cytometry, and Isotropic fractionator, are invasive [44,45,46,47,48,49]. To the best of our knowledge, this is the first technique that shows the potential use of a noninvasive technique to estimate the density of neurons in the gray matter of the cerebral cortex. We believe that the present technique will have great potential in estimating the density of neurons noninvasively and could benefit the health care field.
4. Conclusions
In conclusion, the absorption spectrum of the sample of gray matter of the cerebral cortex examined in this study shows three peaks in the visible and NIR regions, as shown in Figure 4. The two peaks at 540 and 580 nm are due to oxyhemoglobin (HbO2), while the peak at 980 nm is due to the absorption of water in the gray matter brain tissue. Hemoglobin is a protein pigment of red blood cells that involves the transport of oxygen. It binds to oxygen under cooler temperatures [50]. This explains the clear absorption of HbO2 at the two peaks in frozen tissues. When freezing brain tissues, the major properties—such as neuron size, density, and proteins in the tissue matrix—are preserved and are closer to those of the fresh tissues [51,52,53]. Moreover, the attenuation and scattering coefficients, transport length, and neuron density in the gray matter of the male cerebral cortex were calculated based on the spectral measurements using the absorption and Mie model. Table 1 shows that the attenuation coefficients at 580, 800, and 980 nm are 17.75, 11.16, and 11.24 , respectively. The attenuation coefficient at 980 nm is due to water absorption and scattering in the gray matter tissue, while that at 800 nm is mainly due to scattering. Hence, the scattering coefficient is roughly 11.16 mm−1, and the reduced scattering coefficient is roughly 1.12 mm−1. The measured scattering length and transport length at 800 nm were 0.09 and 0.90 mm, respectively. In the literature, the values of optical properties of the gray matter in the cerebral cortex tissues vary due to the used sample (location and age of the person), the experimental techniques, the state of the tissues (fresh, temperature, in vivo, etc.), the structural properties of neurons, and g value [54,55,56,57,58]. Theoretically, it is possible to enhance the critical depth for NIR imaging to roughly 3.8 mm within the gray matter in the brain. Since the thickness of gray matter in the human brain is roughly less than 4 mm, it is possible to noninvasively image the whole gray matter of the cerebral cortex of the human brain using NIR optical techniques. The calculated scattering efficiency (2.5), scattering cross-section (282.6 µm2), and scattering coefficient (11.16 ) at 800 nm gave a density of roughly 40,000 neurons/mm3. This is the approximate number of neurons per mg (mm3) in the gray matter of human brain tissue in our sample. More experiments are needed to further explore the potential of measuring the neuron density at different sites of the cerebral cortex of a human brain. Further validation could potentially be obtained by comparing the density of neurons measured by a pathologist in the same samples with that determined here using the described technique.
The results provide an expected critical depth of 3.8 mm within the gray matter of the cerebral cortex in a healthy human brain using NIR optical techniques. Using these convenient techniques, we may be able to non-invasively measure the density of the neurons in the gray matter of the cerebral cortex. This is an important step toward studying the state of neurons in a person who has the potential for neurodegenerative diseases, allowing appropriate intervention at an early stage of disease. A limitation of this research is that the samples were derived from a single subject, i.e., male normal brain tissue. More research is required in order to collect more data and to compare these data with pathological techniques. The results from the NIR imaging of the same sample will be reported soon.
Funding
This research was funded by the City University of New York (PSC-CUNY) Research Award Program, grant # 6142400-49.
Institutional Review Board Statement
This study did not require Institutional Review Board approval.
Informed Consent Statement
Informed consent was obtained from the subject involved in the study through NDRI.
Data Availability Statement
Most of the data supporting the findings of this study are available within the article. The absorbance data are available from author, [J. Ali] upon request.
Acknowledgments
We acknowledge the use of tissues procured by the National Disease Research Interchange (NDRI) with support from NIH grant U42OD11158.
Conflicts of Interest
The author declares no conflict of interest.
References
- Mercadante, A.A.; Tadi, P. Neuroanatomy, Gray Matter; StatPearls Publishing: Treasure Island, FL, USA, 2022. [Google Scholar]
- Guy-Evans, O. Grey Matter in the Brain. 11 October 2021. Simply Psychology. Available online: www.simplypsychology.org/what-is-grey-matter-in-the-brain.html (accessed on 17 November 2022).
- Cerebrl Cortex. Available online: https://my.clevelandclinic.org/health/articles/23073-cerebral-cortex (accessed on 17 November 2022).
- Neuron. Available online: https://en.wikipedia.org/wiki/Neuron (accessed on 17 November 2022).
- McDonald, B.C.; Conroy, S.K.; Ahles, T.A.; West, J.D.; Saykin, A.J. Alterations in brain activation during working memory processing associated with breast cancer and treatment: A prospective functional magnetic resonance imaging study. J. Clin. Oncol. Off. J. Am. Soc. Clin. Oncol. 2012, 30, 2500–2508. [Google Scholar] [CrossRef] [PubMed] [Green Version]
- McDonald, B.C.; Saykin, A.J. Alterations in brain structure related to breast cancer and its treatment: Chemotherapy and other considerations. Brain Imaging Behav. 2013, 7, 374–387. [Google Scholar] [CrossRef] [PubMed] [Green Version]
- Cimprich, B.; Reuter-Lorenz, P.; Nelson, J.; Clark, P.M.; Therrien, B.; Normolle, D.; Berman, M.G.; Hayes, D.F.; Noll, D.C.; Peltier, S.; et al. Prechemotherapy alterations in brain function in women with breast cancer. J. Clin. Exp. Neuropsychol. 2010, 32, 324–331. [Google Scholar] [CrossRef] [PubMed]
- Seo, J.; Park, M. Molecular crosstalk between cancer and neurodegenerative diseases. Cell. Mol. Life Sci. 2020, 77, 2659–2680. [Google Scholar] [CrossRef] [Green Version]
- Weerasinghe-Mudiyanselage, P.D.E.; Ang, M.J.; Kang, S.; Kim, J.; Moon, C. Structural Plasticity of the Hippocampus in Neurodegenerative Dis. Int. J. Mol. Sci. 2022, 23, 3349. [Google Scholar] [CrossRef]
- Stephenson, J.; Nutma, E.; van der Valk, P.; Amor, S. Inflammation in CNS neurodegenerative diseases. Immunology 2018, 154, 204–219. [Google Scholar] [CrossRef] [Green Version]
- Jellinger, J.K.A. Basic mechanisms of neurodegeneration: A critical update. Cell Mol. Med. 2010, 14, 457–487. [Google Scholar] [CrossRef] [Green Version]
- Luebke, J.I.; Weaver, C.M.; Rocher, A.B.; Rodriguez, A.; Crimins, J.L.; Dickstein, D.L.; Wearne, S.L.; Hof, P.R. Dendritic vulnerability in neurodegenerative disease: Insights from analyses of cortical pyramidal neurons in transgenic mouse models. Brain Struct. Funct. 2010, 214, 81–199. [Google Scholar] [CrossRef] [Green Version]
- Ali, J.H.; Wang, W.B.; Zevallos, M.; Alfano, R.R. Near-infrared spectroscopy and imaging to probe differences in water content in normal and cancer human prostate tissues. Technol. Cancer Res. Treat. 2004, 3, 491–497. [Google Scholar] [CrossRef] [Green Version]
- Kim, G.; Nagarajan, N.; Pastuzyn, E.; Jenks, K.; Capecchi, M.; Shepherd, J.; Menon, R. Deep brain imaging via epi-fluorescence computational cannula microscopy. Sci. Rep. 2017, 7, 44791. [Google Scholar] [CrossRef]
- Zhou, Y.; Liu, C.; Sun, Y.; Pu, Y.; White, S.; Alfano, R.R. Human brain cancer studied by resonance Raman spectroscopy. J. Biomed. Opt. 2012, 17, 116021. [Google Scholar] [CrossRef] [PubMed]
- Wirdatmadja, S.; Johari, P.; Desai, A.; Bae, Y.; Stachowiak, E.K.; Stachowiak, M.K.; Jornet, J.M.; Balasubramaniam, S. Analysis of Light Propagation on Physiological Properties of Neurons for Nanoscale Optogenetics. IEEE Trans. Neural Syst. Rehabil. Eng. 2019, 27, 2. [Google Scholar] [CrossRef] [PubMed]
- Favre-Bulle, I.; Preece, D.; Nieminen, T.; Heap, L.A.; Scott, E.K.; Rubinsztein-Dunlop, H. Scattering of Sculpted Light in Intact Brain Tissue, with implications for Optogenetics. Sci. Rep. 2015, 5, 11501. [Google Scholar] [CrossRef] [Green Version]
- Svaasand, L.O.; Ellingsen, R. Optical properties of human brain Photochem. Photobiol. 1983, 38, 293–299. [Google Scholar] [CrossRef] [PubMed]
- Yoo, K.M.; Alfano, R.R. Time-resolved coherent and incoherent components of forward light scattering in random media. Opt. Lett. 1990, 15, 320–322. [Google Scholar] [CrossRef] [PubMed]
- Lax, M.; Nayaramamurti, V.; Fulton, R.C. Laser Optics of Condensed Matter; Plenum: New York, NY, USA, 1987; p. 229. [Google Scholar]
- Giacomelli, M.G.; Wax, A. Imaging beyond the ballistic limit in coherence imaging using multiply scattered light. Opt. Express 2011, 19, 4268–4279. [Google Scholar] [CrossRef] [Green Version]
- Wang, L.; Wu, H. Biomedical Optics: Principles and Imaging; John Wiley & Sons: Hoboken, NJ, USA, 2007. [Google Scholar]
- Tuchin, V. Tissue Optics: Light Scattering Methods and Instruments for Medical Diagnosis; SPIE Press: Bellingham, WA, USA, 2000. [Google Scholar]
- Prahl, S. Mie Scattering Calculator. Available online: https://omlc.org/calc/mie_calc.html (accessed on 10 October 2022).
- Zhestkov, D.M.; Tuchin, V.V.; Bashkatov, A.N.; Genina, E.A. Optical Immersion of Erythrocytes in Blood: A Theoretical Modeling; SPIE: Bellingham, WA, USA, 2004; p. 5. [Google Scholar]
- Friebel, M.; Roggan, A.; Müller, G.; Meinke, M. Determination of optical properties of human blood in the spectral range 250 to 1100 nm using Monte Carlo simulations with hematocrit-dependent effective scattering phase functions. J. Biomed. Opt. 2006, 11, 034021. [Google Scholar] [CrossRef]
- Jiang, W.; Almadi, M.; Salas, N.; Rajguru, S. Optical Properties of Biological Tissues Measured at Infrared Wavelengths. Biomedical Optics 2014 OSA Technical Digest (Online) (Optica Publishing Group, 2014), Paper BT3A.42. Available online: https://faculty.ksu.edu.sa/sites/default/files/biooptics_2014_optical20properties.pdf (accessed on 17 November 2022).
- Bakhsheshi, M.F.; Lee, T. Non-invasive monitoring of brain temperature by near-infrared spectroscopy. Temperature 2014, 2, 31–32. [Google Scholar] [CrossRef] [Green Version]
- Wang, W.B.; Ali, J.H.; Alfano, R.R.; Vitenson, J.H.; Lombardo, M.J. Spectral polarization imaging of human rectum-membrane-prostate tissues. IEEE J. Sel. Top. Quantum Electron. 2003, 9, 288–293. [Google Scholar] [CrossRef]
- Alfano, R.; Ali, J.; Wang, W.; Zevallos, M. Detecting Human Cancer through Spectral Optical Imaging Using Key Water Absorption Wavelengths. US Patent 7,706,862, 27 April 2010. [Google Scholar]
- Barlow, C.H.; Burns, D.H.; Callis, J.B. Breast Biopsy Analysis by Spectroscopic Imaging. In Photon Migration in Tissues; Chance, B., Ed.; Springer: Boston, MA, USA, 1989. [Google Scholar]
- Cai, W.; Das, B.B.; Liu, F.; Zevallos, M.; Lax, M.; Alfano, R.R. Time-resolved optical diffusion tomographic image reconstruction in highly scattering turbid media. Proc. Natl. Acad. Sci. USA 1996, 93, 13561–13564. [Google Scholar] [CrossRef]
- Satat, G.; Heshmat, B.; Raviv, D.; Raskar, R. All photons imaging through volumetric scattering. Sci. Rep. 2016, 6, 33946. [Google Scholar] [CrossRef] [PubMed] [Green Version]
- Radford, J.; Lyons, A.; Tonolini, F.; Faccio, D. Role of late photons in diffuse optical imaging. Opt. Express 2020, 28, 29486–29495. [Google Scholar] [CrossRef]
- Yaroslavsky, A.N.; Schulze, P.C.; Yaroslavsky, I.V.; Schober, R.; Ulrich, F.; Schwarzmaier, H.J. Optical properties of selected native and coagulated human brain tissues in vitro in the visible and near-infrared spectral range. Phys. Med. Biol. 2002, 47, 2059–2073. [Google Scholar] [CrossRef]
- Kim, S.; Lee, J.H. Near-Infrared Light Propagation in an Adult Head Model with Refractive Index Mismatch. ETRI J. 2005, 27, 377–384. [Google Scholar] [CrossRef]
- Martins, I.S.; Silva, H.F.; Tuchin, V.V.; Oliveira, L.M. Fast Estimation of the Spectral Optical Properties of Rabbit Pancreas and Pigment Content Analysis. Photonics 2022, 9, 122. [Google Scholar] [CrossRef]
- Biswas, T.; Luu, T. In vivo MR Measurement of Refractive Index, Relative Water Content and T2 Relaxation time of Various Brain lesions With Clinical Application to Discriminate Brain Lesions. Internet J. Radiol. 2009, 13, 1. [Google Scholar]
- Franze, K.; Grosche, J.; Skatchkov, S.N.; Schinkinger, S.; Foja, C.; Schild, D.; Uckermann, O.; Travis, K.; Reichenbach, A.; Guck, J. Müller cells are living optical fibers in the vertebrate retina. Proc. Natl. Acad. Sci. USA 2007, 104, 8287–8292. [Google Scholar] [CrossRef] [Green Version]
- Vonsattel, J.P.G.; Keller, C.; Ramirez, E.P.C. Chapter 4—Huntington’s disease—Neuropathology. Handb. Clin. Neurol. 2011, 100, 83–100. [Google Scholar]
- Ribeiro, P.F.M.; Ventura-Antunes, L.; Gabi, M.; Mota, B.; Grinberg, L.T.; Farfel, J.M.; Ferretti-Rebustini, R.E.L.; Leite, R.E.P.; Filho, W.J.; Herculano-Houzel, S. The human cerebral cortex is neither one nor many: Neuronal distribution reveals two quantitatively different zones in the gray matter, three in the white matter, and explains local variations in cortical folding. Front. Neuroanat. 2013, 7, 28. [Google Scholar] [CrossRef] [Green Version]
- Young, N.A.; Collins, C.E.; Kaas, J.H. Cell and neuron densities in the primary motor cortex of primates. Front. Neural Circuits 2013, 7, 30. [Google Scholar] [CrossRef] [Green Version]
- Collins, C.E.; Airey, D.C.; Young, N.A.; Leitch, D.B.; Kaas, J.H. Neuron densities vary across and within cortical areas in primates. Proc. Natl. Acad. Sci. USA 2010, 107, 15927–15932. [Google Scholar] [CrossRef] [PubMed] [Green Version]
- Herculano-Houzel, S.; Lent, R. Isotropic fractionator: A simple, rapid method for the quantification of total cell and neuron numbers in the brain. J. Neurosci. 2005, 25, 2518–2521. [Google Scholar] [CrossRef]
- Miller, D.J.; Balaram, P.; Young, N.A.; Kaas, J.H. Three counting methods agree on cell and neuron number in chimpanzee primary visual cortex. Front. Neuroanat. 2014, 8, 36. [Google Scholar] [CrossRef] [PubMed] [Green Version]
- Herculano-Houzel, S.; von Bartheld, C.S.; Miller, D.J.; Kaas, J.H. How to count cells: The advantages and disadvantages of the isotropic fractionator compared with stereology. Cell Tissue Res. 2015, 360, 29–42. [Google Scholar] [CrossRef] [PubMed] [Green Version]
- von Bartheld, C.S.; Bahney, J.; Herculano-Houzel, S. The search for true numbers of neurons and glial cells in the human brain: A review of 150 years of cell counting. J. Comp. Neurol. 2016, 524, 3865–3895. [Google Scholar] [CrossRef] [Green Version]
- Neves, K.; Menezes Guimarães, D.; Rayêe, D.; Valério-Gomes, B.; Meneses Iack, P.; Lent, R.; Mota, B. The reliability of the isotropic fractionator method for counting total cells and neurons. J. Neurosci. Methods 2019, 326, 108392. [Google Scholar] [CrossRef]
- Wang, J.; Zhang, M.; Guo, Y.; Hu, H.; Chen, K. Quantification of surviving neurons after contusion, dislocation, and distraction spinal cord injuries using automated methods. J. Exp. Neurosci. 2019, 13, 1179069519869617. [Google Scholar] [CrossRef]
- Kaufman, D.P.; Kandle, P.F.; Murray, I.; Dhamoon, A.S. Physiology, Oxyhemoglobin Dissociation Curve; Updated 2022 August 1; StatPearls Publishing: Treasure Island, FL, USA, 2022. [Google Scholar]
- Caon, T.; Simões, C.M. Effect of freezing and type of mucosa on ex vivo drug permeability parameters. AAPS PharmSciTech 2011, 12, 587–592. [Google Scholar] [CrossRef] [Green Version]
- Estrada, L.I.; Robinson, A.A.; Amaral, A.C.; Giannaris, E.L.; Heyworth, N.C.; Mortazavi, F.; Ngwenya, L.B.; Roberts, D.E.; Cabral, H.J.; Killiany, R.J.; et al. Evaluation of Long-Term Cryostorage of Brain Tissue Sections for Quantitative Histochemistry. J. Histochem. Cytochem. 2017, 65, 153–171. [Google Scholar] [CrossRef] [Green Version]
- Bao, W.G.; Zhang, X.; Zhang, J.G.; Zhou, W.J.; Bi, T.N.; Wang, J.C.; Yan, W.H.; Lin, A. Biobanking of fresh-frozen human colon tissues: Impact of tissue ex-vivo ischemia times and storage periods on RNA quality. Ann. Surg. Oncol. 2013, 20, 1737–1744. [Google Scholar] [CrossRef]
- Steen, J.M. Optical Methods and Instrumentation in Brain Imaging and Therapy; Springer: New York, NY, USA, 2014. [Google Scholar]
- Yue, L.; Humayun, M.S. Monte Carlo analysis of the enhanced transcranial penetration using distributed near-infrared emitter array. J. Biomed. Opt. 2015, 20, 8. [Google Scholar] [CrossRef] [PubMed]
- Li, T.; Chang, X.; Pengbo, W.; Yan, L.; Lanhui, W. Photon penetration depth in human brain for light stimulation and treatment: A realistic Monte Carlo simulation study. J. Innov. Opt. Health Sci. 2017, 10, 5. [Google Scholar] [CrossRef]
- Shi, L.; Sordillo, L.A.; Rodríguez-Contreras, A.; Alfano, R. Transmission in near-infrared optical windows for deep brain imaging. J. Biophotonics 2016, 9, 38–43. [Google Scholar] [CrossRef] [PubMed]
- Scholkmann, F.; Zohdi, H.; Nasseri, N.; Wolf, U. Absolute Values of Optical Properties (μa, μs, μeff and DPF) of Human Head Tissue: Dependence on Head Region and Individual. Adv. Exp. Med. Biol. 2018, 1072, 325–330. [Google Scholar]
Figure 1.
Illustration of photons’ journey in a turbid medium.

Figure 2.
Double-beam spectrophotometer: BS (beam splitter) and M (mirror).

Figure 3.
The gray matter is the dark region of the outer surface of the cerebral cortex of the human brain. The inset shows a photograph of human gray matter tissue using a conventional camera.
Figure 3.
The gray matter is the dark region of the outer surface of the cerebral cortex of the human brain. The inset shows a photograph of human gray matter tissue using a conventional camera.

Figure 4.
Absorption spectra of the gray matter of human brain tissue.


Table 1.
Absorbance and attenuation coefficient of the gray matter in the cerebral cortex of a human brain.
Table 1.
Absorbance and attenuation coefficient of the gray matter in the cerebral cortex of a human brain.
| Wavelength λ (nm) | Absorbance A | Attenuation Coefficient μe (mm−1) | Reduced Scattering Coefficient (mm−1) | Penetration Depth δ (mm) |
|---|---|---|---|---|
| 580 | 2.29 | 17.75 | ||
| 800 | 1.44 | ~1.12 | 3.83 | |
| 980 | 1.45 | 11.24 |
Table 2.
The data used to calculate the scattering efficiency for the gray matter of the cerebral cortex of the human brain tissue sample.
Table 2.
The data used to calculate the scattering efficiency for the gray matter of the cerebral cortex of the human brain tissue sample.
| Diameter d in μm | Wavelength λ in μm | Index of Refraction of the Medium nmedium | Index of Refraction of Neurons nneuron | Index of Refraction- Imaginary Part K | Scattering Efficiency Qs |
|---|---|---|---|---|---|
| 12 | 0.800 | 1.34 | 1.4 | 0.0000013 | 2.5 |
Disclaimer/Publisher’s Note: The statements, opinions and data contained in all publications are solely those of the individual author(s) and contributor(s) and not of MDPI and/or the editor(s). MDPI and/or the editor(s) disclaim responsibility for any injury to people or property resulting from any ideas, methods, instructions or products referred to in the content. |
© 2022 by the author. Licensee MDPI, Basel, Switzerland. This article is an open access article distributed under the terms and conditions of the Creative Commons Attribution (CC BY) license (https://creativecommons.org/licenses/by/4.0/).
Share and Cite
MDPI and ACS Style
Ali, J.H. Spectral Optical Properties of Gray Matter in Human Male Brain Tissue Measured at 400–1100 nm. Optics 2023, 4, 1-10. https://doi.org/10.3390/opt4010001
AMA Style
Ali JH. Spectral Optical Properties of Gray Matter in Human Male Brain Tissue Measured at 400–1100 nm. Optics. 2023; 4(1):1-10. https://doi.org/10.3390/opt4010001
Chicago/Turabian StyleAli, Jamal H. 2023. "Spectral Optical Properties of Gray Matter in Human Male Brain Tissue Measured at 400–1100 nm" Optics 4, no. 1: 1-10. https://doi.org/10.3390/opt4010001