Article

Experimental Investigation on Local and Global Texture Evolution in Drawing Seamless Copper Tubes

1
Institute of Metallurgy, Clausthal University of Technology, Robert-Koch-Strasse 42, 38678 Clausthal-Zellerfeld, Germany
2
Institut de Physique et Chimie des Matériaux de Strasbourg (IPCMS)-CNRS-UMR-7504, Université de Strasbourg, 23 rue du Loess, BP 43, 67034 Strasbourg, France
3
Faculty of Mechanical Engineering, Dortmund University of Applied Sciences and Arts, Sonnenstr. 96, 44139 Dortmund, Germany
*
Author to whom correspondence should be addressed.
Appl. Mech. 2023, 4(1), 93-108; https://doi.org/10.3390/applmech4010007
Submission received: 22 December 2022 / Revised: 10 January 2023 / Accepted: 17 January 2023 / Published: 20 January 2023
(This article belongs to the Special Issue Fracture Mechanics and Durability of Engineering Materials)

Abstract

:
Mass flow inequality in the initial stage of tube processing can lead to eccentricity and micro- and nano-structural changes that affect residual stress and texture development. In this study, the macro- and micro-texture development of copper tubes drawn with a tilted die was investigated using three methods: synchrotron, neutron diffraction, and electron backscatter diffraction, in the positions of maximum and minimum wall thickness of the tubes. Understanding how a tilted die can affect the texture development in copper tubes is the main aim of this study. The micro-texture results of EBSD examinations showed the same behavior at the maximum and minimum sides of the as-received tube, as observed using the synchrotron diffraction method as well as macro-texture measurements. The cube texture component was found to be the predominant orientation in the as-received tube. However, it almost disappeared after drawing with −5° tilting. By contrast, the Cu texture component increased significantly. Before drawing, the cube component varied strongly across the wall thickness. After drawing, however, there was no noticeable texture gradient across the wall thickness. The analyses showed that tilting is not creating an inhomogeneous texture development over the circumference.

1. Introduction

In terms of applications and properties, residual stresses (RS) and eccentricity (E) are two main features in the tube drawing, as they affect the limits of the tubes. However, no industrial technique has yet been developed to control these parameters in a repeatable manner using the standard drawing method. To address this problem, Foadian et al. investigated a method to affect E and RS through mass flow control in tubes [1]. This was accomplished as the die was tilted or the tube was moved off center before entering the die. They showed that depending on the alignment of the maximum/minimum wall thickness in the tube, this method is able to reproducibly decrease or even increase E. In addition, Foadian et al. [2] investigated the influence of the die tilting (0° and ±5°) during the tube drawing process on the development of RS by neutron diffraction for as-received copper tubes, both in the drawing zone and on the leaving side. Their findings showed a significant shift of the RS in the direction of compression for the tubes drawn with a −5° tilting angle.
During plastic deformation, crystal rotation occurs, altering the microstructures and crystallographic textures of the materials. Texture in a polycrystalline material describes the distribution of the crystallite orientation. The mass flow, on the other hand, is the outcome of interactions among some process conditions such as temperature, microstructure, and time. It has also been well established that texture development is strongly influenced by the microstructure [3,4]. Therefore, in order to recognize the flow of mass and thus understand the variation and evolution of RS and E, it is necessary to understand the evolution of crystallographic orientation. A thorough knowledge of texture development during the process of deformation is indispensable. This is because the deformation texture not only plays an important role in determining the various material properties but can also significantly influence the recovery and recrystallization behavior. Furthermore, texture analysis can help to understand the deformation mechanisms [5].
In processes where the plastic strain near the surface differs from that in the interior, a texture gradient across the thickness may occur, especially in rolling and drawing with small reductions, resulting in texture inhomogeneity [6]. One of the most influential factors in developing the local texture is the inhomogeneity of mass flow over the tube’s circumference. This results from eccentricity and leads to the development of a complex RS pattern, which affects the materials’ behavior. Therefore, to better understand the material property, texture evolution studies and anisotropic behavior in drawn tubes seem essential. It also helps control the properties and the process [7,8,9,10,11]. Al-Hamdany et. al. studied the texture gradient in copper tubes along the thickness. They showed that both global texture and texture gradient are affected by the thickness of the wall [7]. In another study, the texture evolution of Al-6063 tubes was investigated by Cho et al. during the drawing process. Their results indicated that the severe texture gradient of hot extruded tubes decreased after cold drawing [8].
It has been demonstrated that the average texture of the material can affect different material properties, such that the influence of texture in many cases has been reported to be up to 20–50% of the property values [12]. It has been shown, for example, that the crystallographic direction can result in the anisotropy of the elastic properties [13].
The macroscopic texture is a statistical measurement showing the orientations of the individual grains in a material without taking the spatial position into account. Microscopic texture, on the other hand, determines the orientation of each individual grain in a grain population. It includes the type and degree of misorientation of the grain in relation to its nearest neighbors [6].
Truszkowski et al. [14] investigated the influence of flow characteristics on texture inhomogeneity in the rolling process. They showed that the work hardening exponent and yield strength have a decisive effect on the texture heterogeneity; the higher flow characteristics lead to less shear deformation and, as a result, less heterogeneity in texture. The texture inhomogeneity in cold-drawn wires was analyzed by Bunge and Schläfer [11] by the neutron scattering method. An inhomogeneity in texture from the central axis to the outer surface was observed, in which an axial was detected at the center; however, a rolling-type one was at the outer surface.
Brokmeier et al. [9] investigated the changes in the texture gradient at the maximum and minimum wall thicknesses of the copper tubes. Their results show that the strongest texture forms on the outer surface and a much weaker one in the middle region of the tube. Al-Mg-Si alloy tubes were analyzed for deformation and annealing texture using the EBSD method by Park and Lee [15]. Their observations showed that after drawing with a thickness and diameter reduction of 30% and 10%, respectively, the orientations {111}<001> and {112}<111> were the dominant components.
The texture of hot extruded aluminum tubes followed by cold drawing was investigated by Cho et al. [8]. According to their results, a strong texture gradient was observed moving from the midplane to the wall surfaces. This texture gradient, however, became less pronounced after cold drawing.
Chen et al. [16] investigated the evolution of global texture for cold-drawn copper wires using diffractometry and EBSD. The results showed the formation of <111> and <100> duplex fiber textures, whereas the intensities grew as the strain increased. Using neutron and synchrotron diffraction techniques, Carradò et al. [10] investigated how RSs and texture developed in drawn copper tubes.
In previous studies [1,2], it was shown that it is not only possible to control the eccentricity with a tilted die in the tube drawing process but also to reduce the resulting RS at the surface and through the tube wall thickness. Therefore, this work aims to study the possible influence of these parameters on the crystallographic evolution during drawing using a die with a −5° tilting angle. For this purpose, the micro- and macro-texture of the tubes were analyzed before and after two drawing steps with a tilted die at different wall thickness positions.

2. Materials and Methods

2.1. Materials

Annealed copper deoxidized phosphorus tubes (Cu-DHP—ASTM B75) with original dimensions of 65.0 × 5.5 mm2 (outer diameter × wall thickness) were used. As given in Table 1, the drawing of Cu tubes was conducted in two steps. The final dimension of the tubes, deformation, and the geometrical information of the tools are listed in Table 1, too. For ease of use, the area with the maximum (minimum) wall thickness will be called max (min) in this study. Figure 1 illustrates the microstructure of the as-received as well as the drawn tubes at max and min positions. As can be seen, the microstructures are equiaxed recrystallized grains containing annealing twins. The average grain size of the as-received sample at max and min is the same with 47.1 ± 4.0 µm and 48.3 ± 6.1 µm, respectively.

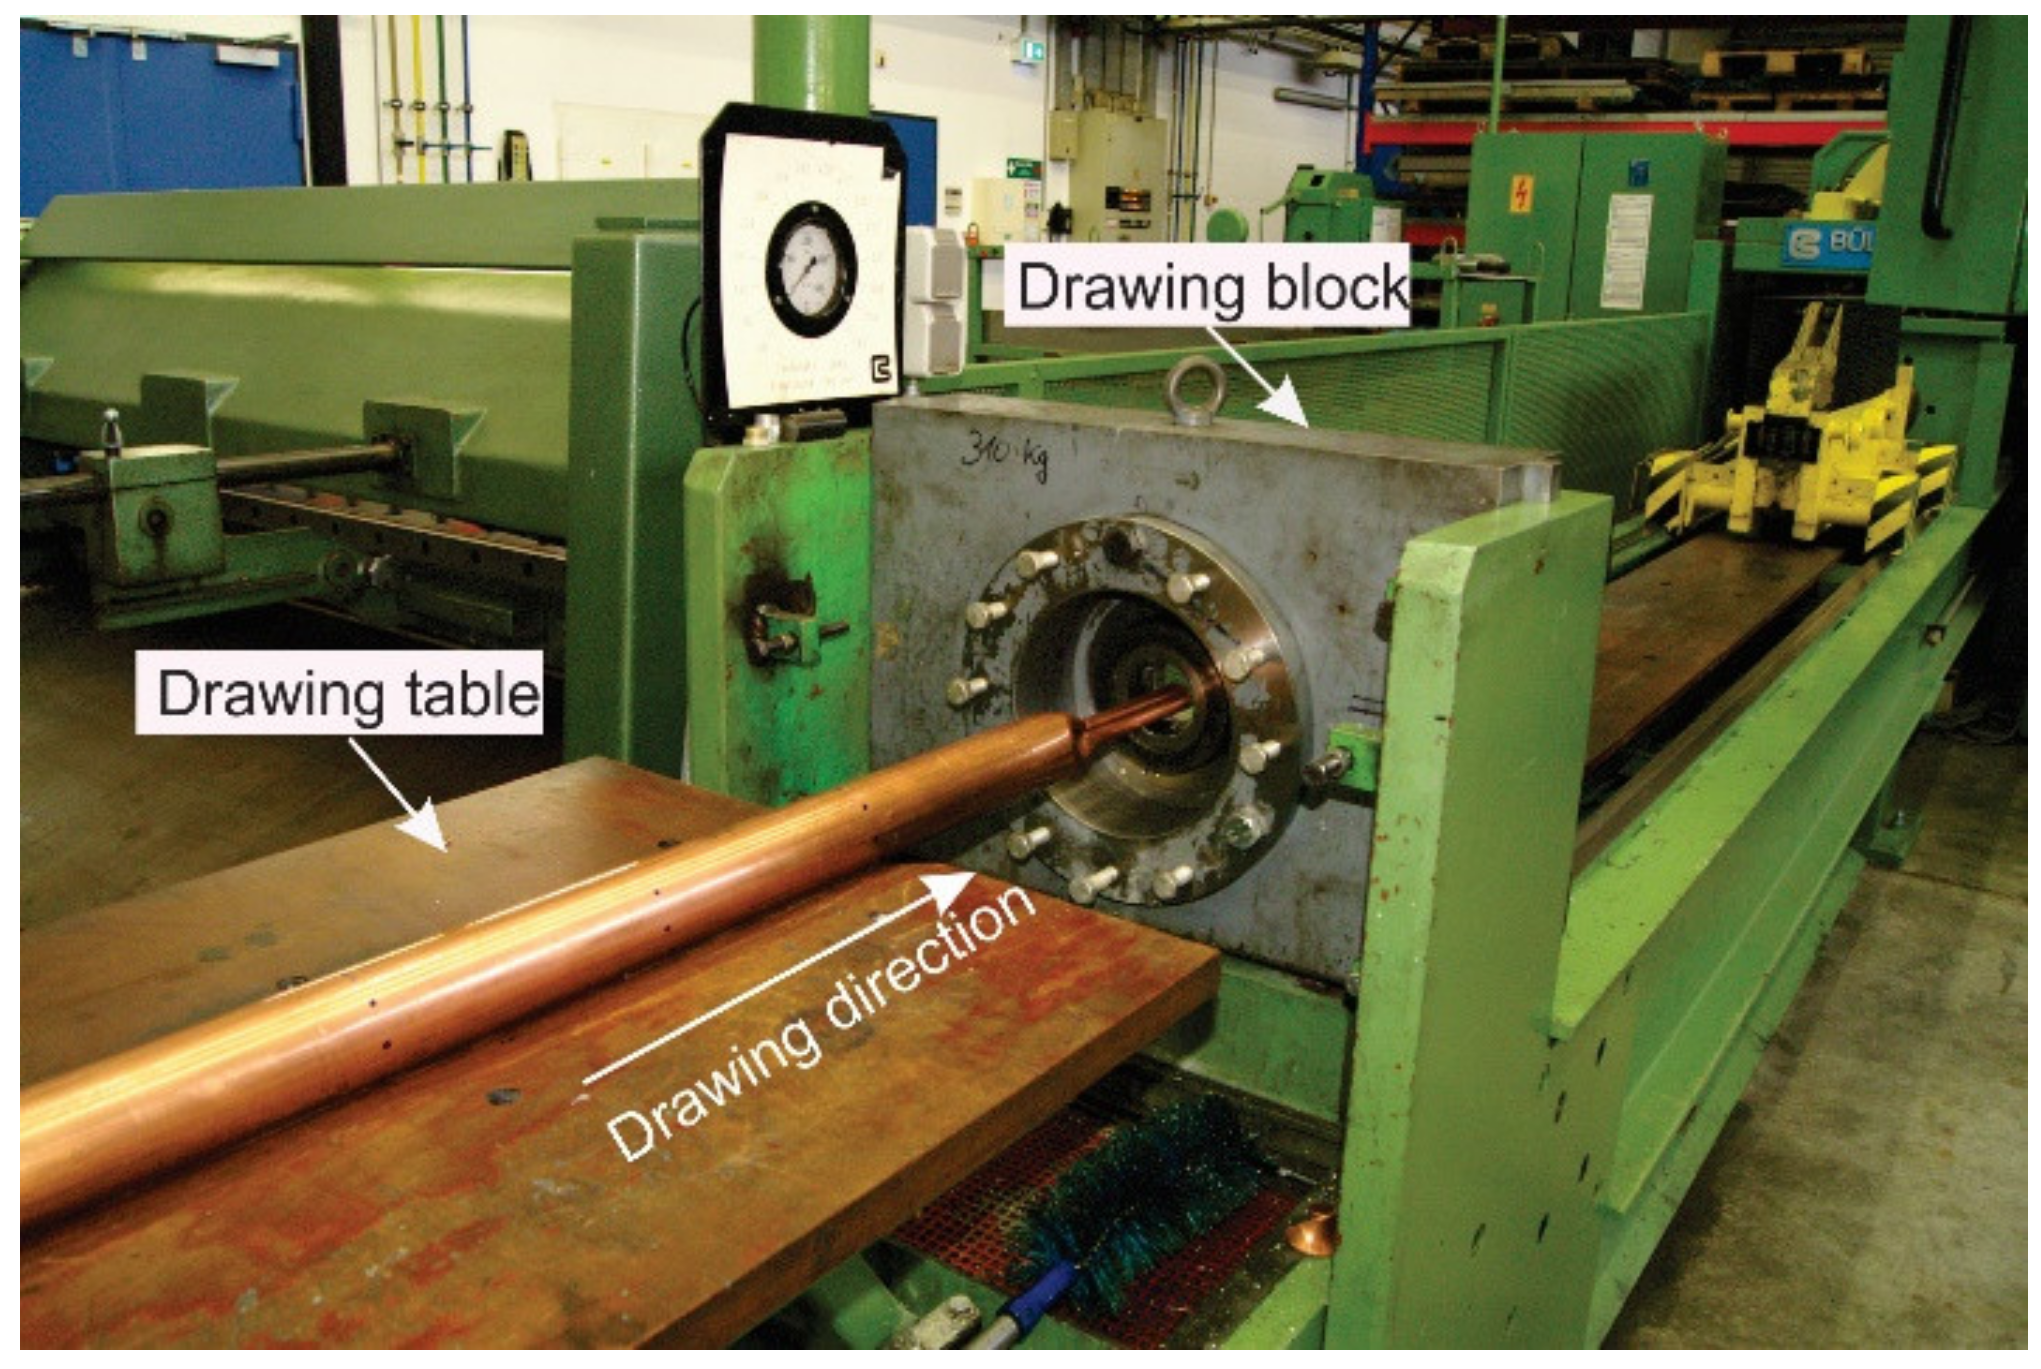
2.2. Drawing Process

The drawing process was performed using a laboratory 2500 kN hydraulic tube drawing machine with a fixed plug, as shown in Figure 2. The drawing speed was between 5 and 30 m/min. An inner clamping system was used for the drawings. For tilting, a die holder with a fixed tilting angle was used. Moreover, a set-up with an in-line system for eccentricity measurement and setting the tilting angle was used, as introduced in previous studies by the authors [1,2].

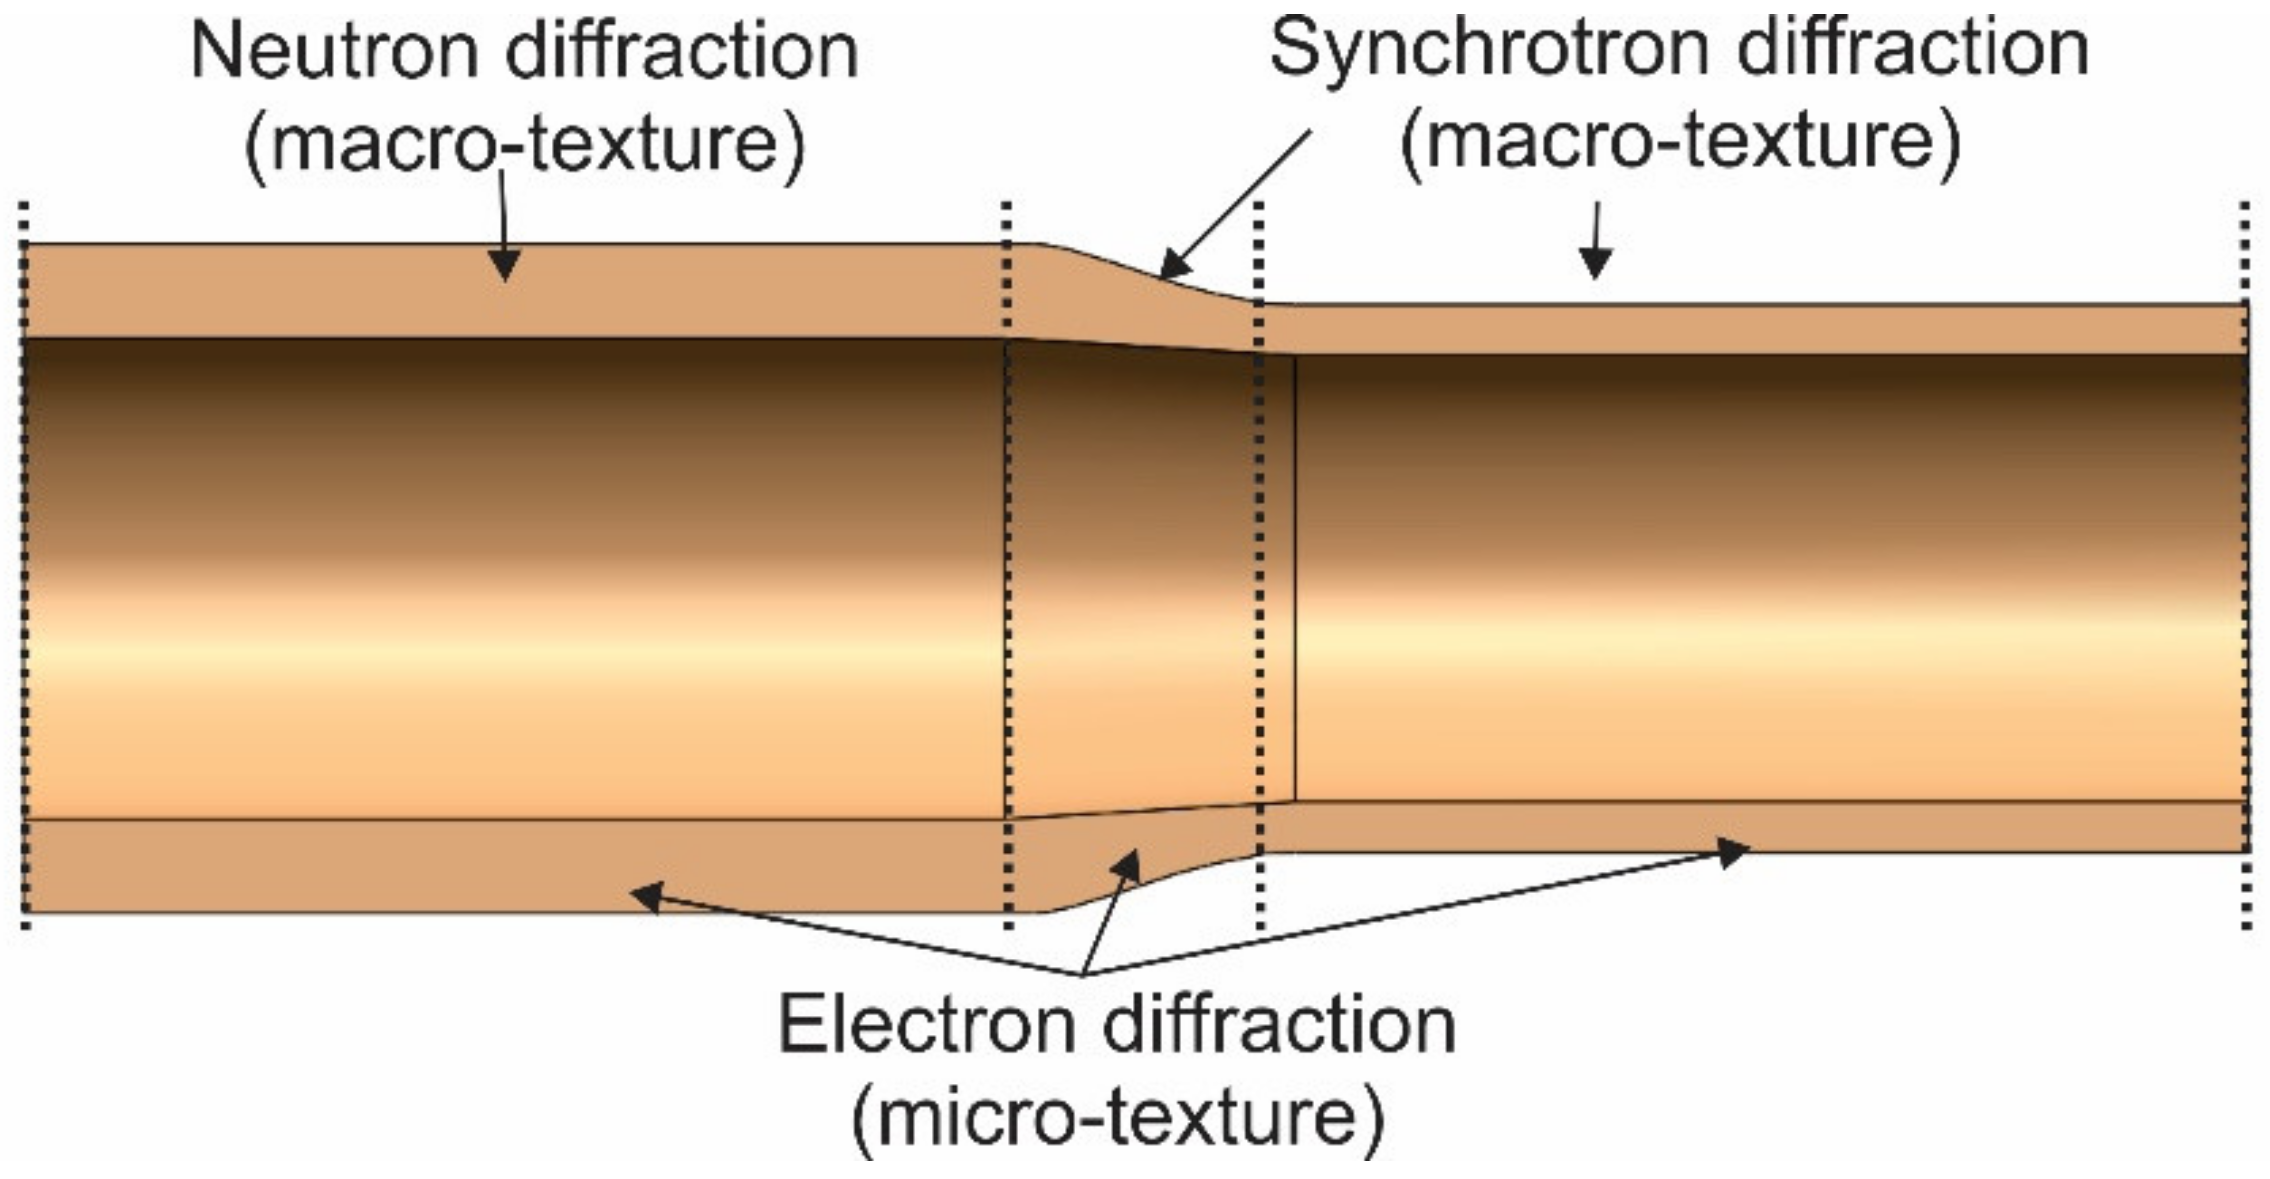
2.3. Texture Analysis

The global texture changes of the copper tubes were measured using two techniques of neutron and synchrotron diffraction methods at different positions during the drawing steps by interrupting the drawing process to get a so-called Interrupted Drawn Tube (IDT), as shown schematically in Figure 3. Three different zones were analyzed in this IDT: the as-received position, the deformation zone, and after drawing. The coarse grain size of the as-received tubes makes it unsuitable for using the synchrotron diffraction method as it does not have a sufficient number of grains in the sample gauge volume (SGV). For this reason, it was measured using neutron diffraction. However, the deformation made the grains fine enough to be analyzed by the synchrotron diffraction technique. In addition, the local textures have been measured by both the synchrotron and electron diffraction techniques (as shown in Figure 3).
Samples were taken from the as-received and the drawn tubes without and with tilting angles of ±5° at three positions of max and min to be evaluated for texture development.

2.3.1. Texture Measurements by Neutron Diffraction

Neutron diffraction measurements were performed using the STRESS-SPEC instrument at Heinz Maier-Leibnitz (FRM II) [17]. Pole figure determinations were carried out with an Eulerian cradle Huber 512. Cubic samples with dimensions of 10 × 10 × wall thickness (mm3) were analyzed. Three similar samples were glued together to provide a sufficient thickness for the neutron measurements. A neutron wavelength of 1.565 Å was used for the measurements obtained from a Ge (311) monochromator.

2.3.2. Measurements of Texture with Synchrotron Diffraction

Texture measurements were performed ex situ using the HEMS-P07B instrument at the German Electron Synchrotron (DESY), which has an X-ray beam with a wavelength of 0.142441 Å and a size of 0.5 × 0.5 mm2 for the local texture measurements. The distance between the sample and the 2D Perkin Elmer (PE) detector was 1123 mm. The PE detector had a resolution of 0.2 mm and a diameter of 416 mm. The azimuthal rotation (phi) was driven from -90° to 90° in steps of 5° with an exposure time of 3 s for every step. The samples were fixed on a pin and mounted on the ω-rotation stage, in which the drawing direction pointed in the direction of the detector. LaB6 was used for the correction of the data.
Averaging the measured data for the different positions was used to calculate the global texture variation. To calculate the ODF, the PFs {111}, {200}, and {220} were used with the degree of series expansion Lmax = 23. The ODF calculation was performed with triclinic sample symmetry because of the lower sample symmetry.

2.3.3. Texture Measurements by Electron Diffraction

The electron diffraction method with the EBSD technique was also used for the measurement of micro-textures. The samples were taken from the axial/radial plane at the max and min positions. Scanning electron microscope Tescan Vega II XMU with Digiview III type EBSD camera with forward scatter detector (FSD) was used. The scan size was 800 × 550 µm2 with a step size of 0.3 µm. The scan voltage was 30 kV, the probe current was 127 pA, and the probe size was 0.3 µm. Using Orientation Imaging Microscopy (OIM) data acquisition software V5.31 and OIM analysis software V5.31, as well as MTEX 3.5.0 software, data processing was performed.

3. Results and Discussions

The crystallographic evolution was studied to obtain an understanding of the probable anisotropic characteristics of the tubes during the drawing process with and without a tilted die and to analyze the evolution of new crystallographic orientations during drawing with tilting. In this context, the influence of tilting on texture development was investigated by comparing various crystallographic orientations before and after drawings utilizing macro-texture. To find any possible texture inhomogeneities over the tube wall thicknesses, micro-texture was investigated.

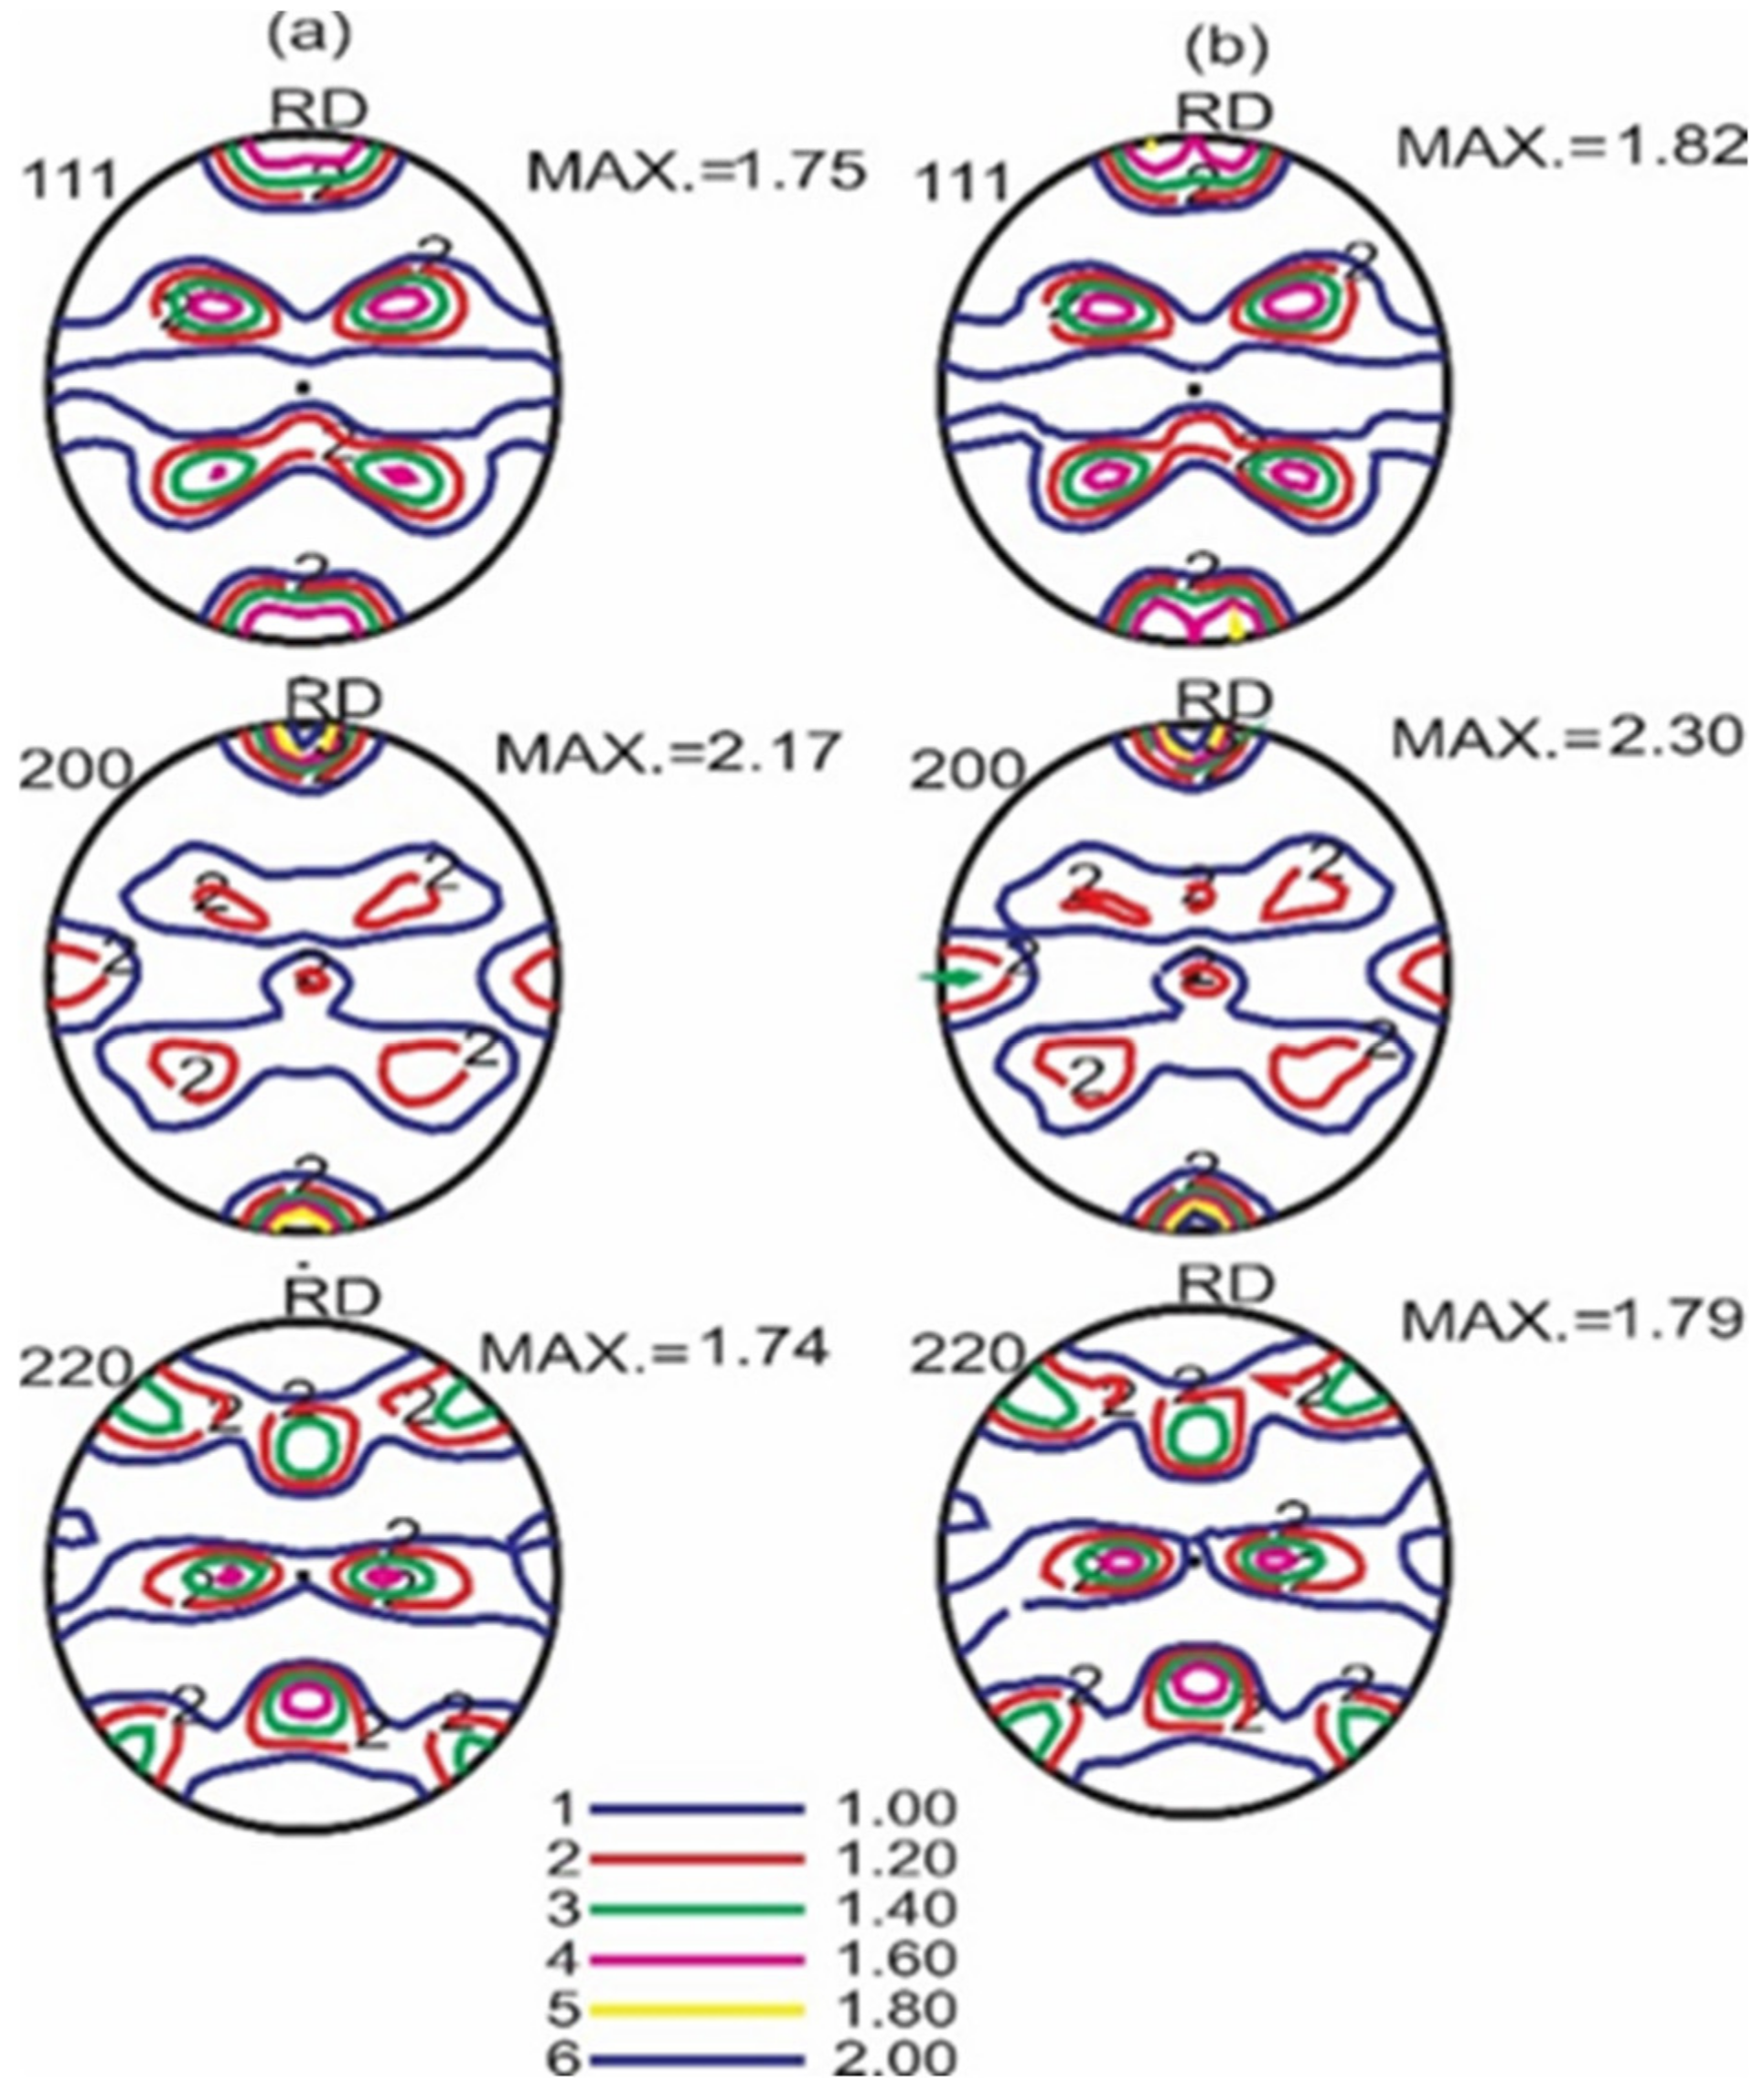
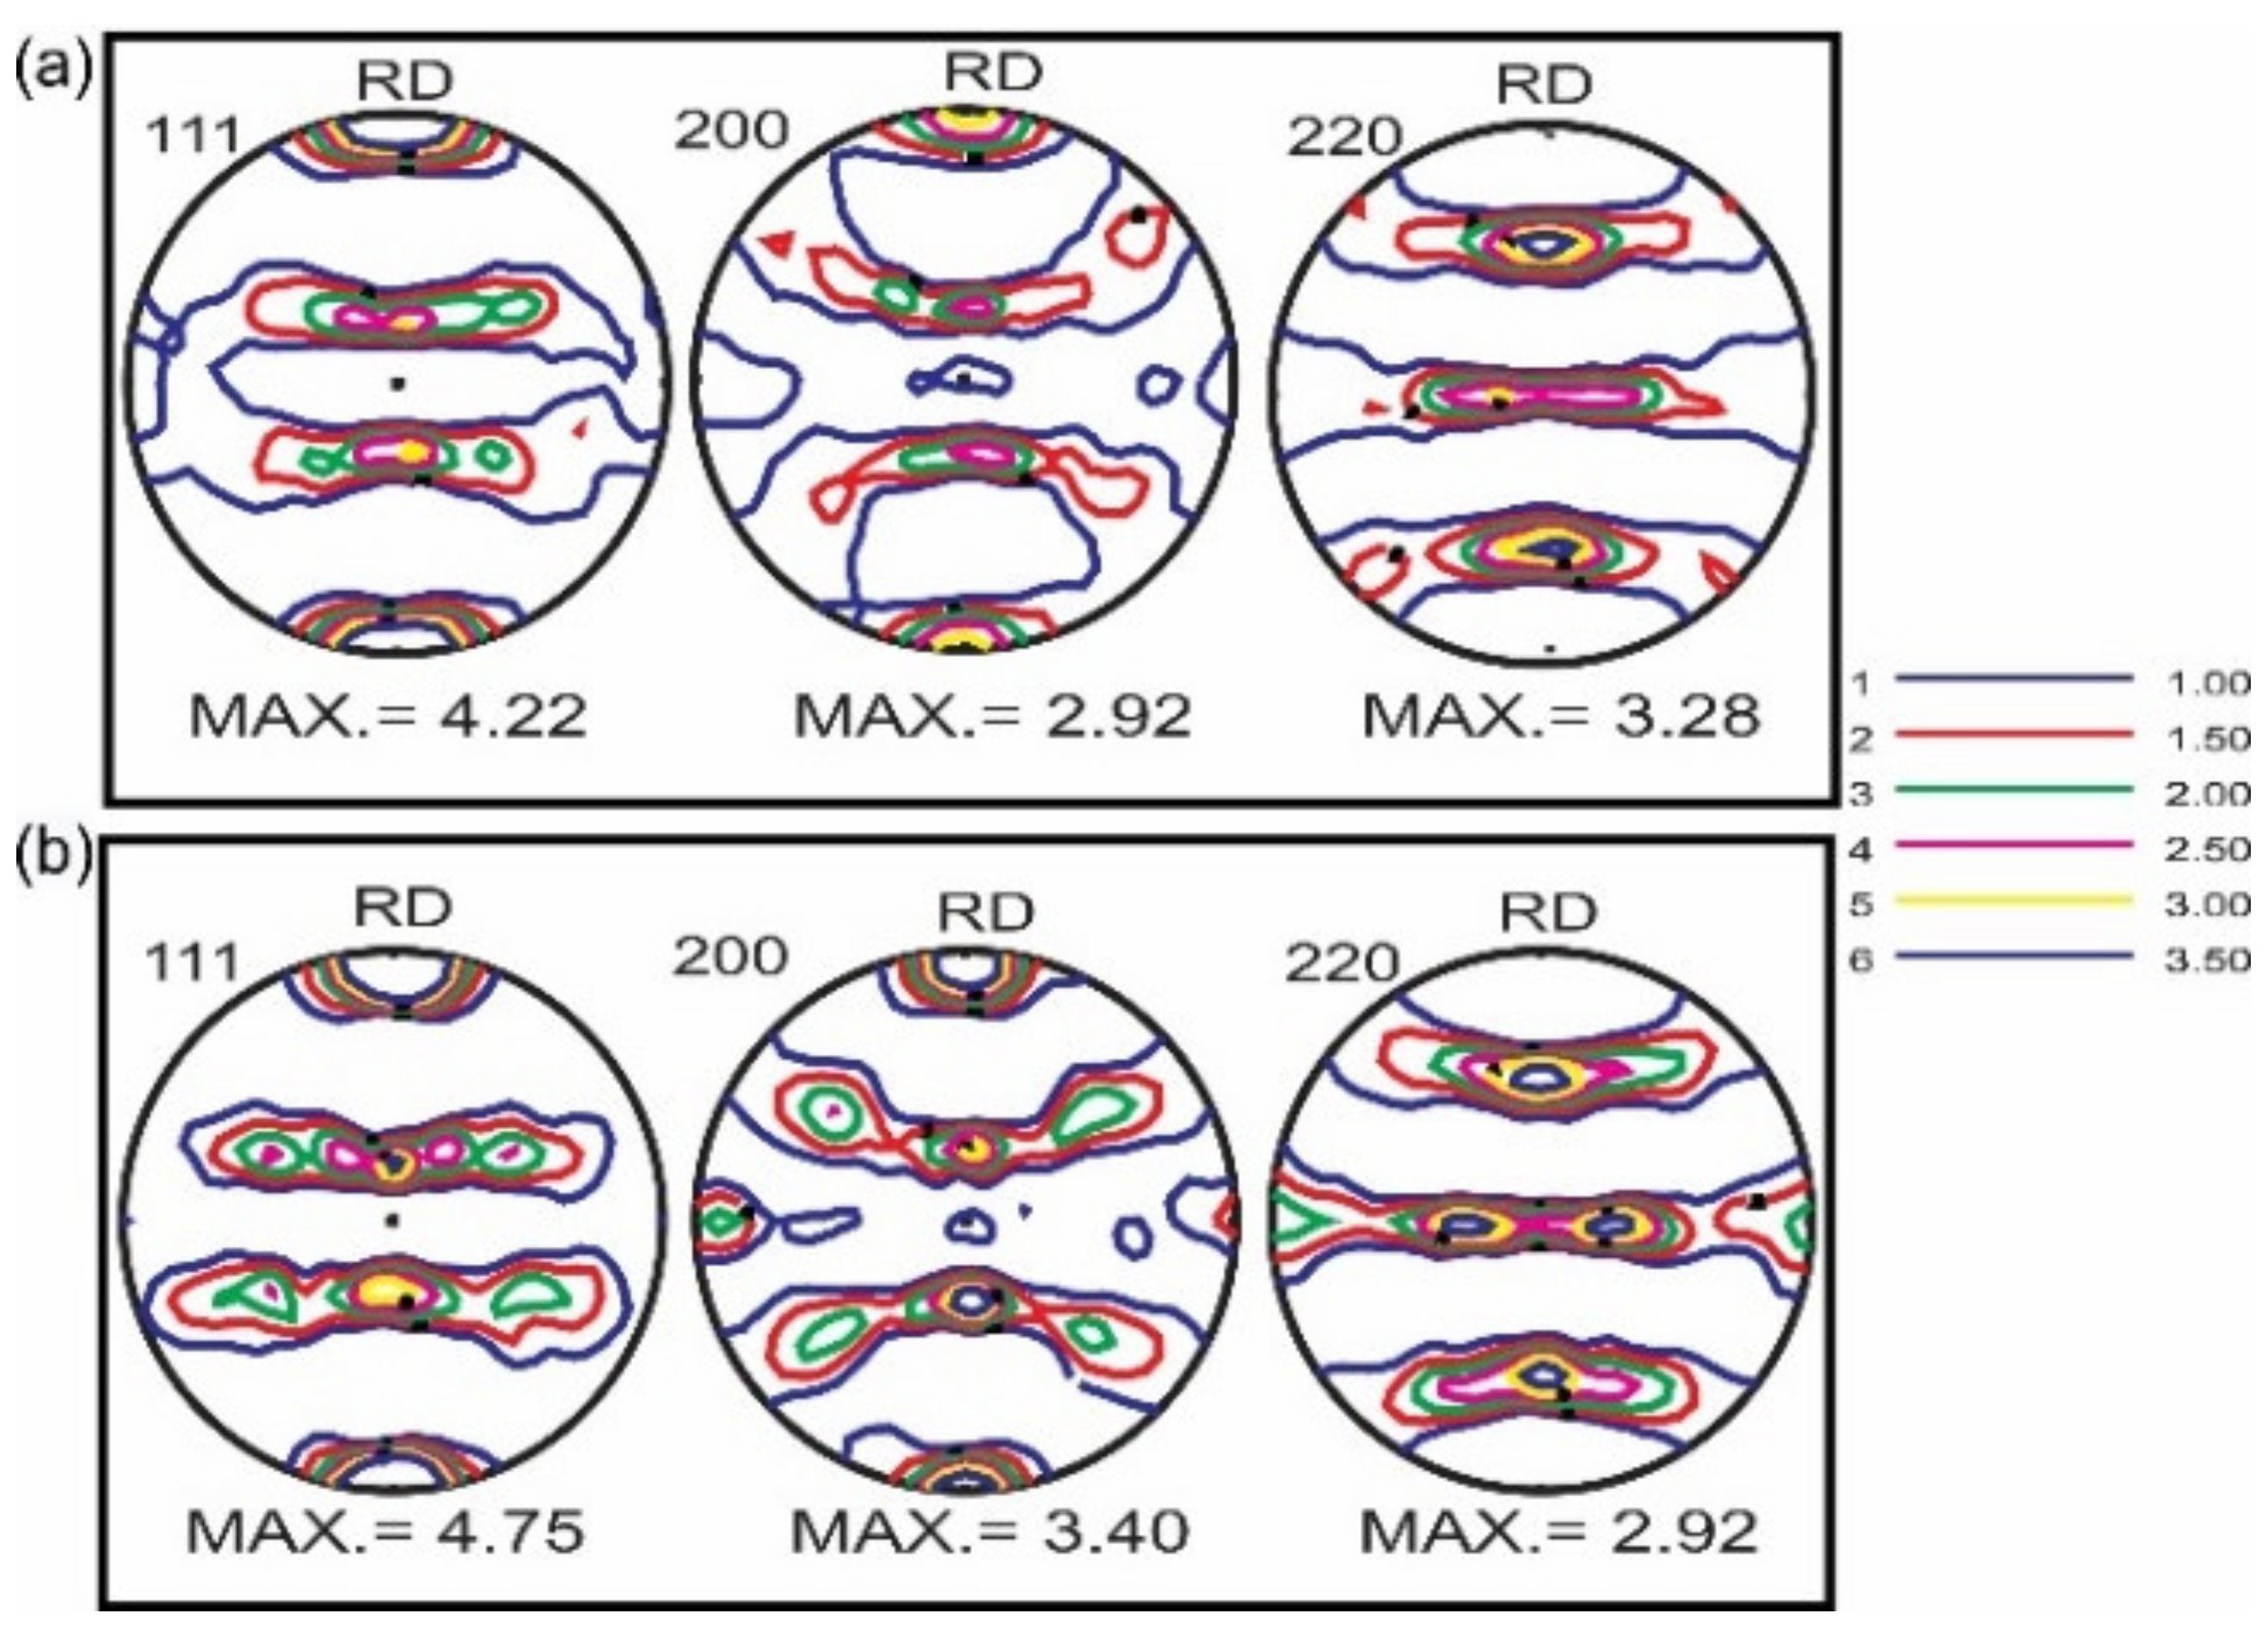
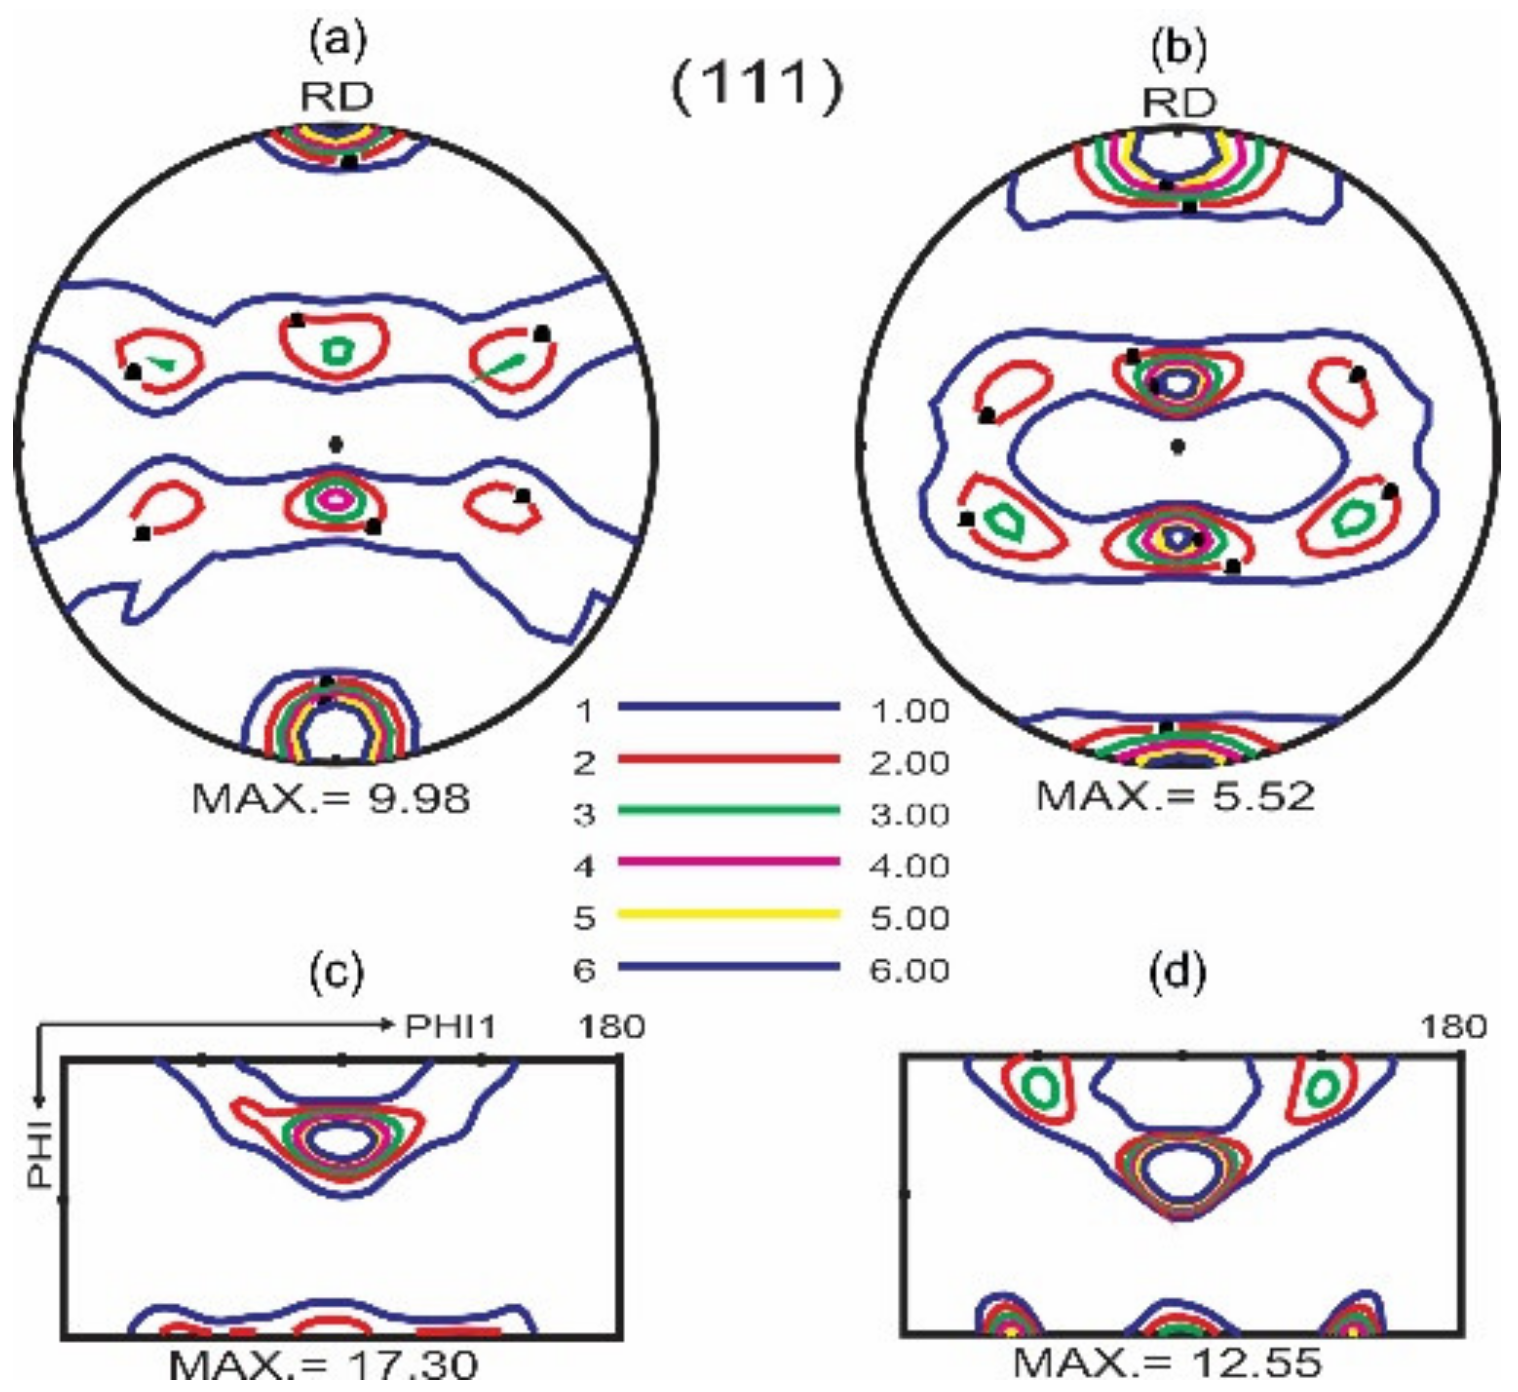
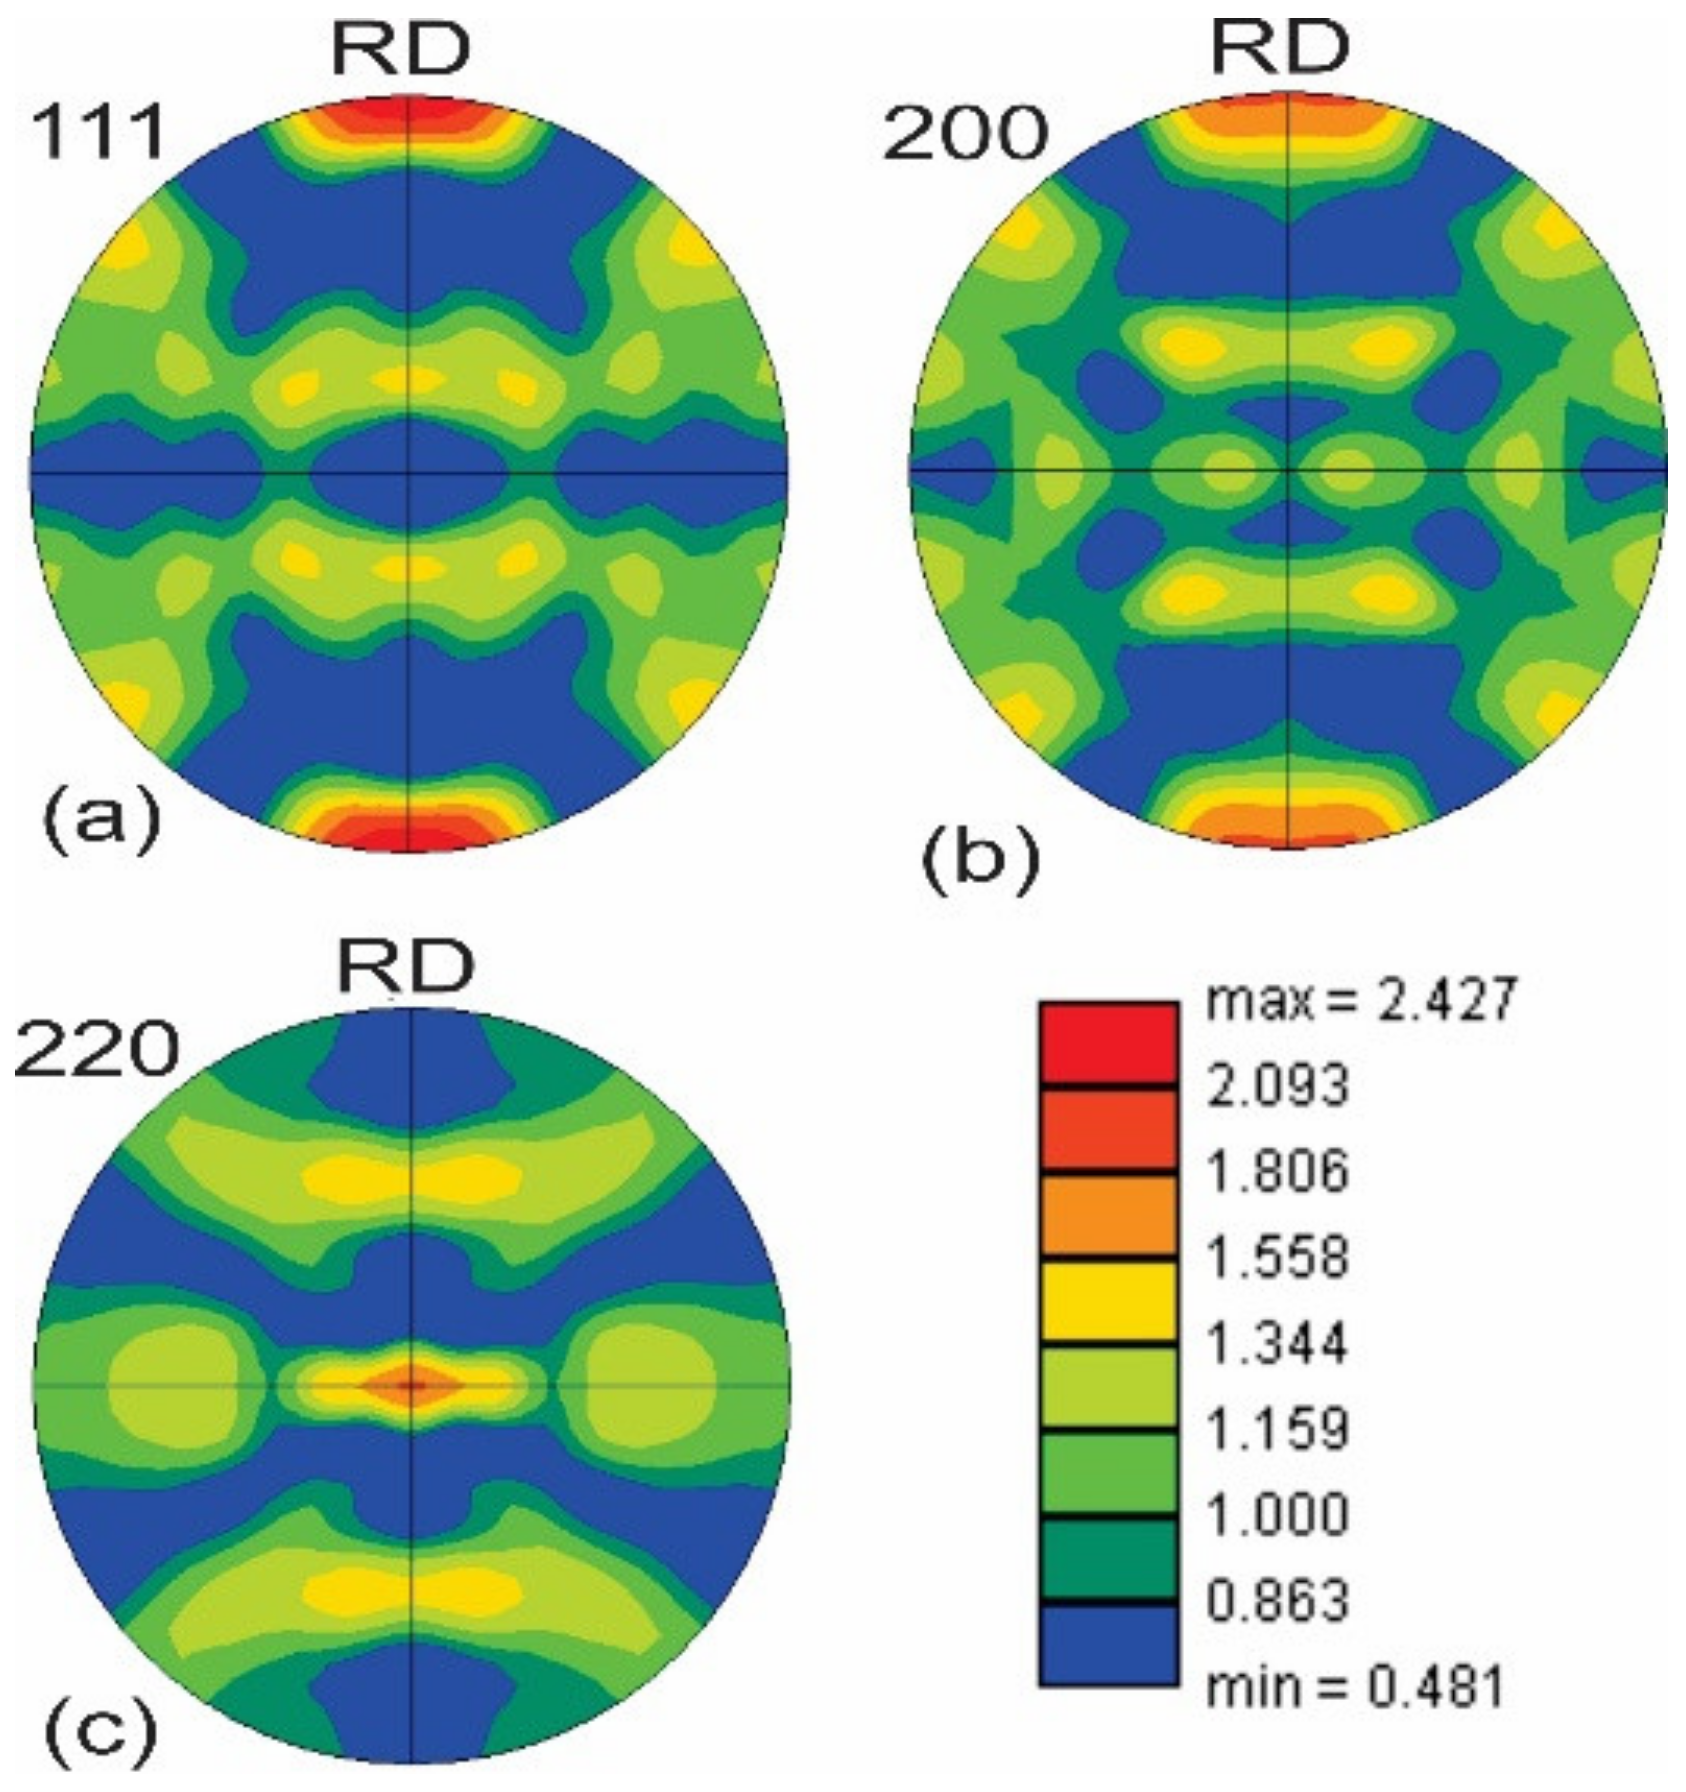
3.1. Macro-Texture Analysis

3.1.1. As-Received Tubes

Figure 4 shows (a) and (b) 111 , 200 and 220 PFs at max and min positions of the tubes in the as-received condition. Following the volume and anisotropic absorption corrections, the PFs are plotted to depict the samples’ global texture. They exhibit the same shape and almost the same density in both positions. This could be expected of the annealing pre-treatment.
When the PFs at the max and min positions of the as-received tube (Figure 4) are compared to the findings of heat-treated Cu samples at 400 °C by Suwas et al. [19], the PFs have the same shape. The cube component 001 < 100 > is also the most dominant in both figures, as described by Engler and Randke [20].
This is typical of the recrystallization texture in materials such as Al, Ni, and Cu that have a medium to high stacking fault energy (SFE) level [19]. Heat-treated and deformed PF have a cube-shaped texture due to the cube-shaped nuclei resulting from the band-like pattern. The deformed grains that still have a cube orientation make up the majority of the bandlike structure or cube bands. Given their ideal conditions for growth into the deformation texture, this orientation will predominate primarily during the following growth [21]. Twin orientations are also visible in the PFs of the as-received tube, confirmed by microstructural analysis as shown in Figure 1. However, this twin orientation is weaker than the cube one.
Pure metals with a medium to high SFE primarily exhibit a copper-type deformation texture (pure type). The SFE will be lower when alloying elements are present, as they are in brass or austenitic steel, indicating an alloy-type texture. Deformation twinning occurs in these materials and leads to the formation of enormous shear bands, which alter the evolution of the deformation texture [22].
The ODF φ 2 sections of the as-received samples at max and min positions were calculated based on the use of 111 , 200 and 220 pole figures. The calculated ODF sections for different φ 2 angles at max and min positions are shown in Figure 5a,b, respectively. It is worth mentioning that sections 0° and 45° show the cube, copper (Cu), and brass (Bs) components, which are the most important components in the deformation processes. As a result, only these two components are typically mentioned in most cases. Figure 5c,d illustrates the 0° and 45° sections of the achieved ODF for max and min positions and detected components. The cube and Bs components are detected in the 0° range of the received tube in max and min positions. However, the Cu and Bs orientations can be observed in the 45° section (Figure 5d). As stated by Wassermann et al. [23], the rolling texture of pure copper and brass also contains the Bs components in the 0 ° section and the Cu component in the 45° section. In the 65° section of the rolling texture, the S components were seen to be in virtually the identical visual location as the Cu component in the 45° section.

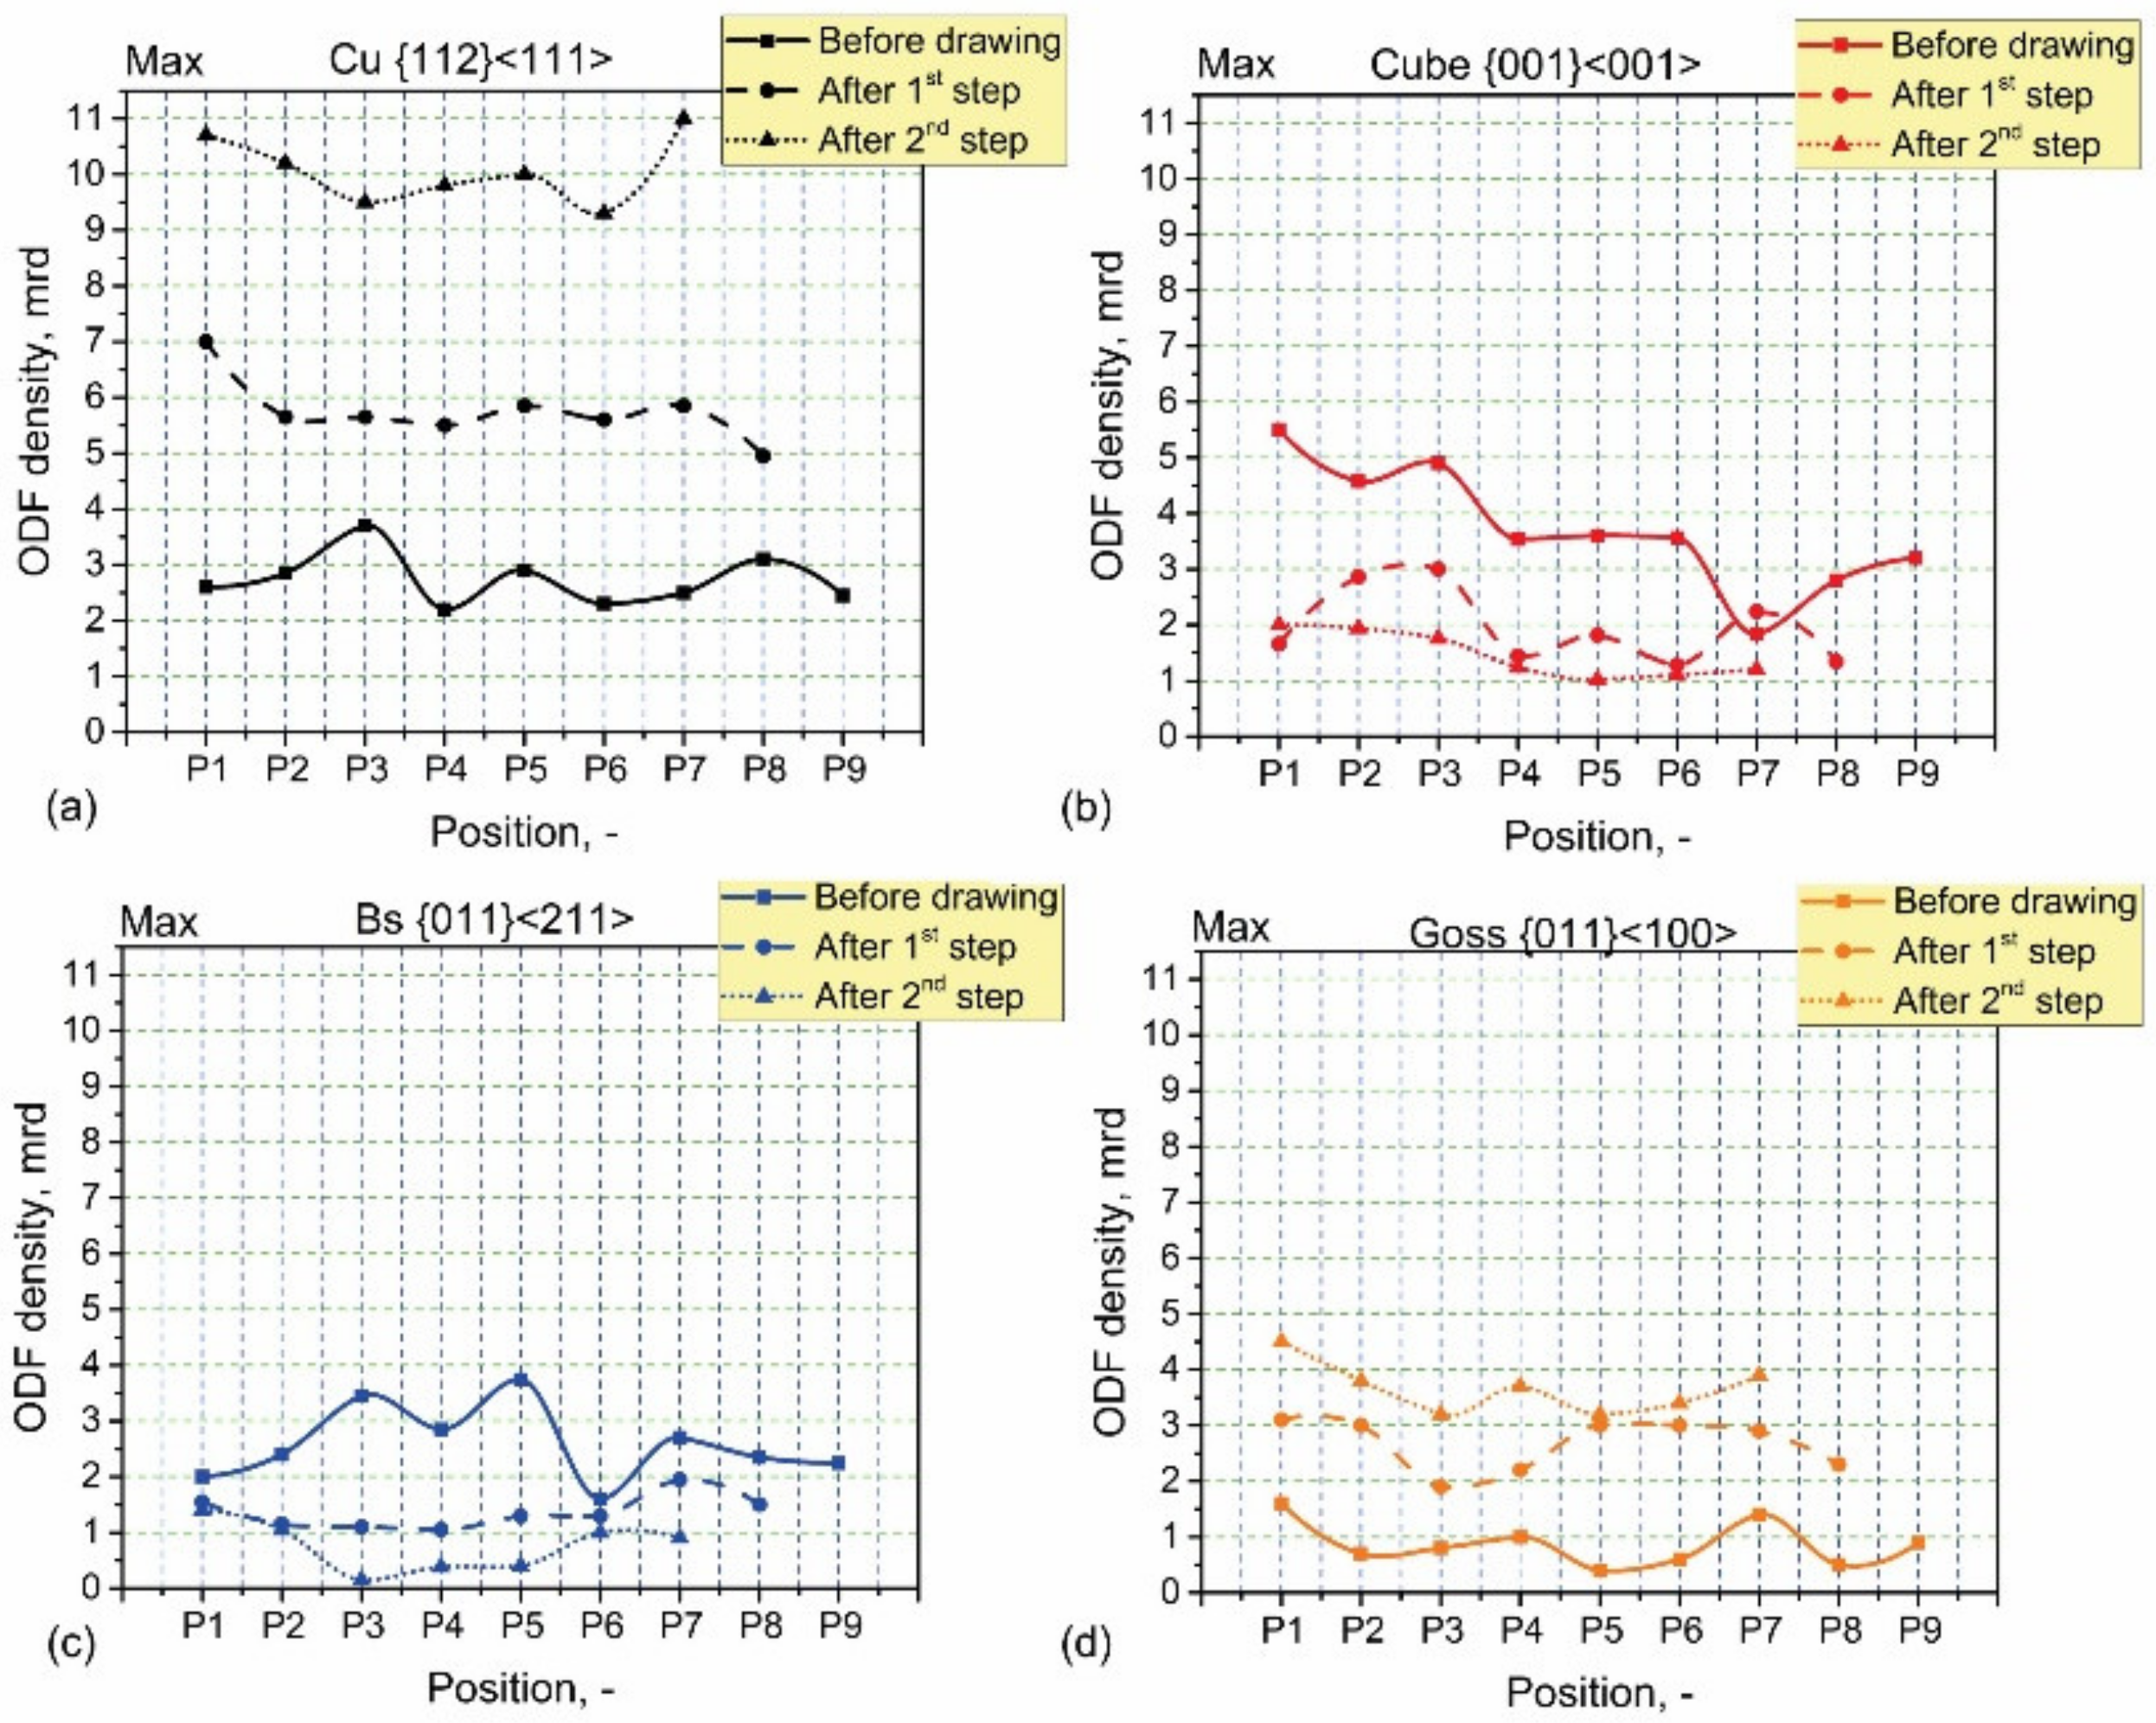
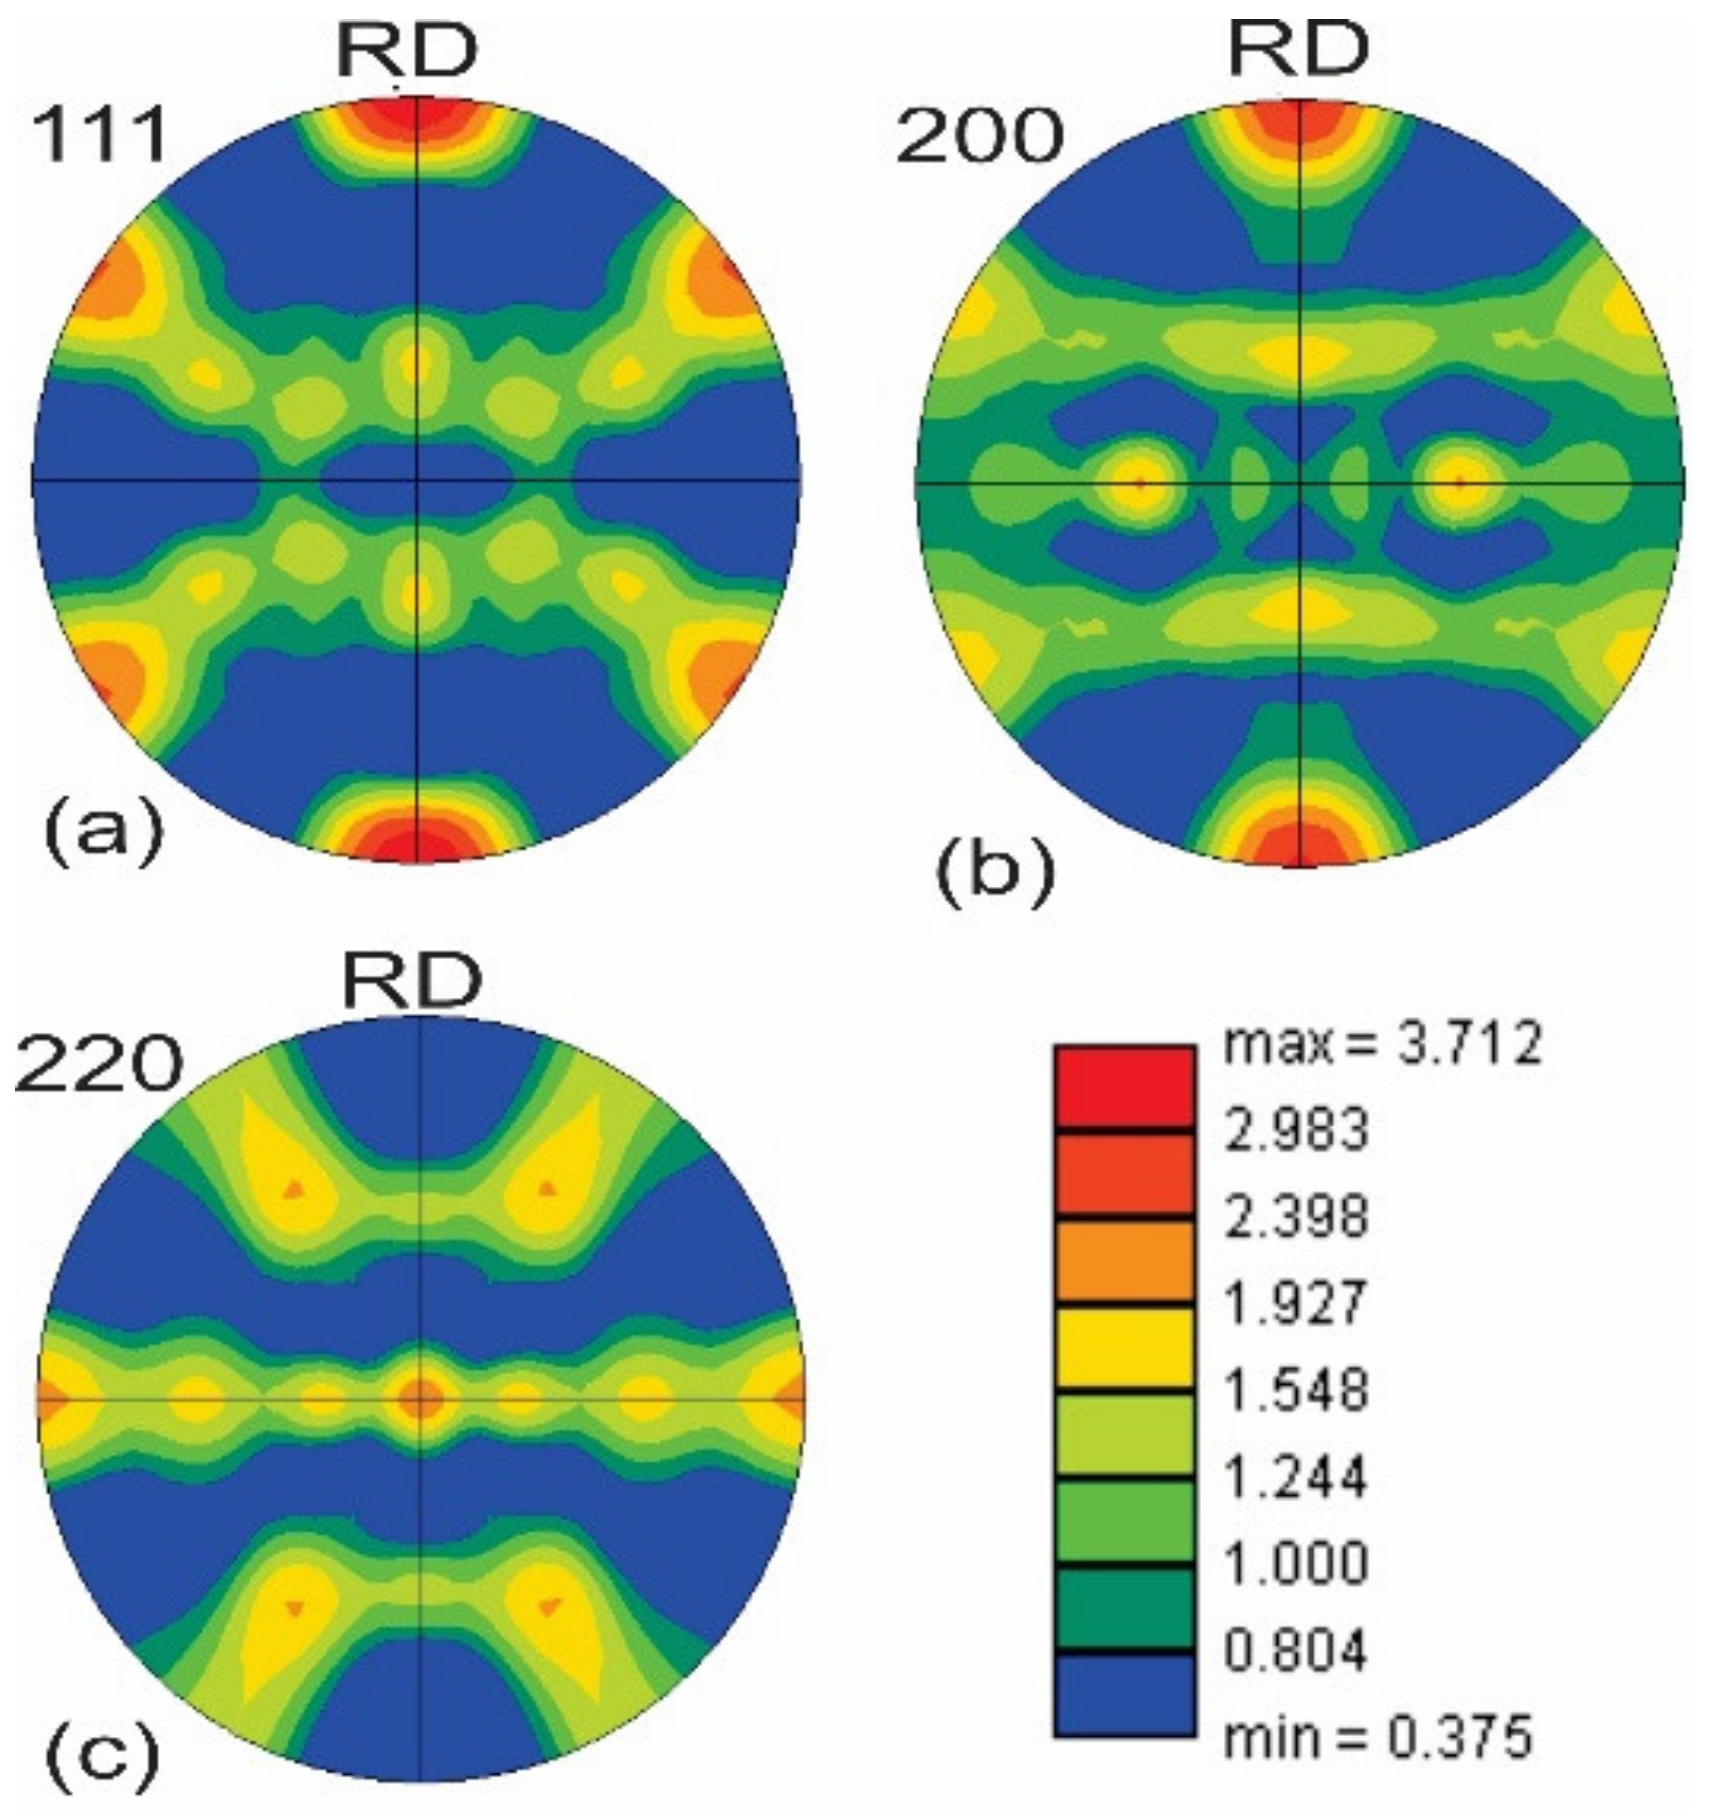
3.1.2. Texture Development following the First Drawing Step

The {111}, {200}, and {220} PFs of the samples drawn with a tilt angle of −5° at the max and min positions are shown in Figure 6a,b, respectively. The cube orientation, which was predominant in the initial tube, almost completely disappeared in the deformation texture after the first drawing step due to its optimal growth conditions. Furthermore, it is obvious that the Cu orientation has taken over as the dominant orientation. Comparing PFs at the max and min sides reveals that both sides have nearly identical PFs across all three planes. The cube component on the min side has fully disappeared; however, there are still some on the max side. This is the only difference between max and min positions. This issue is most likely caused by the varied paths and degrees of deformation on these two sides. Both sides have nearly identical PF densities.
The tubes drawn with a +5° tilting angle are subjected to the same comparison as the max and min sides (Figure 7a,b). There is no noticeable change between the two sides, and the same components as in the tubes drawn with the −5° tilting angle are visible. The max and min positions of the drawn tube with the −5° tilt angle are shown in Figure 8a,b for the φ 2 = 45 ° ODF sections. Similar to the PF results, these ODFs demonstrate the disappearing cube component. Compared to the as-received tubes, the cube orientation is weaker after drawing, with the Cu orientation being the predominant one. However, the ODF densities at the max and min sides differ slightly, being larger at max. Because of the symmetry in the ODFs, only 0 < 𝜑1 < 180 is presented in the figures.

3.1.3. Texture Evolution after the Second Drawing Step

After the second step of the drawing process, the macro-textures were also examined. The 111 PFs at the max and min positions of the tubes drawn with a −5° tilting angle are depicted in Figure 9a,b. As can be observed, the higher deformation leads to a significant increase in the PF density at max. On the other hand, texture development at max and min is slightly asymmetrical as a result of tilting, which generates a mass flow directionally from one side of the tube to the other.
After the second step, as with the first drawing step, the Cu component is dominating. Comparing the ODFs of max and min demonstrates the same behavior as for the first step. Moreover, the additional deformation of the tube results in a considerable rise in the ODF density in comparison to the as-delivered tube as well as the one-time drawn tube.

3.1.4. Texture Gradient

Another factor that contributes to the inhomogeneity over the wall thickness is the texture gradient. The texture was measured at several points over the wall thickness of each sample using the synchrotron technique to investigate how the ODF density varied. The measurement points across the wall thickness of the tube are shown in Figure 10a, beginning from the outer surface to the inner surface.
As seen in PF results, Figure 10b also shows that the cube component is found to be predominant in the initial tube, but its density changes across the thickness. The outer surface has the highest density, and as expected, it is almost the same at the max and min positions. On the other hand, the Cu component has the same intensity at max and min as the cube component and is essentially constant across the wall thickness.
The Goss and Bs components differ slightly across the thickness in addition to the Cu and cube components. The variation among the four components is shown in Figure 10c,d. The highest ODF density is for the cube component, and the lowest is for the Goss component. There are no significant changes in the Bs and Cu components.
Figure 11 compares the ODF densities of the four main components before and after the first step of drawing with −5° tilting at max and min sides. It reveals that the density of the Cu component at both max and min has significantly increased after drawing, whereas the cube component has decreased (Figure 11a,d). However, their variation is not significant over the wall thickness. Figure 11b,c depicts the variation of the Bs and Goss components. After drawing, the Goss component increased while the Bs component decreased.
Figure 12a–d demonstrates the ODF density variation across the wall thickness at the max side of the tube in different states of as-received condition after the first and after the second drawing step using −5° tilting. The Cu component density increases considerably after each step of drawing, as seen in Figure 12a. The Goss component density also increased after drawing, but not significantly (Figure 12d). However, Bs and cube components diminished following the second drawing step, similar to the first step (Figure 12b,c). In conclusion, aside from some slight variations observed on the max and min sides, no remarkable texture gradient was observed over the wall thickness after drawing.

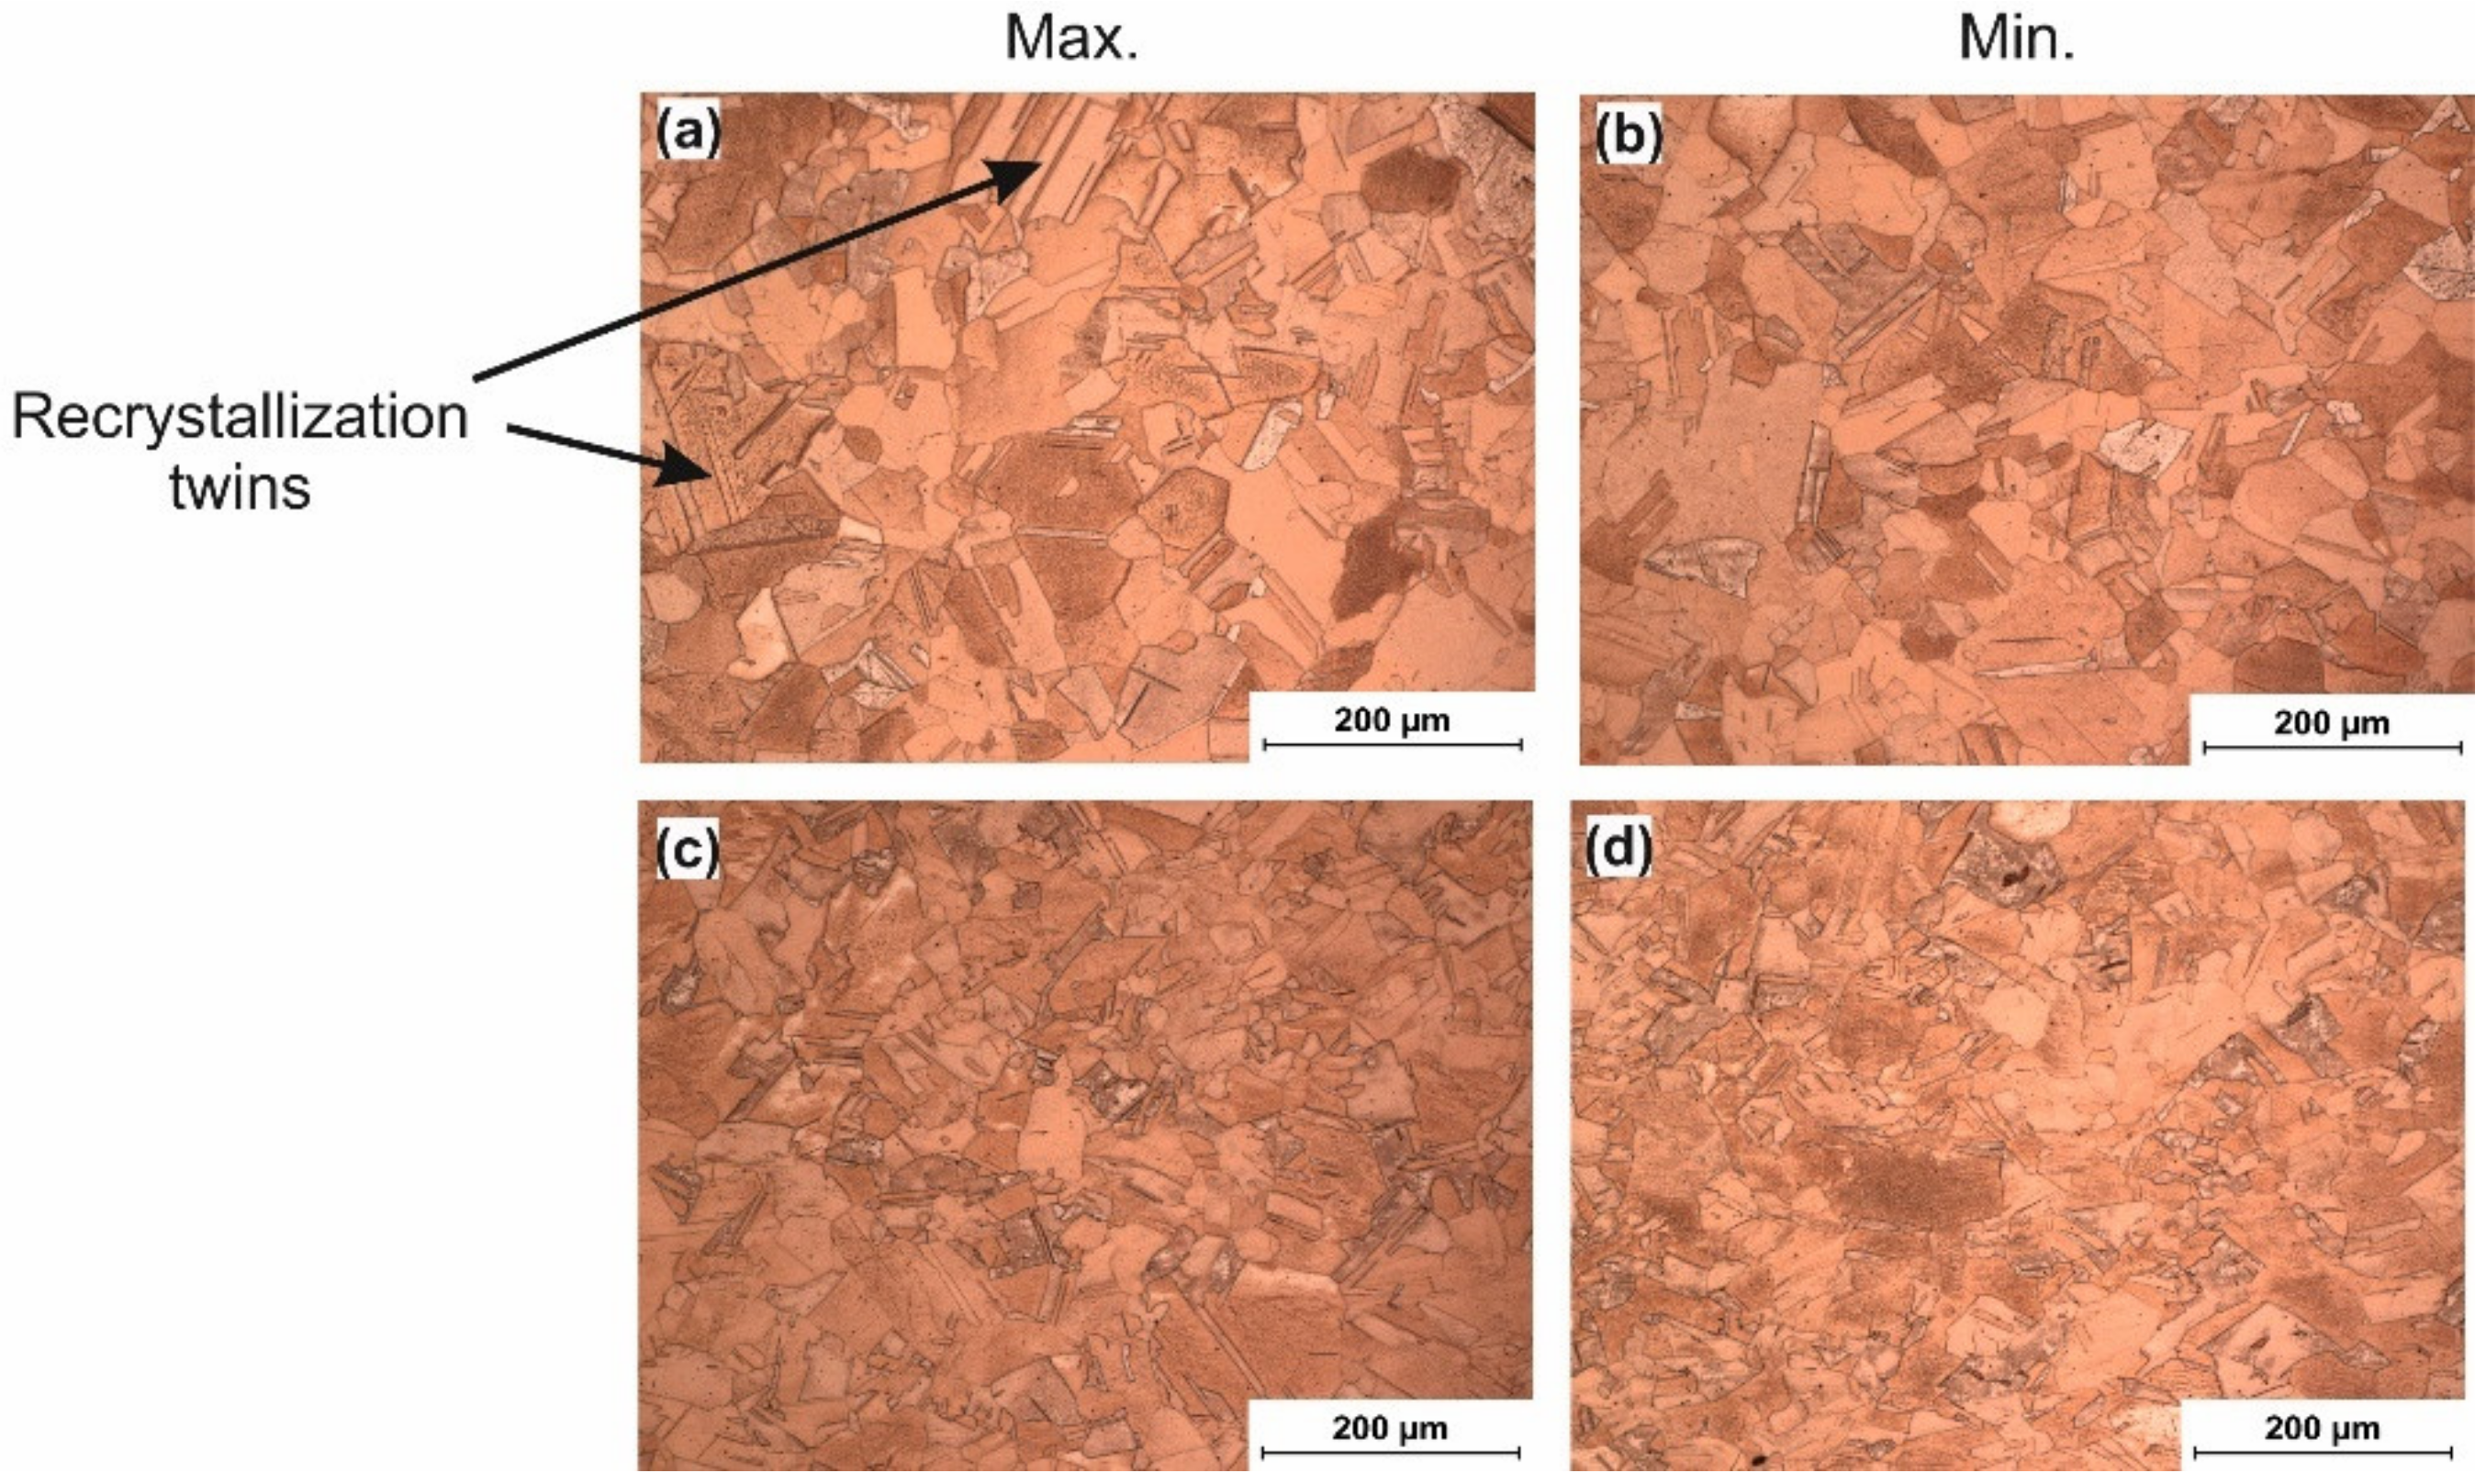
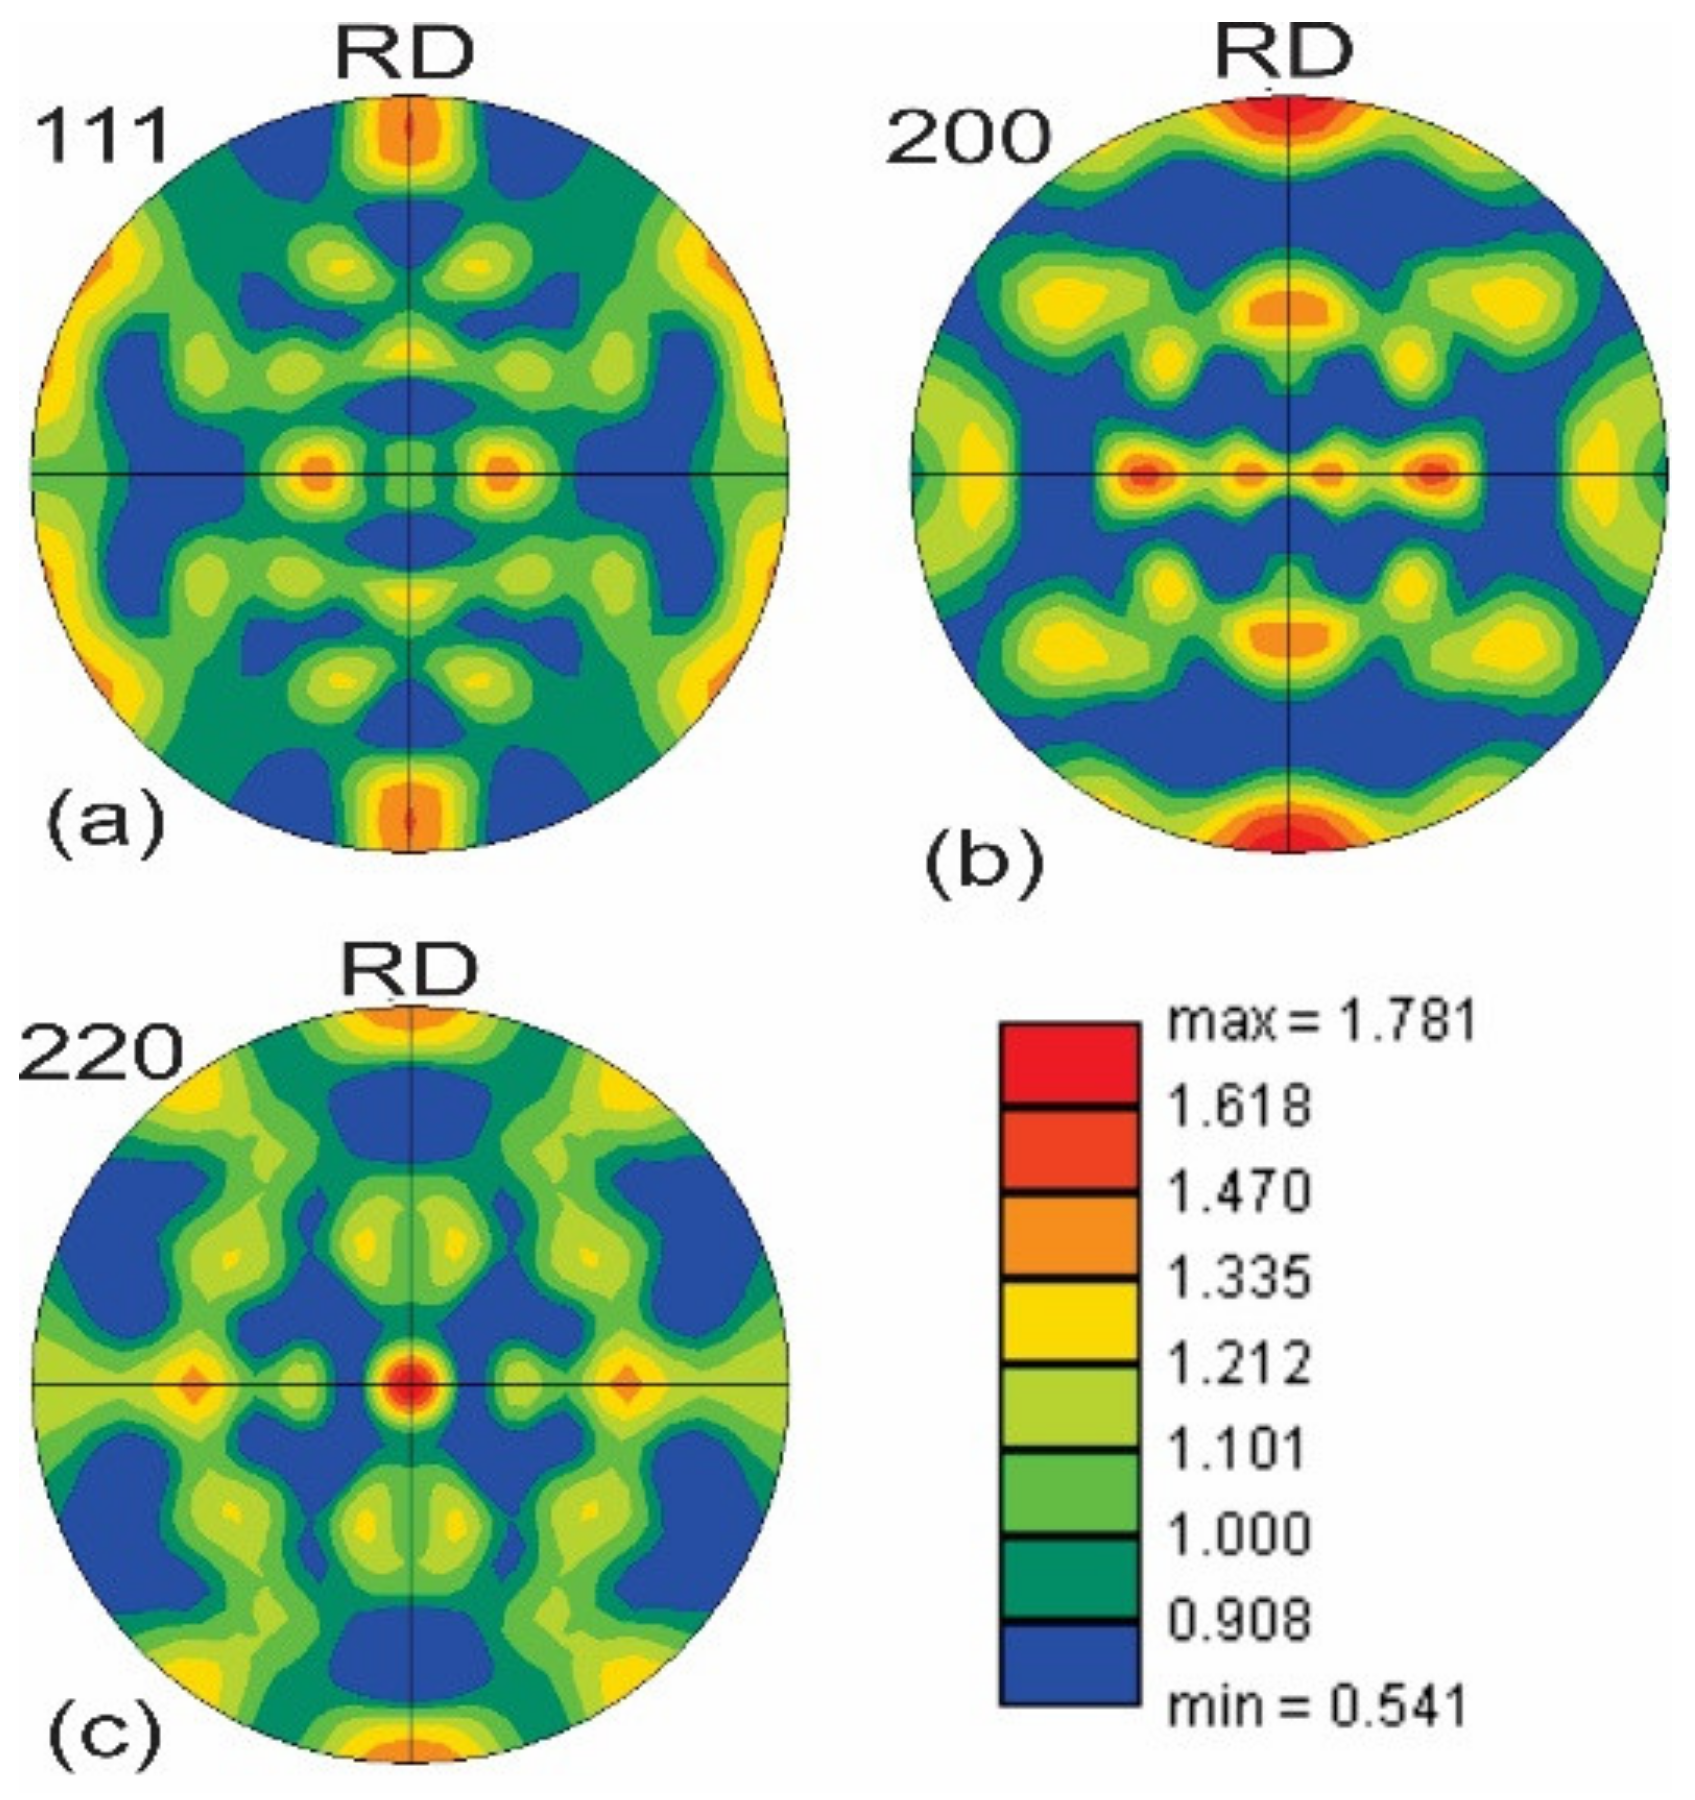
3.2. Micro-Texture Analysis

The micrographs of the max and min positions of the tube in its as-received state are shown in Figure 13a,b, respectively. It is possible to distinguish between grains with various orientations. However, there is no discernible difference between the two positions. Moreover, the micrographs’ color pattern demonstrates that there is no dominant orientation and that various grains exhibit a variety of orientations. The micrographs after the first drawing step with tilting angles of 0° and −5° do not clearly exhibit any dominant orientations, as illustrated in Figure 13c,d.
Figure 14a–c shows the {111}, {100}, and {110} PFs of the obtained tube on the min side are shown. Similar to the macro-texture, the cube component could be identified as the only dominant one in these PFs. As can be observed, the density of the PFs is quite weak, such that the maximum intensity is about 1.78. The same behavior was observed at the max position.
PFs of the tubes at the min side after the second drawing step with a 0° tilt angle (standard drawing) are shown in Figure 15. Same as the macro-texture measurements, the Cu component predominates after the second drawing step. However, components with lower densities such as cube, Bs, and Goss were also detected.
The 111 , 100 , and 110 PFs after the second drawing step with −5° tilting at the min side of the tube are shown in Figure 16. No remarkable difference between the PFs of the samples after tilting and standard drawing was observed. In the case of −5° tilting, the maximum intensity of the PFs was enhanced (3.71) compared to the standard drawn tubes (2.42), which is the only noticeable difference.

4. Conclusions

In the present study, the development of macro- and micro-textures in copper tubes drawn with a tilt angle of 0° and −5° was investigated. The main objective of the texture measurements was to understand if and how the tilt affects the texture development in the tubes. The macro-textures of the tubes—before and after the drawing steps—were analyzed using neutron and synchrotron diffraction techniques. In contrast, the micro-textures of the samples were analyzed using the electron diffraction method. In both the max and min positions of the wall thicknesses of the tubes, the texture was analyzed.
In the as-received tubes, the cube-shaped component was the predominant orientation, which corresponds to the heat treatment process applied to the tubes in the as-received tubes. Comparing the 111 , 200 and 220 PFs showed that there is no noticeable difference in the PFs at the max and min sides of the as-received tube, and both sides showed nearly the same PF densities. Both cube and Bs components were detected in the φ 2 = 0 ° ODF section of the as-received tube. However, Cu and S components were visible in the φ 2 = 45 ° and φ 2 = 65 ° sections, respectively.
As the most dominant component at both the max and min sides of the as-received tubes, the cube component varied strongly over the wall thickness of the tube. However, its variation on both sides was almost similar. The Cu, Goss, and Bs components were more or less constant over the wall thickness in both positions of the as-received tube.
Owing to its ideal conditions of growth into the deformation texture, the cube component almost disappeared after the first step of drawing with −5° tilting at max and min sides of the tube, while the Cu component increased significantly. The 111 , 200 and 220 PFs revealed that the cube component at the min side fully vanished, whereas at the max side there was still some cube component, and this was the only difference between these two positions. The ODF results also showed a decrease in the intensity of the cube and Bs components, which was remarkable in the case of the cube component. Moreover, the intensity of both Cu and Goss components increased, which was strong for Cu. As with the first drawing, the second drawing shows the same tendencies. A texture gradient was observed for only the cube component over the wall thickness after the first and second drawing steps; however, other components varied slightly.
The micro-texture results of EBSD examinations showed the same behavior at the max and min sides of the as-received tube, as observed using the synchrotron diffraction method as well as macro-texture measurements. The EBSD micro-texture of the tubes after drawing using −5° and 0° tilting also showed nonsignificant differences in micro-texture. The only difference was the greater PF density for tubes drawn with −5° tilted die (3.71) in comparison with the 2.42 for the standard-drawn ones.
The analyses showed that there are no significant differences between the drawn tubes with and without tilt in terms of texture development, except for some minor variations. Tilting is not creating an inhomogeneous texture development over the circumference. Moreover, deviations in wall thickness over circumference must not be taken into account concerning texture development when reducing the eccentricity by changing the tool conditions, e.g., tilting the die.

Author Contributions

Conceptualization, F.F., H.P. and A.C.; methodology, F.F.; software, F.F.; investigation and formal analysis, F.F., H.P., A.C. and S.K.; resources, F.F.; data curation, F.F. and S.K.; writing—original draft preparation, S.K.; writing—review and editing, S.K., F.F., H.P. and A.C.; supervision, H.P. and A.C.; funding acquisition, H.P. All authors have read and agreed to the published version of the manuscript.

Funding

This research was funded by German Research Foundation (Deutsche Forschungsgemeinschaft, DFG), under contract PA 837/38-1.

Institutional Review Board Statement

Not applicable.

Informed Consent Statement

Not applicable.

Data Availability Statement

The data presented in this study are available on request from the corresponding author.

Acknowledgments

We acknowledge the support of KME (Kabel Metal Europe) for kindly providing the copper tubes.

Conflicts of Interest

The authors declare no conflict of interest. The funders had no role in the design of the study; in the collection, analyses, or interpretation of data; in the writing of the manuscript; or in the decision to publish the results.

Abbreviations

SymbolDefinitionUnit
BsBrass orientation[-]
CPCrystal plasticity[-]
CuCopper orientation[-]
DESYGerman electron synchrotron[-]
EEccentricity[%]
EBSDElectron backscatter scanning diffraction[-]
FSDForward scattered detector[-]
IDTInterrupted drawn tube[-]
MaxMaximum[-]
MinMinimum[-]
NDNormal direction[-]
ODFOrientation distribution function[-]
OIMOrientation imaging microscopy[-]
PEPerkin Elmer[-]
PFPole figure[-]
RDRolling direction[-]
RSResidual stress[MPa]
SGVSample gauge volume[-]
TDTransverse direction[-]

References

  1. Foadian, F.; Carradó, A.; Palkowski, H. Precision tube production: Influencing the eccentricity and residual stresses by tilting and shifting. J. Mater. Process. Technol. 2015, 222, 155–162. [Google Scholar] [CrossRef]
  2. Foadian, F.; Carradó, A.; Pirling, T.; Palkowski, H. Residual stresses evolution in Cu tubes, cold drawn with tilted dies—Neutron diffraction measurements and finite element simulation. Mater. Des. 2016, 107, 163–170. [Google Scholar] [CrossRef]
  3. Tenckhoff, E. Deformation Mechanisms, Texture, and Anisotropy in Zirconium and Zircaloy; ASTM: Philadelphia, PA, USA, 1988. [Google Scholar]
  4. Mainprice, D.; Nicolas, A. Development of shape and lattice preferred orientations: Application to the seismic anisotropy of the lower crust. J. Struct. Geol. 1989, 11, 175–189. [Google Scholar] [CrossRef]
  5. Engler, O.; Schäfer, C.; Brinkman, H.-J. Crystal-plasticity simulation of the correlation of microtexture and roping in AA 6xxx Al–Mg–Si sheet alloys for automotive applications. Acta Mater. 2012, 60, 5217–5232. [Google Scholar] [CrossRef]
  6. Suwas, S.; Ray, R.K. Crystallographic Texture of Materials; Springer: London, UK, 2014. [Google Scholar]
  7. Al-Hamdany, N.; Brokmeier, H.-G.; Salih, M.; Zhong, Z.; Schwebke, B.; Schell, N.; Gan, W. Crystallographic texture gradient along the wall thickness of an SF-copper tube. Mater. Charact. 2018, 139, 125–133. [Google Scholar] [CrossRef]
  8. Cho, J.H.; Park, S.J.; Choi, S.; Oh, K.H. Deformation Texture of Cold Drawn Al6063 Tube. Mater. Sci. Forum 2002, 408–412, 565–570. [Google Scholar] [CrossRef]
  9. Brokmeier, H.-G.; Carradò, A.; Al-Hamdany, N.; Pirling, T.; Wimpory, R.; Schell, N.; Palkowski, H. Texture gradient in a copper tube at maximum and minimum wall thickness. IOP Conf. Ser. Mater. Sci. Eng. 2015, 82, 12102. [Google Scholar] [CrossRef] [Green Version]
  10. Carradò, A.; Brokmeier, H.-G.; Pirling, T.; Wimpory, R.C.; Schell, N.; Palkowski, H. Development of Residual Stresses and Texture in Drawn Copper Tubes. Adv. Eng. Mater. 2013, 15, 469–475. [Google Scholar] [CrossRef]
  11. Schläfer, D.; Bunge, H.J. The Development of the Rolling Texture of Iron Determined by Neutron-Diffraction. Texture 1974, 1, 157–171. [Google Scholar] [CrossRef] [Green Version]
  12. Bunge, H. Three-dimensional texture analysis. Int. Mater. Rev. 1987, 32, 265–291. [Google Scholar] [CrossRef]
  13. Kocks, U.F.; Tomé, C.N.; Wenk, H.-R. (Eds.) Texture and Anisotropy: Preferred Orientations in Polycrystals and Their Effect on Materials Properties; Cambridge University Press: Cambridge, UK, 2000. [Google Scholar]
  14. Truszkowski, W.; Krol, J.; Major, B. On Penetration of Shear Texture into the Rolled Aluminum and Copper. Met. Mater. Trans. A 1982, 13, 665–669. [Google Scholar] [CrossRef]
  15. Park, H.; Lee, D.N. Deformation and annealing textures of drawn Al–Mg–Si alloy tubes. J. Mater. Process. Technol. 2001, 113, 551–555. [Google Scholar] [CrossRef]
  16. Chen, J.; Yan, W.; Li, W.; Miao, J.; Fan, X.-H. Texture evolution and its simulation of cold drawing copper wires produced by continuous casting. Trans. Nonferrous Met. Soc. China 2011, 21, 152–158. [Google Scholar] [CrossRef]
  17. Hofmann, M.; Gan, W.; Rebelo-Kornmeier, J. STRESS-SPEC: Materials science diffractometer. J. Large-Scale Res. Facil. JLSRF 2015, 1, A6. [Google Scholar] [CrossRef]
  18. Foadian, F.; Carradó, A.; Brokmeier, H.; Gan, W.; Schell, N.; Al-Hamdany, N.; Palkowski, H. Evolution of texture in precision seamless tubes investigated by synchrotron and neutron radiation measurement. Mater. Charact. 2019, 151, 582–589. [Google Scholar] [CrossRef]
  19. Suwas, S.; Singh, A.K.; Narasimha Rao, K.; Singh, T. Effect of modes of rolling on evolution of texture in pure copper and some copper base alloys. Part III. Yield locus anisotropy. Z. Fuer Met. 2003, 94, 1313–1319. [Google Scholar]
  20. Engler, O.; Randke, V. Introduction to Texture Analysis: Macrotexture, Microtexture, and Orientation Mapping, 2nd ed.; CRC Press, Taylor & Francis Group: Boca Raton, FL, USA, 2009. [Google Scholar]
  21. Ridha, A.; Hutchinson, W. Recrystallisation mechanisms and the origin of cube texture in copper. Acta Met. 1982, 30, 1929–1939. [Google Scholar] [CrossRef]
  22. Hatherly, M.; Hutchinson, W.B. An Introduction to Textures in Metals; Chameleon Press: London, UK, 1979. [Google Scholar]
  23. Wassermann, G.; Grewen, J. Texturen Metallischer Werkstoffe, 2nd ed.; Springer: Berlin/Heidelberg, Germany, 1962. [Google Scholar]
Figure 1. Cross-section of (a,b) specimen in as-received condition and (c,d) of the tube drawn with a tilt angle of −5° in the max and min positions.
Applmech 04 00007 g001
Figure 2. Tube drawing facility.
Applmech 04 00007 g002
Figure 3. The interrupted drawn tube IDT used for texture measurements.
Applmech 04 00007 g003
Figure 4. {111}, {200}, and {220} PFs of the as-received tubes at (a) max and (b) min positions, reprinted with permission from [18]. 2019, Elsevier.
Applmech 04 00007 g004
Figure 5. The ODF cuts of the as-received tube at (a) max and (b) min positions for different φ 2 angles. The (c) 0° and (d) 45° ODF sections showing the detected components, reprinted with permission from [18]. 2019, Elsevier.
Applmech 04 00007 g005
Figure 6. 111 , 200 and 220 PFs at the (a) max and (b) min positions of the drawn tube using −5° tilting angle.
Applmech 04 00007 g006
Figure 7. 111 , 200 and 220 PFs at the (a) max and (b) min sides of the drawn tube using +5° tilting angle.
Applmech 04 00007 g007
Figure 8. φ 2 = 45 ° ODF section of (a) max and (b) min sides of the drawn tube using −5° tilting angle.
Applmech 04 00007 g008
Figure 9. 111 PFs after the 2nd drawing step at (a) max, (b) min. 45° ODF section at (c) max and (d) min.
Applmech 04 00007 g009
Figure 10. (a) Reference points over the wall thickness of the as-received tube. (b) Variation of the cube and Cu components at max and min positions of the initial tube. (c) Max and (d) min position comparison of the four principal components.
Applmech 04 00007 g010
Figure 11. Change in principal components cube, Goss, and Bs before and after the first drawing step at (a,b) max and (c,d) min side of the tube. The measuring points are P1 to P9, as sketched in Figure 10.
Applmech 04 00007 g011
Figure 12. Changes in the texture components over the wall thickness of the tube at max side before and after drawing steps; (a) Cu, (b) cube, (c) Bs, and (d) Goss components.
Applmech 04 00007 g012
Figure 13. Micrograph of the as-received tube at (a) max and (b) min positions, (c) max side of the drawn tubes with 0° tilting, and (d) −5° tilting angle.
Applmech 04 00007 g013
Figure 14. (a) 111 , (b) 100 , and (c) 110 PFs of the as-received tubes at min side. The maximum intensity of PFs is approximately 1.78.
Applmech 04 00007 g014
Figure 15. (a) 111 , (b) 100 , and (c) 110 PFs of the tubes drawn with the standard die after the second drawing step at min position. The maximum intensity of PFs is approximately 2.42.
Applmech 04 00007 g015
Figure 16. (a) 111 , (b) 100 , and (c) 110 PFs of the tubes drawn with −5° tilted die after the second step of drawing at min. The maximum intensity of PFs is approximately 3.7.
Applmech 04 00007 g016
Table 1. Tube drawing process of Cu tubes.
StepInitial Size, mmDie ∅, mmPlug ∅, mm Thickness   Reduction ,   ε s Diameter Reduction ,   ε d Q ValueFinal Size, ∅ × t, mm
First65.0 × 5.560.051.00.200.082.560.0 × 4.5
Second60.0 × 4.550.044.00.220.112.0× 4.0
Disclaimer/Publisher’s Note: The statements, opinions and data contained in all publications are solely those of the individual author(s) and contributor(s) and not of MDPI and/or the editor(s). MDPI and/or the editor(s) disclaim responsibility for any injury to people or property resulting from any ideas, methods, instructions or products referred to in the content.

