Article

Shear Deterioration of the Hierarchical Structure of Cellulose Microfibrils under Water Condition: All-Atom Molecular Dynamics Analysis

1
Daio Paper Co., Ltd., Shikoku Chuo 799-0492, Japan
2
Department of Mechanical Engineering, Faculty of Engineering Science, Kansai University, 3-3-35 Yamate-cho, Suita 564-8680, Japan
*
Author to whom correspondence should be addressed.
Appl. Mech. 2023, 4(1), 230-247; https://doi.org/10.3390/applmech4010013
Submission received: 15 January 2023 / Revised: 4 February 2023 / Accepted: 14 February 2023 / Published: 19 February 2023
(This article belongs to the Special Issue Feature Papers in Material Mechanics)

Abstract

:
This study aims to understand the mechanical properties of cellulose nanofibers (CNFs), a nano-sized material element of woods or plants. We develop all-atom (AA) molecular dynamics models of cellulose microfibrils (CMFs), which are the smallest constituent of CNFs. The models were designed for the process of structural failure or the degradation of a hierarchical material of multiple CMF fibers, due to shear deformation. It was assumed that two CMFs were arranged in parallel and in close contact, either in a vacuum or in water. The CMF models in water were built by surrounding AA-modeled water molecules with a few nanometers. Shear deformation was applied in the axial direction of the CMF or in the direction parallel to molecular sheets. Shear moduli were measured, and they agree with previous experimental and computational values. The presence of water molecules reduced the elastic modulus, because of the behavior of water molecules at the interface between CMFs as a function of temperature. In the inelastic region, the CMF often broke down inside CMFs in a vacuum condition. However, in water environments, two CMFs tend to slip away from each other at the interface. Water molecules act like a lubricant between multiple CMFs and promote smooth sliding.

1. Introduction

Cellulose exists as the most abundant resource on the planet. In recent years, the technology for producing cellulose from plants to fibers has been developed extensively, and Klemm et al. [1] indicated that it is expected to be applied in various industries as a kind of sustainable material. We focus on cellulose nanofiber (CNF), which has a diameter of the order of nanometers, as Moon et al. [2] reported. Unlike other inorganic materials, such as metals, ceramics, and synthetic polymers, the CNF has a highly hierarchical structure, and its smallest component is called cellulose microfibril (CMF). Due to the intermolecular hydrogen bonds between molecular chains, a characteristic molecular sheet in the direction parallel to the chain axis appears. The CMF structure is constructed by lamination of the molecular sheets. Basically, the CNF is a fibrous substance with some favorable features, such as being light weight and high strength and having smaller thermal expansion. Therefore, Lee et al. [3] indicated that it is expected as a structural member of automobiles and a component of fiber-reinforced composite materials. The CNF can be an alternative to carbon or glass fiber and will be advantageous, in terms of abundant resources. Reising et al. [4] reported that, recently, the research and the development of a material built up only by CMFs, which is called “All-CNF material”, are underway. In the review by Nishino [5], such all-CNF has an elastic modulus comparable to that of magnesium alloys, as well as the strength comparable to that of stainless steel, and will be suitable to be used for structural materials.
As Milanez et al. [6] indicated that reports on the experimental mechanical properties of the CMF have been increasing in recent years. However, in composite materials, the CMF has to be dispersed in the matrix. In the all-CNF material stated above, many nano-sized CMFs must aggregate and form a macroscopic structure. Therefore, further knowledge of mechanical properties of a single CMF, as well as its aggregates, is needed. Since experiments on CMFs, as performed by Guhados et al. [7], are not easy, due to too narrow size, numerical simulation can be applied effectively. For example, Wu et al. [8] reported that the Young’s modulus and strength are directly estimated by tensile simulation in the direction of the molecular axis or sheet. Many researchers [9,10,11,12,13,14] discovered by simulations that there is a slight twist around the axis of the CMF. Paavilainen et al. [15] and Kannam et al. [16] discussed the cause of the twist from the viewpoint of hydrogen bonds. Such a finding was actually observed in plants, where, as Wang et al. [17] studied, twists are transmitted hierarchically through the CNF, cells, and the entire system.
When integrated in actual structures or mechanical equipment, the CNFs must undergo various modes of deformation, such as bend, twist, tension, and shear. Therefore, it is necessary to understand the fundamental behaviors of deforming CNF. In particular, shear fracture is generally observed at the interface between matrix and reinforcing fibers in composite materials. This is certainly due to weak interfaces between the matrix and the fibers or between aggregating fibers. Therefore, the knowledge about the shear deformation and strength is crucial to the system of CMFs, as well. To deeply understand the shear deformation, one has to realize the structure is connected hierarchically, and the force or energy must be transmitted through, from cellulose molecules, CMFs and the whole structure.
Fortunately, knowledge about the mechanical properties of a single CMF has been accumulated. By Northolt et al. [18], the experimentally measured shear modulus of the CMF ranges from 1.8 to 3.8 GPa, and Zhao et al. [19] indicated that, by simulations using the all-atom model, it is 1.6 GPa. In recent years, by many researchers [20,21,22,23,24], there have been simulations using multiple CMFs, and Hoeger et al. [25] studied a material with an adjusted axial orientation of CMFs. Reising et al. [4] showed that, when the CMFs are aligned along one orientation, then cellulose nanocrystals (CNCs) are obtained, and these types tend to enhance the load transfer between crystals, and the material improves mechanical performance.
Accordingly, there is growing interest concerning the interface and orientation of CMFs. Additionally, understanding the mechanism of interfacial fracture will lead to improving the performance and new applications. Since the interface of CMFs is in atomic scale, it is considered more effective to perform molecular dynamics (MD) simulations, instead of experiments. In practical use, the influence of the ambient environment, such as temperature and water content (i.e., humidity), is important. Since the MD simulation can express an atomic-level thermal motion and the existence of water molecules, it can be applied to the study of such environmental effects.
In this study, we focus on the shearing deformation of CMF to investigate the mechanical strength, as well as the transmitting mechanism of deformation, through a hierarchical structure. The actual hierarchical structure of CNF would be very complicated. For example, the smallest fibers (CMFs) are very long, such as several micro-meters in length, and they are contacting each other with a various number of contact points and various relative angles. However, it is guessed that, in the crystalline state, narrow fibers tend to align in one direction and build a broader fiber. In such situations, the parallel alignment of multiple fibers could be critical points. When observing a real structure of wood or a plant, it is supposed that a hierarchical structure comprises parallel alignments at many levels of fibers. Thus, to simplify the computational model of the hierarchical structure, we assume the condition in which two CMFs are ideally arranged in parallel manner. We will discuss the effects of shear loading direction, temperature, and the amount of water content on mechanical properties for the hierarchical structures.

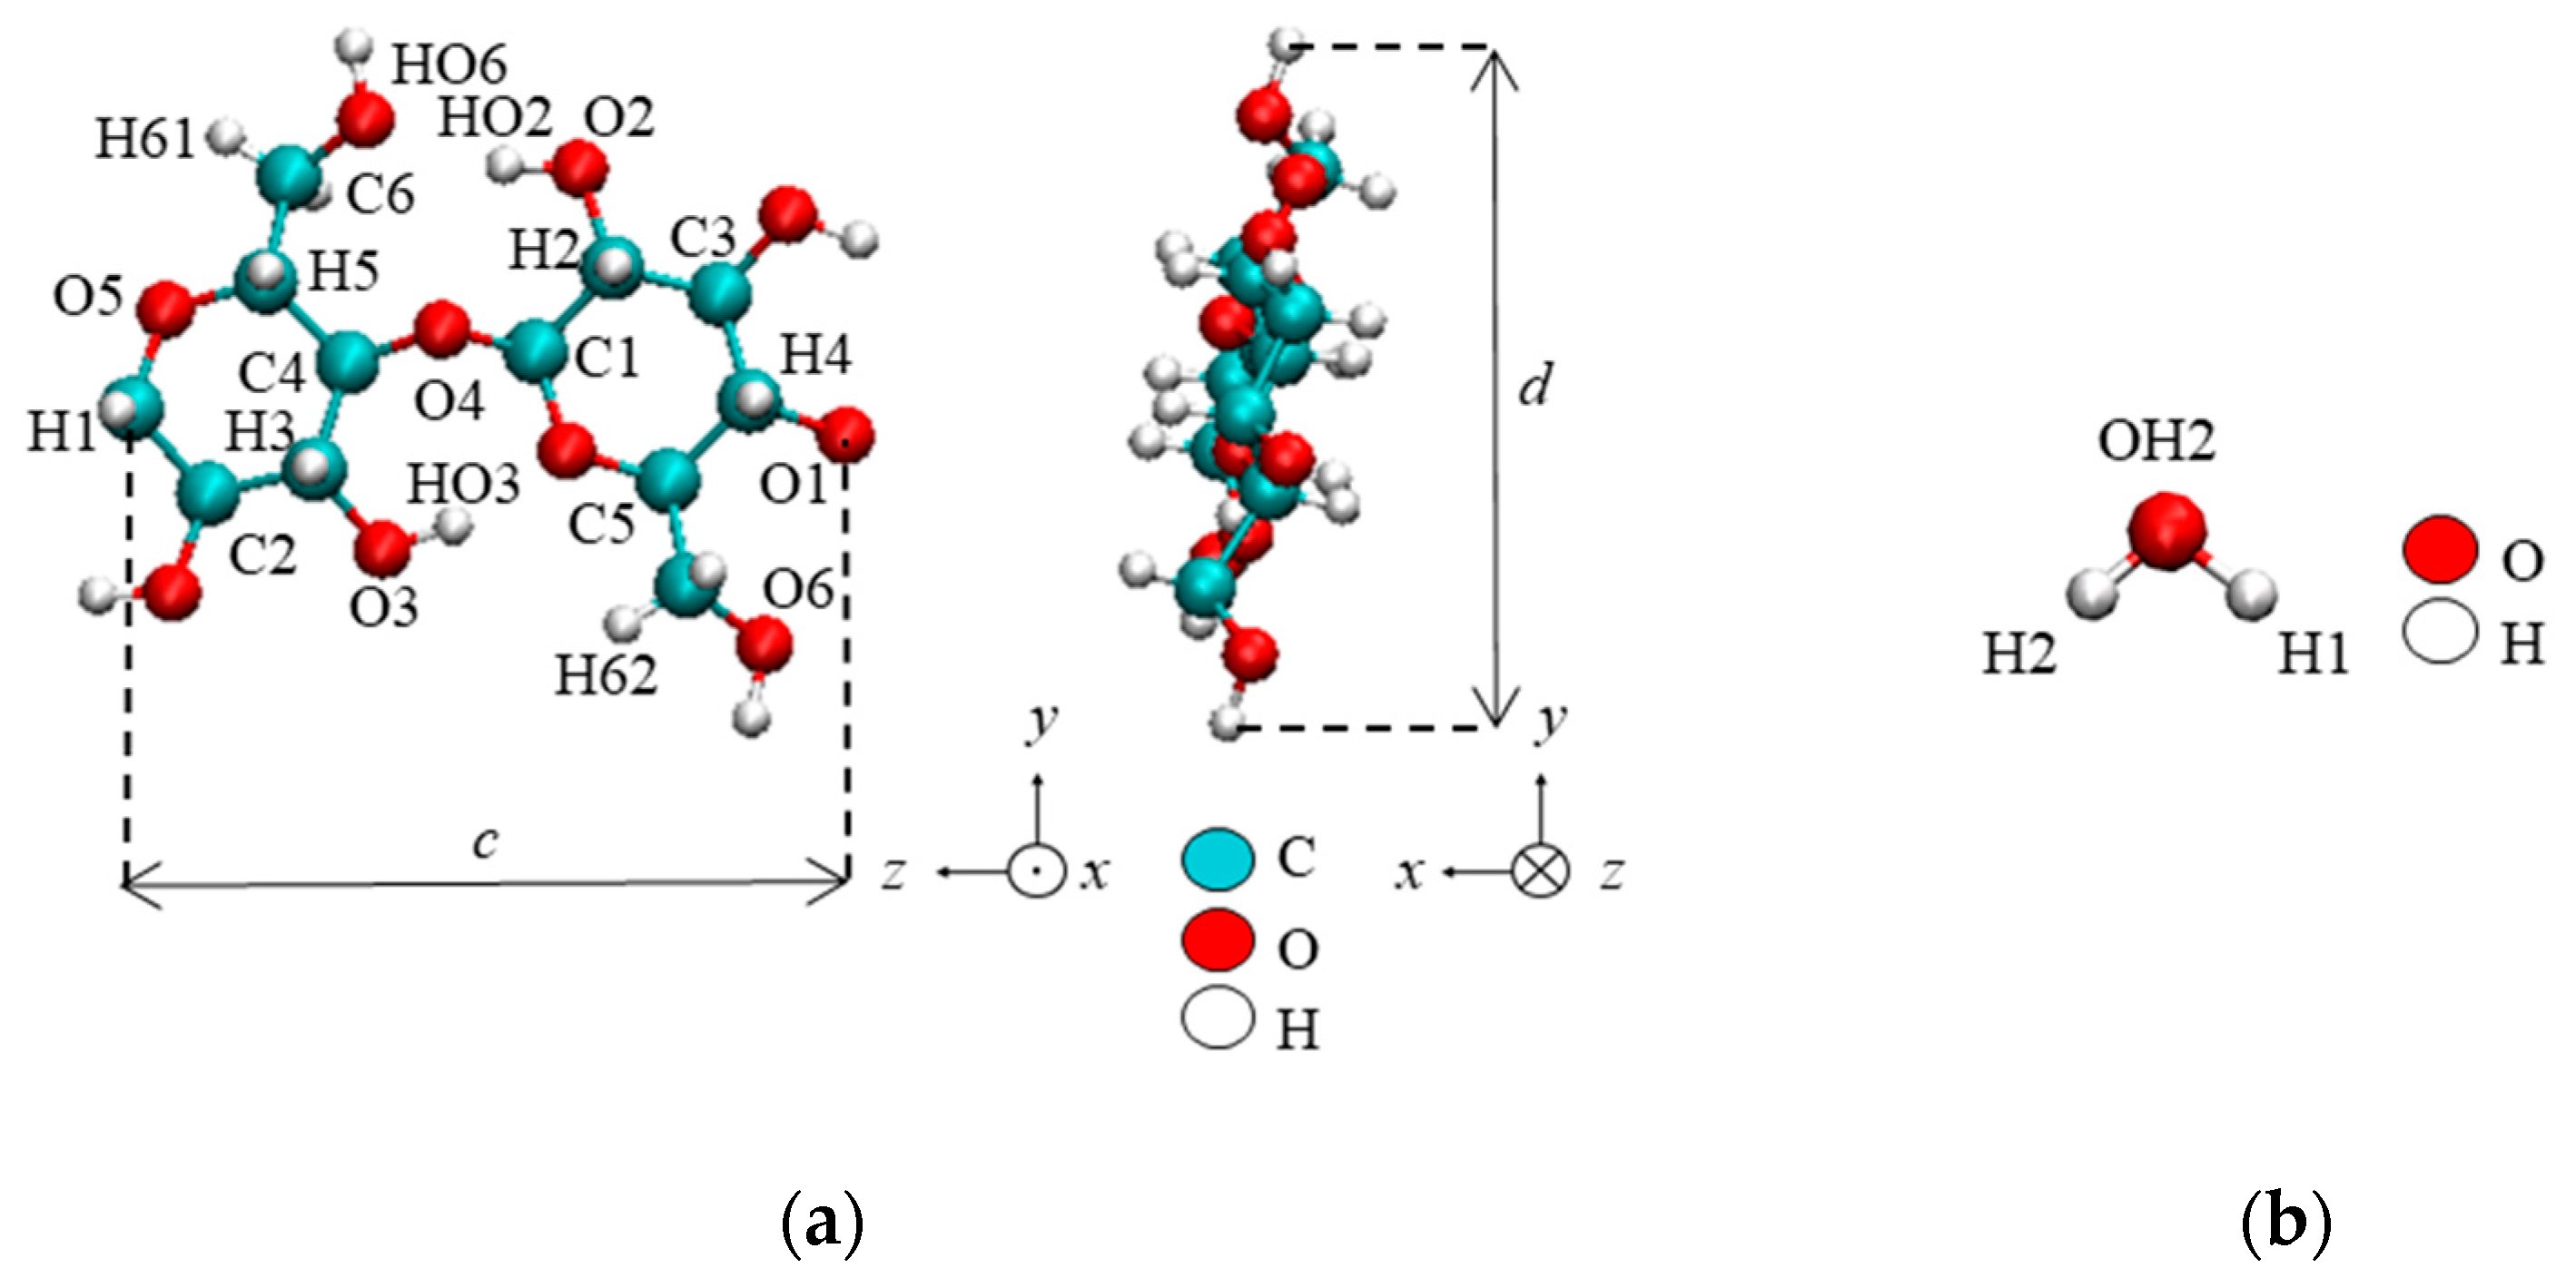
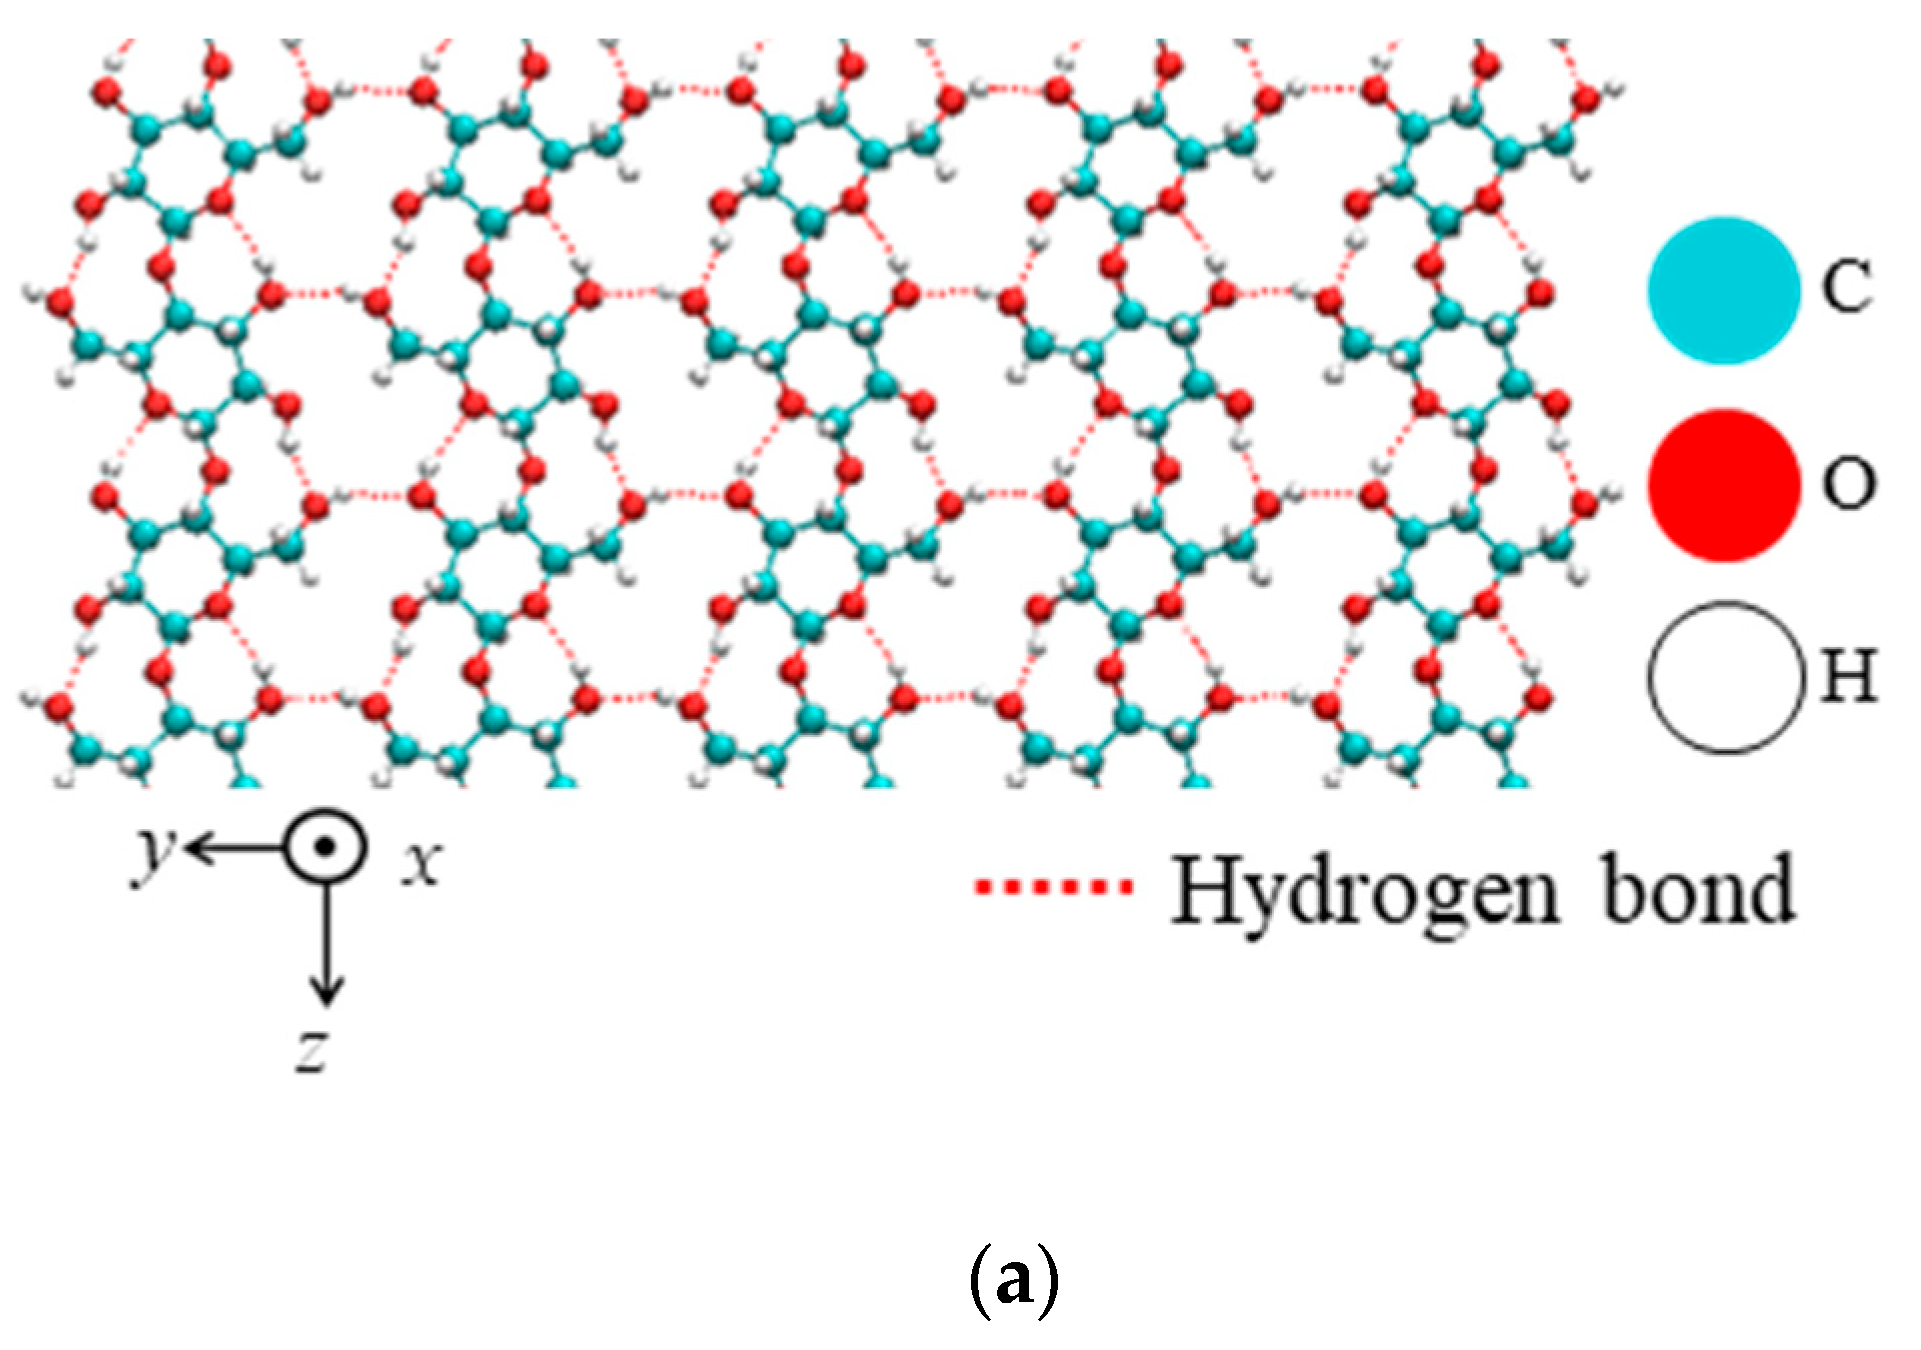
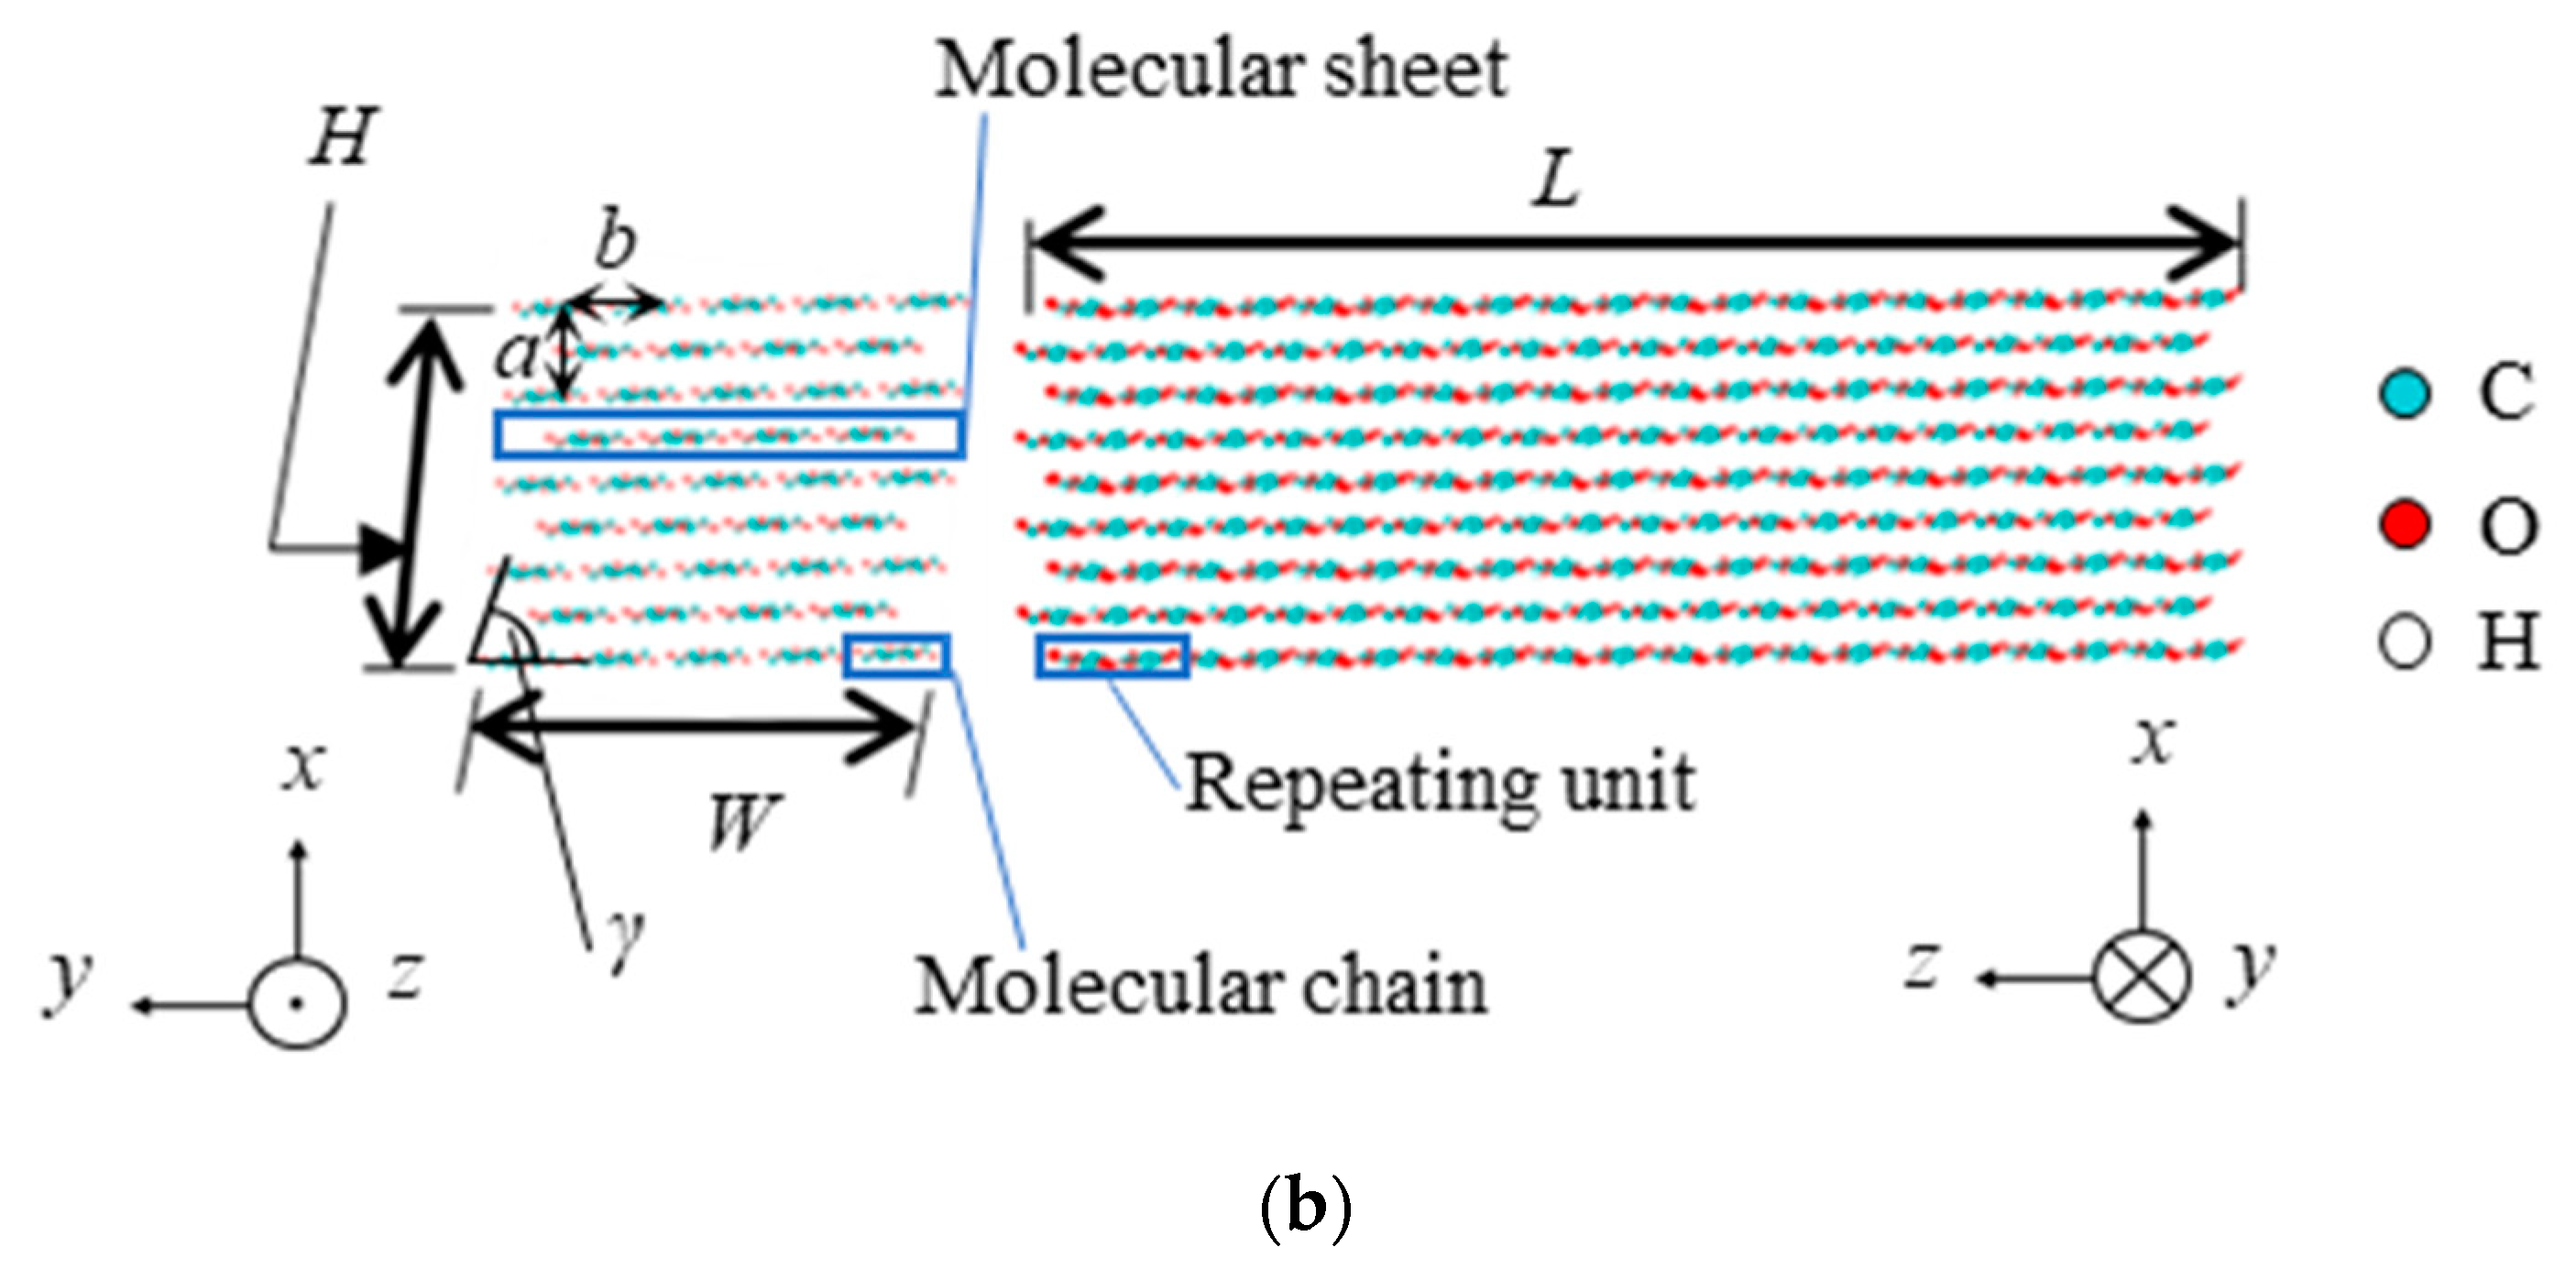
2. Computational Methods and Models

In this study, we conducted molecular dynamics simulation, in which Newtonian equations of motion of atoms or molecules are solved in timeline. The initial conditions are atomic positions and velocities. The interatomic forces are derived via a prescribed interatomic potential function, which will reproduce the energy and microscopic behavior of the atomic system [26,27]. The molecular dynamics code used in this study is NAMD (nanoscale molecular dynamics) [28]. By the NAMD software, many biological polymers or chemicals can be readily put into MD simulations once molecules being studied are determined. The CHARMM force field [29] was used as the interatomic potential (often referred to as “force field” in the field of biochemical molecular analysis). This force field includes the function and parameters for the energy of intramolecular interactions, such as stretching, bending, and twisting (including inappropriate twisting), as well as intermolecular interactions (usually, in the function forms of van der Waals and Coulomb interactions).
Figure 1a shows the structure of the monomer of cellulose. Figure 1b shows the TIP3P model, which is one of molecular models of water, and was used in this study. The TIP3P model is famous one, in which local charges q O and q H are simply located at the atomic positions. For intermolecular interactions, the Lennard–Jones potential parameters ε O and σ O are set at the position of oxygen atom. In this study, all-atom (AA) modeling was applied to all molecules. The AA modeling has an advantage of high computational accuracy, since all the atoms are expressed one-by-one in the system (using no grouping, such as in united atom (UA) method). Table 1 shows the parameters of the CMF and TIP3P models.
Matthews et al. [30] reported the effects of a selected force field (FF) in simulating cellulose. Among CHARMM35 (C35), GLYCAM06 (GL06), and Gromos45 (Gr45), the C35 reproduces lattice constant most appropriately. Miyamoto et al. [31] also compared C35, GL06, and the FF with earlier CHARMM-style parametrization (CSFF), and they concluded that there was no big difference between those force fields. Therefore, it would be sufficiently justified to choose the CHARMM FF for the simulations of cellulose at present. In this study, one of the latest versions, version 36 (CHARMM36), was used to calculate CMF. In addition, version 27 (CHARMM27) was also applied, so as to include the designated water model (TIP3P model). Since a water molecule is treated as a rigid body using the SHAKE method, no change occurs in intramolecular length L OH or angle θ HOH . Among ordinary types of crystal structures in natural cellulose (Iα, Iβ, II, III, and IV), we assumed the cellulose Iβ in modeling the structure of CMF, which is supposed to be the main component of plant-derived natural cellulose. It is known that the crystal structure of cellulose Iβ is monoclinic with lattice constants a, b, c, and γ, as shown in Figure 1a and Figure 2b. First, the repeating unit shown in Figure 1a was defined as a monomer, then 10 monomers were polymerized along the z-axis direction in Figure 1 to create a molecular chain. Since the cellulose molecule has rather flat shape, each molecular chain becomes also planar, and a structural group called molecular sheet is built in, together with intermolecular hydrogen bonds between several chains, as shown in Figure 2a. Technically, a certain number (in this case, forty-one) of molecular chains were assembled into one crystal structure, so that they were arranged around the central chain, and the molecular axis was perpendicular to the xy plane. As a result, a five-layered-looking CMF was created, as shown in Figure 2b. As mentioned above, CMF should contain parallel molecular sheets, and there were many hydrogen bonds between neighboring molecular chains and sheets. The models were created via a utility software developed by Gomes et al. [32], called “Cellulose Builder”. Table 2 summarizes the structural parameters of the CMF model used here.
The dimensions of the CMF model used in this study are close to the experimental ones by Jakob et al. [33], which was measured for crystal region of cellulose (or in CNCs). However, it should be noted that actual CNFs have a variety of widths, lengths, and shapes, depending on manufacturing method and on raw material.

3. Calculation Condition and Computation Procedures

3.1. Structural Relaxation of Single CMF

First, the structural relaxation of the single CMF was performed using the constant-temperature MD, in preparation for constructing a hierarchical structure. All the control of system temperature in the relaxation calculation was realized by the Langevin thermostat [34]. This relaxation calculation was performed for 1.0 ns from the initial state in vacuum condition (i.e., without water) and in 10, 100, 200, or 300 K. The calculation conditions are shown in Table 3. All the simulations in this study utilized the multilevel summation method (MSM) [35] for the accuracy of the electrostatic (Coulombic) interaction. The MSM is implemented in NAMD software and is supposed to provide an accuracy similar to the conventional particle mesh Ewald (PME) method. Since the MSM can be used without periodic boundary conditions, but with non-periodic or semi-periodic system, it is advantageous for reducing the calculation cost.

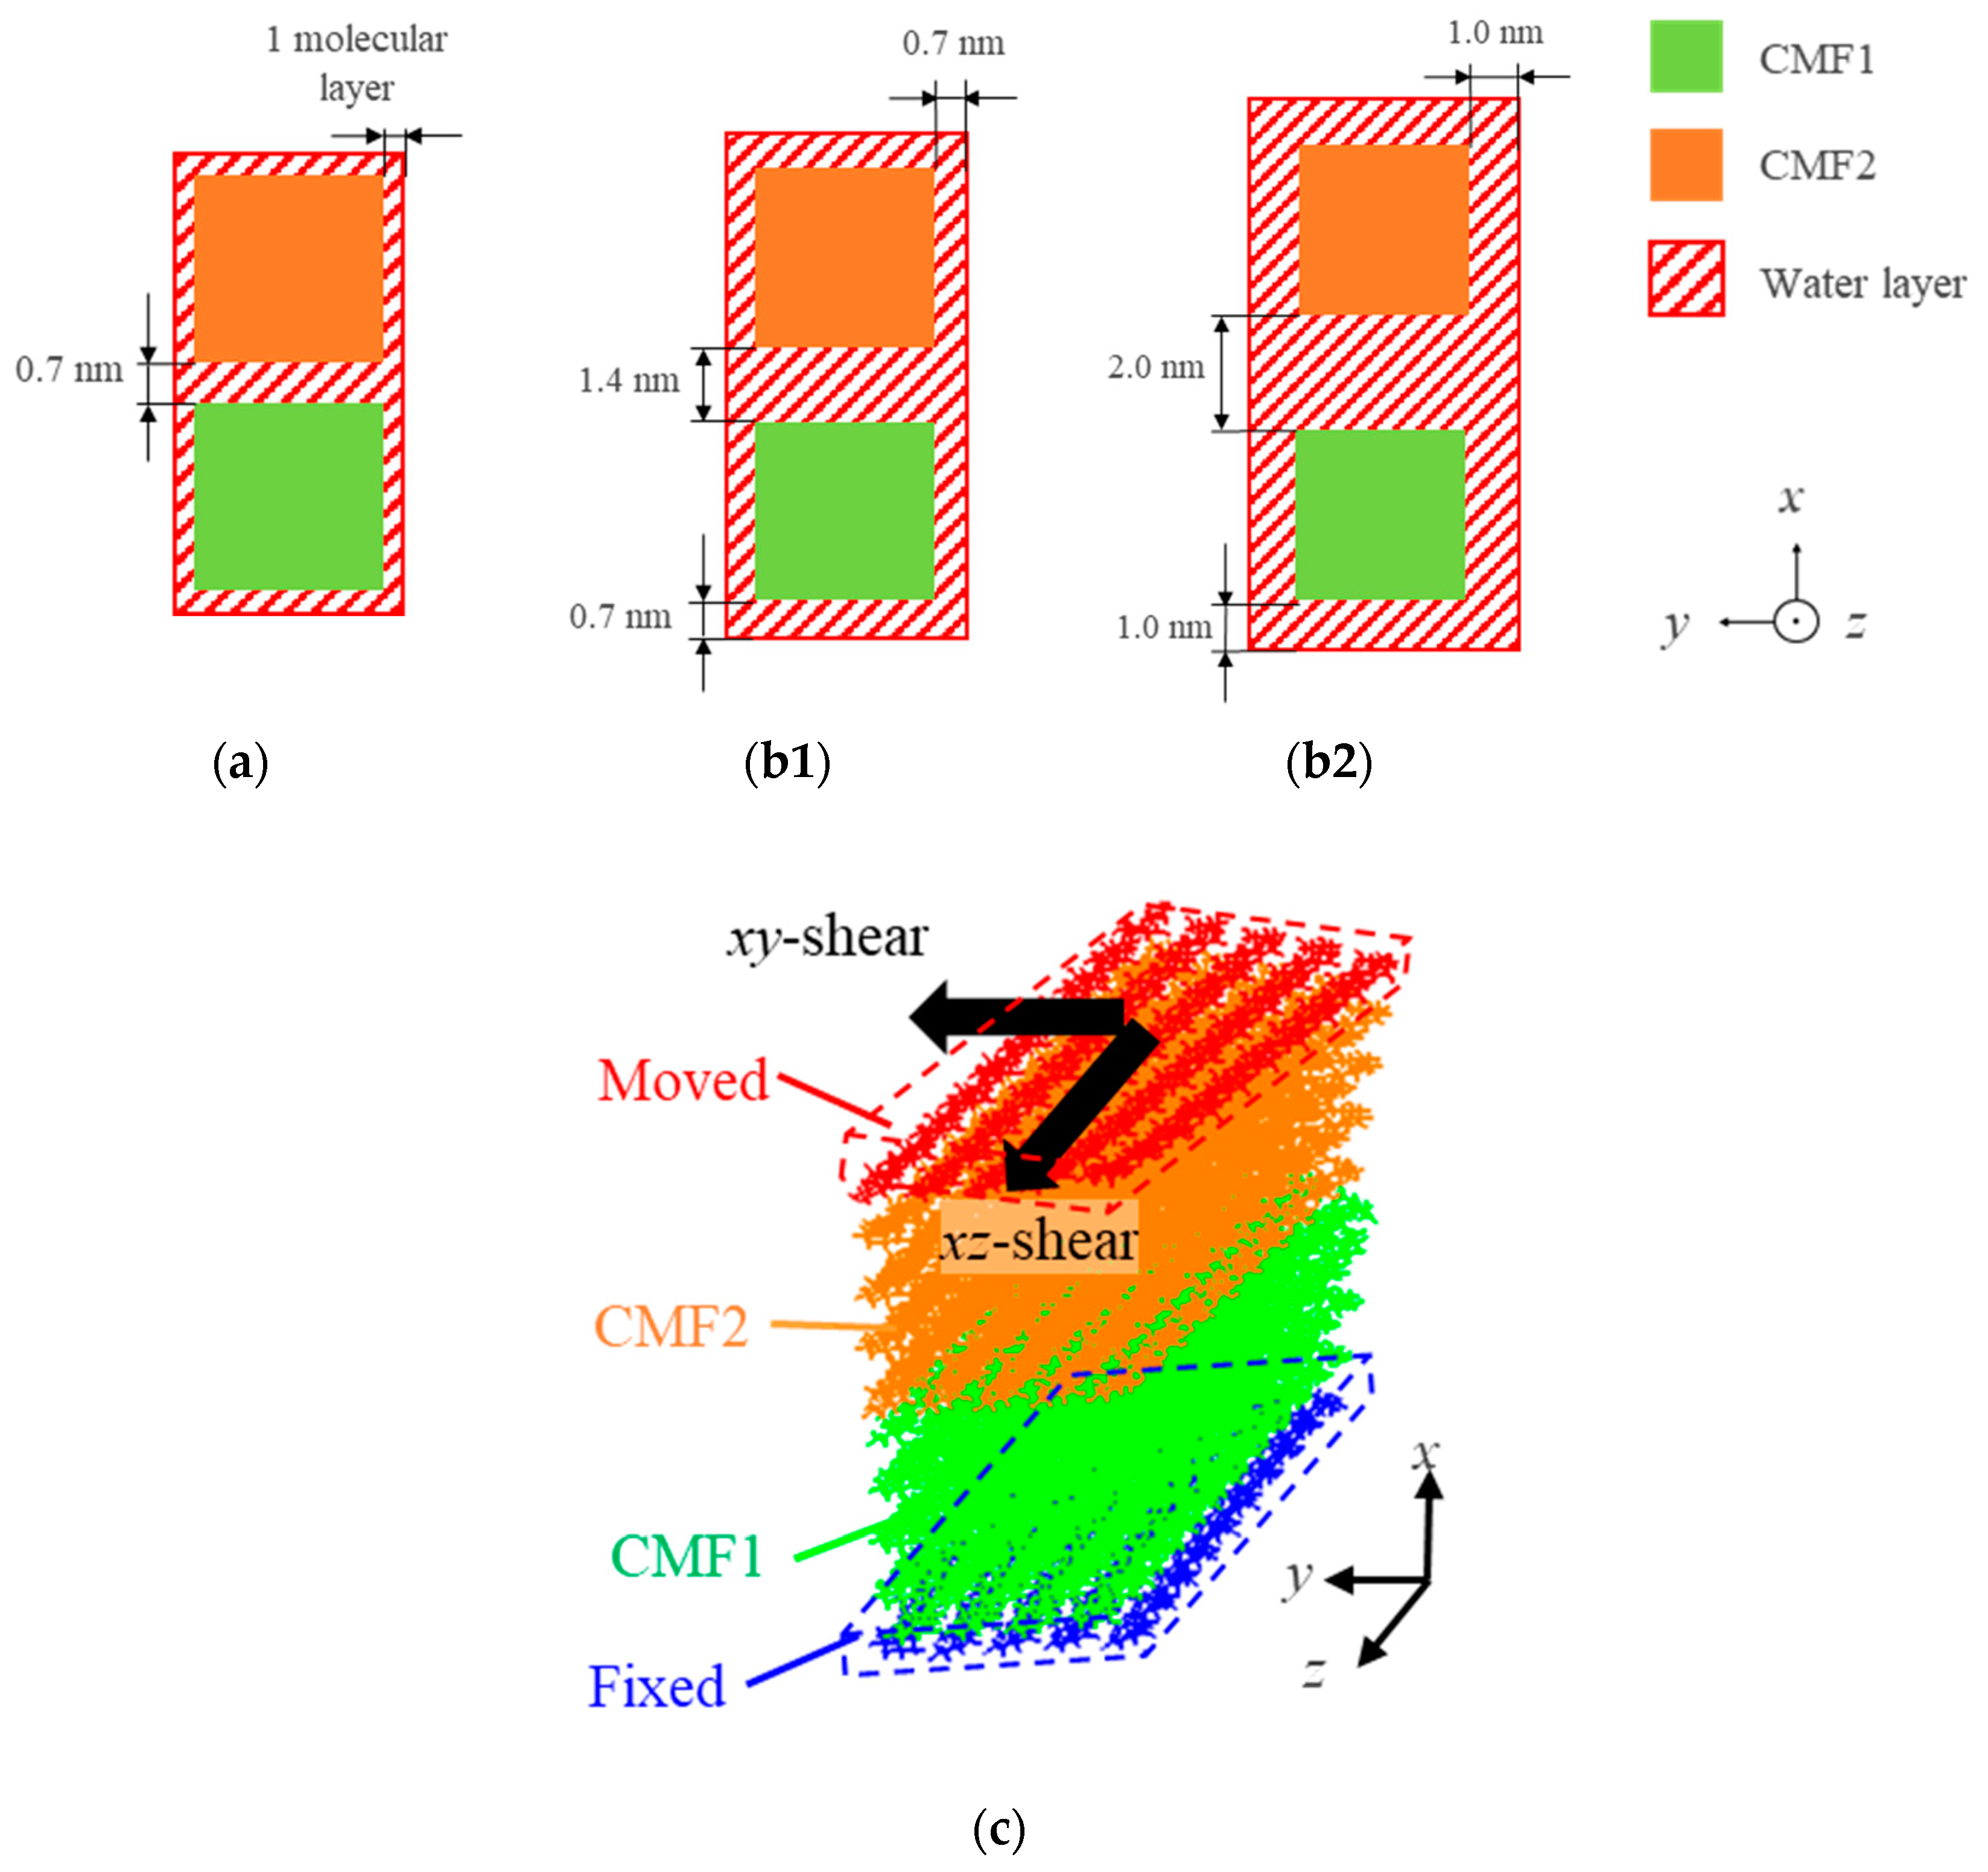
3.2. Hierarchical Structure Simulation of Two CMFs

A hierarchical structure including multiple CMFs was produced by combining two equivalent CMFs that had been thermally relaxed, as explained in the previous subsection. First, two CMFs were placed by spacing 0.7 nm between them along the x direction, as shown in Figure 3a (the x direction was perpendicular to the molecular sheets). Next, water molecules were placed with a thickness of one molecular size, so as to surround two CMFs. This was performed using “solvate” function offered in the visualization software, VMD [36]. Then, after the structural relaxation for 1.0 ns, the initial configuration of the hierarchical structure surrounded by water molecules was obtained. The existence of a thin layer of water molecules in this hierarchical MD model might be justified by the following experiments. Both Koch et al. [37] and Take et al. [38] reported that cellulose in an amorphous state can be attached only by a monolayer of water in a relative humidity from 0 to 20%. Fernandes et al. [39] experimentally detected a similar osmosis of water between CMFs.
To investigate the effect of water thickness, other models were prepared for comparison, where the spacing in the x direction between two CMFs was changed from 0.7 nm to 1.4 or 2.0 nm. Each CMF has water a layer with a thickness of 0.7 or 1.0 nm, as shown in Figure 3(b1,b2). These initial structures were adequately relaxed in 300 K. Here, these models are called “Thick water models A and B”, and they are abbreviated as “TW-A” and “TW-B” models hereafter. Note that the water thickness of TW-B model is comparable to the experimental result obtained by Niinivaara et al. [40] in a vapor deposition on CNF ultra-thin film. In comparing results, the original model with 0.7 nm water thickness will be called “one-layer water” model.
Next, shear simulations were performed using the steering molecular dynamics (SMD) method [41]. In the SMD method, controlled atoms called “SMD atoms” are assigned in the system, and dummy (virtual) atoms with velocity constraints are connected to them by harmonic springs. Some SMD atoms were placed on one side of the system and were to be forcibly moved with a constant velocity. Other SMD atoms on the other side of the system were spatially fixed. Thus, shear simulations of the hierarchical structure were performed. In practice, as shown in Figure 3c, the SMD atoms in CMF2 (upper one) were located in several molecular chains at one end region in the x direction, and they are marked “y “Mo”ed” (colored by red) in the figure. The fixed atoms in CMF1 (lower one) were located in several chains at the other end region, and they are marked “y “Fi”ed” (colored by blue) in the figure. The velocity and spring constant required in the SMD simulations were determined based on the previous works by Sinko et al. [22] and Pradhan et al. [42], respectively.
Shear simulations explained in the main text consisted of two conditions with different shear directions, but of the same joining direction (i.e., attached to the x-direction). For the condition, “xz-” or “xy-shear”, the model was joined in the x direction (perpendicular to the molecular sheet) and subsequently was sheared in the z-direction (direction parallel to the axis of the chains) or in the y-direction (direction perpendicular to the axis of the chains). Another model, named, “yx-” or ”yz-shear”, in which two CMFs were joined in the y direction (direction parallel to the molecular sheet), was also sheared in the x- or z-direction. To avoid congestion in discussing, the results of “yx-” and “yz-shear” are included in the supplementary material of this paper (please see “supporting information”). Shear simulations of the hierarchical structures in vacuum (the condition without water molecules) were also conducted for comparison, but they are also included in the supplementary material. For the TW-A and TW-B hierarchical models, only the xz-shear simulations at 300 K were performed. Table 4 summarizes the calculation conditions for structural relaxation and subsequent shear simulations for the hierarchical structure models.
In the early stage of shear loading, a linear relationship between shear stress and shearing distance would be observed. Shear stress and strain of the system, which are defined based on continuum mechanics of materials, as shown in Figure 4, were analyzed in the simulations. The shear stress τ is estimated from the shearing force F exerted on the molecules in the surface and an estimated area under shear A by the equation,
τ = F / A
when the surface being exerted shearing force moves by x , shear strain γ is obtained via the reference length L ,
γ = x / L
when γ is small enough, τ is assumed to be proportional to γ as,
τ = G γ ,
where the proportional coefficient G is shear modulus. The larger G is, the less the substance is hard to deform by shear.
In this study, hydrogen bonds were observed, which are unbonded interactions, as defined in Figure 5. Jeffrey [43] proposed that there are three levels of bonding strength, depending on interatomic distance L and angle θ , as defined in Figure 5. Accordingly, hydrogen bonds are detected up to Jeffrey’s second level (supposedly, it is the normal level of the electrostatic interaction) by using the function of the VMD software. In the present study, the cutoffs for the distance and angle for all hydrogen bonds were set to be L = 0.30 nm and θ = 150 deg.

4. Result and Discussion

4.1. Hierarchical Structure Simulation Using Two CMFs

Figure 6 shows a cross-sectional view focusing on the interface before shear deformation at 10 K in water. Hydrogen bonds are depicted by broken red lines. Some planar units (chunks connected by blue- or red-colored atoms and bonds) in the figure are recognized as molecular sheets at the surface of two CMFs. Water molecules (presented only by red-colored atoms and bonds) are located at random in between those sheets. It was confirmed that the surfaces of CMFs are connected by hydrogen bonds via water molecules. Figure 7a,b shows the total shape and molecular configuration of the MD model in water before (at time 0) and after (at time 1.0 ns) shear deformation obtained at 10 K for “xz-“ and “xy-shear” simulations, respectively. In both shearing directions, the interface between CMFs seems a slippery one, due to water. Similar behaviors were observed at different temperatures, too. By contrast, in vacuum conditions, the event of destruction might occur inside CMF (which is shown in Figures S3a,b in the Supplementary Materials). Muthoka et al. [44] also reported that a similar phenomenon in vacuum conditions was also reported in the shear simulation of single CMF by MD. Figure 8 shows the shear stress–strain curves, where the Figure 7a,b were obtained from the simulations of “xz-shear” and “xy-shear” cases, respectively. Since instantaneous values of shear stress showed large fluctuation, due to thermal vibration of atoms, each of the plots were averaged every 0.02 nm.
For the elastic region, a shear rigidity (shear modulus) can be defined and was analyzed here for the strain range from 0 to 0.04 in Figure 8. The relationship between the shear moduli and temperatures are shown in Figure 9, where G x z and G x y are the shear moduli for the “xz-” and “xy-shear” cases, respectively. The moduli obtained for both shear directions tend to decrease as the system temperature rises. By using VMD (visualization software), it was well-observed that the behavior of water molecules at the interface strongly depends on temperature, as explained as follows, or by the schematic in Figure 10. At 10 K, water molecules are elastically sheared as a part of the CMFs structure accompanying a slight thermal oscillation, the direction of which is primarily in parallel to the interface. At 100 K, the water molecules move in a manner similar to 10 K, but the amplitude of oscillation becomes quite larger than 10 K. At 200 K, another mode of vibration that is in the direction perpendicular to the interface appears. Additionally, at 300 K, the rotational motion of water molecules is involved. Thus, the higher the temperature was, the more intense the movement of the water molecules that was observed. With the reinforcement of the migration (diffusive motion) of all molecules, hydrogen bonds between two surfaces of CMFs via water molecules were repeatedly switched on and off. In high temperatures (such as in 300 K), hydrogen bonds became unstable, and the averaged strength of the bonds was reduced; therefore, the shear stress of the system was lowered. It is understood that, due to the reduction of the resistance to shear at many parts of the structure, the shear rigidity also measured low in high temperature cases. As detailed information, the number of hydrogen bonds was counted for the total calculation system (including parts not between CMFs), and it did not change so much during shear loading. However, just counting the part between CMFs, the number of hydrogen bonds fluctuated largely. This fact suggests that there is intermittent replacement of hydrogen bond in the interface region via water molecules.
It was also found that there exists anisotropy in the shear modulus. Table 5 shows the values of G x y and G x z averaged over four temperatures conditions (four plots presented in Figure 9) obtained from the MD simulations of the present study, together with the experimental shear modulus of cell walls in larch (a plant of the family of Pinaceae), which was experimentally obtained by Müller et al. [45]. Comparing G x y and G x z , the averaged value of G x z (1.63 GPa) is twice higher than that of G x y (0.753 GPa), which displays a strong elastic anisotropy. In the “xz-shear” simulation, the hydrogen bonds between two surfaces of CMFs via water molecule were prone to be stretched more than in the “xy-shear”. Thus, a hydrogen bond can work effectively in the “xz-shear” case, shear modulus increases there. As shown by Table S1 in the Supplementary Materials, the shear modulus obtained in water is lower than that in vacuum condition. As recognized earlier in Table 5, the averaged value of G x z (1.63 GPa) agrees well with an experimental shear modulus of the cell wall of larch (1~3 GPa). Shishehbor et al. [46] performed MD simulations to obtain the shear moduli of a single CMF in various directions, which were compared, and their values ranged 3.75~5.75 GPa. The shear modulus G y z of the hierarchical structure (plural of CMF structures) in this study, which was obtained in vacuum (4.29 GPa), seems to be in a lower range of those values (the details are found in Table S1 in the supplementary material). This means that the hierarchical structure includes some weak parts and will show easier deterioration in shear deformation than a single CMF structure.
Next, let us consider the large-deformation (plastic) region beyond the elastic one. At the marked points from A to F in Figure 8a for the “xz-shear” simulation, the stress dropped sharply and rose again. This is supposed to be a stick-and-slip behavior, which is well-observed at solid interfaces in nanoscale. When a stick-and-slip behavior occurs at low temperature, shear stress increases to a high level before a large drop. As stated above, for the equilibrium state or small strain (elastic) region, water molecules at the interface do migrate not significantly at low temperature, but help to make stable hydrogen bonds between the two CMFs’ surfaces. When lots of stable hydrogen bonds break by the shear and the interface is about to slip, new stable bonds are formed immediately at other places. During the exchange of sites of hydrogen bonds, the resistance to shear deformation is kept constant, and the stress does not increase by much on average. At a system temperature of 300 K, a zig-zag pattern of the graph was shown, and stick-and-slip behaviors with periodic increases and decreases of shear stress were observed (intense peak stress are marked by D, E, F in Figure 8a), whereas such features were not seen at other temperatures (e.g., only one large peak is found as marked by A (10 K), B (100 K), or C (200 K) in each figure). At high-temperature conditions, a few hydrogen bonds between the two surfaces were established via water molecules, and they were easily broken and resulted in a clear stick-and-slip behavior. Note that Izumi et al. [47] previously pointed out that hydrogen bonds at the ends of the molecular chains, in particular, increase and decrease periodically, and they are resistant to shearing. This is the reason for the stick-and-slip behavior in high temperature cases.
To the contrary, for the “xy-shear” case, as shown in Figure 8b, the interface slipped more smoothly on the whole, and no sudden drop of stress nor stick-and-slip behavior was observed, except for 10 K (a large drop is marked G in the figure). Now, we can suppose that the maximum stress for each graph in Figure 8 can be taken as the shear strength. The relationship between shear strength and the temperature is shown in Figure 11. It is supposed that, if there was a slight change of (initial and boundary) conditions, the fluctuation of stress and maximum values would show changes. However, the maximum stress values change monotonically with temperature change, as shown in Figure 11. So, it is reasonable to think that qualitative dependency on temperature would not change. To clarify this, it will need many calculations with different conditions, and we can expect it in further study. For all temperatures, the shear strength obtained by “xz-shear” was larger than that of “xy-shear”, but the difference was reduced above 300 K. It is guessed that those shear strengths correspond to the strength of the strongest group of hydrogen bonds. As stated for the elastic region, the number of hydrogen bonds is reduced in high temperature, but the highest strength of bonds is being kept, independent of the temperature.
Sinko et al. [22] previously discussed the areal density (density per surface area) of hydrogen bonds in CMF. The study pointed out that the density of hydrogen bonds is independent of the length of CMF in the direction perpendicular to the molecular sheet (corresponding to the x direction in the present study), while it increases with the increase of the length in the direction parallel to the molecular sheet (corresponding to the y direction in the present study). Therefore, the computation results of the “xy-shear” and “xz-shear” in this study hold, regardless of the fiber length, and can be applied to the real CMF. However, it is sure that the actual length of CMF is even longer than our MD models. Then, the results of the “yx-shear” and “yz-shear” (included in the supplementary material) should shift to larger values when evaluating actual CMF materials, which will contain longer CMF fibers.

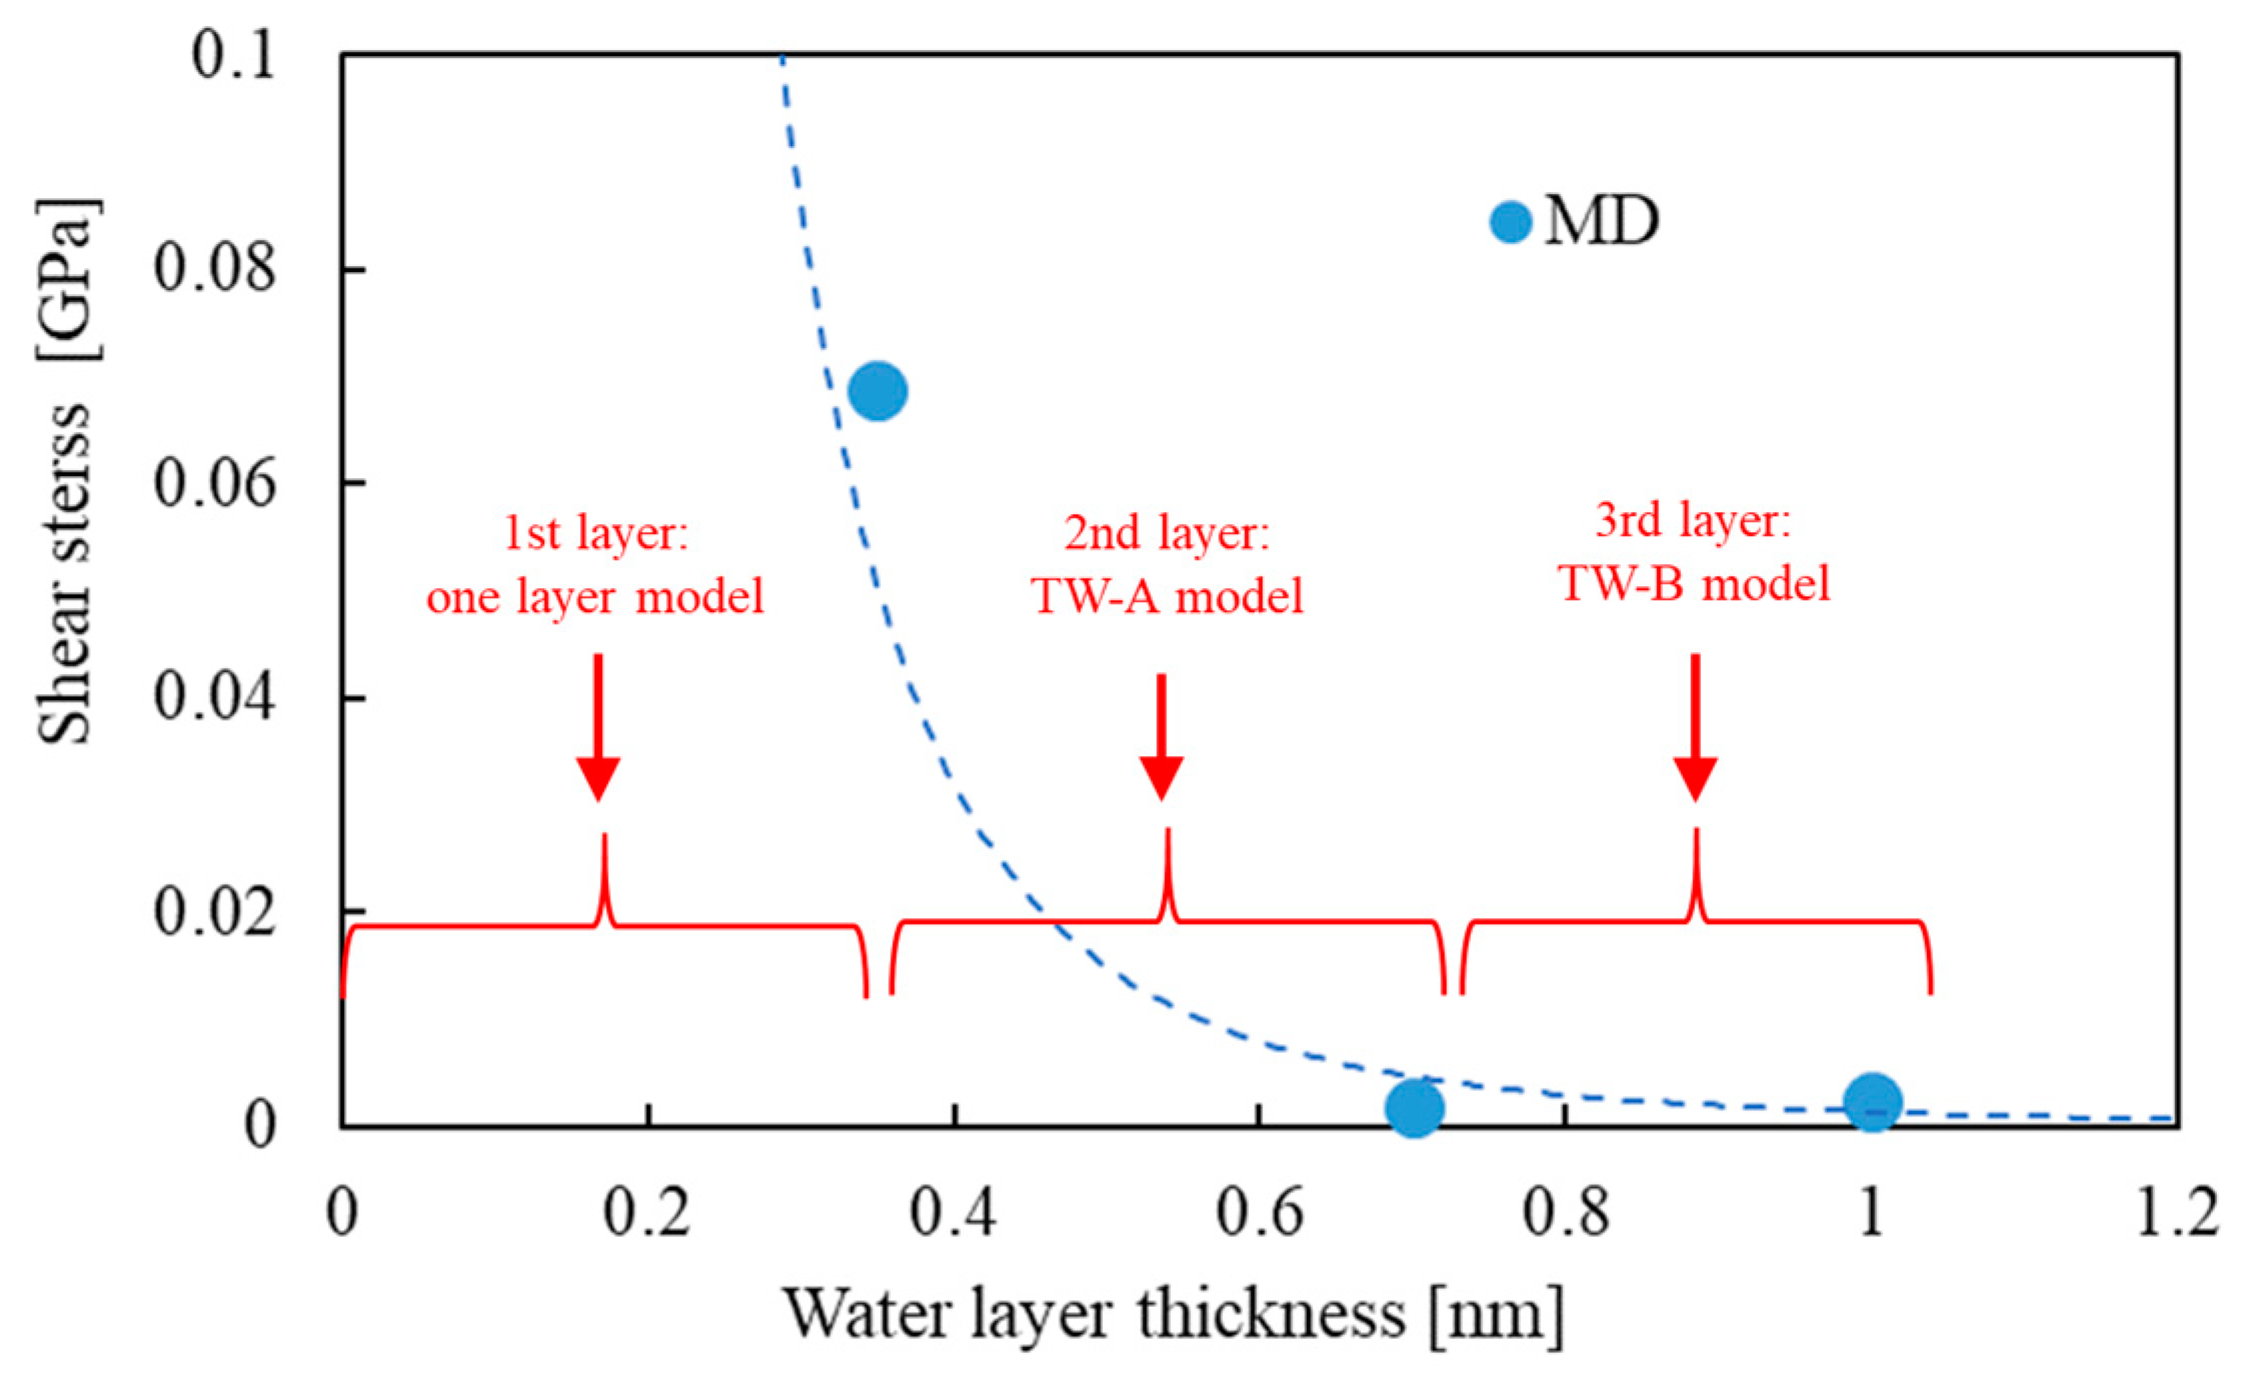
4.2. Effect of Water Thickness on the Mechanical Properties of Hierarchical Structure of Two CMFs (Results of Thick Water Models: TW-A and TW-B)

Figure 12 shows the shape of the CMFs and molecular configurations before and after shearing in TW-A (thick water, model A) and TW-B (thick water, model B) models. As explained in Section 3.2, the thickness of the water in the TW-B model is approximately 1.5 times higher than that in the TW-A model. As found in Figure 12b, it was observed that a void was formed in the water region. In the equilibrium state, the water molecules were distributed uniformly around the CMFs, but due to shear loading, some instability induced such stable free surfaces, which were energetically favored. This phenomenon of voids is physically interesting and should be treated in further studies, but not here. However, most of the water molecules surrounded CMF structures fully, and the formation of void did not affect the behavior of shear deformation. Figure 13 shows the transition of shear stress (each plot of shear stress was averaged over every 0.02 nm), with an increase of shear distance obtained by the “xz-shear” simulation for TW-A and TW-B, compared with the above-mentioned result of the one-layer model (i.e., the same graph for 300 K in Figure 8a, which is included). Figure 14 shows the relationship between the averaged stress and the water thickness for three models. The stress values in Figure 14 were obtained by time-averaging over all the plots displayed in Figure 13. As mentioned earlier, the stick-and-slip behavior, including the water molecules, was basically caused by periodic generation and the extinction of hydrogen bonds in between two CMF surfaces. However, for both the TW-A and TW-B models, due to the relatively large thickness of the water layer, a single hydrogen bond could not directly bridge two CMF surfaces. That is why the shear stress did not fluctuate so much.
As explained in the previous section, at 300 K in the water condition, water molecules moved as if they were lubricating two CMFs at the interface. As can be found in Figure 14, when the thickness of the water layer exceeds a certain value between 0.35~0.7 nm, the average shear stress was reduced substantially. This critical thickness of the water may be equivalent to 2 or 3 layers of molecules. It is supposed that, in such circumstances, most of the water molecules can move fluidly (highly diffusive), and the interface exhibits easy sliding. In the further study, the molecular evaluation of diffusion the coefficient around CMFs and its dependence on temperature will help to clarify the role of water in shear deformation.
In experimental work, Niinivaara et al. [40] measured the thickness of the water layer around the nano-sized cellulose structure of 7 nm in the diameter (which is called cellulose nano crystal (CNC) there, but it is supposed to be almost the same structure as our single CMF model). The thickness value was approximately 1 nm for each surface of CNC structure, which corresponds to three monolayers of water molecules. As shown in Figure 14, the TW-B model that was used in this study possesses the equivalent thickness of the water layer around the CMFs. Therefore, the stable arrangement, including two CMFs in equilibrium state, agrees well with experiment, but it was theoretically predicted by our MD simulation that some instability by shearing loading could occur easily with such critical distance between CMFs. The previous study suggested the importance of van der Waals force (or hydrogen bond), but we visually exhibited the importance of the arrangement of water molecules and their movement.

5. Conclusions

In this study, we investigated the mechanical properties of cellulose microfibril (CMF) as the smallest and most basic component of cellulose nanofiber (CNF) materials. In particular, the mechanism of deformation and fracture in the shearing mode was studied by scrutinizing a simplified example of the hierarchical structure, which was produced by joining two CMF bodies. The following points were obtained and discussed.
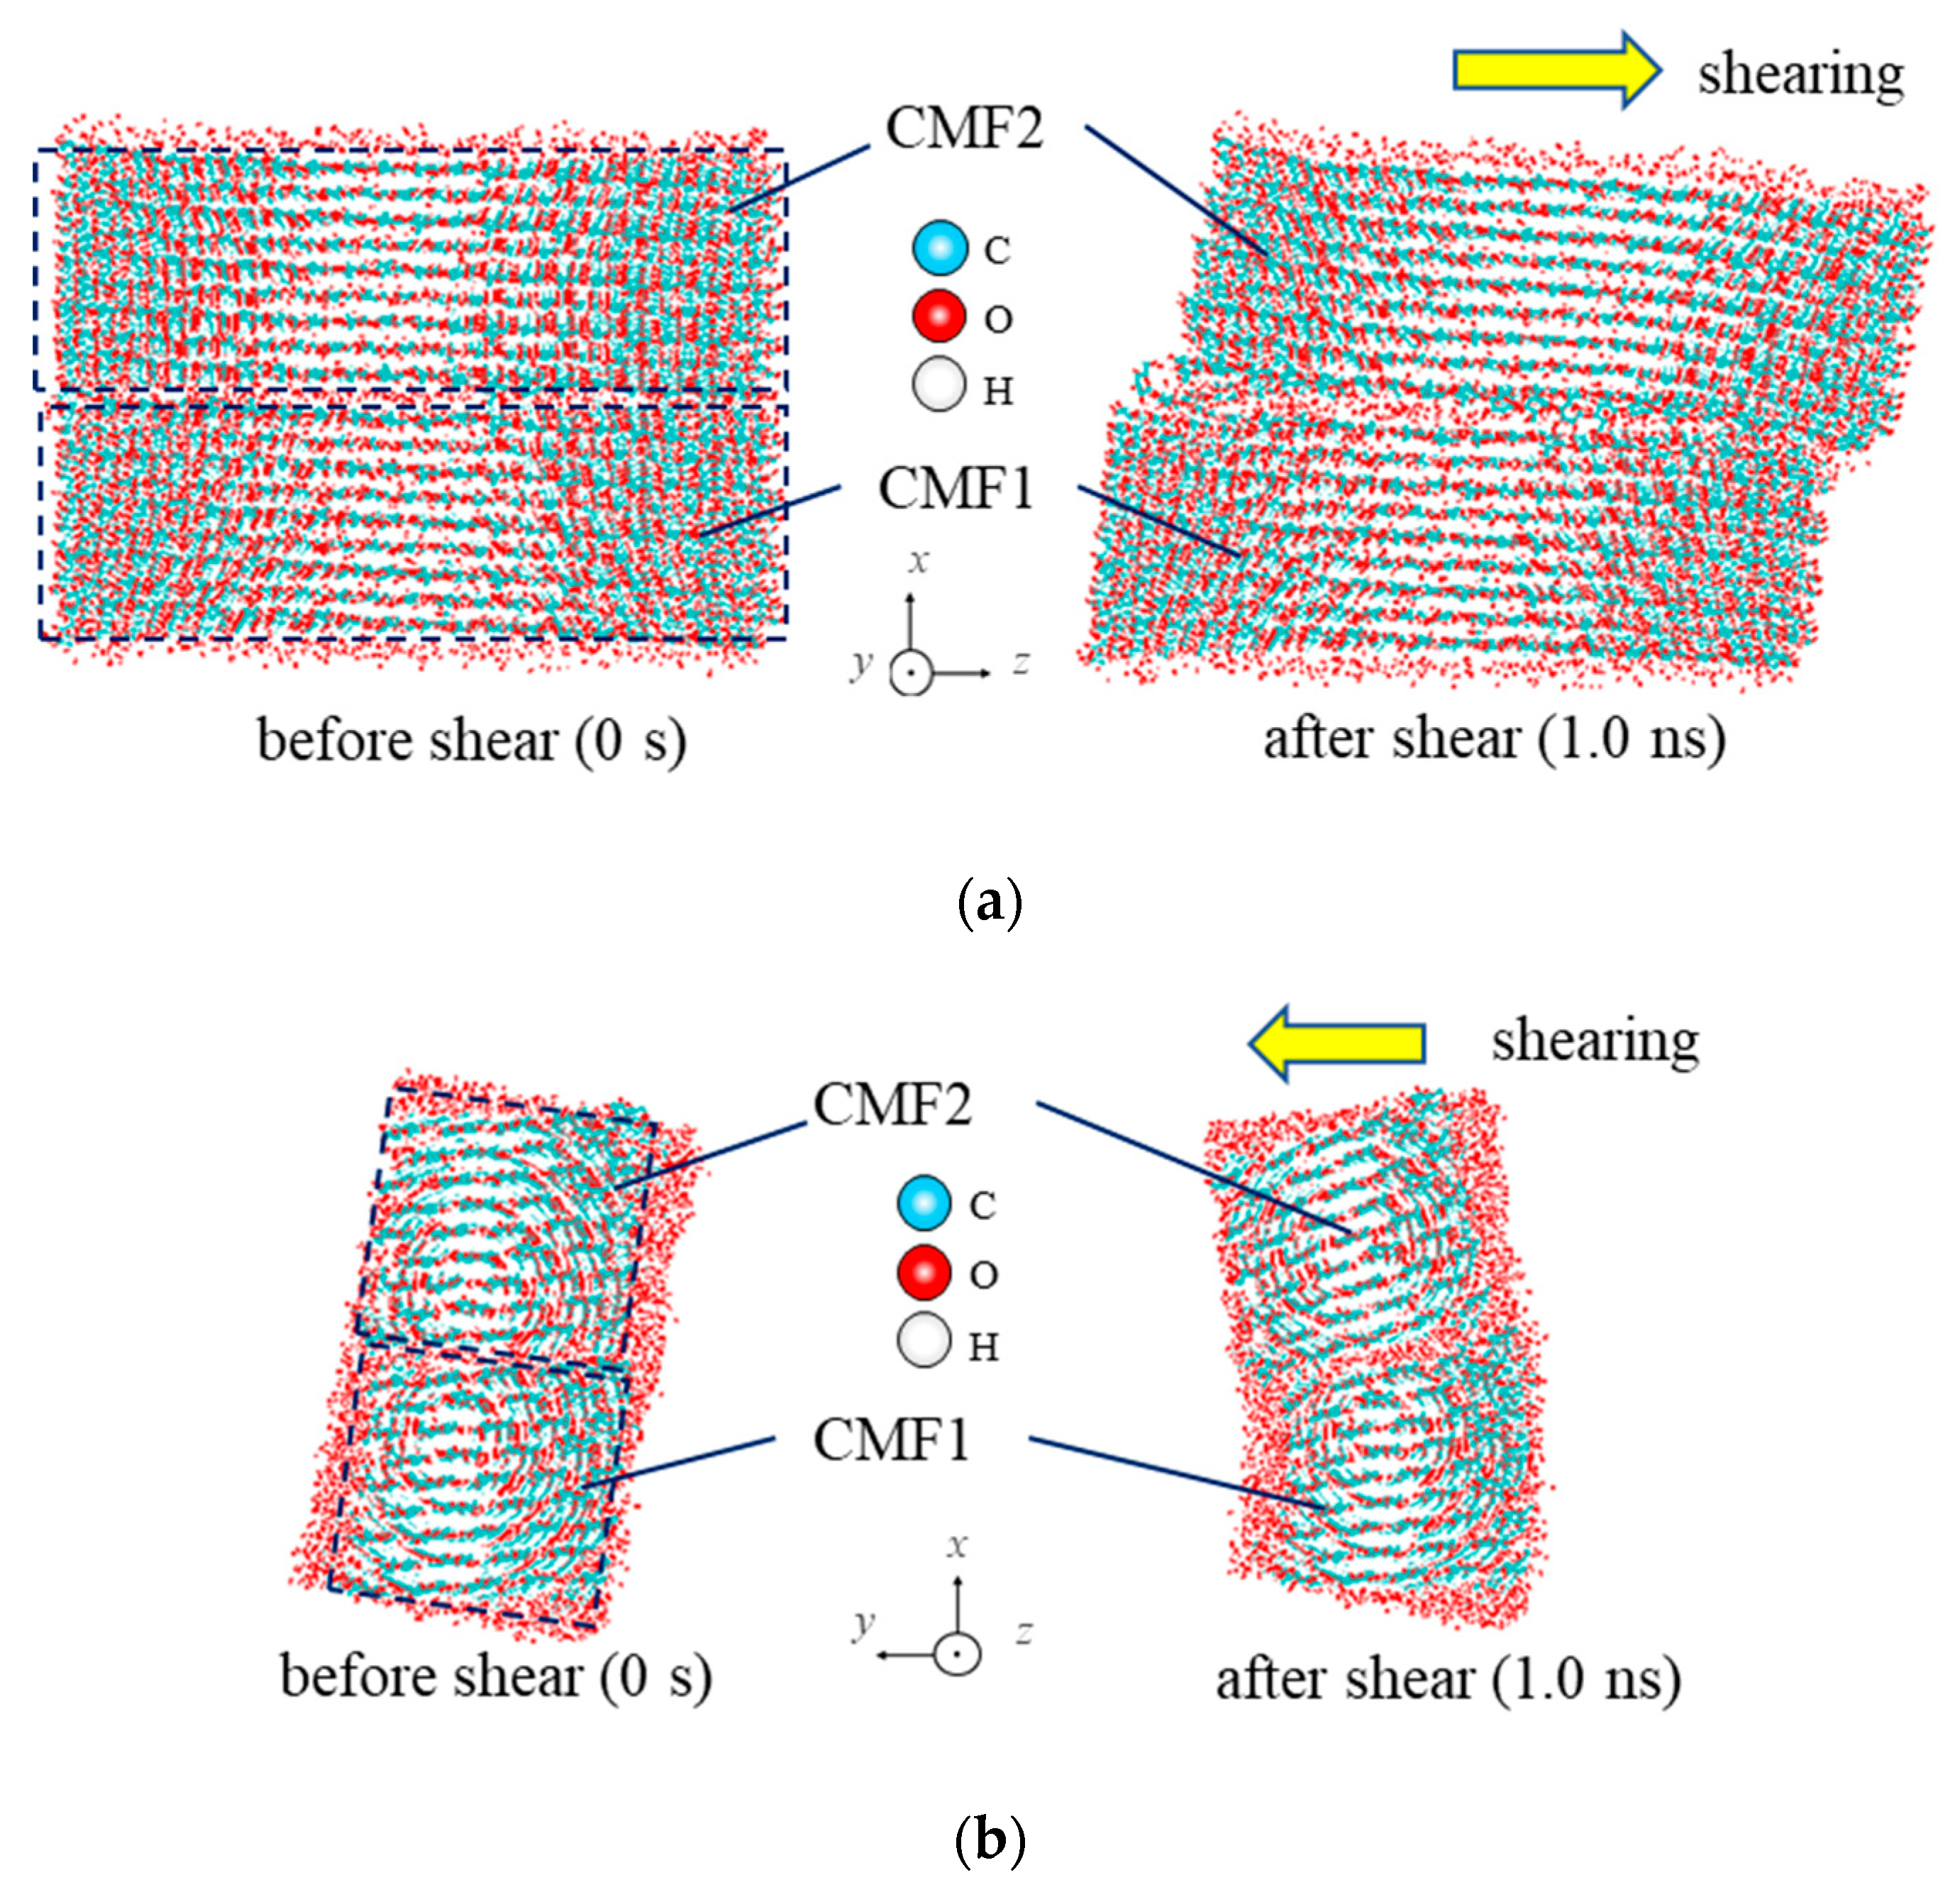
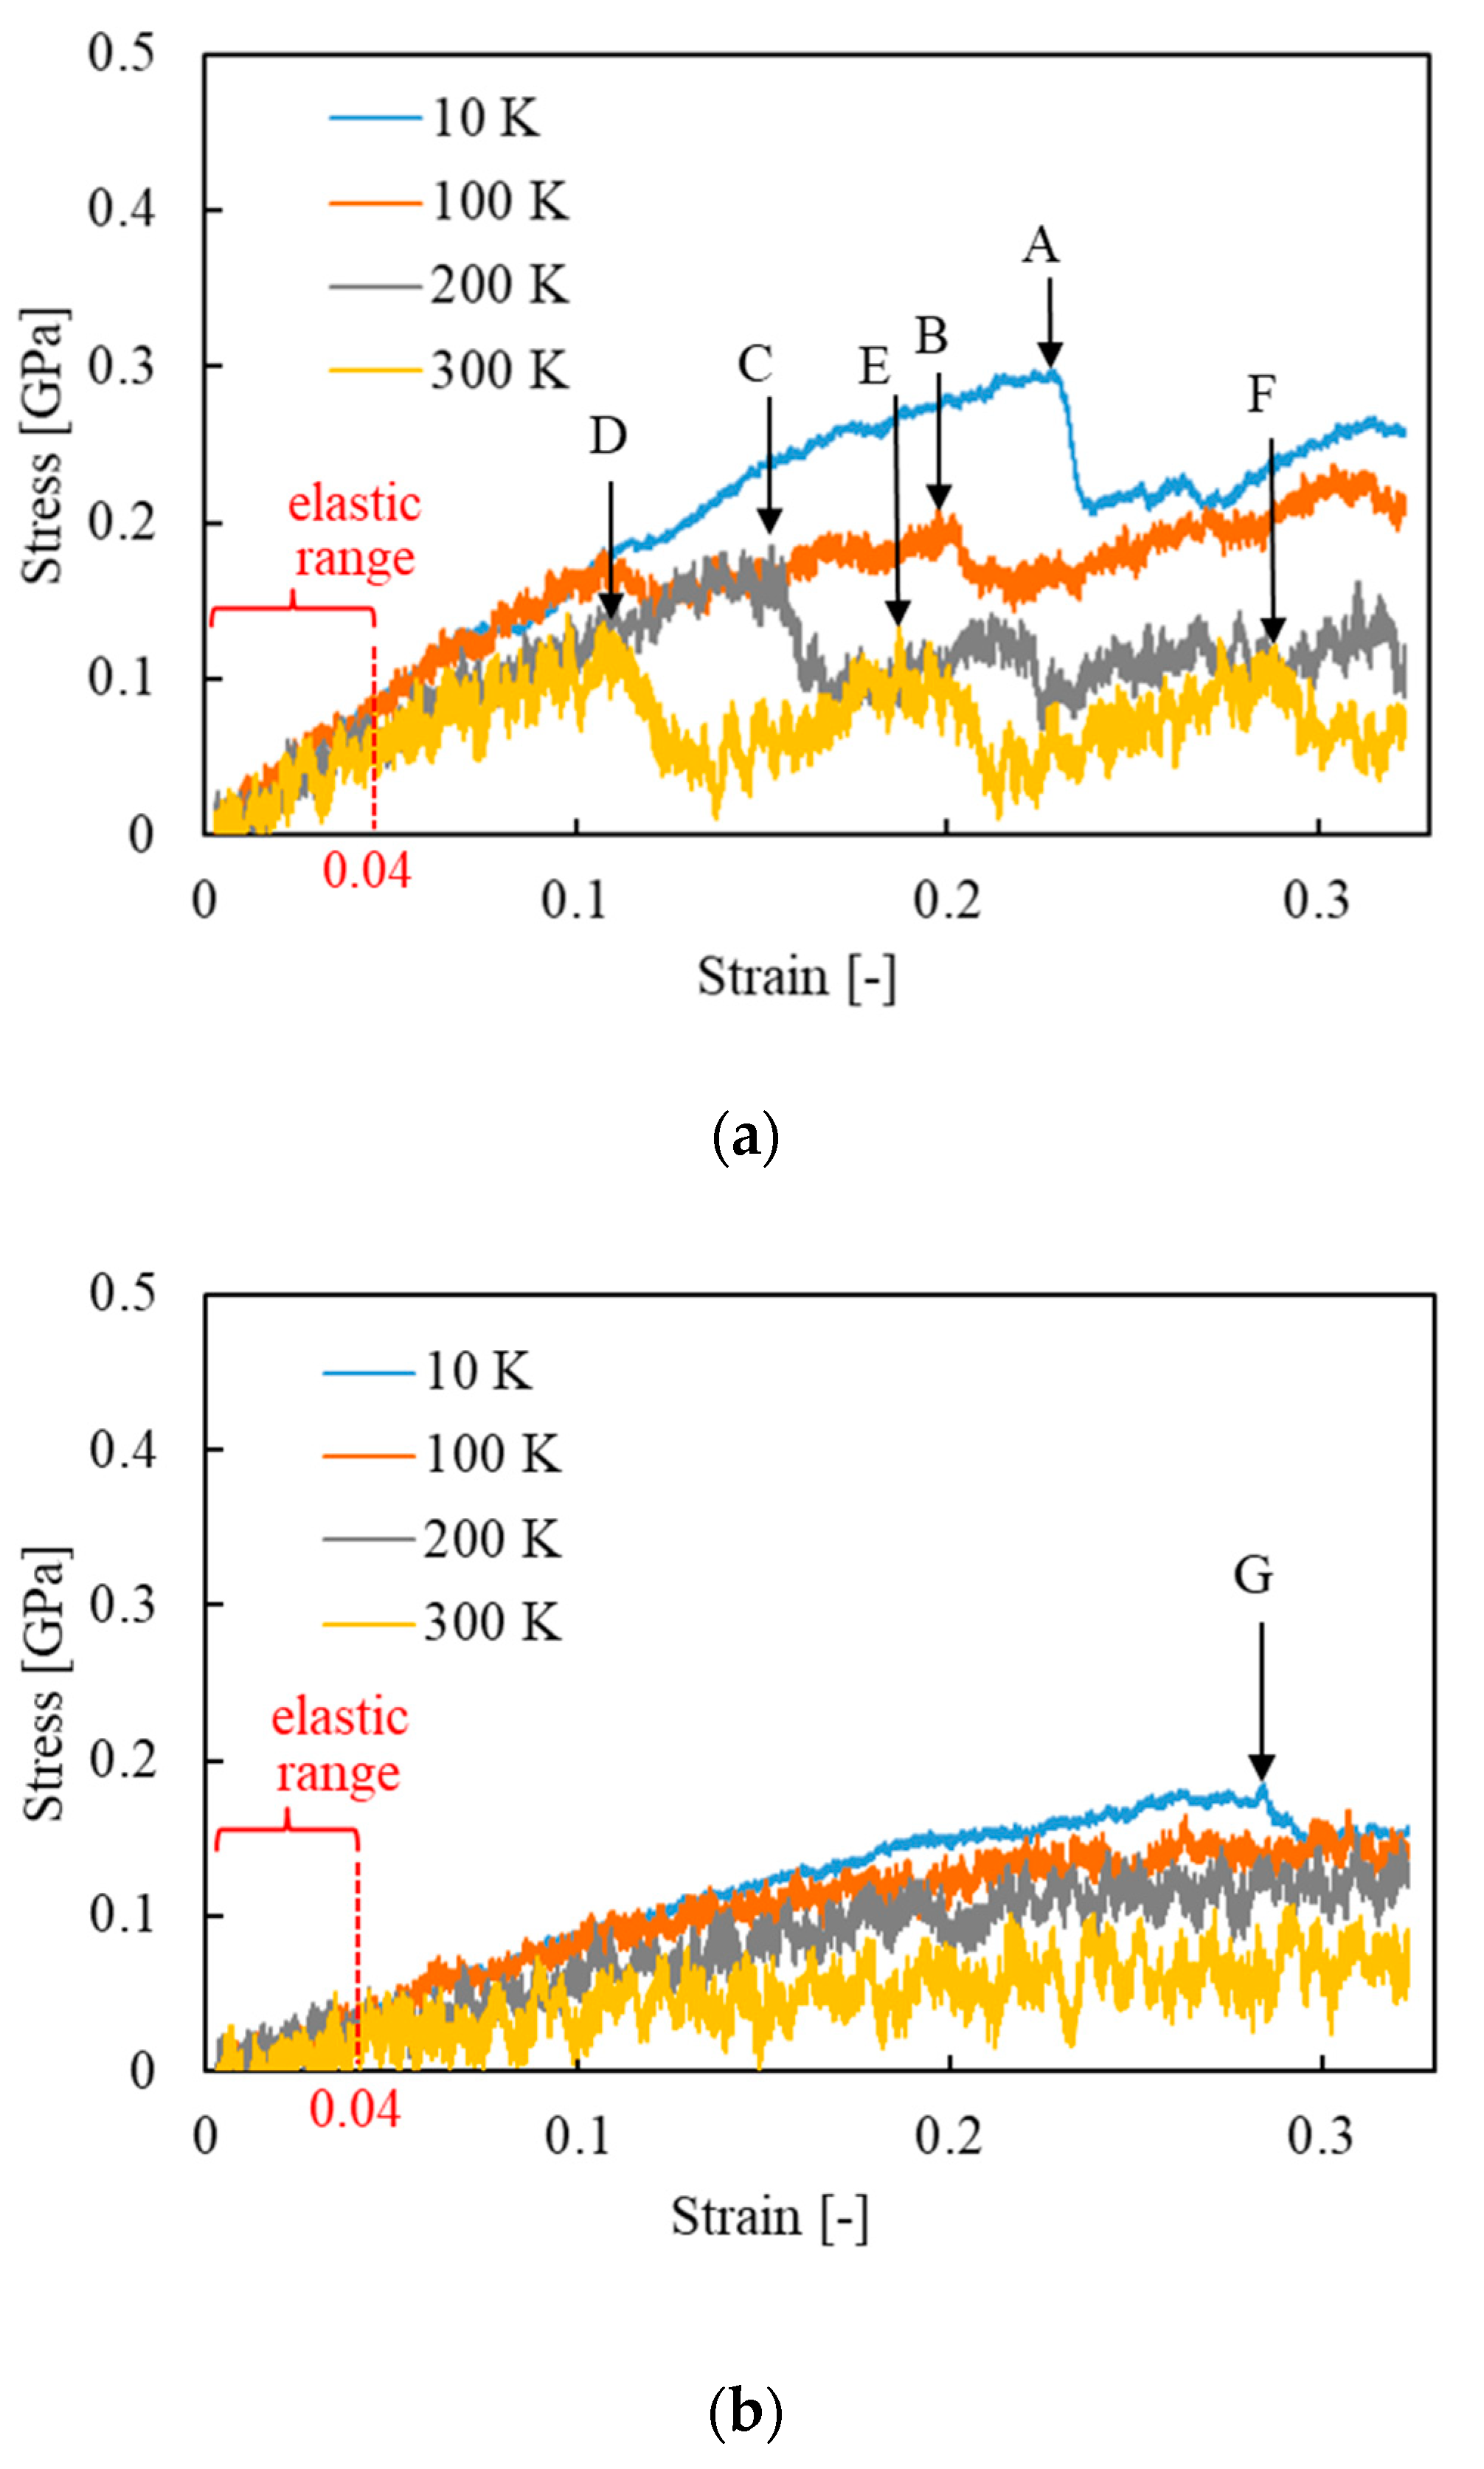
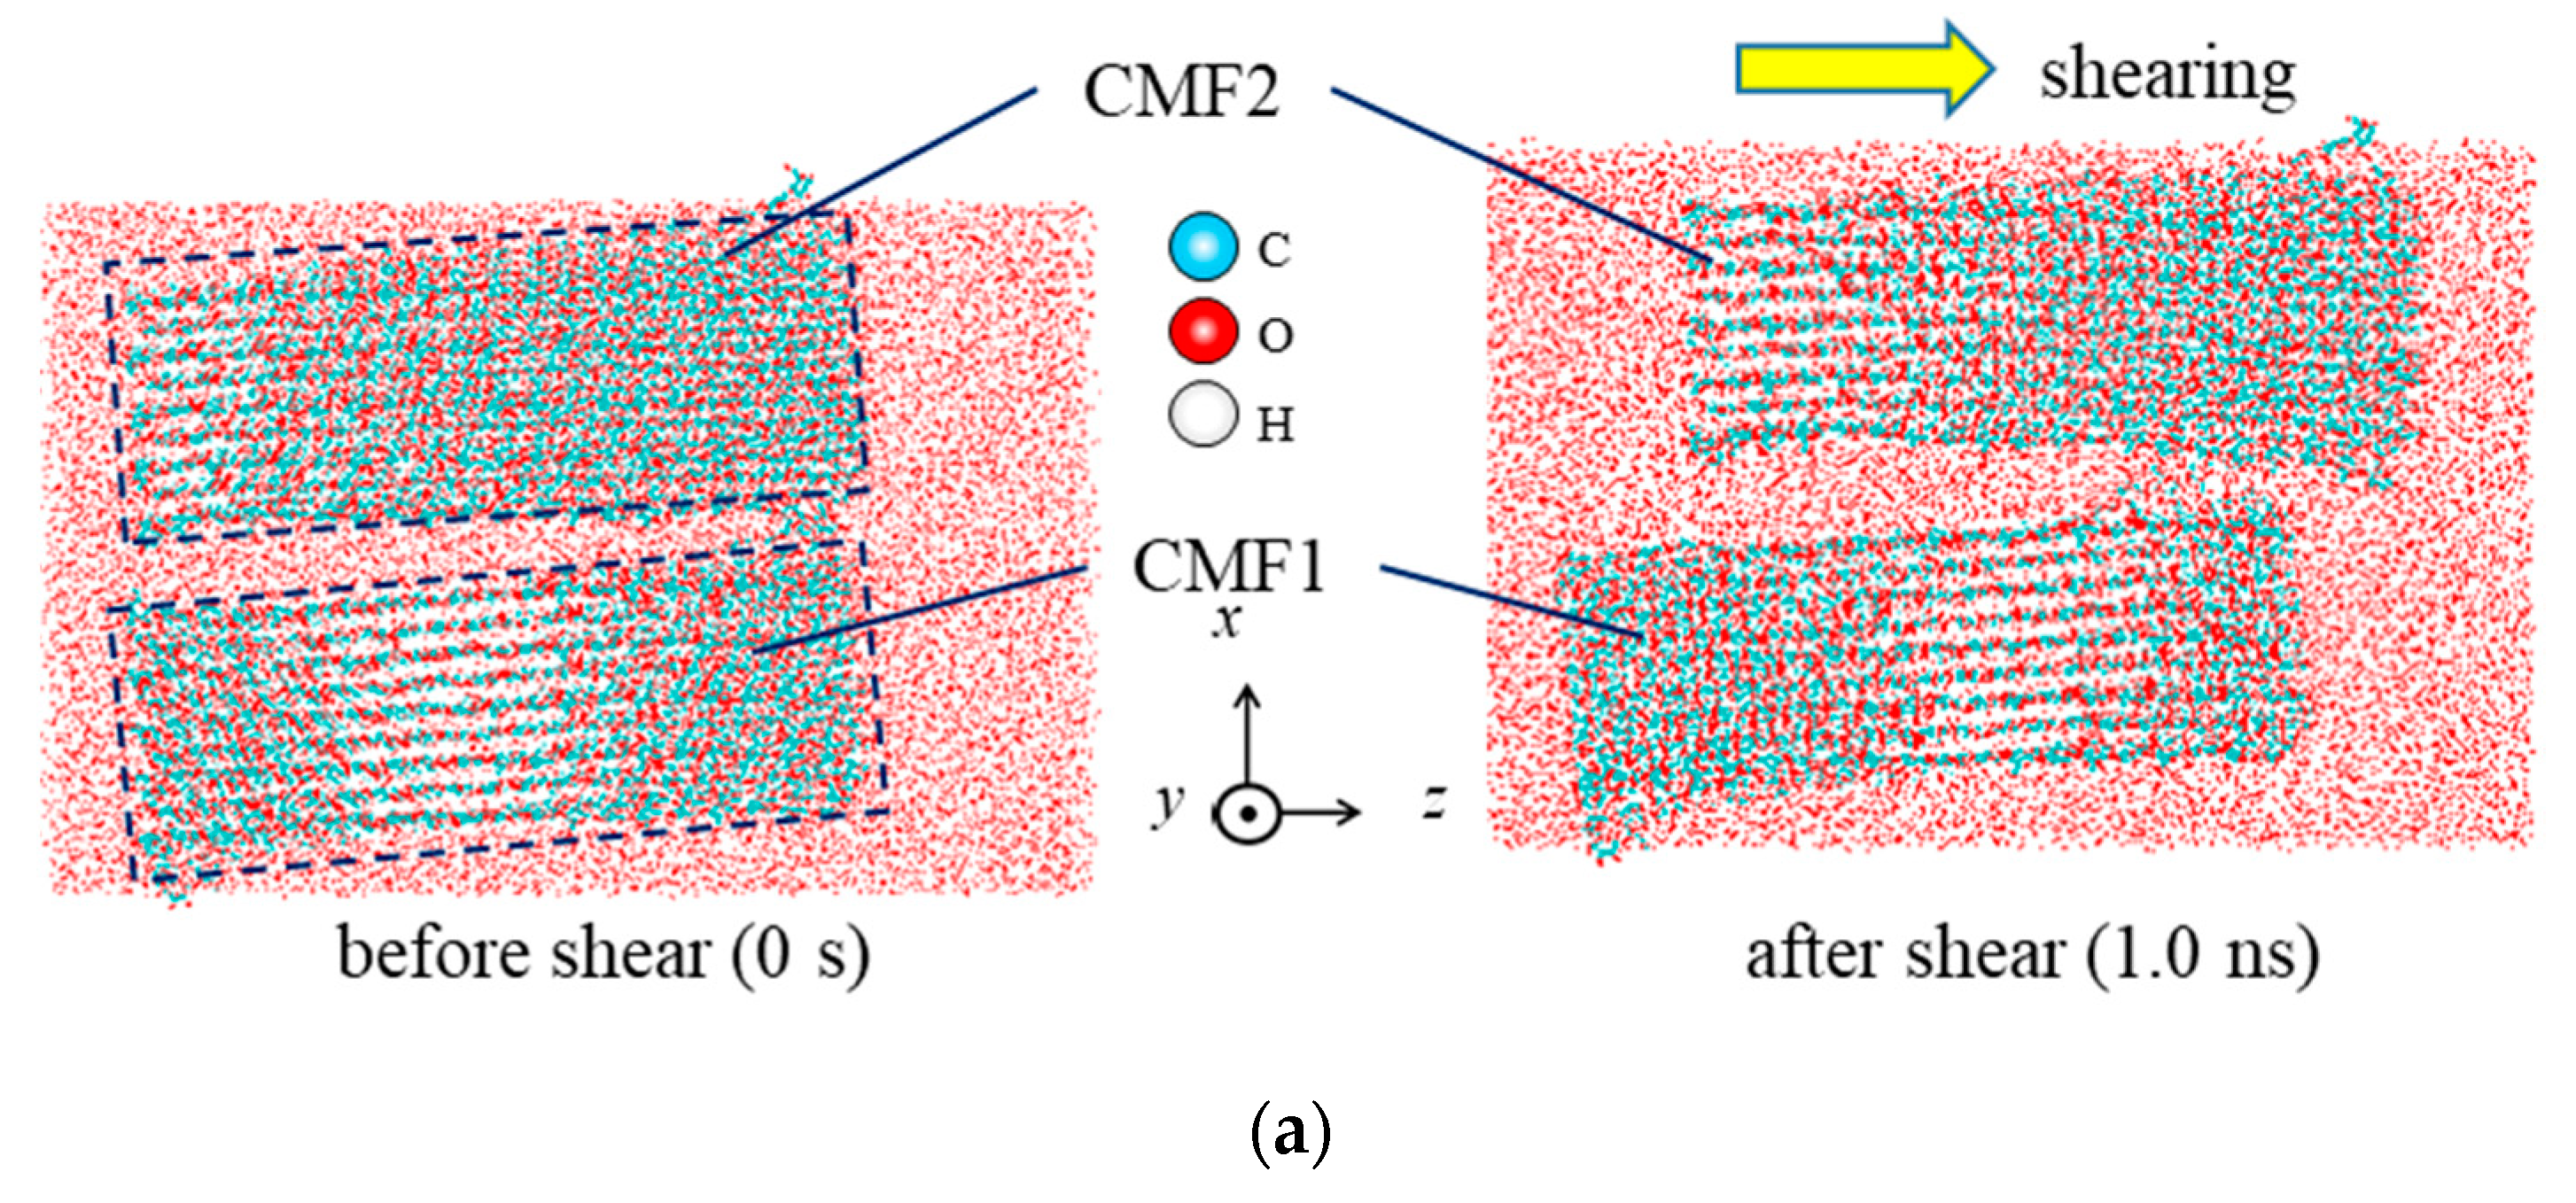
In vacuum condition, shear failure may occur inside the CMF, not at the interface. In the water condition, interfacial slip tends to occur in shear deformation.
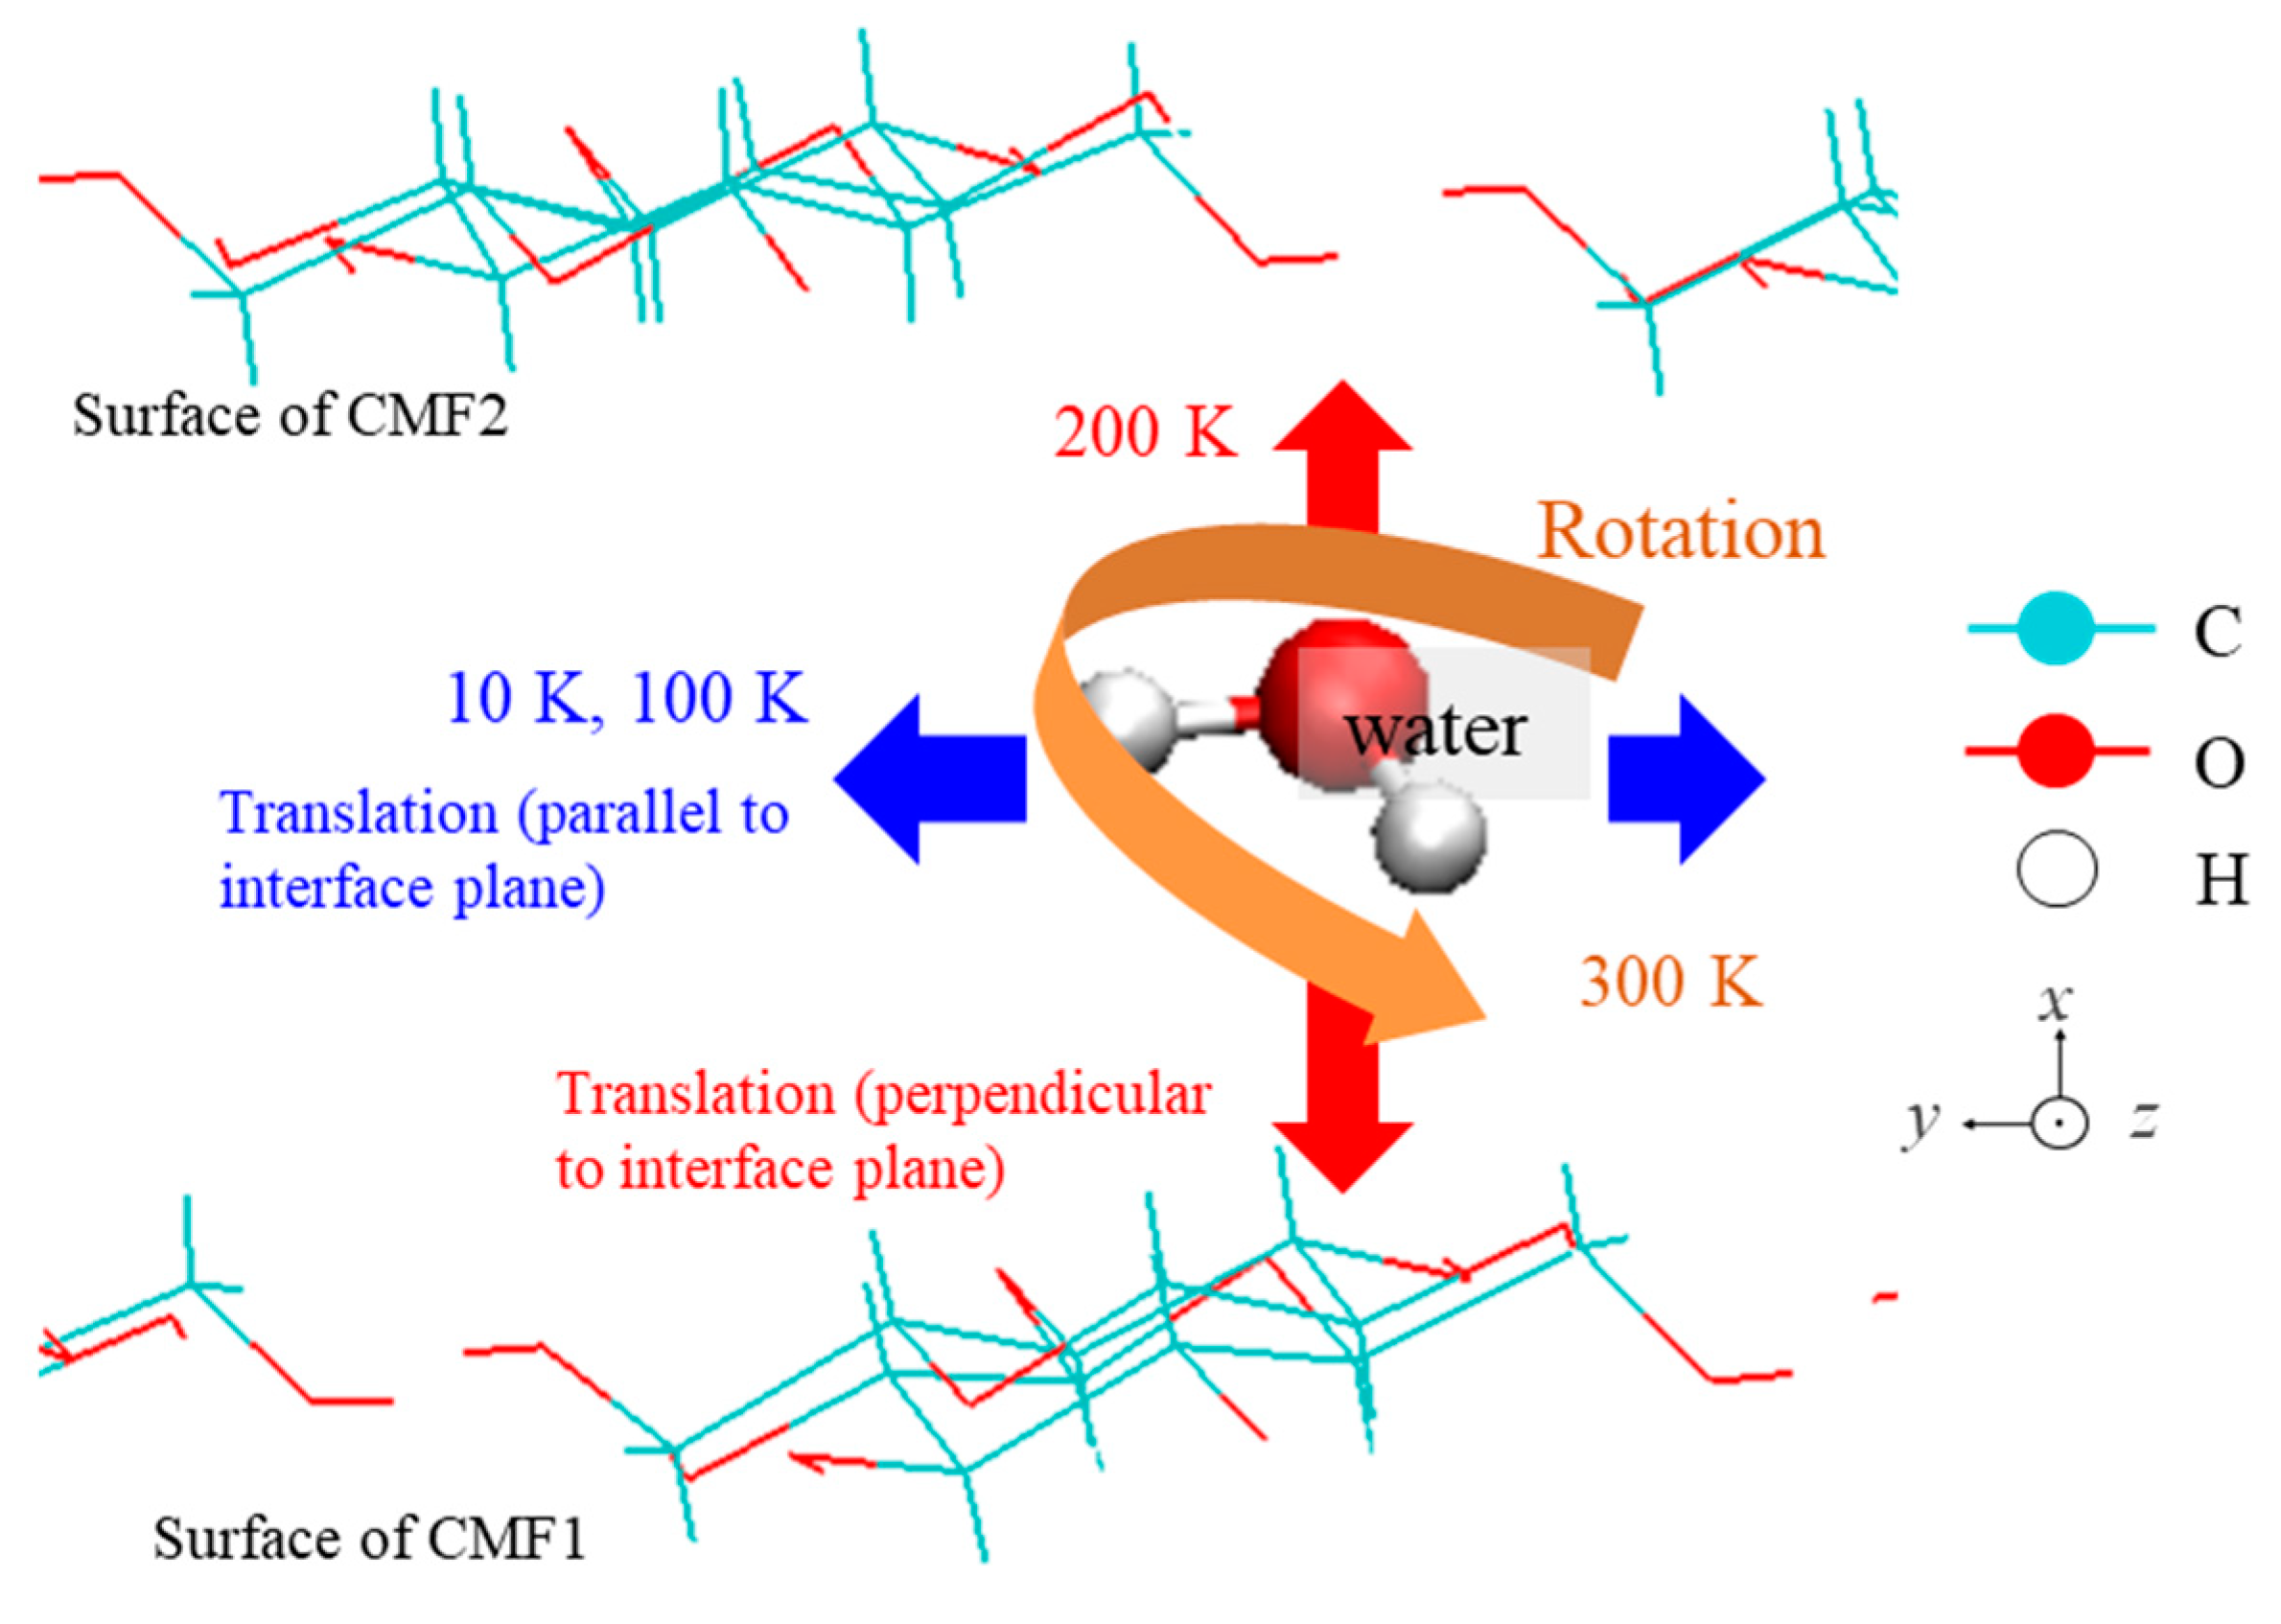
The behavior of the water molecules at the interface is largely changed by the temperature. For example, at 300 K, the hydrogen bonds between the surfaces via water the molecules were reduced, and both the shear modulus and shear strength showed smaller values than in the vacuum condition.
There is strong anisotropy in shear moduli. The strength depends on the joining direction, with regard to the direction of molecular sheets.
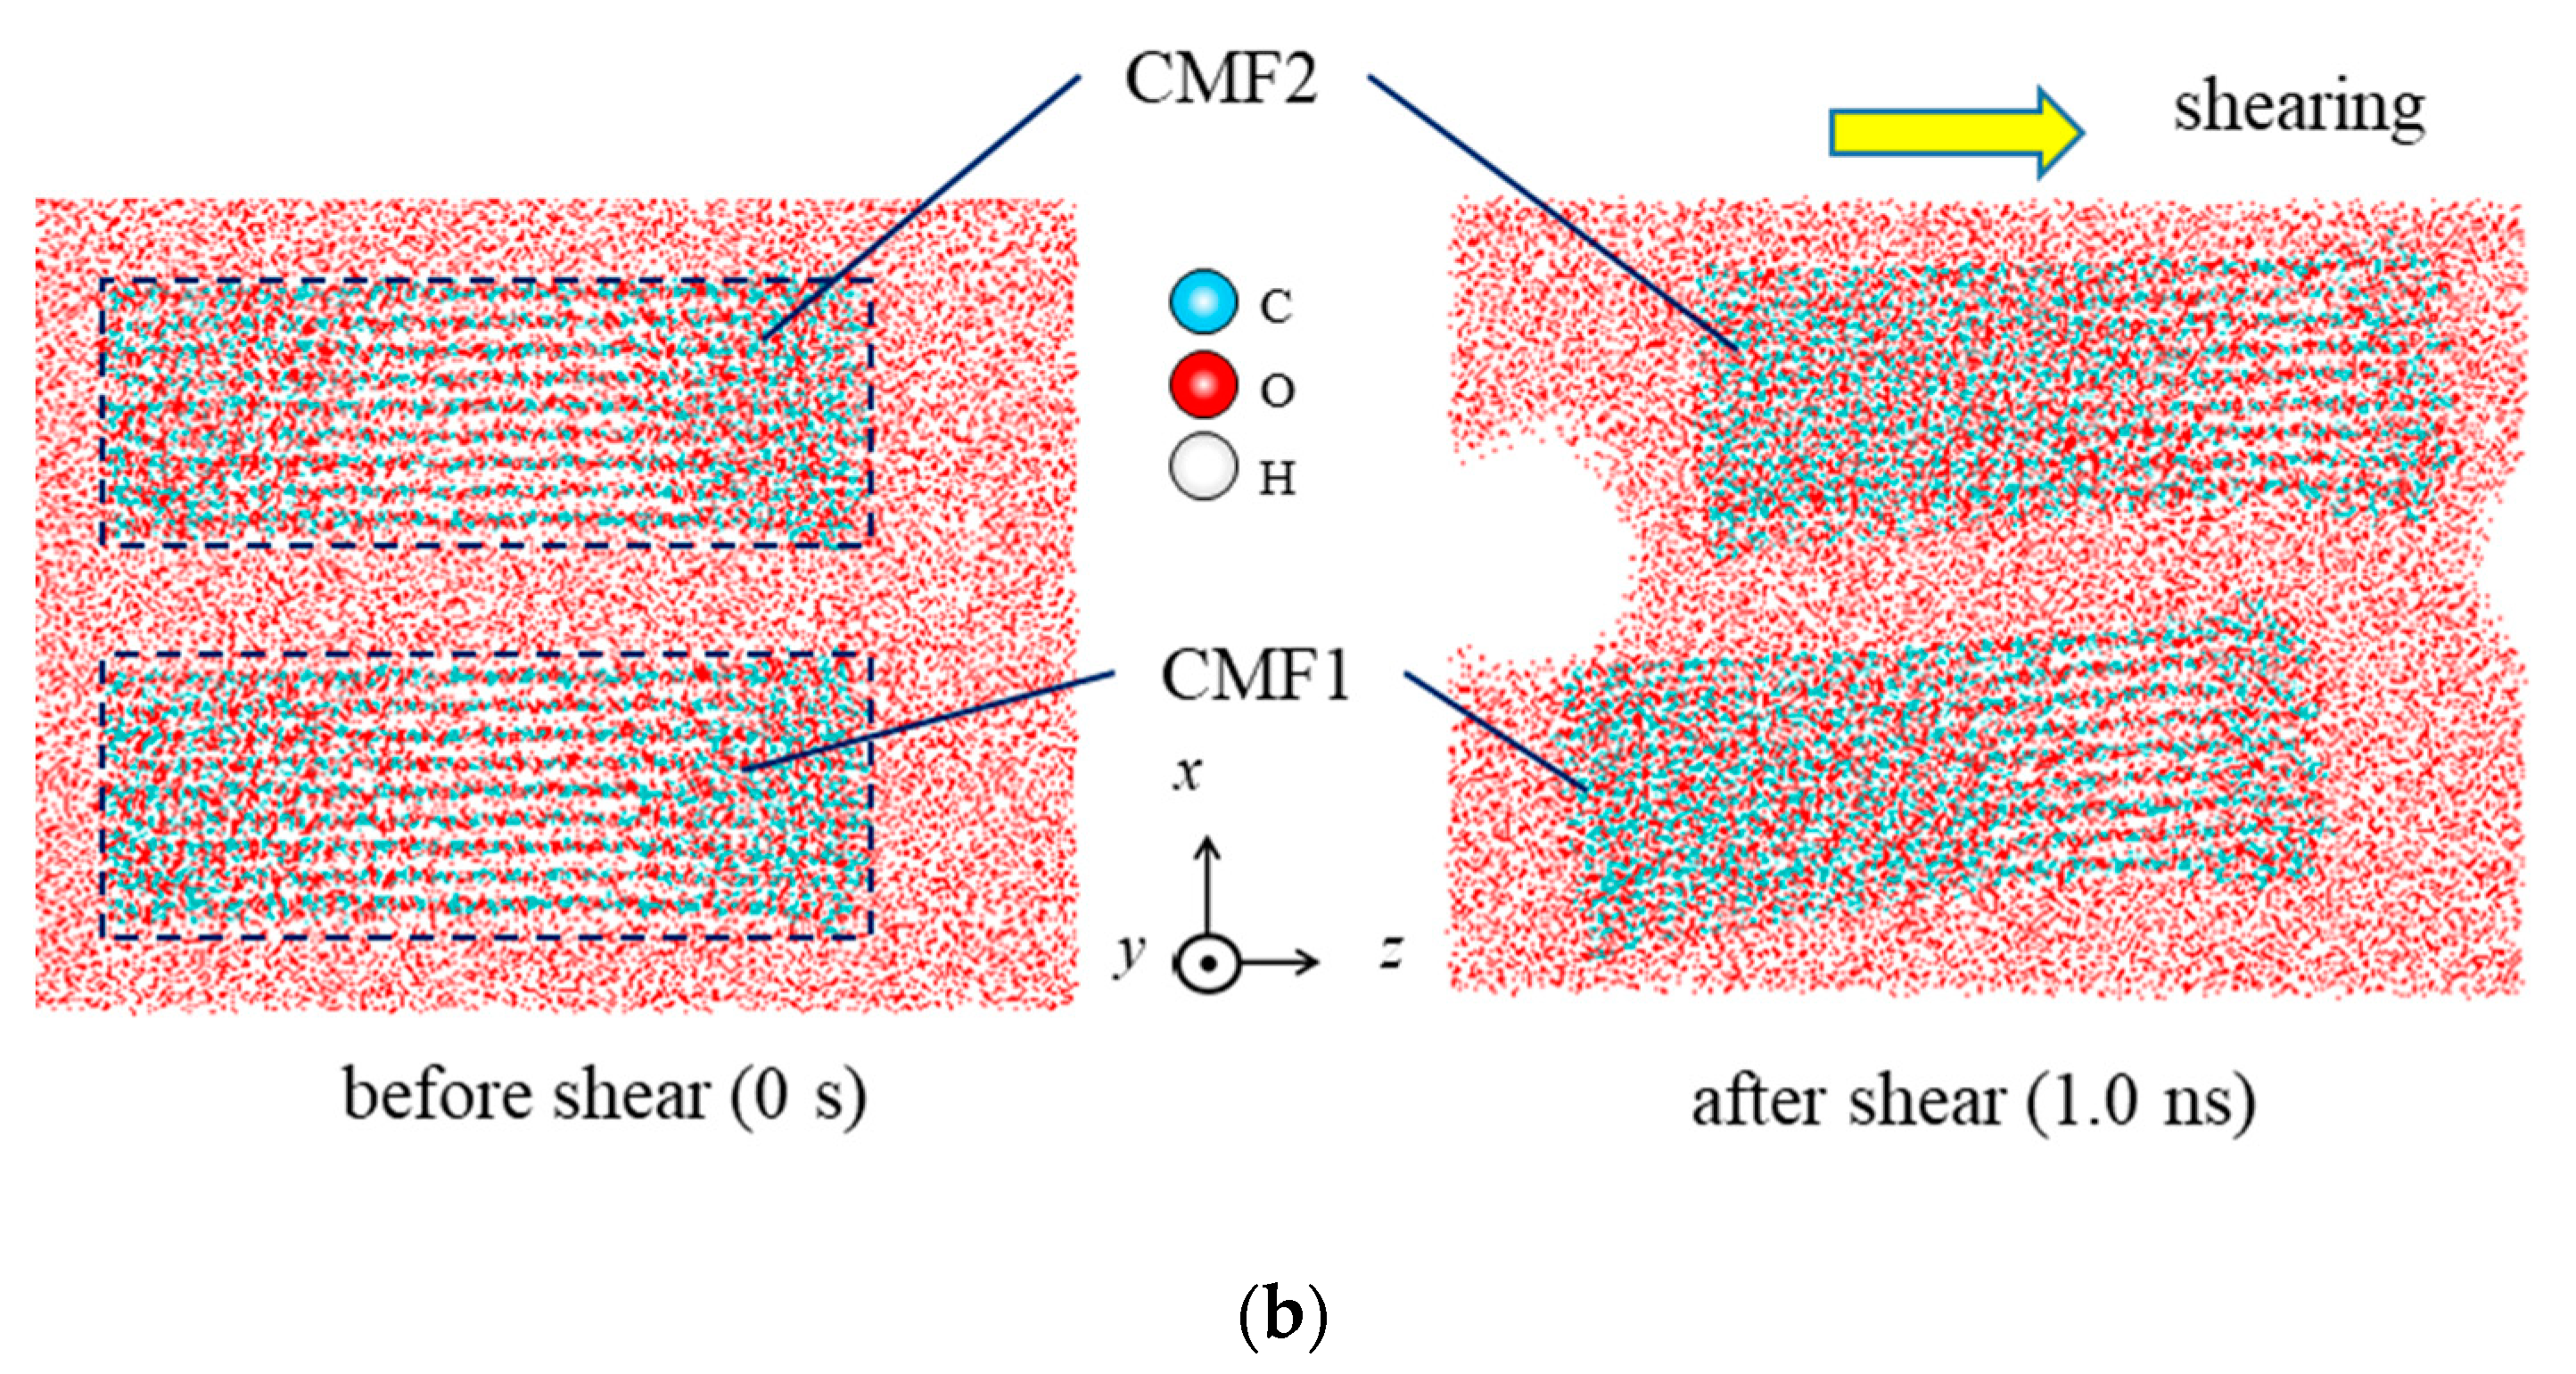
When the length of water thickness exceeds 0.35 or 0.7 nm, the hydrogen bonds cannot directly connect two CMFs, interfacial sliding occurs easily, and shear stress on average is reduced to almost zero.
As a final remark, as a future study, we will make larger and multi-level hierarchical structures of CMFs, so as to discuss an actual situation of CNF materials, based on the all-atom methodology constructed in the present study, which will be successfully applied there with the help of the computational power, which we believe will be continuously developing.

Supplementary Materials

The following supporting information can be downloaded at: https://www.mdpi.com/article/10.3390/applmech4010013/s1, Supporting Information for: Shear deterioration of the hierarchical structure of cellulose microfibrils under water condition: all-atom molecular dynamics analysis.

Author Contributions

Conceptualization, K.-i.S. and Y.I.; methodology, K.-i.S. and Y.I.; software, K.-i.S. and Y.I.; validation, K.-i.S., Y.I. and T.S.; formal analysis, Y.I. and K.-i.S.; investigation, Y.I. and K.-i.S.; resources, K.-i.S., T.S., M.T. and Y.T.; data curation, K.-i.S. and Y.I.; writing—original draft preparation, Y.I. and K.-i.S.; writing—review and editing, K.-i.S.; visualization, Y.I. and K.-i.S.; supervision, K.-i.S., T.S., M.T. and Y.T.; project administration, K.-i.S.; funding acquisition, K.-i.S., T.S., M.T. and Y.T. All authors have read and agreed to the published version of the manuscript.

Funding

This research was funded by JSPS.KAKENHI grant number 21K03759 and by the Kansai University Fund for the Promotion and Enhancement of Education and Research, 2022.

Institutional Review Board Statement

Not applicable.

Informed Consent Statement

Not applicable.

Data Availability Statement

The data presented in this study are available in the article and supplementary Materials.

Conflicts of Interest

The authors declare no conflict of interest.

References

  1. Klemm, D.; Kramer, F.; Moritz, S.; Lindström, T.; Ankerfors, M.; Gray, D.; Dorris, A. Nanocelluloses: A New Family of nature-based materials. Angew. Chem. Int. Ed. 2011, 50, 5438–5466. [Google Scholar] [CrossRef] [PubMed]
  2. Moon, R.J.; Martini, A.; Nairn, J.; Simonsen, J.; Youngblood, J. Cellulose nanomaterials review: Structure, properties and nanocomposites. Chem. Soc. Rev. 2011, 40, 3941–3994. [Google Scholar] [CrossRef] [PubMed]
  3. Lee, K.-Y.; Aitomäki, Y.; Berglund, L.A.; Oksman, K.; Bismarck, A. On the use of nanocellulose as reinforcement in polymer matrix composites. Compos. Sci. Technol. 2014, 105, 15–27. [Google Scholar] [CrossRef] [Green Version]
  4. Reising, A.B.; Moon, R.J.; Youngblood, J.P. Effect of particle alignment on mechanical properties of neat cellulose nanocrystal films. J. Sci. Technol. Forest Prod. Process. 2012, 2, 32–41. Available online: https://www.fs.usda.gov/treesearch/pubs/44003 (accessed on 15 January 2023).
  5. Nishino, T. Structures and critical mechanical properties of cellulose. J. Soc. Mater. Sci. Jpn. 2008, 57, 97–103. [Google Scholar] [CrossRef] [Green Version]
  6. Milanez, D.H.; Morato do Amaral, R.; Lopes de Faria, L.I.; Gregolin, J.A.R. Technological indicators of nanocellulose advances obtained from data and text mining applied to patent documents. Mater. Res. 2014, 17, 1513–1522. [Google Scholar] [CrossRef] [Green Version]
  7. Guhados, G.; Wan, W.; Hutter, J.L. Measurement of the elastic modulus of single bacterial cellulose fibers using atomic force microscopy. Langmuir 2005, 21, 6642–6646. [Google Scholar] [CrossRef]
  8. Wu, X.; Moon, R.J.; Martini, A. Tensile strength of Iβ crystalline cellulose predicted by molecular dynamics simulation. Cellulose 2014, 21, 2233–2245. [Google Scholar] [CrossRef]
  9. Heiner, A.P.; Teleman, O. Structural reporter parameters for the characterisation of crystalline cellulose. Pure Appl. Chem. 1996, 68, 2187–2192. [Google Scholar] [CrossRef] [Green Version]
  10. Yui, T.; Nishimura, S.; Akiba, S.; Hayashi, S. Swelling behavior of the cellulose Iβ crystal models by molecular dynamics. Carbohydr. Res. 2006, 341, 2521–2530. [Google Scholar] [CrossRef]
  11. Nishiyama, Y.; Johnson, G.P.; French, A.D. Diffraction from nonperiodic models of cellulose crystal. Cellulose 2012, 19, 319–336. [Google Scholar] [CrossRef]
  12. Hadden, J.A.; French, A.D.; Woods, R.J. Effect of microfibril twisting on theoretical powder diffraction patterns of cellulose Iβ. Cellulose 2014, 21, 879–884. [Google Scholar] [CrossRef] [PubMed] [Green Version]
  13. Shklyaev, O.E.; Kubicki, J.D.; Watts, H.D.; Crespi, V.H. Constraints on Iβ cellulose twist from DFT calculations of 13C NMR chemical shifts. Cellulose 2014, 21, 3979–3991. [Google Scholar] [CrossRef]
  14. Uto, T.; Mawatari, S.; Yui, T. Theoretical study of the structural stability of molecular chain sheet models of cellulose crystal allomorphs. J. Phys. Chem. B 2014, 118, 9313–9321. [Google Scholar] [CrossRef]
  15. Paavilainen, S.; Róg, T.; Vattulainen, I. Analysis of twisting of cellulose nanofibrils in atomistic molecular dynamics simulations. J. Phys. Chem. B 2011, 115, 3747–3755. [Google Scholar] [CrossRef] [PubMed]
  16. Kannam, S.K.; Oehme, D.P.; Doblin, M.S.; Gidley, M.J.; Bacic, A.; Downton, M.T. Hydrogen bonds and twist in cellulose microfibrils. Carbohydr. Polym. 2017, 175, 433–439. [Google Scholar] [CrossRef] [Green Version]
  17. Wang, J.-S.; Wang, G.; Feng, X.-Q.; Kitamura, T.; Kang, Y.-L.; Yu, S.-W.; Qin, Q.-H. Hierarchical chirality transfer in the growth of towel gourd tendrils. Sci. Rep. 2013, 3, 3102. [Google Scholar] [CrossRef] [PubMed] [Green Version]
  18. Northolt, M.G.; Boerstoel, H.; Maatman, H.; Huisman, R.; Veurink, J.; Elzerman, H. The structure and properties of cellulose fibres spun from an anisotropic phosphoric acid solution. Polymer 2001, 42, 8249–8264. [Google Scholar] [CrossRef]
  19. Zhao, Z.; Shklyaev, O.E.; Nili, A.; Mohamed, M.N.A.; Kubicki, J.D.; Crespi, V.H.; Zhong, L. Cellulose microfibril twist, mechanics, and implication for cellulose biosynthesis. J. Phys. Chem. A 2013, 117, 2580–2589. [Google Scholar] [CrossRef]
  20. Takada, K.; Saitoh, K.-I.; Takuma, M.; Takahashi, Y.; Sato, T. Molecular dynamics study on transmission mechanism of torsional deformation in cellulose nanofibers with hierarchical structure. Soft Nanosci. Lett. 2019, 9, 45–57. [Google Scholar] [CrossRef] [Green Version]
  21. Izumi, Y.; Saitoh, K.; Takuma, M.; Takahashi, Y.; Sato, T. Mechanical behavior and hierarchical transmission mMechanism of cellulose nanofiber by all-atom molecular dynamics model. Proc. Mech. Eng. Congr. Jpn. 2020, 2020, J03132. [Google Scholar] [CrossRef]
  22. Sinko, R.; Keten, S. Traction–separation laws and stick–slip shear phenomenon of interfaces between cellulose nanocrystals. J. Mech. Phys. Solid. 2015, 78, 526–539. [Google Scholar] [CrossRef] [Green Version]
  23. Hou, Y.; Guan, G.-F.; Xia, J.; Ling, Z.-C.; He, Z.; Han, Z.-M.; Yang, H.-B.; Gu, P.; Zhu, Y.; Yu, S.-H.; et al. Strengthening and toughening hierarchical nanocellulose via humidity-mediated interface. ACS Nano 2021, 15, 1310–1320. [Google Scholar] [CrossRef]
  24. Paajanen, A.; Ceccherini, S.; Maloney, T.; Ketoja, J.A. Chirality and bound water in the hierarchical cellulose structure. Cellulose 2019, 26, 5877–5892. [Google Scholar] [CrossRef] [Green Version]
  25. Hoeger, I.; Rojas, O.J.; Efimenko, K.; Velev, O.D.; Kelley, S.S. Ultrathin film coatings of aligned cellulose nanocrystals from a convective-shear assembly system and their surface mechanical properties. Soft Matter 2011, 7, 1957–1967. [Google Scholar] [CrossRef]
  26. Allen, M.P.; Tildesley, D.J. Computer Simulation of Liquids, 2nd ed.; Oxford University Press: Oxford, UK, 2017; ISBN 9780198803195. [Google Scholar]
  27. Lesar, R. Introduction to Computational Materials Science: Fundamentals to Applications; Cambridge University Press: Cambridge, UK, 2014; ISBN 0521845874. [Google Scholar]
  28. Phillips, J.C.; Braun, R.; Wang, W.; Gumbart, J.; Tajkhorshid, E.; Villa, E.; Chipot, C.; Skeel, R.D.; Kale, L.; Schulten, K. Scalable molecular dynamics with NAMD. J. Comp. Chem. 2005, 26, 1781–1802. [Google Scholar] [CrossRef] [Green Version]
  29. Mackerell, A.D.; Bashford, D.; Bellontt, M.; Dunbrack, R.L.; Evanseck, J.D.; Field, M.J.; Fischer, S.M.; Gao, J.; Guo, H.; Ha, S.; et al. All-atom empirical potential for molecular modeling dynamics studies of proteins. J. Phys. Chem. B 1998, 102, 3586–3616. [Google Scholar] [CrossRef] [PubMed]
  30. Matthews, J.F.; Beckham, G.T.; Bergenstrahle-Wohlert, M.; Brady, J.W.; Himmel, M.E.; Crowley, M.F. Comparison of cellulose Iβ simulations with three carbohydrate force fields. J. Chem. Theory Comput. 2012, 8, 735–748. [Google Scholar] [CrossRef]
  31. Miyamoto, H.; Schnupf, U.; Crowley, M.F.; Brady, J.W. Comparison of the simulations of cellulosic crystals with three carbohydrate force fields. Carbohydr. Res. 2016, 422, 17–23. [Google Scholar] [CrossRef] [Green Version]
  32. Gomes, T.C.F.; Skaf, M.S. Cellulose-Builder: A toolkit for building crystalline structures of cellulose. J. Comp. Chem. 2012, 33, 1338–1346. [Google Scholar] [CrossRef]
  33. Jakob, H.F.; Fengel, D.; Tschegg, S.E.; Fratzl, P. The Elementary Cellulose Fibril in Picea abies: Comparison of transmission electron microscopy, small-angle X-ray scattering, and wide-angle X-ray scattering results. Macromolecules 1995, 28, 8782–8787. [Google Scholar] [CrossRef]
  34. Schlick, T. Molecular Modeling and Simulation: An Interdisciplinary Guide; Springer Science+Business Media: New York, NY, USA, 2002; p. 435. ISBN 978-0-387-22464-0. Available online: https://link.springer.com/book/10.1007/978-0-387-22464-0 (accessed on 15 January 2023).
  35. Hardy, D.J.; Wu, Z.; Phillips, J.C.; Stone, J.E.; Skeel, R.D.; Schulten, K. Multilevel summation, method for electrostatic force evaluation. J. Chem. Theory Comput. 2015, 11, 766–779. [Google Scholar] [CrossRef] [PubMed] [Green Version]
  36. Humphrey, W.; Dalke, A.; Schulten, K. VMD: Visual molecular dynamics. J. Mol. Graph. 1996, 14, 33–38. [Google Scholar] [CrossRef] [PubMed]
  37. Koch, M.; Tenbohlen, S.; Stirl, T. Diagnostic application of moisture equilibrium for power transformers. IEEE Trans. Power Deliv. 2010, 25, 2574–2581. [Google Scholar] [CrossRef]
  38. Take, Y.; Ota, T.; Yasoshima, H. Problems on paper strength: Chap. 4, Effect of moisture containing on paper strength. Jpn. TAPPI J. 1964, 18, 155–159. (In Japanese) [Google Scholar] [CrossRef]
  39. Fernandes, A.N.; Thomas, L.H.; Altaner, C.M.; Callow, P.; Forsyth, V.T.; Apperley, D.C.; Kennedy, C.J.; Jarvis, M.C. Nanostructure of cellulose microfibrils in spruce wood. Proc. Natl. Acad. Sci. USA 2011, 108, E1195–E1203. [Google Scholar] [CrossRef] [Green Version]
  40. Niinivaara, E.; Faustini, M.; Tammelin, T.; Kontturi, E. Water vapor uptake of ultrathin films of biologically derived nanocrystals: Quantitative assessment with quartz crystal microbalance and spectroscopic ellipsometry. Langmuir 2015, 31, 12170–12176. [Google Scholar] [CrossRef] [PubMed]
  41. Steered/Interactive Molecular Dynamics. Available online: http://www.ks.uiuc.edu/Research/smd_imd/ (accessed on 10 January 2023).
  42. Pradhan, S.M.; Katti, D.R.; ASCE, M.; Katti, K.S. Steered molecular dynamics study of mechanical response of full length and short collagen molecules. J. Nanomech. Micromech. 2011, 1, 104–110. [Google Scholar] [CrossRef]
  43. Jeffrey, G.A. An Introduction to Hydrogen Bonding; Oxford University Press: New York, NY, USA, 1997; ISBN 0-19-509549-9. [Google Scholar]
  44. Muthoka, R.M.; Kim, H.C.; Kim, J.W.; Zhai, L.; Panicker, P.S.; Kim, J. Steered pull simulation to determine nanomechanical properties of cellulose nanofiber. Materials 2020, 13, 710. [Google Scholar] [CrossRef] [Green Version]
  45. Müller, U.; Sretenovic, A.; Gindl, W.; Teischinger, A. Longitudinal shear properties of Europe larch wood related to cell-wall structure. Wood Fiber Sci. 2004, 36, 143–151. Available online: http://wfs.swst.org/index.php/wfs/article/view/751 (accessed on 15 January 2023).
  46. Shishehbor, M.; Dri, F.L.; Moon, R.J.; Zavattieri, P.D. A continuum-based structural modeling approach for cellulose nanocrystals (CNCs). J. Mech. Phys. Solid. 2018, 111, 308–332. [Google Scholar] [CrossRef]
  47. Izumi, Y.; Saitoh, K.; Takuma, M.; Takahashi, Y.; Sato, T. Molecular dynamics analysis of shear deformation and friction behavior in hierarchical structure of cellulose nanofibers with water molecules. Proc. Mech. Eng. Congr. Jpn. 2021, 2021, J031-29. (In Japanese) [Google Scholar] [CrossRef]
Figure 1. Repeating unit (monomer) of cellulose molecule and TIP3P water model: (a) Repeating unit (monomer) of cellulose molecular model; (b) TIP3P water model.
Applmech 04 00013 g001
Figure 2. Molecular sheet and CMF model of cellulose Iβ: (a) Molecular sheet and hydrogen bond; (b) CMF model of cellulose Iβ.
Applmech 04 00013 g002aApplmech 04 00013 g002b
Figure 3. MD simulation model for the shear simulation of hierarchical structure: (a) Normal model in water; (b1) Thick A model; (b2) Thick B model; (c) Constraint condition for shear simulation.
Applmech 04 00013 g003
Figure 4. Theoretical shear stress and shear strain, as continuum is assumed.
Applmech 04 00013 g004
Figure 5. Hydrogen bond and parameters used for the definition.
Applmech 04 00013 g005
Figure 6. Cross sectional view at the interface of the hierarchical structure (CMFs are joined on x-plane, in water, at temperature T = 10 K).
Applmech 04 00013 g006
Figure 7. Shear simulations of hierarchical structure (in water and at temperature T =10 K): (a) shearing in xz direction (“xz-shear”); (b) shearing in xy direction (“xy-shear”).
Applmech 04 00013 g007
Figure 8. Stress–strain diagrams during shear simulations of the hierarchical structure (in water): (a) shear in xz direction (“xz-shear”); (b) shear in xy direction (“xy-shear”). The marks A– in figures indicate intense peak of stress.
Applmech 04 00013 g008
Figure 9. Relationship between shear modulus and temperature (in water).
Applmech 04 00013 g009
Figure 10. Schematic of the behavior of water molecule in interface of the hierarchical structure model.
Applmech 04 00013 g010
Figure 11. Relationship between shear strength and temperature (in water).
Applmech 04 00013 g011
Figure 12. Results of shear simulation of thick water A and B (TW-A, TW-B) models: (a) TW-A model (the spacing between CMFs is 1.4 nm); (b) TW-B model (the spacing between CMFs is 2.0 nm).
Applmech 04 00013 g012aApplmech 04 00013 g012b
Figure 13. Shear stress-shear strain diagram (xz-direction, at temperature T = 300 K).
Applmech 04 00013 g013
Figure 14. Relationship between water thickness and the averaged shear stress during shear process.
Applmech 04 00013 g014
Table 1. Parameters of repeating unit of cellulose molecule and TIP3P water model in the all-atom model.
PropertyValue
c (nm)1.038
d (nm)0.873
L OH (nm)0.09572
θ HOH   ( ° )104.52
q O   (e)−0.834
q H   (e)0.417
ε O   (kcal/mol)0.1521
σ O   (nm)0.3156
Table 2. Structural parameters of cellulose micro fibril (CMF).
PropertyValue(s)
Lattice parameter a, b, c (nm)0.7784, 0.8201, 1.038
Lattice parameter γ ( ° )83.5
Degree of polymerization10
The number of molecular chains41
The number of atoms17343
Length L (nm)10.38
Width, height W, H (nm)3.2804, 3.1136
Table 3. Calculation conditions for structure relaxation of single CMF.
PropertyValue(s)
Cutoff length for intermolecular potential (nm)1.3
Temperature T (K)10, 100, 200, 300
Duration of structure relaxation (ns)1.0
Time increment (fs)1.0
Table 4. Calculation conditions for structure relaxation of hierarchical structure.
Conditions in Common
Model NameNormalTW-ATW-B
Water thickness between CMFs (nm)0.71.42.0
Temperature T (K)10, 100, 200, 300300
Duration of structure relaxation (ns)1.0
Cutoff length for intermolecular potential (nm)1.3
Time increment (fs)1.0
Shear simulation by SMD
Model nameNormalTW-ATW-B
Shear directionz, yzz
Shear velocity v (m/s)2.0
Duration of shearing (ns)1.0
Spring constant (kcal/mol) 1.0 × 10 5
Table 5. Shear modulus in shear direction (MD results are of water model and each value is averaged over four temperature conditions).
Shear Direction/TypeShear Modulus [GPa]
G x y   (averaged value of our MD results)0.753
G x z (averaged value of our MD results)1.63
Larch (experimental) [43]1~3
Disclaimer/Publisher’s Note: The statements, opinions and data contained in all publications are solely those of the individual author(s) and contributor(s) and not of MDPI and/or the editor(s). MDPI and/or the editor(s) disclaim responsibility for any injury to people or property resulting from any ideas, methods, instructions or products referred to in the content.

