


Model Soups for Various Training and Validation Data


Department of Information Sciences, Tokyo University of Science, Yamazaki, Chiba 278-8510, Japan
*
Author to whom correspondence should be addressed.
AI 2022, 3(4), 796-808; https://doi.org/10.3390/ai3040048
Submission received: 25 August 2022
/
Revised: 16 September 2022
/
Accepted: 24 September 2022
/
Published: 28 September 2022
(This article belongs to the Topic Recent Trends in Image Processing and Pattern Recognition)
Abstract
:Model soups synthesize multiple models after fine-tuning them with different hyperparameters based on the accuracy of the validation data. They train different models on the same training and validation data sets. In this study, we maximized the model fine-tuning accuracy using the inference time and memory cost of a single model. We extended the model soups to create subsets of k training and validation data using a method similar to k-fold cross-validation and trained models on these subsets. First, we showed the correlation between the validation and test data when the models are synthesized, such that their training data contain validation data. Thereafter, we showed that synthesizing k of these models, after synthesizing models based on subsets of the same training and validation data, provides a single model with high test accuracy. This study provides a method for learning models with both high accuracy and reliability for small datasets such as medical images.
1. Introduction
In recent years, researchers have focused on applying deep learning to numerous tasks, mainly because of the development of large datasets and computers to achieve high accuracy in areas such as image processing. Examples of such applications include AlexNet [1], VGG [2], ResNet [3], EfficientNet [4], and VisionTransformer [5]. The range of applications is expanding. In addition to general object recognition, it has also been applied in highly specialized fields, such as medical images [6,7]. However, the number of datasets and parameters in the model is becoming increasingly important [8]. It is difficult for state-of-the-art models, such as VisionTransformer, to perform well, especially for small datasets. Nevertheless, the high cost of collecting rare and specialized images makes it difficult to collect a sufficient sample size.
Pre-training models on similar datasets including large number of samples often improves performance when an objective has limited datasets [9,10,11,12]. For example, VisionTransformer is pre-trained on JET-300M [8] before training the inference model on ImageNet-1K [13] because ImageNet-1k has 10 million images, which is insufficient for training VisionTransformer. In contrast, JET-300M contains 300 million images and can be used as a sufficient pre-training dataset for VisionTransformer. Thus, when training on a small- or medium-scale dataset, pre-training on a larger dataset yielded higher accuracy than training on a full scratch dataset.
CLIP [14] and ALIGN [15] are effective models for several downstream tasks trained on large datasets. CLIP trains two models from a combination of 400 million images and natural language explanatory text for each image: a model that obtains image features and one that obtains text features. CLIP can be used as a pre-trained model to obtain higher accuracy with small datasets. Similarly, ALIGN learns image features from over one billion images and alternative text pairs from the web. Instead of manually screening the samples, ALIGN was trained on a dataset containing noise samples to collect a larger dataset.
However, regardless of the pre-trained model employed, adequate accuracy cannot be obtained without fine-tuning with appropriate hyperparameters, which vary with the datasets. Therefore, the best model must be obtained by searching for hyperparameters [16,17,18] using methods, such as grid search [19], random search [20], and generic algorithms [21]. In addition, certain hyperparameters can improve or worsen the learned model. To increase the accuracy of the model obtained via fine-tuning, we must combine the best parts of these multiple models.
In general, using several different models for inference can be highly efficient. For example, ensembles [22] increase accuracy by averaging the outputs of several different classifiers. Ensembles are typically used to increase the accuracy of machine learning and other methods. In deep learning, ensembles improve the accuracy [23] and obtain good fine-tuning points for several models. However, the computational cost of a single deep learning model is higher than that of other machine-learning models. Therefore, increasing the accuracy of a single model is essential as an alternative to using several different models during inference.
Model soups [24] provided a model with a computational cost of inference of a single model and an accuracy comparable to that of an ensemble. The method averages the weights of fine-tuned models with different hyperparameters from the same pre-trained model. This method does not increase the computational cost of the model during inference and provides the best of several models, such as an ensemble.
However, the model soups train models based on the same training data, although they are trained using different hyperparameters. Typically, different training data change the behavior of the model. Partitioning the data into training and validation data changes the behavior of the model, particularly when the number of datasets is small. In particular, the accuracy should be equally high regardless of how the dataset is divided. This problem must be overcome to extend the model soups to smaller datasets.
The method of k-fold cross-validation [25] is popular for avoiding errors caused by partitioning datasets into training and validation datasets. The method of k-fold cross-validation divides the available data into k subsets, creates k different training and validation datasets, and trains the models on these subsets. We assume that synthesizing models from different training and validation datasets will provide higher accuracy in model soups than synthesizing models with different hyperparameters, such as the learning rate and data augmentation intensity.
This study aimed to apply model soups to different training and validation data in divided datasets to achieve robust learning on small amounts of data. Two experiments were performed for this purpose. First, we examined how the correlation between validation accuracy and test accuracy changes when models for different training and validation datasets are synthesized using model soups. Second, this study demonstrates how synthesizing models based on different training and validation data achieves both high accuracy and reliability.
2. Preliminaries
2.1. Model Soups
There are numerous ways to obtain a better model after training multiple models. The simplest method, “Best on val”, uses the model with the highest accuracy in the validation data as the resulting model. However, this approach only uses the selected model. We hypothesize that the accuracy is improved when using more models.
Model soups [24] is a simple insight-based method. The weights of models fine-tuned from the same pre-trained model with different hyperparameters can be interpolated to improve recognition accuracy and robustness. The study proposes two main methods: uniform and greedy soups. Uniform soups take the average weight of all the learned models as the weight of the new model. Considering the parameters of several different models , the function average, which represents the average of the parameters of a particular model, can be expressed as follows:
Specifically, uniform soups apply the function average to all the models obtained with different hyperparameters.
Greedy soups greedily adopted models with high accuracy for the validation data. is the accuracy for dataset D and the model parameters and are the validation data shared in the model soups. Here, greedy soups are executed, as in Algorithm 1.
| Algorithm 1 Greedy Soups |
|
Prior experimental studies have shown that greedy soups are more accurate on test data and more robust for distribution-shifted data than uniform soups and the original models.
However, prior research has focused on fine-tuning medium-sized datasets, such as ImageNet [13]. ImageNet contains approximately 1.2 million images for 1000 classes of images, and its number of samples is considered sufficient to reduce the influence of splitting the training data into training and validation data. However, in many cases, it is difficult to collect even medium-sized numbers. For example, CIFAR10 [26] contains only 50,000 images from 10 classes. For the stable application of model soups to these domains, the results of different training data should be considered.
2.2. k-Fold cross Validation
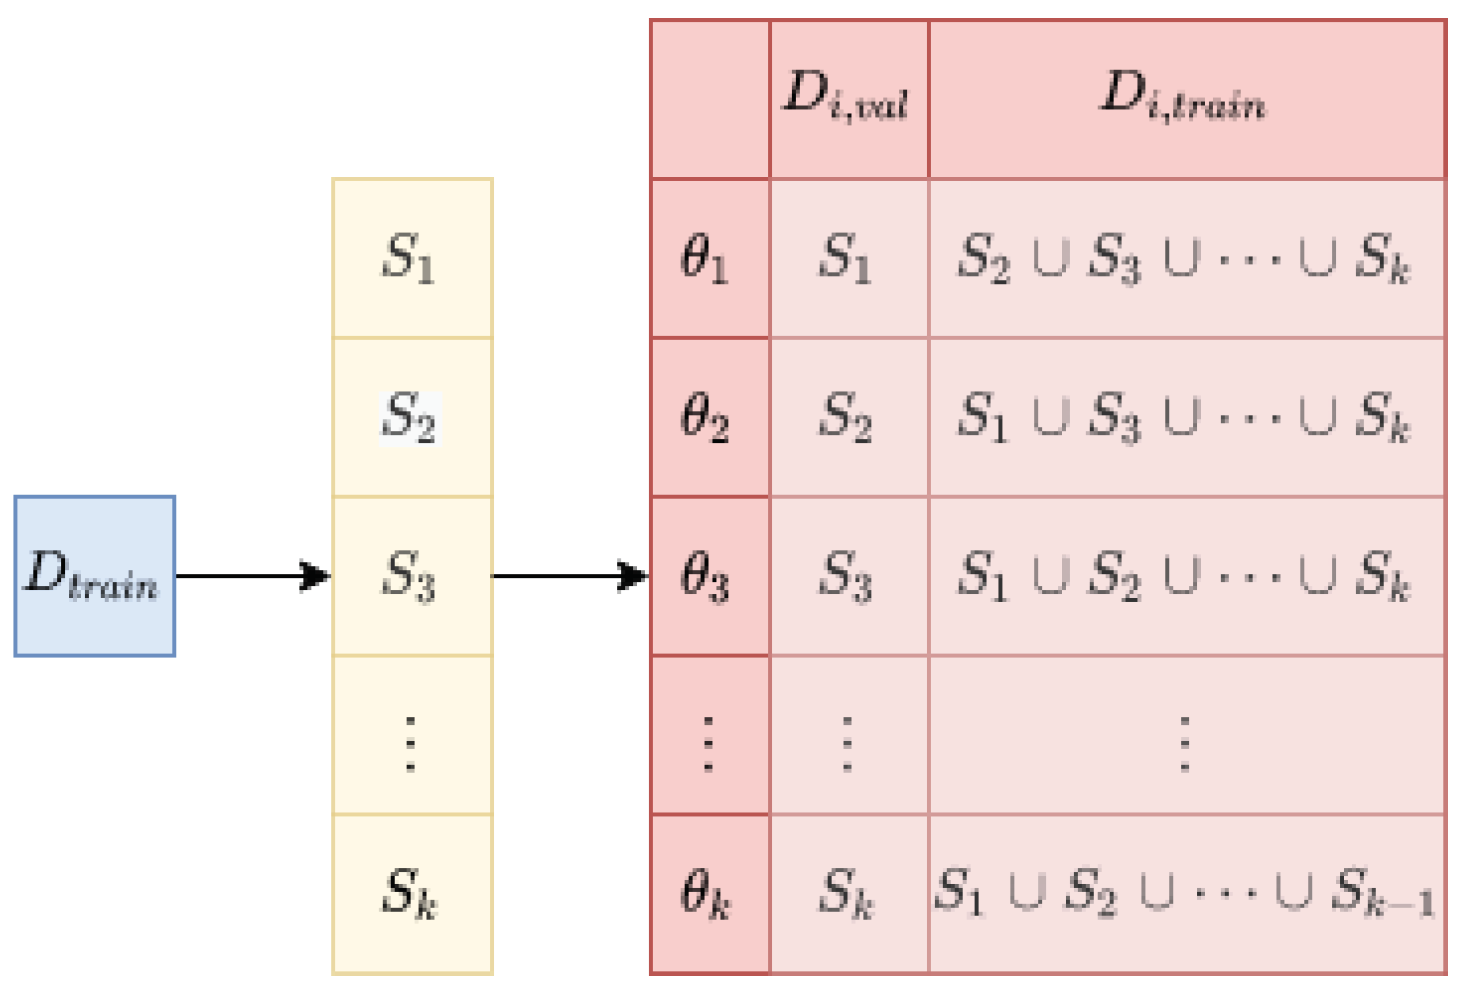
The k-fold cross-validation [25] is a common evaluation method in machine learning, as shown in Figure 1. Algorithm 2 was used for the training and evaluation.
| Algorithm 2 k-Fold Cross Validation |
|
This method improves the reliability of machine learning. For example, in a hyperparameter search, when optimizing a fixed set of training and validation data, overfitting may occur on the combination. The k-fold cross-validation prevents overfitting by optimizing k types of training and validation data.
As described above, the k-fold cross-validation was more effective with smaller datasets. Therefore, dataset bias, a bottleneck in applying model soups, may be reduced by splitting datasets into several subsets of training and validation data, as in the k-fold cross-validation. The following sections describe the methods used to reduce the bias.
3. Methods
This study determines whether model soups can be effectively applied to models trained using different training and validation data. A distinct problem arises from k-fold cross-validation. When training a model, we separate the training and validation data. However, when some models are synthesized, validation data for one model are included in the training data for the other models. This is a critical problem because the validation data are responsible for detecting whether the model is overfitted with the training data. Additionally, the accuracy of the validation data for a model indicates whether the model is selected. For example, for Best on val, which served as the baseline in model soups, the model with the highest accuracy against the validation data was adopted. Furthermore, greedy soups adopt a model with higher accuracy for the validation data, as shown in Algorithm 1. Therefore, when training and validation data are separated, the accuracy of the validation data determines whether the synthesized model is expected to outperform the pre-synthesized models. However, when models based on different training and validation data are synthesized, we use validation data to learn the parameters of the post-synthesized model. Even validation data for the pre-synthesized models are less reliable for the post-synthesized models. For instance, consider training and validation data divided into five subsets. Model A is assigned the first subset as validation data and the remaining subset as training data. For model A, the ratio of each subset used for training is 0:1:1:1:1. Similarly, model B is assigned the second subset as validation data and the remaining subsets as training data. For model B, the ratio of each subset used for training is 1:0:1:1:1. When the two models are synthesized, the ratio of the trained subsets for the post-synthesized model becomes 1:1:2:2:2. The first and second two subsets are used less frequently than the other subset, but not zero. The validation data, as defined by k-fold cross-validation, do not exist for the post-synthesized model. Then, an alternative indicator is required to validate the post-synthesized model. Here, we investigated whether the validation data for pre-synthesized models can be used as an accuracy indicator the post-synthesized model.
First, we show the relationship between the accuracy of the validation and test data when uniform soups are applied to the same hyperparameters and the training and validation data. The dataset used in the experiment provides the test data, which are independent of the training and validation data. Therefore, the accuracy of the test data determines the accuracy of all models, including the post-synthesized models. The test data cannot be used to indicate the model to be synthesized, to avoid leaks. Based on the above results, we showed how to merge models based on different training and validation data while utilizing the validation data as effectively as possible.
3.1. Uniform Soups for Different Training and Validation Data
We conducted experiments to illustrate the relationship between the validation and test data when models trained by different subsets were combined with model soups.
- 1.
- Create a subset of k types of training and validation data through k-fold cross-validation.
- 2.
- Provide T type hyperparameters.
- 3.
- Fine-tune kinds of models.
- 4.
- Synthesize models by applying uniform soups from k models to n models for each hyperparameter.
First, let be a parameter of the model trained on and validated on : Second, is the accuracy of the model with the parameter with respect to the validation data . Third, is the accuracy of the model with the parameter for the test data . Finally, is the average of the provided model parameters, similar to the uniform soups. We propose two measures for the accuracy of the validation data:
AvgAcc is the average of the set of accuracies for the validation data corresponding to the included models. Similarly, MinAcc represents the minimum accuracy among the sets of accuracies for the validation data corresponding to the included models.
The following points were verified for each synthesized number of models created using the above procedure.
- 1.
- RMSE for each of AvgAcc, MinAcc for validation data, and Acc for test data.
- 2.
- Correlations between val accuracy and test accuracy.
- First, to measure how far the validation data are from the test data for a particular number of synthesized models n, RMSE (root mean squared error) is calculated as in Equation (4):where is the model synthesized with the t-th hyperparameter and ValAcc is the val accuracy: AvgAcc or MinAcc. The expected value of the difference between the accuracies and for model is close to zero if the validation data and test data have the same distribution. In contrast, the difference is likely to be larger when the validation data are larger than the test data, because of the synthesis of different training and validation data. This experiment shows that the distribution over the validation data diverges from the test data, depending on the number of merged models. Furthermore, we showed that MinAcc is more effective than AvgAcc based on the hypothesis that a more stringent criterion for the model is more robust than an average criterion.
Second, by calculating the correlation between the val accuracy and test accuracy for the number of models to be merged, we showed that the validation data effectively select models that enhance the test data. Furthermore, it showed correlations in regions of high accuracy, which is particularly important when applying greedy soups.
3.2. Greedy Soups Containing Different Training and Validation Data
To apply model soups to different training and validation data, we experimented with three different extensions of greedy soups.
- Greedy soups (for all subset)
- Best on val for greedy soups per subset (BGSSs)
- Greedy soups for greedy soups per subset (GSGSs)
The first method applies greedy soups without distinguishing between models that include all training and validation data based on MinAcc calculated using Equation (3). Although mixing models from different training data may improve the test accuracy of the synthesized model, it can mix the models multiple times based on unreliable validation data.
The second method is to apply greedy soups to each training and validation dataset and then adopt the model with the highest val accuracy. The validation data are more reliable because they are not mixed with the training data that the synthesized model follows; however, they do not interpolate between models with different training data. Hence, the benefit of the improved accuracy is small.
The last method is to apply greedy soups to each training and validation dataset and then to each synthesized model. As the models synthesized in the first step were based on the same training and validation data, the same greedy soups as in previous studies were applied. The next step is to apply greedy soups to different models of the training and validation data. Thus, they are synthesized using indicators based on val accuracy. This method applies greedy soups on a subset-by-subset basis, allowing decisions to be made using MinAcc only in the last iterations, maintaining the reliability of the validation data.
The val and test accuracies of the models were compared.
3.3. Experimental Setup
As in previous studies, we employed CLIP ViT-B/32 [14] as the pre-trained model. Furthermore, we applied fine-tuning only to the final linear layer before fine-tuning the entire model (LP initialization), as described by Kumar et al. [27]. To make this correspond to different training and validation subsets, we applied LP initialization to each of the k subsets and trained the model of the corresponding subset.
CIFAR10 was used as the dataset. CIFAR10 provides training data and test data. Note that there is no official validation data. The training data include 50,000 samples, and the test data include 10,000 samples. Each sample is an image belonging to one of the 10 classes. The size of these images is , but the images are scaled up to when they are input to the model. Both the training and test data include an equal number of samples for each class: the training data include 5000 images of the same class each, and the test data include 1000 images of the same class each.
Moreover, We split the training data defined in CIFAR10 into subsets of training and validation data, as shown in Algorithm 2. We experiment with five splits; hence, each subset contained training data including 40,000 samples and validation data including 10,000 samples. The training data are divided so that each subset contains an equal number of image classes. Training and validation data are assigned when training each model. Note that the validation data assigned to a model is not used for training the model, before synthesis.
We trained the models with 18 different hyperparameters. The searched hyperparameters contain the learning rate, strength of data augmentation and whether to apply mixup [28]. This study adopts grid search. The learning rate is chosen from 0.00003, 0.00001 or 0.000003. Strength of data augmentation is chosen from minimal, medium or strong categories, which were defined in a previous study [24]. As a result, there are 18 combinations of hyperparameters that are searched for by grid search. In addition, based on five different training and validation data, a total of 90 models are trained.
4. Experimental Results
As described in Section 3.3, this study trained 90 models based on 18 hyperparameters and 5 training and validation data in the experiment. We show the relationship between the validation accuracy and test accuracy of the trained models using Figure 2. These models’ validation data have the highest accuracy (0.9844), and the corresponding model’s test data have the best accuracy (0.9809). The lowest accuracy of the validation data is 0.9720, and the corresponding model’s test data accuracy is 0.9721, the 11th least accurate. These models are used in both of the following experiments.
4.1. Model Soups for Different Training and Validation Data
4.1.1. Comparison between AvgAcc and MinAcc
Table 1 shows the RMSE of the validation and test accuracies for each number of models merged in the graph.
The experimental results showed that the distribution of the validation and test data shifted as the number of merged models increased. In addition, the RMSE of MinAcc was smaller than that of AvgAcc for any number of merged models, indicating that the validation data are reliable.
4.1.2. Correlation of Classification Accuracy between Validation and Test Data
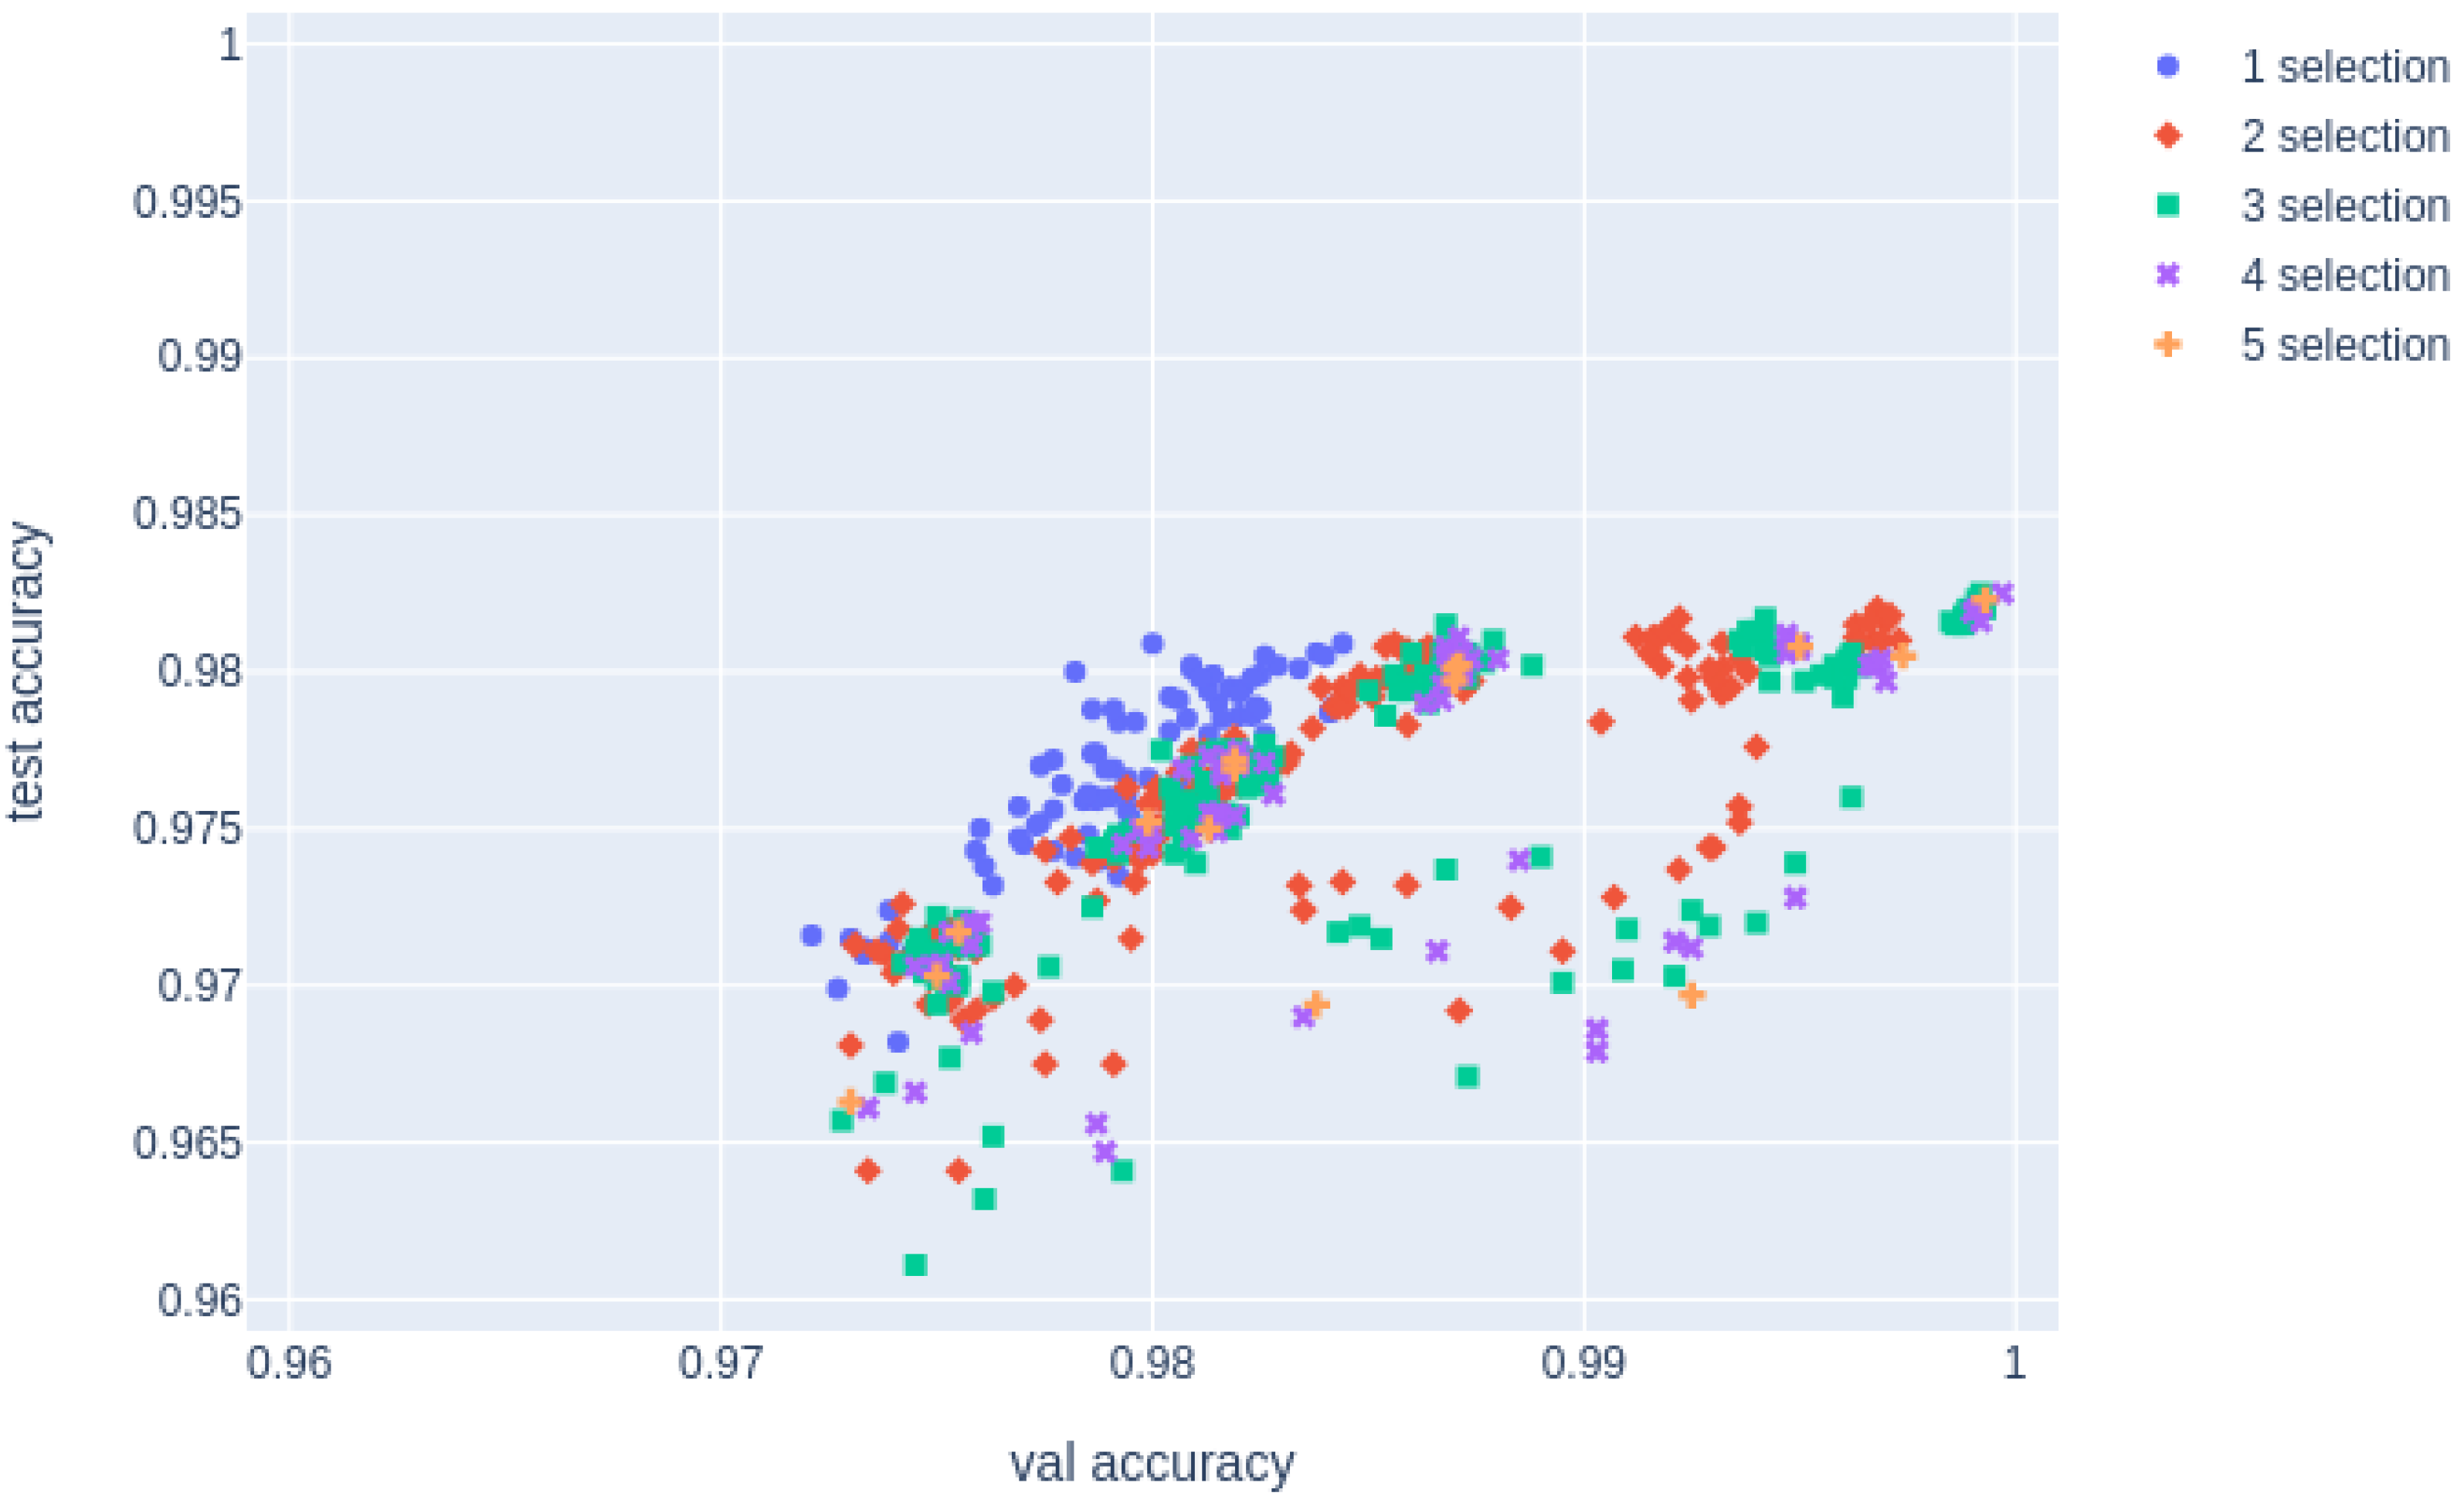
Figure 3 shows the accuracy of the validation and test data when n models with the same hyperparameters and different training and validation data were synthesized via uniform soups.
In the above graph, the correlation between val and test accuracies for each number of models n merged in uniform soups is shown in “corr for all” in Table 2. This result implies that the greater the number of synthesized models, the stronger the correlation between MinAcc and test accuracy.
However, to improve the accuracy of greedy soups, reliability in domains with high accuracy is important. In Figure 3, there are regions in which both MinAcc and the test accuracy have low accuracy. These samples were those in which the interpolation of weights worsened the accuracy because of the significant distance between the models. Owing to their low validation accuracy, these models have not been synthesized to improve the accuracy of greedy soups. Next, we investigated how the accuracy changes for each number of synthesized models in the domain with a high val accuracy.
Figure 4 shows a graph of the results of the synthesized model, removing the results of the model with a value accuracy less than the threshold. The threshold is the minimum val accuracy of the model before the synthesis. The correlation between the val accuracy and test accuracy in the extracted models shows that the correlation coefficient is lower for than for , as indicated by the “corr over thre” in Table 2.
As shown above, the synthesis of models based on different training and validation data reduced the reliability of the validation data. Conversely, although the validation data are overestimated, this allows us to confirm that synthesizing different subsets of models can increase the accuracy. Therefore, val accuracy can detect an extreme decrease in the test accuracy when the model is synthesized.
4.2. Greedy Soups Containing Different Training and Validation Data
For greedy soups with different training and validation data, we conducted the following experiments.
- Three types of greedy soups based on different subsets of training and validation data.
- Uniform soups for all models.
- Best on val, the single model with the greatest accuracy on the validation data.
The results of these vals (calculated based on MinAcc, except for Best on val) and test accuracies are shown in Table 3.
The experiment shows that GSGSs, applying greedy soups for each subset and finally applying greedy soups between subsets produces the best test accuracy. The highest val accuracy was achieved by applying greedy soups with all subsets mixed; however, the test accuracy was lower than that of other greedy soup methods. This observation seems to result from the unreliability of the validation data owing to the repeated synthesis of models that include each other’s validation data in the training data. However, greedy soups exceeded the baseline Best on val, indicating that the method eliminated cases in which synthesis would result in extremely low accuracy.
5. Discussion and Future Work
5.1. Reliability of val Accuracy
This study synthesized models with different subsets of training and validation data assigned by greedy soups while maximally preserving the reliability of the validation data. Conversely, even if the number of models is approximately five, the correlation between the val and test accuracies indicates that synthesizing different model subsets reduces the reliability of val accuracy.
Some accuracy is maintained even when applying greedy soups based on val accuracy, which has decreased in reliability because val accuracy is an adequate evaluation index for test accuracy for low accuracy. This situation prevents merging, which results in a lower accuracy than the baseline. However, the choice to maximize accuracy is difficult because reliability is lower in areas with higher accuracy.
In the future, we will develop and verify a method for calculating the val accuracy that is more reliable than the MinAcc. In addition, we will investigate whether there is an index with a higher correlation with test accuracy, and verify whether test accuracy can be improved by combining it with greedy soups.
5.2. Hyperparameters Optimization
Uniform soup results were above the baseline in the previous study and below the baseline in this study. This difference may be because some hyperparameter settings deviated from those of the original model. To show that this deterioration in accuracy was not related to the combination with k-fold cross-validation, we ran uniform soups for each subset, and the one with the highest validation was adopted. Table 4 confirms that the accuracy deteriorated when combined with the k-fold cross-validation.
The above results suggest that greedy soups are more effective when the region of the optimal parameters is unknown.
5.3. Generalization Performance for Highly Specialized Datasets
This research aims to apply this method to highly specialized fields, such as medical images, where it is difficult to collect multiple samples. However, this experiment was conducted within the scope of general category recognition. In the future, we will consider the type of problems that may arise when the proposed method is applied to highly specialized datasets.
First, a few samples may cause considerable distance between the models trained using different training and validation data. If the distance between the models is significantly large, the effectiveness of merging by model soups is reduced, and the result would be the same as if the model with the highest validation accuracy was simply adopted. This problem can be solved by adjusting the hyperparameters to constrain the distance from the source model such that it is not considerably far.
Second, the source model possibly did not capture the features of the target dataset. For example, CLIP [14] comprises generic images that have been collected. Therefore, it is known that excessive specialization of the target data reduces the effectiveness of transfer learning from ImageNet when the distance from the source dataset is large. One way to address this issue is to use datasets that are closer to the target data. For example, for medical images, such as CT images, it is important to use a dataset in a close domain, such as RadImageNet [29] to train the source model.
5.4. Model Constraints
The proposed method is essentially model agnostic. The model employed in this experiment is overly large to be applicable for running on low-memory devices. However, lighter pre-trained models make the proposed method applicable. Alternatively, the study is not limited by the size or type of model. As the proposed method is applied to various tasks in the future, the best model for each task can be adopted.
5.5. Future Works
This study shows experimentally that synthesized models trained on multiple subsets of training and validation data are more accurate than synthesized models trained on each subset. However, it is unclear how efficient these methods are. Alternatively, is it more efficient to explore the learning rate or the strength of data augmentation than to explore multiple subsets? In this experiment, 90 different models were trained based on 18 hyperparameters and 5 sub-sets. For example, increasing the range of the learning rate or increasing the density of the search may improve accuracy. To verify this possibility, we must first consider the optimal search, as described above. In the future, we will show that the accuracy of the test data with respect to the total number of models trained benefits the proposed method.
6. Conclusions
In this study, models trained with different training and validation data using a similar method to k-fold cross-validation were verified to improve accuracy by merging the weights of multiple models using model soups. Therefore, we examined how the reliability of val accuracy changes when models that include validation data in the training data are synthesized by model soups.
First, for validation, we synthesized multiple models within the same hyperparameter by using uniform soups on a set of models trained with different hyperparameters and training and validation data. We observed that the correlation between the validation and test data results decreased with each merged model, especially in regions where the accuracy of the validation data was higher than that of the baseline. However, if the validation data contained regions where the accuracy of the validation data was lower than the baseline, the correlation increased, indicating that it can be used to detect a significant decrease in test accuracy.
Based on the above results, we proposed two greedy soups that allow models to be synthesized with each other’s validation data in the training data and compared them with the baselines. In particular, the accuracy of GSGSs is higher than that of the baseline, which performs greedy soups on each model based on the same training and validation data. Thereafter, it performs greedy soups on different subsets. This observation shows that val accuracy estimates the test accuracy, even if the models are synthesized using different training and validation data.
This research allowed us to create models that are less susceptible to bias owing to differences in assignments for training and validation. In particular, the smaller the amount of data, the larger this bias becomes, making this study more valid for fine-tuning the small amounts of data for which model soups are effective.
However, this study has four limitations. First, the val accuracy is not sufficiently reliable when models based on different training and validation data are synthesized. We showed that the val accuracy computed by the proposed method is sufficiently reliable to be used as an indicator of which model should be synthesized by experiments. However, it is less reliable than the conventional val accuracy. In further research, we must investigate whether there is a calculation method that is more reliable than the proposed method, even if the model is synthesized based on training and validation data. Second, the search space for hyperparameters is non-trivial. The optimal hyperparameters vary for each dataset. If the search space cannot be narrowed down to an optimal range, the accuracy of the learned model becomes highly variable. We must improve the efficiency of the search in model soups in future works. Third, a single benchmark dataset was used in the experiments. This research has a high affinity for datasets that find it difficult to collect numerous samples due to their specialized nature, such as medical images. Future experiments should be conducted on such datasets. Finally, although the proposed method has been shown to improve the accuracy of the synthesized model, it has not shown its efficiency compared to existing methods. In the future, we will show the effectiveness of the proposed method.
Author Contributions
Conceptualization, K.S. and T.M.; methodology, K.S. and T.M.; software, K.S.; validation, K.S. and T.M.; formal analysis, K.S. and T.M.; investigation, K.S. and T.M.; data curation, K.S.; writing—original draft preparation, K.S.; writing—review and editing, K.S. All authors have read and agreed to the published version of the manuscript.
Funding
This research was funded by JST SPRING grant number JPMJSP2151.
Institutional Review Board Statement
Not applicable.
Informed Consent Statement
Not applicable.
Data Availability Statement
Not applicable.
Conflicts of Interest
The founders had no role in the design of the study; in the collection, analyses, or interpretation of data; in the writing of the manuscript; or in the decision to publish the results.
References
- Krizhevsky, A.; Sutskever, I.; Hinton, G.E. ImageNet Classification with Deep Convolutional Neural Networks. In Advances in Neural Information Processing Systems; Pereira, F., Burges, C.J.C., Bottou, L., Weinberger, K.Q., Eds.; Curran Associates, Inc.: Sydney, Australia, 2012; Volume 25, pp. 1097–1105. [Google Scholar]
- Simonyan, K.; Zisserman, A. Very Deep Convolutional Networks for Large-Scale Image Recognition. arXiv 2014, arXiv:1409.1556. [Google Scholar]
- He, K.; Zhang, X.; Ren, S.; Sun, J. Deep Residual Learning for Image Recognition. In Proceedings of the 2016 IEEE Conference on Computer Vision and Pattern Recognition (CVPR), Las Vegas, NV, USA, 27–30 June 2016; pp. 770–778. [Google Scholar]
- Tan, M.; Le, Q. EfficientNet: Rethinking Model Scaling for Convolutional Neural Networks. In Proceedings Machine Learning Research; PMLR: Long Beach, CA, USA, 2019; Volume 97, pp. 6105–6114. [Google Scholar]
- Dosovitskiy, A.; Beyer, L.; Kolesnikov, A.; Weissenborn, D.; Zhai, X.; Unterthiner, T.; Dehghani, M.; Minderer, M.; Heigold, G.; Gelly, S.; et al. An image is worth 16x16 words: Transformers for image recognition at scale. arXiv 2020, arXiv:2010.11929. [Google Scholar]
- Wang, X.; Peng, Y.; Lu, L.; Lu, Z.; Bagheri, M.; Summers, R.M. Chestx-ray8: Hospital-scale chest x-ray database and benchmarks on weakly-supervised classification and localization of common thorax diseases. In Proceedings of the IEEE Conference on Computer Vision and Pattern Recognition, Honolulu, HI, USA, 21–26 July 2017; pp. 2097–2106. [Google Scholar]
- Esteva, A.; Kuprel, B.; Novoa, R.A.; Ko, J.; Swetter, S.M.; Blau, H.M.; Thrun, S. Dermatologist-level classification of skin cancer with deep neural networks. Nature 2017, 542, 115–118. [Google Scholar] [CrossRef] [PubMed]
- Sun, C.; Shrivastava, A.; Singh, S.; Gupta, A. Revisiting Unreasonable Effectiveness of Data in Deep Learning Era. In Proceedings of the IEEE International Conference on Computer Vision (ICCV), Venice, Italy, 22–29 October 2017. [Google Scholar]
- Girshick, R.; Donahue, J.; Darrell, T.; Malik, J. Rich feature hierarchies for accurate object detection and semantic segmentation. In Proceedings of the IEEE Conference on Computer Vision and Pattern Recognition, Columbus, OH, USA, 23–28 June 2014; pp. 580–587. [Google Scholar]
- Yosinski, J.; Clune, J.; Bengio, Y.; Lipson, H. How transferable are features in deep neural networks? Adv. Neural Inf. Process. Syst. 2014, 27, 1703. [Google Scholar]
- Kornblith, S.; Shlens, J.; Le, Q.V. Do better imagenet models transfer better? In Proceedings of the IEEE/CVF Conference on Computer Vision and Pattern Recognition, Long Beach, CA, USA, 15–20 June 2019; pp. 2661–2671. [Google Scholar]
- Kolesnikov, A.; Beyer, L.; Zhai, X.; Puigcerver, J.; Yung, J.; Gelly, S.; Houlsby, N. Big transfer (bit): General visual representation learning. In Proceedings of the European Conference on Computer Vision, Glasgow, UK, 23–28 August 2020; Springer: Berlin/Heidelberg, Germany, 2020; pp. 491–507. [Google Scholar]
- Deng, J.; Dong, W.; Socher, R.; Li, L.J.; Li, K.; Fei-Fei, L. Imagenet: A large-scale hierarchical image database. In Proceedings of the 2009 IEEE Conference on Computer Vision and Pattern Recognition, Miami, FL, USA, 20–25 June 2009; IEEE: Piscataway, NJ, USA, 2009; pp. 248–255. [Google Scholar]
- Radford, A.; Kim, J.W.; Hallacy, C.; Ramesh, A.; Goh, G.; Agarwal, S.; Sastry, G.; Askell, A.; Mishkin, P.; Clark, J.; et al. Learning transferable visual models from natural language supervision. In Proceedings of the International Conference on Machine Learning, Online, 18–24 July 2021; PMLR: Long Beach, CA, USA, 2021; pp. 8748–8763. [Google Scholar]
- Jia, C.; Yang, Y.; Xia, Y.; Chen, Y.T.; Parekh, Z.; Pham, H.; Le, Q.; Sung, Y.H.; Li, Z.; Duerig, T. Scaling up visual and vision-language representation learning with noisy text supervision. In Proceedings of the International Conference on Machine Learning, Online, 18–24 July 2021; PMLR: Long Beach, CA, USA, 2021; pp. 4904–4916. [Google Scholar]
- Young, S.R.; Rose, D.C.; Karnowski, T.P.; Lim, S.H.; Patton, R.M. Optimizing deep learning hyper-parameters through an evolutionary algorithm. In Proceedings of the Workshop on Machine Learning in High-Performance Computing Environments, Austin, TX, USA, 15 November 2015; pp. 1–5. [Google Scholar]
- Real, E.; Moore, S.; Selle, A.; Saxena, S.; Suematsu, Y.L.; Tan, J.; Le, Q.V.; Kurakin, A. Large-scale evolution of image classifiers. In Proceedings of the International Conference on Machine Learning, Sydney, Australia, 6–11 August 2017; PMLR: Long Beach, CA, USA, 2017; pp. 2902–2911. [Google Scholar]
- Zoph, B.; Le, Q.V. Neural architecture search with reinforcement learning. arXiv 2016, arXiv:1611.01578. [Google Scholar]
- LaValle, S.M.; Branicky, M.S.; Lindemann, S.R. On the relationship between classical grid search and probabilistic roadmaps. Int. J. Robot. Res. 2004, 23, 673–692. [Google Scholar] [CrossRef]
- Bergstra, J.; Bengio, Y. Random Search for Hyper-Parameter Optimization. J. Mach. Learn. Res. 2012, 13, 281–305. [Google Scholar]
- Holland, J.H. Genetic Algorithms. Sci. Am. 1992, 26, 66–73. [Google Scholar] [CrossRef]
- Dietterich, T.G. Ensemble Methods in Machine Learning. In Proceedings of the First International Workshop on Multiple Classifier Systems, Cagliari, Italy, 21–23 June 2000; Springer: Berlin/Heidelberg, Germany, 2000; pp. 1–15. [Google Scholar]
- Lakshminarayanan, B.; Pritzel, A.; Blundell, C. Simple and Scalable Predictive Uncertainty Estimation using Deep Ensembles. In Proceedings of the Advances in Neural Information Processing Systems, Long Beach, CA, USA, 4–9 December 2017; Guyon, I., Luxburg, U.V., Bengio, S., Wallach, H., Fergus, R., Vishwanathan, S., Garnett, R., Eds.; Curran Associates, Inc.: Sydney, Australia, 2017; Volume 30. [Google Scholar]
- Wortsman, M.; Ilharco, G.; Gadre, S.Y.; Roelofs, R.; Gontijo-Lopes, R.; Morcos, A.S.; Namkoong, H.; Farhadi, A.; Carmon, Y.; Kornblith, S.; et al. Model soups: Averaging weights of multiple fine-tuned models improves accuracy without increasing inference time. arXiv 2022, arXiv:2203.05482. [Google Scholar]
- Stone, M. Cross-validatory choice and assessment of statistical predictions. J. R. Stat. Soc. Ser. B 1974, 36, 111–133. [Google Scholar] [CrossRef]
- Krizhevsky, A.; Nair, V.; Hinton, G. Learning Multiple Layers of Features from Tiny Images. Tech Report. 2009. Available online: https://scholar.google.co.jp/scholar?q=Learning+Multiple+Layers+of+Features+from+Tiny+Images&hl=en&as_sdt=0&as_vis=1&oi=scholart (accessed on 25 August 2022).
- Kumar, A.; Raghunathan, A.; Jones, R.M.; Ma, T.; Liang, P. Fine-Tuning can Distort Pretrained Features and Underperform Out-of-Distribution. In Proceedings of the International Conference on Learning Representations, Online, 25 April 2022. [Google Scholar]
- Zhang, H.; Cisse, M.; Dauphin, Y.N.; Lopez-Paz, D. mixup: Beyond empirical risk minimization. arXiv 2017, arXiv:1710.09412. [Google Scholar]
- Mei, X.; Liu, Z.; Robson, P.M.; Marinelli, B.; Huang, M.; Doshi, A.; Jacobi, A.; Cao, C.; Link, K.E.; Yang, T.; et al. RadImageNet: An Open Radiologic Deep Learning Research Dataset for Effective Transfer Learning. Radiol. Artif. Intell. 2022, 4, e210315. [Google Scholar] [CrossRef]
Figure 1.
k-Fold Cross Validation.

Figure 2.
Comparison of the validation accuracy and test accuracy of the trained models. The models were trained based on 18 types of hyperparameters and 5 types of training and test data.
Figure 2.
Comparison of the validation accuracy and test accuracy of the trained models. The models were trained based on 18 types of hyperparameters and 5 types of training and test data.

Figure 3.
Comparison of uniform soups validation and test data accuracies for models with different training and validation data. We selected models from different training and validation data with the same hyperparameters and compared the results of applying uniform soups to the n models.
Figure 3.
Comparison of uniform soups validation and test data accuracies for models with different training and validation data. We selected models from different training and validation data with the same hyperparameters and compared the results of applying uniform soups to the n models.

Figure 4.
Val and test accuracies for models with val accuracy greater than or equal to that of the model with the lowest val accuracy before the application of uniform soups in Figure 3.
Figure 4.
Val and test accuracies for models with val accuracy greater than or equal to that of the model with the lowest val accuracy before the application of uniform soups in Figure 3.


Table 1.
RMSE of model soups val and test accuracies for each number of models synthesized. The merged models have the same hyperparameters but different training and validation data.
Table 1.
RMSE of model soups val and test accuracies for each number of models synthesized. The merged models have the same hyperparameters but different training and validation data.
| n | AvgAcc | MinAcc |
|---|---|---|
| 1 | 0.30% | |
| 2 | 0.87% | 0.92% |
| 3 | 0.98% | 1.06% |
| 4 | 1.02% | 1.11% |
| 5 | 1.03% | 1.14% |
Table 2.
Correlation coefficients between validation accuracy and test accuracy for each number of models to be merged in uniform soups. “corr for all” is the correlation coefficient for all models, and ”corr over thre” is the correlation coefficient for models whose evaluation accuracy is above a certain threshold. The threshold is the lowest validation accuracy of the models before merging.
| n | Corr for All | Corr over Thre |
|---|---|---|
| 1 | 0.878 | |
| 2 | 0.934 | 0.763 |
| 3 | 0.978 | 0.707 |
| 4 | 0.985 | 0.673 |
| 5 | 0.989 | 0.685 |
Table 3.
Comparison of the val and test accuracies of the proposed and existing methods for CIFAR10. Greedy soups has the highest val accuracy, but the lowest test accuracy among the proposed methods. The gap between the val accuracy and test accuracy of greedy soups is large. However, the proposed method GSGSs has the highest test accuracy compared to the other methods. The gap between the val accuracy and test accuracy of GSGSs is not as large as that of greedy soups.
| Method | Val | Test |
|---|---|---|
| Best on val | 98.44% | 98.09% |
| Uniform soups | 98.14% | 96.88% |
| Greedy soups | 99.67% | 98.26% |
| BGSSs | 98.66% | 98.27% |
| GSGSs | 98.97% | 98.32% |
Table 4.
Comparison of uniform soups and Best on val.
| Method | Acc |
|---|---|
| Best on val | 98.44% |
| Uniform Soups | 98.14% |
| Best Uniform Soups per split on val | 96.88% |
Publisher’s Note: MDPI stays neutral with regard to jurisdictional claims in published maps and institutional affiliations. |
© 2022 by the authors. Licensee MDPI, Basel, Switzerland. This article is an open access article distributed under the terms and conditions of the Creative Commons Attribution (CC BY) license (https://creativecommons.org/licenses/by/4.0/).
Share and Cite
MDPI and ACS Style
Suzuki, K.; Matsuzawa, T. Model Soups for Various Training and Validation Data. AI 2022, 3, 796-808. https://doi.org/10.3390/ai3040048
AMA Style
Suzuki K, Matsuzawa T. Model Soups for Various Training and Validation Data. AI. 2022; 3(4):796-808. https://doi.org/10.3390/ai3040048
Chicago/Turabian StyleSuzuki, Kaiyu, and Tomofumi Matsuzawa. 2022. "Model Soups for Various Training and Validation Data" AI 3, no. 4: 796-808. https://doi.org/10.3390/ai3040048