


Using Colour as a Marker for Coral ‘Health’: A Study on Hyperspectral Reflectance and Fluorescence Imaging of Thermally Induced Coral Bleaching

 , , and
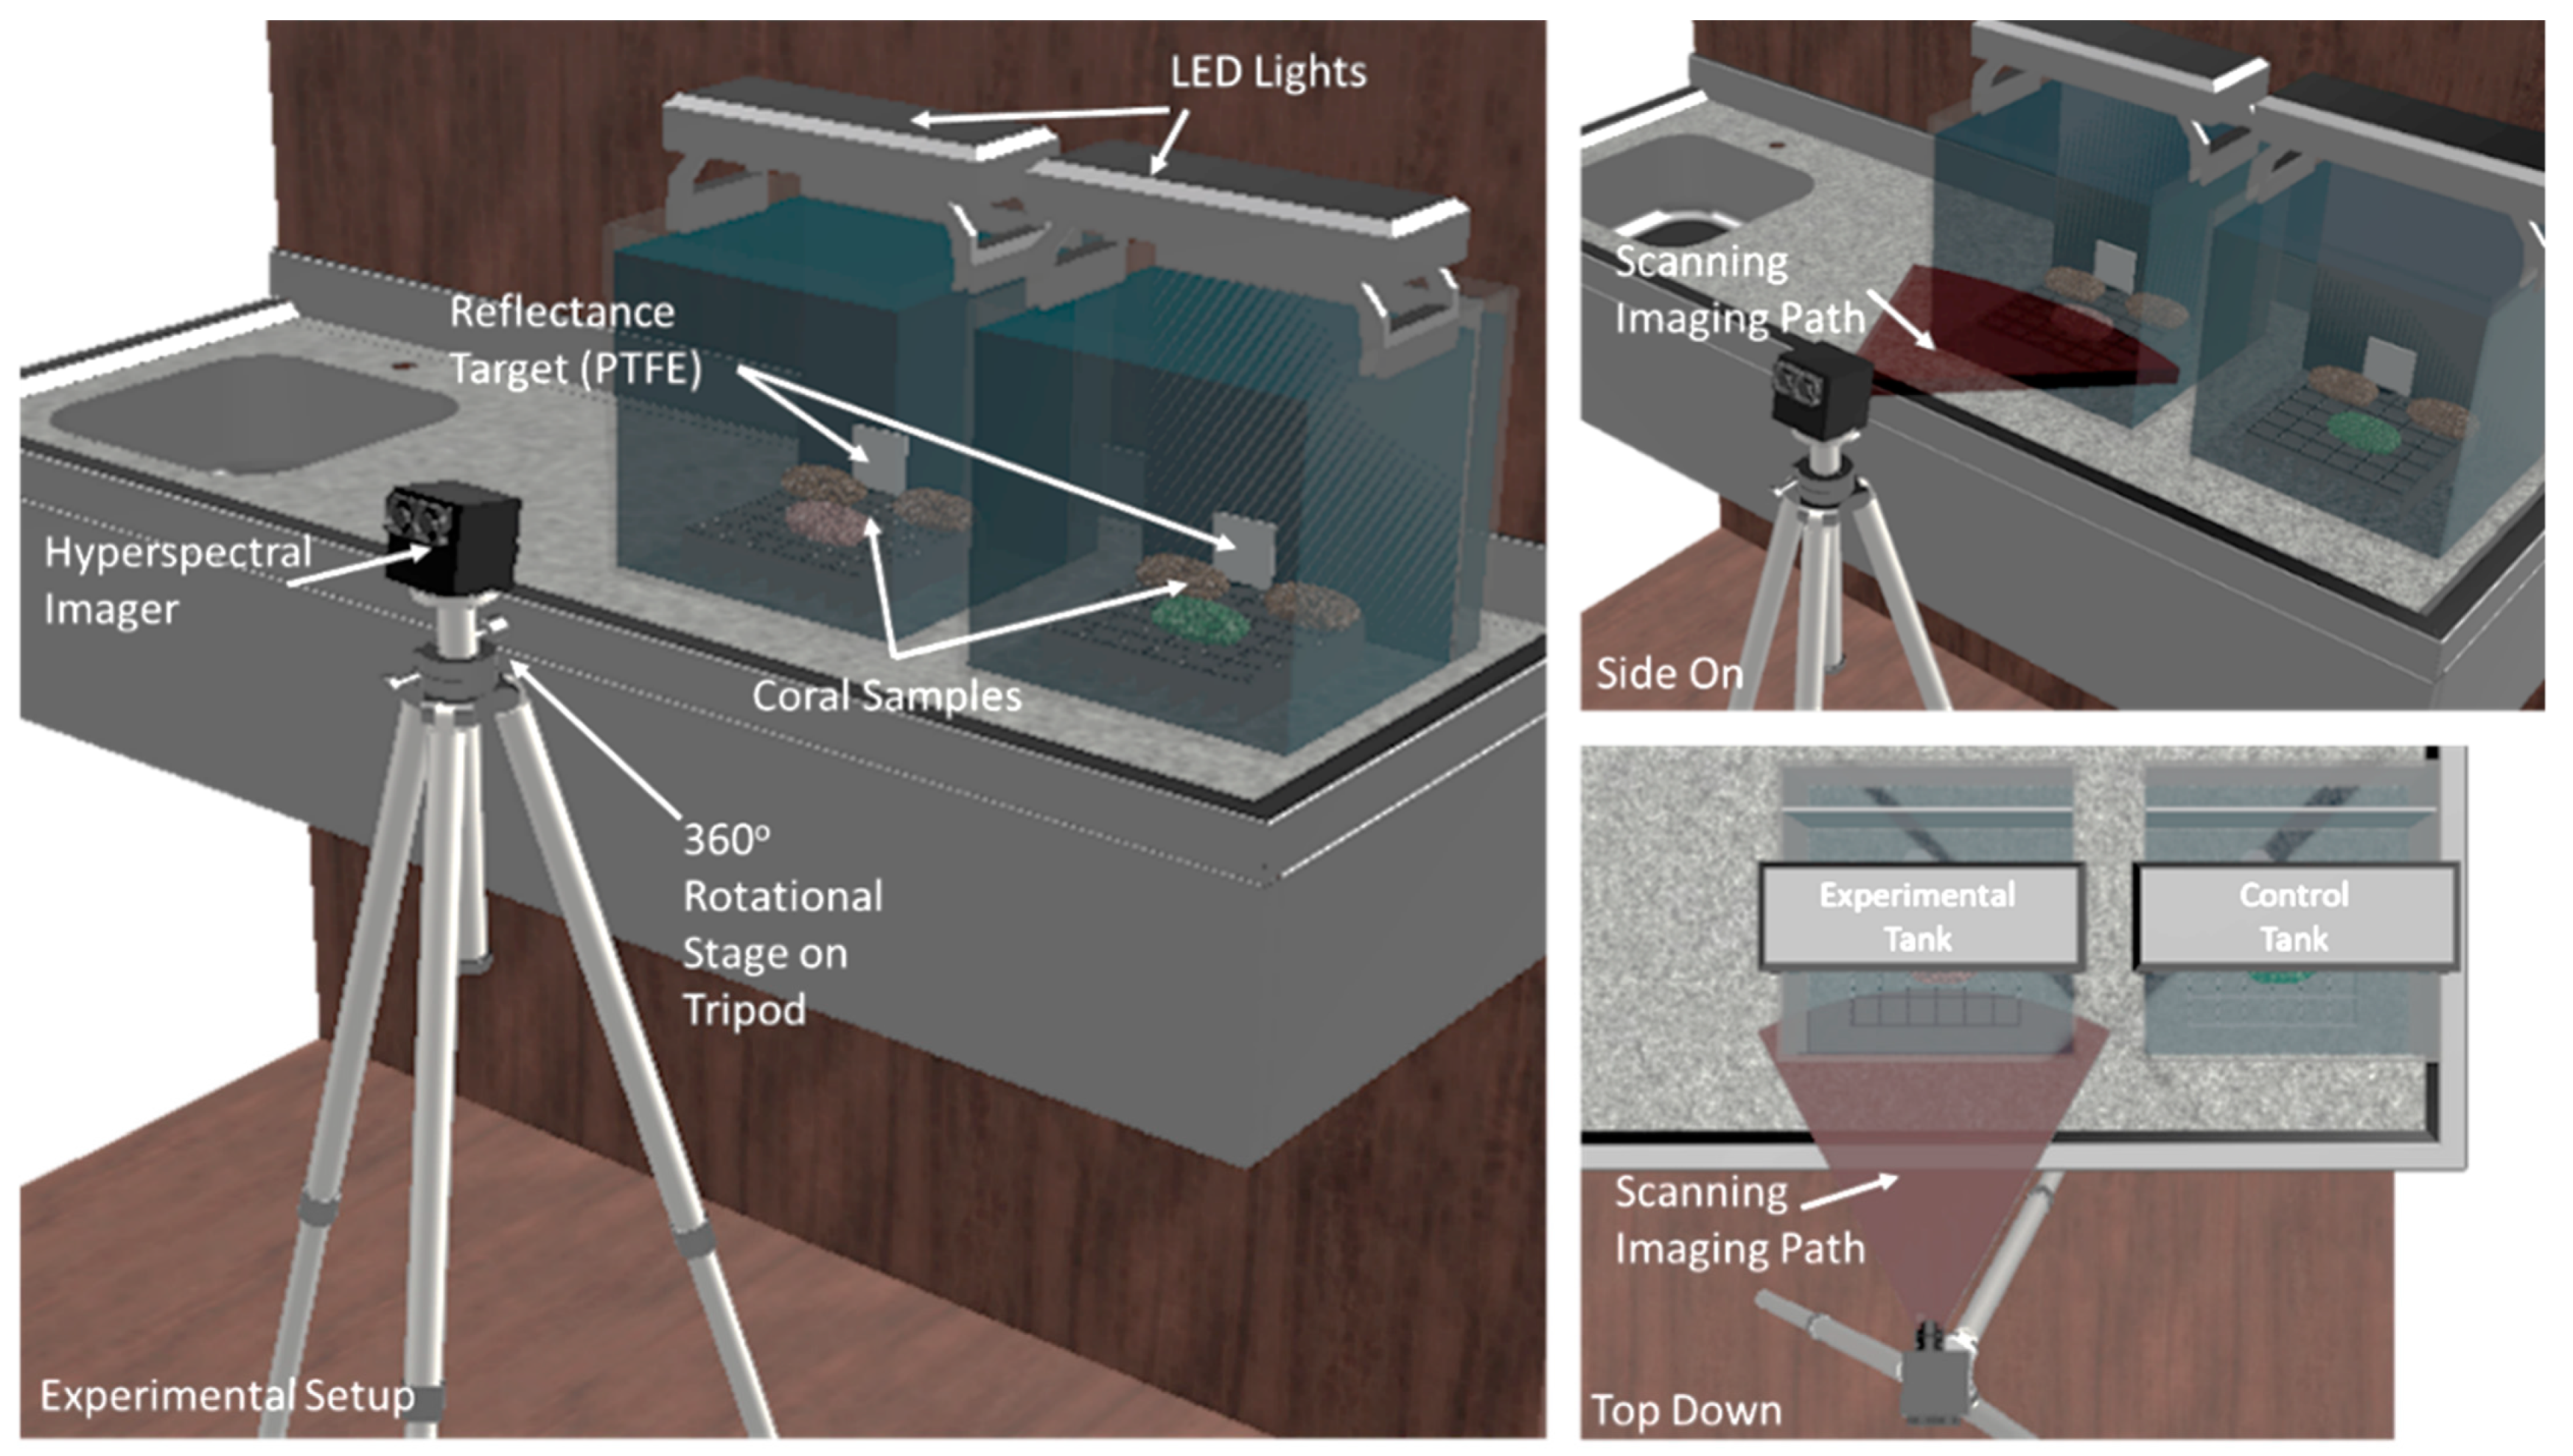
Abstract
:1. Introduction
2. Materials and Methods
3. Results
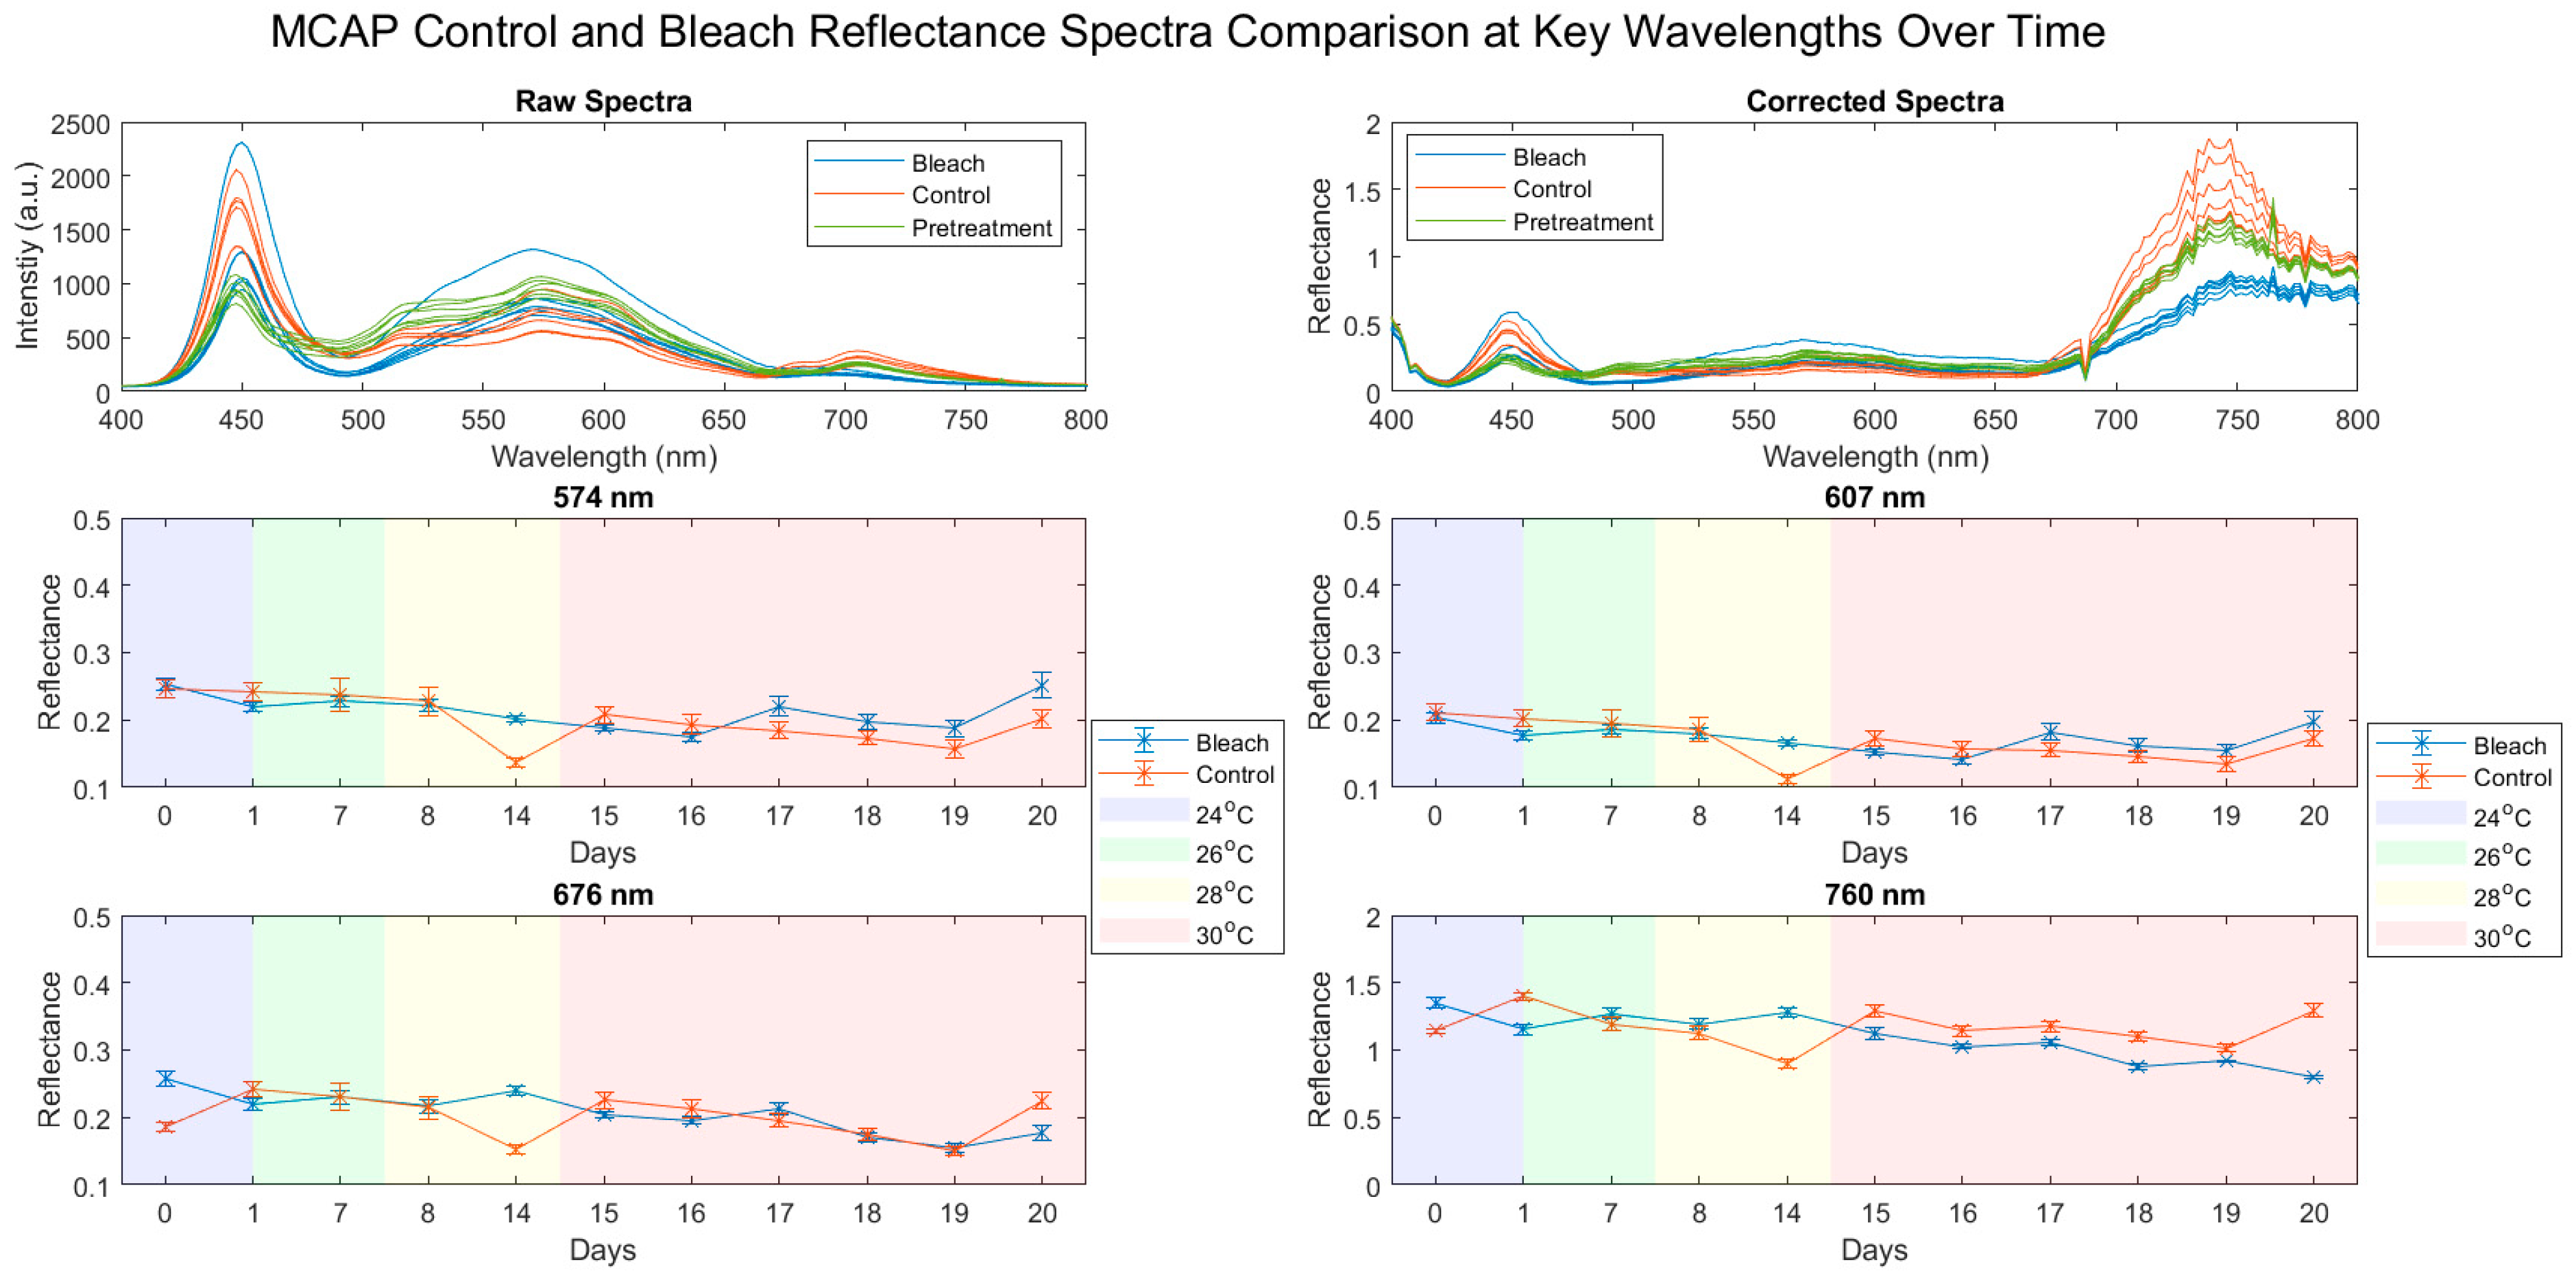
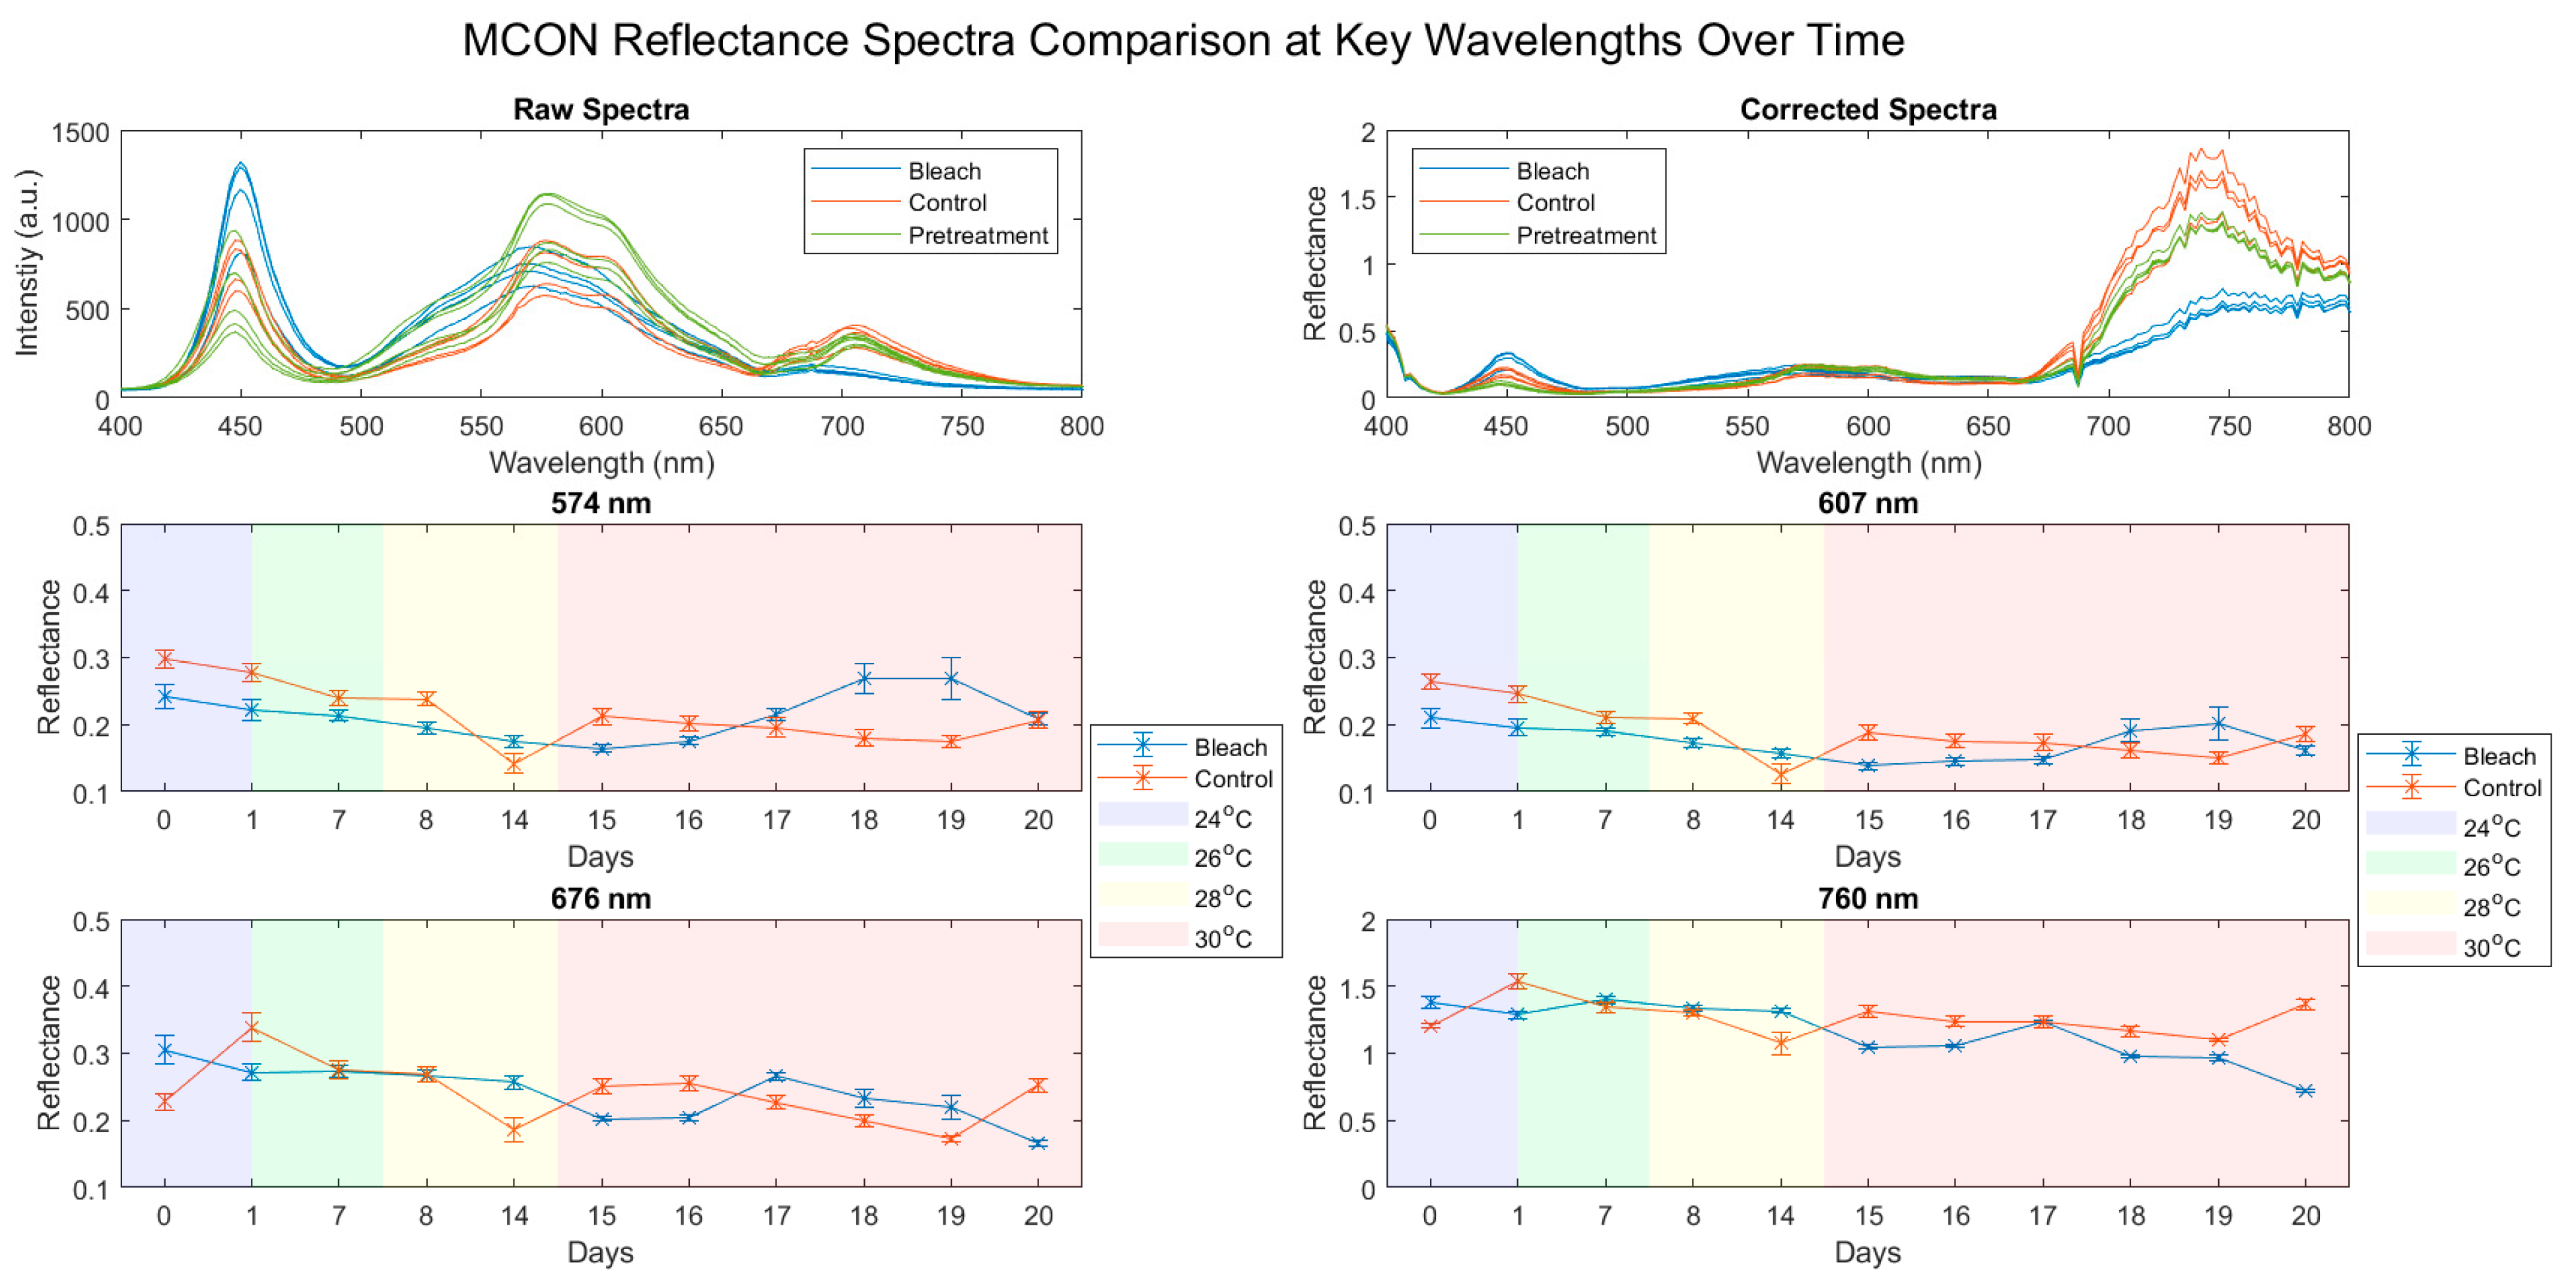
3.1. Reflectance Spectra
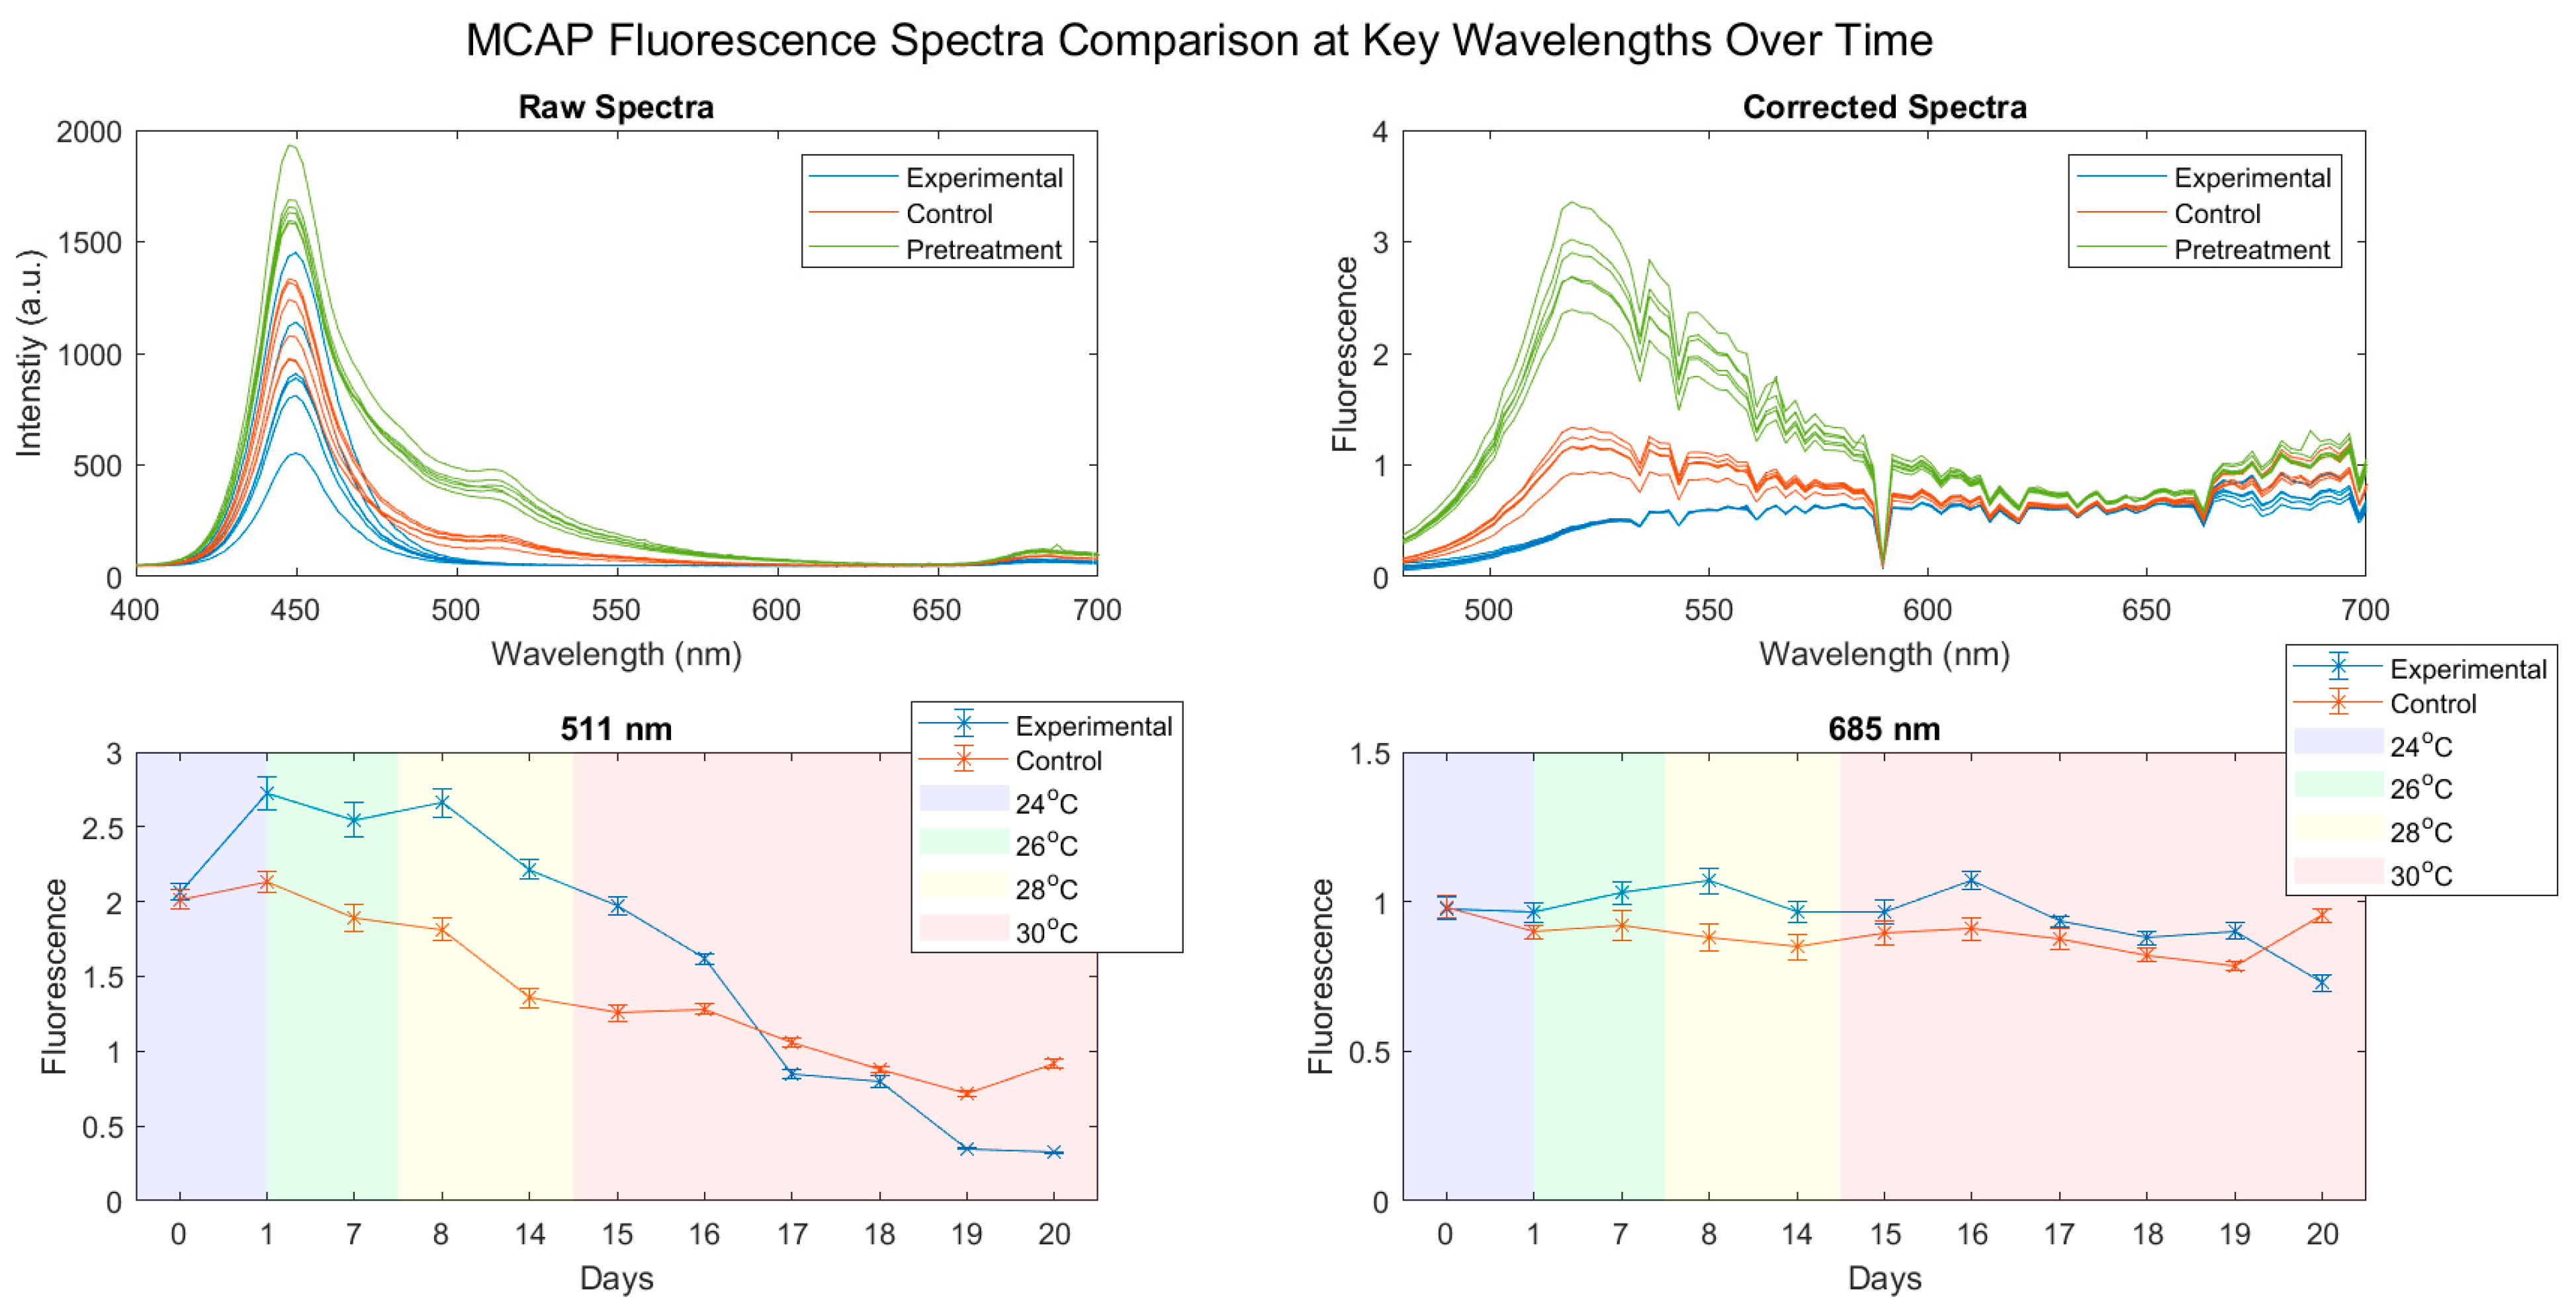
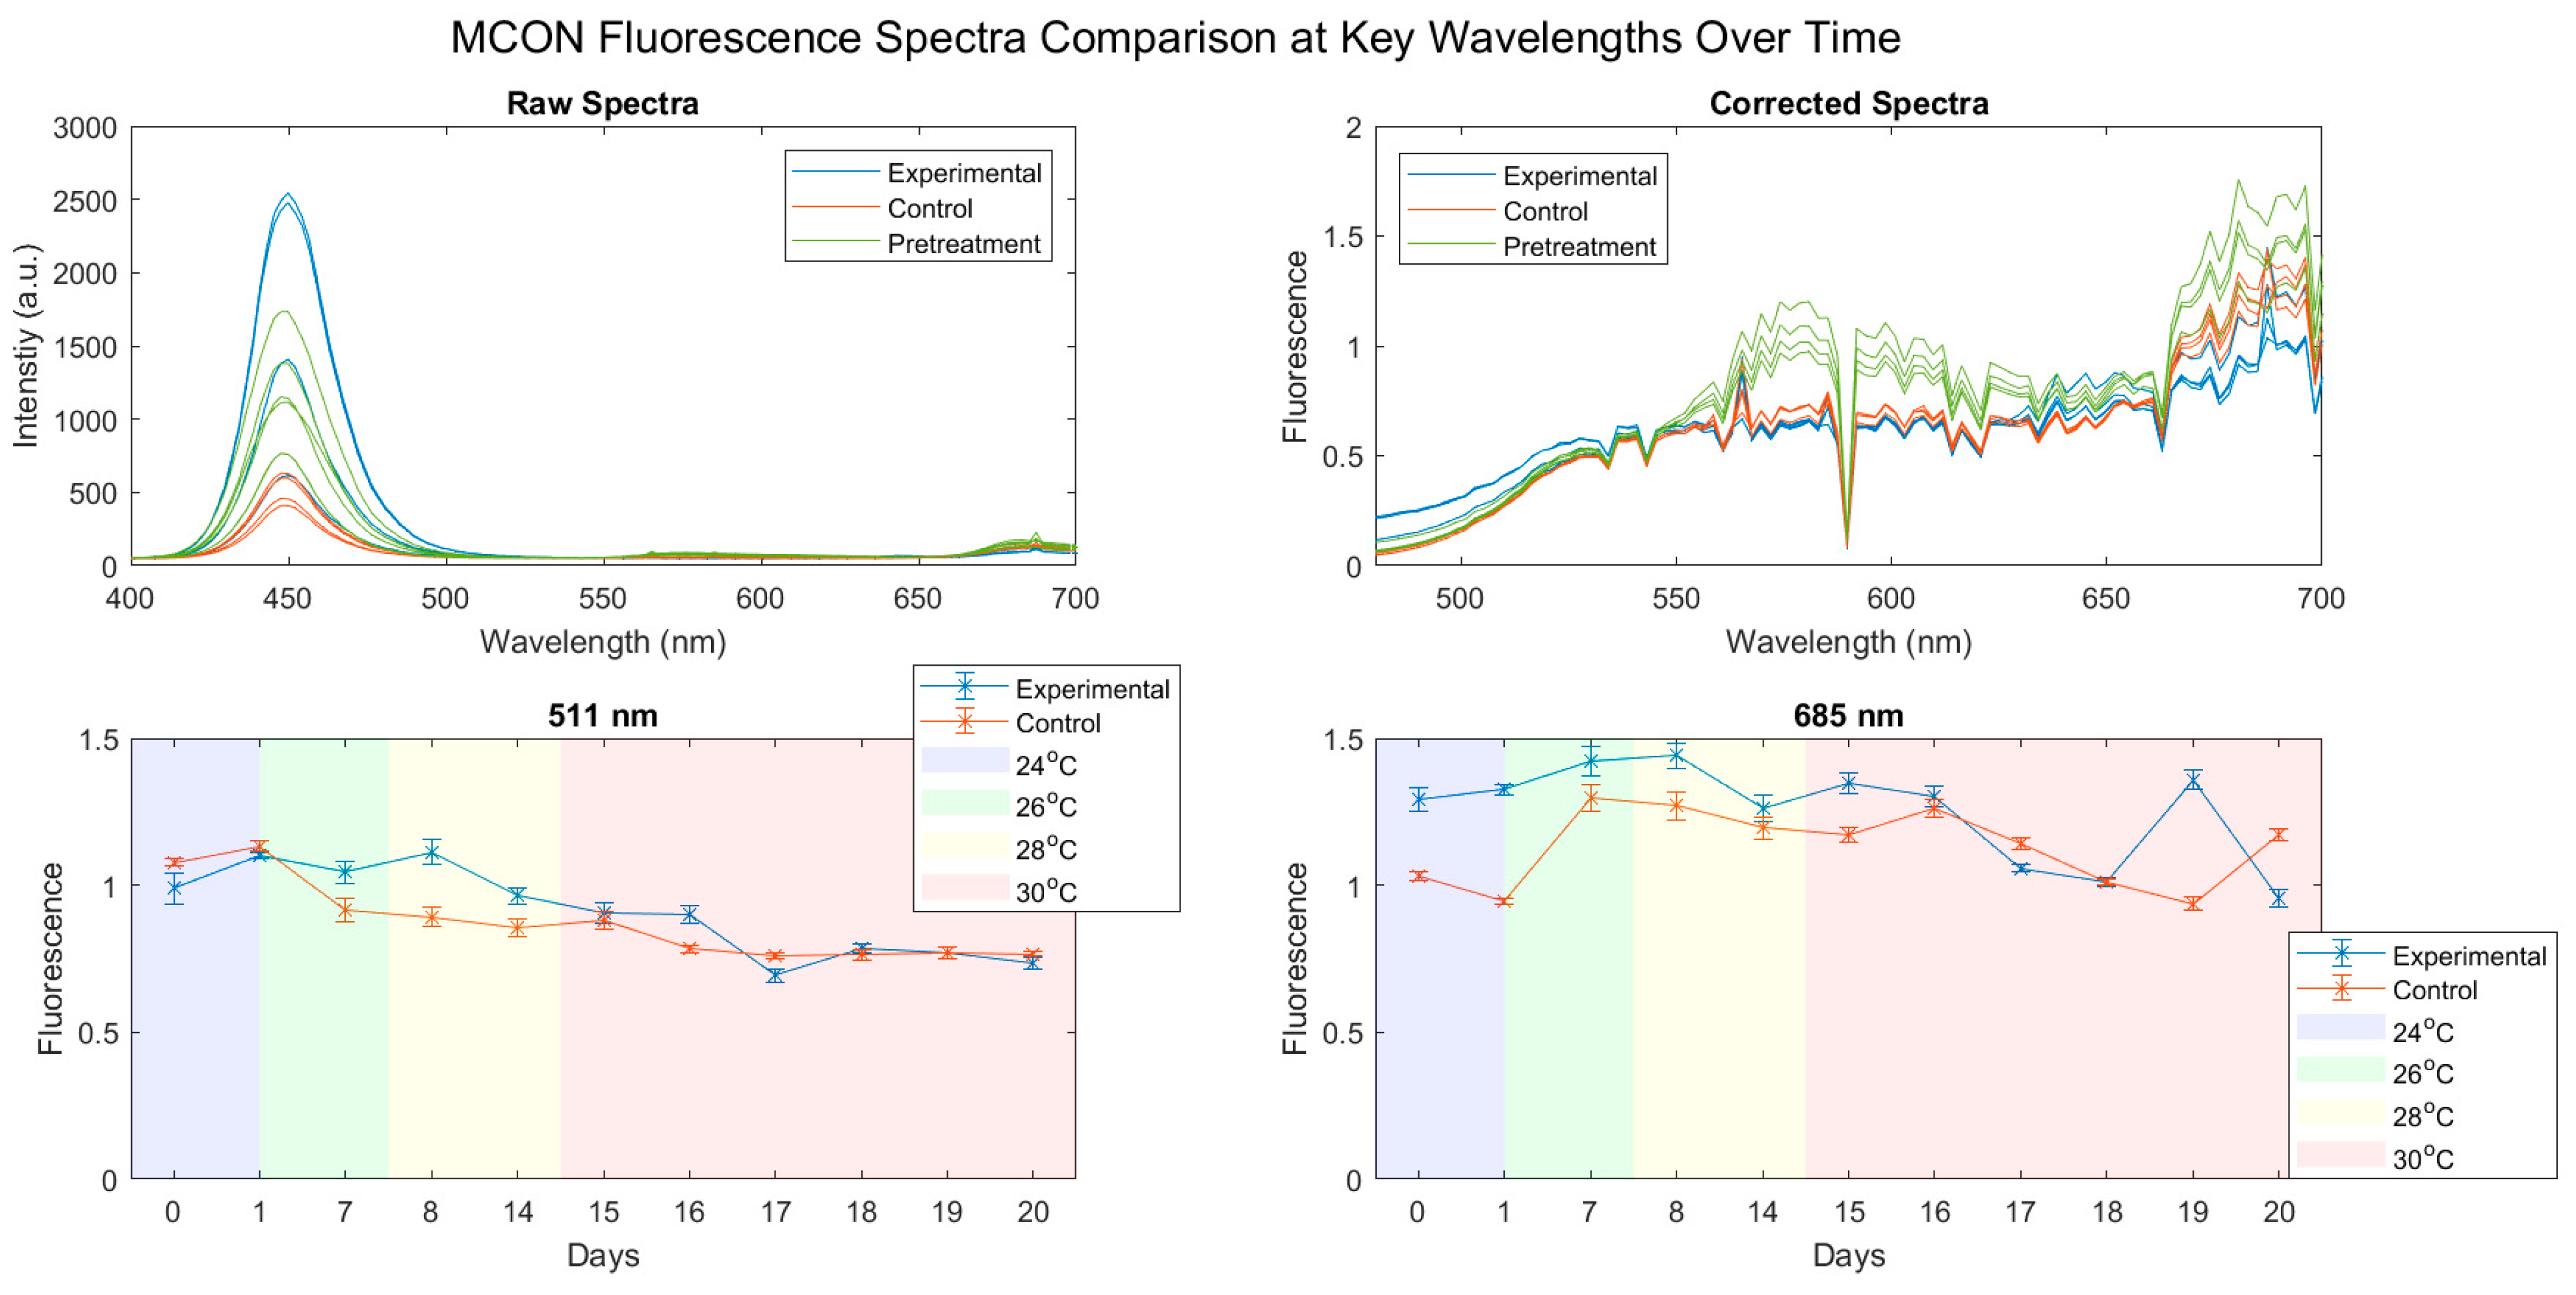
3.2. Fluorescence Spectra
4. Discussion
5. Conclusions
Supplementary Materials
Author Contributions
Funding
Institutional Review Board Statement
Informed Consent Statement
Data Availability Statement
Acknowledgments
Conflicts of Interest
References
- Hughes, T.P.; Kerry, J.T.; Álvarez-Noriega, M.; Álvarez-Romero, J.G.; Anderson, K.D.; Baird, A.H.; Babcock, R.C.; Beger, M.; Bellwood, D.R.; Berkelmans, R.; et al. Global warming and recurrent mass bleaching of corals. Nature 2017, 543, 373–377. [Google Scholar] [CrossRef] [PubMed]
- Teague, J.; Megson-Smith, D.A.; Allen, M.J.; Day, J.C.; Scott, T.B. A Review of Current and New Optical Techniques for Coral Monitoring. Oceans 2022, 3, 30–45. [Google Scholar] [CrossRef]
- Fitt, W.K.; McFarland, F.K.; Warner, M.E.; Chilcoat, G.C. Seasonal patterns of tissue biomass and densities of symbiotic dinoflagellates in reef corals and relation to coral bleaching. Limnol. Oceanogr. 2000, 45, 677–685. [Google Scholar] [CrossRef] [Green Version]
- Sheppard, C.; Davy, S.; Pilling, G.; Graham, N. The Biology of Coral Reefs; Oxford University Press: Oxford, UK, 2017. [Google Scholar]
- LaJeunesse, T. Diversity and community structure of symbiotic dinoflagellates from Caribbean coral reefs. Mar. Biol. 2002, 141, 387–400. [Google Scholar] [CrossRef]
- Rouzé, H.; Lecellier, G.; Saulnier, D.; Berteaux-Lecellier, V. Symbiodinium clades A and D differentially predispose Acropora cytherea to disease and Vibrio spp. colonization. Ecol. Evol. 2016, 6, 560–572. [Google Scholar] [CrossRef]
- Stat, M.; Morris, E.; Gates, R.D. Functional diversity in coral–dinoflagellate symbiosis. Proc. Natl. Acad. Sci. USA 2008, 105, 9256–9261. [Google Scholar] [CrossRef] [Green Version]
- Putnam, H.M.; Stat, M.; Pochon, X.; Gates, R.D. Endosymbiotic flexibility associates with environmental sensitivity in scleractinian corals. Proc. R. Soc. B Boil. Sci. 2012, 279, 4352–4361. [Google Scholar] [CrossRef] [Green Version]
- Stat, M.; Gates, R.D. Clade D Symbiodinium in Scleractinian Corals: A ‘Nugget’ of Hope, a Selfish Opportunist, an Ominous Sign, or All of the Above? J. Mar. Biol. 2011, 2011, 730715. [Google Scholar] [CrossRef] [Green Version]
- Satoh, S.; Ikeuchi, M.; Mimuro, M.; Tanaka, A. Chlorophyll b Expressed in Cyanobacteria Functions as a Light-harvesting Antenna in Photosystem I through Flexibility of the Proteins. J. Biol. Chem. 2001, 276, 4293–4297. [Google Scholar] [CrossRef] [Green Version]
- Roth, M.S.; Deheyn, D.D. Effects of cold stress and heat stress on coral fluorescence in reef-building corals. Sci. Rep. 2013, 3, 1421. [Google Scholar] [CrossRef]
- Field, S.F.; Bulina, M.Y.; Kelmanson, I.V.; Bielawski, J.P.; Matz, M.V. Adaptive Evolution of Multicolored Fluorescent Proteins in Reef-Building Corals. J. Mol. Evol. 2006, 62, 332–339. [Google Scholar] [CrossRef] [PubMed]
- Salih, A.; Larkum, A.; Cox, G.; Kühl, M.; Hoegh-Guldberg, O. Fluorescent pigments in corals are photoprotective. Nature 2000, 408, 850–853. [Google Scholar] [CrossRef] [PubMed]
- Palmer, C.V.; Modi, C.; Mydlarz, L.D. Coral Fluorescent Proteins as Antioxidants. PLoS ONE 2009, 4, e7298. [Google Scholar] [CrossRef] [Green Version]
- Rodriguez-Lanetty, M.; Harii, S.; Hoegh-Guldberg, O. Early molecular responses of coral larvae to hyperthermal stress. Mol. Ecol. 2009, 18, 5101–5114. [Google Scholar] [CrossRef] [PubMed]
- Desalvo, M.K.; Voolstra, C.R.; Sunagawa, S.; Schwarz, J.A.; Stillman, J.H.; Coffroth, M.A.; Szmant, A.M.; Medina, M. Differential gene expression during thermal stress and bleaching in the Caribbean coral Montastraea faveolata. Mol. Ecol. 2008, 17, 3952–3971. [Google Scholar] [CrossRef]
- Teague, J.; Willans, J.; Allen, M.J.; Scott, T.B.; Day, J.C. Hyperspectral imaging as a tool for assessing coral health utilising natural fluorescence. J. Spectr. Imaging 2019, 8, a7. [Google Scholar] [CrossRef] [Green Version]
- Barott, K.; Smith, J.; Dinsdale, E.; Hatay, M.; Sandin, S.; Rohwer, F. Hyperspectral and Physiological Analyses of Coral-Algal Interactions. PLoS ONE 2009, 4, e8043. [Google Scholar] [CrossRef]
- Myers, M.R.; Hardy, J.T.; Mazel, C.H.; Dustan, P. Optical spectra and pigmentation of Caribbean reef corals and macroalgae. Coral Reefs 1999, 18, 179–186. [Google Scholar] [CrossRef]
- Zawada, D.G.; Jaffe, J.S. Changes in the fluorescence of the Caribbean coral Montastraea faveolata during heat-induced bleaching. Limnol. Oceanogr. 2010, 48, 412–425. [Google Scholar] [CrossRef] [Green Version]
- Holden, H.; LeDrew, E. Spectral Discrimination of Healthy and Non-Healthy Corals Based on Cluster Analysis, Principal Components Analysis, and Derivative Spectroscopy. Remote Sens. Environ. 1998, 65, 217–224. [Google Scholar] [CrossRef]
- Dove, S.; Ortiz, J.C.; Enríquez, S.; Fine, M.; Fisher, P.; Iglesias-Prieto, R.; Thornhill, D.; Hoegh-Guldberg, O. Response of holosymbiont pigments from the scleractinian coral Montipora monasteriata to short-term heat stress. Limnol. Oceanogr. 2006, 51, 1149–1158. [Google Scholar] [CrossRef] [Green Version]
- Fitt, W.K.; Brown, B.E.; Warner, M.E.; Dunne, R.P. Coral bleaching: Interpretation of thermal tolerance limits and thermal thresholds in tropical corals. Coral Reefs 2001, 20, 51–65. [Google Scholar] [CrossRef]
- Falkowski, P.; Knoll, A.H. (Eds.) . Evolution of Primary Producers in the Sea; Academic Press: Cambridge, MA, USA, 2007. [Google Scholar]
- Brown, J.S. Absorption and fluorescence spectra of chlorophyll-proteins isolated from Euglena gracilis. BBA Bioenergy 1980, 591, 9–21. [Google Scholar] [CrossRef] [PubMed]
- Winters, G.; Holzman, R.; Blekhman, A.; Beer, S.; Loya, Y. Photographic assessment of coral chlorophyll contents: Implications for ecophysiological studies and coral monitoring. J. Exp. Mar. Biol. Ecol. 2009, 380, 25–35. [Google Scholar] [CrossRef]
- Thieberger, Y.; Kizner, Z.; Achituv, Y.; Dubinsky, Z. A novel, nondestructive bioassay for assessing areal chlorophyll a in hermatypic cnidarians. Limnol. Oceanogr. 1995, 40, 1166–1173. [Google Scholar] [CrossRef]
- Siebeck, U.E.; Marshall, N.J.; Klüter, A.; Hoegh-Guldberg, O. Monitoring coral bleaching using a colour reference card. Coral Reefs 2006, 25, 453–460. [Google Scholar] [CrossRef]
- Siebeck, U.E.; Logan, D.; Marshall, N.J. CoralWatch—A flexible coral bleaching monitoring tool for you and your group. In Proceedings of the 11th International Coral Reef Symposium, Ft. Lauderdale, FL, USA, 7–11 July 2008. [Google Scholar]
- Joyce, K.; Phinn, S. Hyperspectral analysis of chlorophyll content and photosynthetic capacity of coral reef substrates. Limnol. Oceanogr. 2003, 48, 489–496. [Google Scholar] [CrossRef] [Green Version]
- Hochberg, E.J.; Apprill, A.M.; Atkinson, M.J.; Bidigare, R.R. Bio-optical modeling of photosynthetic pigments in corals. Coral Reefs 2006, 25, 99–109. [Google Scholar] [CrossRef]
- Dove, S.; Hoegh-Guldberg, O.; Ranganathan, S. Major colour patterns of reef-building corals are due to a family of GFP-like proteins. Coral Reefs 2001, 19, 197–204. [Google Scholar] [CrossRef]
- Haddock, S.H.D.; Dunn, C.W. Fluorescent proteins function as a prey attractant: Experimental evidence from the hydromedusa Olindias formosus and other marine organisms. Biol. Open 2015, 4, 1094–1104. [Google Scholar] [CrossRef]
- Dunlap, W.; Chalker, B.; Bandaranayake, W.; Won, J.W. Nature’s sunscreen from the Great Barrier Reef, Australia. Int. J. Cosmet. Sci. 1998, 20, 41–51. [Google Scholar] [CrossRef] [PubMed]


Publisher’s Note: MDPI stays neutral with regard to jurisdictional claims in published maps and institutional affiliations. |
© 2022 by the authors. Licensee MDPI, Basel, Switzerland. This article is an open access article distributed under the terms and conditions of the Creative Commons Attribution (CC BY) license (https://creativecommons.org/licenses/by/4.0/).
Share and Cite
Teague, J.; Willans, J.; Megson-Smith, D.A.; Day, J.C.C.; Allen, M.J.; Scott, T.B. Using Colour as a Marker for Coral ‘Health’: A Study on Hyperspectral Reflectance and Fluorescence Imaging of Thermally Induced Coral Bleaching. Oceans 2022, 3, 547-556. https://doi.org/10.3390/oceans3040036
Teague J, Willans J, Megson-Smith DA, Day JCC, Allen MJ, Scott TB. Using Colour as a Marker for Coral ‘Health’: A Study on Hyperspectral Reflectance and Fluorescence Imaging of Thermally Induced Coral Bleaching. Oceans. 2022; 3(4):547-556. https://doi.org/10.3390/oceans3040036
Chicago/Turabian StyleTeague, Jonathan, Jack Willans, David A. Megson-Smith, John C. C. Day, Michael J. Allen, and Thomas B. Scott. 2022. "Using Colour as a Marker for Coral ‘Health’: A Study on Hyperspectral Reflectance and Fluorescence Imaging of Thermally Induced Coral Bleaching" Oceans 3, no. 4: 547-556. https://doi.org/10.3390/oceans3040036