
When and Where Did They Strand? The Spatio-Temporal Hotspot Patterns of Cetacean Stranding Events in Indonesia
 , , , , , and
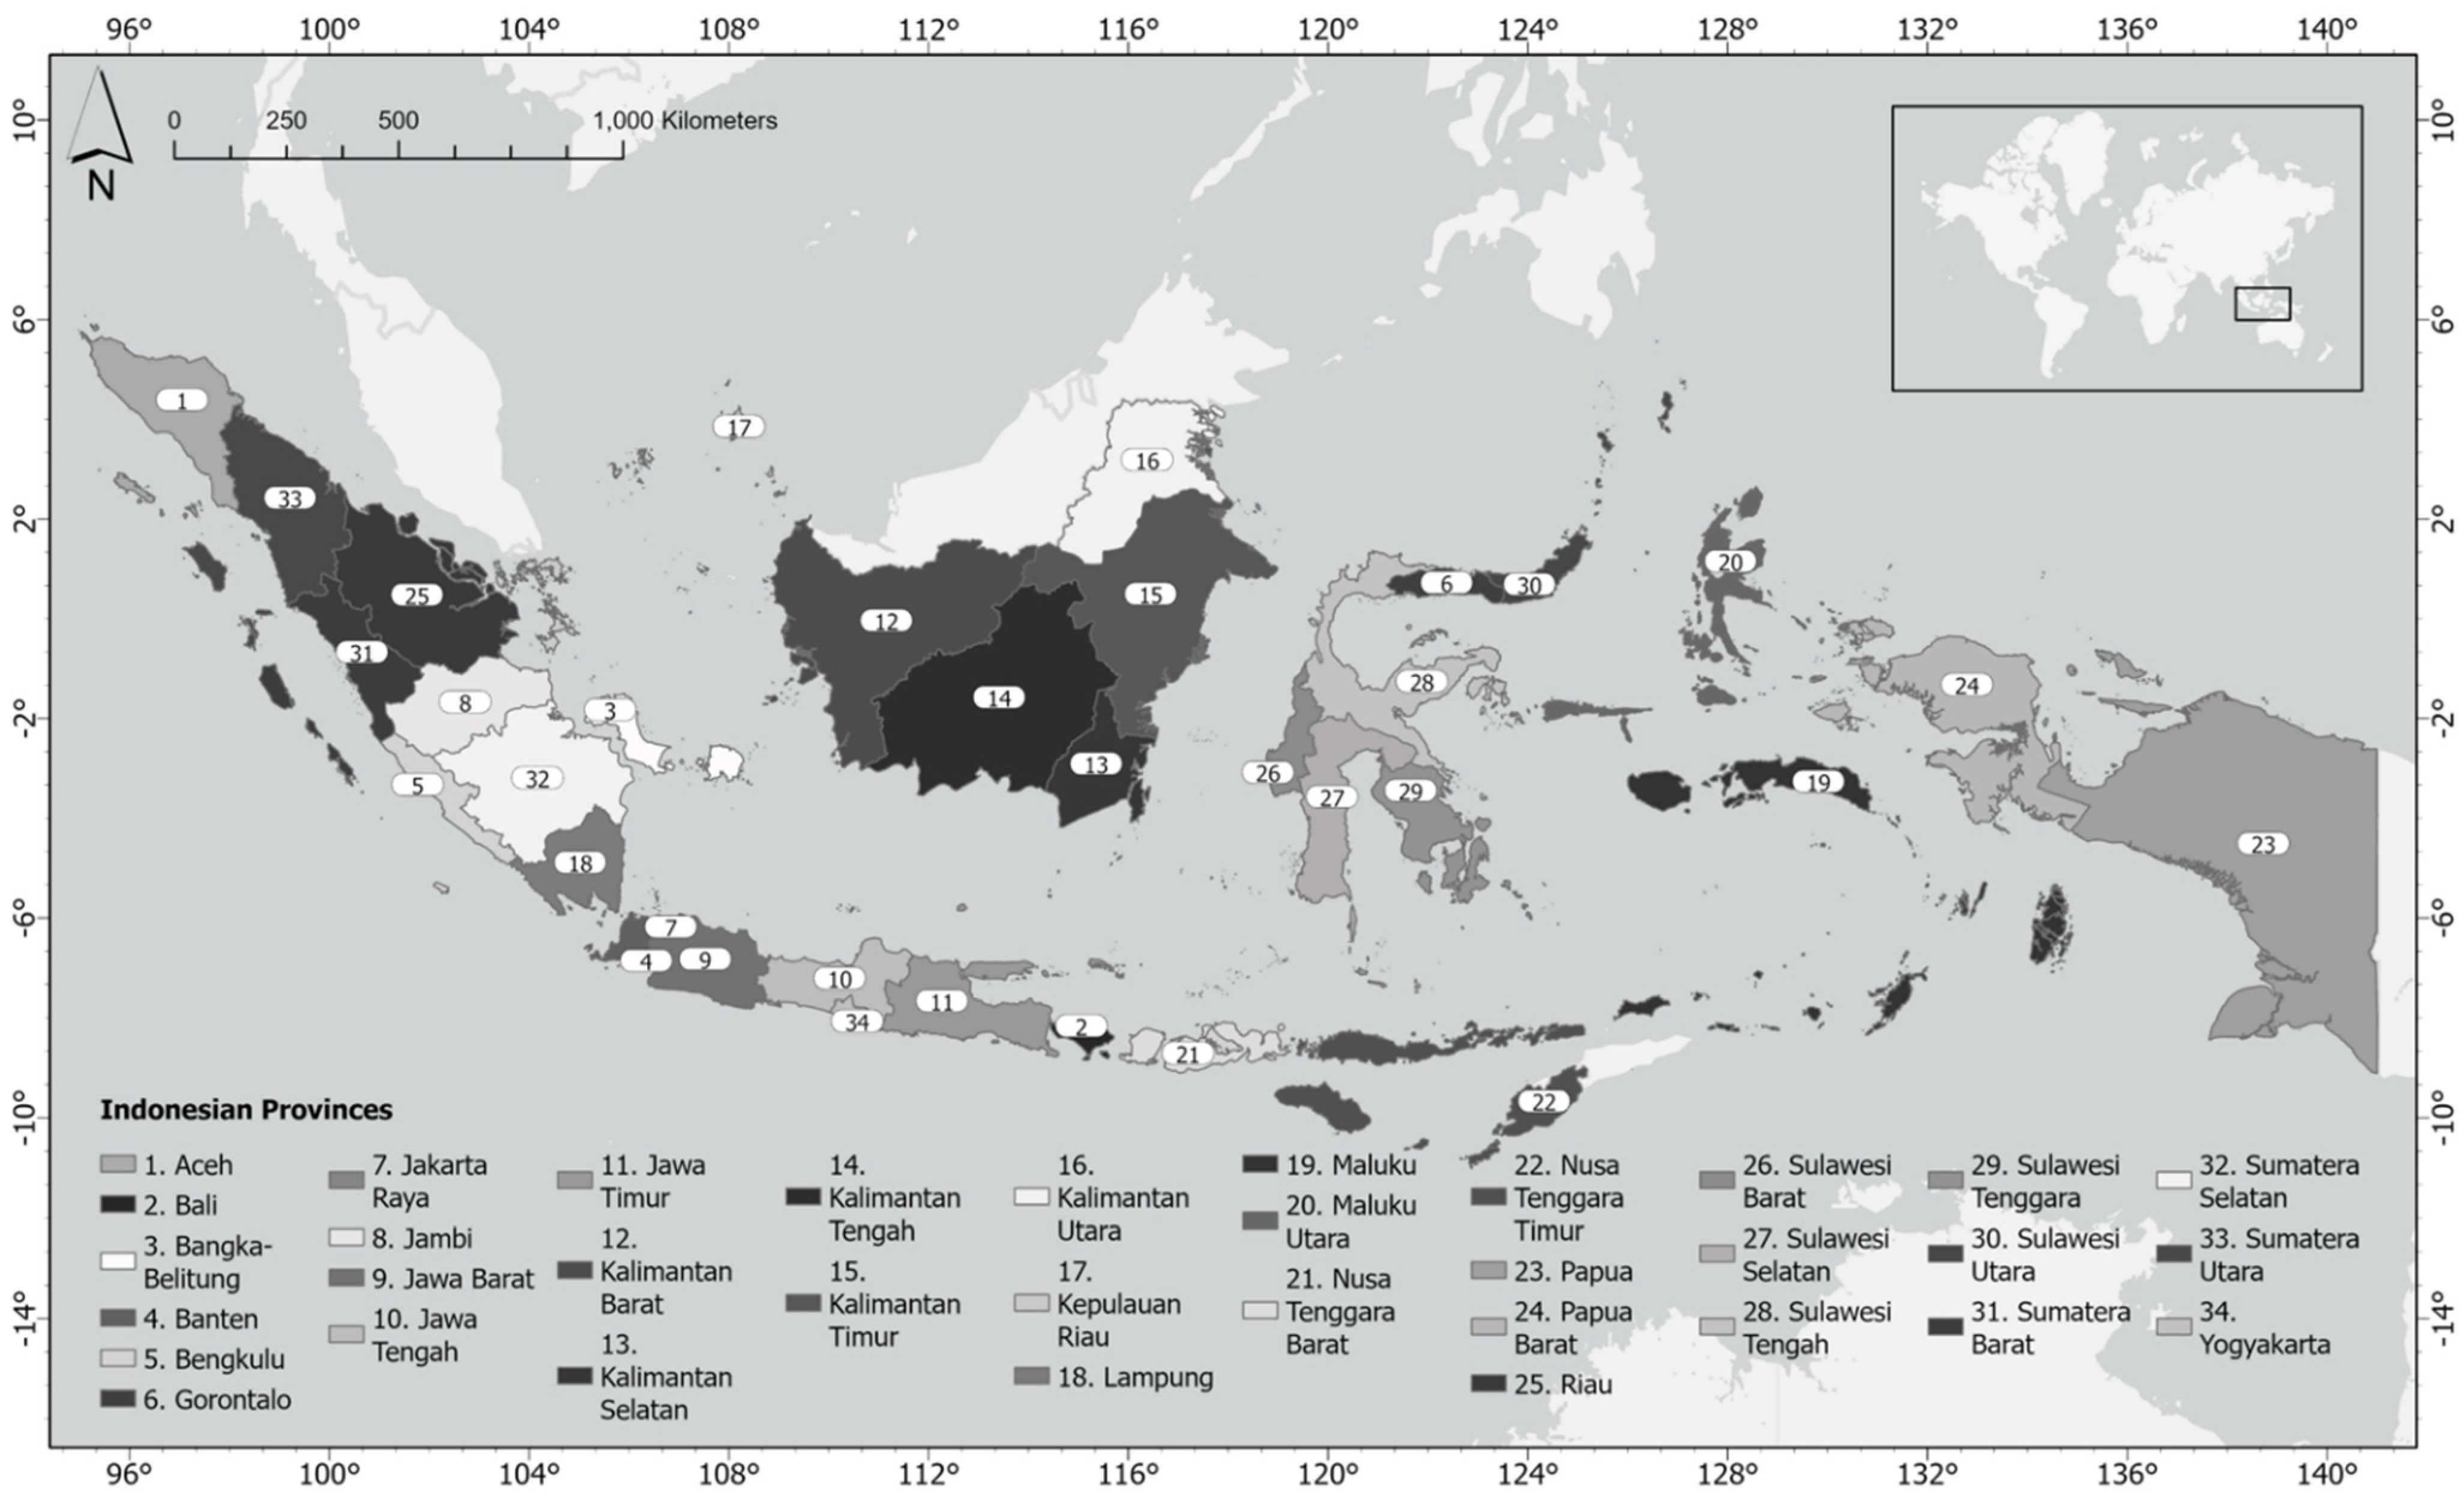
Abstract
:1. Introduction
- (1)
- Are there spatial hotspots of cetacean strandings, and if yes, where are they?
- (2)
- Are there spatio-temporal trends of cetacean strandings, and if yes, how?
2. Materials and Methods
2.1. Study Area and Dataset
2.2. Spatial and Temporal Analyses
3. Results
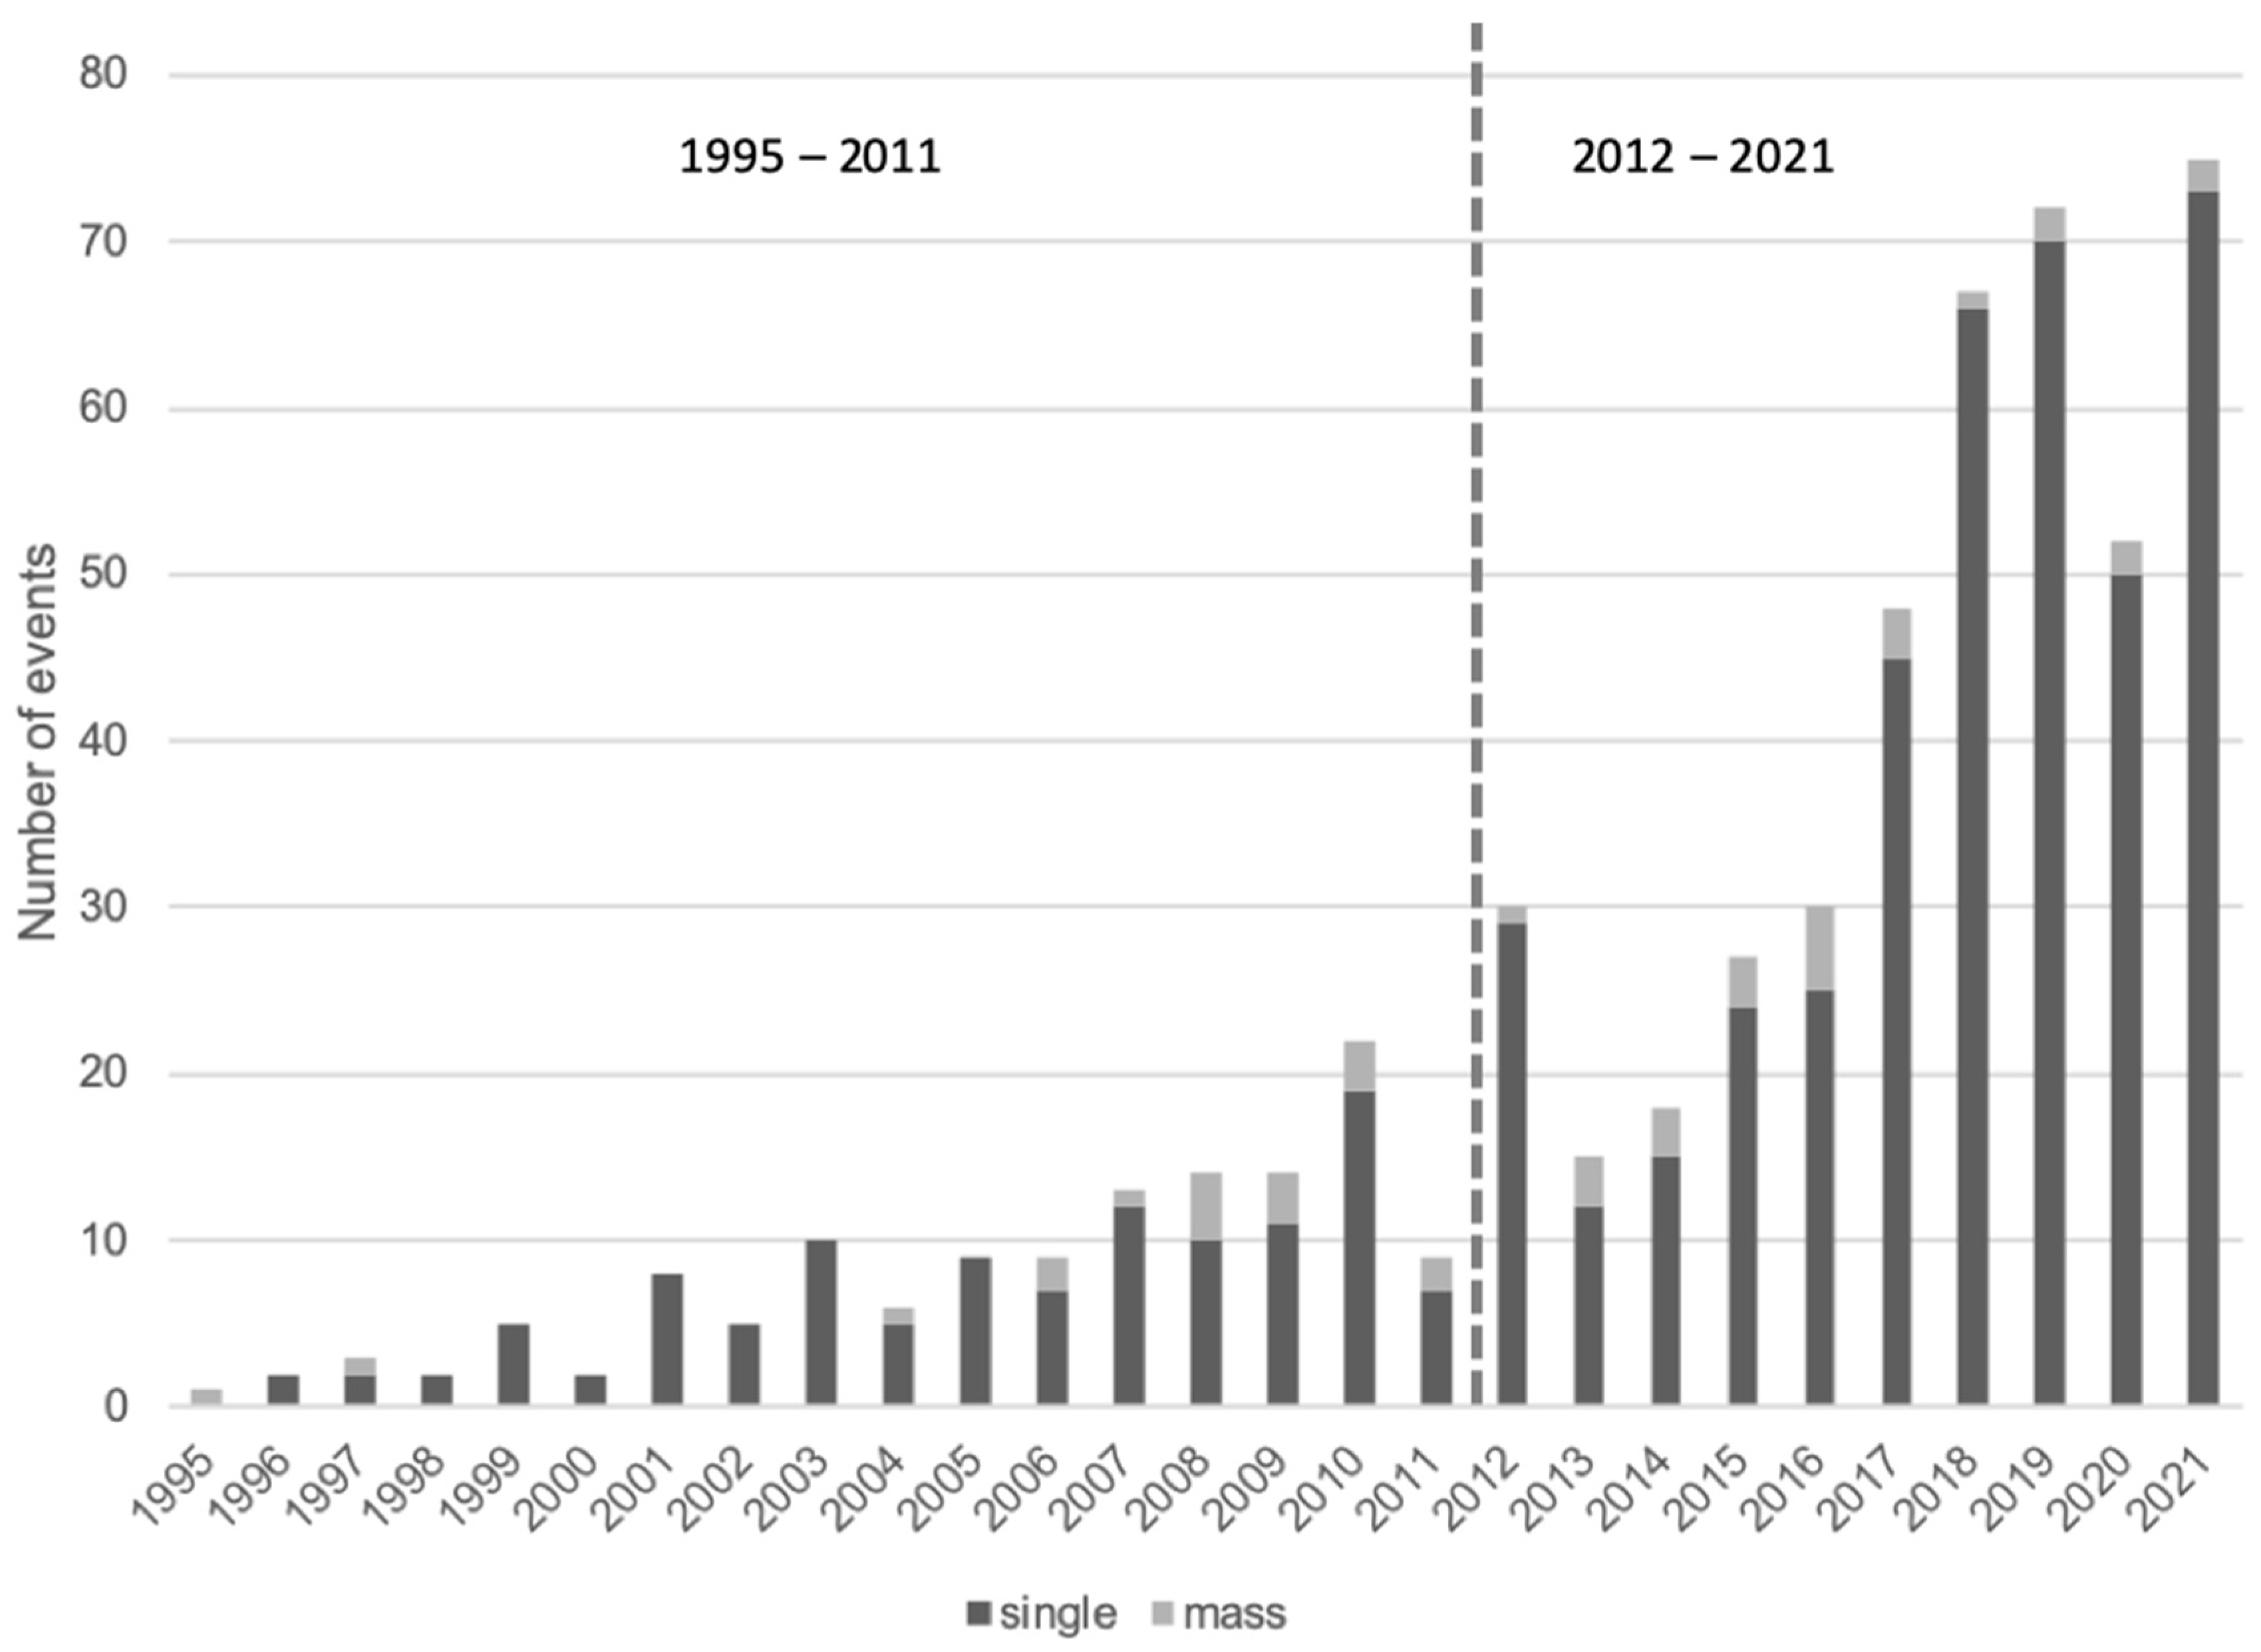
3.1. Descriptive Statistics of the Stranding Events
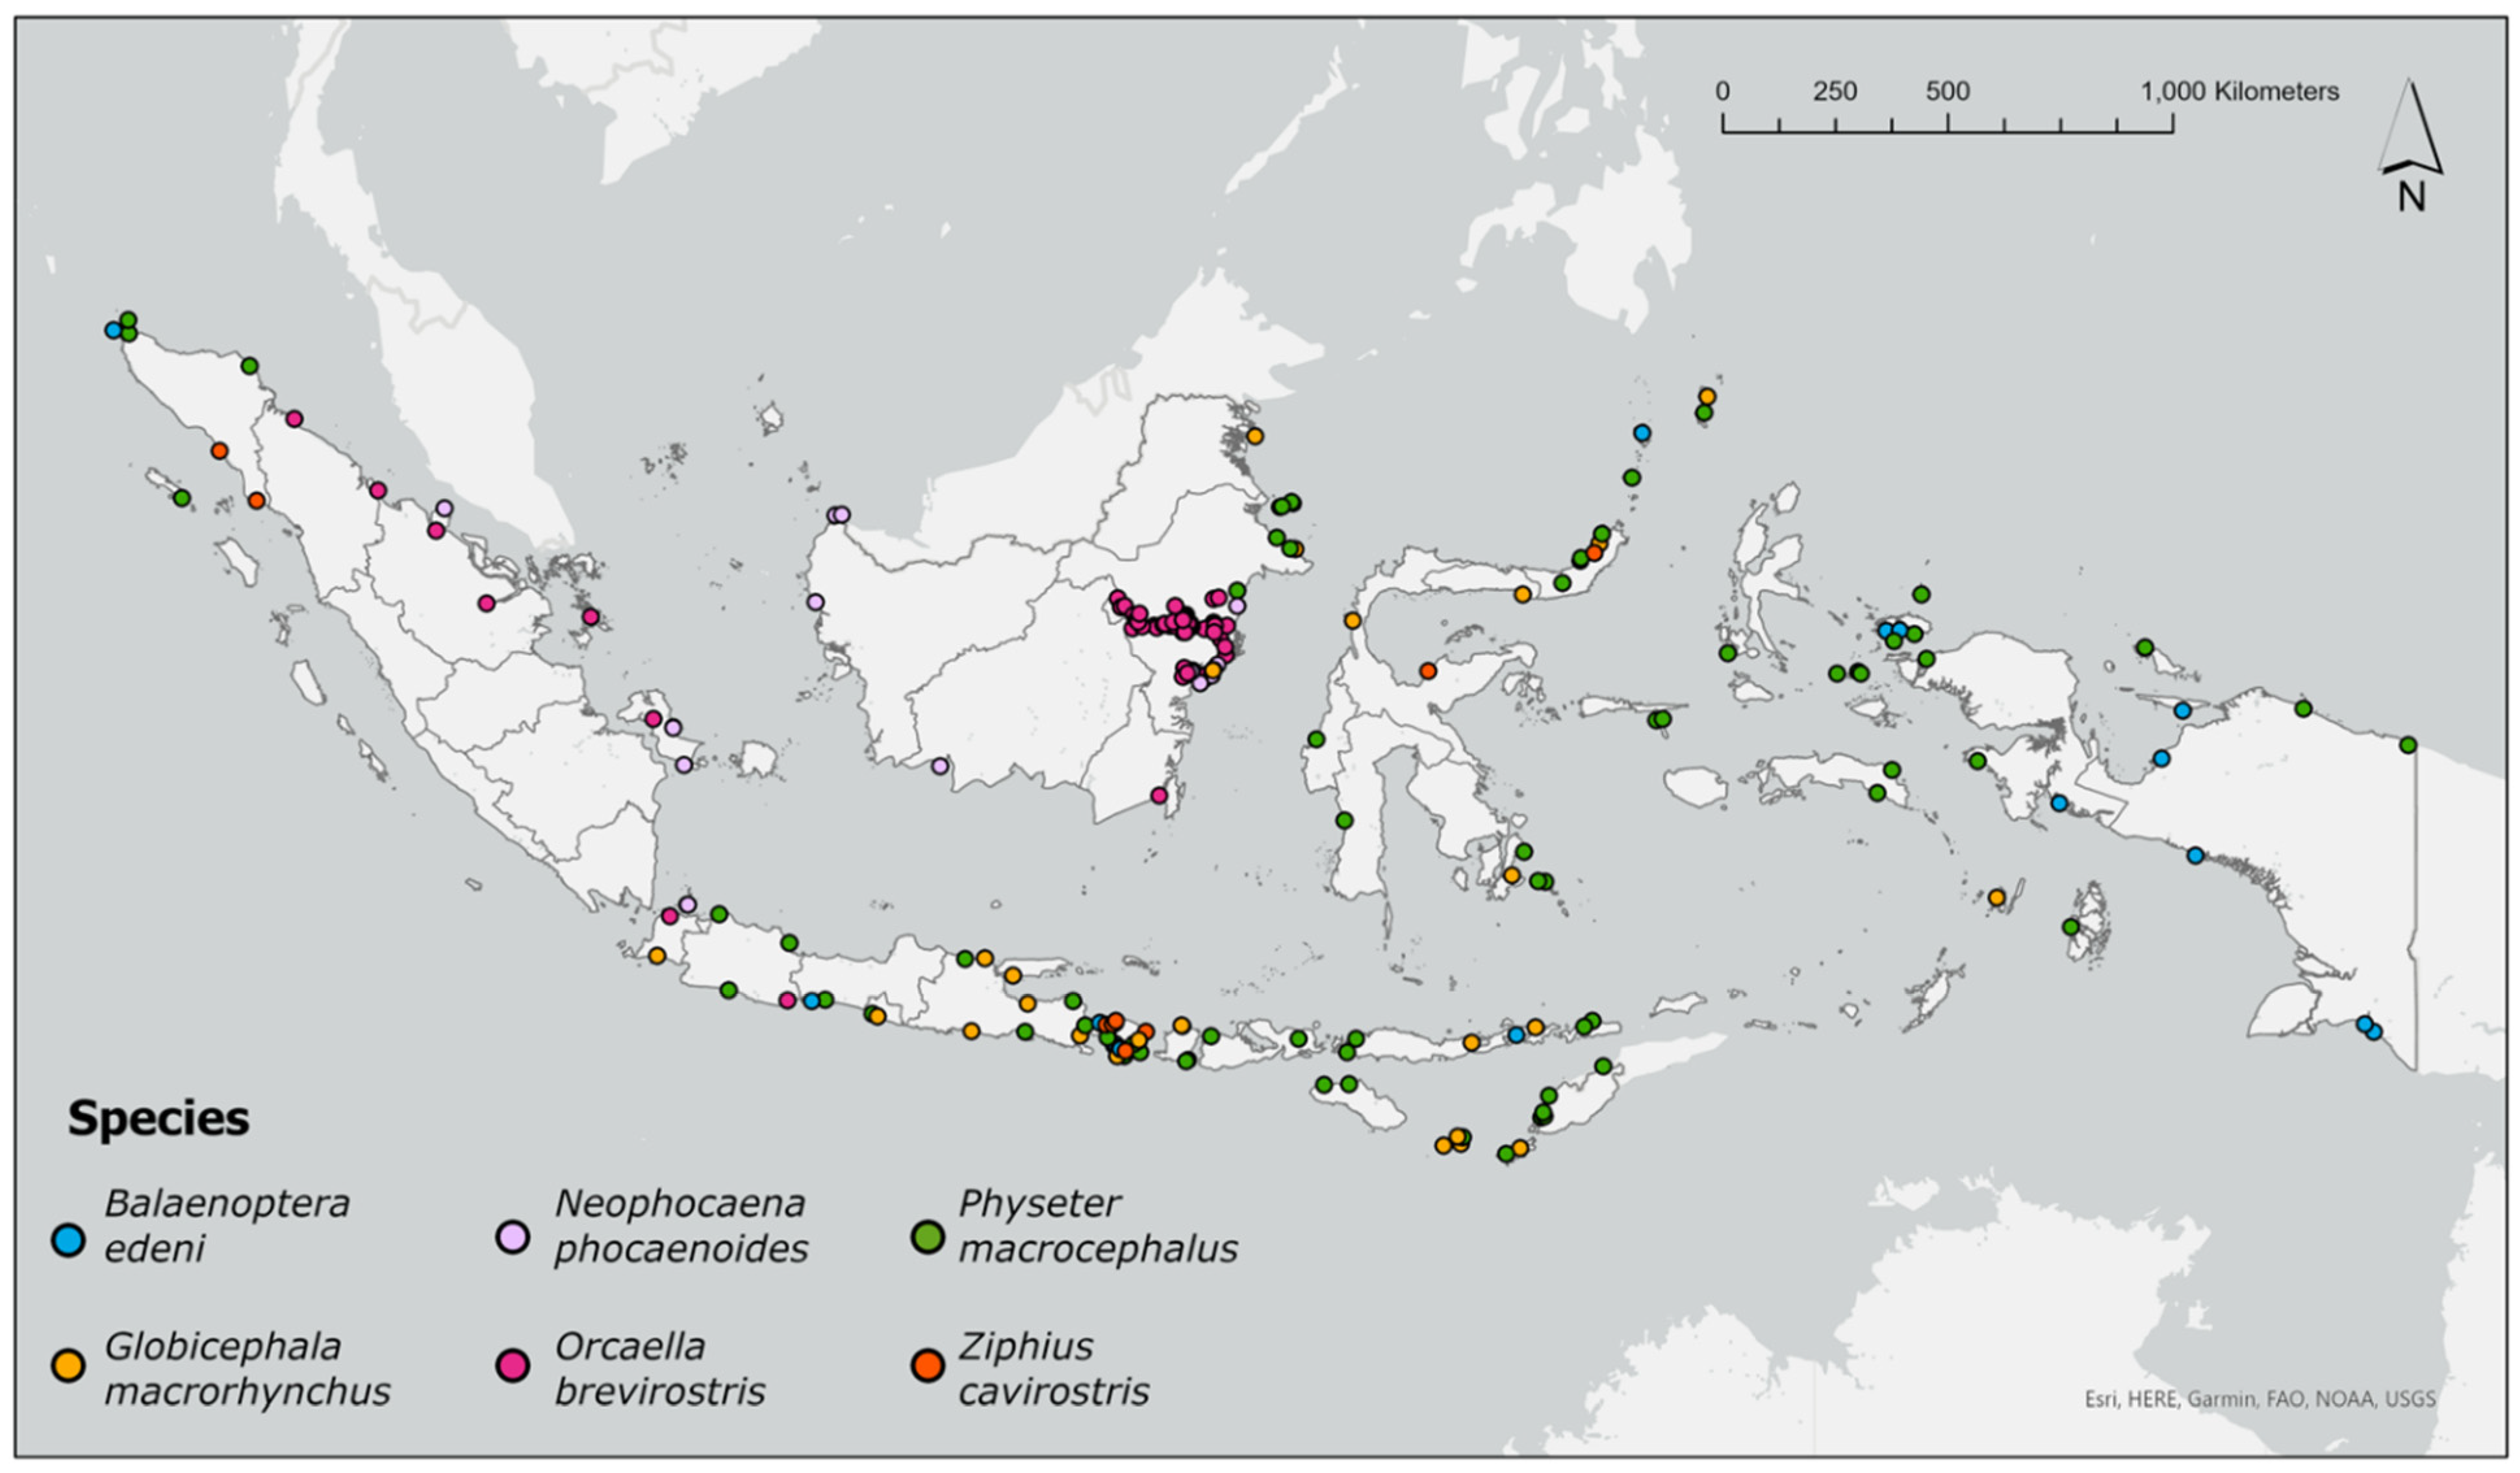
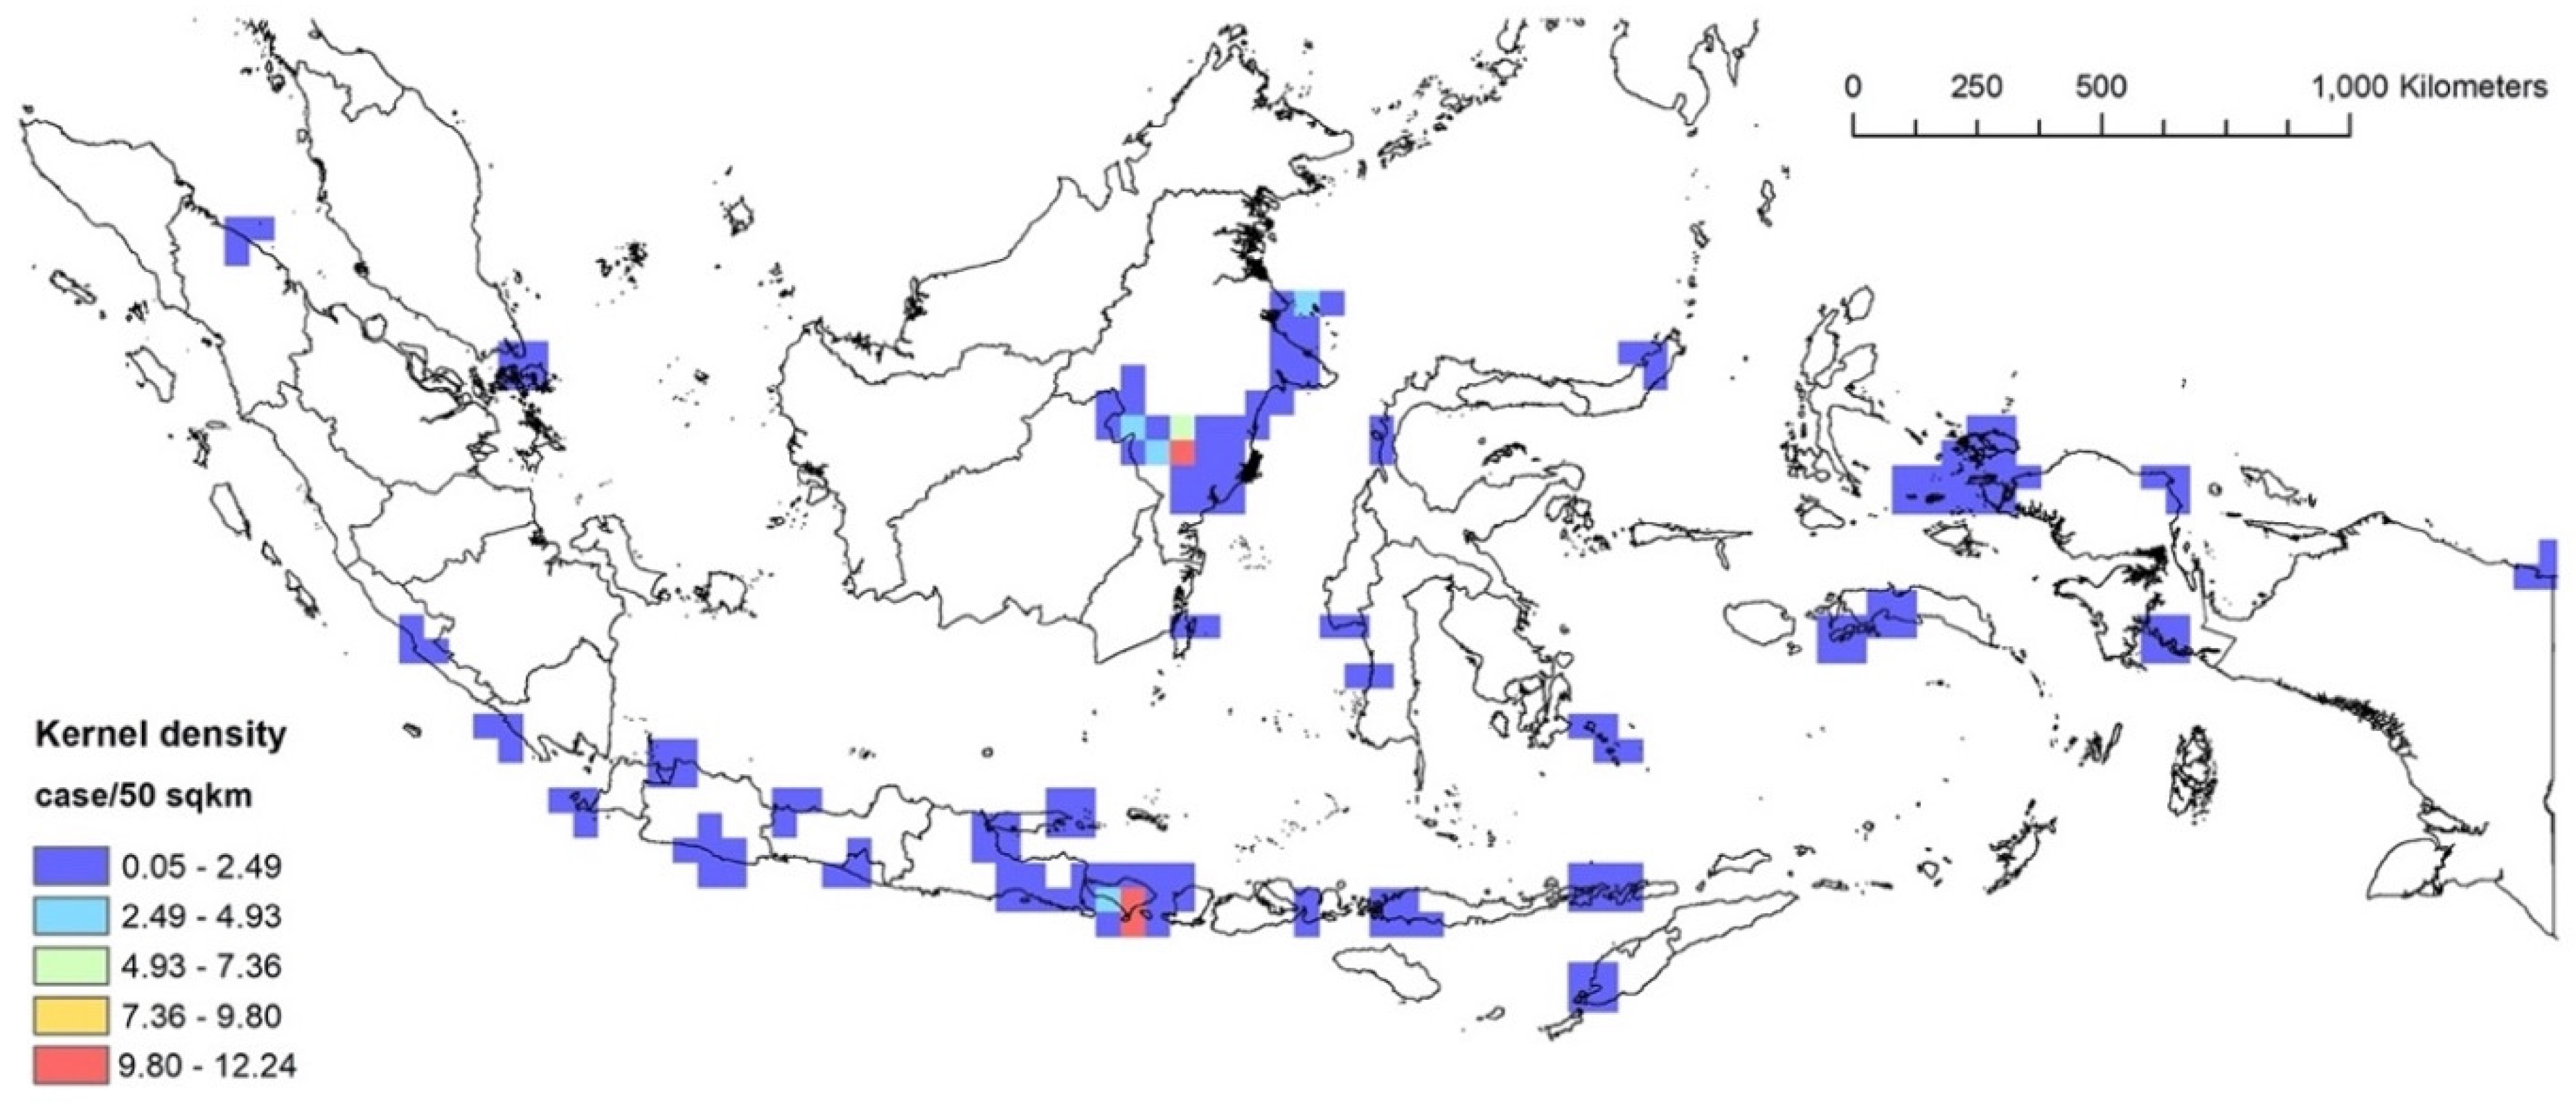
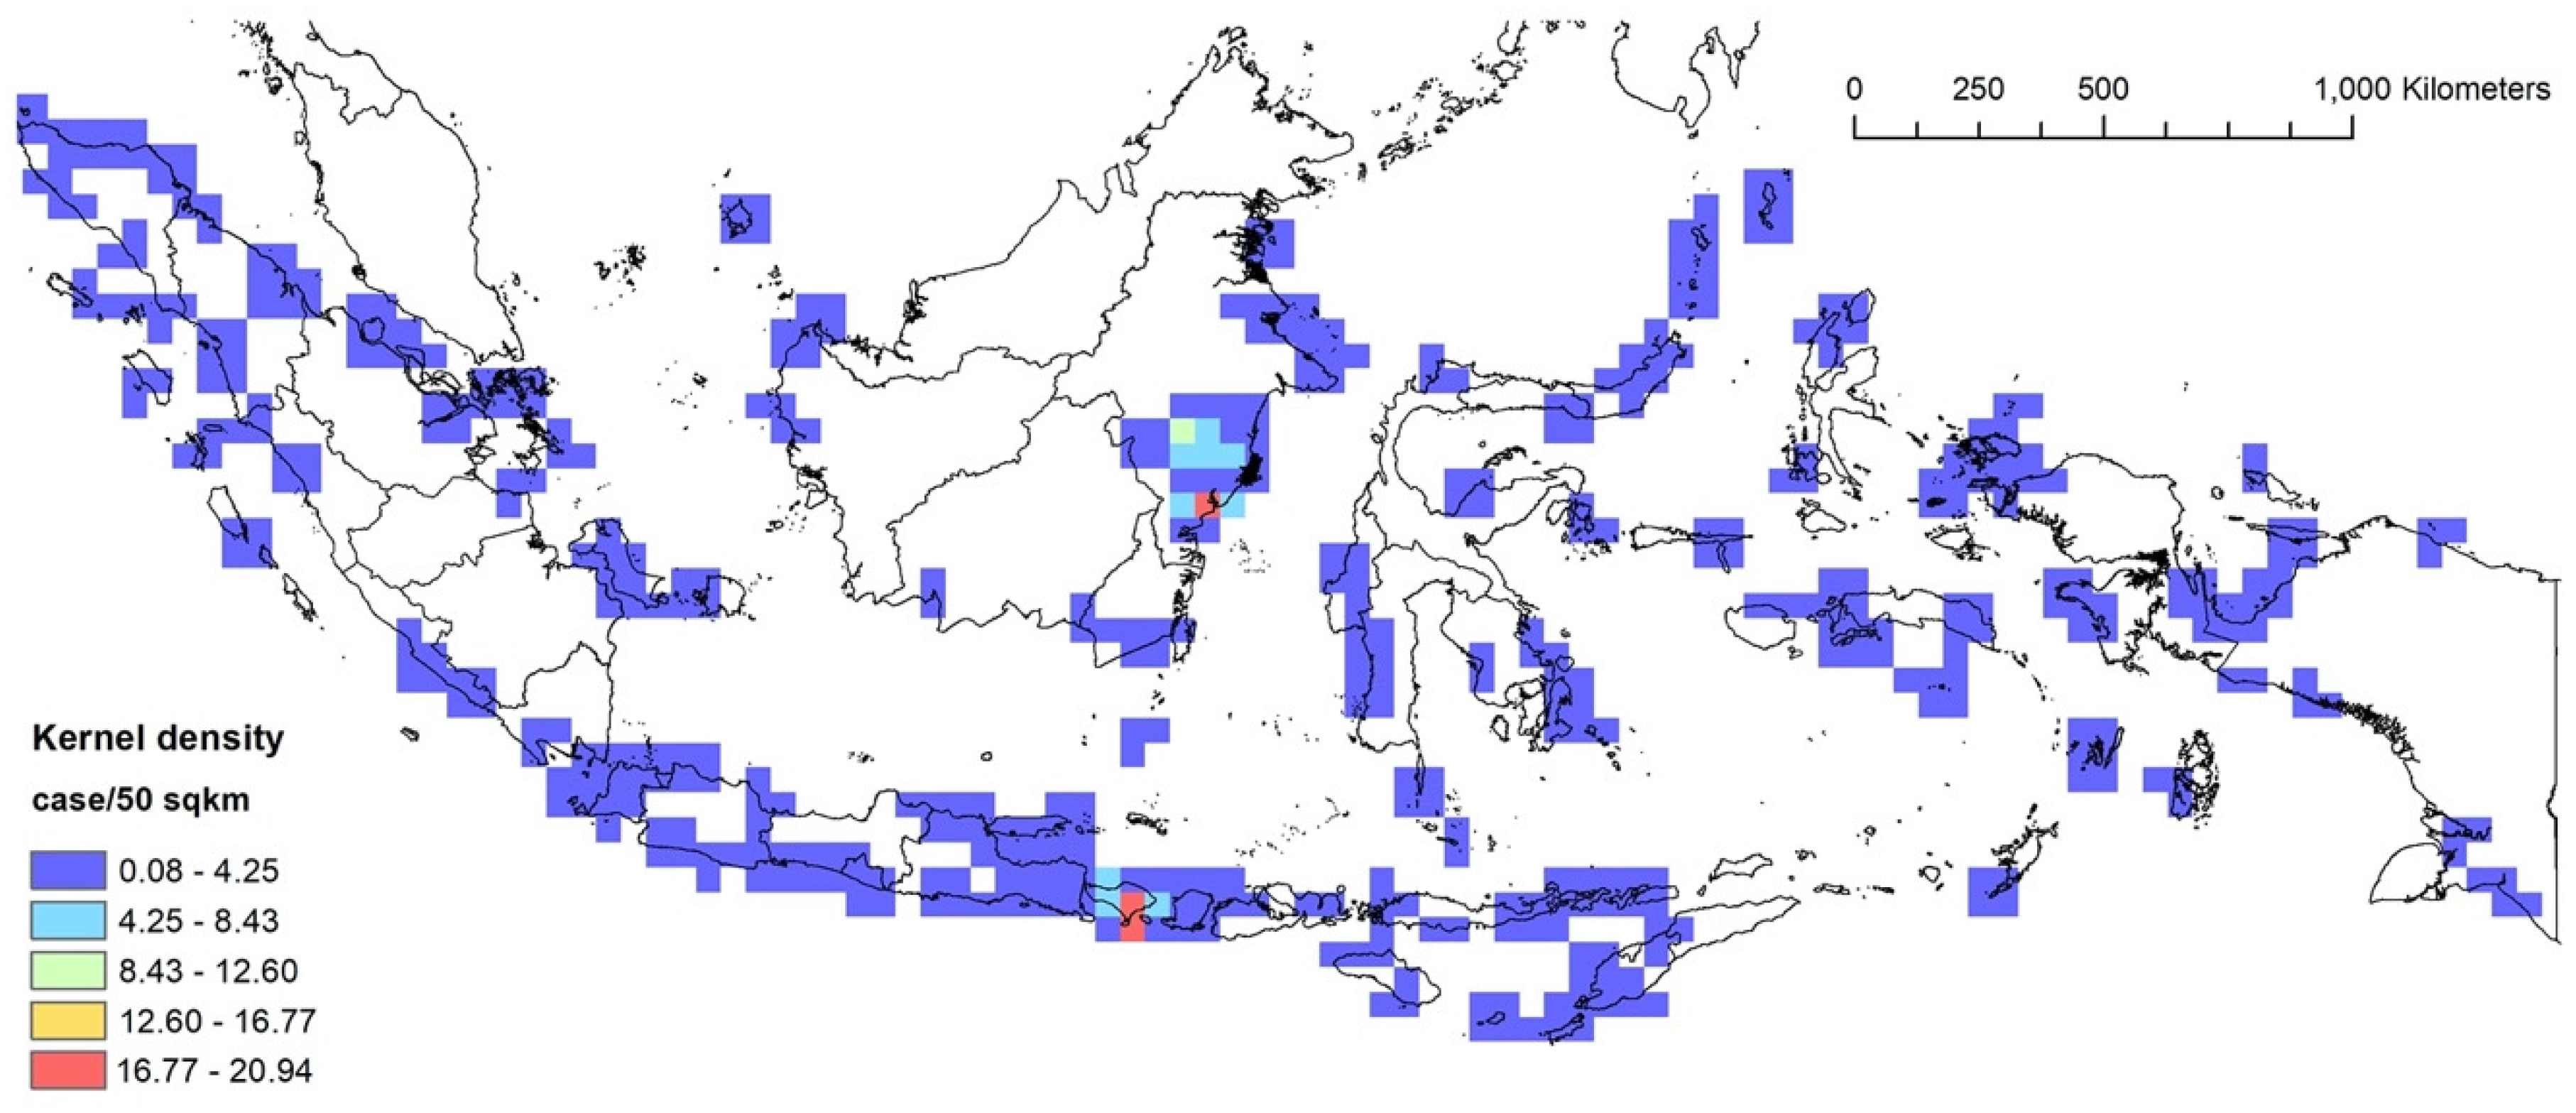
3.2. RQ1: Kernel Density Analysis
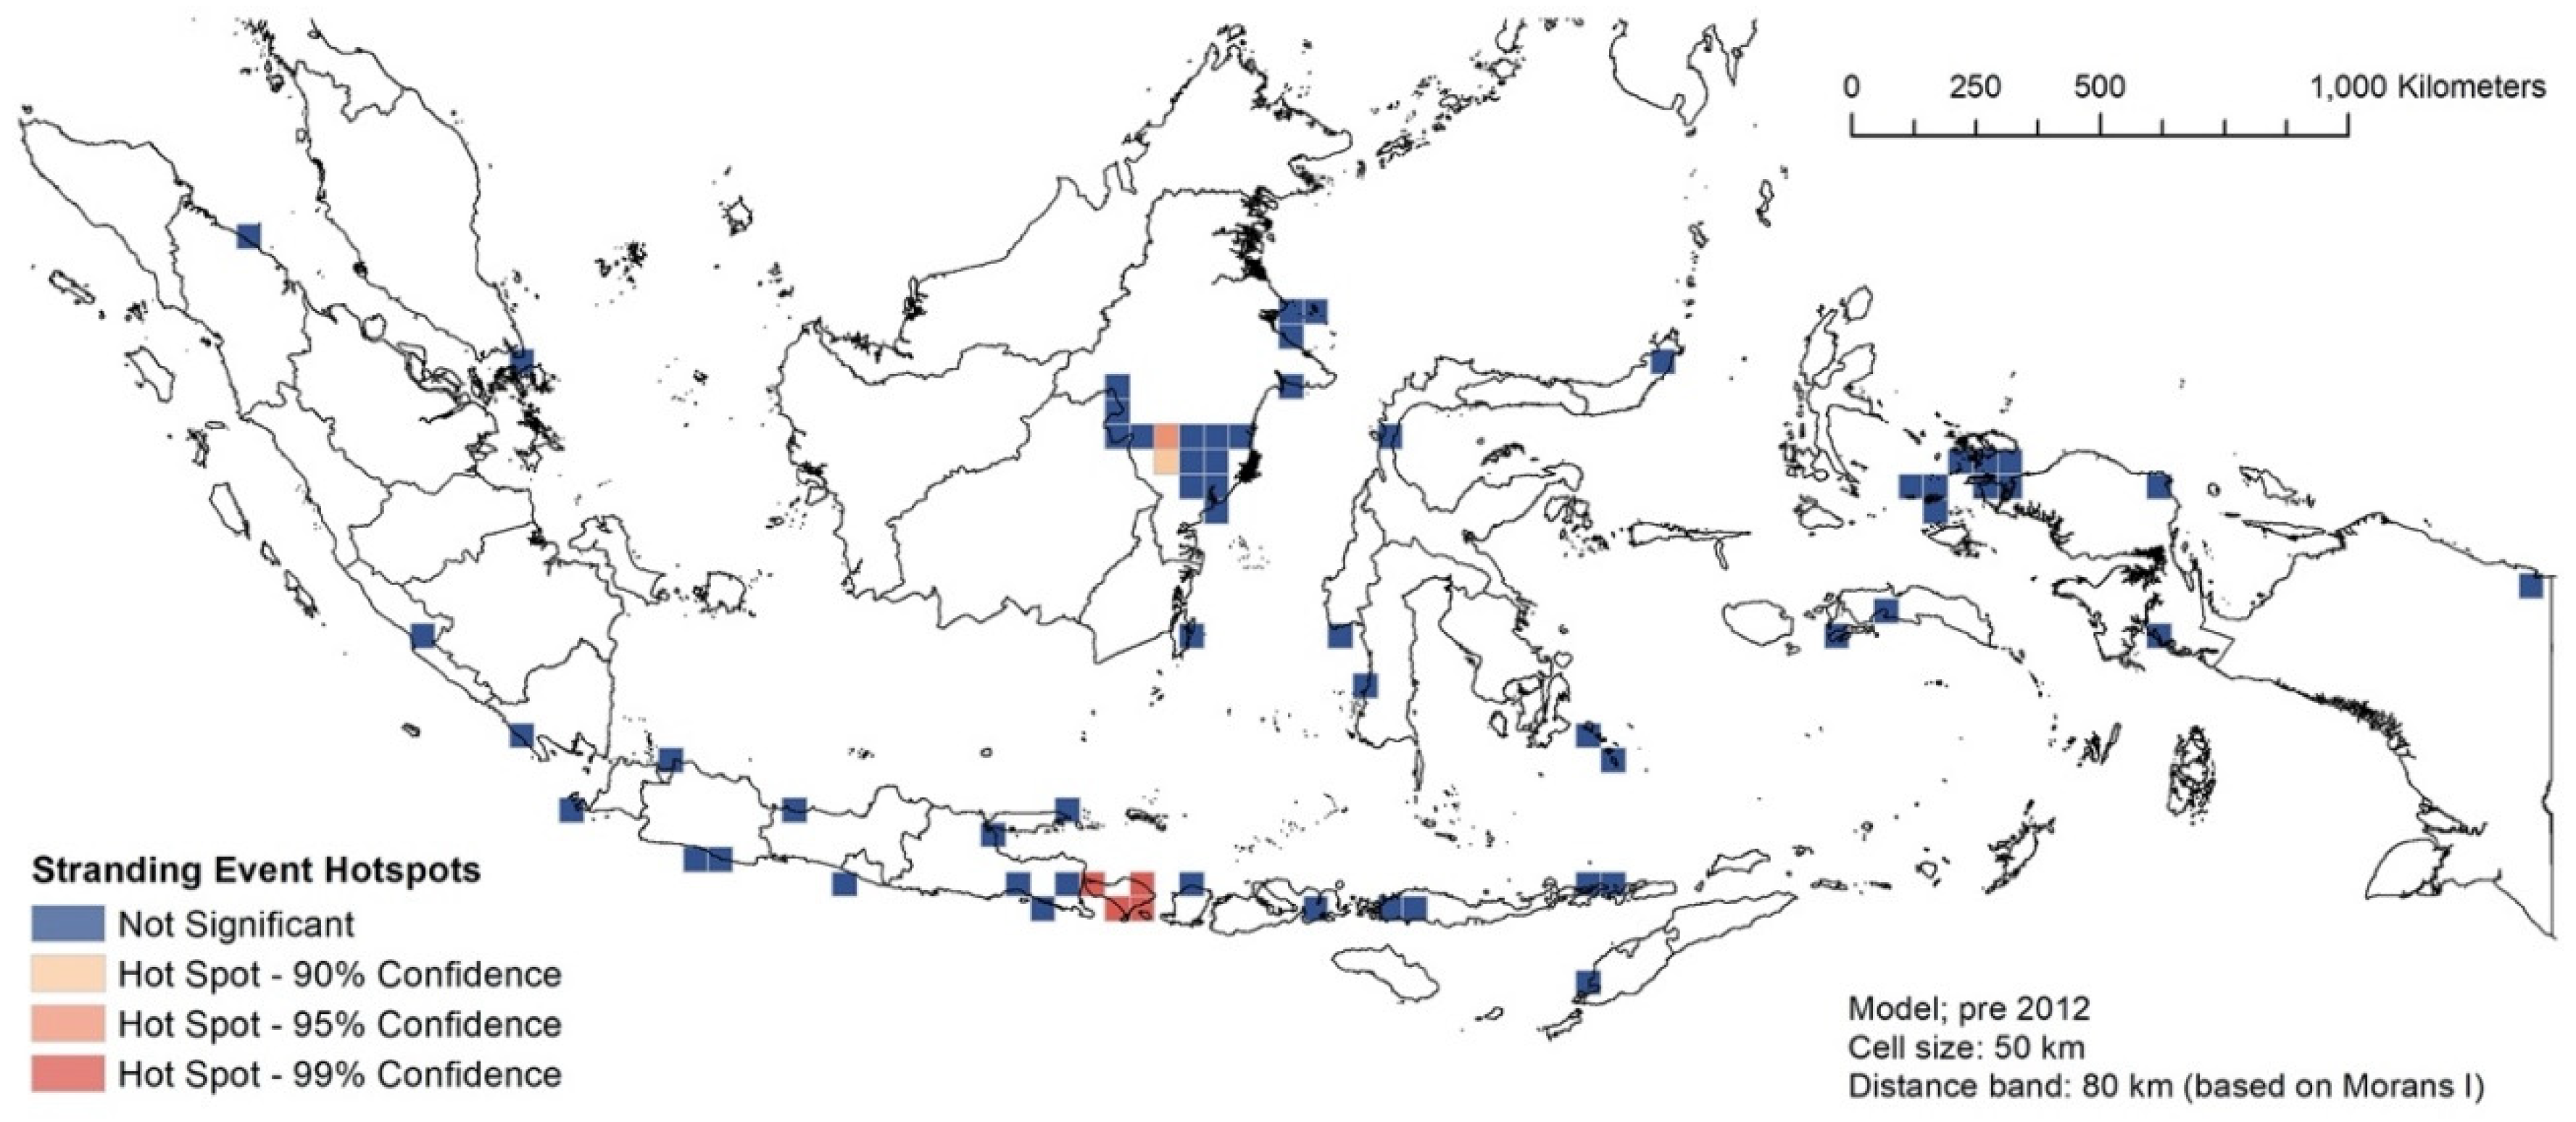
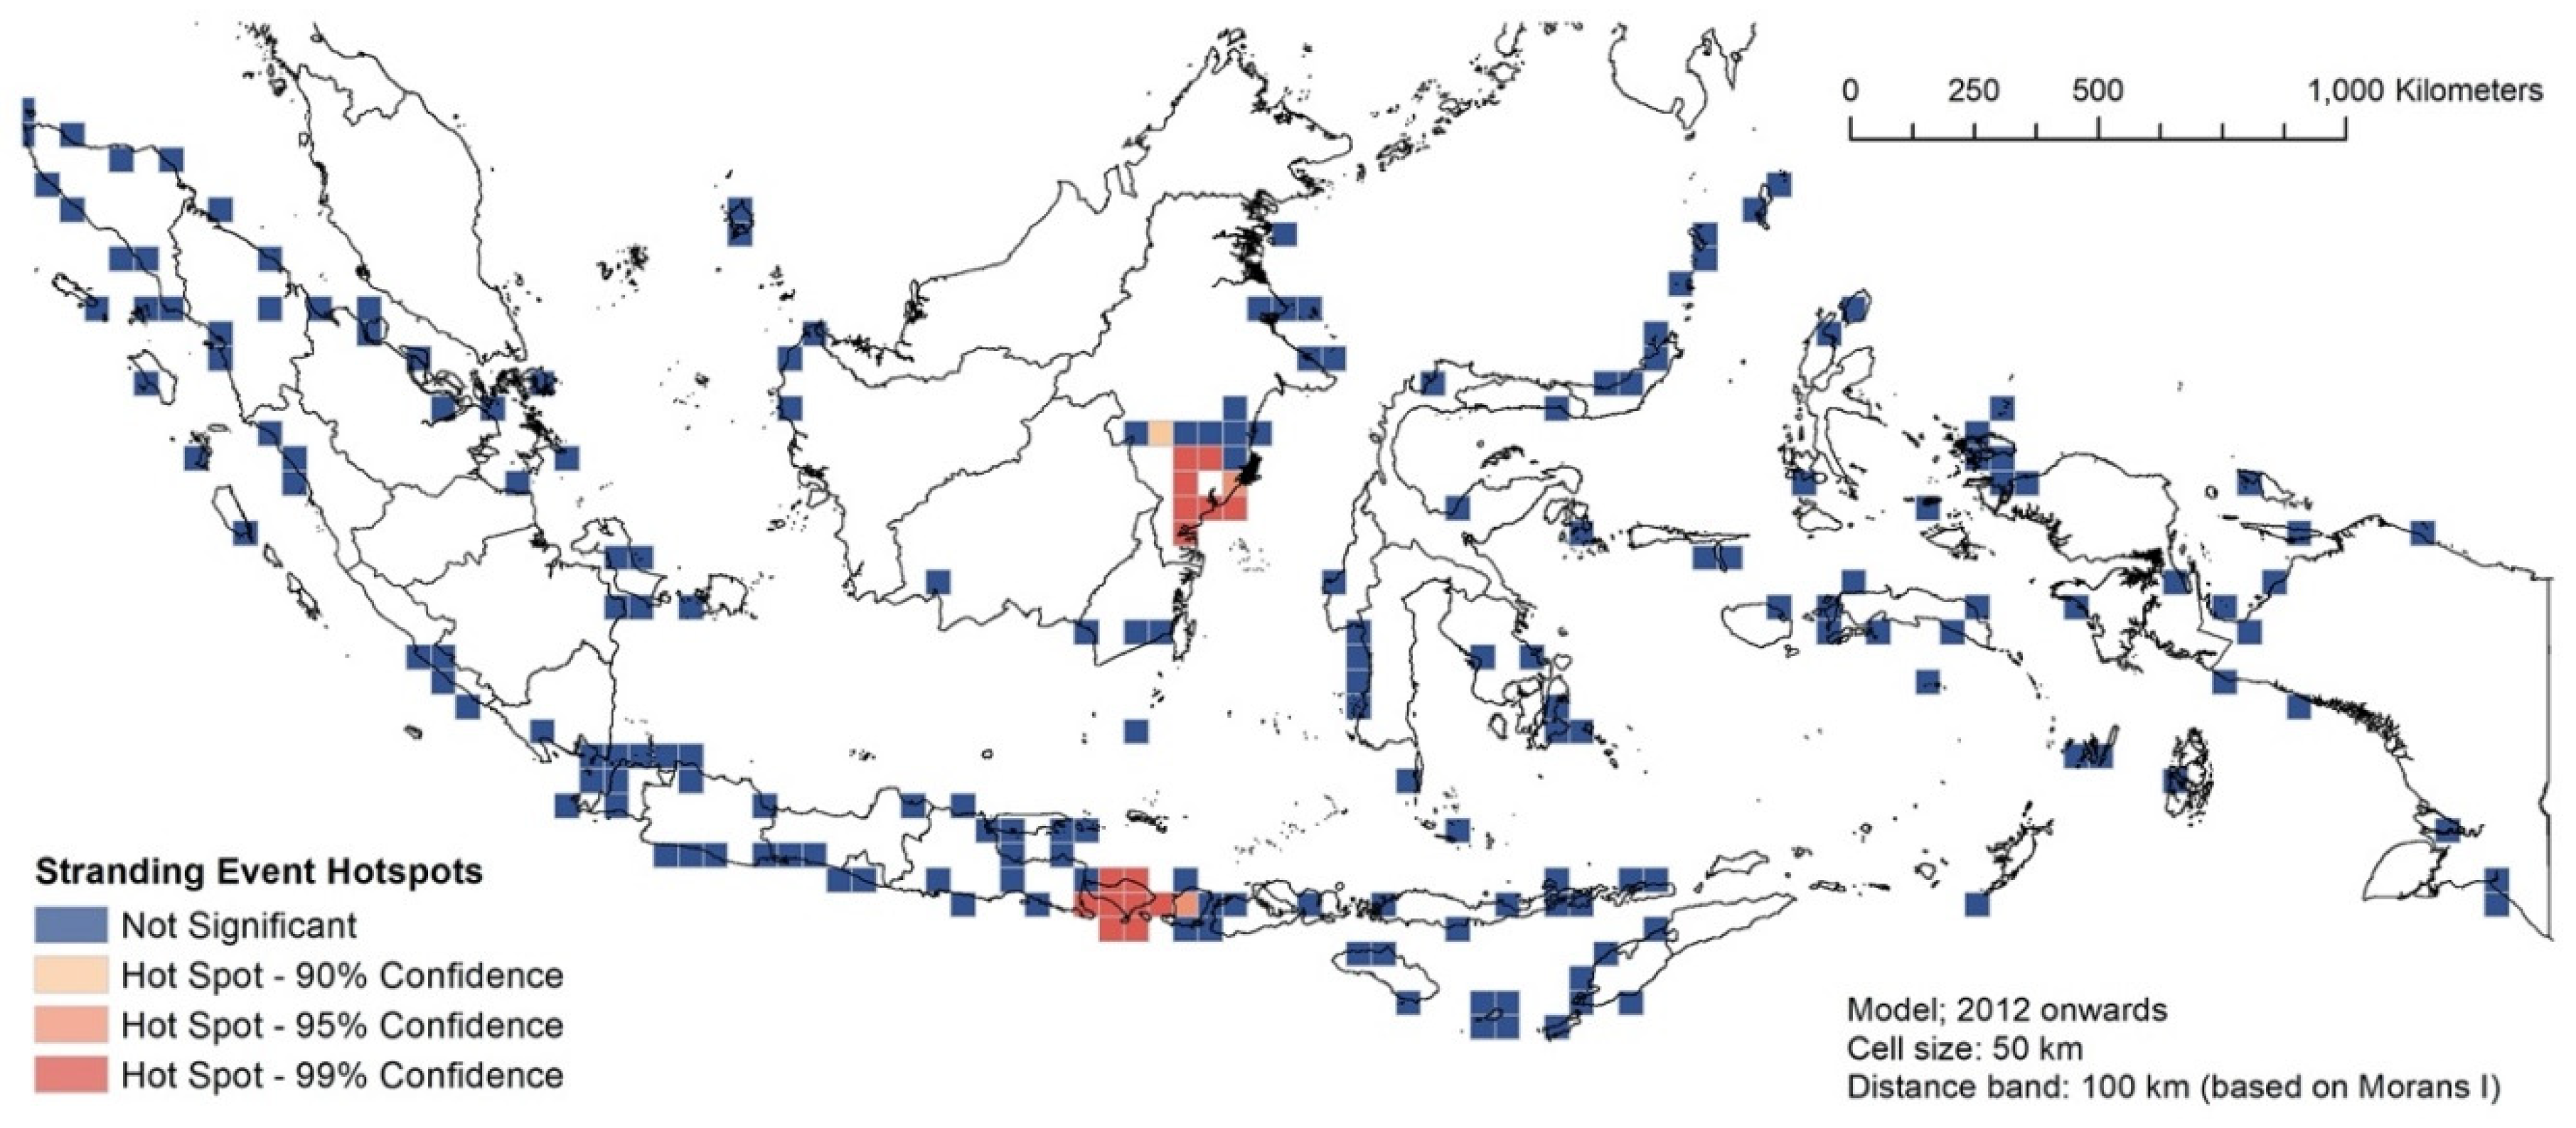
3.3. RQ1: Spatial Hotspot Analysis
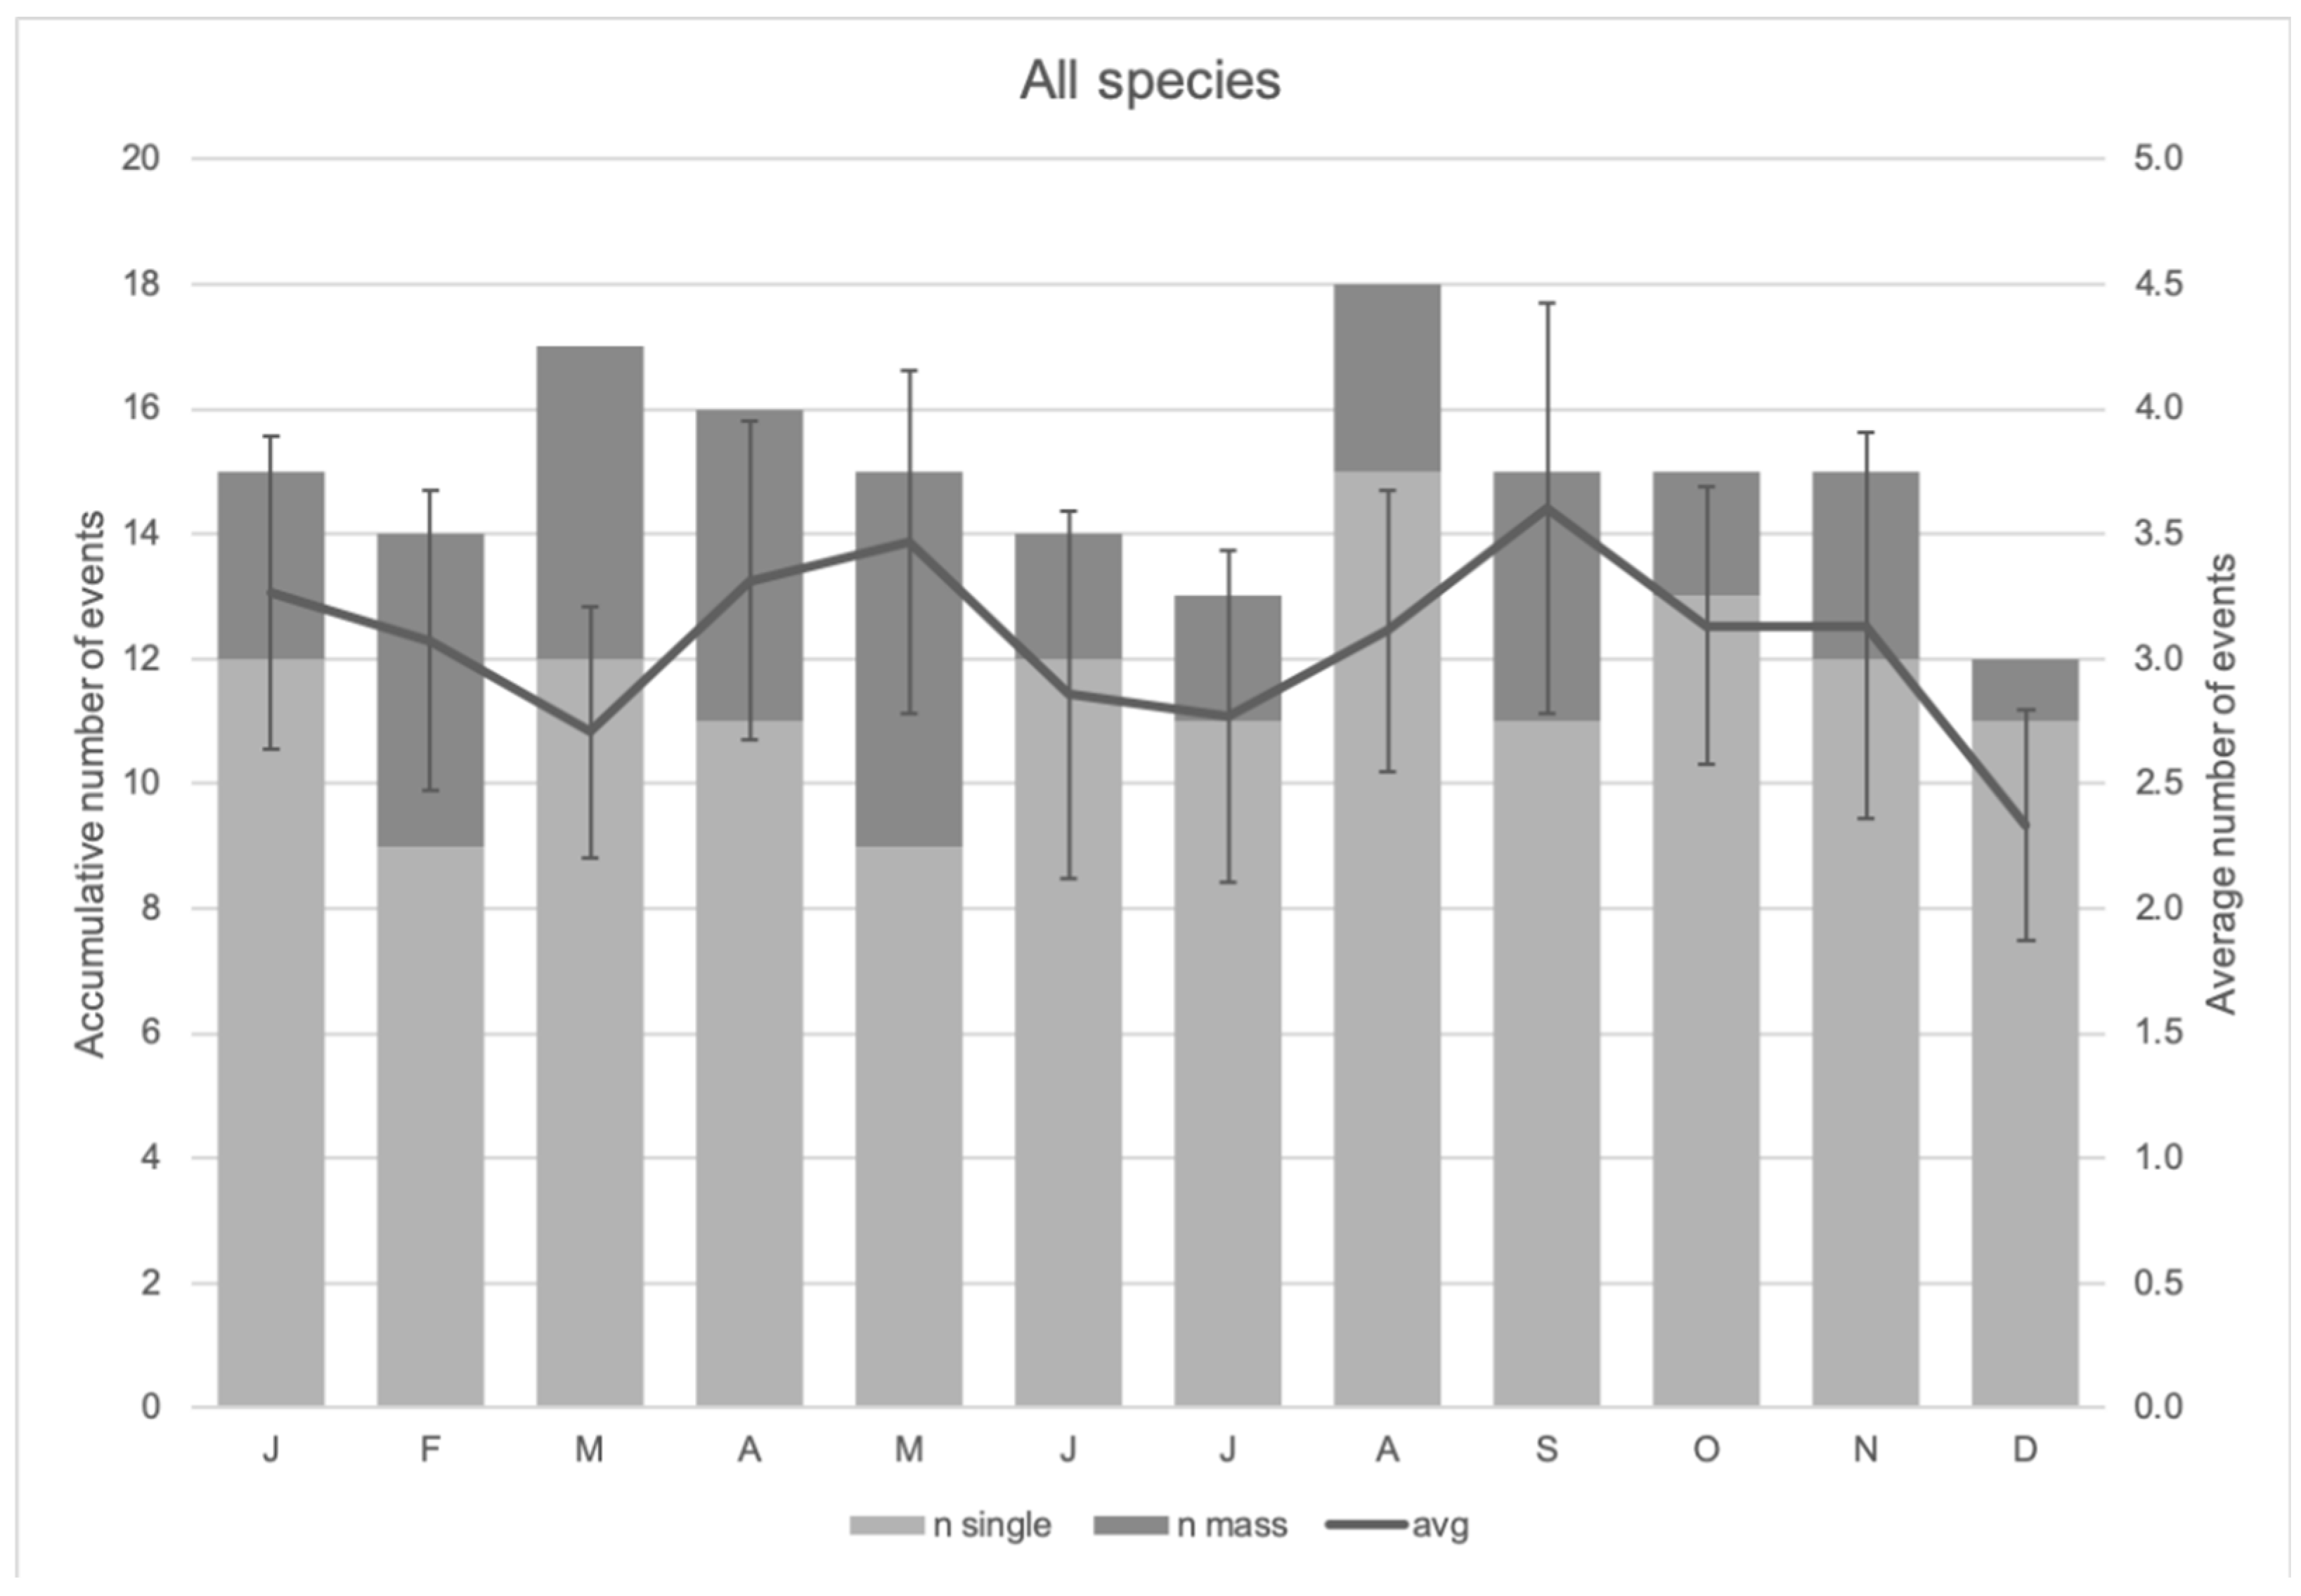
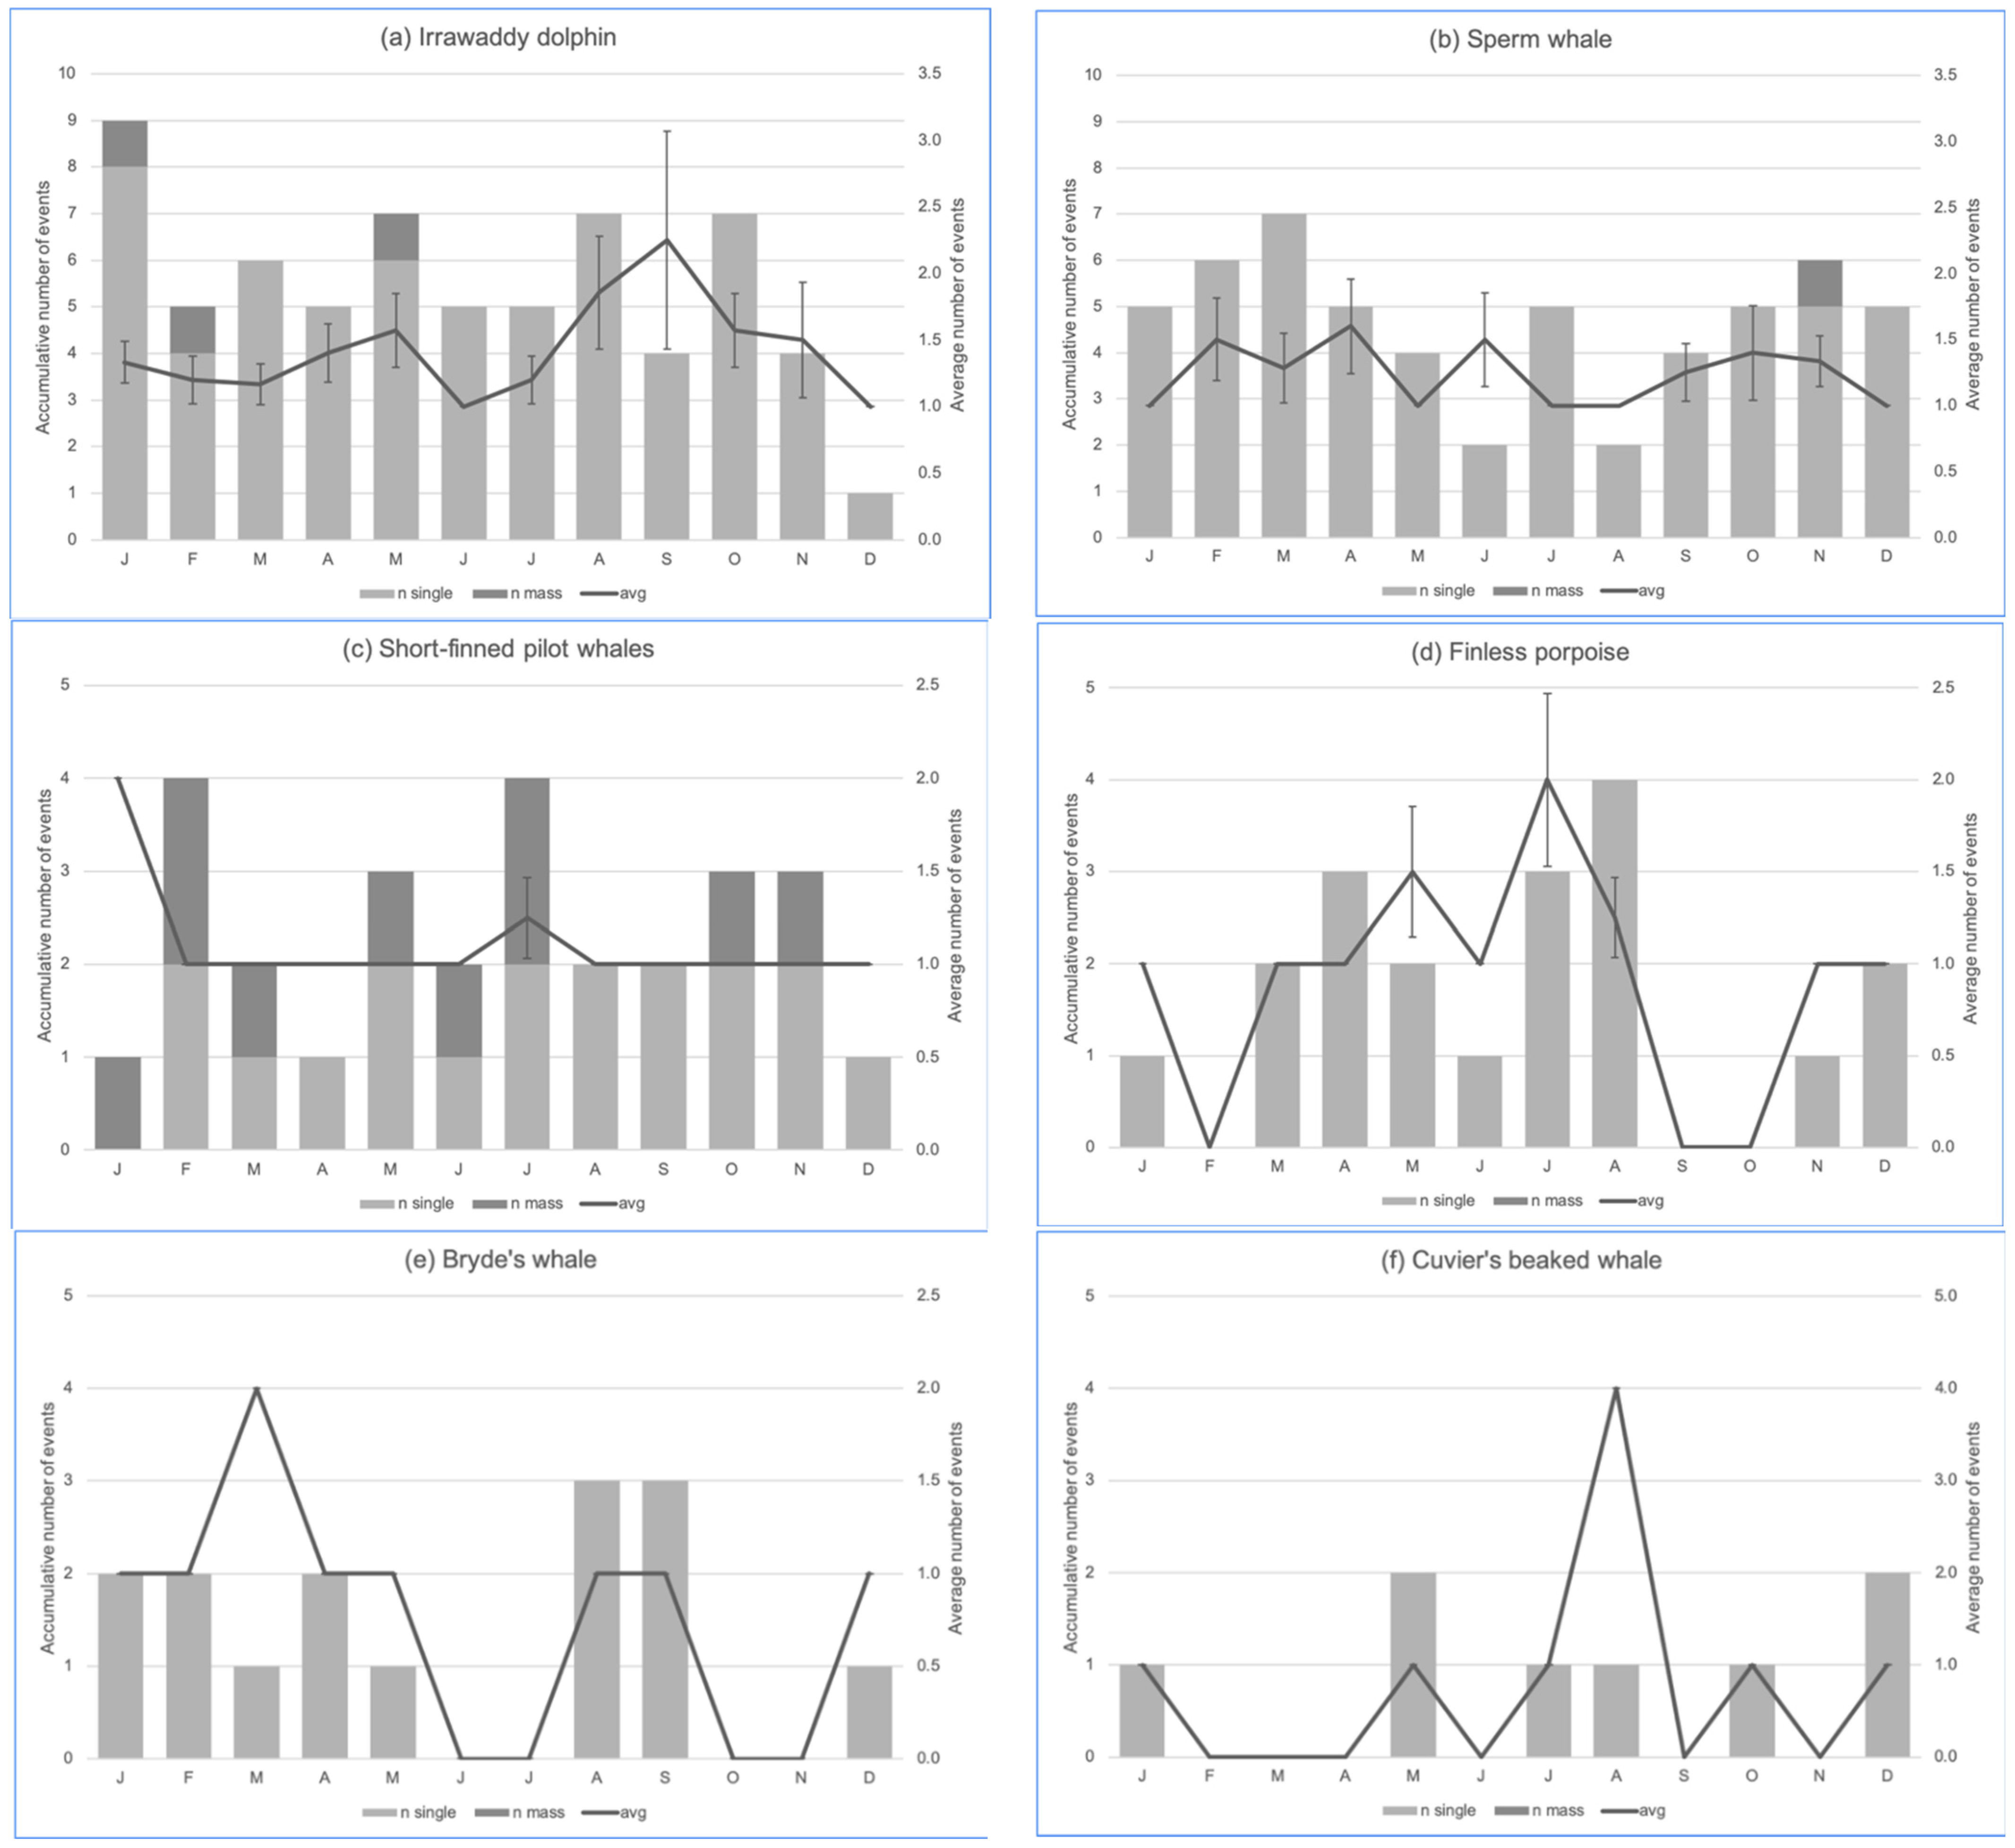
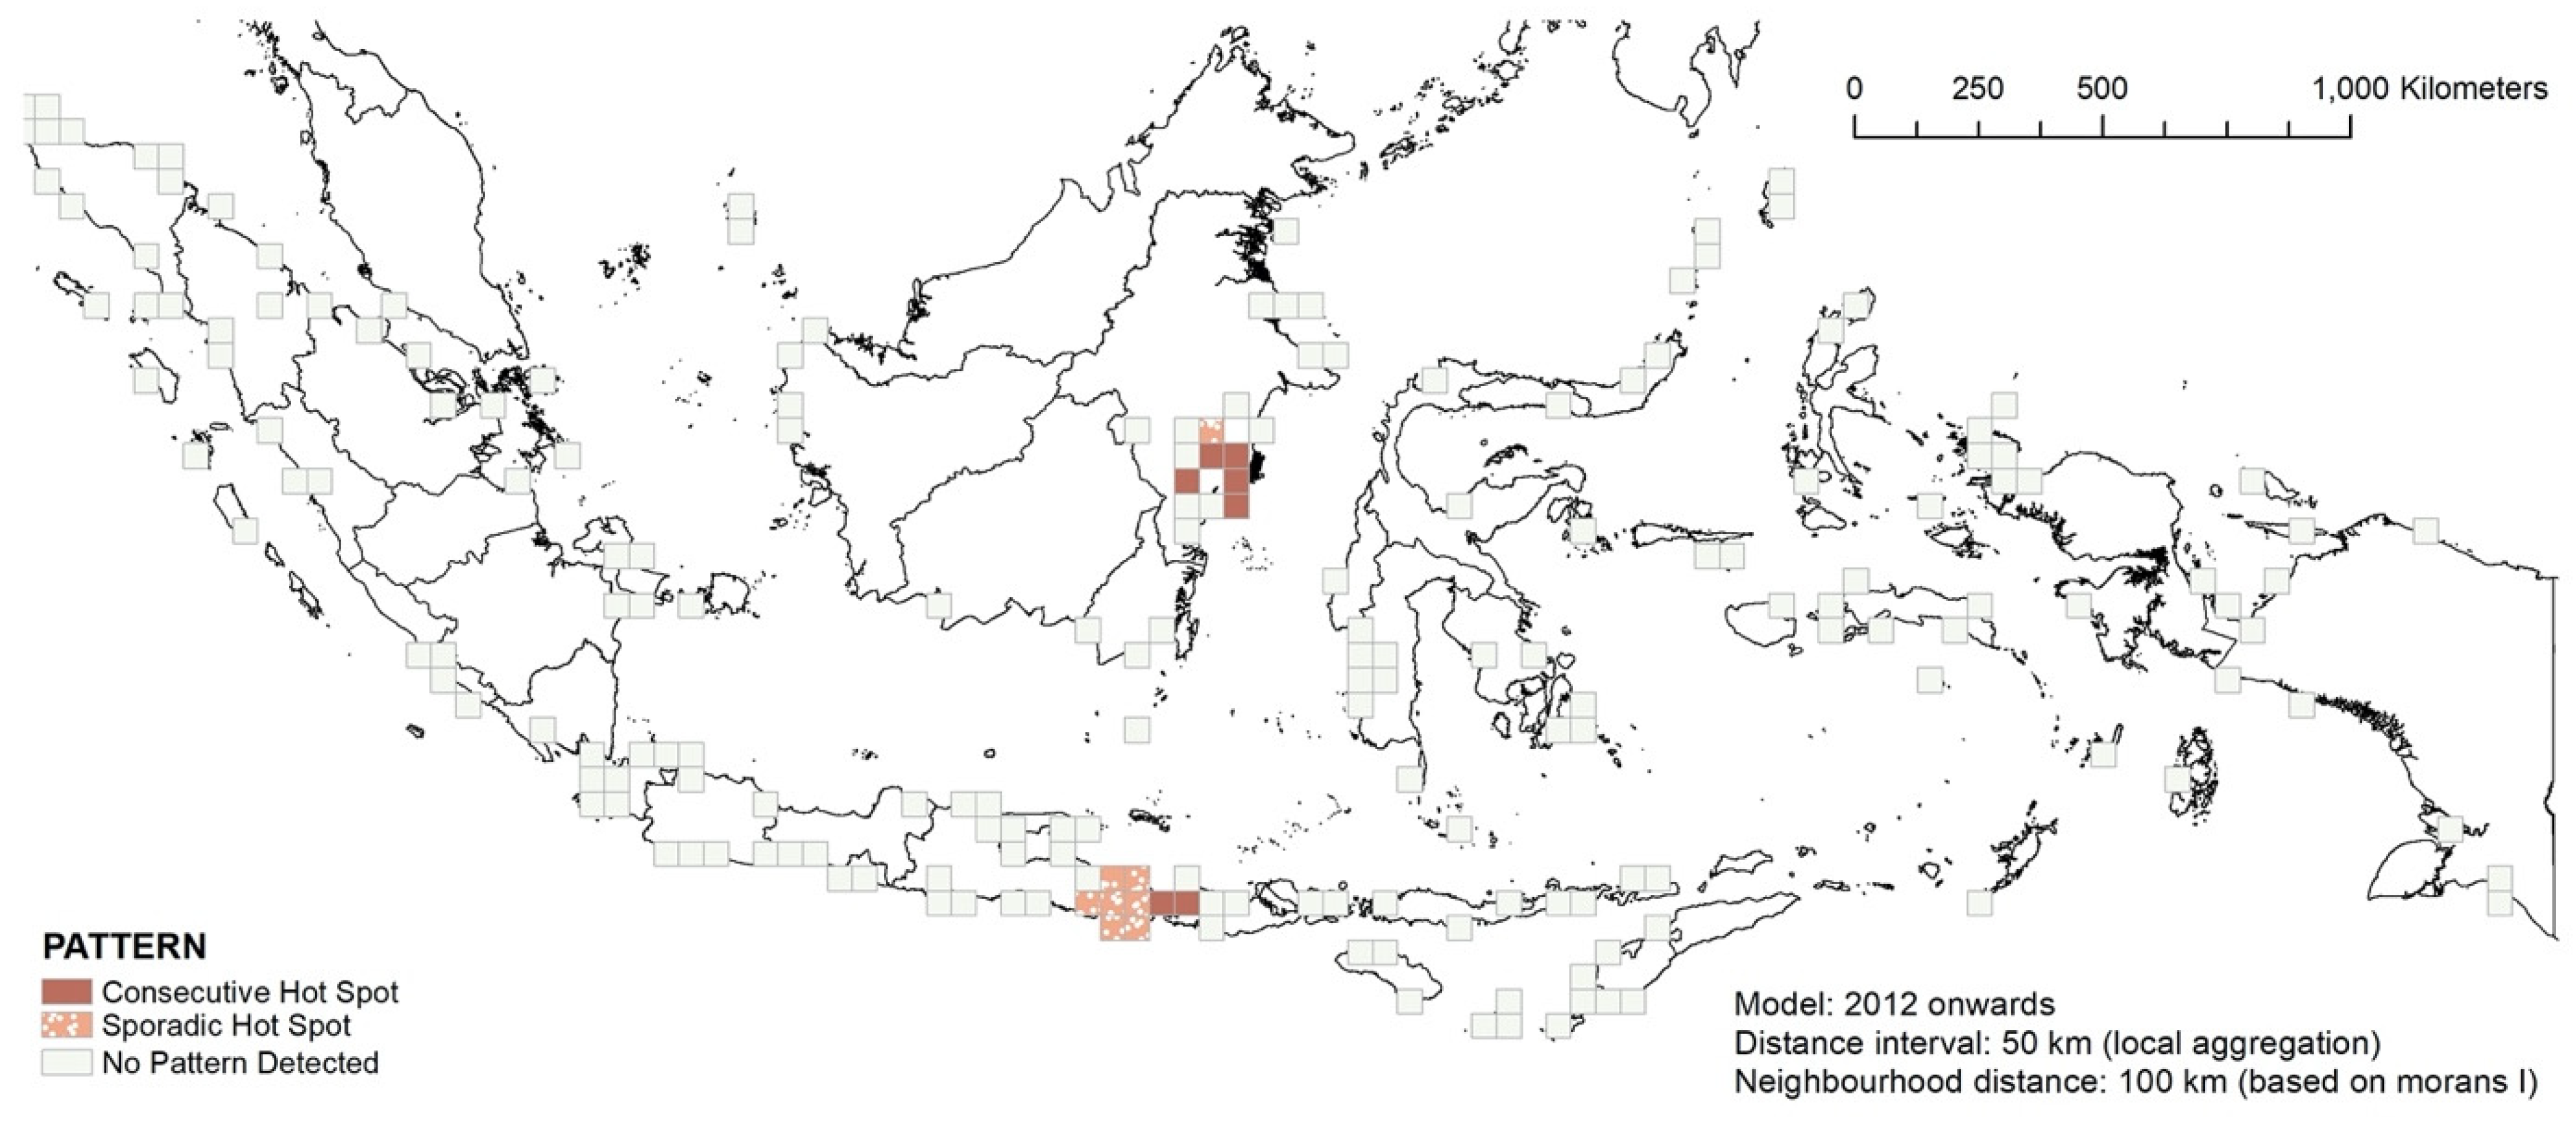
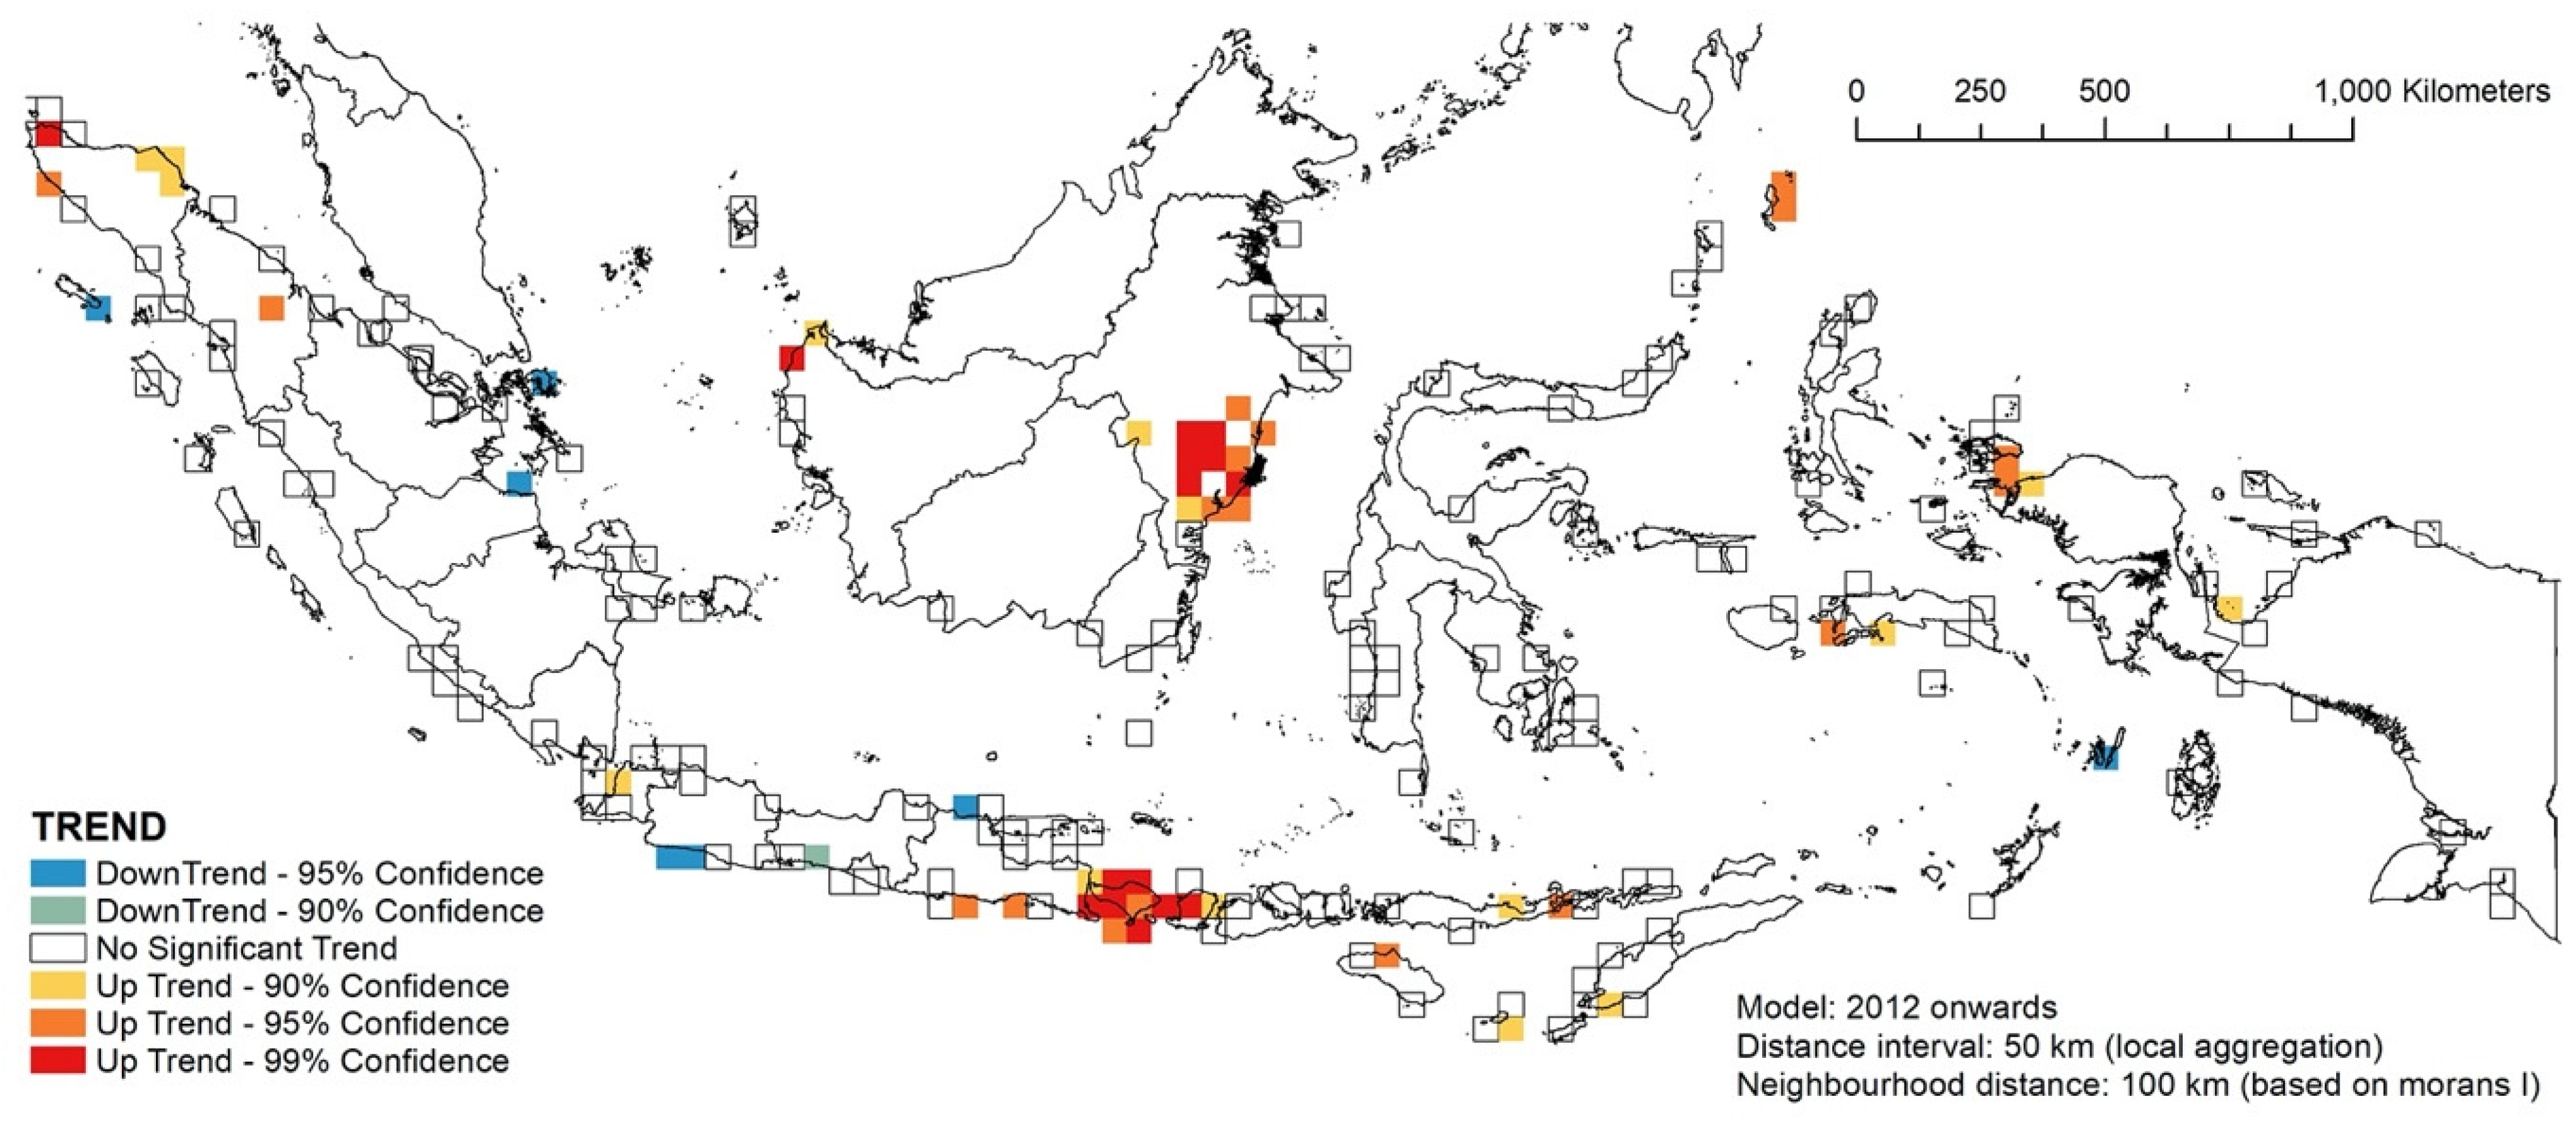
3.4. RQ2: Temporal Hotspot Analysis
3.5. Notes on Methodological Caveats
4. Discussion
4.1. Species-Specific and Location-Specific Findings
4.2. Management Implications
Supplementary Materials
Author Contributions
Funding
Institutional Review Board Statement
Informed Consent Statement
Data Availability Statement
Acknowledgments
Conflicts of Interest
References
- Mustika, P.L.K.; Sadili, D.; Sunuddin, A.; Kreb, D.; Hadi, S.; Ramli, I.; Suprapti, D.; Ratha, J.; Lazuardi, E.; Rasdiana, H.; et al. Rencana Aksi Nasional (RAN) Konservasi Cetacea Indonesia 2016–2020 (the Cetacean National Plan of Action (NPOA) for Indonesia 2016–2020); Ministry of Marine Affairs and Fisheries: Jakarta, Indonesia, 2016; p. 88. [Google Scholar]
- Beasley, I.; Jedensjö, M.; Wijaya, G.M.; Anamiato, J.; Kahn, B.; Kreb, D. Observations on Australian Humpback Dolphins (Sousa sahulensis) in Waters of the Pacific Islands and New Guinea. In Humpback Dolphins (Sousa spp.): Current Status and Conservation, Part 2: Advances in Marine Biology; Elsevier: Amsterdam, The Netherlands, 2016; Volume 73, pp. 219–271. [Google Scholar]
- Rudolph, P.; Smeenk, C.; Leatherwood, S. Preliminary checklist of cetacea in the Indonesian Archipelago and adjacent waters. Zool. Verh. 1997, 312, 3–48. [Google Scholar]
- Slijper, E.J.; Utrecht, W.L.V.; Naaktgeboren, C. Remarks on the Distribution and Migration of Whales, Based on Observations from Netherlands Ships. Bijbragen Tot Djerkunde 1964, 34, 3–93. [Google Scholar] [CrossRef] [Green Version]
- Walker, W.A.; Coe, J.M. Survey of marine debris ingestion by odontocete cetaceans. In Proceedings of the Second International Conference on Marine Debris, Honolulu, HI, USA, 2–7 April 1989; pp. 2–7. [Google Scholar]
- Leeney, R.H.; Amies, R.; Broderick, A.C.; Witt, M.J.; Loveridge, J.; Doyle, J.; Godley, B.J. Spatio-temporal analysis of cetacean strandings and bycatch in a UK fisheries hotspot. Biodivers. Conserv. 2008, 17, 2323–2338. [Google Scholar] [CrossRef]
- Waereebeek, K.V.; Baker, A.; Félix, F.; Gedamke, J.; Iñiguez, M.; Sanino, G.P.; Secchi, E.R.; Sutaria, D.; Helden, A.V.; Wang, Y. Vessel collisions with small cetaceans worldwide and with large whales in the Southern Hemisphere, an initial assessment. Lat. Am. J. Aquat. Mamm. 2007, 6, 43–69. [Google Scholar] [CrossRef] [Green Version]
- Martineau, D.; Lemberger, K.; Dallaire, A.; Labelle, P.; Lipscomb, T.P.; Michel, P.; Mikaelian, I. Cancer in Wildlife, a Case Study: Beluga from the St. Lawrence Estuary, Quebec, Canada. Environ. Health Perspect. 2002, 110, 285–292. [Google Scholar] [CrossRef] [PubMed]
- Jepson, P.D.; ARbelo, M.; Deaville, R.; Patterson, I.A.P.; Castro, P.; Baker, J.R.; Degollada, E.; Ross, H.M.; Herraez, P.; Pocknell, A.M.; et al. Gas-bubble lesions in stranded cetaceans. Nature 2003, 425, 575–576. [Google Scholar] [CrossRef]
- Cox, T.M.; Ragen, T.J.; Read, A.J.; Vos, E.; Baird, R.W.; Balcomb, K.; Barlow, J.; Caldwell, J.; Cranford, T.; Crum, L.; et al. Understanding the impact of anthropogenic sound on beaked whales. J. Cetacean Resour. Manag. 2006, 7, 177–187. [Google Scholar]
- Tyack, P.L.; Zimmer, W.M.; Moretti, D.; Southall, B.L.; Claridge, D.E.; Durban, J.W.; Clark, C.W.; D′Amico, A.; DiMarzio, N.; Jarvis, S. Beaked whales respond to simulated and actual navy sonar. PLoS ONE 2011, 6, e17009. [Google Scholar] [CrossRef] [Green Version]
- Forney, K.A.; Southall, B.L.; Slooten, E.; Dawson, S.; Read, A.J.; Baird, R.W.; Brownell, R.L., Jr. Nowhere to go: Noise impact assessments for marine mammal populations with high site fidelity. Endanger. Species Res. 2017, 32, 391–413. [Google Scholar] [CrossRef] [Green Version]
- Vanselow, K.H.; Ricklefs, K. Are solar activity and sperm whale Physeter macrocephalus strandings around the North Sea related? J. Sea Res. 2005, 53, 319–327. [Google Scholar] [CrossRef]
- Vanselow, K.H.; Ricklefs, K.; Colijn, F. Solar Driven Geomagnetic Anomalies and Sperm Whales (Physeter macrocephalus) Strandings around the North Sea: An Analysis of Long Term Datasets. Open Mar. Biol. J. 2009, 3, 89–94. [Google Scholar] [CrossRef]
- Vanselow, K.H.; Jacobsen, S.; Hall, C.; Garthe, S. Solar storms may trigger sperm whale strandings: Explanation approaches for multiple strandings in the North Sea in 2016. Int. J. Astrobiol. 2018, 17, 336–344. [Google Scholar] [CrossRef]
- Fossi, M.C.; Baini, M.; Simmonds, M.P. Cetaceans as ocean health indicators of marine litter impact at global scale. Front. Environ. Sci. 2020, 8, 255. [Google Scholar] [CrossRef]
- Gulland, F.; Hall, A.J. Is marine mammal health deteriorating? Trends in the global reporting of marine mammal disease. EcoHealth 2007, 4, 135–150. [Google Scholar] [CrossRef]
- Obusan, M.C.M.; Aragones, L.V.; Salibay, C.C.; Siringan, M.A.T.; Rivera, W.L. Occurrence of human pathogenic bacteria and Toxoplasma gondii in cetaceans stranded in the Philippines: Providing clues on ocean health status. Aquat. Mamm. 2015, 41, 149. [Google Scholar] [CrossRef]
- Mustika, P.L.; High, K.K.; Ratha, I.M.J.; Siko, M.M.; Acebes, J.M.; Makin, R.M.; Meo, M.S.; d’Alxandro, E.; Didok, P.R.E. First Record of Predation on an Oilfish (Ruvettus pretiosus) and a Previously Unknown Cephalopod Prey (Thysanoteuthis rhombus) by a Short-finned Pilot Whale (Globicephala macrorhynchus) in East Nusa Tenggara, Indonesia. Aquat. Mamm. 2022; in press. [Google Scholar]
- Mustika, P.L.K.; Hutasoit, P.; Madusari, C.C.; Purnomo, F.S.; Setiawan, A.; Tjandra, K.; Prabowo, W.E. Whale strandings in Indonesia, including the first record of a humpback whale (Megaptera novaeangliae) in the Archipelago. Raffles Bull. Zool. 2009, 57, 199–206. [Google Scholar]
- Badan Informasi Geospasial. Atlas Geospasial Indonesia: Fisik dan Lingkungan Alam; Badan Informasi Geospasial (BIG): Jakarta, Indonesia, 2020. [Google Scholar]
- Nag, O.S. Countries with the Longest Coastline. Available online: https://www.worldatlas.com/articles/countries-with-the-most-coastline.html (accessed on 2 May 2022).
- Ningsih, N.S.; Rakhmaputeri, N.; Harto, A.B. Upwelling variability along the southern coast of Bali and in Nusa Tenggara waters. Ocean. Sci. J. 2013, 48, 49–57. [Google Scholar] [CrossRef]
- Geraci, J.R.; Lounsbury, V.J. Marine Mammals Ashore: A Field Fuide for Strandings; Texas A&M University Sea Grant College Program: College Station, TX, USA, 1993. [Google Scholar]
- Betty, E.L.; Bollard, B.; Murphy, S.; Ogle, M.; Hendriks, H.; Orams, M.B.; Stockin, K.A. Using emerging hot spot analysis of stranding records to inform conservation management of a data-poor cetacean species. Biodivers. Conserv. 2020, 29, 643–665. [Google Scholar] [CrossRef]
- Worton, B.J. Kernel Methods for Estimating the Utilization Distribution in Home-Range Studies. Ecology 1989, 70, 164. [Google Scholar] [CrossRef]
- Augé, A.A.; Otley, H.; Rendell, N.; Frans, V.F. Spatial distribution of cetacean strandings in the Falkland Islands to define monitoring opportunities. J. Cetacean Res. Manag. 2018, 19, 1–7. [Google Scholar]
- Getis, A.; Ord, J. The Analysis of Spatial Association by Use of Distance Statistics. Geogr. Anal. 1992, 24, 189–206. [Google Scholar] [CrossRef]
- Myers, N.; Mittermeier, R.A.; Mittermeier, C.G.; Da Fonseca, G.A.; Kent, J. Biodiversity hotspots for conservation priorities. Nature 2000, 403, 853–858. [Google Scholar] [CrossRef] [PubMed]
- Cheng, Z.; Zu, Z.; Lu, J. Traffic crash evolution characteristic analysis and spatiotemporal hotspot identification of urban road intersections. Sustainability 2018, 11, 160. [Google Scholar] [CrossRef] [Green Version]
- Dudhat, S.; Pande, A.; Nair, A.; Mondal, I.; Srinivasan, M.; Sivakumar, K. Spatio-temporal analysis identifies marine mammal stranding hotspots along the Indian coastline. Sci. Rep. 2022, 12, 4128. [Google Scholar] [CrossRef]
- Harris, N.L.; Goldman, E.; Gabris, C.; Nordling, J.; Minnemeyer, S.; Ansari, S.; Lippmann, M.; Bennett, L.; Raad, M.; Hansen, M. Using spatial statistics to identify emerging hot spots of forest loss. Environ. Res. Lett. 2017, 12, 024012. [Google Scholar] [CrossRef] [Green Version]
- Purwanto, P.; Utaya, S.; Handoyo, B.; Bachri, S.; Astuti, I.S.; Utomo, K.S.B.; Aldianto, Y.E. Spatiotemporal analysis of COVID-19 spread with emerging hotspot analysis and space–time cube models in East Java, Indonesia. ISPRS Int. J. Geo-Inf. 2021, 10, 133. [Google Scholar] [CrossRef]
- Bass, C.A. Emerging hotspot analysis of Florida manatee (Trichechus manatus latirostris) mortality (1974–2012). Master’s Thesis, Nova Southeastern University, Davies, FL, USA, October 2017. [Google Scholar]
- Olson, J.K.; Aschoff, J.; Goble, A.; Larson, S.; Gaydos, J.K. Maximizing surveillance through spatial characterization of marine mammal stranding hot spots. Mar. Mammal Sci. 2020, 36, 1083–1096. [Google Scholar] [CrossRef]
- Falcone, E.A.; Schorr, G.S.; Watwood, S.L.; DeRuiter, S.L.; Zerbini, A.N.; Andrews, R.D.; Morrissey, R.P.; Moretti, D.J. Diving behaviour of Cuvier′s beaked whales exposed to two types of military sonar. R. Soc. Open Sci. 2017, 4, 170629. [Google Scholar] [CrossRef] [Green Version]
- Caldas de Castro, M.; Singer, B.H. Controlling the false discovery rate: A new application to account for multiple and dependent tests in local statistics of spatial association. Geogr. Anal. 2006, 38, 180–208. [Google Scholar] [CrossRef]
- Bernaldo de Quirós, Y.; Fernandez, A.; Baird, R.; Brownell, R., Jr.; Aguilar de Soto, N.; Allen, D.; Arbelo, M.; Arregui, M.; Costidis, A.; Fahlman, A. Advances in research on the impacts of anti-submarine sonar on beaked whales. Proc. R. Soc. B 2019, 286, 20182533. [Google Scholar] [CrossRef] [PubMed] [Green Version]
- Kreb, D.; Reeves, R.R.; Thomas, P.O.; Braulik, G.T.; Smith, B.D. Establishing Protected Areas for Asian Freshwater Cetaceans: Final Workshop Report for a Workshop Titled “Freshwater Cetaceans as Flagship Species for Integrated River Conservation Management” (Samarinda, Indonesia, 19–24 October 2009); Conservation Foundation for Rare Aquatic Species of Indonesia: Samarinda, Indonesia, 2010; p. 47. [Google Scholar]
- Schorr, G.S.; Falcone, E.A.; Moretti, D.J.; Andrews, R.D. First long-term behavioral records from Cuvier’s beaked whales (Ziphius cavirostris) reveal record-breaking dives. PLoS ONE 2014, 9, e92633. [Google Scholar] [CrossRef] [PubMed] [Green Version]
- Shearer, J.M.; Quick, N.J.; Cioffi, W.R.; Baird, R.W.; Webster, D.L.; Foley, H.J.; Swaim, Z.T.; Waples, D.M.; Bell, J.T.; Read, A.J. Diving behaviour of Cuvier’s beaked whales (Ziphius cavirostris) off Cape Hatteras, North Carolina. R. Soc. Open Sci. 2019, 6, 181728. [Google Scholar] [CrossRef] [PubMed] [Green Version]
- Costa, A.F.; Siciliano, S.; Emin-Lima, R.; Martins, B.M.L.; Sousa, M.E.M.; Giarrizzo, T.; Silva Júnior, J.d.S.e. Stranding survey as a framework to investigate rare cetacean records of the north and north-eastern Brazilian coasts. ZooKeys 2017, 688, 111–134. [Google Scholar] [CrossRef] [Green Version]
- Möller, L.M.; Attard, C.R.; Bilgmann, K.; Andrews-Goff, V.; Jonsen, I.; Paton, D.; Double, M.C. Movements and behaviour of blue whales satellite tagged in an Australian upwelling system. Sci. Rep. 2020, 10, 21165. [Google Scholar] [CrossRef]
- Sahri, A.; Jak, C.; Putra, M.I.H.; Murk, A.J.; Andrews-Goff, V.; Double, M.C.; Van Lammeren, R.J. Telemetry-based home range and habitat modelling reveals that the majority of areas important for pygmy blue whales are currently unprotected. Biol. Conserv. 2022, 272, 109594. [Google Scholar] [CrossRef]
- Mustika, P.L.K.; Birtles, A.; Everingham, Y.; Marsh, H. Evaluating the potential disturbance from dolphin watching in Lovina, north Bali, Indonesia. Mar. Mammal Sci. 2015, 31, 808–817. [Google Scholar] [CrossRef]
- Gómez-Hernández, G.; Leyva-Aguilera, J.C.; Delhumeau-Rivera, S.; Seingier, G.; Elorriaga-Verplancken, F.R.; Heckel, G. Marine mammal stranding response in Mexico: Lessons learned. Aquat. Conserv. Mar. Freshw. Ecosyst. 2021, 31, 841–852. [Google Scholar] [CrossRef]
- Alvarado-Rybak, M.; Toro, F.; Escobar-Dodero, J.; Kinsley, A.C.; Sepúlveda, M.A.; Capella, J.; Azat, C.; Cortés-Hinojosa, G.; Zimin-Veselkoff, N.; Mardones, F.O. 50 years of cetacean strandings reveal a concerning rise in Chilean Patagonia. Sci. Rep. 2020, 10, 9511. [Google Scholar] [CrossRef]
- Díaz-Delgado, J.; Fernández, A.; Sierra, E.; Sacchini, S.; Andrada, M.; Vela, A.I.; Quesada-Canales, Ó.; Paz, Y.; Zucca, D.; Groch, K. Pathologic findings and causes of death of stranded cetaceans in the Canary Islands (2006–2012). PLoS ONE 2018, 13, e0204444. [Google Scholar]
- Arbelo, M.; de Los Monteros, A.E.; Herráez, P.; Andrada, M.; Sierra, E.; Rodríguez, F.; Jepson, P.D.; Fernández, A. Pathology and causes of death of stranded cetaceans in the Canary Islands (1999−2005). Dis. Aquat. Org. 2013, 103, 87–99. [Google Scholar] [CrossRef] [PubMed]


Publisher’s Note: MDPI stays neutral with regard to jurisdictional claims in published maps and institutional affiliations. |
© 2022 by the authors. Licensee MDPI, Basel, Switzerland. This article is an open access article distributed under the terms and conditions of the Creative Commons Attribution (CC BY) license (https://creativecommons.org/licenses/by/4.0/).
Share and Cite
Mustika, P.L.K.; High, K.K.; Putra, M.I.H.; Sahri, A.; Ratha, I.M.J.; Prinanda, M.O.; Agung, F.; Purnomo, F.S.; Kreb, D. When and Where Did They Strand? The Spatio-Temporal Hotspot Patterns of Cetacean Stranding Events in Indonesia. Oceans 2022, 3, 509-526. https://doi.org/10.3390/oceans3040034
Mustika PLK, High KK, Putra MIH, Sahri A, Ratha IMJ, Prinanda MO, Agung F, Purnomo FS, Kreb D. When and Where Did They Strand? The Spatio-Temporal Hotspot Patterns of Cetacean Stranding Events in Indonesia. Oceans. 2022; 3(4):509-526. https://doi.org/10.3390/oceans3040034
Chicago/Turabian StyleMustika, Putu Liza Kusuma, Kathryn K. High, Mochamad Iqbal Herwata Putra, Achmad Sahri, I Made Jaya Ratha, Muhammad Offal Prinanda, Firdaus Agung, Februanty S. Purnomo, and Danielle Kreb. 2022. "When and Where Did They Strand? The Spatio-Temporal Hotspot Patterns of Cetacean Stranding Events in Indonesia" Oceans 3, no. 4: 509-526. https://doi.org/10.3390/oceans3040034