

Radiological and Periodontal Evaluation of Stock and Custom CAD/CAM Implant Abutments—A One-Year Follow-Up Study


Abstract
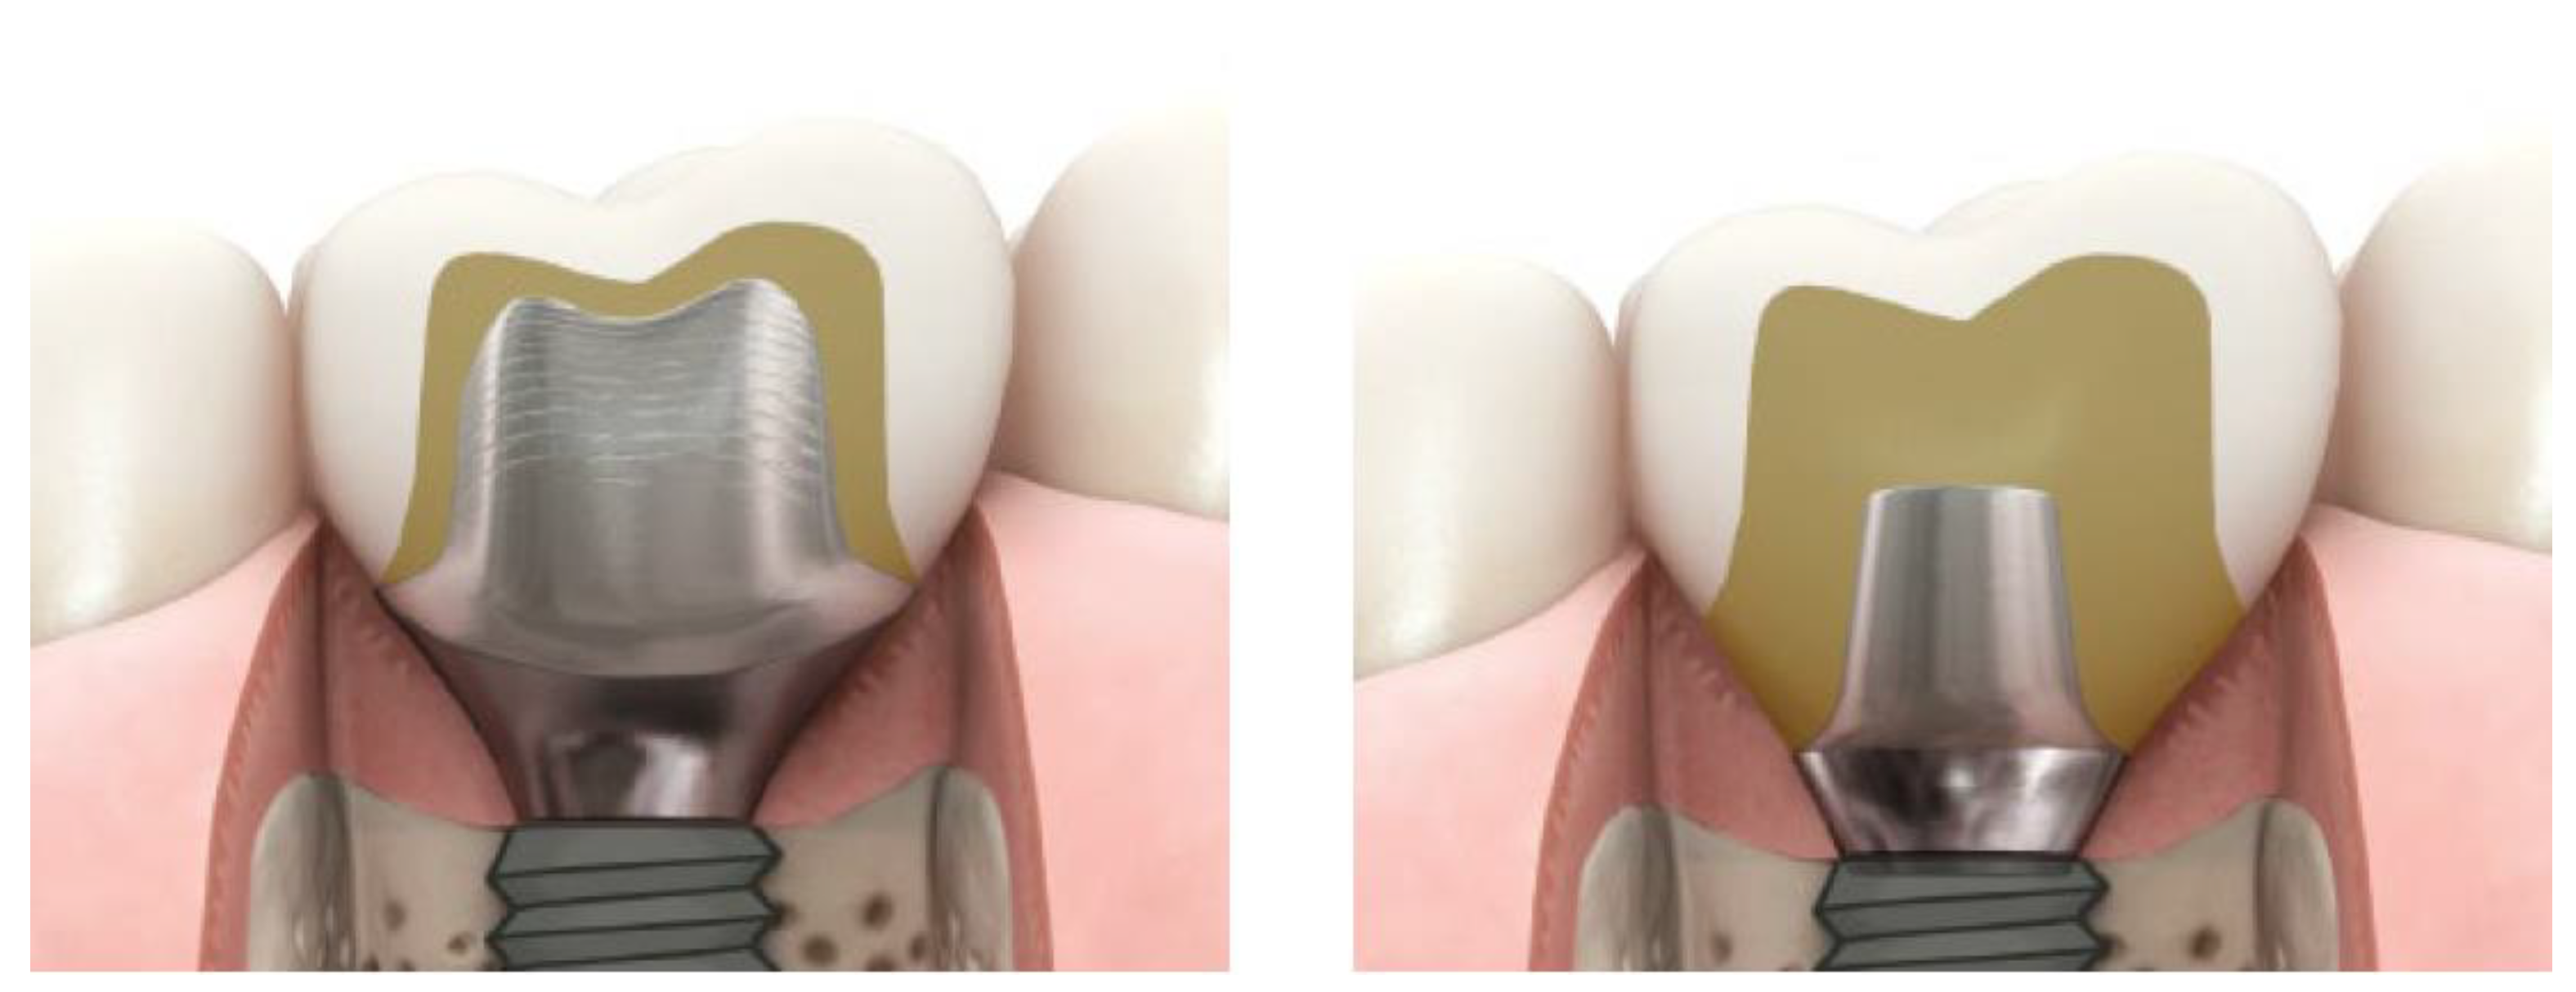
:1. Introduction
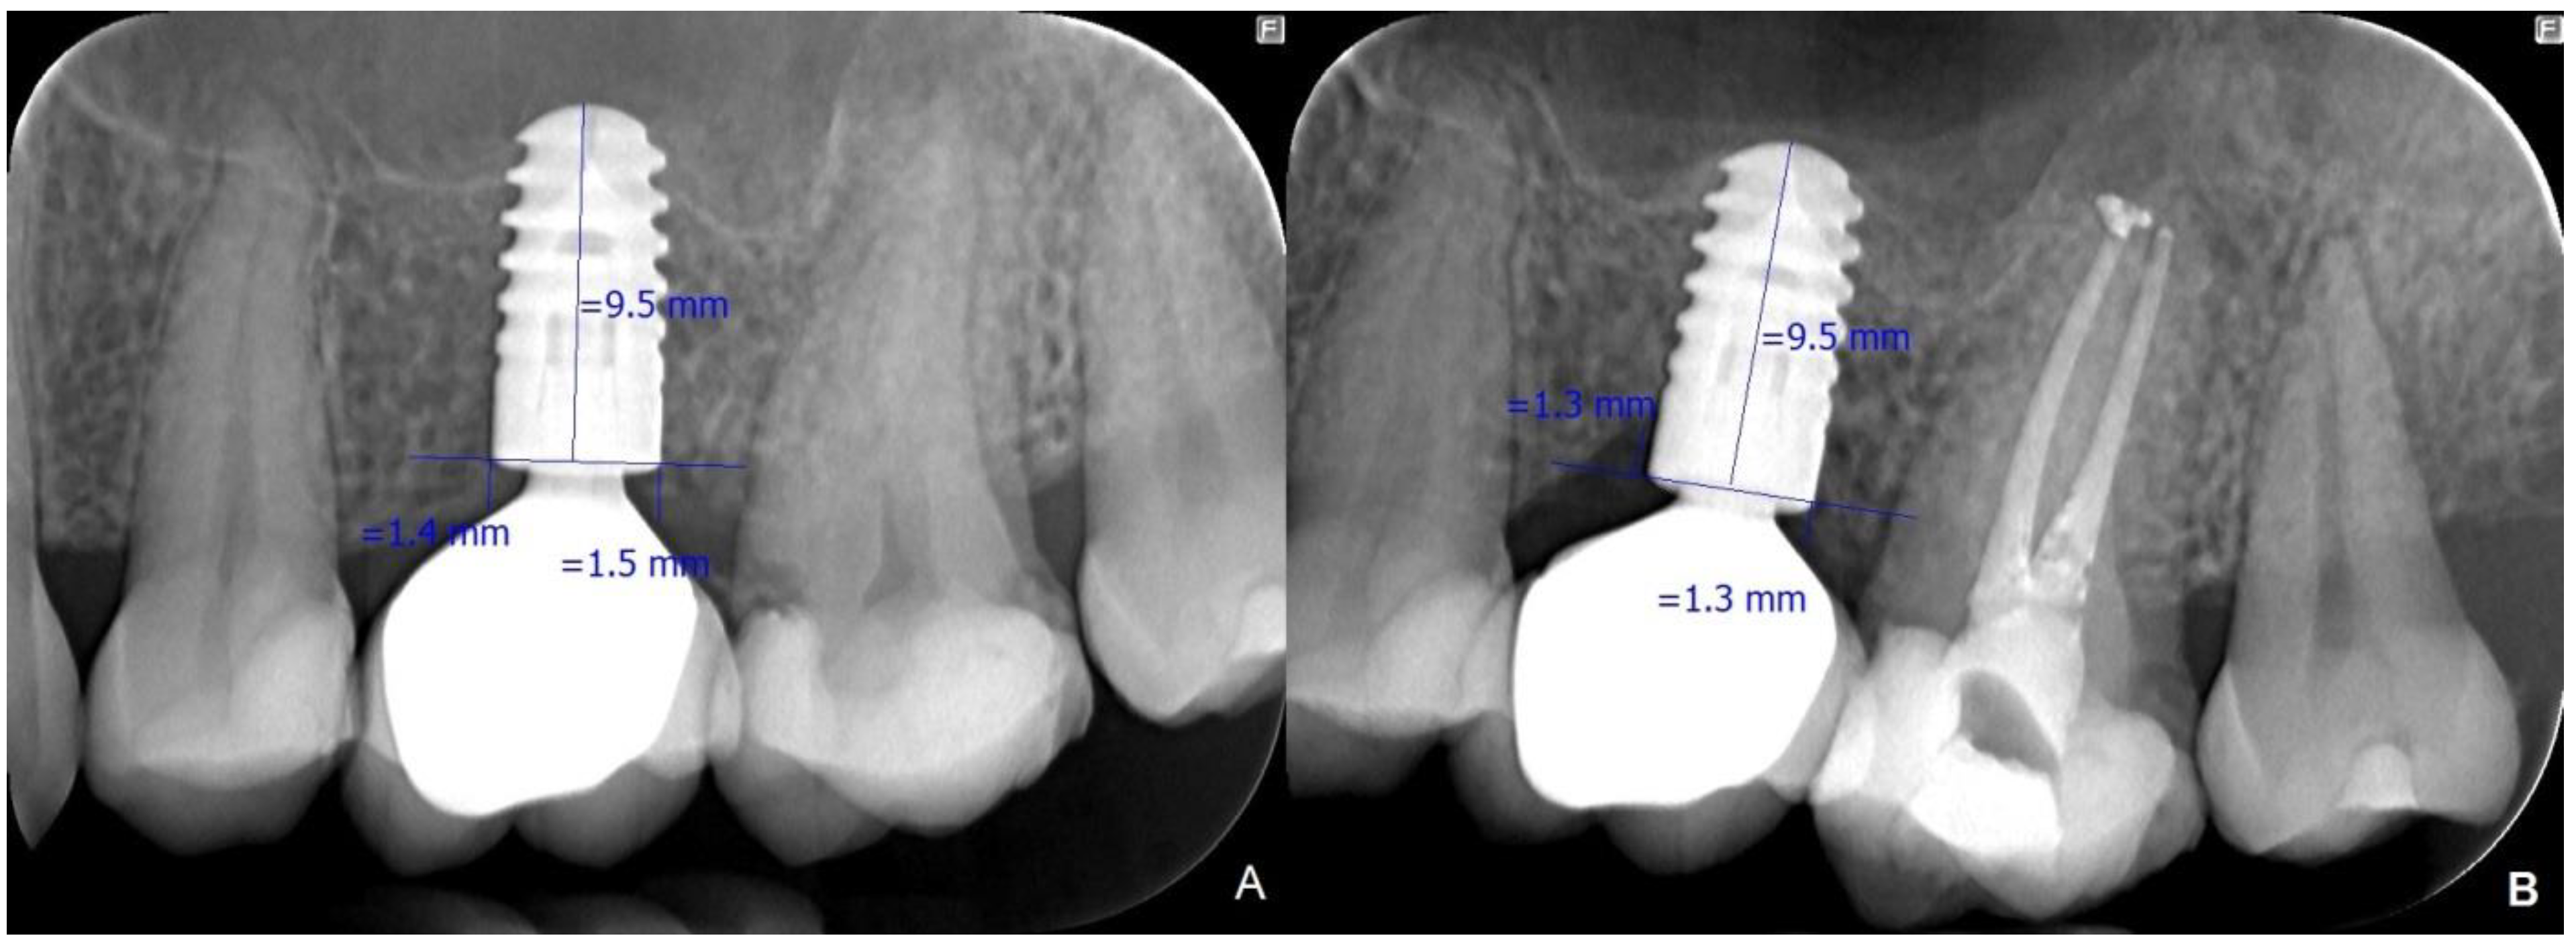
2. Materials and Methods
3. Results
4. Discussion
5. Conclusions
Author Contributions
Funding
Institutional Review Board Statement
Informed Consent Statement
Data Availability Statement
Conflicts of Interest
References
- Hamilton, A.; Judge, R.B.; Palamara, J.E.; Evans, C. Evaluation of the fit of CAD/CAM abutments. Int. J. Prosthodont. 2013, 26, 370–380. [Google Scholar] [CrossRef] [PubMed]
- Gallo, S.; Pascadopoli, M.; Pellegrini, M.; Pulicari, F.; Manfredini, M.; Zampetti, P.; Spadari, F.; Maiorana, C.; Scribante, A. CAD/CAM Abutments versus Stock Abutments: An Update Review. Prosthesis 2022, 4, 468–479. [Google Scholar] [CrossRef]
- Park, J.I.; Lee, Y.; Lee, J.H.; Kim, Y.L.; Bae, J.M.; Cho, H.W. Comparison of fracture resistance and fit accuracy of customized zirconia abutments with prefabricated zirconia abutments in internal hexagonal implants. Clin. Implant Dent. Relat. Res. 2013, 15, 769–778. [Google Scholar] [CrossRef] [PubMed]
- Priest, G. Virtual-designed and computer-milled implant abutments. J. Oral Maxillofac. Surg. 2005, 63, 22–32. [Google Scholar] [CrossRef]
- Linkevicius, T.; Vindasiute, E.; Puisys, A.; Peciuliene, V. The influence of margin location on the amount of undetected cement excess after delivery of cement-retained implant restorations. Clin. Oral Implants Res. 2011, 22, 1379–1384. [Google Scholar] [CrossRef]
- Von Maltzahn, N.F.; Holstermann, J.; Kohorst, P. Retention Forces between Titanium and Zirconia Components of Two-Part Implant Abutments with Different Techniques of Surface Modification. Clin. Implant Dent. Relat. Res. 2016, 18, 735–744. [Google Scholar] [CrossRef]
- Dumbrigue, H.B.; Abanomi, A.A.; Cheng, L.L. Techniques to minimize excess luting agent in cement-retained implant restorations. J. Prosthet. Dent. 2002, 87, 112–114. [Google Scholar] [CrossRef]
- Dentsply Implants. ATLANTIS™ beyond CAD/CAM: ATLANTIS™ Patient-Specific Abutments. Image p. 6. 2015. Available online: https://www.dentsplysirona.com/content/dam/dentsply/web/Implants/FranchiseContent/1224580-ATLANTIS-Abutments-beyond-CAD-CAM-1501-oonkuxc-en-1504.pdf (accessed on 20 May 2022).
- Borges, T.; Lima, T.; Carvalho, A.; Carvalho, V. Clinical Outcome of Inter-Proximal Papilla between a Tooth and a Single Implant Treated with CAD/CAM Abutments: A Cross-Sectional Study. J. Oral Maxillofac. Res. 2012, 3, e4. [Google Scholar] [CrossRef]
- Boudrias, P.; Shoghikian, E.; Morin, E.; Hutnik, P. Esthetic option for the implant-supported single-tooth restoration-treatment sequence with a ceramic abutment. J. Can. Dent. Assoc. 2001, 67, 508–514. [Google Scholar]
- Kapos, T.; Ashy, L.M.; Galluci, G.O.; Weber, H.P.; Wismeijer, D. Computer-aided design and computer-assisted manufacturing in prosthetic implant dentistry. Int. J. Oral Maxillofac. Implants 2009, 24, 110–117. [Google Scholar]
- Binon, P.P. Implants and components: Entering the new millennium. Int. J. Oral Maxillofac. Implants 2000, 15, 76–94. [Google Scholar]
- Parpaiola, A.; Norton, M.; Cecchinato, D.; Bressan, E.; Toia, M. Virtual Abutment Design: A Concept for Delivery of CAD/CAM Customized Abutments-Report of a Retrospective Cohort. Int. J. Periodontics Restor. Dent. 2013, 33, 51–58. [Google Scholar] [CrossRef] [PubMed]
- Linkevicius, T.; Vaitelis, J. The effect of zirconia or titanium as abutment material on soft peri-implant tissues: A systematic review and meta-analysis. Clin. Oral Implants Res. 2015, 26, 139–147. [Google Scholar] [CrossRef] [PubMed]
- Sailer, I.; Philipp, A.; Zembic, A.; Pjetursson, B.E.; Hammerle, C.H.; Zwahlen, M. A systematic review of the performance of ceramic and metal implant abutments supporting fixed implant reconstructions. Clin. Oral Implants Res. 2009, 20, 4–31. [Google Scholar] [CrossRef] [PubMed]
- Park, S.E.; Da Silva, J.D.; Weber, H.P.; Ishikawa-Nagai, S. Optical phenomenon of periimplant soft tissue. Part I. Spectrophotometric assessment of natural tooth gingiva and periimplant mucosa. Clin. Oral Implants Res. 2007, 18, 569–574. [Google Scholar] [CrossRef] [PubMed]
- Jung, R.E.; Holderegger, C.; Sailer, I.; Khraisat, A.; Suter, A.; Hammerle, C.H. The effect of all-ceramic and porcelain-fused-to-metal restorations on marginal peri-implant soft tissue color: A randomized controlled clinical trial. Int. J. Periodontics Restor. Dent. 2008, 28, 357–365. [Google Scholar]
- Gutmacher, Z.; Levi, G.; Blumenfeld, I.; Machtei, E.E. Soft and Hard Tissue Changes around Tissue-Oriented Tulip-Design Implant Abutments: A 1-Year Randomized Prospective Clinical Trial. Clin. Implant Dent. Relat. Res. 2015, 1, 891–897. [Google Scholar] [CrossRef]
- Rompen, E.; Raepsaet, N.; Domken, O.; Touati, B.; Van Dooren, E. Soft tissue stability at the facial aspect of gingivally converging abutments in the esthetic zone: A pilot clinical study. J. Prosthet. Dent. 2007, 97, 119–125. [Google Scholar] [CrossRef]
- Becker, W.; Goldstein, M.; Becker, B.E.; Sennerby, L. Minimally invasive flapless implant surgery: A prospective multicenter study. Clin. Implant Dent. Relat. Res. 2005, 7, 21–27. [Google Scholar] [CrossRef]
- Kim, Y.; Oh, T.J.; Misch, C.E.; Wang, H.L. Occlusal considerations in implant therapy: Clinical guidelines with biomechanical rationale. Clin. Oral Implants Res. 2005, 16, 26–35. [Google Scholar] [CrossRef]
- Weng, D.; Nagata, M.J.; Bell, M.; Bosco, A.F.; de Melo, L.G.; Richter, E.J. Influence of microgap location and configuration on the periimplant bone morphology in submerged implants. An experimental study in dogs. Clin. Oral Implants Res. 2008, 19, 1141–1147. [Google Scholar] [CrossRef]
- Weng, D.; Nagata, M.J.; Bosco, A.F.; de Melo, L.G. Influence of microgap location and configuration on radiographic bone loss around submerged implants: An experimental study in dogs. Int. J. Oral Maxillofac. Implants 2011, 26, 941–946. [Google Scholar]
- Abrahamsson, I.; Berglundh, T.; Lindhe, J. The mucosal barrier following abutment dis/reconnection. An experimental study in dogs. J. Clin. Periodontol. 1997, 24, 568–572. [Google Scholar] [CrossRef]
- De Rouck, T.; Eghbali, R.; De Bruyn, H.; Cosyn, J. The gingival biotype revisited: Transparency of the periodontal probe through the gingival margin as a method to discriminate thin from thick gingiva. J. Clin. Periodontol. 2009, 36, 428–433. [Google Scholar] [CrossRef]
- Dentsply Implants. Surgical Manual. Available online: http://www.dentsplyimplants.com/~/media/M3%20Media/DENTSPLY%20IMPLANTS/1212105%20ANKYLOS%20Surgical%20Manual.ashx?filetype=.pdf (accessed on 6 June 2022).
- Mombelli, A.; van Oosten, M.A.; Schurch, E., Jr.; Land, N.P. The microbiota associated with successful or failing osseointegrated titanium implants. Oral Microbiol. Immunol. 1987, 2, 145–151. [Google Scholar] [CrossRef]
- Brägger, U.; Hafeli, H.; Huber, B.; Hämmerle, C.H.F.; Lang, N.P. Evaluation of postsurgical crestal bone levels adjacent to non-submerged dental implants. Clin. Oral Implants Res. 1998, 9, 218–224. [Google Scholar] [CrossRef]
- Koutouzis, T.; Neiva, R.; Nonhoff, J.; Lundgren, T. Placement of implants with platform-switched Morse taper connections with the implant-abutment interface at different levels in relation to the alveolar crest: A short-term (1-year) randomized prospective controlled clinical trial. Int. J. Oral Maxillofac. Implants 2013, 28, 1553–1563. [Google Scholar] [CrossRef]
- Apicella, D.; Veltri, M.; Chieffi, N.; Polimeni, A.; Giovannetti, A.; Ferrari, M. Implant adaptation of stock abutments versus CAD/CAM abutments: A radiographic and Scanning Electron Microscopy study. Ann. Stomatol. 2010, 1, 9–13. [Google Scholar]
- Byrne, D.; Houston, F.; Cleary, R.; Claffey, N. The fit of cast and premachined implant abutments. J. Prosthet. Dent. 1998, 80, 184–192. [Google Scholar] [CrossRef]
- Jemt, T.; Pettersson, P. A three-year follow-up study on single implant treatment. J. Dent. 1993, 21, 203–208. [Google Scholar] [CrossRef]
- White, G.E. Osseointegrated Dental Technology. Quintessence 1993, 1, 82–83. [Google Scholar] [CrossRef]
- Broggini, N.; McManus, L.M.; Hermann, J.S.; Medina, R.; Schenk, R.K.; Buser, D.; Cochran, D.L. Peri-implant inflammation defined by the implant-abutment interface. J. Dent. Res. 2006, 85, 473–478. [Google Scholar] [CrossRef]
- Quirynen, M.; Bollen, C.M.; Eyssen, H.; van Steenberghe, D. Microbial penetration along the implant components of the Brånemark system. An in vitro study. Clin. Oral Implants Res. 1994, 5, 239–244. [Google Scholar] [CrossRef] [PubMed]
- Lops, D.; Bressan, E.; Parpaiola, A.; Sbricoli, L.; Cecchinato, D.; Romeo, E. Soft tissues stability of CAD/CAM and stock abutments in anterior regions: 2-year prospective multicentric cohort study. Clin. Oral Implants Res. 2015, 26, 1436–1442. [Google Scholar] [CrossRef] [PubMed]
- Cosyn, J.; Sabzevar, M.M.; De Bruyn, H. Predictors of inter-proximal and midfacial recession following single implant treatment in the anterior maxilla: A multivariate analysis. J. Clin. Periodontol. 2012, 39, 895–903. [Google Scholar] [CrossRef] [PubMed]
- Cairo, F.; Pagliaro, U.; Nieri, M. Soft tissue management at implant sites. J. Clin. Periodontol. 2008, 35, 163–167. [Google Scholar] [CrossRef]
- Luterbacher, S.; Mayfield, L.; Brägger, U.; Lang, N.P. Diagnostic characteristics of clinical and microbiological tests for monitoring periodontal and periimplant mucosal tissue conditions during supportive periodontal therapy (SPT). Clin. Oral Implants Res. 2000, 11, 521–529. [Google Scholar] [CrossRef]
- Schou, S.; Holmstrup, P.; Stoltze, K.; Hjørting-Hansen, E.; Fiehn, N.E.; Skovgaard, L.T. Probing around implants and teeth with healthy or inflamed peri-implant mucosa/gingiva. A histologic comparison in cynomolgus monkeys (Macaca fascicularis). Clin. Oral Implants Res. 2002, 13, 113–126. [Google Scholar] [CrossRef]
- Bauman, G.R.; Mills, M.; Rapley, J.W.; Hallmon, W.H. Clinical parameters of evaluation during implant maintenance. Int. J. Oral Maxillofac. Implants 1992, 7, 220–227. [Google Scholar]
- Salvi, G.E.; Lang, N.P. Diagnostic parameters for monitoring peri-implant conditions. Int. J. Oral Maxillofac. Implants 2004, 19, 116–127. [Google Scholar]
- Karoussis, I.K.; Muller, S.; Salvi, G.E.; Heitz-Mayfield, L.J.; Bägger, U.; Lang, N.P. Association between periodontal and peri-implant conditions: A 10-year prospective study. Clin. Oral Implants Res. 2004, 15, 1–7. [Google Scholar] [CrossRef] [PubMed]
- Smith, D.E.; Zarb, G.A. Criteria for success of osseointegrated endosseous implants. J. Prosthet. Dent. 1989, 62, 567–572. [Google Scholar] [CrossRef] [PubMed]
- Feloutzis, A.; Lang, N.P.; Tonetti, M.S.; Bürgin, W.; Brägger, U.; Buser, D.; Duff, G.W.; Kornman, K.S. IL-1 gene polymorphism and smoking as ris IL-1 gene polymorphism and smoking as risk factors for periimplant bone loss in a well-maintained population. Clin. Oral Implants Res. 2003, 14, 10–17. [Google Scholar] [CrossRef] [PubMed]
- Brägger, U.; Pasquali, L.; Rylander, H.; Carnes, D.; Kornman, K.S. Computer-assisted densitometric image analysis in periodontal radiography. J. Clin. Periodontol. 1988, 15, 27–37. [Google Scholar] [CrossRef]
- Lang, N.P.; Hill, R.W. Radiographs in periodontics. J. Clin. Periodontol. 1977, 4, 16–28. [Google Scholar] [CrossRef]
- Sewerin, I.P.; Gotfredsen, K.; Stoltze, K. Accuracy of radiographic diagnosis of periimplant radiolucencies—An in vitro experiment. Clin. Oral Implants Res. 1997, 8, 299–304. [Google Scholar] [CrossRef]
- Zembic, A.; Sailer, I.; Jung, R.E.; Hämmerle, C.H. Randomized-controlled clinical trial of customized zirconia and titanium implant abutments for single-tooth implants in canine and posterior regions: 3-year results. Clin. Oral Implants Res. 2009, 20, 802–808. [Google Scholar] [CrossRef]
- Chang, M.; Wennström, J.L. Peri-implant soft tissue and bone crest alterations at fixed dental prostheses: A 3-year prospective study. Clin. Oral Implants Res. 2010, 21, 527–534. [Google Scholar] [CrossRef]
- Lin, H.-T.; Lin, J.C.-Y.; Salamanca, E.; Dorj, O.; Pan, Y.-H.; Wu, Y.-F.; Hsu, Y.-S.; Fang, C.-Y.; Chang, W.-J. Marginal Bone Level Evaluation of Fixed Partial Dental Prostheses Using Preformed Stock versus CAD/CAM Customized Abutments. J. Pers. Med. 2022, 12, 1051. [Google Scholar] [CrossRef]
- Hsiao, C.-C.; Liang, C.-H.; Shen, Y.-F.; Hsu, K.-W. Retrospective comparison of posterior fixed dental prostheses supported by two different titanium abutments on tissue level implants. J. Prosthet. Dent. 2021, 125, 877–882. [Google Scholar] [CrossRef]
- Parpaiola, A.; Toia, M.; Norton, M.; Cecchinato, D.; Bressan, E.; Lops, D. CAD/CAM Implant Abutments: Peri-implant Hard and Soft Tissue Response with Up to 4 Years of Follow-up- A Retrospective Cohort Study Evaluation. Int. J. Periodontics Restor. Dent. 2020, 40, 193–201. [Google Scholar] [CrossRef] [PubMed]
- Nitzan, D.; Mamlider, A.; Levin, L.; Schwartz-Arad, D. Impact of smoking on marginal bone loss. Int. J. Oral Maxillofac. Implants 2005, 20, 605–609. [Google Scholar] [PubMed]
- French, D.; Grandin, H.M.; Ofec, R. Retrospective cohort study of 4591 dental implants: Analysis of risk indicators for bone loss and prevalence of peri-implant mucositis and peri-implantitis. J. Periodontol. 2019, 90, 691–700. [Google Scholar] [CrossRef] [PubMed]
- Kao, R.T.; Pasquinelli, K. Thick vs. thin gingival tissue: A key determinant in tissue response to disease and restorative treatment. J. Calif. Dent. Assoc. 2002, 30, 521–526. [Google Scholar] [CrossRef] [PubMed]
- Ferrari, M.; Cagidiaco, M.C.; Garcia-Godoy, F.; Goracci, C.; Cairo, F. Effect of different prosthetic abutments on peri-implant soft tissue. A randomized controlled clinical trial. Am. J. Dent. 2015, 28, 85–89. [Google Scholar]
- Lim, Y.W.; Lim, Y.J.; Kim, B.; Lee, S.P. A new method of measuring the volumetric change of alveolar bone around dental implants using computed tomography. J. Clin. Med. 2020, 9, 1238. [Google Scholar] [CrossRef]


| Abbreviation | Definition |
|---|---|
| CAD/CAM | computer-aided design/computer-aided manufacturing (milling) |
| PI | plaque index |
| mPI | modified plaque index |
| API | average plaque index |
| mAPI | modified average plaque index |
| i-API | initial average plaque index |
| 4m-API | four-month average plaque index |
| 8m-API | eight-month average plaque index |
| 12m-API | twelve-month average plaque index |
| mBI | modified bleeding index |
| ABI | average bleeding indeks |
| mABI | modified average bleeding index |
| i-ABI | inital average bleeding index |
| 4m-ABI | four-month average bleeding index |
| 8m-ABI | eight-month average bleeding index |
| 12m-ABI | twelve-month average bleeding index |
| 8m-ABI-D | eight-month average bleeding index dichotomized |
| 12m-ABI-D | twelve-month average bleeding index dichotomized |
| PPD | pocket probing depth |
| APPD | average probing pocket depth |
| i-APPD | initial pocket probing depth |
| 4m-APPD | four-month pocket probing depth |
| 8m-APPD | eight-month pocket probing depth |
| 12m-APPD | twelve-month pocket probing depth |
| CBLE | crestal bone loss evaluation |
| CBLEm | crestal bone loss evaluation mesialy |
| CBLEd | crestal bone loss evaluation distaly |
| ACBLE | average crestal bone loss evaluation |
| TCBLE | total crestal bone loss evaluation |
| i-ACBLE | inital average crestal bone loss evaluation |
| 12m-ACBLE | twelve-month average crestal bone loss evaluation |
| SH | smoking habit |
| GB | gingival biotype |
| OH | oral hygiene |
| AM | arithmetic mean |
| SD | standard deviation |
| CI | confidence interval |
| Type of Abutment | Number of Subjects | Gingival Biotype (GB) | Smoking Habits (SH) | Oral Hygiene Level (OH) | ||||
|---|---|---|---|---|---|---|---|---|
| Thin | Thick | Yes | No | Poor | Good | Excellent | ||
| STOCK | 34 | 5 | 29 | 9 | 25 | 0 | 13 | 21 |
| CUSTOM | 30 | 6 | 24 | 11 | 19 | 0 | 12 | 18 |
| TOTAL | 64 | 11 | 53 | 20 | 44 | 0 | 25 | 39 |
| i-mAPI | 4m-mAPI | 8m-mAPI | 12m-mAPI | ||
|---|---|---|---|---|---|
| STOCK | Median | 0.25 | 0.125 | 0.25 | 0.5 |
| Range | 0–1.75 | 0–1.5 | 0–1.5 | 0–1.5 | |
| CUSTOM | Median | 0 | 0.125 | 0 | 0.125 |
| Range | 0–1.5 | 0–1.5 | 0–1.25 | 0–1.5 | |
| Mann–Whitney’s U test | p | 0.333 | 0.744 | 0.150 | 0.108 |
| Total for all subjects (STOCK + CUSTOM) | Median | 0.25 | 0.125 | 0 | 0.25 |
| Range | 0–1.75 | 0–1.5 | 0–1.5 | 0–1.5 | |
| Friedman’s two-way analysis of variance for repeated measures | χ2 (number of degrees of freedom) p | χ2 = 16.76 (3); p = 0.001 | |||
| i-mABI | 4m-mABI | 8m-mABI | 12m-mABI | ||
|---|---|---|---|---|---|
| STOCK | Median | 0.25 | 0.125 | 0.5 | 0.5 |
| Range | 0–2 | 0–2.5 | 0–1.25 | 0–1.75 | |
| CUSTOM | Median | 0.25 | 0 | 0 | 0 |
| Range | 0–1.25 | 0–0.75 | 0–0.5 | 0–0.5 | |
| Mann–Whitney’s U test | p | 0.427 | 0.132 | 0.002 | <0.001 |
| Total for all subjects (STOCK + CUSTOM) | Median | 0.25 | 0 | 0.25 | 0.25 |
| Range | 0–2 | 0–2.5 | 0–1.25 | 0–1.75 | |
| Friedman’s two-way analysis of variance for repeated measurements | χ2 (number of degrees of freedom) p | χ2 = 3.15 (3); p = 0.369 | |||
| i-APPD | 4m-APPD | 8m-APPD | 12m-APPD | ||
|---|---|---|---|---|---|
| STOCK | AM | 2.53 | 2.67 | 2.62 | 2.6 |
| SD | 0.83 | 0.81 | 0.76 | 0.76 | |
| CUSTOM | AM | 2.55 | 2.58 | 2.64 | 2.66 |
| SD | 0.58 | 0.64 | 0.59 | 0.56 | |
| Student’s t-test for independent samples | T | −0.09 | 0.44 | −0.16 | −0.38 |
| P | 0.928 | 0.657 | 0.870 | 0.709 | |
| Total for all subjects | AM | 2.53 | 2.62 | 2.63 | 2.62 |
| SD | 0.72 | 0.73 | 0.68 | 0.66 | |
| ANOVA for repeated measurements with Greenhouse–Geisser correction | F (number of degrees of freedom) p | F = 2.17 (1.45; 91.24) p = 0.135 | |||
| i-ACBLE | 12m-ACBLE | ||
|---|---|---|---|
| STOCK | AM | −0.32 | −0.24 |
| SD | 0.88 | 0.94 | |
| CUSTOM | AM | −0.27 | −0.15 |
| SD | 0.47 | 0.54 | |
| Student’s t-test for independent samples | T | −0.29 | −0.45 |
| p | 0.775 | 0.652 | |
| Total for all subjects | AM | −0.29 | −0.2 |
| SD | 0.71 | 0.78 | |
| Student’s t-test for dependent samples | t | −3.7 | |
| p | <0.001 | ||
| TCBLE | ||
|---|---|---|
| STOCK | AM | 0.05 |
| SD | 0.17 | |
| CUSTOM | AM | 0.11 |
| SD | 0.15 | |
| Student’s t-test for independent samples | T | 1.66 |
| p | 0.105 | |
| Total for all subjects (N = 63) * | Average | 0.76 |
| SD | 0.16 |
| Variable | Value | N | TCBLE AM | TCBLE SD | Student’s t-Test |
|---|---|---|---|---|---|
| SH | YES | 20 | 0.01 | 0.14 | t = 1.94 |
| NO | 43 | 0.11 | 0.13 | p = 0.028 | |
| GB | Thin | 11 | 0.13 | 0.24 | t = 1.25 |
| Thick | 52 | 0.06 | 0.14 | p = 0.218 | |
| OH | Good | 24 | 0.09 | 0.13 | t = 0.58 |
| Excellent | 39 | 0.07 | 0.17 | p = 0.564 |
| 8m-mABI-D | 12m-mABI-D | ||||
|---|---|---|---|---|---|
| 0 | 1 | 0 | 1 | ||
| Type of abutment | STOCK | 11 | 23 | 6 | 28 |
| CUSTOM | 18 | 12 | 17 | 13 | |
| Total | 29 | 35 | 23 | 41 | |
| Pearson χ2 | 4.92 | 10.54 | |||
| p | 0.027 | 0.001 | |||
| Oral hygiene | Good | 7 | 18 | 5 | 20 |
| Excellent | 22 | 17 | 18 | 39 | |
| Total | 29 | 35 | 23 | 41 | |
| Pearson χ2 | 4.96 | 4.53 | |||
| p | 0.026 | 0.033 | |||
| Gingival biotype | Thin | 6 | 5 | 3 | 8 |
| Thick | 23 | 30 | 20 | 33 | |
| Total | 29 | 35 | 23 | 41 | |
| Fischer’s exact test p | 0.526 | 0.732 | |||
| Coefficient | Statistical Error | Wald (df) | p | Chance Ratio | 95% CI | ||
|---|---|---|---|---|---|---|---|
| 8m-mABI-D | Type of abutment | 1.29 | 0.56 | 5.29 (1) | 0.022 | 3.62 | 1.2–10.82 |
| Oral hygiene | 1.35 | 0.59 | 5.28 (1) | 0.022 | 3.85 | 1.22–12.15 | |
| Constant | −0.98 | 0.47 | 4.3 (1) | 0.038 | 0.38 | ||
| 12m-mABI-D | Type of abutment | 2.04 | 0.63 | 10.36 (1) | 0.001 | 7.65 | 2.22–26.41 |
| Oral hygiene | 1.55 | 0.67 | 5.31 (1) | 0.021 | 4.7 | 1.26–17.51 | |
| Constant | −0.91 | 0.49 | 3.5 (1) | 0.061 | 0.4 | ||
Disclaimer/Publisher’s Note: The statements, opinions and data contained in all publications are solely those of the individual author(s) and contributor(s) and not of MDPI and/or the editor(s). MDPI and/or the editor(s) disclaim responsibility for any injury to people or property resulting from any ideas, methods, instructions or products referred to in the content. |
© 2023 by the authors. Licensee MDPI, Basel, Switzerland. This article is an open access article distributed under the terms and conditions of the Creative Commons Attribution (CC BY) license (https://creativecommons.org/licenses/by/4.0/).
Share and Cite
Pelivan, I.; Šeparović, I.; Vuletić, M.; Dulčić, N.; Gabrić, D. Radiological and Periodontal Evaluation of Stock and Custom CAD/CAM Implant Abutments—A One-Year Follow-Up Study. Prosthesis 2023, 5, 437-452. https://doi.org/10.3390/prosthesis5020030
Pelivan I, Šeparović I, Vuletić M, Dulčić N, Gabrić D. Radiological and Periodontal Evaluation of Stock and Custom CAD/CAM Implant Abutments—A One-Year Follow-Up Study. Prosthesis. 2023; 5(2):437-452. https://doi.org/10.3390/prosthesis5020030
Chicago/Turabian StylePelivan, Ivica, Ivan Šeparović, Marko Vuletić, Nikša Dulčić, and Dragana Gabrić. 2023. "Radiological and Periodontal Evaluation of Stock and Custom CAD/CAM Implant Abutments—A One-Year Follow-Up Study" Prosthesis 5, no. 2: 437-452. https://doi.org/10.3390/prosthesis5020030