1. Introduction
The real fascination with quantum computing lies in its consistent and continuous computation ability. That is why the actual implementations of quantum computing technology are all in inaccessible areas wherein continuous monitoring and observation are necessary, such as navigation, seismology, the pharma industry and many more. Quantum information processing (QIP) is the turning point in computer science, mathematics, physics and engineering [
1]. QIP is an inference of quantum mechanics to fulfill an information processing objective. Classical and quantum information can be used jointly to comprehend phenomena that are impractical for classical information processing, such as the exploration of an unstructured database with a quadratic speedup. It is associated with the most exemplary conceivable classical algorithms [
2].
Machine learning is another concept wherein machines are trained to solve problems with learning algorithms where machines are pre-arranged with the capacity to discover some structure concealed within data. In unsupervised learning, for performing any typical task, firstly “natural” clusters present in the raw and unstructured data are discovered [
3].
The process of grouping datapoints (input data) based on their similarities is called clustering, described as an unsupervised learning problem to generate training data using a specific set of inputs but without any label. In order to make a collection of unlabeled data more comprehensible and manipulable, clustering isthe process of looking for comparable structural features. Clustering helps in the analysis of unstructured data at the surface level. The density of the datapoints, graphing and the shortest distance are some of the factors that affect the cluster formation. The centroid-based clustering method is used to study or analyze unstructured data. It bases its operation on how closely the datapoints resemble the selected center value. The datasets are separated into a predetermined number of clusters (a set of datapoints or group), and a vector of values references each cluster. The input data variable shows no difference and joins the cluster compared to the vector value. The initial step is to define the number of clusters. The k-means algorithm is a centroid-based clustering technique used for surfacing and optimizing huge amounts of data. Using a variety of distance metrics, such as the Minkowskidistance [
4], Manhattan distance and Euclidian distance, the clustering methods iteratively calculate the separation between the clusters and the characteristic centroids (center of the cluster). The massive collection of healthcare data consented to be easily accessible. However, it was complex data; therefore, it required a lot of work to efficiently evaluate the data to produce significant judgments or assessments of the patient’s health. Therefore, a prompt and fast technique is needed to aid health researchers in creating efficient healthcare policies, drug recommendation systems and persona-specific health profiles. The quantum clustering method is used to recognize the complex data patterns from the patient data [
5]. The suitability of the quantum clustering method for complex healthcare data is discussed in
Section 3. To fully utilize the healthcare data research, clinicians use the quantum domain [
6]. The strategies and methods to overcome some of the healthcare challenges by leveraging the power of quantum and ML include:
Connect health data from disparate sources
Determine effective treatments by identifying hidden patterns
Enable personalized care with precision
Exploring real-world clinical data for risk stratification
Create efficiencies in healthcare administration workflows (billing for health usage etc.)
Predicting disease progression through quantum power and using casual inference to improve patient outcomes.
The future of today’s cutting-edge technologyis quantum machine learning (QML) [
7]. QML is the fusion of quantum computing and artificial intelligence that will alter the future in the area dedicated to developing quantum algorithms for machine learning tasks. QML fills the gaps between the theoretical advances in quantum computing and the deployed machine learning science [
8]. QML focuses on offering synthesis that describes the most relevant machine learning algorithm in the quantum framework, reducing the complexity of the discipline involved. QML is a highly new field with much more growth, but we can already start to predict how it will impact our future [
9].
There are a few standard algorithmic primitives that are utilized to construct the algorithms in the majority of quantum machine learning applications. Quantum techniques for linear algebra, such as matrix multiplication and inversion, have been applied, for example, to recommendation systems. Second, supervised or unsupervised learning has used the capacity to estimate the separations between quantum states, for instance using the SWAP test [
10]. Most of these processes require access to the data on a quantum level, which can be accomplished by storing the data in particular data structures [
11].
Quantum interference is used to modify the underlying probabilities and helps with the quadratic speedup using Grover’s search algorithm. Regarding the adiabatic optimization, the paper [
12] explains many use case examples that talk about traffic optimization. Now, this is a slowly varying quantum evaluation. The paper [
13] discussed solving energy minimization use cases. In the case of linear system algorithms, we leveraged Hamilton in the simulation to perform the matrix inversion. In the least-squares fitting, an exponential speedup for well-conditiona filling problems with sparse A is presented in [
14]. The traditional math method requires hundreds of qubits [
15]. We described QK-means algorithm, a quantum clustering algorithm that can be thought of as a quantum equivalent for the classical k-means algorithm. In more detail, the definition of the QK-means will be provided in
Section 3. We present a comprehensive analysis to demonstrate that the QK-means produces results that are consistent with those of the classical k-means algorithm.
In this research paper, experimentation was performed using the quantum k-means (QK-means) clustering algorithm.
Section 2 will cover the introduction and background research about the basics of quantum computing, machine learning, unsupervised clustering algorithm and the healthcare data-driven approach.
Section 3 explains the methodology adopted for the quantum implementation of the QK-mean algorithm with the help of the state preparation process flow. The results and discussion portions are exhibited in
Section 4, which presents the findingson two varieties of datasets.
1.1. Literature Review
The paper aims to improve the performance of clustering algorithms. The primary focus is to improve the QK-means algorithm’s performance along with using fewer qubits. Beforehand, we studied the existing research by doing a literature review of the research papers in the field. The earlier works on clustering problems used the hybrid classical-quantum approach. In the paper “K-means clustering based on improved quantum particle swarm optimization algorithm”, the authors used the k-means algorithm for faster convergence and accurate results [
16]. The k-means algorithm was merged with an improvised version of the quantum particle swarm algorithm. The amalgamation of both algorithms providedan effective clustering result [
16]. Another approach to using the k-means algorithm was implementing a quantum chaotic cuckoo search algorithm for data clustering [
17]. The quantum chaotic cuckoo search algorithm combined the idea of a genetic cuckoo search, quantum algorithm and k- means algorithm. The performance of the hybrid k-mean algorithm was displayed in the form of the external and internal clustering quality. One would accept that it would have many enabled products in the healthcare space. However, the translation into the product has been relatively slow [
18]. The different variants of the k-means algorithm used by researchers so far are shown in the following table (
Table 1).
1.2. Basic Concepts of Quantum Computing
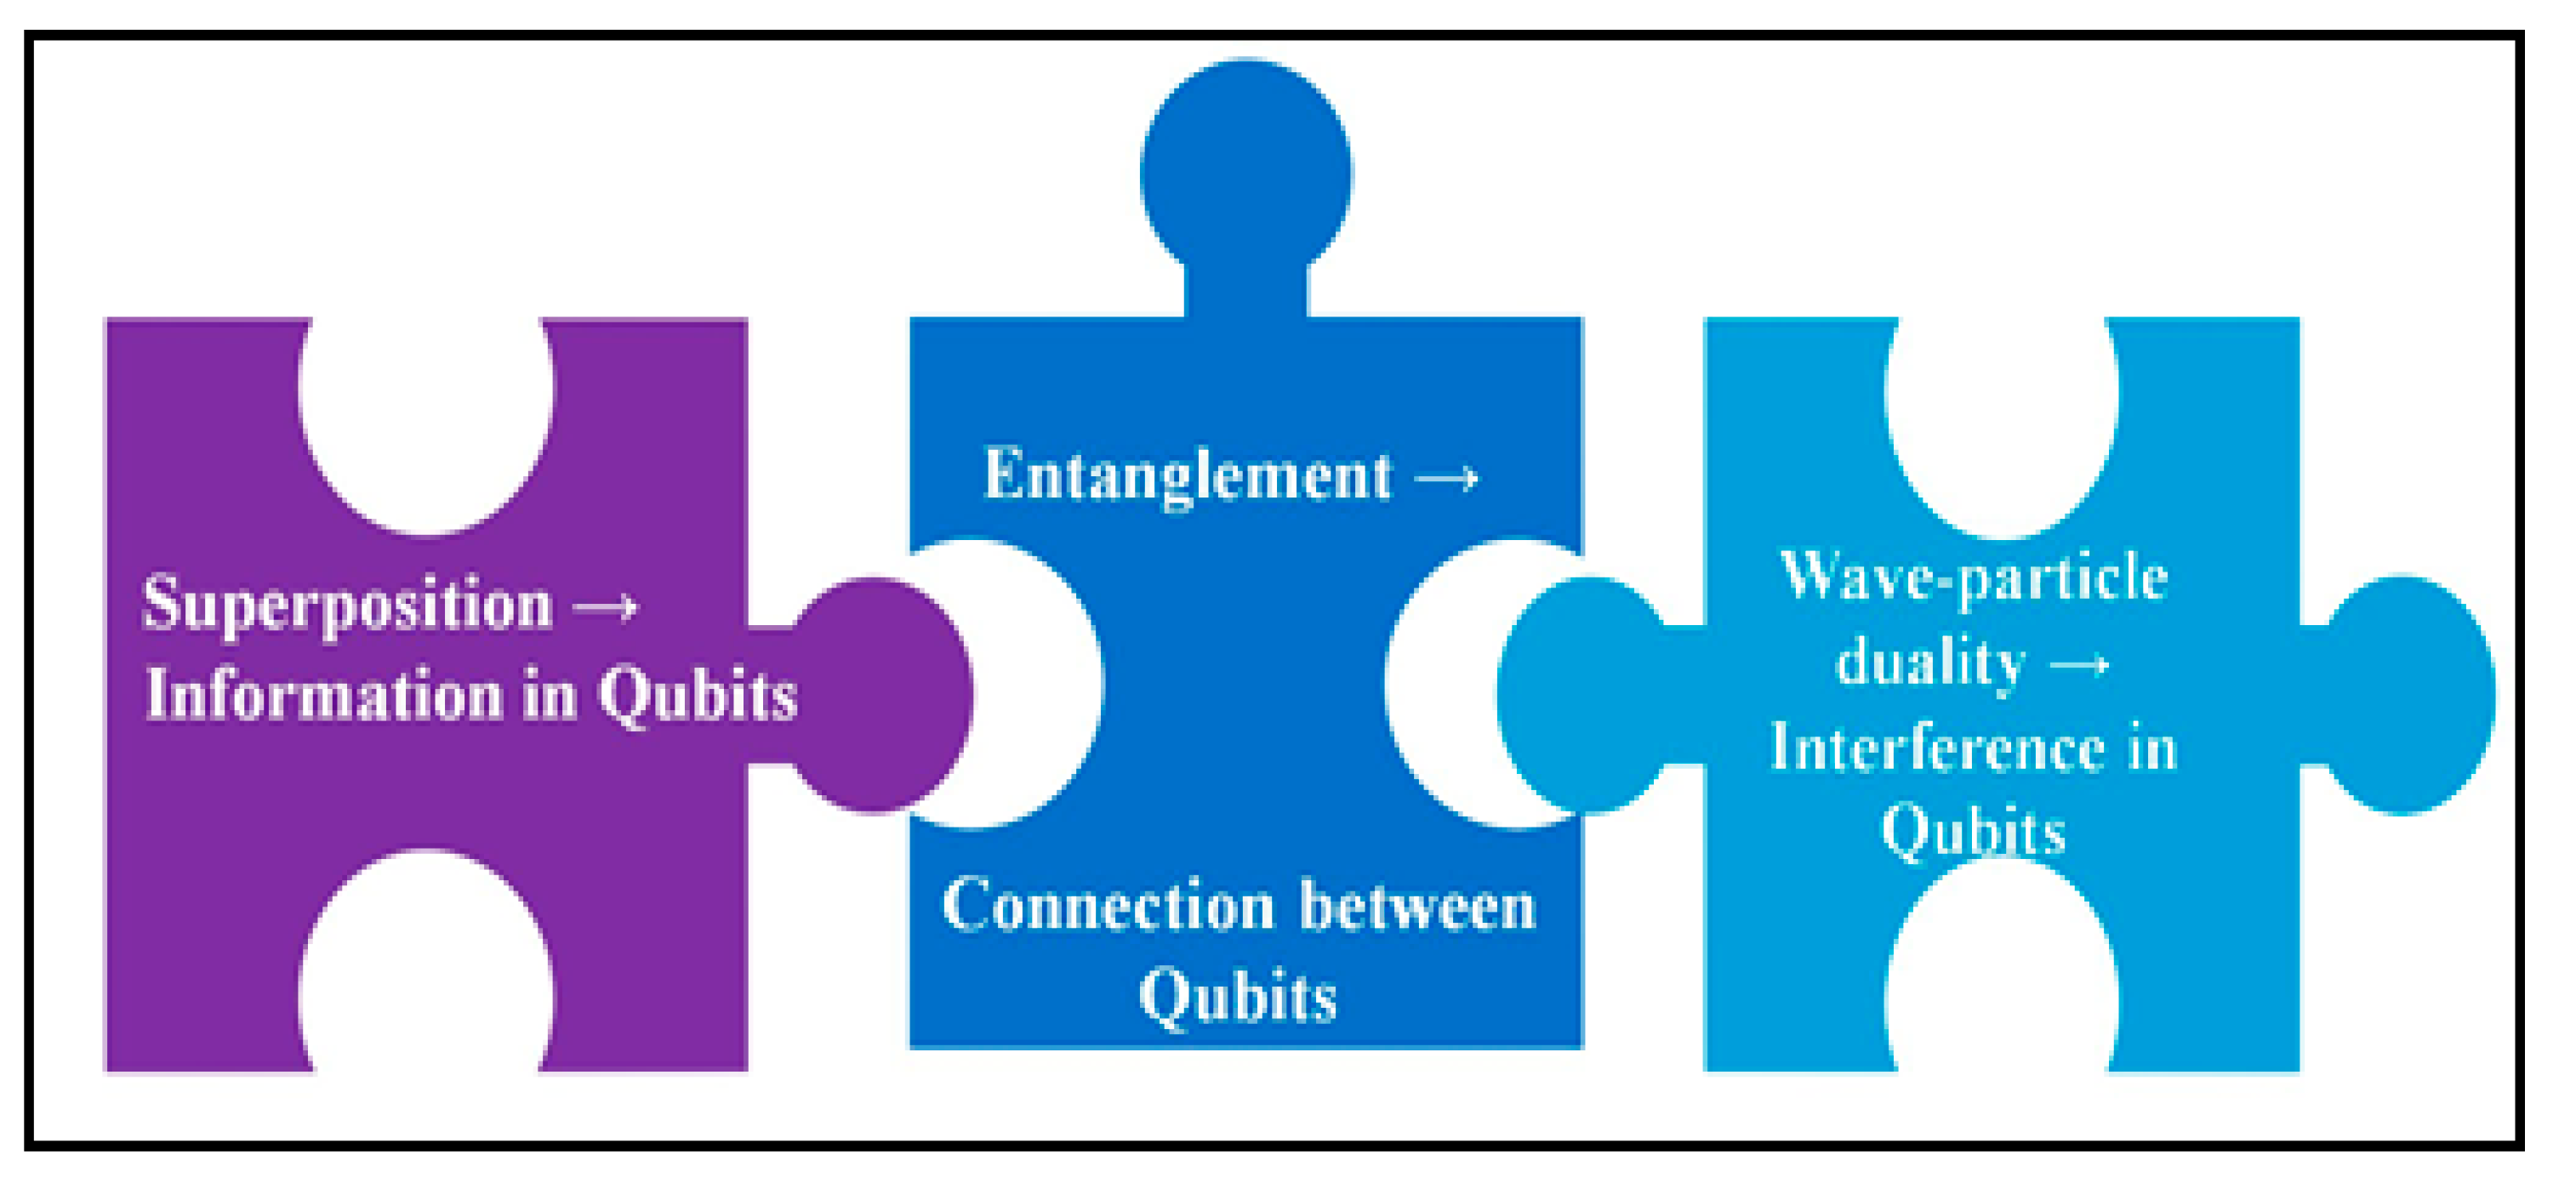
This section explained a few core concepts of the quantum computing used. In quantum computing, the small unit of information is known as a qubit.
Figure 1 depicts a glimpse of the basic principles of qubits and how they are pieces of the same concept. The binary notation and Dirac vector are used to represent the states (Equation (1)).
where
a and
b are complex numbers and |
a|
2 + |
b|
2 = 1.
The 0 or 1 state is used to represent the classical algorithm, but in quantum computing │0⟩ and │1⟩ can be used at the same time with the handful probability of being in a state.
The state of a qubit is shown in Equation (2). The probability amplitude is for reveling one the states as an outputwhere|a|2 and |b|2 are used for finding the probability of achieving│0⟩ and │1⟩, respectively. The state of a qubit can also be written as │ψ⟩= a│0⟩+ b │1. A qubit in such a state is said to be in superposition. So, once a measurement is completed on that qubit, it would yield │0⟩ with probability |a|2 and │1⟩ with probability |b|2.
The quantum operations of the quantum gate are applied to transform and change the qubit states. The norm of the state vector is supposed to maintain the harmony after applying the quantum gate. It implies that the sum of the squares of the probability amplitudes should always be equal to one [
24]. Hence, the unitary matrices are used to denote the quantum gates. It is a fact that all the quantum operations are reversible and do exist. All the quantum gates, except for the measurement gate, fall into this category. So, the non-reversible operation of the measurement gate is used at the end of the computation.
1.3. Model of Quantum Circuit
Quantum computation operates by harnessing a bundle of quantum gates on the qubits [
25]. The quantum gates denote the quantum operations. As shown in
Figure 2, there are three quantum gates directed to the qubits. The measurement is calculated at the end to obtain the outcome of the quantum circuit. This entire procedure of the quantum transition on the qubits is revealed in the system of a quantum circuit, where the timeline of the qubit is read from left to right. The quantum circuit model is the well-known method of evolving and exhibiting quantum models [
26]. The three-qubit quantum circuit [
27] that formulates entangled states is illustrated in
Figure 2. The quantum circuit formulates this quantum state (Equation (3)). A quantum logic gate, often known as a “quantum gate,” is a fundamental quantum circuit that uses a few qubits. To provide a clear image,
Figure 2 depicts a quantum circuit example.
Figure 2 shows a quantum circuit for a two-qubit entanglement.On the qubit q
0, the Hadamard gate and the controlled-NOT gate are applied. The control and the target qubit are q
0 and q
1, respectively. A measurement gate is applied to both the q
0 and q
1 qubit at the termination of the circuits.
2. The QK-Means Algorithm
We are focused on unsupervised learning and, more specifically, the classic clustering problem. Given a dataset represented as N datapoints (vectors), we assigned the vectors to one of the k labels. The initial stage defined the number of C or used an elbow method to identify the best value of C so that similar datapoints are assigned to the same cluster. The Euclidean distance is frequently used to evaluate how similar datapoints are grouped. However, different metrics may be appropriate depending on the problem. To understand the QK-means algorithm, it was important to know the basics about the working of the k-means algorithm (
Table 2). The k-means clustering was composed of four essential stages as explained in
Table 3. The QK-means firstly identified the preliminary value of the centroids (center of the cluster). Let (
C1,
C2, …
Cn−1,
Cn) represent the centroid’s harmony. The Euclidean distance was used to calculate distances and then the distance matrix at iteration 0 was executed. The flow of encoding, distance calculation and centroid assignment are shown in
Figure 3. A matrix
was used to describe the dataset; each row is a vector
for
that represents one datapoint. The centroid of the cluster
for the
jth row is
. We employed a tool created in [
8] in addition to the amplitude to increase the likelihood of achieving an accurate estimate for the distances needed for the QK-means algorithm. In order to calculate the median, we took several copies of the estimator from the amplitude estimation technique. A series of quantum algorithms was created for the encoding of the classical data into quantum data by the quantum computing approach known as amplitude amplification [
28,
29], which generalizes the concept behind Grover’s search algorithm. We assumed that the state space of our quantum system was represented by an N-dimensional Hilbert space (Equation (4)). If the dataset has V points overall, we could locate them by initializing a quantum register |ψ⟩ with n qubits where 2
n = N into a uniform superposition of each dataset and datapoint N such that:
The QK-means algorithm at a high level accomplishes in the identical method as the classical k-means algorithm. Therein, the quantum subroutines are used for the distance estimation, then the least value out of the set of elements is discovered. Subsequently, the matrix multiplication for the procurement of the new centroids as quantum states and effectual tomography is achieved. Some random initial points should be picked, primarily when using, for example, the k-means [
26]. Assigning the clusters is achieved by executing Steps 1 and 2. Step 3 and Step 4 calculate the minimum distance and assign a datapoint to the nearest centroid. In this way, the whole process is restated until the convergence is achieved (
Figure 3). By using encoding techniques, all the classical data are transformed into a quantum state. For additional processing, the amplitude encoding technique is utilized. The QK-means algorithm is used to evaluate all the performance metrics as those of the classical algorithm to perform the comparative analysis after data preprocessing (normalization and outlier rejection). The accepted input data form is quantitative data i.e., numeric data. Refs. [
34,
35] brought up the issue with the dead units. In other words, if certain units are initialized more distantly from the input dataset than other units, they instantly stop learning throughout the whole learning process. Due to the fact that only the Euclidean distance is used for clustering, it suggests that the data clusters are formed similar to balls. The cluster number must be predetermined. The k-means algorithm can accurately identify the clustering centers when k = k*. Otherwise, some datapoints will not be positioned at the centers of the appropriate clusters, which would result in an inaccurate clustering result. Instead, they are either at locations where distinct clusters converge, or they are biased away from the specific cluster centers.
The algorithm resumes with the estimation of the square distance between the data points and clusters with the help of a quantum procedure. To determine the square distance or inner product (with sign) between the two vectors contained in the QRAM, a quantum subroutine can be modified. When we achieved quantum access to the vectors and centroids, the distance estimation became very effective. We estimated the distances or inner products between the vectors with various standards in order to calculate the QK-means. On a high level, we then estimated the inner product of the unnormalized vectors by first estimating the inner products between the quantum states
and
,corresponding to the normalized vectors (Equation (5)), and then multiplying our estimator by the product of the vector norms. Instead of using the inner product, a comparable computation wasconducted for the square distance. The square distance was calculated using the SWAP test as explained in [
24] or using the distance calculation procedure as given in [
36].
The probability of getting zero for each of the V
i is calculated using Equation (5).
For calculating the distances for each and every datapoint, Equations (6) and (7) show the datapoints assigned to either cluster 1 or cluster 2, i.e., C
1 and C
2, respectively.
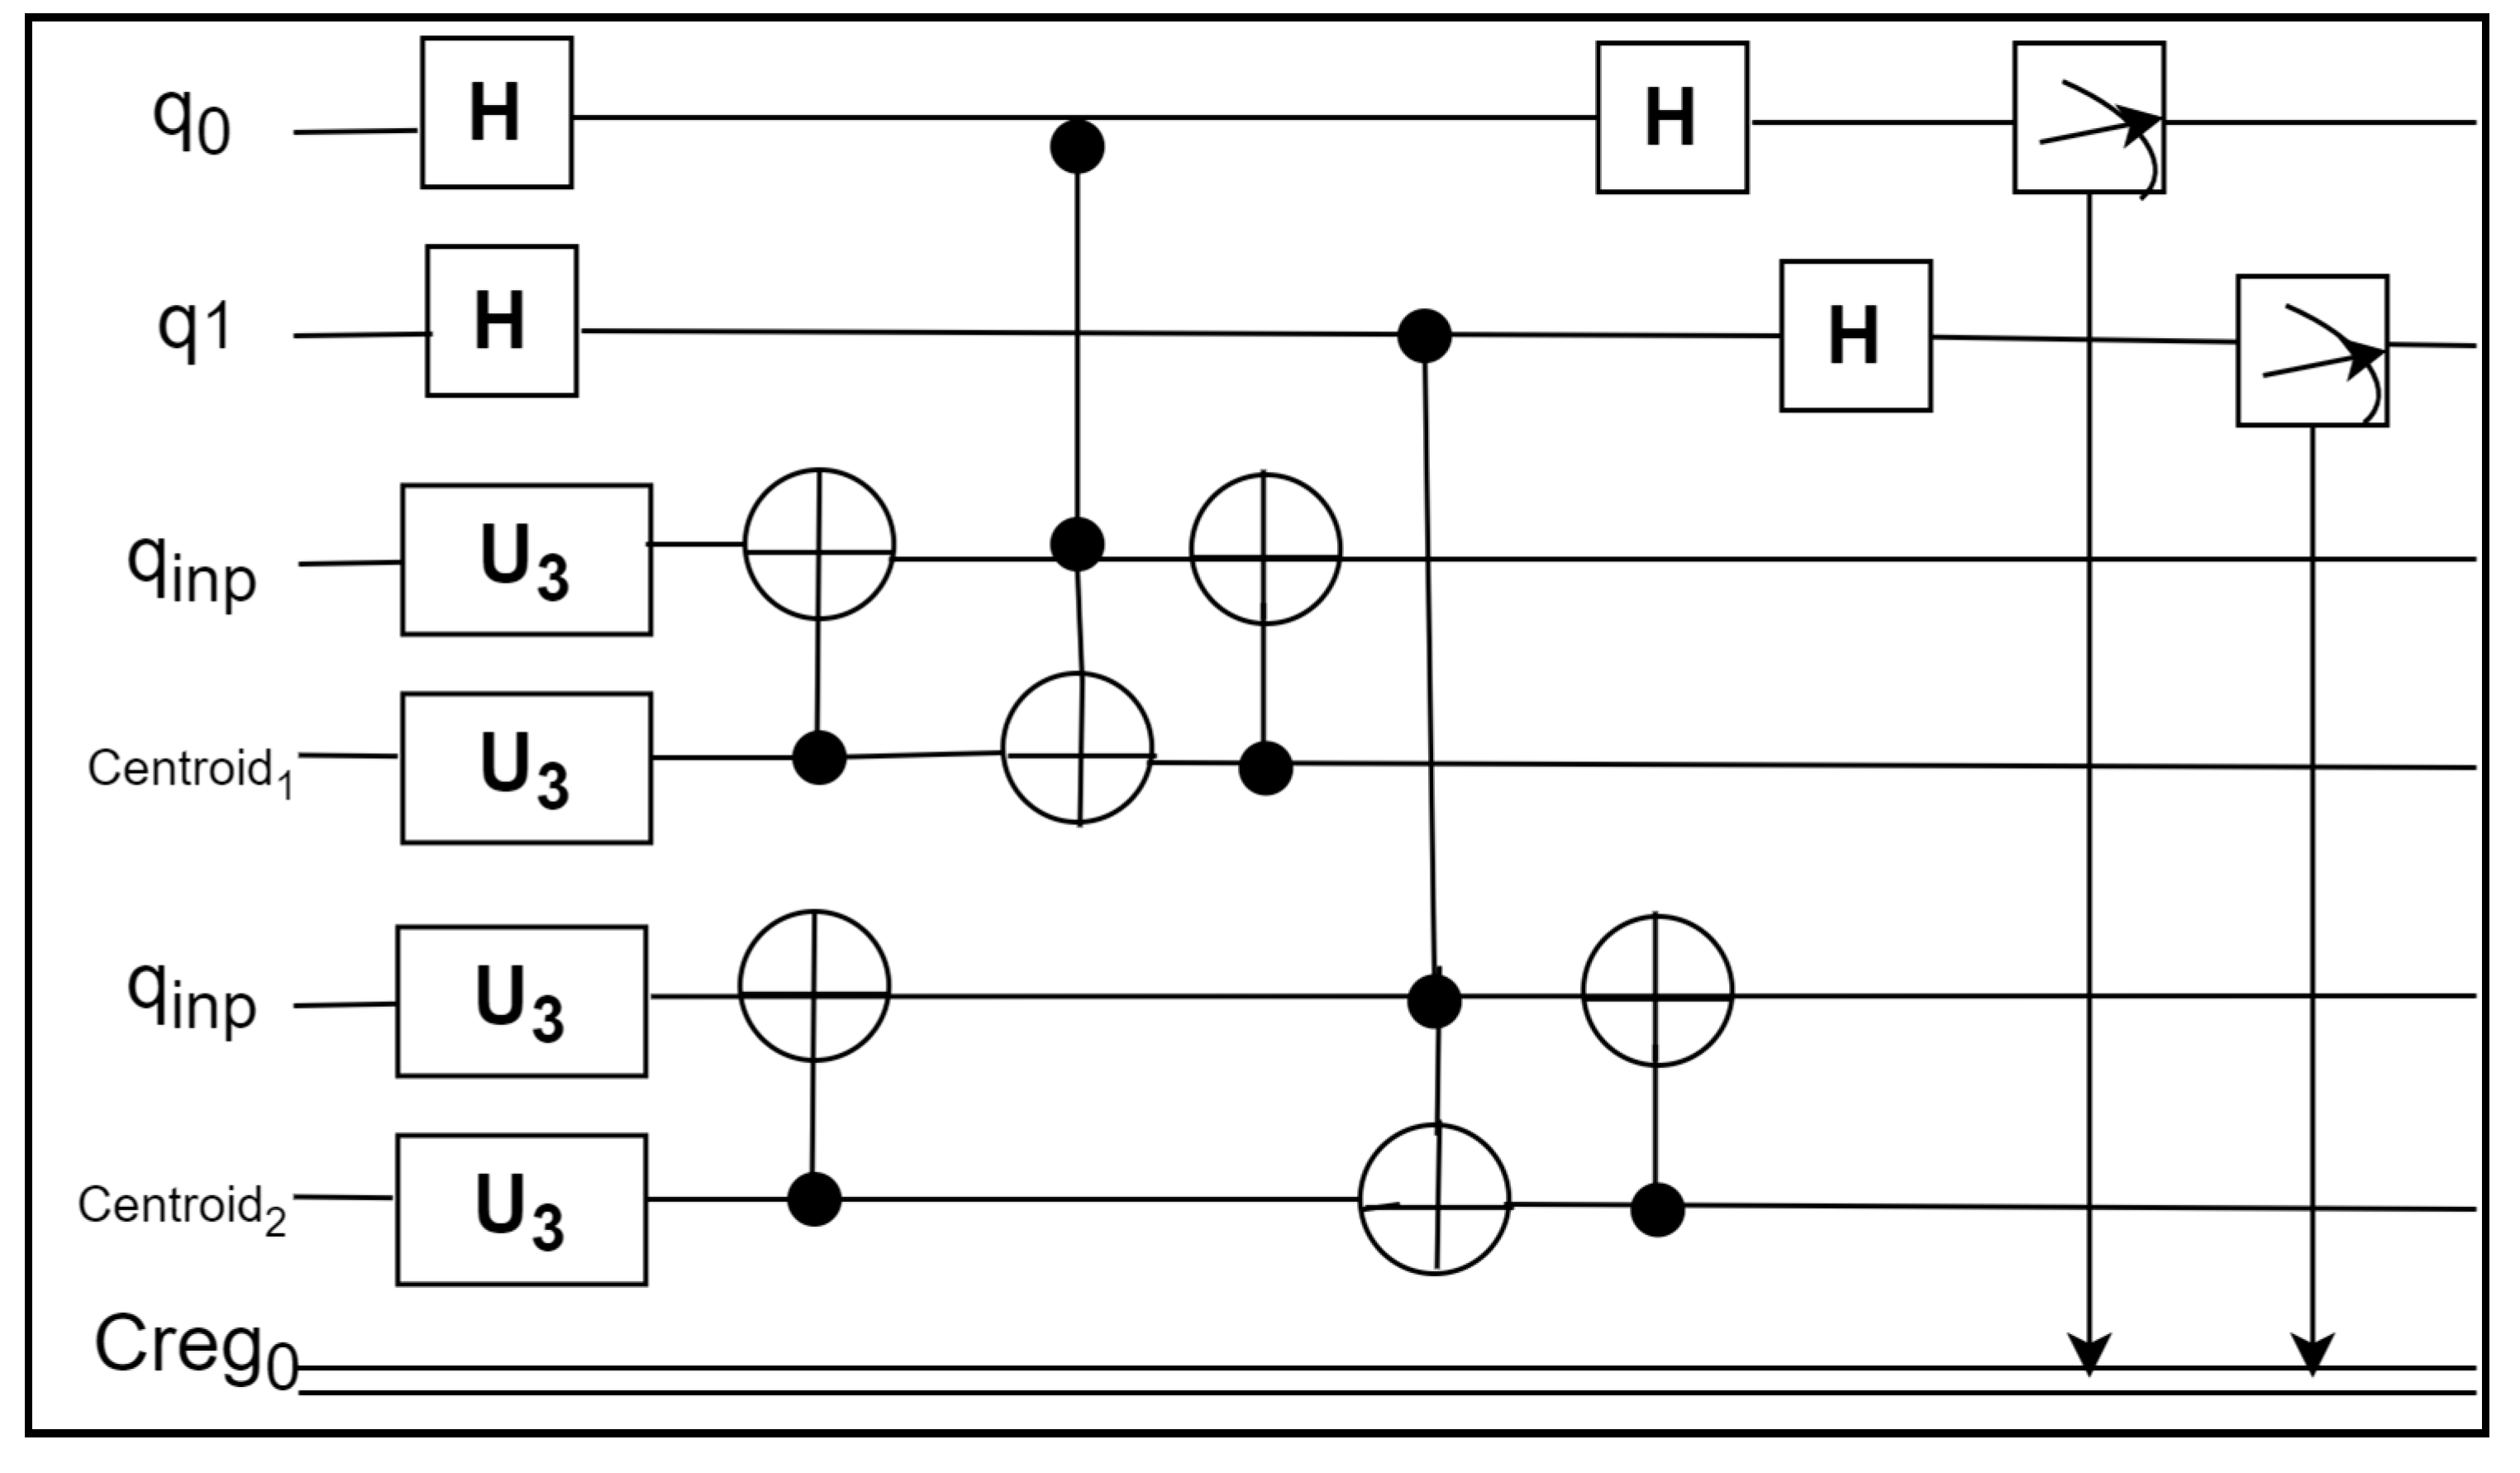
The U3 gate contains the encoding for the centroids and datapoints features. The first qubit receives the H gate, which connects the measurement to the conventional register. The entangled qubits carry out the SWAP test to determine the distance between the datapoints and centroids. The SWAP test is performed using a combination of control and anti-control gates. The distance between the first datapoint and centroid 1 (C1) is determined, as shown in
Figure 4, and the distance between the first datapoint and centroid 2 (C2) is calculated. The probabilities of getting the nearest centroids are measured using the Z gate. The shots should be chosen according to the requirements and run on the IBM simulator after the circuit has been run. Place the P
0 value into the calculation above √(2P
0−1) (Equation (5)) after calculating the frequency of achieving0 and dividing it by the total number of shots.
After the termination of Step 1, distinctly assess the distance between the datapoints and k centroid in the different registers and subsequently opt for the index j corresponding to the centroid adjoined to the given datapoint.
Now, initially take two points as the centroid (i.e., C
1 and C
2). Calculate the distance from one datapoint to C
1 and C
2, then obtain the closest centroid either C
1 or C
2 (
Figure 5). Update one of the centroids for further calculation. Calculate the distances for all the data points until the final result appears as a new centroid or updated centroid. With the help of the new centroid, different clusters will be formed. To prepare the quantum state of the centroid, we need to make |C
1〉a tensor with all the datapoints in superposition.
The assignments of the centroid initially store the index of the datapoint and then store the label of the centroids. After updating the centroid in the iteration, the label values will be assigned to the datapoints.
The input data
is in superposition when
While estimating the distance between the centroids and datapoints, the datapoints were assigned to their respective centroids. For assigning the clusters, we useda combination of quantum gates, i.e.,the Hadamard gate, NOT gate, controlled-NOT gate and measurement.Initially, the input data
in the superposition implies that the datapoints are not assigned yet. Each time the centroid is updated in order to check which datapoints belong to which state, we needed to measure their corresponding qubits. Suppose that the qubits are in the
or
state. If they are
, then the datapoint belongs to cluster 1 (C1) and if they are
, then that datapoint belongs to C2 (
Figure 6 and Equations (8) and (9)).
Check the first datapoint while taking into account the initial data. Then, take into account the separation between ⟨i
1│K
1⟩ and ⟨i
1│K
2⟩ (
Figure 6). A SWAP test between i
1 and K
1 or K
2 is conducted to determine which one will be at the shortest distance. A second qubit is used to hold the centroids. A new centroid value is encoded in the U gate for the cluster assignment. The centroid vectors are the input for rotating the value into the block sphere for a new centroid in the U gate. Take two qubits for
and
where continuous updating is required. After choosing the points for
and
, store those points in the qubits. As
and
can be prepared as taking the initial state
and putting a U gate, similarly prepare
. As a result of Step4 (
Figure 7), each time
and
are updated, find the distances of the datapoints from the new
and
and follow the same steps to calculate the distances. Show the datapoints in a single qubit system oncethe labeling of the datapoints is achieved. While doing the SWAP test, the circuit will deal with the data. However, the |ψ
in〉 value (Equation (8)) will need labeling. For example, 16 datapoints need four qubits.
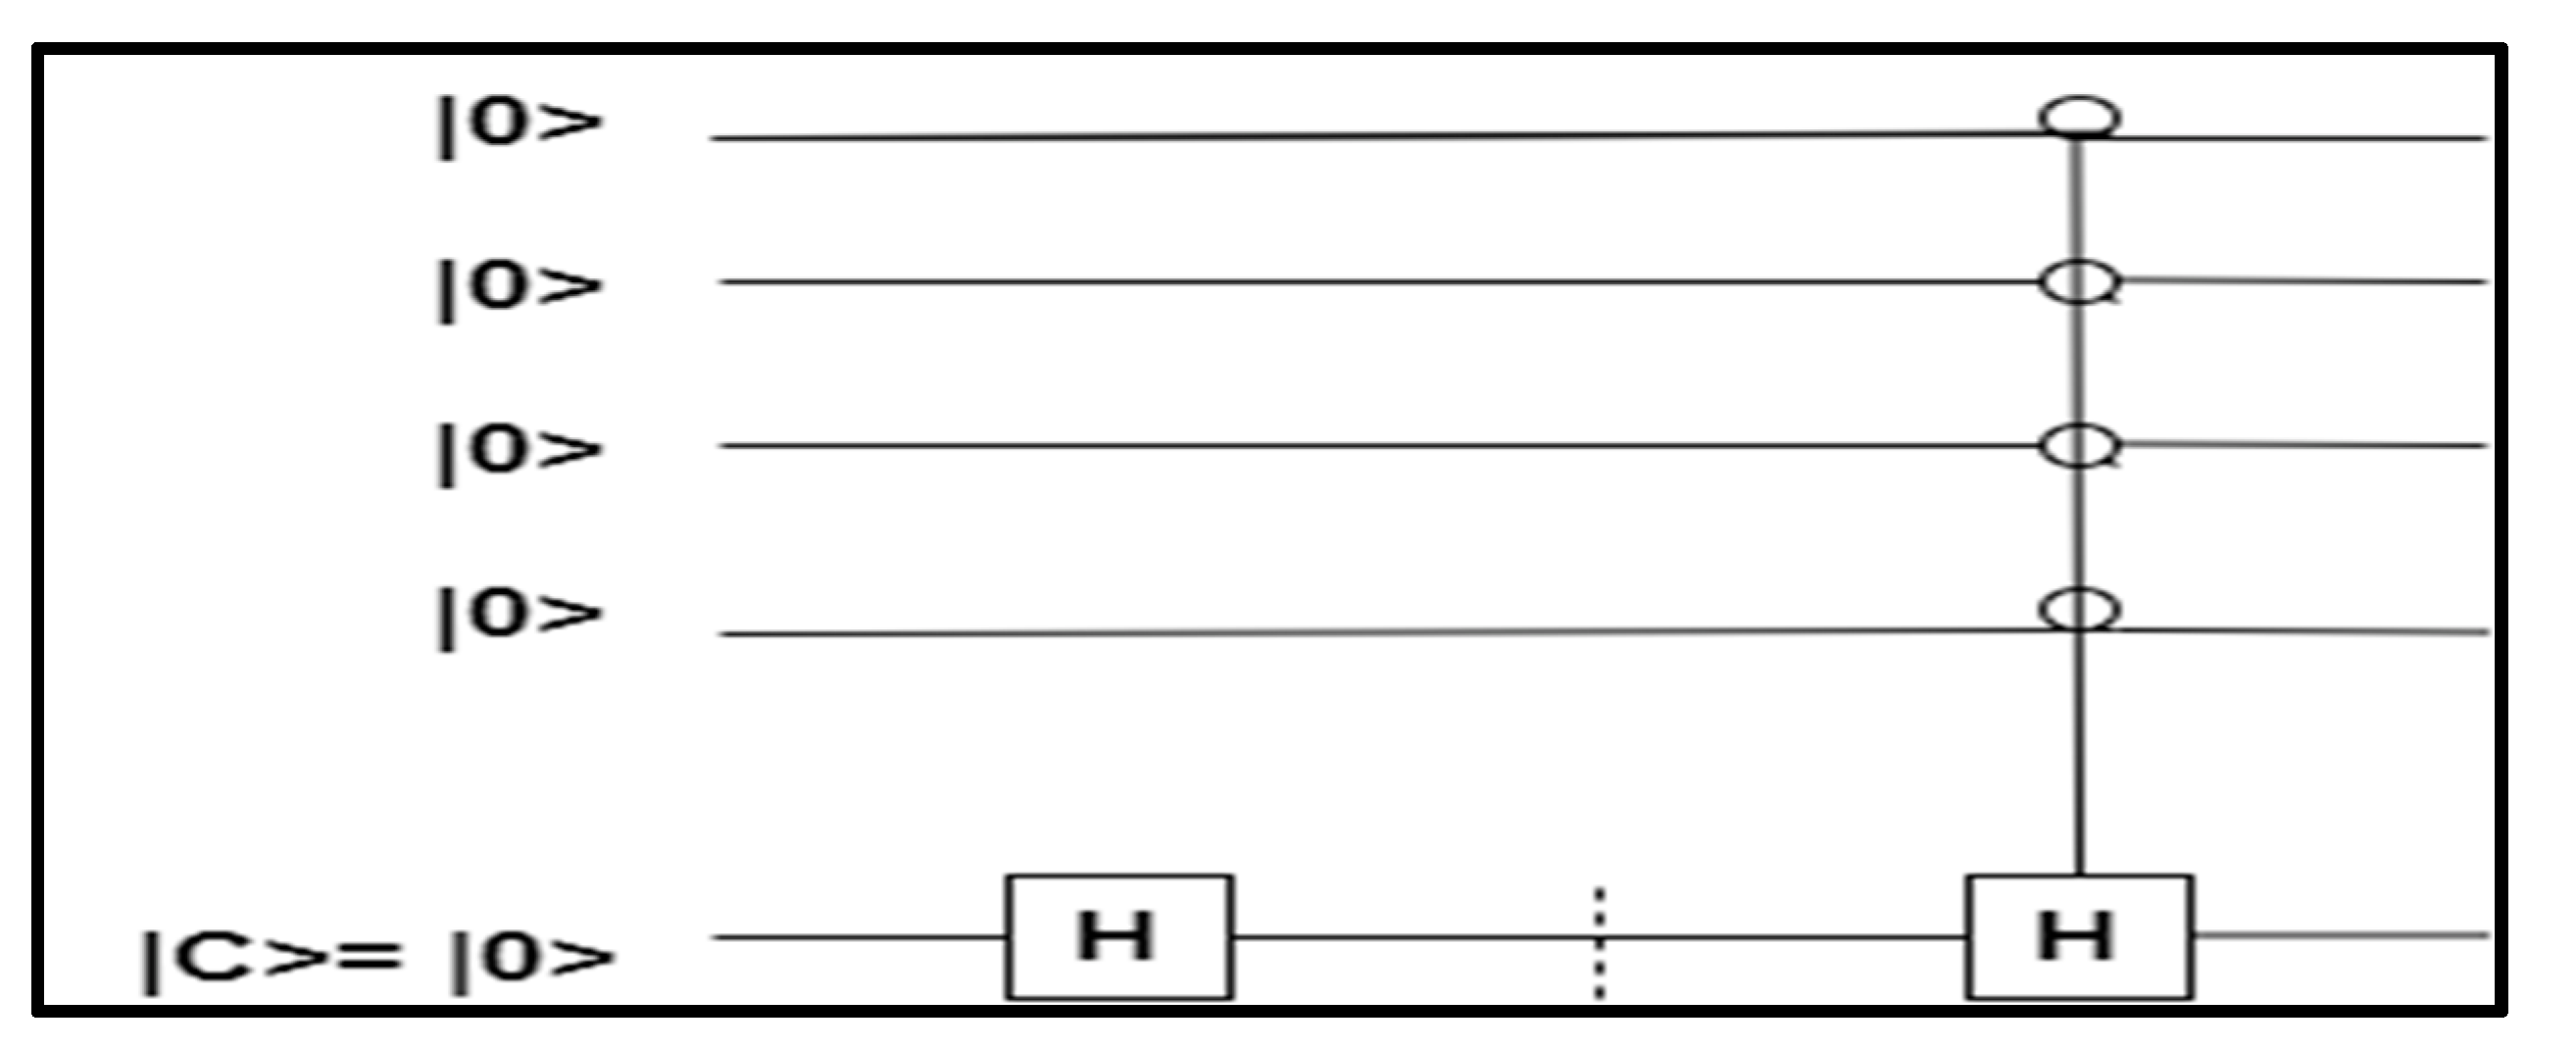
Figure 7 shows the labeling of the datapoints. Implementing the quantum state for the labeling converted the |+〉 state into the |0〉 state. So, for that, we applied an H operation. If the result (probability) shows the|0〉 state, then the answer is K
1 and we conductthe following operation (
Figure 6).
After updating
and
, again store them into the quantum state and then perform the SWAP test for second datapoint
using a new centroid. If that second datapoint is nearest to
, it belongs to C2 (i.e.,
). As shown in
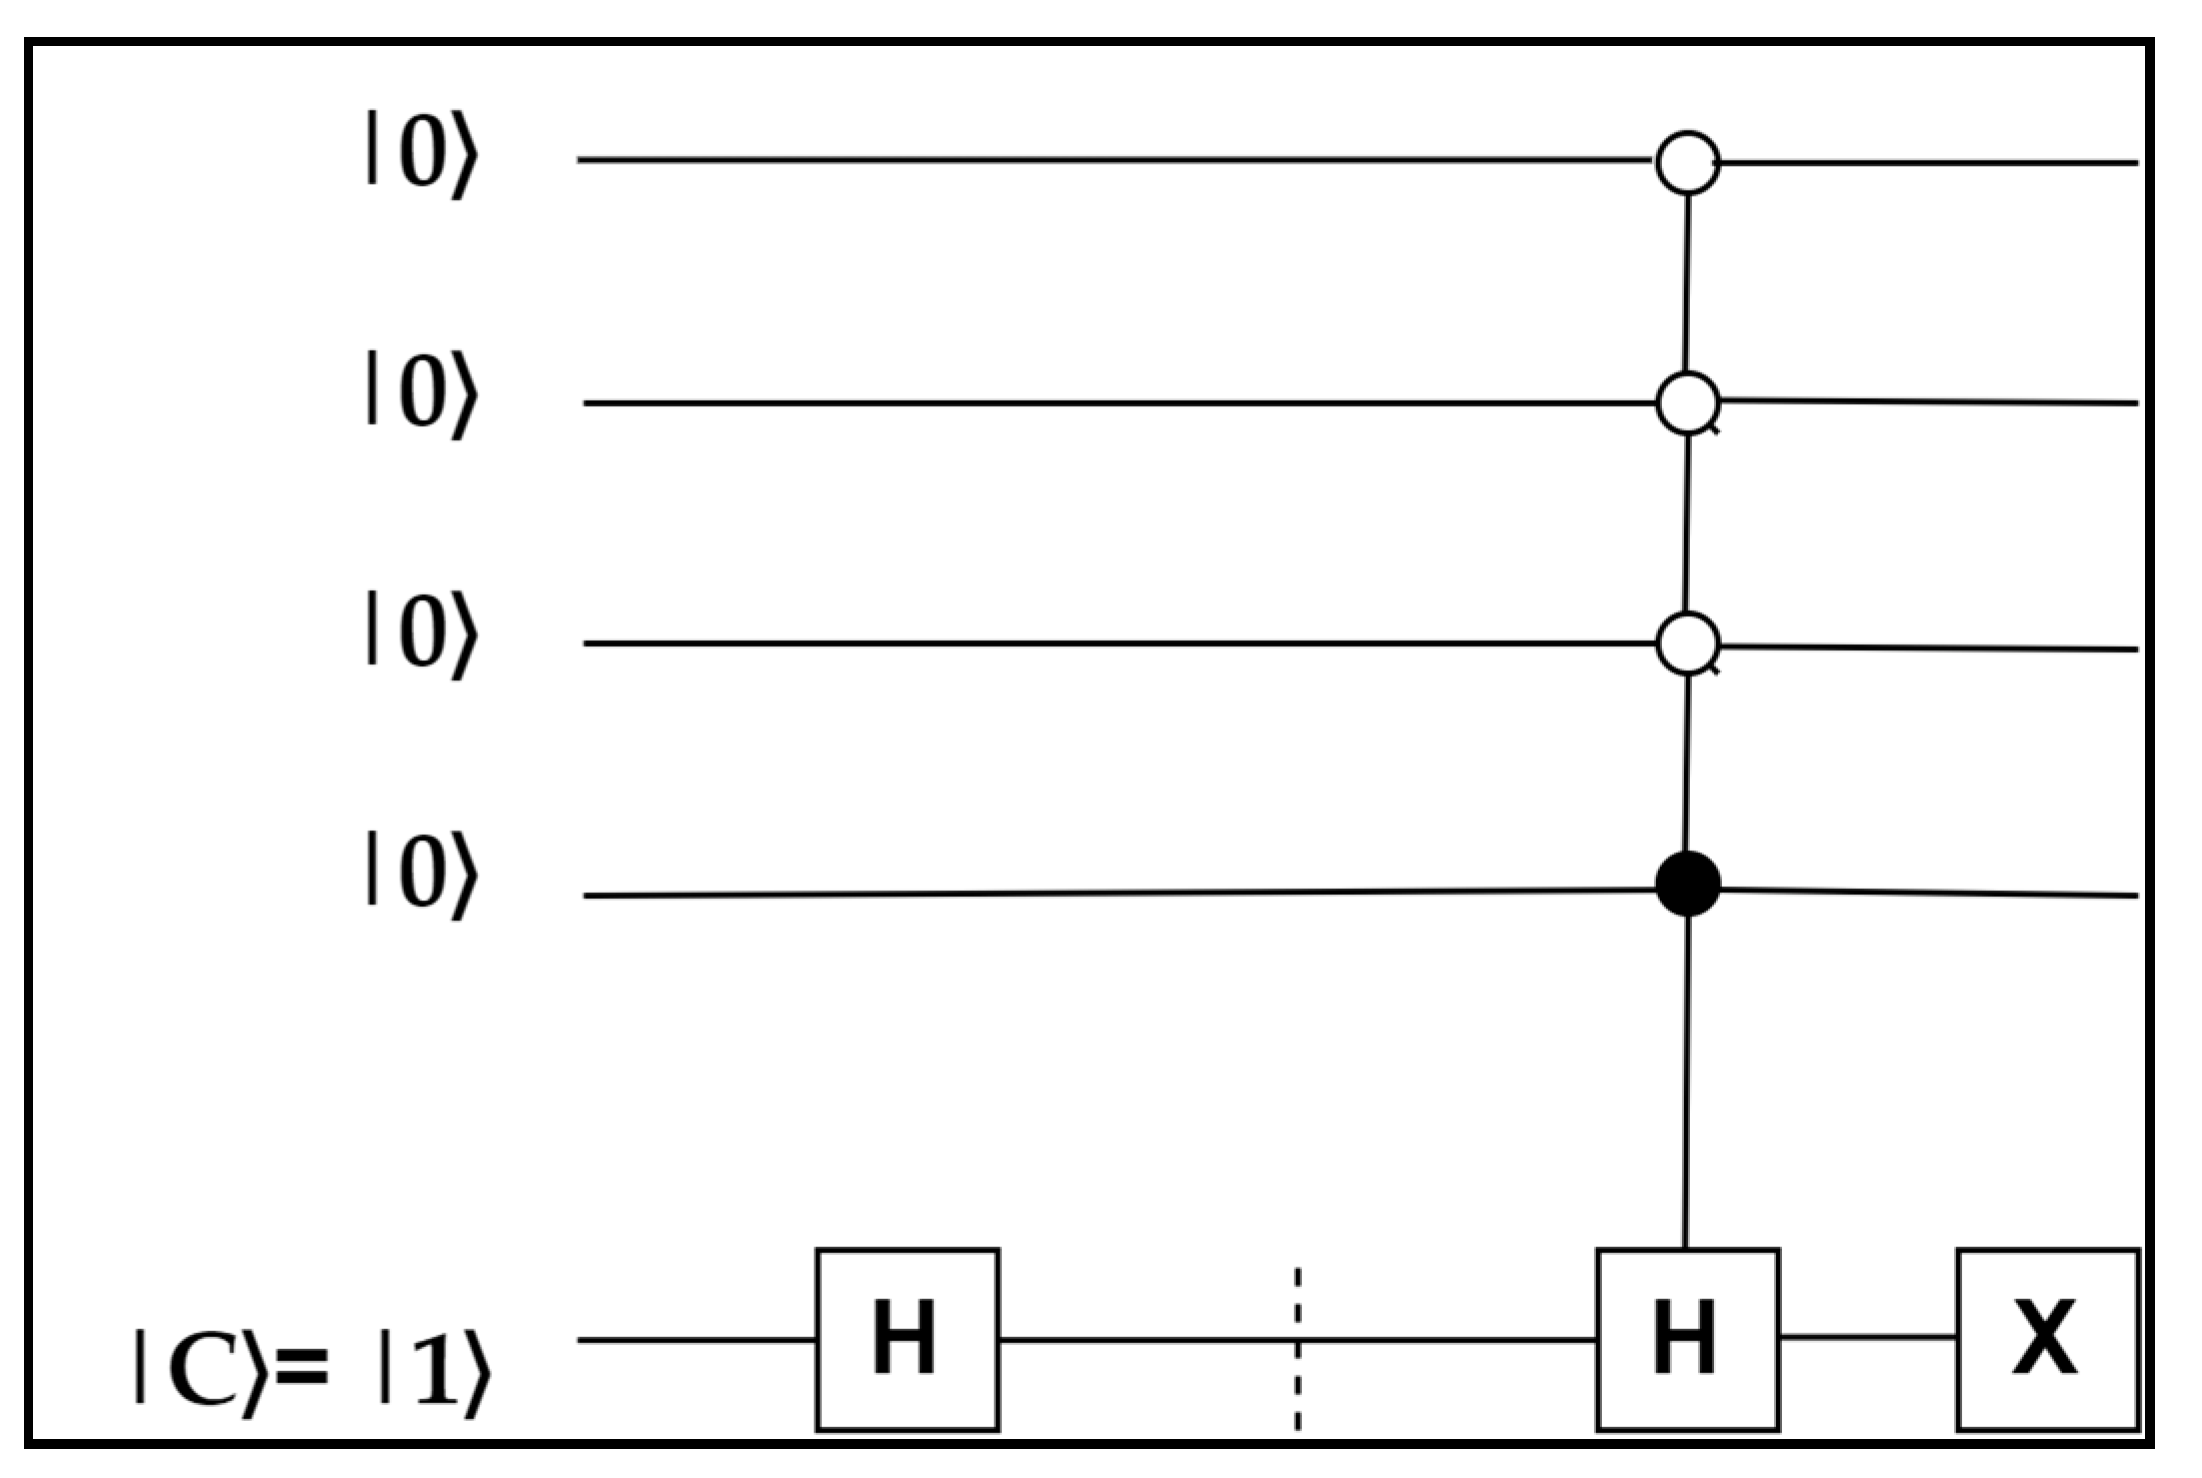
Figure 6, when the H gate is applied, the state becomes the
state, and after applying the H gate and X gate consecutively, the final output is the
state (
Figure 7). At the end, apply the measurement to see whichstate the datapoints are in.The cluster assignment, which is a visual depiction of the label assignment, is shown in
Figure 8.
To apply label 1 or centroid 1, a
state is formed. To apply label 2 or centroid 2, a
state is created.
Table 4 shows that the centroids K
1 and K
2 belong to clusters C
1 and C
2, respectively.
3. Results and Observations
This section demonstrates the performance of the QK-means algorithm with two different datasets, i.e.,the Mucormycosis and cardiovascular datasets (
Table 5). The experiment shows the unsupervised learning to get the C number of clusters (C = 2 or C = 3). The clusters are then evaluated by the similarity measures to show the cluster quality and clustering with the defined clusters. We first discuss the clustering results from the small mucormycosis dataset (synthetic dataset) and then discuss the cardiovascular dataset. The accuracy rate (A) (Equation (10)) shows the comparison between the different classical and classical-quantum algorithms.
where
n(
Xk) is the number of the quality cluster
k and
n is the total number of datapoints. The good clustering performance has the higher accuracy rate.
We measured all the data, which were calculated by observing the probabilities in order to obtain the clusters. We employed quantum circuits to store the clusters in the quantum data state and we also used the SWAP test to measure the Euclidean distance. The quantum component evaluated these two stages. The centroid (cluster centre) value was first defined (i.e., k = 2), and these two centroids were then labelled as label 0 and label 1. When the input data were labelled with the combination ofanti-control and NOT operations, itwas categorized as cluster 1 (label 1) and cluster 0 (label 0). It was crucial to first set up a circuit for the final output (
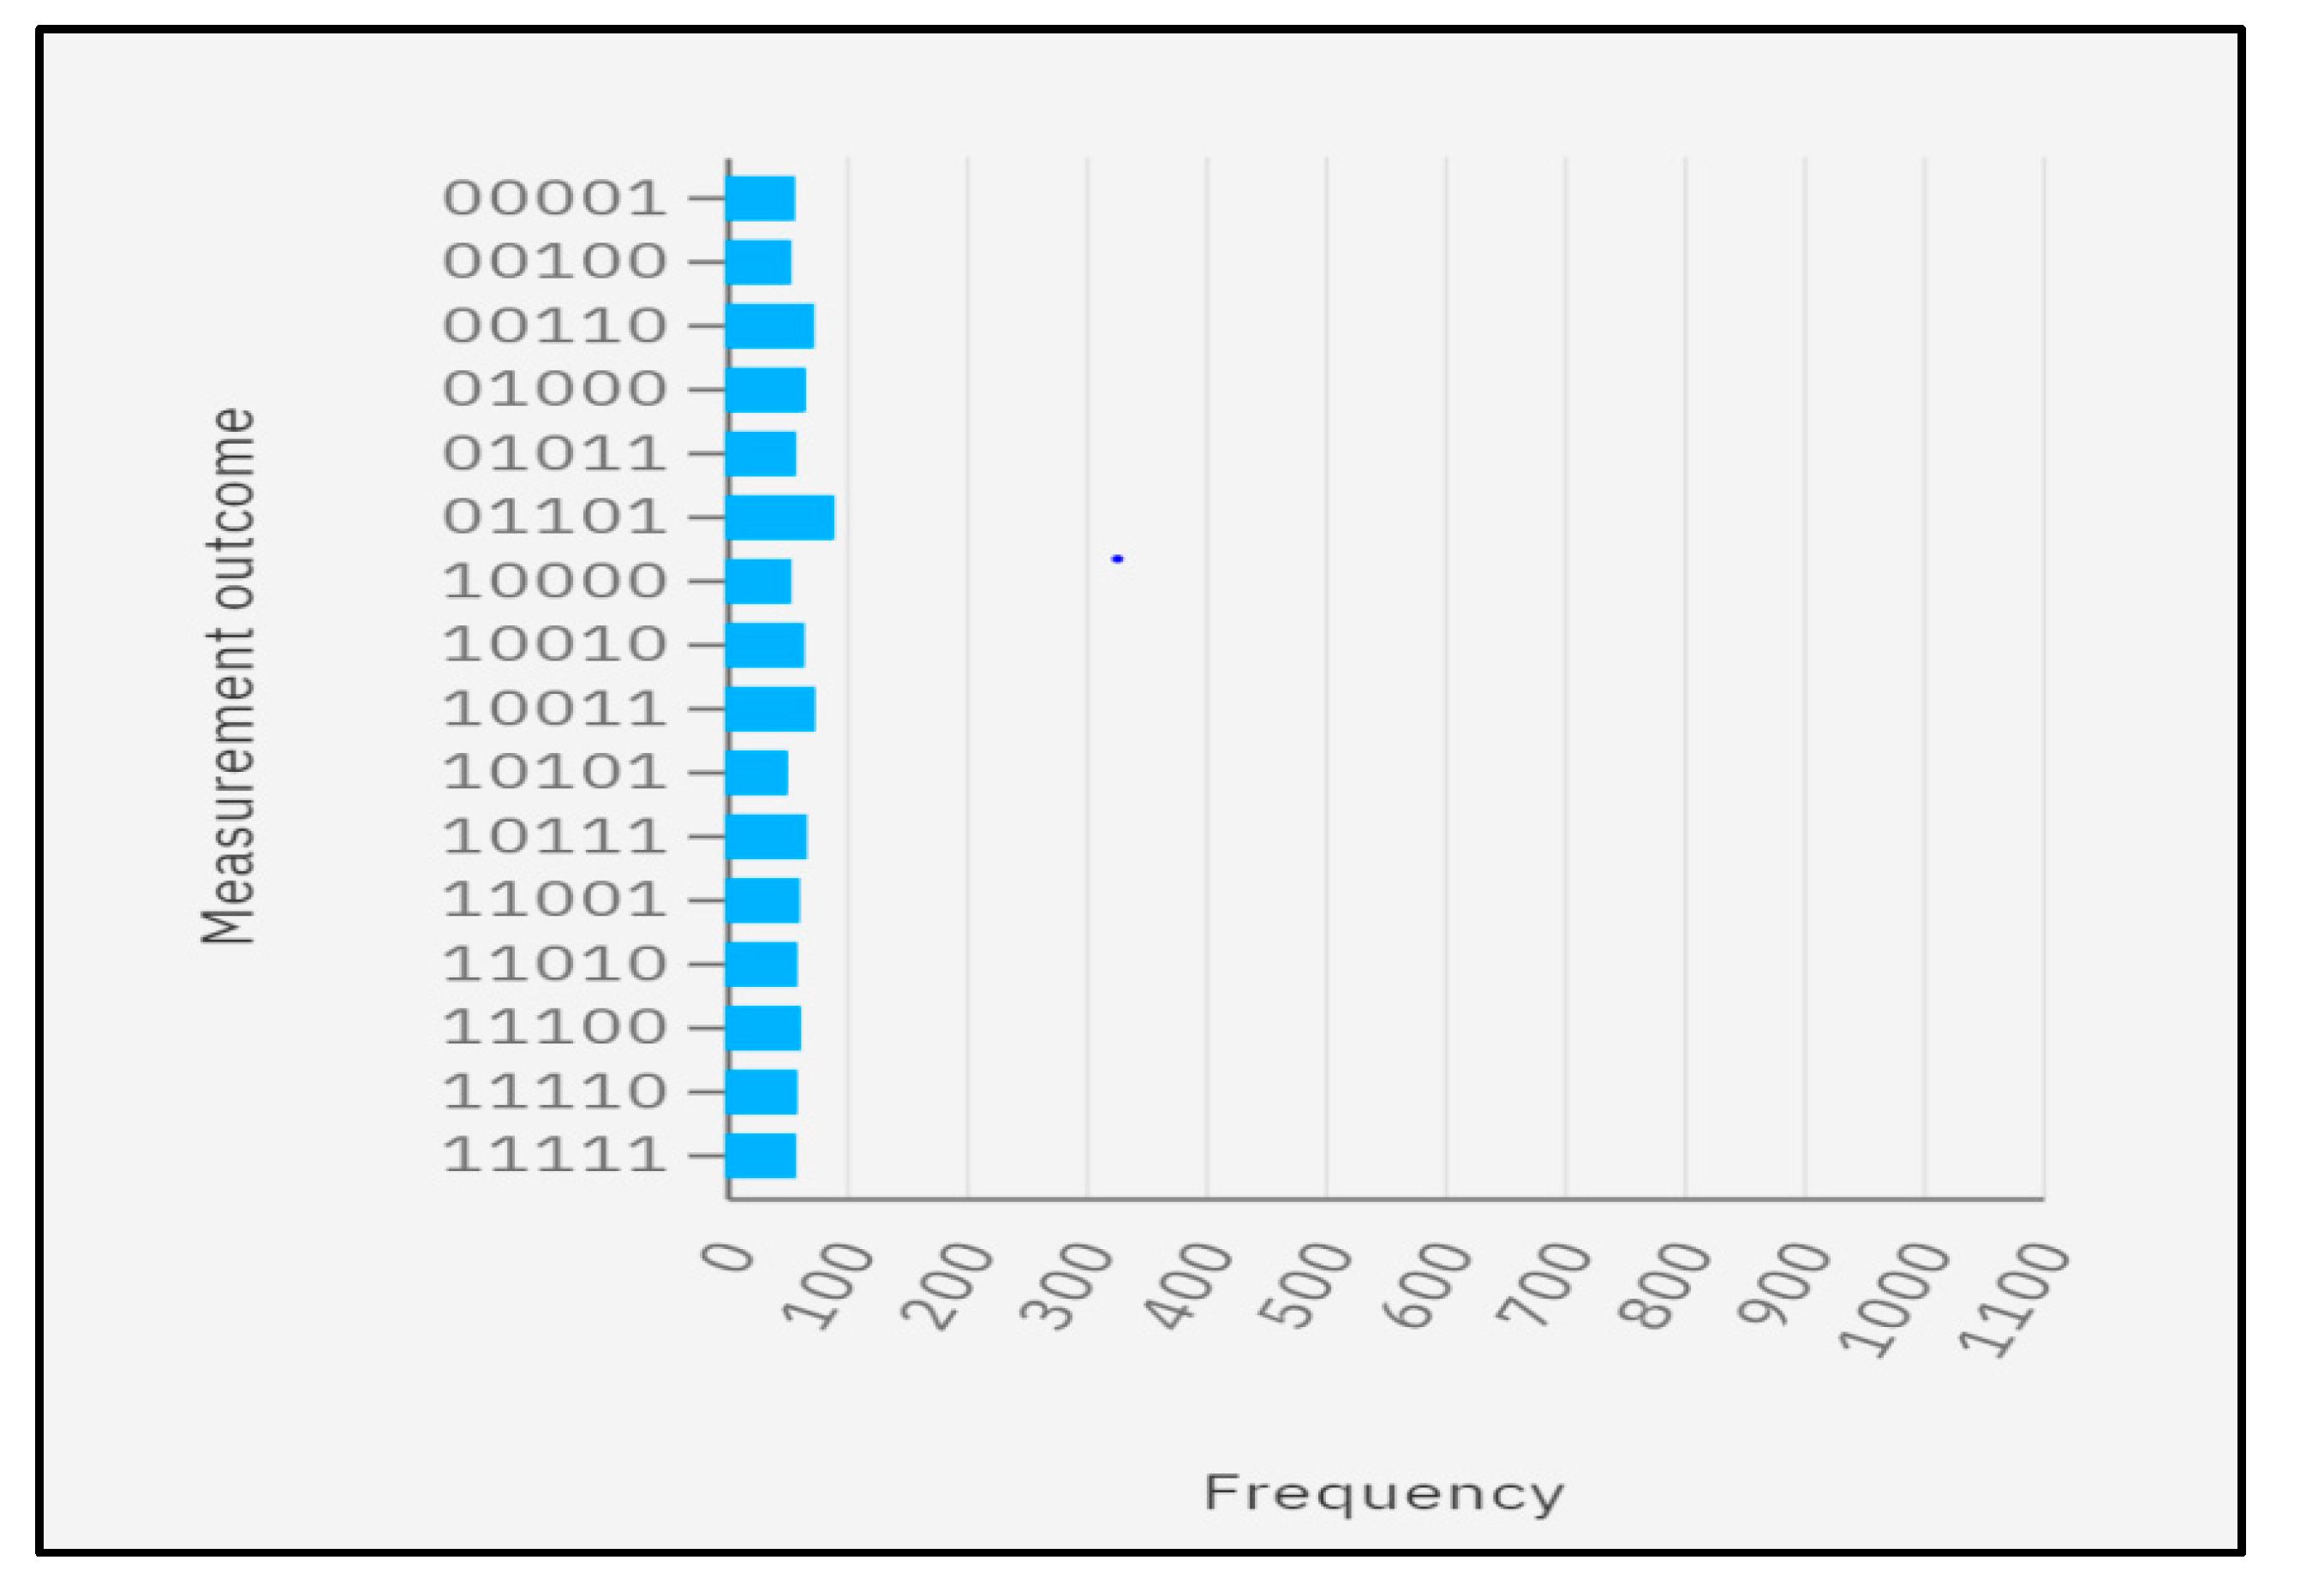
Table 6), and only then wereall the qubits measured. All of the states resulted from the H operation with equal likelihood.Using these steps, we gained the following two advantages:
We assigned the labelling of the centroid to the states with four qubits during the cluster assignment stage. As a result, the circuit’s centroid labelling was used to assign the clusters. The circuit was created using the control NOT instead of the operation. The necessary qubit was the sum of all the classical registers. The measurement result was 00001, which denoted a cluster assignment of 0 (read from left to right) and a datapoint of 0001 (read from right to left) (
Table 6). The synthetic input dataset contained the most datapoints and belonged to label 2. (C2). These datapoints were therefore given label 2 first, followed by label 1 for the remaining datapoints. Based on the likelihood determined by the QASM simulator (
Figure 8). The measurement’s probability demonstrated that the cluster assignment was done correctly (
Figure 5). By computing the distance between the clusters and the datapoints, the datapoints were assigned to the matching cluster. According to the results fetched from the QASM simulator, the datapoints
,
,
,
,
,
,
and
belonged to cluster 2 (C2) and the datapoints
,
,
,
and
belonged to cluster 1 (C1).
Final Output = .
3.1. Results on Mucormycosis Dataset
The paper showed the implementation of a quantum clustering algorithm, i.e.,the QK-means algorithm on a small dataset (a Mucormycosis dataset containing 16 datapoints), and the performance was compared with the classical k-mean algorithm (
Figure 9). The size of the feature space affected the QK-means algorithm’s completion time. It was presented thorough an examination of the QK-means algorithm, which depended on the characteristics of the data matrix.
The final result also implied that the improvised version of the QK-means performed much better than the k-means algorithm overall. Depending on the circuits and noise model, different simulation methods were available. The state console computer was described by a vector with 2n elements, what we call the statevector. The state vector simulator supported the additional configurable options and the advanced simulation methods. The instructions and gates were applied to simulate the quantum circuits by using the wave function of a statevector and also had the potential to support the general noise modeling. IBM providedthe high performance QASM simulator for simulating the quantum circuits with and without noise.
3.2. Cardiovascular Dataset
A dataset from Kaggale.com was chosen in order to predict whether a person has cardiovascular disease [
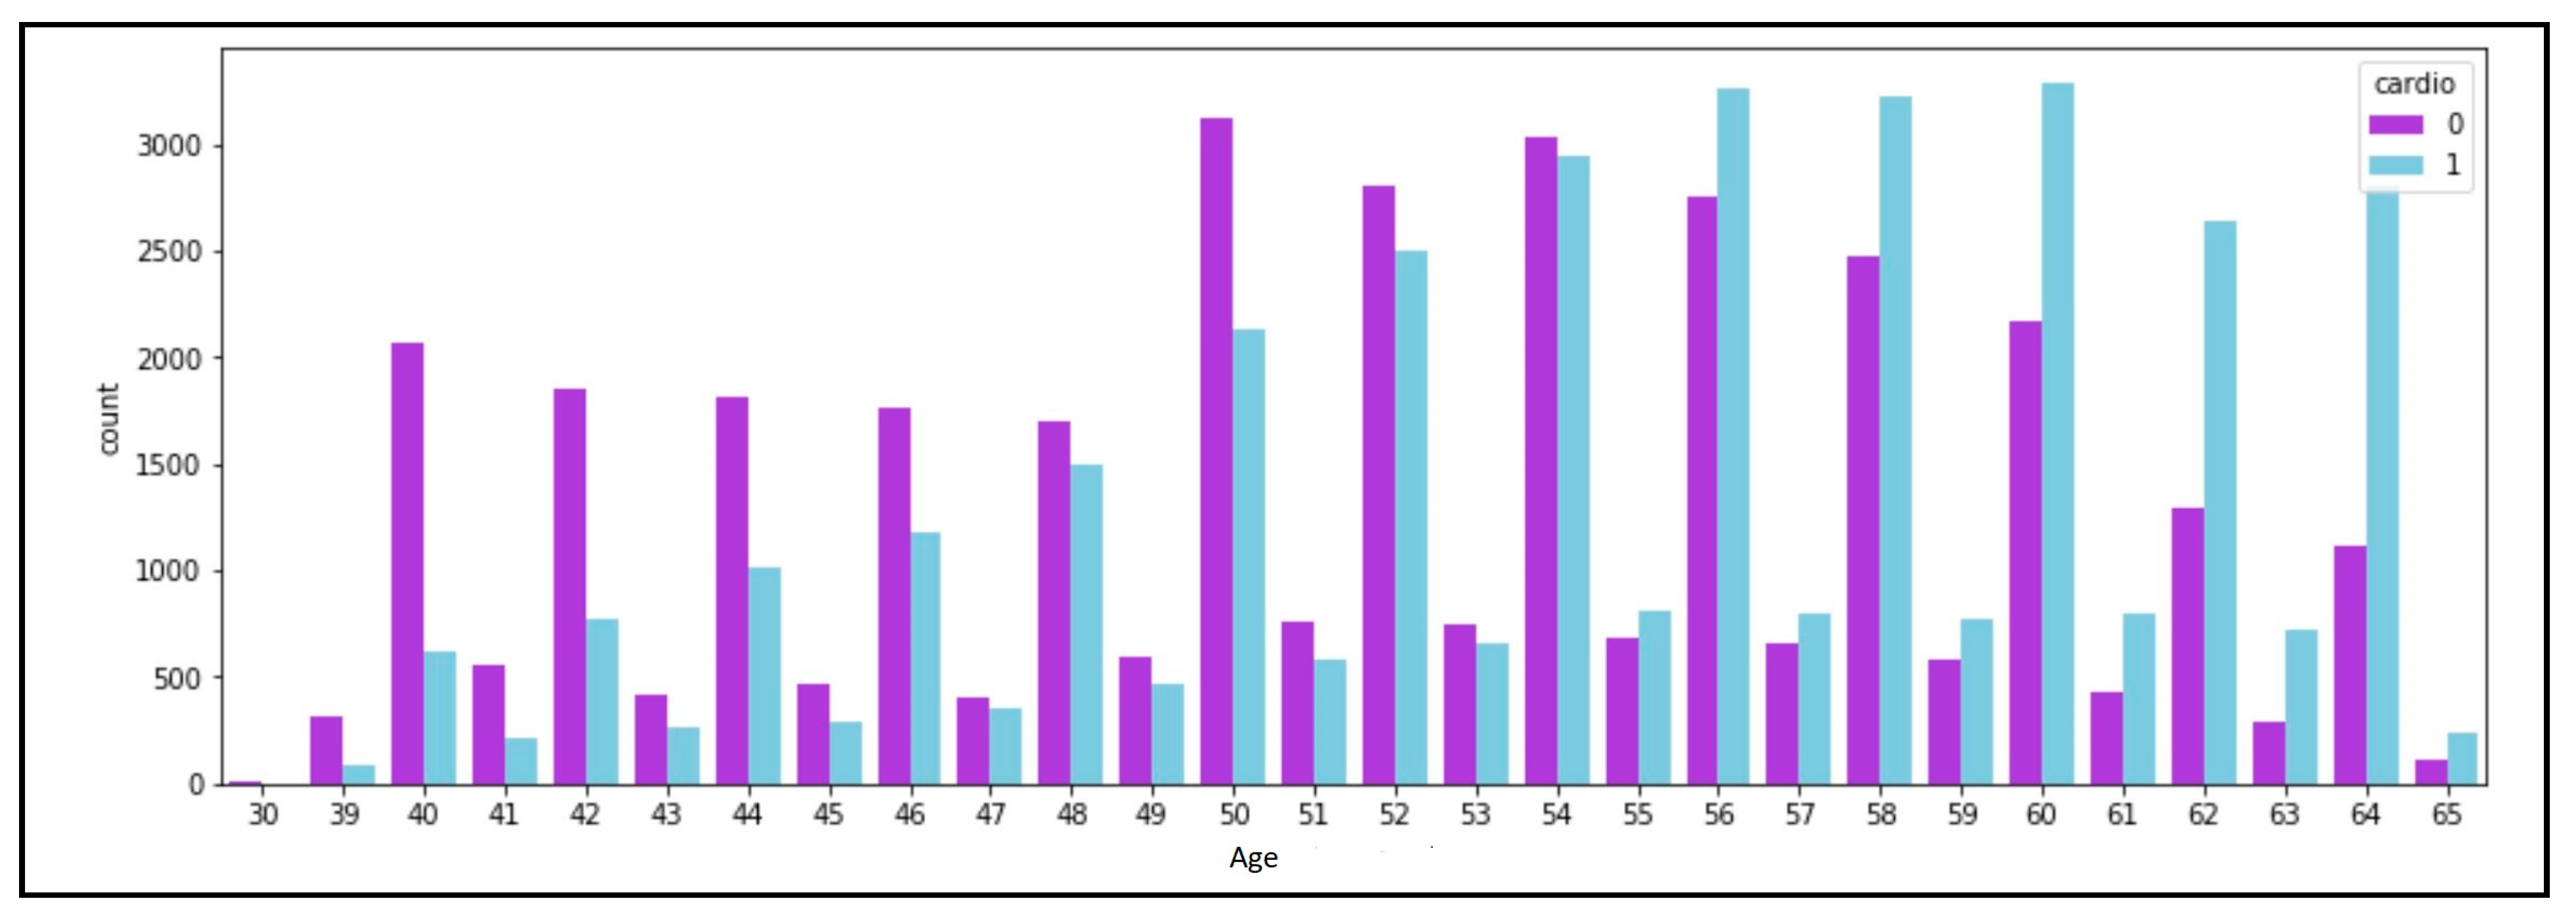
37]. This dataset included three different categories of data: factual information, examination feature results and patient-provided information. Additionally, the category and numerical data was separated from the dataset’s data. The original dataset comprised 14 characteristics and 70,000 data instances. To compare the association between the age groups and cardiovascular disease, a graphical depiction was created (
Figure 10). The graphic displays a bar chart with the number of persons on the Y-axis and their age in years on the X-axis.
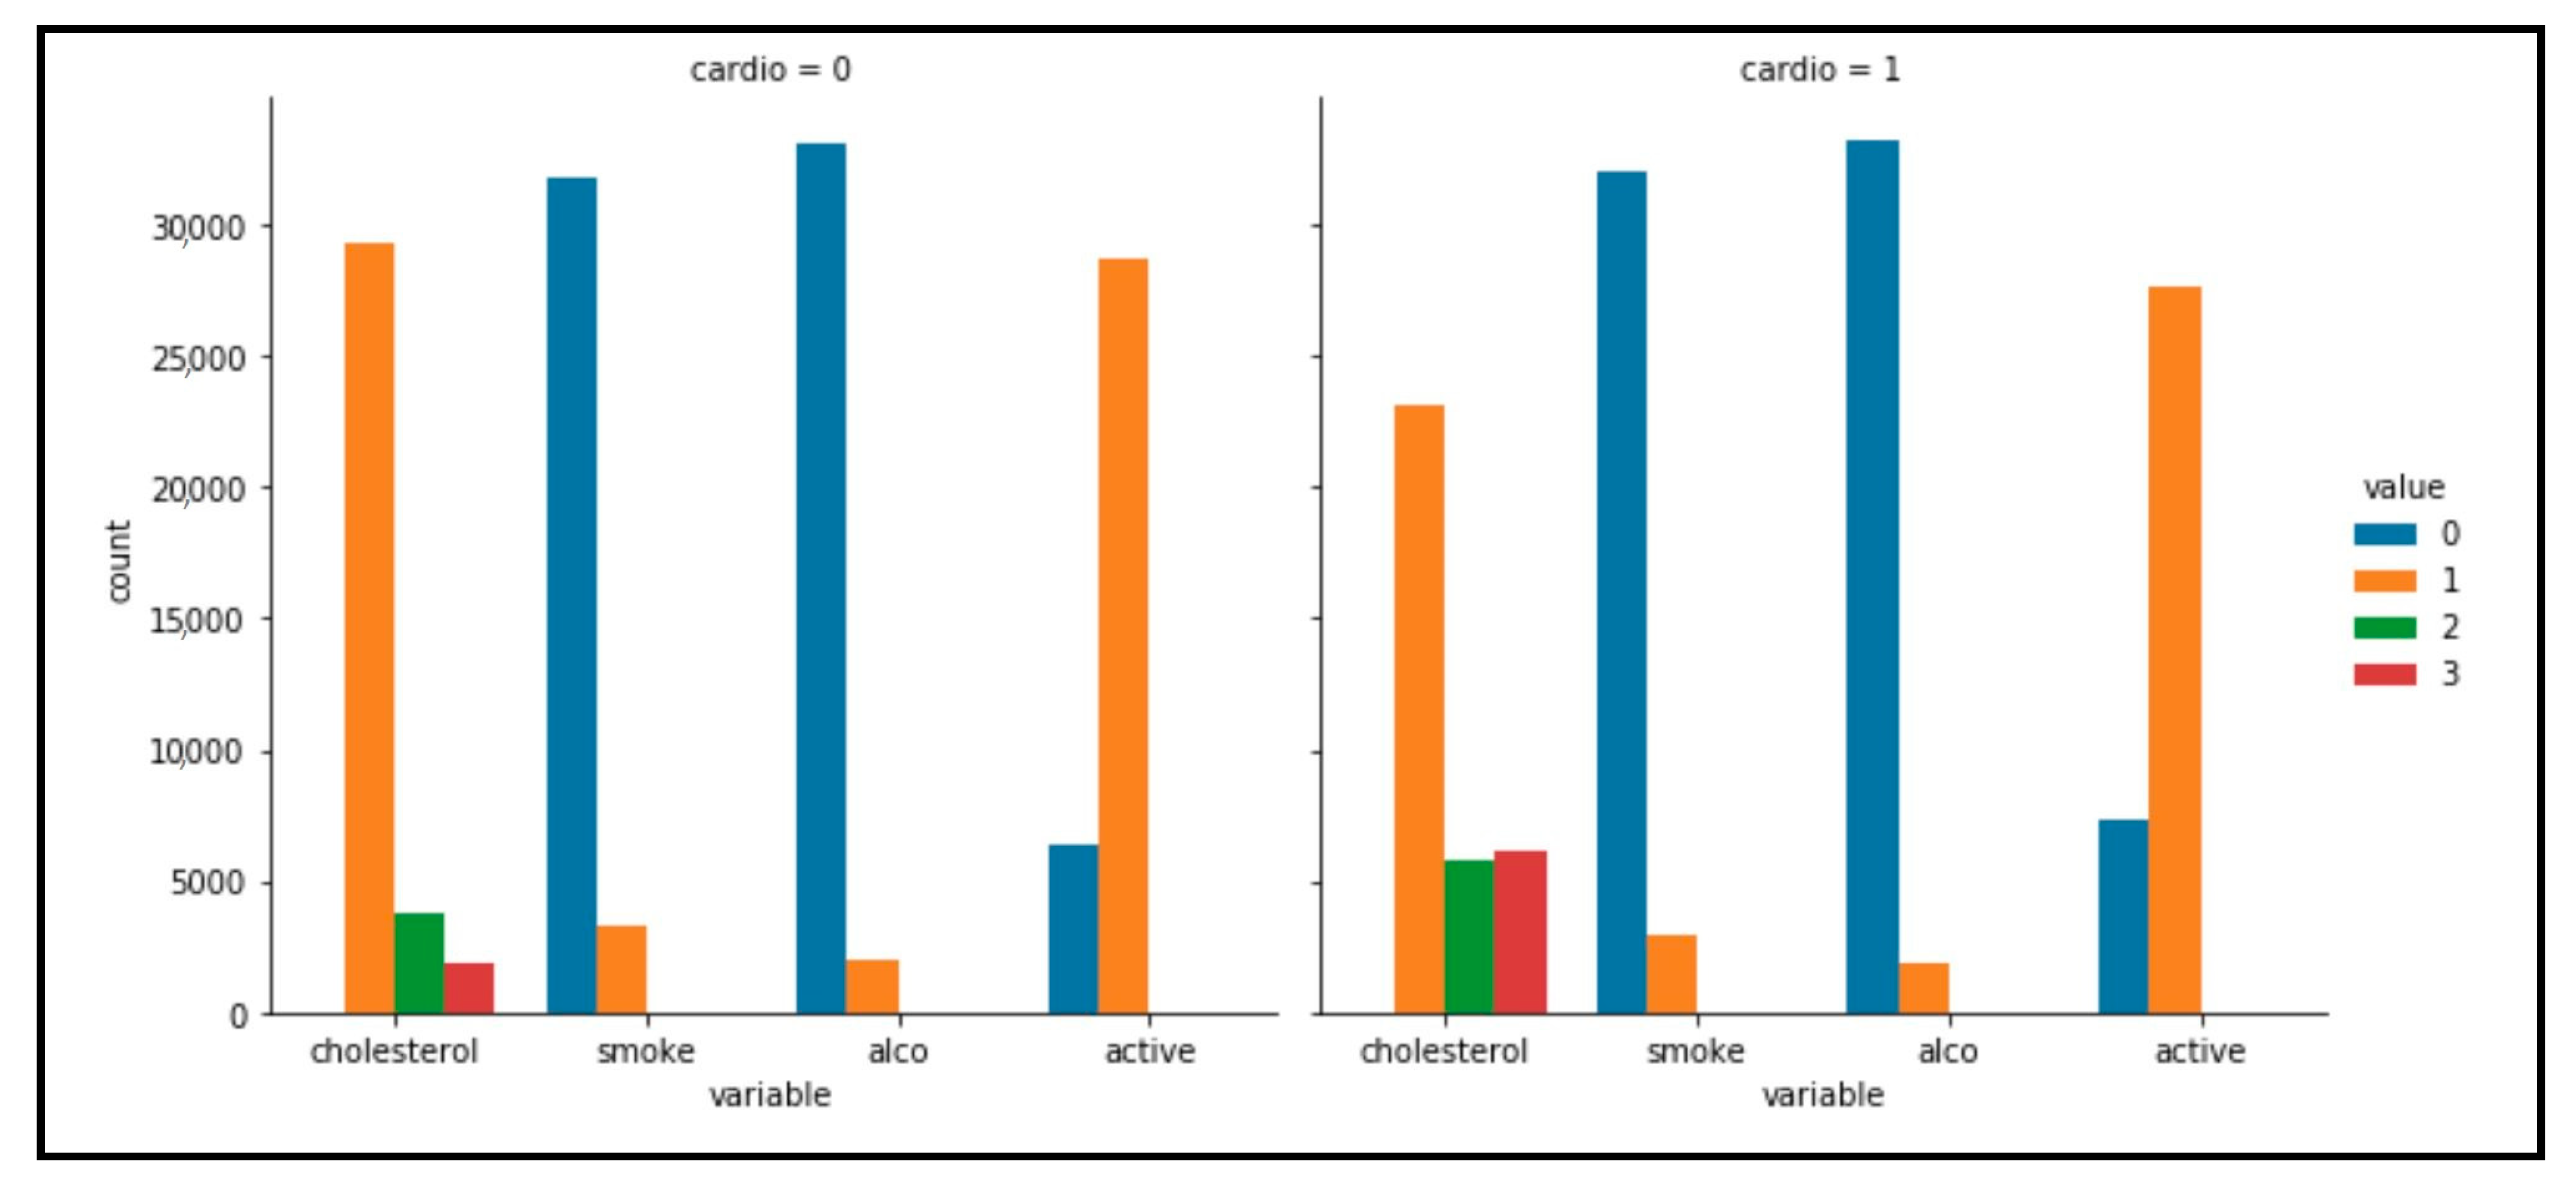
Figure 10 represents those with cardiovascular illness withthe color purple, while those without the disease are shown in blue. People in the age range of 56 to 60 were definitely more susceptible to the condition, as shown by the graph. Additionally, as shown in
Figure 11, a visual analysis of the categorical data distribution was carried out. The bivariate study discussed above demonstrated that the individuals with cardiovascular disease had higher blood sugar and cholesterol levels than non-sufferers. By eliminating the outliers, irrelevant data were omitted and the dataset was made more representative. Diastolic blood pressure (ap_lo) cannot be greater than systolic blood pressure (ap_hi) since the former refers to the pressure in the arteries between heartbeats, while the latter measures the greatest pressure the heart can exert while pumping. Additionally, blood pressure is the numerical difference between systolic and diastolic blood pressure; it cannot be minus. By taking into account these details, the anomalies from ap_hi and ap_lowere eliminated in order to remove erroneous blood pressure data. We observed an updated dataset with a new decreased number, which was equivalent to 6000 quantities ofthe dataset after the data cleansing process. We employed the amplitude encoding approach and the U3 gate to encode the features of the datapoints after cleaning the classical data with the help of classical preprocessing techniques to focus on the significant patient characteristics. Age, cholesterol, smoking, alcohol consumption and physical activity were the cardiovascular data characteristics we focused on. The amplitudes or features were arranged in a block sphere, and the quantum state was subjected to quantum processes to produce the clusters. The QK-means algorithm performed well on the data related to cardiovascular disease.
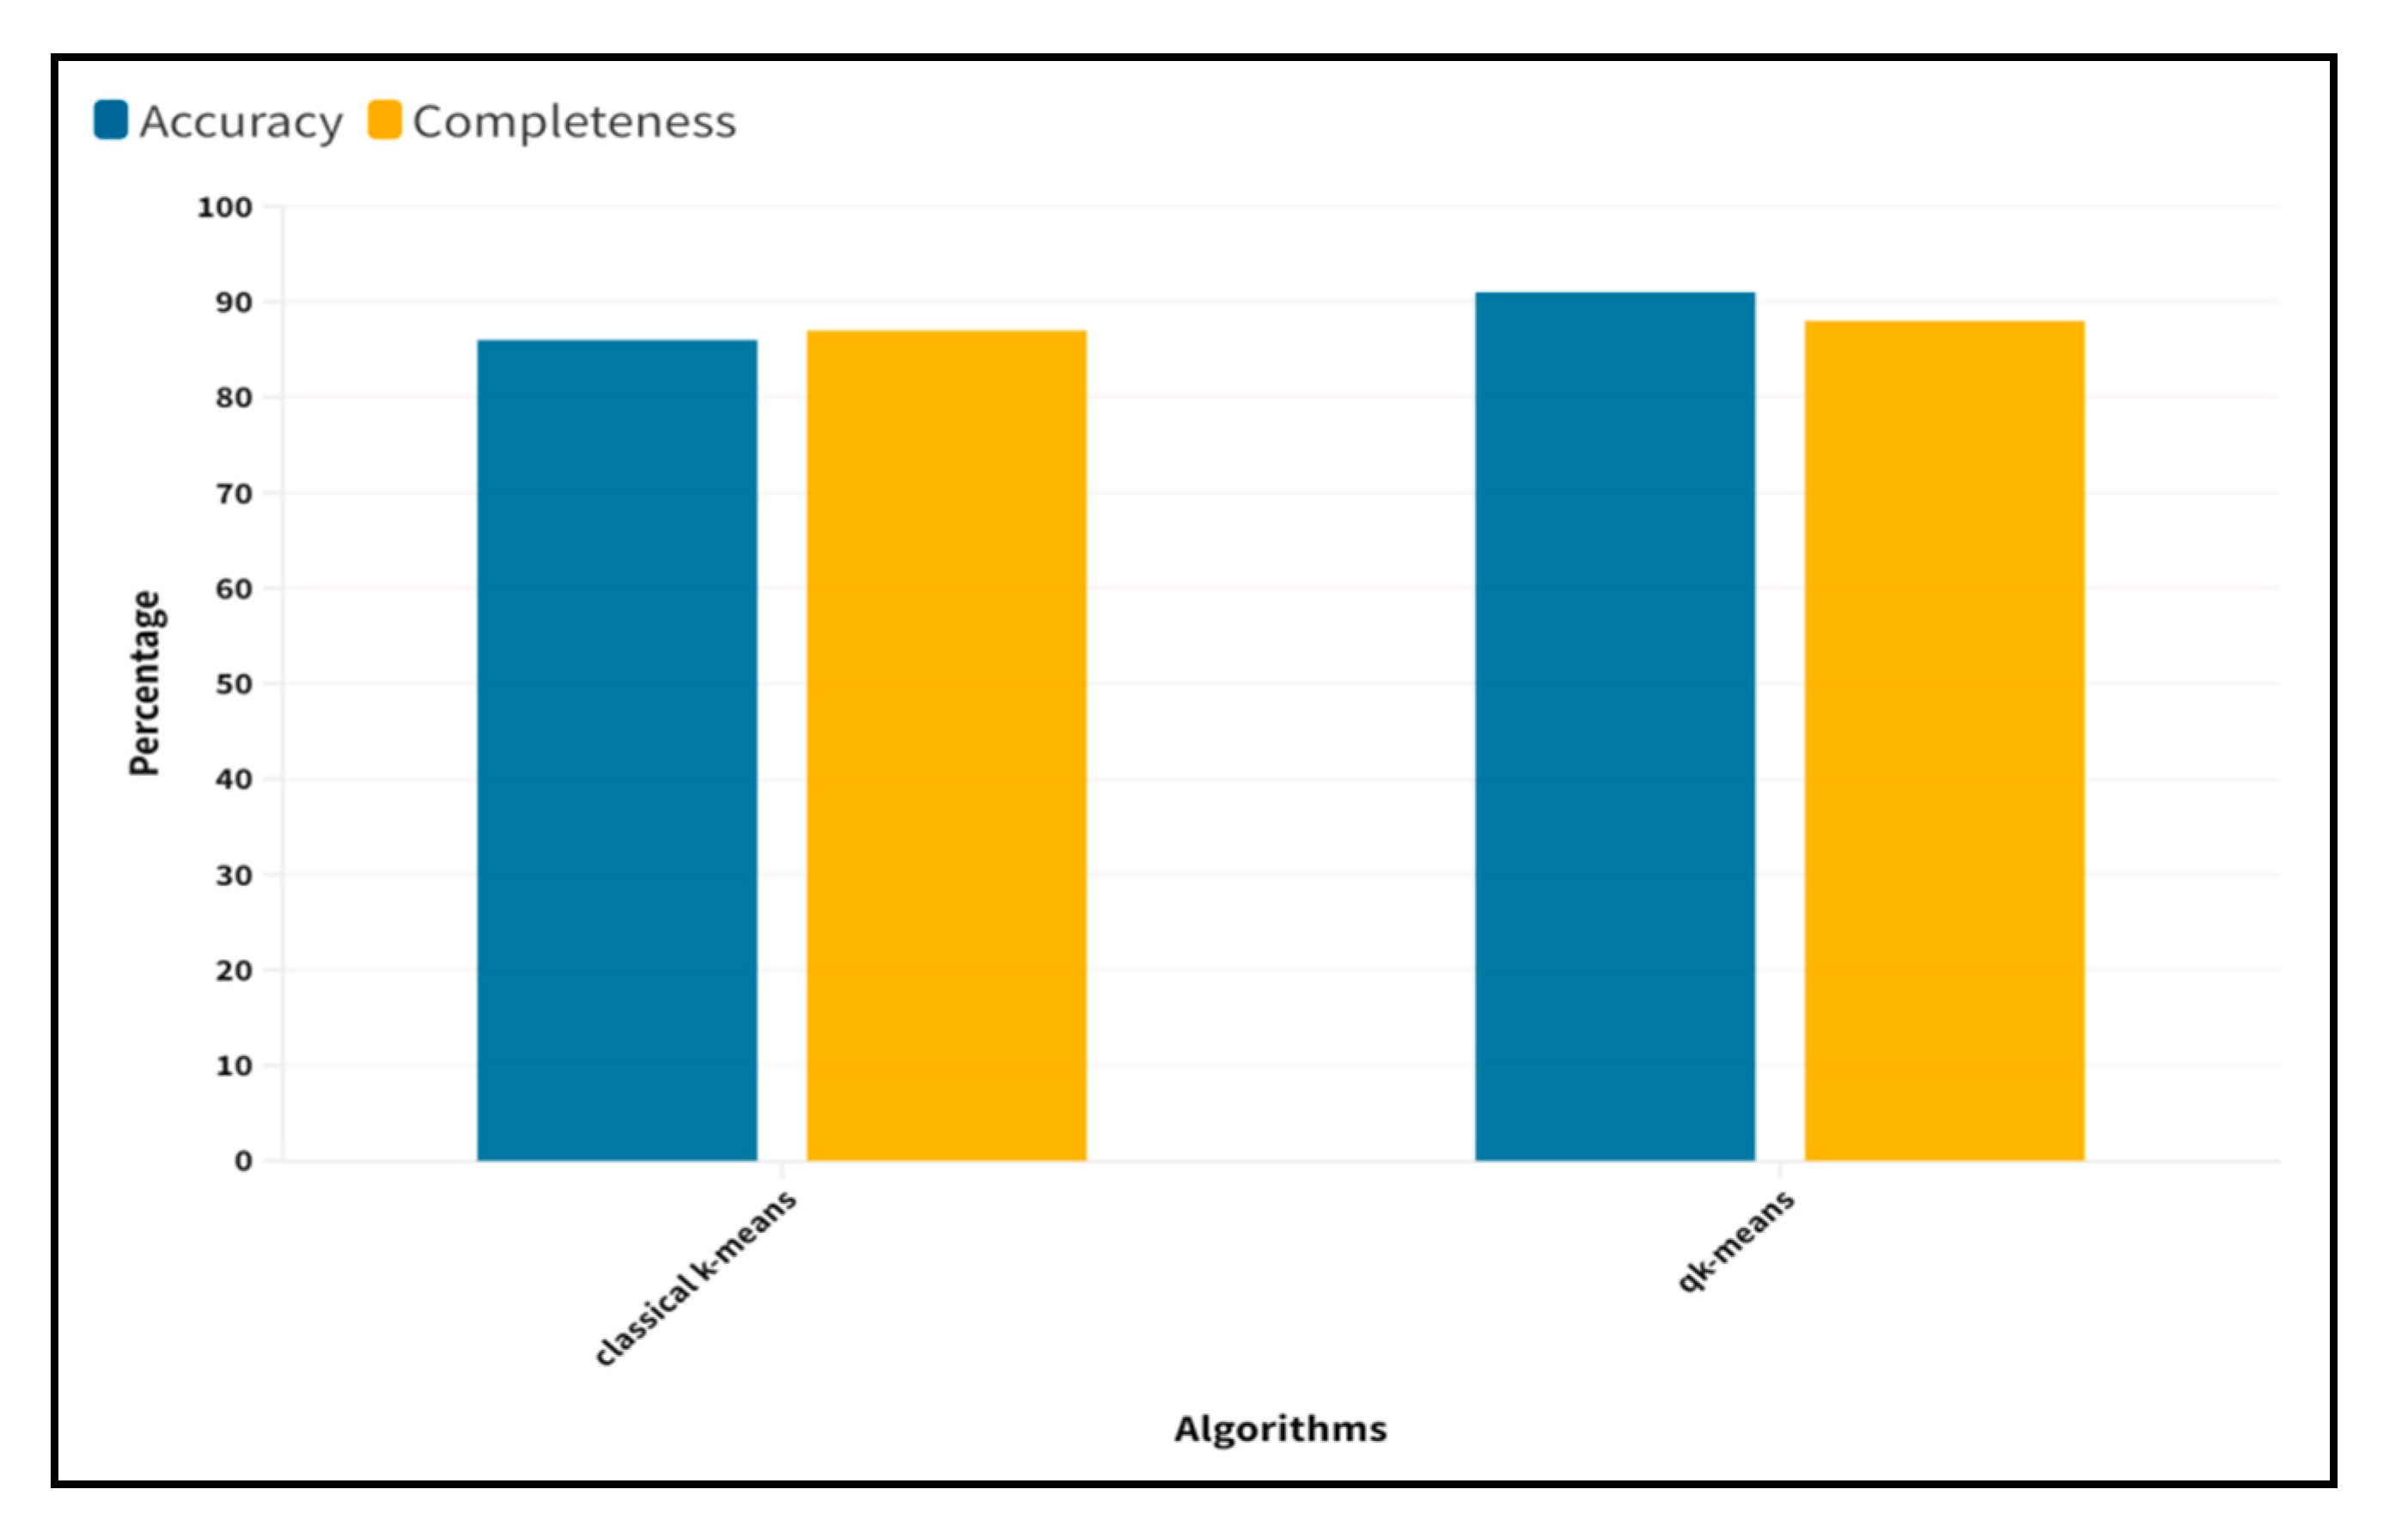
Figure 12 presents the accuracy metrics for the QK-means algorithm’s performance. Recent literature [
38] provides a more detailed description of the measures used. The classical counterpart of the QK-means algorithm obtained an 82% accuracy, but the classical-quantum QK-means method achieved a 91% accuracy in clustering the input cardiovascular disease data, according to a comparison of the classical k-means, k-means ++ and the QK-means algorithms. Finally, we showed that the QK-means converged more accurately than the classical clustering techniques (
Figure 12). It was made possible due to the fluctuations that occurredmore quickly from the fleeting equilibrium of the clusters.
4. Conclusions and Future Direction
Quantum computing and its algorithms are being extensively used and effective in various applications. Looking at the track records of the quantum computers that provide exponential speedups and reduced work time, they are one of the first preferences of researchers all over the world. This added advantage of speedups proves to be a game changer for machine learning algorithms since training a data model is usually a time consuming process, as it involves a big deal of manipulation for the vectors. Hence, with newly emerging applications for machine learning models, a great deal of interest to improve the existing training algorithms has been noticed.
This study described a quantum adaptation of the classical k-means algorithm. In addition, we discussed how scaling would be possible in relation to the present iterations of the k-means and k-means++ clustering algorithms. Initially, it was discovered that complex datasets and tensor products may be deployed and computed quickly on quantum computers. However, there are other restrictions that also appliedto this situation regarding noise and qubit coherence durations. These restrictions were also the reason for the ineffectiveness and decreased precision of problem-solving. In this research, we demonstrated the quantum implementation of the k-means algorithm on the IBM quantum QASM simulator using the SWAP test. To significantly improve the k-means technique, we constructed quantum clustering through employing intricate quantum circuits and a variety of quantum operations. The result in
Section 4 demonstrated that the classical-quantum clustering QK-means algorithm outperformed the existing classical k-means and k-means ++ algorithms in terms of cluster quality and accuracy.
The QK-means algorithm’s limitation was that it must repeat each step when a new data series was added. After gathering the necessary data from the current clustering and existing dataset, the incremental clustering was applied to the incremental data. Without constantly scanning the dataset and executing the algorithm, the new data was matched in the already-existing clusters or formed in a new cluster. To overcome the classical problem in the QK-means, the quantum incremental k-means algorithm can be used. The steps of the proposed quantum incremental k-means algorithm are as follows.
Step 1: Estimate the centroid distance with the help of superposition.
Step 2: Perform entanglement to calculate closest distance between the datapoints and the centroids.
Step 3: For the centroid state, measure the label register and carry out the matrix multiplication.
Step 4: Using quantum tomography, update the calculated centroid.
Step 5: Repeat the steps until the formation of all clusters is achieved.
Steps 6: As new data arrives, use quantum parallelism for the best match.
In this study, we discussed the possibility of using quantum clustering techniques for two types of healthcare data which includeda lower number of features. In the future, we will work on the complex feature-rich dataset (i.e.,a large number of features). The quantum incremental k-means algorithm offered a different approach to learning from the data and aids in finding the needle in a multidimensional dataset. On such data, which exhibits exploitable separations, diverse densities, etc., the quantum incremental k-means method performed well. The quantumplatform enabled the development of a network of connected devices and electronic components by utilizing wireless hardware that was built from the ground up and a cutting-edge user interface. The incremental k-means algorithm and quantum platform, two emerging quantum technologies, will open previously unseen doors in science when combined.


