1. Introduction
As the demand for vehicles continues to grow, the roads are overflowing with new vehicles at an extremely fast rate. For the same reason, the rate of pollution is increased swiftly [
1]. Although, due to the development of technology, IC engines are becoming less common and the amount of pollution has lessened, even from the existing data of various studies, IC engines are still the primary source of pollution after electricity [
2].
Electrification is being adopted into the heavier vehicle forms apart from passenger cars, and it is driven by various factors. Some of the motivation factors for this research are summarized here:
Depleting fossil fuels availability [
3].
The recent evolution in battery technology is making electric commercial vehicles technically and commercially feasible [
4]. Additionally, the price tag for electric vehicles is expected to fall continuously courtesy of falling battery costs [
5,
6].
There is an increase in the availability and capacity of public charging infrastructure [
6].
There are similarities between the powertrain architecture, structure, and components among light-, medium-, and heavy-duty vehicles as compared to those of much more technologically mature personal electric vehicles. Very recently, battery, pantograph, or fuel cell technology has matured enough to turn long-haul heavy electric trucks into a viable alternative to standard ICE trucks [
7].
Half of all trucks operating in the EU travel distances of under 300 km. These journeys can now be completed by electric trucks thanks to the new models currently on the market with a range of about 300 km (enough to make nine out of ten journeys). The range of existing electric trucks is expected to rapidly increase to 500 km, with the trips covering about two-thirds of the driven kilometers and 19 out of 20 trips [
8].
Further modelling and analyses are needed in the area of electrification to perfect the drive cycles of electric vehicles [
9,
10].
EMs are an integral part of either the full-time or part-time propulsion of the electric vehicle. With battery prices being expected to drop significantly in the next decade [
11], it is extremely important to address other components as well. The objective of this research paper is to evaluate what type of EM topology is suitable for electric commercial vehicles without compromising on their performance and costs concerning the suitable EM topology/design.
2. State-of-the-Art Technology
The current literature offers methods to design e-machines using various parameters and calculations, however, there are no studies wherein we can gain an initial understanding of the cost of the e-machine that is being designed.
In an electric powertrain, electric energy is converted into mechanical energy by the electric machine (EM), and then, it is transmitted to the drive shaft, which is mechanically coupled to a mechanical reduction, such as a gearbox or a differential, or it is sent straight to the wheels [
12]. A range of diverse machine types or topologies has resulted from the development of EM for various application use cases. In general, electric vehicles can use any known EM topology.
EMs supply power and torque to the wheels for propulsion in electric vehicles. Compared to an internal combustion engine, the efficiency of energy conversion by an EM is higher. With improved torque characteristics at lower speeds and instantaneous power ratings of two or three times the motor’s rated power, an EM provides high torque and a large power density. During the braking of the vehicle, the EM turns in the opposite direction and converts mechanical energy into electrical energy, which is known as regenerative braking [
13].
The selection of EM that drives the electric vehicles is a critical step that demands careful consideration. The automotive industry is still on the lookout for the best EM drive for EVs given the broad variety of topologies and individual EM designs available and the difficulties to characterize or standardize the requirements of the electric powertrain without over-dimensioned components. It is thus crucial to understand the requirements of the powertrain, and particularly, the EM.
The most basic demands for EMs are as follows [
14]:
A high-power density.
High torque at low speeds during the beginning of the journey and ascending and high power at high velocities.
An extensive speed range through a constant power area.
A low level of operational noise.
High efficiency throughout a wide speed range with steady torque and power levels.
Excellent regenerative braking efficiency.
A small size, a low weight, and a lower moment of inertia.
Excellent reliability and resilience for a variety of vehicle operating environments.
Cost efficiency.
Every EM has different highest efficiency operating points, which are dependent on a variety of design characteristics. For example, permanent magnet synchronous machines (PMSM) are preferable for applications near the rated speed and higher torque ones, whereas induction machines (IM) are better at higher speeds [
15]. In comparison to passenger electric cars, the EM design for heavy-duty trucks must be changed due to the required high start-up torque but low speed requirements in the main operation points.
To start the analysis, the four most relevant EM topologies for the mobility applications of EMs were categorized, and these are the asynchronous motor (ASM)/induction motor (IM), the permanent magnet synchronous motor (PMSM), the externally excited synchronous motor (EESM), and the switched reluctance motor (SRM), which were analyzed to select the topology that best suits an EV and an electric commercial vehicle (eCV) application. Several performance characteristics such as the power density, efficiency, cost, noise levels, and control systems of the different electric machine types were examined, and a conclusion was made. The regenerative braking was assumed to be the same for all of the EMs. The results of this comparison are in
Table 1.
Long-haul commercial vehicles must meet three vital criteria: low operation costs, high payloads, and range. A PMSM is usually favored for high-torque and low-speed applications due to the high efficiency areas of a PMSM that account for less power consumption and thus, the increased range of the vehicle compared to reduced efficiency and range due to the large magnetizing currents incurred in an IM and the consequentially high excitation losses in this type of machine.
Therefore, based on the comparison table and the critical performance requirements of electric commercial vehicles, the PMSM was selected to perform the analysis.
2.1. Selection of PMSM Topology
A PMSM runs as a synchronous machine when the air gap flux and stator windings are distributed in a sinusoidal pattern. PMSM’s rare earth magnet material helps to boost the flux density in the air gap, the power density, and the torque-to-inertia ratio, allowing it to run at a wide constant power speed range [
13].
The surface-mounted permanent magnet synchronous machine (SPMSM), in which the permanent magnets are attached to the rotor’s surface, and the internal permanent magnet synchronous machine (IPMSM), in which the magnets are inserted into the rotor, are the two types of PMSM rotors [
18].
Because of its simple production method, the SPMSM is quite affordable, and it also demonstrates high torque, although it experiences mechanical instability [
19]. Eddy currents, on the other hand, can heat the magnets and cause irreversible demagnetization. Furthermore, to prevent the surface magnets from becoming detached at high rotational speeds, they must be bandaged to the rotor’s surface.
Since the magnets are attached to the rotor, the centrifugal forces are absorbed by the superimposing laminated core. This problem can be overcome by utilizing IPMSM technology. It also protects magnets from mechanical damage and eddy currents due to the laminated core design [
20]. Therefore, IPMSM was selected as the suitable topology.
2.2. Terms and Definitions
Stack length: The length of the lamination stack that gives rigidity to the stator is referred to as the EM stack length. The winding end-turn lengths, which are not torque producing, are not included in the stack length.
Rotor diameter: The rotor diameter of an EM is defined as the circle described by the moving rotor.
Stator Diameter: The stator diameter of an EM is defined as the circle, which is described by the stationary stator.
Shape Ratio (SR): The shape ratio of a PMSM is defined as the ratio of the stack length to the rotor diameter [
21].
Split ratio (α): The split ratio of a PMSM is defined as the ratio of the rotor diameter to the stator diameter [
21].
3. Methodology
The methodology was developed to keep the solution as simple as possible, while considering critical design parameters and technical and economic aspects. Both quantitative and qualitative analyses have been performed for the selection of a suitable EM for the defined use cases. An overview of the followed steps is presented below in
Figure 1.
3.1. Use Case Definition
Three different gross vehicle weights, three different values of shape ratios, and one value of split ratio were selected to define the use cases for the battery electric commercial vehicles. The WLTC drive cycles were modified, the maximum speed was limited to 90 km/h, and they were named WLTC1_mod, WLTC2_mod, and WLTC3_mod. The use cases are summarized in
Table 2.
The vehicle and powertrain parameters used in the research were selected from a previous study by the Chair of Production Engineering of E-Mobility Components (PEM) at RWTH Aachen. The overview of these parameters can be seen in
Table 3.
3.2. Simulation Model Development
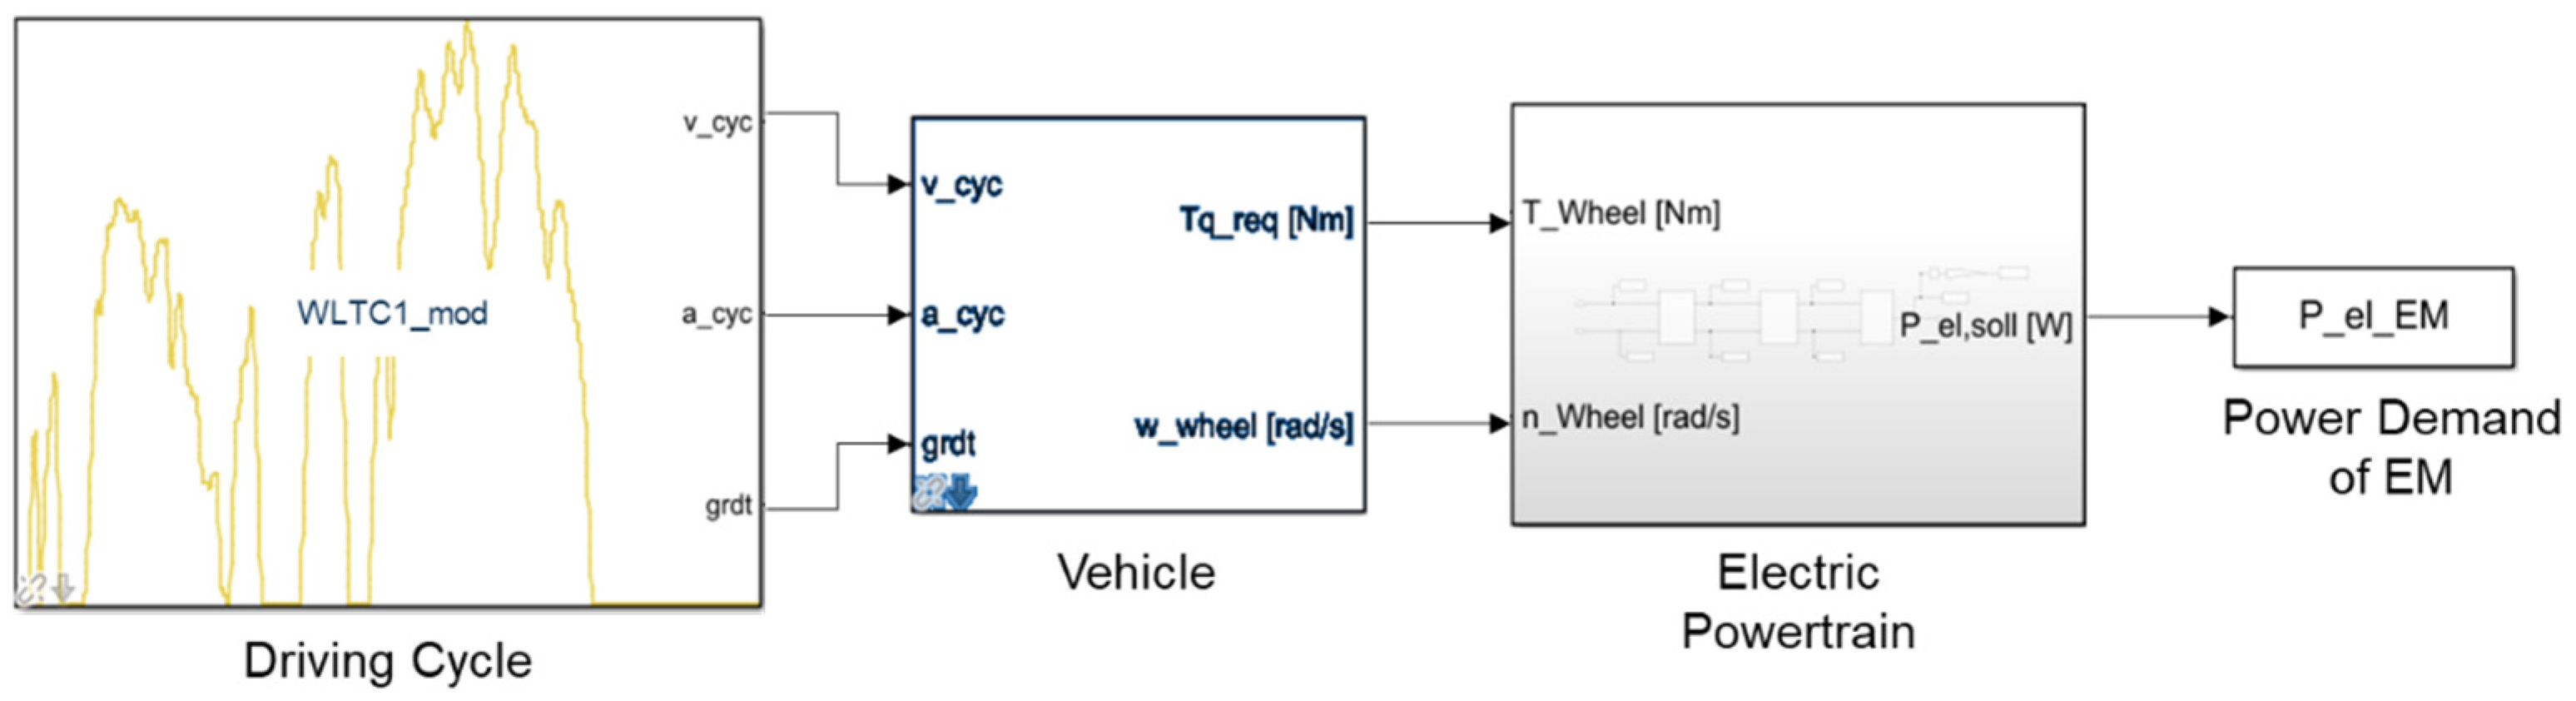
As can be seen in
Figure 2, the complete layout of the simulation model consists of various sub-systems or blocks, namely, the driving cycle, vehicle, electric powertrain, BEV battery, fuel cell, and H
2 tank.
All of the simulation blocks, apart from electric powertrain, were developed at PEM during previous studies and for the current project.
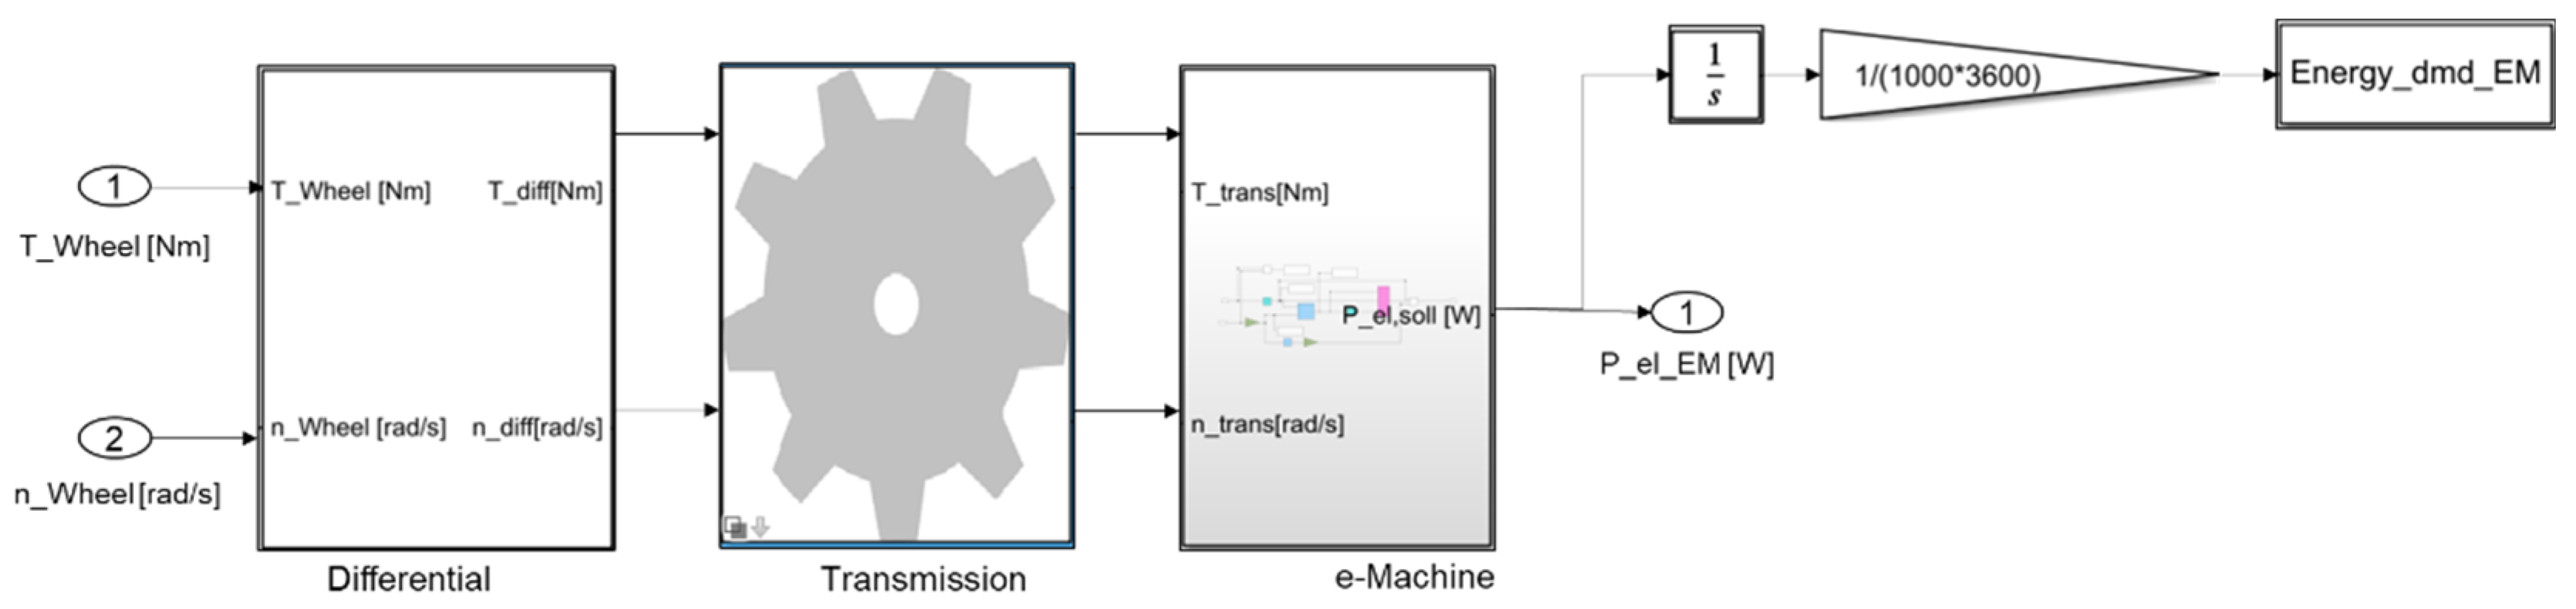
The basic process of this block is to use the torque and speed at the wheel of the vehicle as the inputs and perform calculations at the differential and transmission block, as illustrated in the process flow in
Figure 3, while considering the final gear ratio and the transmission gear ratio along with the efficiencies of the respective gears. The torque and speed values after the transmission block were fed into the e-Machine block as inputs, thereby enabling the calculation of its power, torque, energy, and speed demands. This block selects the efficiencies at different operating points according to the efficiency map for a PMSM. The process to select the efficiency map is defined in the next subsection.
3.2.1. Selection of Efficiency Maps
The efficiency maps that we used in our research (refer to
Section 3.2.2) are available as open source for study and research purposes [
22].
Additionally, these already generated efficiency maps correspond to the data in
Table 4 and
Table 5. These efficiency maps were created by a research team from TUM Munich using their in-house developed tool, “Modell für den Entwurf und die Analyse einer PMSM oder ASM (MEAPA)“ [
20].
There are two steps for the selection of an EM efficiency map. The details of the steps used in the selection of efficiency maps are elaborated below. Steps 1 and 2, which are written below, provide a background of how the studies by the authors Wolff, Kalt et al. [
20] and Kalt, Erhard et al. [
22], respectively, were conducted and explain the underlying assumptions, parameters, and equations, etc., which have been used during their calculations for efficiency maps generation.
In the first step, some existing EMs in heavy-duty trucks (40 t GVW) in the production or prototype stages are summarized [
22]. Aside from the publicly known vehicle parameters, assumptions were made about the gearbox design and the electrical machine’s subsequent operating speed. Machine efficiency maps are created based on the vehicle specifications.
Table 4 summarizes the powertrain architecture parameters of some on-the-market heavy-duty electric trucks and their corresponding electric powertrains. The topology, number of gears and e-machines, as well as the e-machine type, rated power, and torque, were obtained from fitting sources, whilst the rotational velocity of the machine identified as “
n85”, which was rated for a maximum vehicle speed of 85 km/h, is determined using Equations (3) and (4) [
22].
rdyn = dynamic rolling radius of tires;
igear = gear ratio.
Wolff, Kalt et al. considered the starter torque that is required for 40-tonne heavy-duty vehicles as 35,000 Nm as this enables typical road acceleration (>0.646 m/s
2) and sufficient torque reserves for starting on roads with gradients of 15–17% [
22].
In the second step, based on the input parameters from the above step, with the help of MATLAB, efficiency maps are generated using the MEAPA (Modell für den Entwurf und die Analyse einer PMSM oder ASM) tool developed by TUM, Munich.
In the initial step of the design model, the primary dimensions are determined based on the input parameters. The stator and rotor layouts can then be designed. The design parameters are then sent to the analysis model, which calculates the currents and voltages for the operating points within the valid operating range using a motor and generator model. Finally, the losses are calculated, and the efficiency diagram is created [
20].
Assumptions used in the tool for creating efficiency maps:
Because the number of pole pairs for the specified trucks is unknown, a value of 4 was used because lower pole pair numbers are often used for low-speed and high-torque applications [
22].
An IPMSM was selected with an embedded magnet assembly [
22].
Apart from the number of pole pairs, several assumptions are made for the input parameters for the e-machine design tool MEAPA. These assumptions are stated below in
Table 5.
3.2.2. Selected Efficiency Maps
A pre-processing approach was followed to select the efficiency maps for the research that was conducted. The demand torque and speed for selected use cases were derived from the simulation model that is explained in the previous section of the chapter. Two IPMSM efficiency maps were selected based on the torque and speed demands derived from the use cases considered for two vehicle categories; there was one efficiency map for 7.5 t vehicles and another one for the 18 t and 40 t vehicles [
22]. The selected efficiency maps can cover the demand range of the use cases based on the GVW, drive cycles, and vehicle dynamics defined in
Section 3.1. The efficiency map selected for the 7.5 t vehicle is for serial no. 3 and the one for the 18 t and 40 t vehicles are for serial no. 2, which can be seen in
Table 4. The summary of the selected efficiency maps is given in
Table 6.
3.3. Selection of a Geometrically Suitable E-Machine
In the design of a PMSM, the variables for sizing include the shape ratio (SR), the split ratio (α), the torque per rotor volume (TRV), and the torque density (TD), and these variables are important for determining the mechanical and electrical characteristics of the motor.
The rotor diameter, stack length, and stator diameter of the motor can be determined using these independent variables. According to the research conducted by Kim, H.-J. et al., the TD can be represented by Equation (5) [
21]:
To determine the rotor diameter, stator diameter, and stack length values of the e-machine, some assumptions about the values were made using the reviewed literature based on an experiment conducted on an IPMSM.
Based on Equations (1), (2) and (5), the following relationships were derived:
Ds = stator outer diameter (mm);
Dr = rotor outer diameter (mm);
Lstk = stack length (mm);
Tmax = max. torque required for application.
The assumed values of the parameters based on the literature are as follows:
Shape ratio (SR) = 0.5–2.0 [
21].
Torque density (TD) = (7832 [
21] + 28,860 [
23])/2 = 18,346 Nm/m
3.
The shape ratio (SR) is commonly defined as being between 0.5 and 2 [
21]. The value of the torque density (TD) is considered as an average of two values found in different works of literature, whereby 7832 Nm/m
3 is the value from the work of Kim and their team [
21] and 28,860 Nm/m
3 is the typical value of torque density of a PMSM [
23]. As an EM with a very small power rating was considered in the work of Kim and their team [
21], another value of torque density was considered to have tangible results for the analysis in the research paper.
3.4. Development of the Cost Function for E-Machine
The cost function for the EM cost is based on a cost study of a PMSM which was conducted under the Lebenszykluskostenreduktion im elektrischen Verteilerverkehr (LiVe) project at PEM. The study is based on market data as well as assumptions. Though the detailed results of this study are not relevant to this research paper, the price components of the PMSM are. Three different reference e-machines, EM 1, EM 2, and EM 3, their geometrical parameters, and their price components were considered for this research.
Using the values of the stator diameter, rotor diameter, and stack length along with their corresponding costs, a cost function was developed to calculate the cost of the PMSM, which is directly dependent on the maximum value of torque (the max-load torque required for the application), which can be derived from the simulation model.
A relationship has been established between the geometric parameters, Ds, Dr, Lstk, Tmax, α, and TD, as shown is Equations (6)–(8).
Once the geometric parameters Ds, Dr, and Lstk were calculated, a system of linear equations was developed using the three reference e-machines, EM 1, EM 2, and EM 3. The values of the geometric parameters for these machines along with their total cost form the components of linear equations. MATLAB was used to solve these linear equations to find the total cost of the EM.
In the next step, the component costs of the core components of the EM, i.e., the magnets, copper, shaft, rotor lamination stack, and stator lamination stack, were also considered during the analysis. The function is defined based on the geometry of the EM and various component costs from EM 1, EM 2, and EM 3. These functions were then implemented into the overall EM cost function script which was created with the MATLAB tool.
The assumed values of the parameters based on the reference e-machines are as follows:
All of the parameters for EM 1, EM 2, and EM 3 were assumed to be constant, apart from the costs and geometry, while we were calculating the cost function.
The split ratio for the use case analysis was considered as the average value of split ratios for the three reference e-machines.
Split ratio (α) = (0.619 + 0.620 + 0.618)/3 = 0.62.
Tmax = Max_Torque (max. torque (Nm) required for applications; this was obtained from the simulation model).
SR = 0.5 to 2.0.
α = 0.62.
TD = 18,346.
Ds = 1000 * ((Tmax/(0.25 * pi * TD * SR * α)) ^ (1/3)).
Dr = α * Ds.
Lstk = SR * Dr.
3.5. Overview of the Selected Parameters and Assumptions
The assumptions considered during this research are summarized below in
Table 7. The assumptions have been already used, and their backgrounds are defined in the previous sub-sections under the methodology section.
4. Results and Analysis
In this section, the results of various use cases are shown. Both the quantitative and qualitative analyses were performed to research design parameters for the most cost-efficient e-machine and the effect of other decisive factors on the selection of an e-machine.
4.1. Quantitative Analysis: Results for 7.5 t Vehicle
Table 8 displays the consolidated results of the simulation with varying shape ratios. The effects of varying shape ratios on the geometry and cost of the e-machine are displayed. It can be inferred that the cost of the e-machine, stator OD and rotor OD decreases along with an increasing SR while the stack length increases.
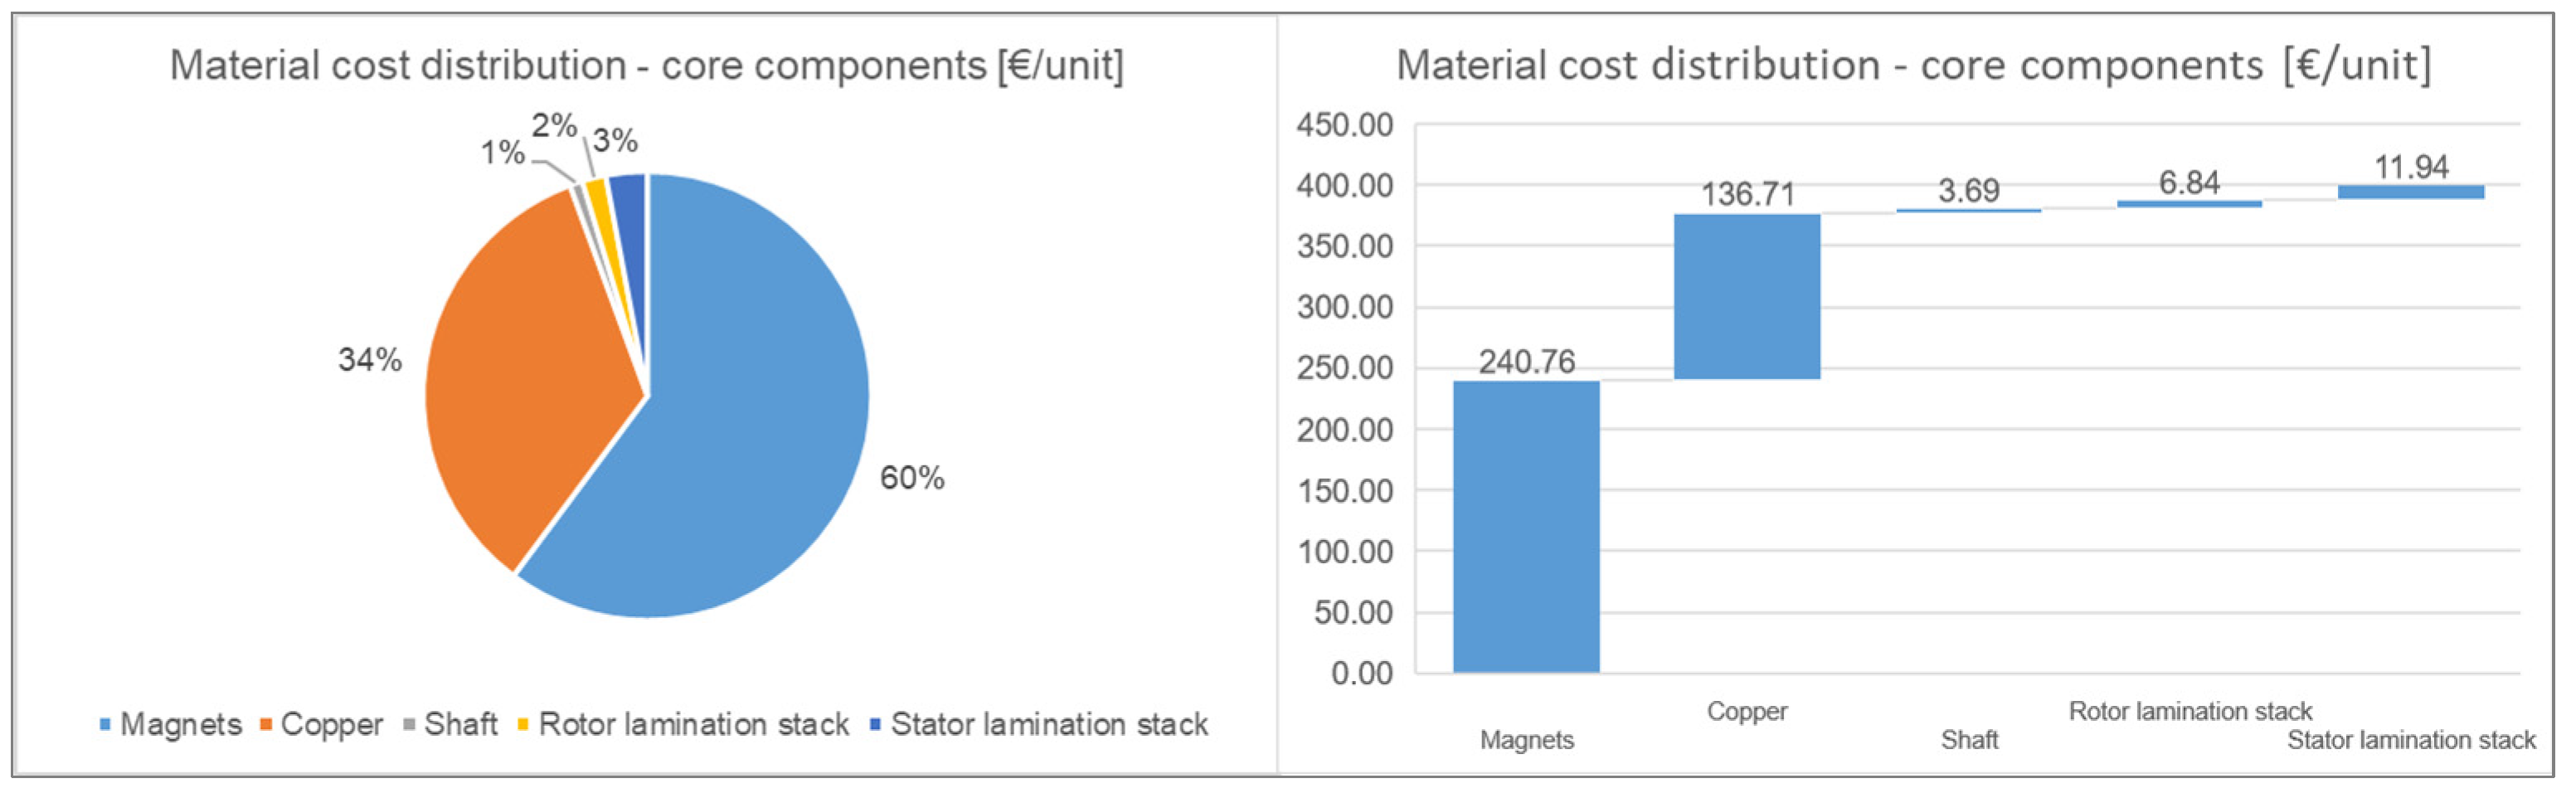
Here are the values of the material cost distribution of the core components of the e-machine for the first and last sub-use cases, as shown above in
Table 8.
Figure 4 and
Figure 5 demonstrate the material cost distribution of the core components both as a function of percentage as well as the cost (EUR/unit). It can be observed from the figures that while the rotor OD and stator OD decreased, the stack length increased with an increase in the values of the shape ratio (SR). This contributes to the increased magnet costs from 95 (EUR/unit) to approx. 240 (EUR/unit) and to the percentage increase in the magnets cost contribution from 53% to 60%.
Summary of Use Cases
Similarly, each use case defined in
Section 3.1 was analyzed with a total of 144 sub-use cases for all of the vehicles, 7.5 t, 18 t and 40 t along with the selected drive cycles, and out of them, the following most cost-efficient combinations have been observed. The rest of the use cases have not been displayed due to repetitiveness in the pattern of the results, as similar kinds of results were observed for the three vehicles.
The E-machine cost behavior analysis demonstrates increasing SR values and a fixed α value for 7.5 t vehicle and WLTC1_mod drive cycle.
As can be inferred from
Figure 6, the most cost-efficient e-machine is at the very beginning of the plot, and this is true for all of the different use cases that have been simulated.
It can be observed in
Table 8,
Table 9,
Table 10 and
Table 11 that the cost of the e-machine increases as the SR increases. This is because the stack length of the e-machine increases, which results in a significant increase in the core component costs. Thus, α = 0.62 and SR = 0.5 are the values of the design parameters for the most cost-efficient e-machine for every use case that was considered.
4.2. Qualitative Analysis: Other Influencing Factors for E-Machine Selection
As observed, the values of the stator OD and rotor OD usually decrease with the increasing value of SR, and the stack length increases with an increasing SR. As per the analysis performed by Kim, H.-J. et al., the efficiency of the analyzed e-machine is 94.8% and 95.7% at α = 0.48 and α = 0.70, respectively. It is also stated that the efficiency tends to increase as the α increases, but it decreases as the α exceeds by about 0.7. Therefore, we can assume that during our analysis at α = 0.62, the efficiency of the e-machine lies between 94.8% and 95.7%.
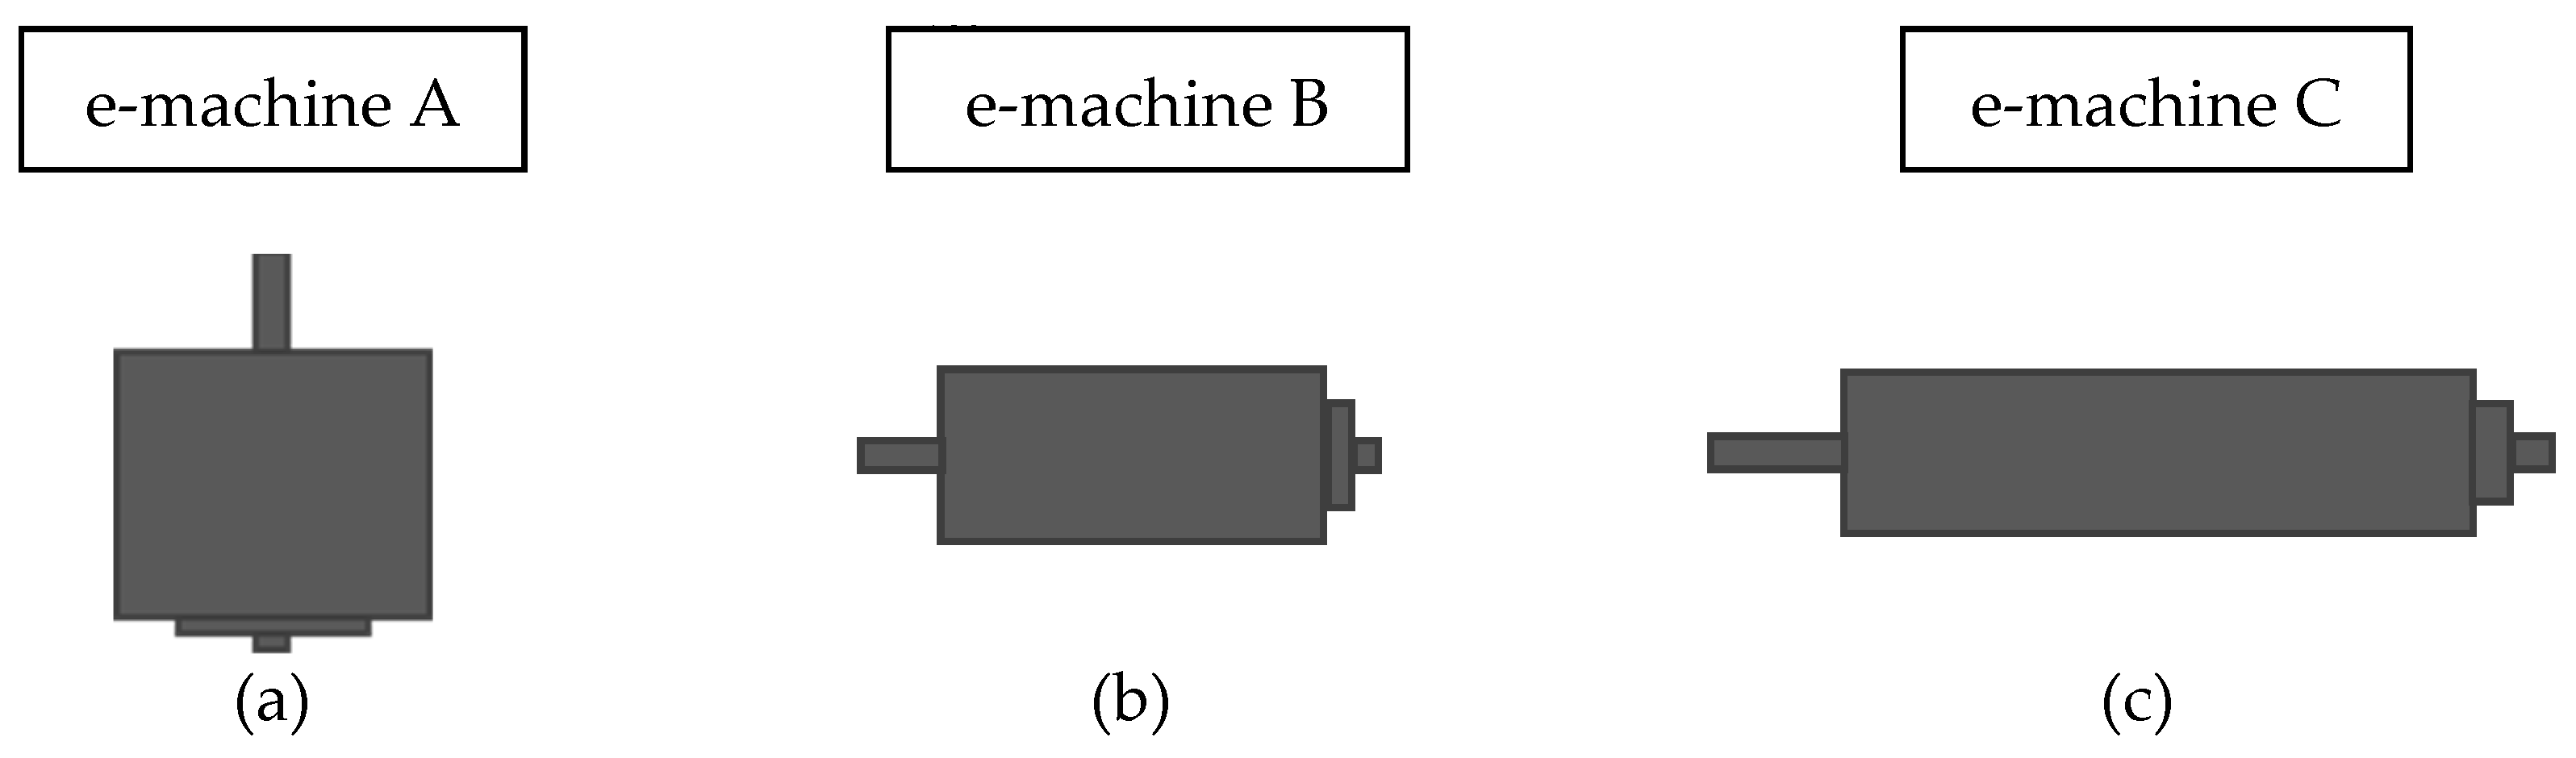
The geometries of the e-machine are referred to as ‘e-machine A’, ‘e-machine B’, and ‘e-machine C’, hereafter.
As illustrated in
Figure 7, when one is considering the vehicle’s powertrain/e-machine packaging requirements, either of these geometries might be more suitable compared to the other. Therefore, the values of design parameters α and SR were considered with other vehicle requirements.
4.2.1. Packaging Analysis
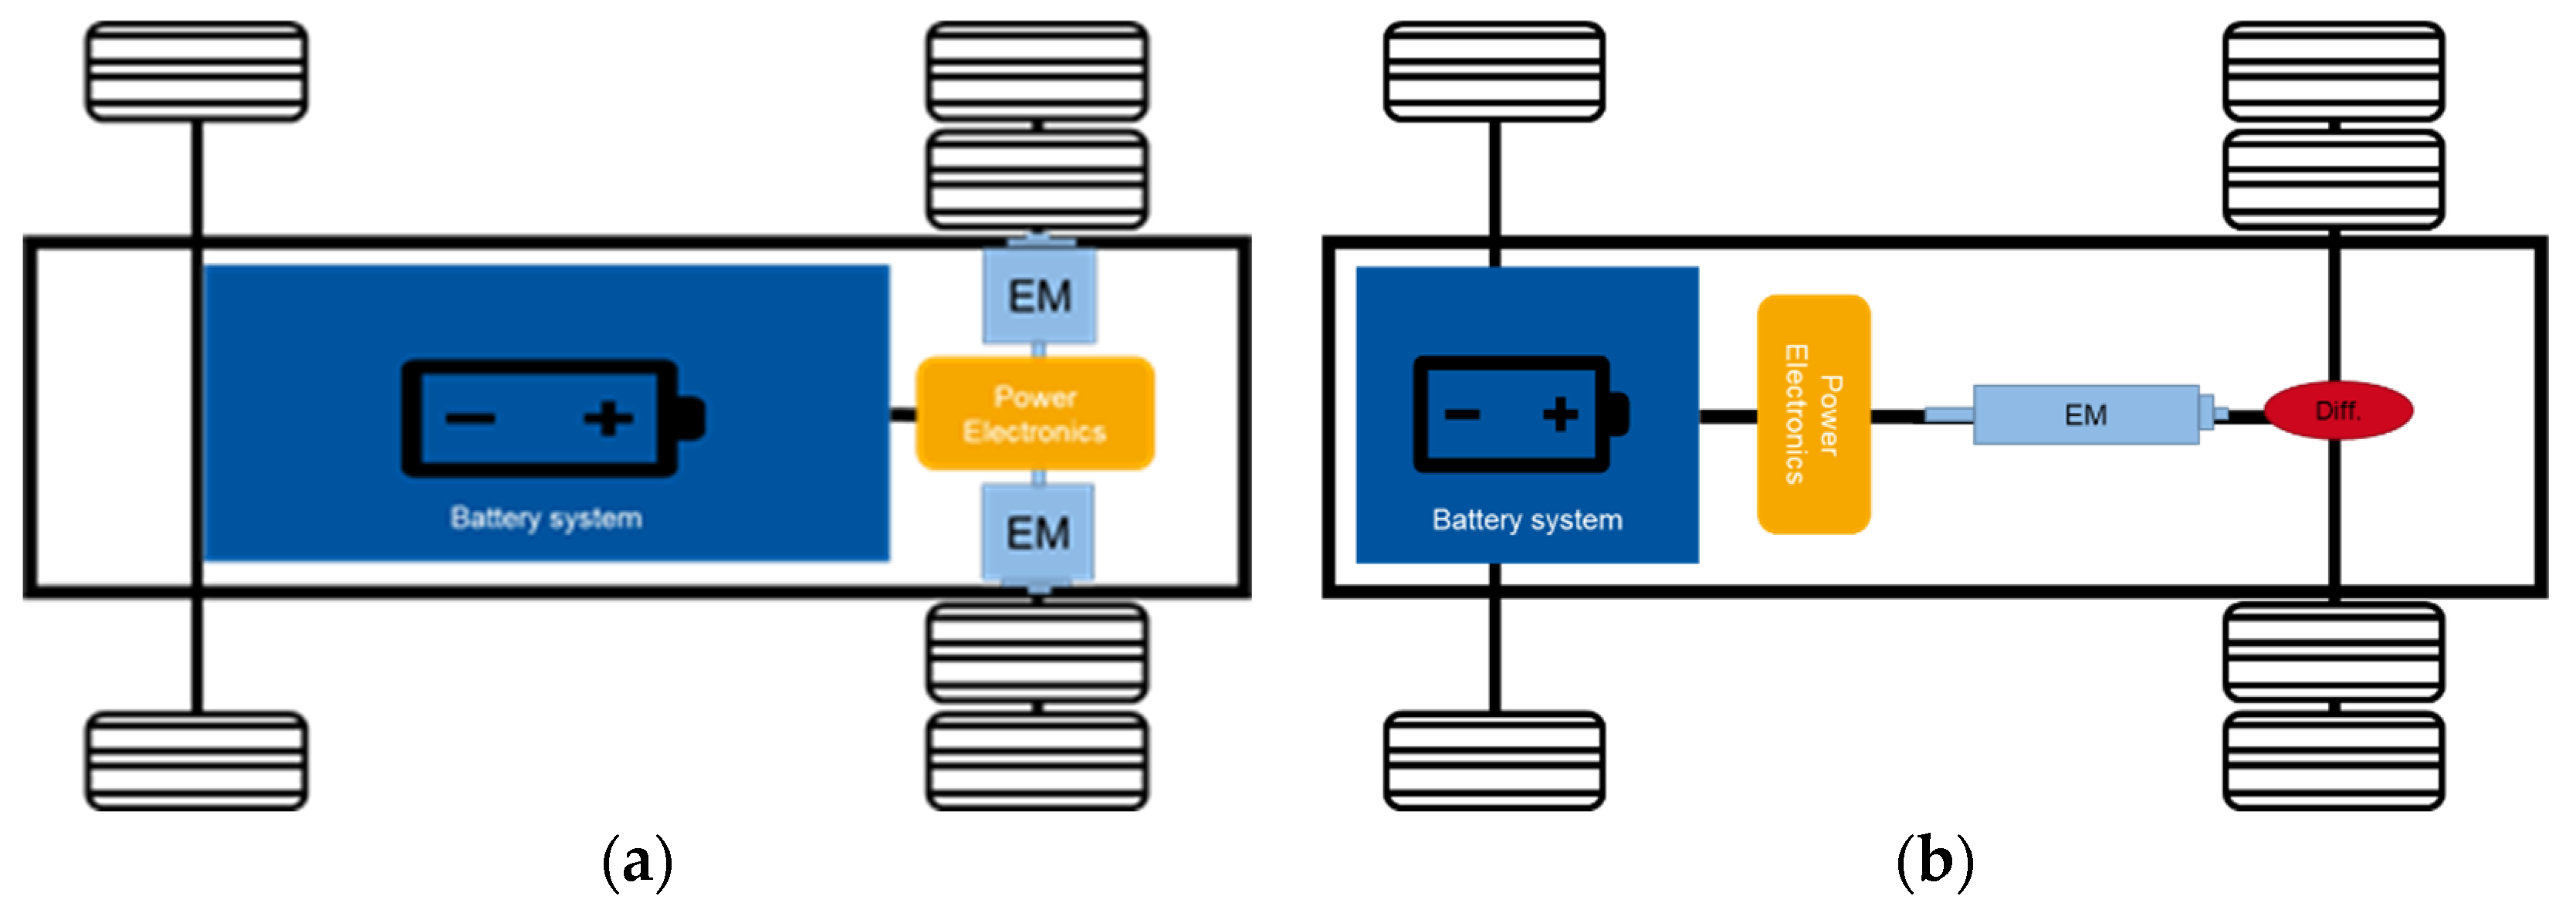
In the case of the in-wheel e-machines, the geometry of the e-machine with SR = 0.5 (e-machine A) might be more suitable compared to that of an e-machine with SR = 2.0 (e-machine C). This is illustrated below in
Figure 8a.
As the ‘e-machine C’ has a longer stack length, it will not leave enough room in the frame to accommodate two e-machines as it accommodates two e-machines with geometry 1. The ‘e-machine B’ geometry could be suitable for this use case depending upon the chassis structure of the vehicle.
The battery layout and capacity play a vital role in deciding on an electric commercial vehicle, particularly for long-haul applications.
Though, due to the advancements in battery cell technology, smaller batteries are becoming more efficient, still, for heavier segment electric vehicles, a large battery is considered to be essential to meet the application requests. This factor also inclines towards the e-machine with a larger stator OD and smaller stack length (e-machine A). Nevertheless, e-machine C is suitable for a central arrangement as illustrated in
Figure 8b.
4.2.2. Thermal Management Analysis
It is possible to improve the overall efficiency of an electric motor by adequately cooling the copper windings. Additionally, maintaining a high level of cooling allows the motor’s power output to be enhanced. As a result, it can be concluded that adequately cooling the copper windings of electric motors is critical to increasing the power density of electric machines [
24].
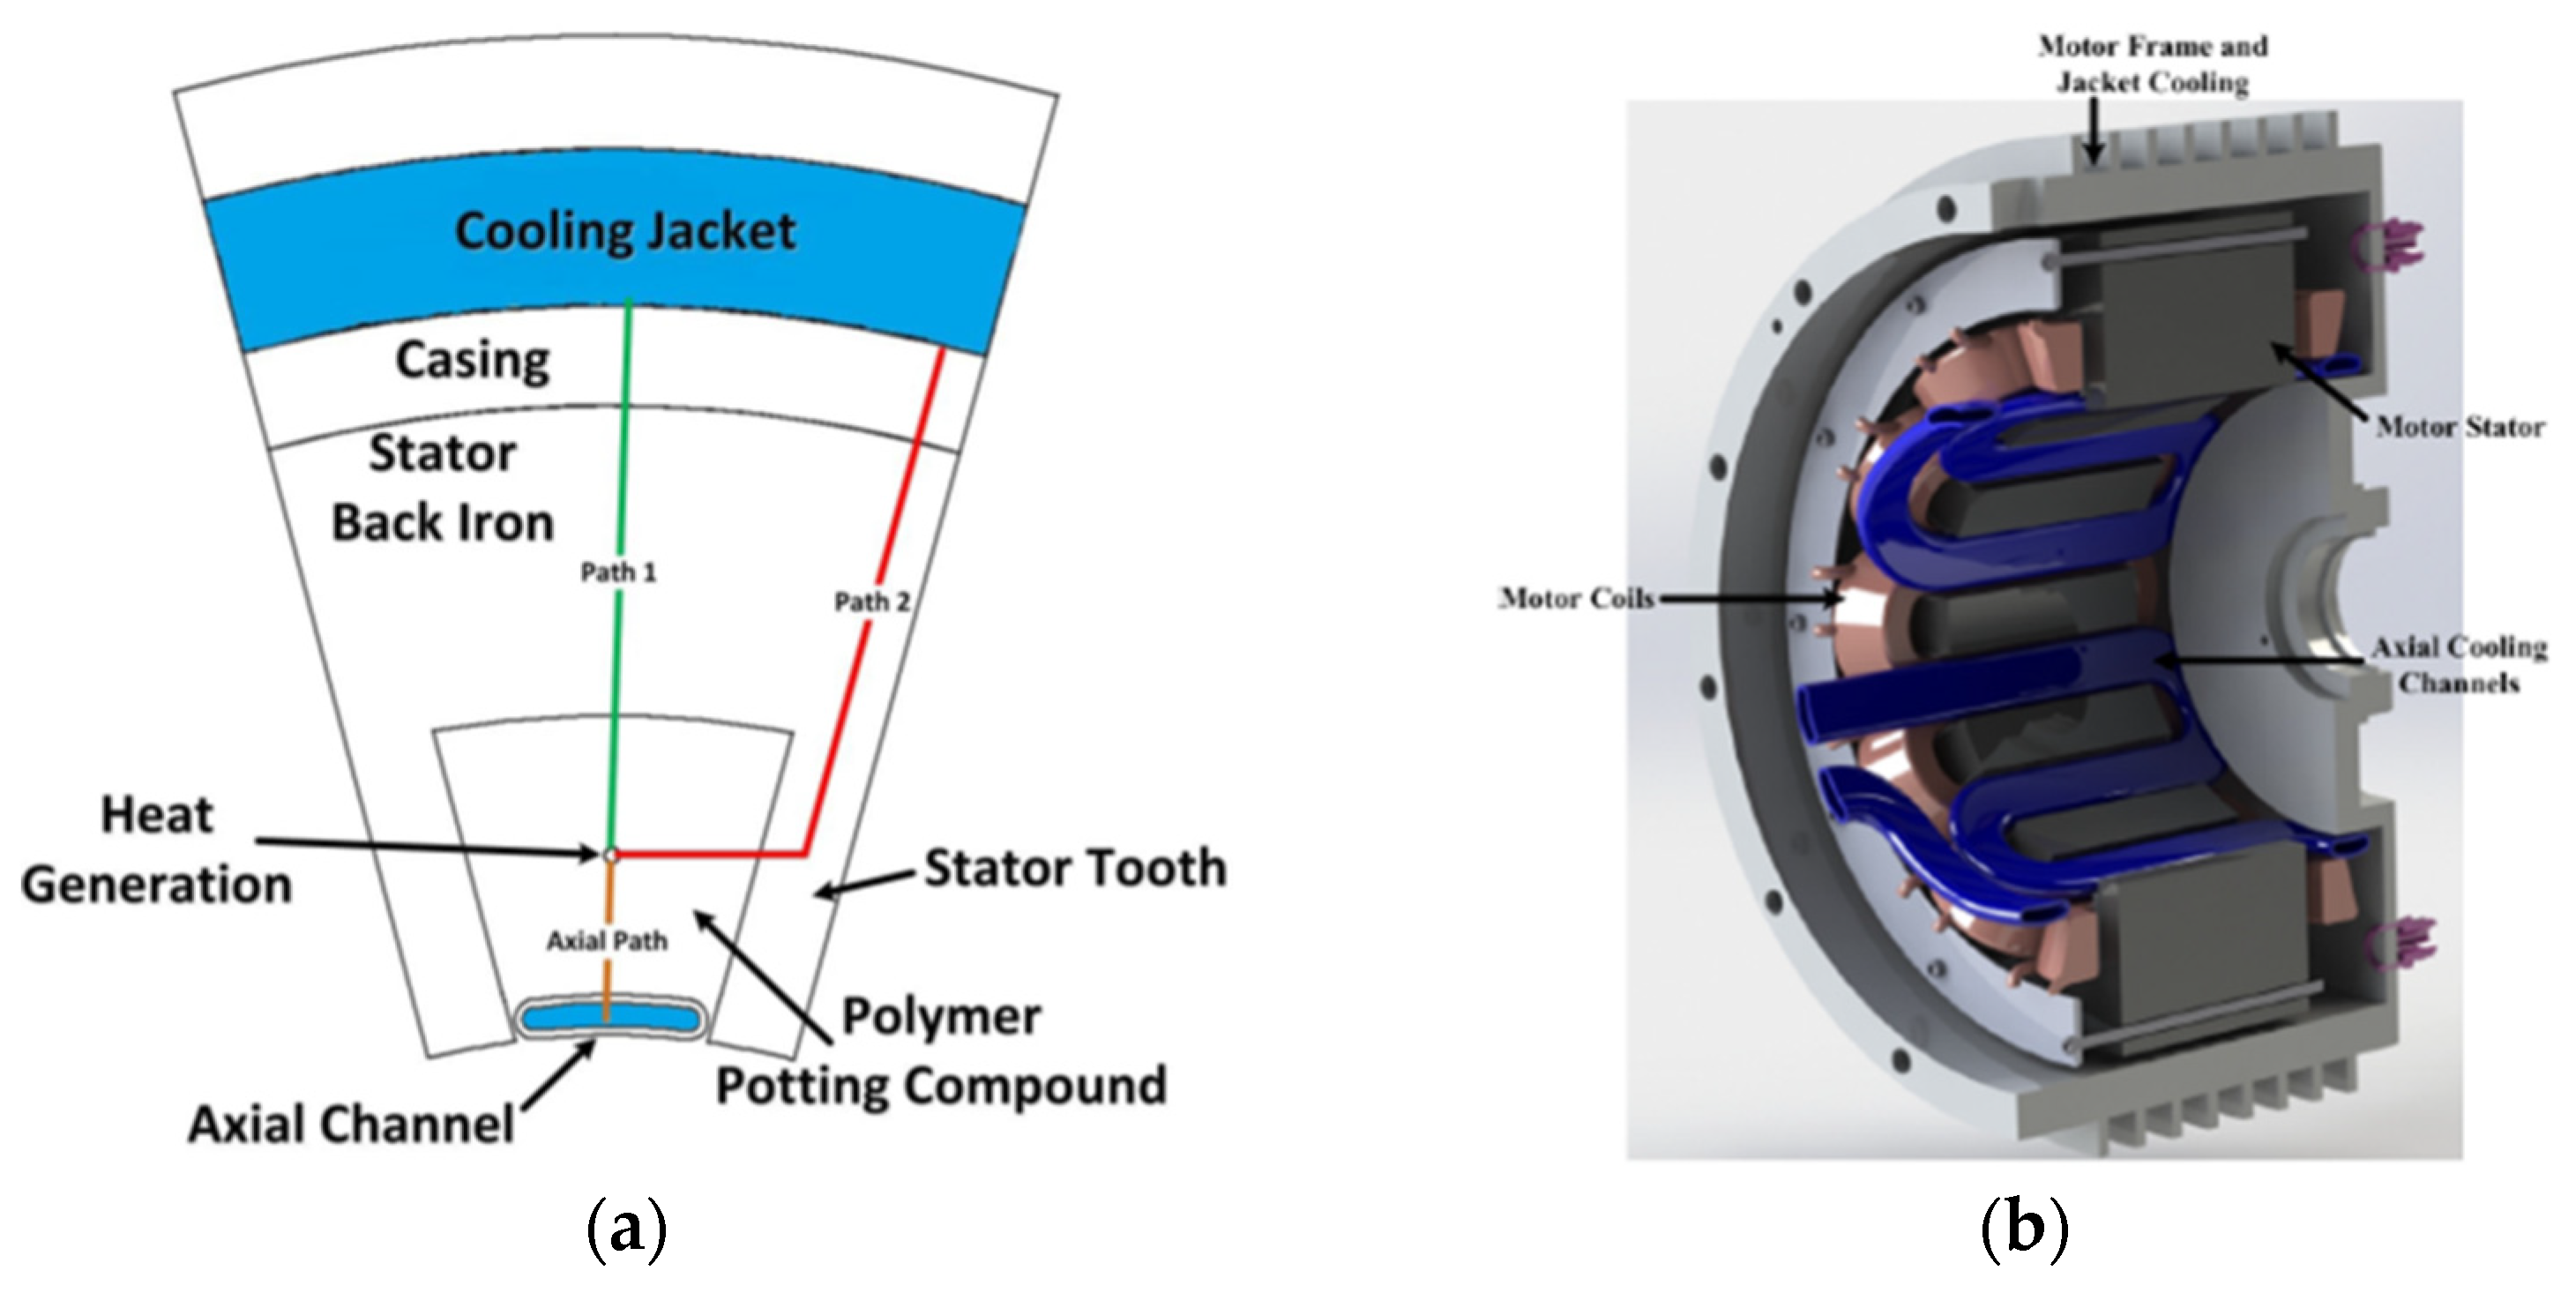
To remove heat energy from within, most of the e-machines available today use the conventional jacket cooling method. A coolant travels through channels, running through the e-machine casing, and it removes the thermal energy from the perimeter of the motor in this operation. The heat created by components such as motor windings must pass through the stator into the motor casing, and then, into the cooling fluid to be evacuated for this cooling process to work. There is a significant thermal resistance that prevents the created thermal energy from being dissipated because there is such a long distance to travel and so many contacts to conduct through.
Figure 9 depicts the alternative paths for heat to go to the extraction points, which are represented by the blue sections of the diagram.
The following equation can be used to compute the thermal resistance of individual components in the thermal network.
The length of the conduction path, l, the thermal conductivity of the medium, κ, and the cross-sectional area of the conduction path, A, can be used to calculate the thermal resistance, R.
The most reasonable strategy to improve the thermal energy removal efficiency is to lower the thermal resistance encountered by the energy generated. As inferred from Equation (9), this can be accomplished in several ways, including reducing the conduction length, increasing the conduction area, or boosting the thermal conductivity of the heat-transfer medium. For different methods, the effects of e-machine geometry will be different, and these are explained below.
We assume that the thermal conductivity of the medium and the cross-sectional area of the conduction path remains constant.
Cooling jacket method: As shown in
Figure 9a, the e-machine with a shorter conduction path will offer lesser thermal resistance. This can be achieved by having an ‘e-machine C’ with a smaller stator diameter.
Axial channel method: In this method, the heat transfer takes place along the length of the e-machine, as shown in
Figure 9a,b. Therefore, an ‘e-machine A’ with a smaller stack length will offer less thermal resistance.
The ‘e-machine B’ will fall in between ‘e-machine A’ and ‘e-machine C’ for both of the methods.
4.2.3. Stator Loss Analysis
The major losses in a PMSM are the stator losses. According to Yu, Y. et al. [
25], the components of the stator loss, i.e., hysteresis loss, eddy current loss, and stray loss, can be expressed as Equation (10):
where
Bm is the max. the magnetic field strength in one electric period, ∆
B is an increment of the magnetic field intensity with one step, ∆
T is the time step,
kh is hysteresis loss factor,
kf is coefficient of lamination,
ke is stray loss,
σ is the conductivity of steel sheet, and
d is the length of stator iron core.
If the parameters such as Bm, ∆B, the hysteresis loss factor, the coefficient of lamination, and the conductivity of the sheet are assumed to be constant over the time step, ∆T, it can be interpreted that the stator loss is directly proportional to the length of the stator iron core. Therefore, a larger stack length might result in larger stator losses, thereby reducing the efficiency of the e-machine. Hence, the geometry of ‘e-machine A’ might be more suitable in this case, however, bench test results will provide sufficient data to analyze the impact of other factors as well, apart from the length of the stator iron core.
5. Discussion
As learned during the research, α = 0.62 and SR = 0.5 are the values of the split and shape ratios, respectively, for the most cost-efficient EM for any use case. However, as it was observed, the values of the stator and rotor OD usually decrease with the increasing value of SR, and the stack length increases with an increasing SR.
A qualitative analysis of the packaging requirements, thermal management, and stator losses was performed to analyze what geometry would be most suitable in different conditions.
Limitations and Future Research
Furthermore, an experimental increase in the efficiency of the EM was observed in the work of Kim and their team [
21] when the α increased to 0.70, and then, the efficiency fell. Thus, an experimental setup might offer a more accurate scenario.
Another point could be to include multiple reference e-machines which will broaden the scope of the design and cost function while utilizing several values of design parameters along with the associated component costs. Additionally, a similar methodology can be utilized by designing another type of e-machine, such as an EESM or an IM, etc., and then, deriving the costs.
The factors such as the operating conditions cost over the lifetime and the ease of manufacturing cost-effective EM components could be analyzed.
Apart from this, the study could collaborate with several test bench analyses, such as a reliability analysis of the selected e-machine geometry, load, and no-load tests, as well as finite element analysis (FEA), which would enable one to comment on the experimental values of the EM parameters, such as the efficiency at operating points of the use case, reliability over defined time and distance, etc.
6. Conclusions
There was a gap in the available literature, whereby the initial understanding of the cost of the e-machine was under development, and it was not available in other studies. This work highlights a methodology that was developed to help understand the economic aspect as well as the performance factors. A novel methodology is presented in this work to help select the initial geometry of the e-machine during the design process, a cost estimation based on the geometry of the electric motor, and an estimate of the effect of design parameters on the cost of the electric motor and its components.
The most cost-efficient EM might not be suitable for all of the use cases in a real-life scenario, therefore, other methods such as a qualitative analysis, a reliability analysis, and the operating conditions over a lifetime, etc., should be considered to obtain the best trade-off between the cost and the performance. The developed methodology that is presented in this work is helpful for:
Selecting the initial geometry of the electric motor during the design process.
Carrying out a cost estimation based on the geometry of the electric motor.
Estimating the effect of the design parameters on the cost of the electric motor and its components.
Moreover, the developed methodology can be used for other electric powertrain topologies as well, regardless of the energy source.
Author Contributions
Conceptualization, J.G.D.G. and C.S.; methodology, J.G.D.G., C.S. and F.B.; software, C.S.; validation, J.G.D.G. and C.S.; formal analysis, C.S.; investigation, J.G.D.G. and C.S.; resources, A.K., H.H. and B.D.; data curation, C.S.; writing—original draft preparation, C.S.; writing—review and editing, J.G.D.G. and F.B.; visualization, J.G.D.G. and C.S.; supervision, F.B. and B.D.; project administration, H.H., B.D. and A.K.; funding acquisition, A.K. and H.H. All authors have read and agreed to the published version of the manuscript.
Funding
This research was funded by the German Federal Ministry for the Environment, Nature Conservation, Nuclear Safety and Consumer Protection (BMUV), grant number 16EM4016-1. The project name was “LiVePLuS”.
Data Availability Statement
The data that support the findings of this study are available from the corresponding author, J.G.D.G., upon reasonable request.
Conflicts of Interest
The authors declare no conflict of interest.
References
- Fries, A.M.; Kerler, A.M.; Rohr, A.S.; Schickram, A.B.S.; Sinning, A.M.; Lienkamp, A.B.M.; Kochhan, A.B.R.; Fuchs, A.S.; Reuter, A.B.; Burda, A.P.; et al. An Overview of Costs for Vehicle Components, Fuels, Greenhouse Gas Emissions and Total Cost of Ownership Update 2017. Res. Gate 2017, 4. [Google Scholar]
- Sharma, S.; Kumar, V. Optimized Motor Selection for Various Hybrid and Electric Vehicles. In Proceedings of the SAE Technical Paper Series 8th SAEINDIA International Mobility Conference & Exposition and Commercial Vehicle Engineering Congress 2013 (SIMCOMVEC), Chennai, India, 4 December 2013; SAE International400 Commonwealth Drive: Warrendale, PA, USA, 2013. [Google Scholar]
- Kampker, A.; Pandey, R.; Gomez, J.G.D.; Wessel, S.; Treichel, P.-E.; Malatyali, I. Cost Optimal Design Strategy of Electric Drivetrains for Medium Heavy-Duty Vehicles Based on Product Development and Production Costs. In Proceedings of the 2019 9th International Electric Drives Production Conference (EDPC), Esslingen, Germany, 3–4 December 2019; pp. 1–8, ISBN 978-1-7281-4319-4. [Google Scholar]
- Liimatainen, H.; van Vliet, O.; Aplyn, D. The potential of electric trucks—An international commodity-level analysis. Appl. Energy 2019, 236, 804–814. [Google Scholar] [CrossRef]
- Unterlohner, F. Comparison of Hydrogen and Battery Electric Trucks; Transport & Environment: Brussels, Belgium, 2020. [Google Scholar]
- Mathieu, L.; Cornelis, S.; Nix, J.; Bannon, E. Recharge EU Trucks: Time to Act!—A Roadmap for Electric Truck Charging Infrastructure Deployment; Transport & Environment: Brussels, Belgium, 2020. [Google Scholar]
- Kampker, A.; Krciskother, K.; Buning, M.K.; Gomez, J.G.D. Technological and Total Cost of Ownership Analysis of Electric Powertrain Concepts for Long-Haul Transport in Comparison to Traditional Powertrain Concepts. In Proceedings of the 8th International Electric Drives Production Conference, Schweinfurt, Germany, 4–5 December 2018; IEEE: Piscataway, NJ, USA, 2018. [Google Scholar]
- Mathieu, L. Unlocking Electric Trucking in EU: Recharging in Cities; Transport & Environment: Brussels, Belgium, 2020. [Google Scholar]
- Ekberg, K.; Eriksson, L. Electrification of a Heavy-Duty CI Truck—Comparison of Electric Turbocharger and Crank Shaft Motor. Energies 2021, 14, 1402. [Google Scholar] [CrossRef]
- Dollinger, M.; Fischerauer, G. Model-Based Range Prediction for Electric Cars and Trucks under Real-World Conditions. Energies 2021, 14, 5804. [Google Scholar] [CrossRef]
- Sanguesa, J.; Torres-Sanz, V.; Garrido, P.; Martinez, F.; Marquez-Barja, J. A Review on Electric Vehicles: Technologies and Challenges. Smart Cities 2021, 4, 372–404. [Google Scholar] [CrossRef]
- Fischer, R. Elektrotechnik Für Maschinenbauer—Sowie für Studierende der Versorgungstechnik, des Wirtschaftsingenieurwesens und Anderer Technischer Fachbereiche; Springer: Berlin/Heidelberg, Germany, 2016. [Google Scholar]
- Karki, A.; Phuyal, S.; Tuladhar, D.; Basnet, S.; Shrestha, B.P. Status of Pure Electric Vehicle Power Train Technology and Future Prospects. ASI 2020, 3, 35. [Google Scholar] [CrossRef]
- Zeraoulia, M.; Benbouzid, M.; Diallo, D. Electric Motor Drive Selection Issues for HEV Propulsion Systems: A Comparative Study. In Proceedings of the 2005 IEEE Vehicle Power and Propulsion Conference, Chicago, IL, USA, 7–9 September 2005; pp. 280–287, ISBN 0-7803-9280-9. [Google Scholar]
- Xue, X.D.; Cheng, K.W.E.; Cheung, N.C. Selection of Electric Motor Drives for Electric Vehicles. In Proceedings of the 2008 Australasian Universities Power Engineering Conference, Sydney, NSW, Australia, 14–17 December 2008. [Google Scholar]
- de Santiago, J.; Bernhoff, H.; Ekergård, B.; Eriksson, S.; Ferhatovic, S.; Waters, R.; Leijon, M. Electrical Motor Drivelines in Commercial All-Electric Vehicles: A Review. IEEE Trans. Veh. Technol. 2012, 61, 475–484. [Google Scholar] [CrossRef] [Green Version]
- Fang, Q.; Scharfenstein, D.; Weiss, C.; Müller, C.; Schwarzer, U. Motor Handbook; Elsevier: Amsterdam, The Netherlands, 2019. [Google Scholar]
- Scharfenstein, D.; Weiss, C.; Qi, F.; Müller, C.; Schwarzer, U. Handbook of Electric Machines; Infineon AG: Munich, Germany, 2019. [Google Scholar]
- Lee, D.-K.; Ro, J.-S. Analysis and Design of a High-Performance Traction Motor for Heavy-Duty Vehicles. Energies 2020, 13, 3150. [Google Scholar] [CrossRef]
- Kalt, S.; Erhard, J.; Lienkamp, M. Electric Machine Design Tool for Permanent Magnet Synchronous Machines and Induction Machines. Machines 2020, 8, 15. [Google Scholar] [CrossRef] [Green Version]
- Kim, H.-J.; Jeong, J.-S.; Yoon, M.-H.; Moon, J.-W.; Hong, J.-P. Simple Size Determination of Permanent-Magnet Synchronous Machines. IEEE Trans. Ind. Electron. 2017, 64, 7972–7983. [Google Scholar] [CrossRef]
- Wolff, S.; Kalt, S.; Bstieler, M.; Lienkamp, M. Influence of Powertrain Topology and Electric Machine Design on Efficiency of Battery Electric Trucks—A Simulative Case-Study. Energies 2021, 14, 328. [Google Scholar] [CrossRef]
- Ehsani, M.; Gao, Y.; Gay, S. Characterization of electric motor drives for traction applications. In Proceedings of the 29th Annual Conference of the IEEE Industrial Electronics Society, Roanoke, VA, USA, 2–6 November 2003. [Google Scholar]
- Rhebergen, C. The Importance of Electric Motor Thermal Management and the Role of Polymer Composites in Axial Cooling. Master thesis, McMaster University, Hamilton, ON, Canada, 2015. [Google Scholar]
- Yu, Y.; Liang, D.; Liang, Z.; Ze, Q. Calculation for stator loss of high-speed permanent magnet synchronous machine in torque-speed envelope and restraint approach for circulating current in windings. Trans. Electr. Mach. Syst. 2018, 2, 211–219. [Google Scholar] [CrossRef]
Figure 1.
Overview of steps followed for methodology development.
Figure 1.
Overview of steps followed for methodology development.
Figure 2.
Overview of the simulation model.
Figure 2.
Overview of the simulation model.
Figure 3.
Inside view of the electric powertrain block.
Figure 3.
Inside view of the electric powertrain block.
Figure 4.
Material cost distribution of core components for drive cycle: WLTC1_mod, SR = 0.5, and α = 0.62.
Figure 4.
Material cost distribution of core components for drive cycle: WLTC1_mod, SR = 0.5, and α = 0.62.
Figure 5.
Material cost distribution of core components for drive cycle: WLTC1_SeLv, SR = 2.0, and α = 0.62.
Figure 5.
Material cost distribution of core components for drive cycle: WLTC1_SeLv, SR = 2.0, and α = 0.62.
Figure 6.
Cost-efficient e-machine geometry and costs for a 7.5 t vehicle.
Figure 6.
Cost-efficient e-machine geometry and costs for a 7.5 t vehicle.
Figure 7.
Illustration of geometry of an e-machine. (a) represents a shape ratio (SR) = 0.5 and (b) represents a shape ratio (SR) = 1.2 and (c) represents a shape ratio (SR) = 2.0.
Figure 7.
Illustration of geometry of an e-machine. (a) represents a shape ratio (SR) = 0.5 and (b) represents a shape ratio (SR) = 1.2 and (c) represents a shape ratio (SR) = 2.0.
Figure 8.
Illustration of suitable geometry for (a) an in-wheel e-machine and (b) central arrangement.
Figure 8.
Illustration of suitable geometry for (a) an in-wheel e-machine and (b) central arrangement.
Figure 9.
(
a) Conduction paths and methods for thermal management: the cooling jacket and axial channel and (
b) a schematic view of e-machine cross-section with conduction paths [
24].
Figure 9.
(
a) Conduction paths and methods for thermal management: the cooling jacket and axial channel and (
b) a schematic view of e-machine cross-section with conduction paths [
24].
Table 1.
Rating of different e-machine types [
2,
16,
17].
Table 1.
Rating of different e-machine types [
2,
16,
17].
| Characteristic | ASM/IM | PMSM | EESM | SRM |
|---|
| Power density | - | ++ | + | - |
| Efficiency | -- | ++ | + | - |
| Cost | ++ | - | + | + |
| Noise level | ++ | ++ | - | - |
| Control systems | ++ | + | + | - |
Table 2.
Overview of all the use cases evaluated based on the weight of the vehicle, drive cycle, shape, and split ratio.
Table 2.
Overview of all the use cases evaluated based on the weight of the vehicle, drive cycle, shape, and split ratio.
| Weight of the Vehicle (GVW) | Drive Cycle | Shape Ratio (SR) | Split Ratio (α) |
|---|
| 7.5 t | WLTC1_mod | 0.5–2.0 | 0.62 |
| WLTC2_mod |
| WLTC3_mod |
| 18 t | WLTC1_mod | 0.5–2.0 | 0.62 |
| WLTC2_mod |
| WLTC3_mod |
| 40 t | WLTC1_mod | 0.5–2.0 | 0.62 |
| WLTC2_mod |
| WLTC3_mod |
Table 3.
Overview of the vehicle and powertrain parameters used in the evaluation of the 7.5 t, 18 t, and 40 t vehicles.
Table 3.
Overview of the vehicle and powertrain parameters used in the evaluation of the 7.5 t, 18 t, and 40 t vehicles.
| | 7.5 t | 18 t | 40 t | |
|---|
| Parameter | Value | Value | Value | Unit |
|---|
| Configuration of the vehicle | 4 × 2 | 6 × 4 | 6 × 4 | |
| Truck mass, fully loaded | 7500 | 14,500 | 35,000 | kg |
| Load of the vehicle | 3500 | 8785 | 27,600 | kg |
| Unloaded truck mass | 4000 | 5715 | 7400 | kg |
| Rolling resistance | 0.01 | 0.01 | 0.01 | |
| Frontal area | 7.4 | 8.0 | 10.0 | m² |
| Air drag coefficient | 0.6 | 0.6 | 0.6 | |
| Dynamic wheel radius | 0.37 | 0.5 | 0.45 | m |
| Differential ratio | 5.57 | 4.6 | 4.55 | |
| Differential efficiency | 0.98 | 1.0 | 0.98 | |
| Gear ratio | 2.5 | 2.5 | 2.5 | |
| Gear efficiency | 0.9 | 0.9 | 0.9 | |
Table 4.
Summary of heavy-duty trucks of various OEMs and their corresponding powertrain topology parameters considered [
22].
Table 4.
Summary of heavy-duty trucks of various OEMs and their corresponding powertrain topology parameters considered [
22].
| S.No. | Concept | Topology | Gears | No. of Machines | Machine Type | Rated Power (kW) | Rated Rot. Velocity (rpm) | Max. EM Torque (Nm) |
|---|
| 1 | Axletech EPS785 | Central motor | 1 | 1 | PMSM | 350 | - | 3500 |
| 2 | DAF CF Electric | Central motor | 1 | 1 | PMSM | 210 | 8837 | 2000 |
| 3 | Tesla Semi | distributed | 1 | 4 | PMSM | 223 | 2525 | 380 |
| 4 | E-Force EF18 SZM | Dual central motor | 3 | 2 | PMSM | 150 | - | 2025 |
| 5 | Nikola Tre | Dual central motor, eAxle | 1 | 2 | PMSM | 240 | | 900 |
Table 5.
Assumptions of input parameters for the machine design tool MEAPA [
22].
Table 5.
Assumptions of input parameters for the machine design tool MEAPA [
22].
| Parameter | Symbol | Value | Unit |
|---|
| Voltage (rated) | U | 800 | V |
| Number of pole pairs | P | 4 | - |
| Rot. Velocity (max) | nmax | 1.75 nN | rpm |
| Power factor | Cos | 1 | - |
| Number of phases | M | 3 | - |
| Magnet arrangements | - | Internal, embedded | - |
| Circuit wiring | - | Star | - |
| Wire type | - | Round wire | - |
| Cooling type | - | Liquid | - |
| Iron material | - | VACOFLUX50 | - |
| Conductor material | - | Copper | - |
| Winding type | - | Single layer, integral slot | - |
Table 6.
Summary of the selected efficiency maps [
22].
Table 6.
Summary of the selected efficiency maps [
22].
| Weight of the Vehicle (GVW) | Efficiency Map Characteristics | Value | Unit |
|---|
| 7.5 t | Max. rated torque | 380.88 | Nm |
| Max. rated speed | 17,900 | rpm |
| 18 t and 40 t | Max. rated torque | 2018 | Nm |
| Max. rated speed | 15,465 | rpm |
Table 7.
Overview of the assumptions and considered parameter values.
Table 7.
Overview of the assumptions and considered parameter values.
| Parameter | Value | Comments |
|---|
| Type of vehicle | BEV | As defined in Section 3.1 |
| GVW (t) | 7.5, 18 and 40 |
| Drive Cycles | WLTC1_mod, WLTC2_mod, and WLTC3_mod |
| Gear efficiency | 0.9 |
| Differential efficiency | 0.98 |
| Vehicle & powertrain parameters | various |
| Shape ratio (SR) | 0.5–2.0 | As defined in Section 3.3 |
| Split ratio (α) | 0.62 |
| Torque density (Nm/m3) | 18,346 |
| Rated Voltage (V) | 800 | As defined in Section 3.2.1 |
| Number of pole pairs | 4 |
| Max. rotational speed (rpm) | 1.75 nN |
| Power factor | 1 |
| Number of phases | 3 |
| Magnet arrangements | Internal, embedded |
| Circuit wiring | Star |
| Wire type | Round wire |
| Cooling type | Liquid |
| Iron material | VACOFLUX50 |
| Conductor material | Copper |
| Winding type | Single layer, integral slot |
| Efficiency map: 7.5 t | Max. rated torque (Nm)—380.88 | As defined in Section 3.2.2 |
| Max. rated speed (rpm)—17,900 |
| Efficiency map: 18 t and 40 t | Max. rated torque (Nm)—2018 |
| Max. rated speed (rpm)—15,465 |
| Gear reduction | Single speed gear reduction | - |
Table 8.
Overview of the behavior of e-machine cost based on different combinations of geometrical parameters split ratio (α) and shape ratio (SR) for 7.5 t vehicle and drive cycle WLTC1_mod.
Table 8.
Overview of the behavior of e-machine cost based on different combinations of geometrical parameters split ratio (α) and shape ratio (SR) for 7.5 t vehicle and drive cycle WLTC1_mod.
| Weight of the Vehicle | Drive Cycle | Split Ratio (α) | Shape Ratio (SR) | Stator OD (mm) | Rotor OD (mm) | Stack Length (mm) | E-Machine Cost (€) |
|---|
| 7.5 t | WLTC1_mod | 0.62 | 0.5 | 361.97 | 224.42 | 112.21 | 748.89 |
| 0.6 | 340.63 | 211.19 | 126.71 | 753.61 |
| 0.7 | 323.57 | 200.61 | 140.43 | 762.29 |
| 0.8 | 309.48 | 191.88 | 153.50 | 773.52 |
| 0.9 | 297.57 | 184.49 | 166.04 | 786.43 |
| 1.0 | 287.30 | 178.12 | 178.12 | 800.52 |
| 1.1 | 278.31 | 172.55 | 189.81 | 815.42 |
| 1.2 | 270.36 | 167.62 | 201.15 | 830.91 |
| 1.3 | 263.24 | 163.21 | 212.17 | 846.80 |
| 1.4 | 256.82 | 159.23 | 222.92 | 862.99 |
| 1.5 | 250.98 | 155.61 | 233.41 | 879.39 |
| 1.6 | 245.64 | 152.29 | 243.67 | 895.92 |
| 1.7 | 240.72 | 149.25 | 253.72 | 912.54 |
| 1.8 | 236.18 | 146.43 | 263.57 | 929.20 |
| 1.9 | 231.96 | 143.82 | 273.25 | 945.89 |
| 2.0 | 228.03 | 141.38 | 282.75 | 962.58 |
Table 9.
Overview of the most cost-effective e-machines for different use cases in the 7.5 t vehicle category.
Table 9.
Overview of the most cost-effective e-machines for different use cases in the 7.5 t vehicle category.
| Gross Vehicle Weight (t) | Drive Cycle | Split Ratio (α) | Shape Ratio (SR)
| Stator OD (mm)
| Rotor OD (mm)
| Stack Length (mm)
| Cost of the Core Components (€)
| E-Machine Cost (€) |
|---|
| Magnets | Copper | Shaft | Rotor Lamination Stack | Stator Lamination Stack |
|---|
| 7.5 | WLTC1_mod | 0.62 | 0.5 | 361.97 | 224.42 | 112.21 | 95.55 | 54.25 | 1.46 | 10.87 | 18.95 | 748.89 |
| WLTC2_mod | 0.5 | 388.98 | 241.17 | 120.58 | 102.68 | 58.30 | 1.57 | 11.68 | 20.37 | 804.77 |
| WLTC3_mod | 0.5 | 416.27 | 258.09 | 129.04 | 109.88 | 62.39 | 1.68 | 12.50 | 21.79 | 861.24 |
Table 10.
Overview of the most cost-effective e-machines for different use cases in the 18 t vehicle category.
Table 10.
Overview of the most cost-effective e-machines for different use cases in the 18 t vehicle category.
| Gross Vehicle Weight (t) | Drive Cycle | Split Ratio (α) | Shape Ratio (SR) | Stator OD (mm) | Rotor OD (mm) | Stack Length (mm) | Cost of the Core Components (€) | E-Machine Cost (€) |
|---|
| Magnets | Copper | Shaft | Rotor Lamination Stack | Stator Lamination Stack |
|---|
| 18 | WLTC1_mod | 0.62 | 0.5 | 381.55 | 236.56 | 118.28 | 100.71 | 57.19 | 1.54 | 11.45 | 19.98 | 789.40 |
| WLTC2_mod | 0.5 | 395.65 | 245.30 | 122.65 | 104.44 | 59.30 | 1.60 | 11.88 | 20.71 | 818.57 |
| WLTC3_mod | 0.5 | 541.31 | 335.61 | 167.81 | 142.88 | 81.13 | 2.19 | 16.25 | 28.34 | 1111.93 |
Table 11.
Overview of the most cost-effective e-machines for different use cases in the 40 t vehicle category.
Table 11.
Overview of the most cost-effective e-machines for different use cases in the 40 t vehicle category.
| Gross Vehicle Weight (t) | Drive Cycle | Split Ratio (α) | Shape Ratio (SR) | Stator OD (mm) | Rotor OD (mm) | Stack Length (mm) | Cost of the Core Components (€) | E-Machine Cost (€) |
|---|
| Magnets | Copper | Shaft | Rotor Lamination Stack | Stator Lamination Stack |
|---|
| 40 | WLTC1_mod | 0.62 | 0.5 | 445.46 | 276.18 | 138.09 | 117.58 | 66.76 | 1.80 | 13.37 | 23.32 | 921.62 |
| WLTC2_mod | 0.5 | 519.95 | 322.37 | 161.18 | 137.24 | 77.93 | 2.10 | 15.61 | 27.22 | 1075.72 |
| WLTC3_mod | 0.5 | 718.21 | 445.29 | 222.64 | 189.58 | 107.64 | 2.90 | 21.56 | 37.60 | 1485.91 |
| Disclaimer/Publisher’s Note: The statements, opinions and data contained in all publications are solely those of the individual author(s) and contributor(s) and not of MDPI and/or the editor(s). MDPI and/or the editor(s) disclaim responsibility for any injury to people or property resulting from any ideas, methods, instructions or products referred to in the content. |
© 2023 by the authors. Licensee MDPI, Basel, Switzerland. This article is an open access article distributed under the terms and conditions of the Creative Commons Attribution (CC BY) license (https://creativecommons.org/licenses/by/4.0/).


 and
and 


