Article

Development of Thresholds to Predict Grazing Behaviour of Dairy Cows from Motion Sensor Data and Application in a Pasture-Based Automatic Milking System

1
Faculty of Veterinary & Agricultural Sciences, The University of Melbourne, Parkville Campus, Parkville, VIC 3010, Australia
2
Faculty of Veterinary & Agricultural Sciences, The University of Melbourne, Dookie Campus, Dookie, VIC 3647, Australia
*
Author to whom correspondence should be addressed.
Dairy 2023, 4(1), 124-136; https://doi.org/10.3390/dairy4010009
Submission received: 13 December 2022 / Revised: 23 January 2023 / Accepted: 26 January 2023 / Published: 29 January 2023
(This article belongs to the Special Issue Advances in Digital Dairy)

Abstract

:
The monitoring and measurement of animal behaviour may be valuable for improving animal production and welfare. This study was designed to develop thresholds to predict the grazing, standing, walking, and lying behaviour of dairy cows from motion sensor (IceTag) output. The experiment included 29 lactating cows grazed in a pasture-based dairy production system with voluntary cow movement in northern Victoria, Australia. Sensors recorded motion data at 1 min intervals. A total of 5818 min of cow observations were used. Two approaches were developed using (1) the IceTag lying index and steps only and (2) the IceTag lying index, steps, and motion index for each behaviour. Grazing behaviour was best predicted by the second approach, which had a sensitivity of 92% and specificity of 60%. The thresholds were then used to predict cow behaviour during two periods. On average, across both time periods, cows spent 38% of the day grazing, 38% lying, 19% standing, and 5% walking. Predicted individual cow grazing time was positively correlated with both milk production and milking frequency. The thresholds developed were effective at predicting cow behaviours and can be applied to measure behaviour in pasture-based dairy production.

1. Introduction

Precisely monitoring and measuring animal behaviours has the potential to increase the efficiency of production and product quality from livestock systems, including dairy [1]. The intensification of dairy production, including industry trends towards larger herds and greater use of automatic milking systems (AMS), will require a greater measurement and understanding of the behaviour of dairy cows [2]. For example, increasing herd sizes may lead to longer waiting times for cows in the milking parlour and longer time off pasture with reduced time for grazing and resting [3], while in AMS, a thorough understanding of grazing behaviour is needed to facilitate voluntary cow movement [4]. Compared to conventional milking systems where cows are herded between the pasture and milking parlour as a group, in AMS, cows move voluntarily as individuals or in small groups, so they enter and exit the pasture allocation at different times. This voluntary cow movement between the pasture and milking parlour is a major variable that impacts on milking frequency and production [4]. Therefore, understanding the grazing behaviour of individual cows is important to increase the accuracy of pasture allocation in AMS and further improve animal production.
Over the past seven decades, automatic sensors have been invented and developed to monitor animal behaviours, which are less labour intensive than visual observation and reduce human interference [5]. However, the accuracies and accessibilities of these sensors are varied; for example, while noseband pressure-based sensors are more accurate in classifying jaw activities than other sensors, accelerometers are more practical on commercial farms [6]. Among these behaviour sensors, the IceTag sensor (IceTag, IceRobotics Ltd., Edinburgh, Scotland) is a motion sensor that can be used under research and commercial conditions on dairy farms and has been validated to measure posture (lying or standing) and the number of steps taken in pasture-based systems [7]. The IceTag records activity as steps and a motion-index indicative of the amount of movement [7,8]. The IceTag was found to be reasonably accurate in differentiating between standing and walking in dairy cows with a misclassification rate of 10% when using a rolling 3 s average [9].
The IceTag sensor was specifically developed for adult cattle but has been used on other categories and species, such as young calves [10] and lambs [11]. While previous studies found that the IceTag sensor measured some behaviours accurately (lying or standing), it did not accurately measure steps in lambs [11] and calves [10]. In cows, algorithms have been developed that have made the IceTag sensor multifunctional, and it can operate with reasonable overall accuracy to detect oestrus [7] and lameness [12] and to map the diurnal patterns of animal position and step rate [13]. However, when differentiating different motion behaviours (grazing, standing, and walking), the overlap of the number of steps and motion index made these behaviours challenging to differentiate [10]. Some algorithms have been developed to predict lying, standing, and walking behaviour rather than grazing behaviour. However, previous work on grazing behaviour by using a pedometer increased the precision of the prediction of grazing behaviour while sacrificing standing and walking behaviours [13]. There is a need to further develop the thresholds to better differentiate between grazing, standing, and walking behaviour.
Cows modify their grazing and walking behaviour under different management regimes [14]. Compared to conventional milking systems (CMS), cow behaviours tend to become less synchronous in AMS [15]. In CMS, animals are fetched from paddocks to milking parlours around the time of milking, while in AMS, cows move voluntarily and choose when to feed, rest, and be milked [15,16]. The animals must be motivated to act independently and walk between the pasture and the milking unit several times a day [15]. It is likely that the amount of pasture and the distance from the pasture to the milking unit play a role in controlling the independent voluntary movement of cows [17] and hence the overall natural range of behaviours in AMS. Behaviours, particularly grazing, are also influenced by the time of the day [18]. Cows follow a distinct diurnal grazing pattern; for example, Gibb et al. (1997) [18] observed five grazing bouts per day, most occurring during daylight, and only one grazing bout occurring between 2200 and 0600 h. Another study showed that during the hours of daylight, the average time that cattle spent grazing ranged from 4.5 to 9.3 h, whereas over the whole 24 h period, the time spent grazing ranged from 6.8 to 13.0 h, which indicates the amount of grazing during the daylight was greater than that during the dark [19]. Among the grazing bouts per day, the dusk bout was the longest, occupying approximately 40% of the daily total feeding time [20]. The grazing behaviour of cows is also influenced by other cues, such as social herd structures [21], as well as herd management [22].
The aim of this study was to develop thresholds to differentiate behaviours (in particular, grazing, standing, walking, and lying behaviour) of dairy cows using IceTag data. The thresholds were then used to determine the temporal grazing behaviour of dairy cows in a pasture-based AMS and the correlations between predicted behaviours and cow characteristics and production.

2. Materials and Methods

2.1. Site and Farm Details

The study described was approved by the Faculty of Veterinary and Agricultural Sciences Animal Ethics committee at The University of Melbourne (ID number: 1814481.1). The study was conducted at The University of Melbourne Dookie Campus dairy farm, in northern Victoria, Australia (36°22′48′′ S, 145°42′36′′ E). The region has a Mediterranean climate with annual average rainfall of 550 mm. The dairy farm has a pasture-based production system with an AMS and voluntary cow movement. There were 55 hectares of pastures on the farm that are sown to either perennial ryegrass (Lolium perenne) or annual ryegrass (Lolium multiflorum)-based pastures. The dairy milking herd contained up to 158 Holstein-Friesian cows of mixed ages with a split calving system, where approximately two-thirds of the cows calved in late winter–early spring and the remainder calved in autumn. The AMS consisted of three Lely Astronaut robotic milking machines (Astronaut milking machine; Lely Industries NV, Maasland, The Netherlands). A ‘3-way’ grazing system was implemented, where the pasture area was divided into three zones, and the cows were allowed access to a new paddock approximately every 8 h. Cows voluntarily moved from the paddock to the dairy individually or in small groups. This voluntary movement resulted in different milking frequencies for individual cows. Depending on the paddock allocated to the grazing herd, cows had to walk from 100 m to 1 km from the paddock to the AMS. The diet of the herd varies seasonally, but on an annual basis, grazed pasture was approximately 50% of the cows’ diet with 30% from concentrates and 20% from hay/silage. Drinking water was available ad libitum in the paddocks and at the dairy shed. Each cow was fitted with an electronic identification collar (Owes-H system, Lely, Massluis, The Netherlands), and cow-milking records were registered in the herd management software (T4C InHerd, Lely, Maassluis, The Netherlands). The cow and production data used in this study were time of milking, lactation days, milking frequency per day, lactation number (parity), liveweight (kg), milk yield (kg/day), milk fat (%), and milk protein (%). All of these production data were reported daily for individual cows from the herd management software (T4C InHerd, Lely, Maassluis, The Netherlands).

2.2. Cow Selection and Behaviour Observations

The observations used to develop the thresholds to predict grazing, standing, walking, and lying behaviours were conducted with a total of 29 lactating cows over two separate periods in 2018. In the first period from 6 to 20 September, 15 cows were selected from a herd of 150 cows. The second period was 6–27 November when another 14 cows were selected from a herd of 147 cows. Cows were selected based on their milking orders two weeks before the experiment. Milking orders were calculated as the percentile rank of cows using the morning milking times of individual cows from first to last following the procedure of Cullen et al. (2020) [23]. The aim of cow selection was to include cows with a broad range of milking orders in both periods, as milking orders have been shown to be correlated with cow characteristics and production in the herd [23]. No cows that showed clinical symptoms of lameness or other health issues were included in this study. Their diet consisted of 5.4 kg/day/cow cereal-grain based pellets offered by AMS and fed during milking, and <1 kg DM/day/cow cereal hay was offered on the side of laneway, together with a back-calculated estimated pasture intake (using the Primary Industries Standing Committee (2007) method [24]) of 10.5 and 12.7 kg DM/day in September and November, respectively.
IceTag activity sensors (IceTag; IceRobotics Ltd., Edinburgh, Scotland) were fitted to the rear, left leg of each cow on the first day of each observation period. These cows were also visually marked with stock spray so they could be individually identified from a distance. The IceTag is a three-axis accelerometer that can record cows’ motion behaviours. The IceTag sensor recorded the activity in three-dimensions and stored it in the SD memory card until the data were downloaded after the experiment. The activity data were downloaded in 1 min intervals with three variables: lying (0–100 scale, where higher numbers indicate the leg is horizontal and in a lying position), steps (number per minute), and the motion index (overall index of movement).
Cow behaviour was recorded as grazing, walking, standing, or lying by trained technicians for continuous 30 min periods on individual cows using the definitions in Table 1. Cow observations were conducted throughout the experimental periods during daylight hours by technicians observing the cows from a distance of 10–50 m. To meet the objective of defining grazing behaviour, most observations were selected to monitor cows when they were grazing. The start and end times of each cow observation were recorded to synchronise the behaviour data with the IceTag activity. Each time that the behaviour changed was also recorded (e.g., when the cow stopped grazing and started walking). Behaviour was classified for each 1 min interval by noting which of the four behaviours (grazing, walking, standing, or lying) was observed for the longest period of each minute. There were 102 cow observations in September (average 6.8 observations per cow, range 5–9) and 99 observations in November (average 7.1 observations per cow, range 3–9). The total duration of recorded observations was 6102 min. However, the IceTag data from one cow in the November period (6 observations) could not be retrieved, so these data were excluded from the analysis, leaving 5922 min of observation for further analysis.

2.3. Data Analysis

The 1 min interval cow behaviour observations and IceTag data (lying index, motion index, and steps) were manually compared to check for obvious errors. For example, if a cow was observed as being upright but the IceTag identified it as lying with high lying index, this indicated that the cow had been misidentified. This process identified 104 min (<2% of observations) of data that were excluded from further analysis. In total, across the September and November periods, there were 5818 min of observations used to develop the thresholds (4387 min of grazing, 607 min of standing, 497 min of lying, and 327 min of walking).
Thresholds to predict grazing, standing, walking, and lying behaviour from the IceTag data were developed by comparing the 1 min IceTag data with the 5818 min of observed data across the September and November periods. First, thresholds were developed using the IceTag lying and steps only, then with the IceTag lying, steps, and motion index. Different thresholds of IceTag lying index (0–100, in units of 10), steps (0–25, in individual units), and the motion index (0–30, in individual units) were manually tested for each behaviour. The predictions from different combinations of thresholds were visually assessed to achieve the highest sensitivity (Sn, true positive rate), specificity (Sp, true negative rate), positive predicted value (PPV), negative predicted value (NPV), while predicting a similar total number of behaviours as there were observations of each behaviour. The following equations were used:
S n = T P T P + F N × 100    
S p = T N T N + F P × 100
P P V = T P T P + F P × 100
N P V = T N F N + T N × 100    
where TP = number of true positive observations, FN = number of false negative observations, TN = number of true negative observations, and FP = number of false positive observations. The total misclassification rate for grazing, walking, and standing behaviour was also calculated.
The thresholds were also tested across 2 and 5 min intervals. The behaviour for each 2 or 5 min interval was classified as grazing, walking, standing, or lying according to the most common recorded at the 1 min intervals, and if there was equal number of two different behaviours, then the behaviour recorded first was used. For example, in a 5 min interval, if the behaviours in individual minutes were grazing, grazing, standing, walking, and walking, then the 5 min interval was recorded as grazing because it occurred first. The number of steps, motion, and lying indices were averaged over the 2 or 5 min intervals. The predictions were assessed using the same statistics described above.
Using the thresholds developed, the individual cow IceTag data were used to predict the behaviours (grazing, standing, walking, or lying) of each cow at 1 min intervals for the periods 10–19 September and 7–26 November 2018. The data were summarised as the average number of minutes of each behaviour per cow per day (behaviours in milking were also recorded) and the average percentage of cows showing each behaviour for each minute of the day for both periods.
To investigate the relationships between predicted behaviour and cow characteristics and production, the individual cow average behaviour time (measured by IceTag) was compared with the corresponding average production values for both periods. The cow milking order was calculated for each cow as an average over the experimental periods based on morning milking times, following the procedure of Cullen et al. (2020) [23]. Correlations between behaviours, cow characteristics, and production were calculated using Microsoft Excel, 2016 version (Redmond, WA, USA).

3. Results

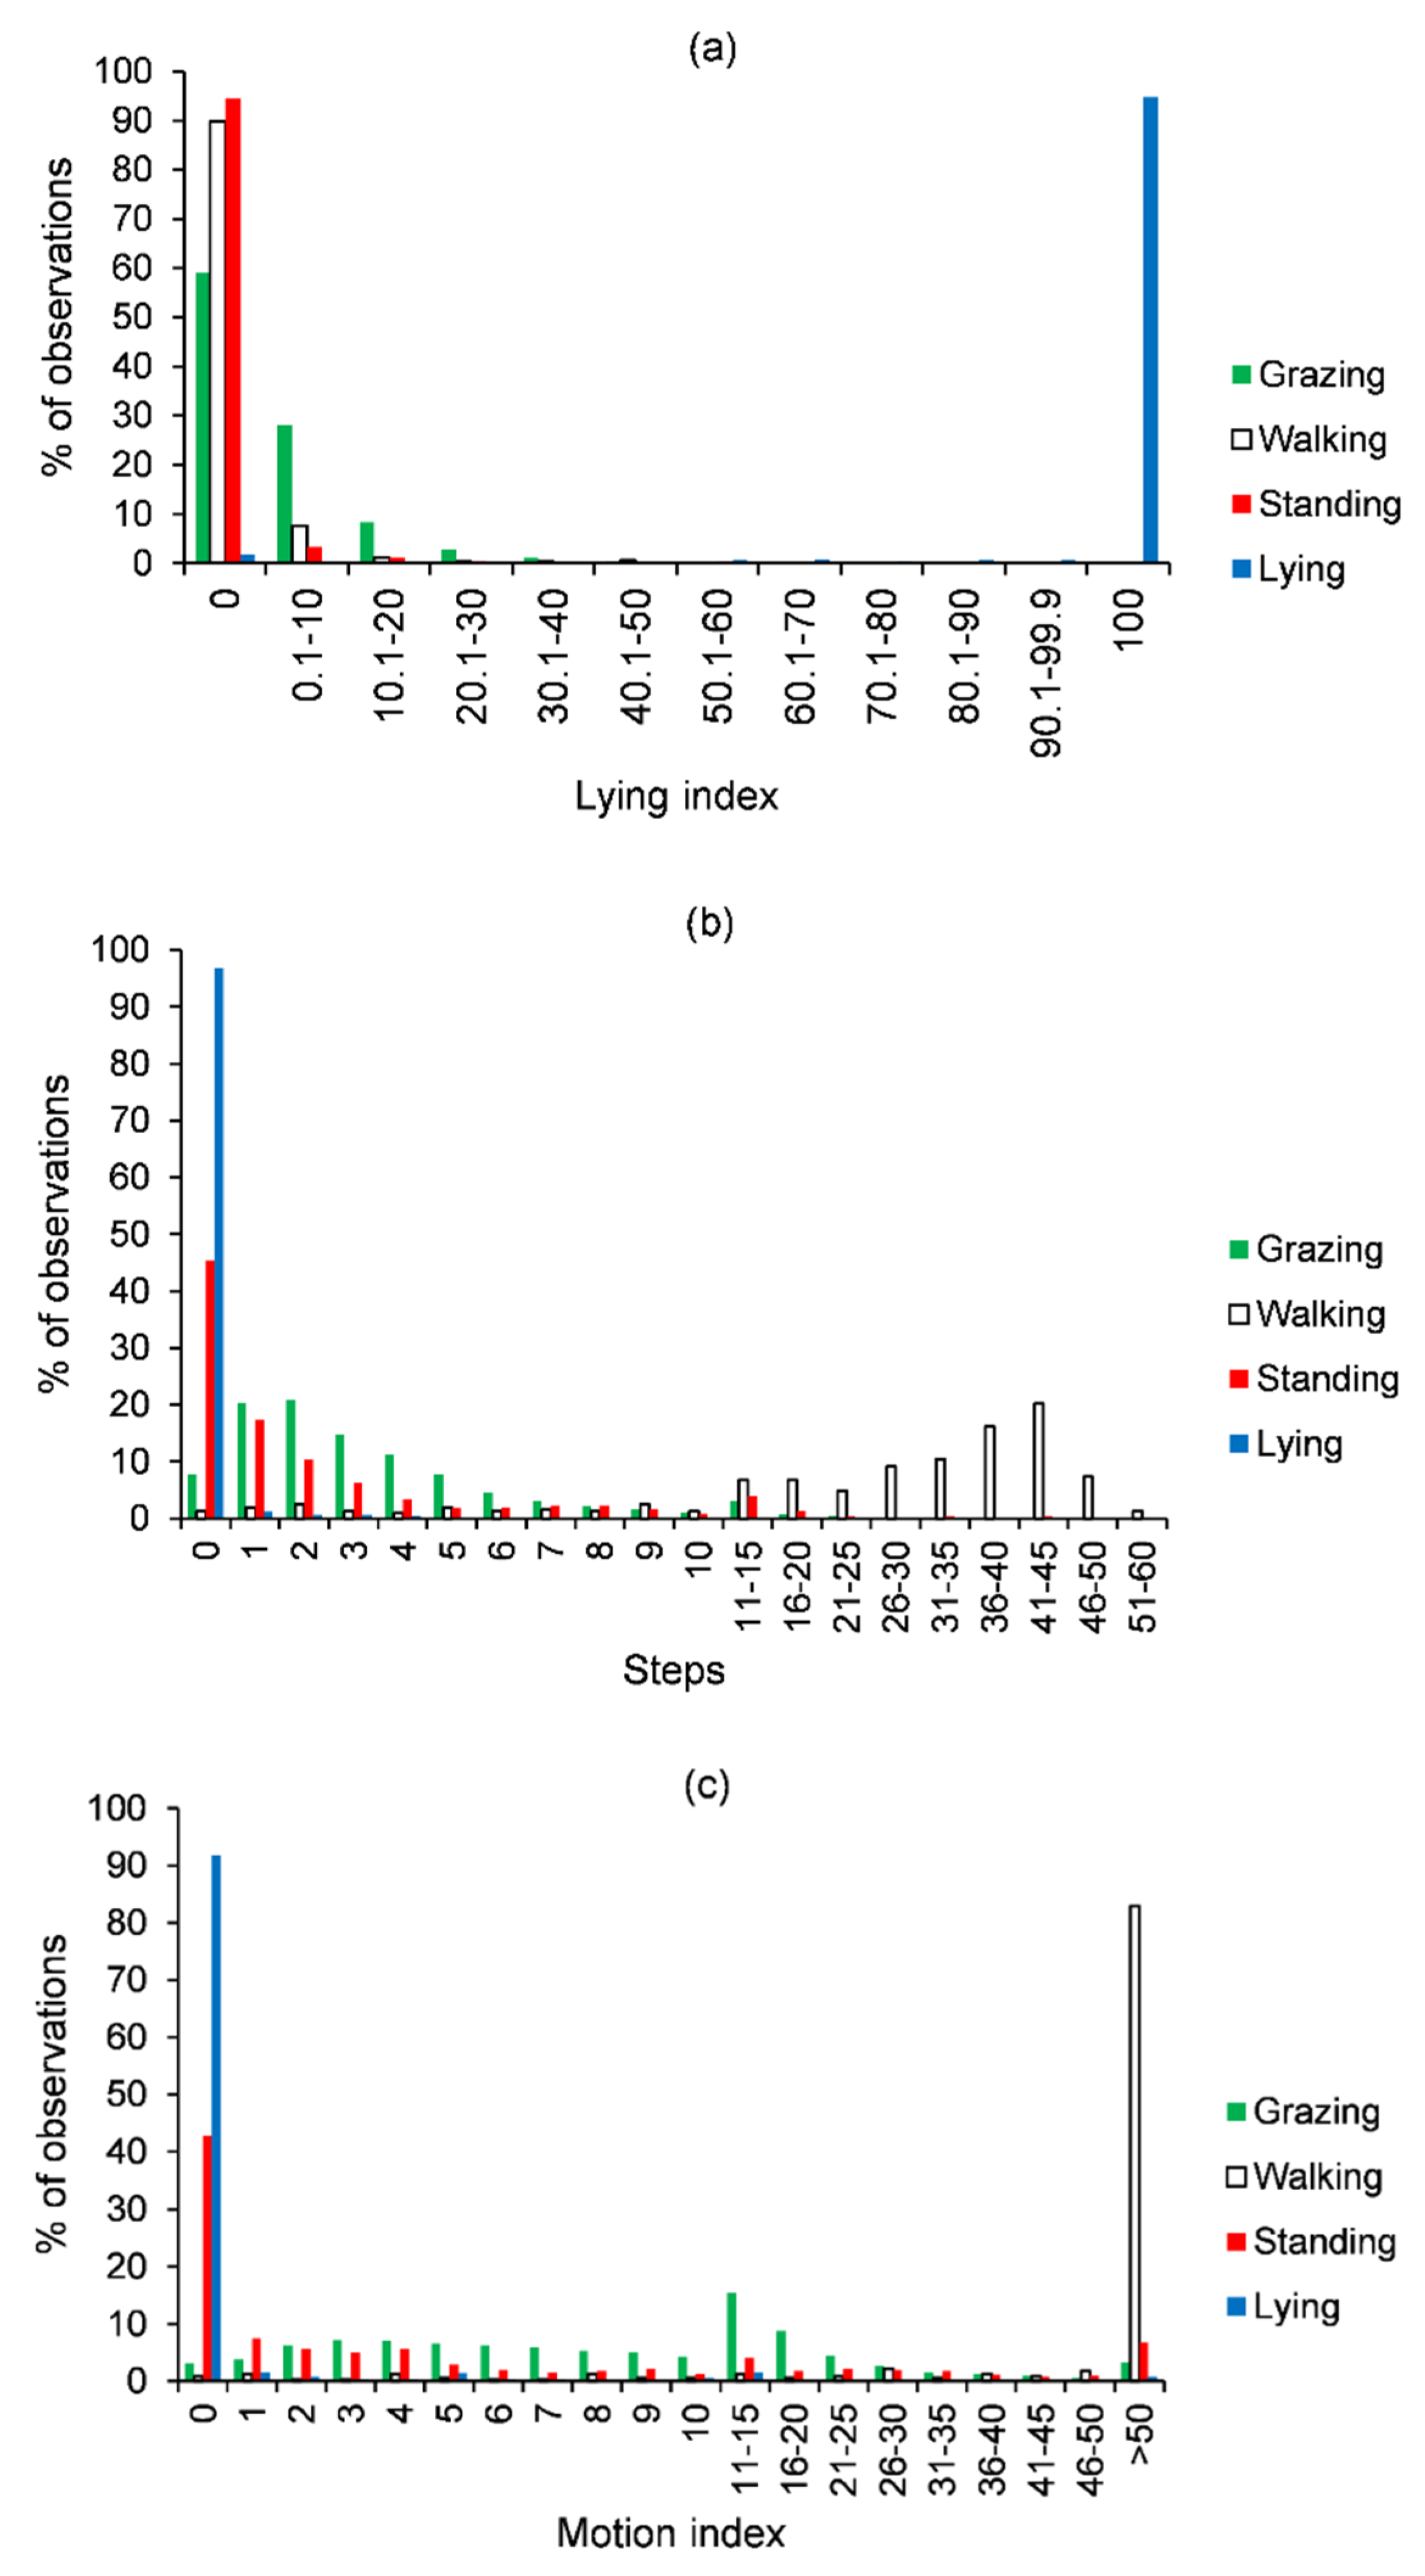
3.1. Thresholds to Predict Behaviour

The observed behaviour and the corresponding IceTag data for lying, steps, and the motion index is shown in Figure 1. The IceTag lying data showed that 95% of the lying observations had a lying index value of 100, and 98% of the lying observations were >50 on the lying index (Figure 1a). More than 99% of the grazing, walking, and standing observations had an IceTag lying value of <50; however, there was more variation with grazing.
Grazing observations most commonly had IceTag steps values of 1 or 2 steps/minute (each 20% of observation), with 91% of grazing observations having 1–15 steps/minute (Figure 1b). Eight percent of grazing observations had no steps. Similar patterns were observed with the motion index, where 94% of grazing observations had a value in the range of 1–50, and 3% had a value of zero (Figure 1c). Walking behaviour had higher steps and a higher motion index than grazing, but it was also more variable. Eighty-three percent of walking observations had 11–60 steps/minute and a motion index > 50 (Figure 1b,c). For standing behaviour, 45 and 48% of observations had 0 and 1–10 steps/minute, respectively, while 43 and 36% of observations had the motion index value of 0 and 1–10, respectively, (Figure 1b,c).
Thresholds to predict behaviours based on IceTag lying and steps only and IceTag lying, steps, and the motion index are shown in Table 2. Lying behaviour was most accurately predicted, with a PPV of 95.5% and a NPV of 99.9%. In general, the predictions of grazing, standing, and walking behaviour between the two approaches were also similar; however, there were some small improvements in predictions when the motion index was included (the sum of sensitivity and specificity was slightly increased for grazing and standing when the motion index was included but was slightly lower for walking). The low specificity and NPV for grazing predictions and the low sensitivity and PPV for standing predictions (Table 2) indicate that differentiating between standing and grazing was the most difficult. When the motion index was included, these predictions were slightly improved. Both approaches predicted walking behaviour quite well.
Compared to the total number of observations of each behaviour, the thresholds with only IceTag lying and steps slightly underpredicted the number of grazing observations (98.9%) and overpredicted the number of lying, walking, and standing observations at the 1 min time scale (102.0, 111.6, and 102.3%, respectively). By comparison, the thresholds with IceTag lying, steps, and the motion index slightly overpredicted the number of lying and grazing (102 and 100.5%, respectively) but under-predicted the number of standing and walking (97.2 and 98.2%, respectively) observations. This indicates that the thresholds with IceTag lying, steps, and the motion index had a small improvement in predicting the total number of behaviour observations, particularly for grazing. The combined misclassification rate for grazing, walking, and standing behaviours was 15.7% using steps only and 13.9% using steps and the lying index, indicating that some of the prediction errors for individual behaviours cancel each other out when compared against the total number of observations.
The thresholds used for predictions at the 1 min intervals had the highest Se and Sp, with declining results for the 2 and 5 min intervals (Table 2). There were some minor exceptions to this; for example, grazing predictions had higher Se at the 2 min intervals compared to 1 min, but there was a decline in Sp. The Se of walking behaviour decreased substantially from 2 to 5 min intervals.

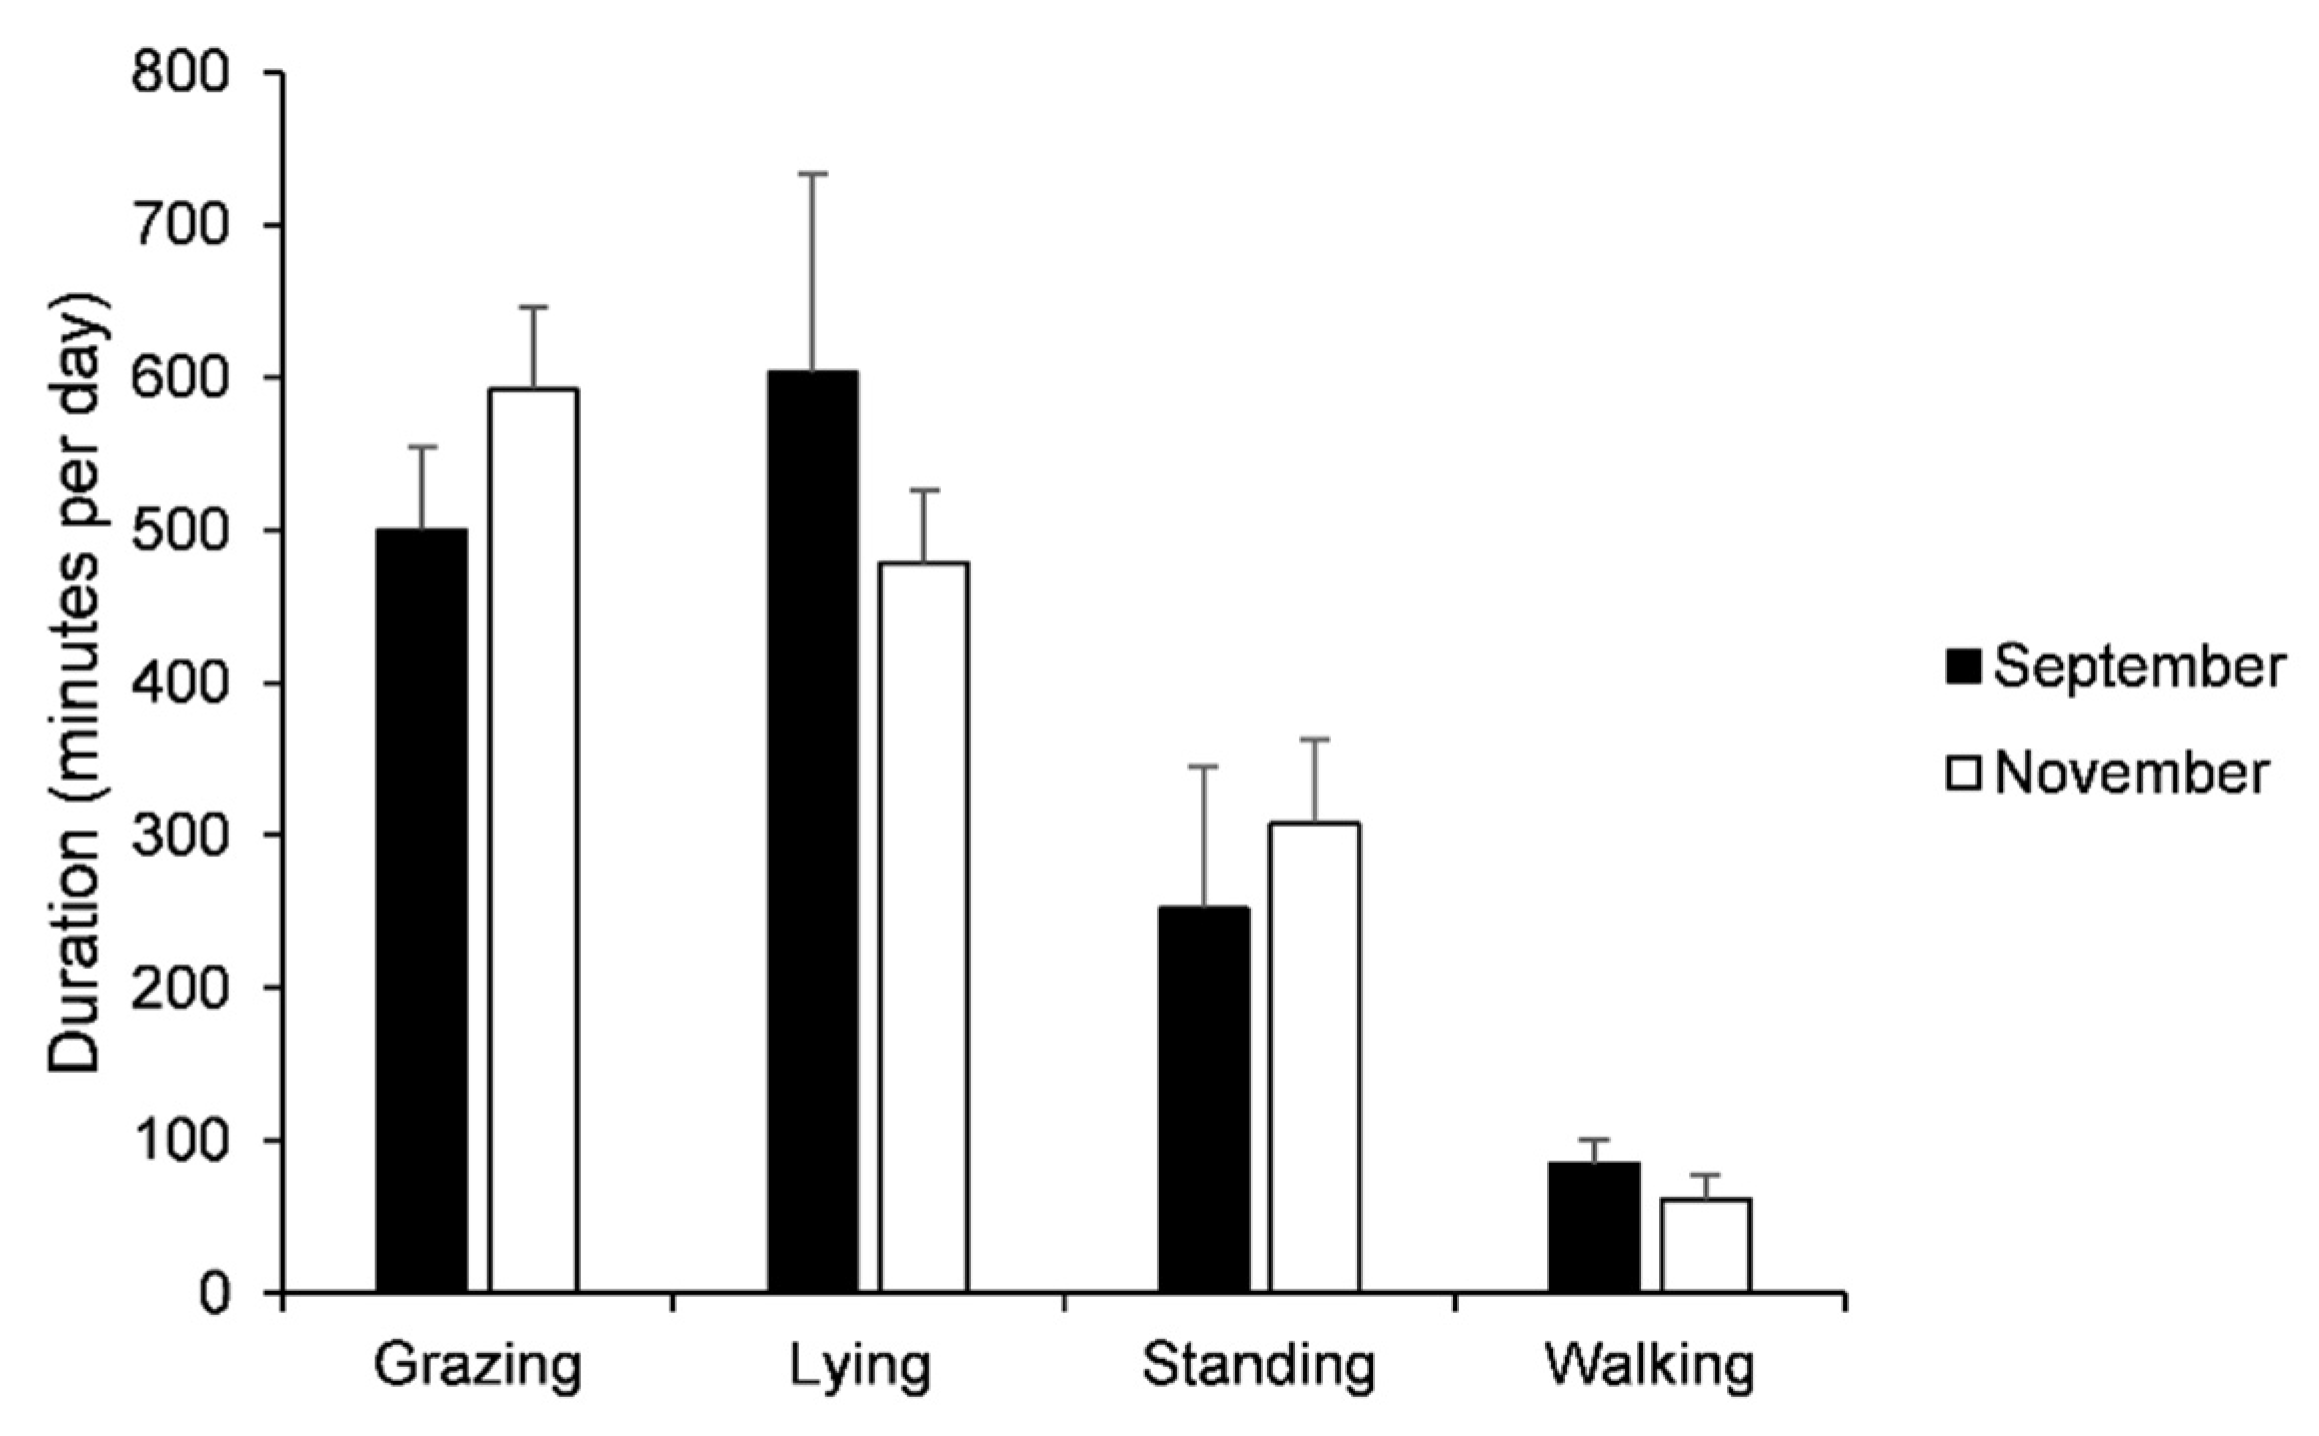
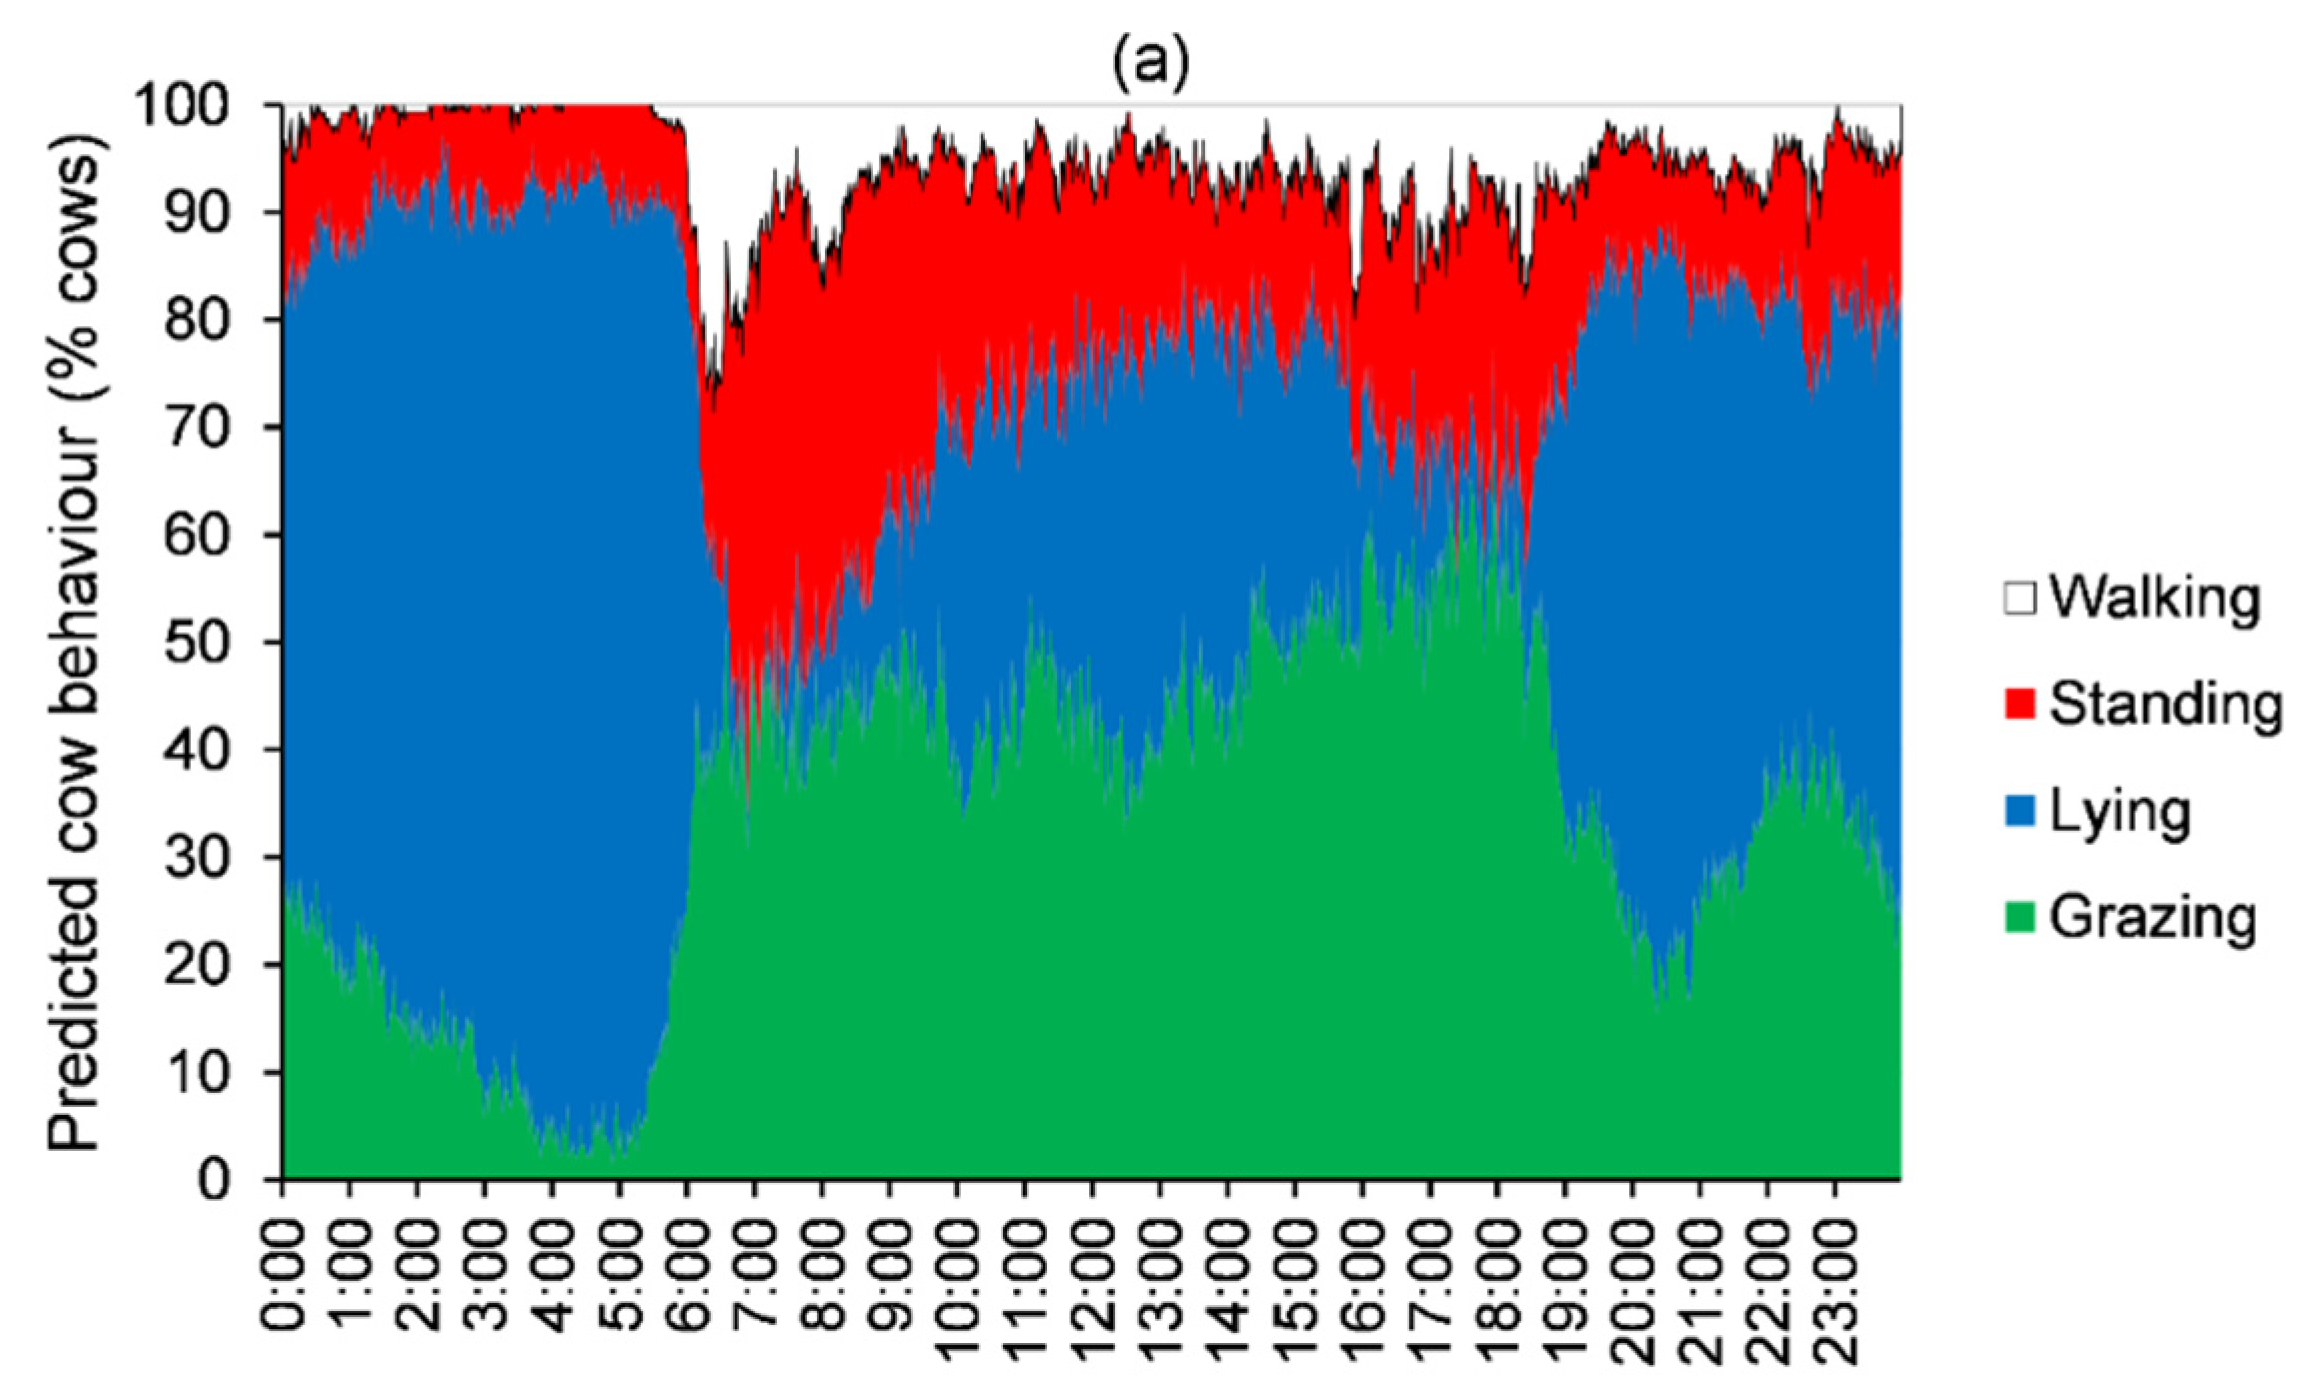
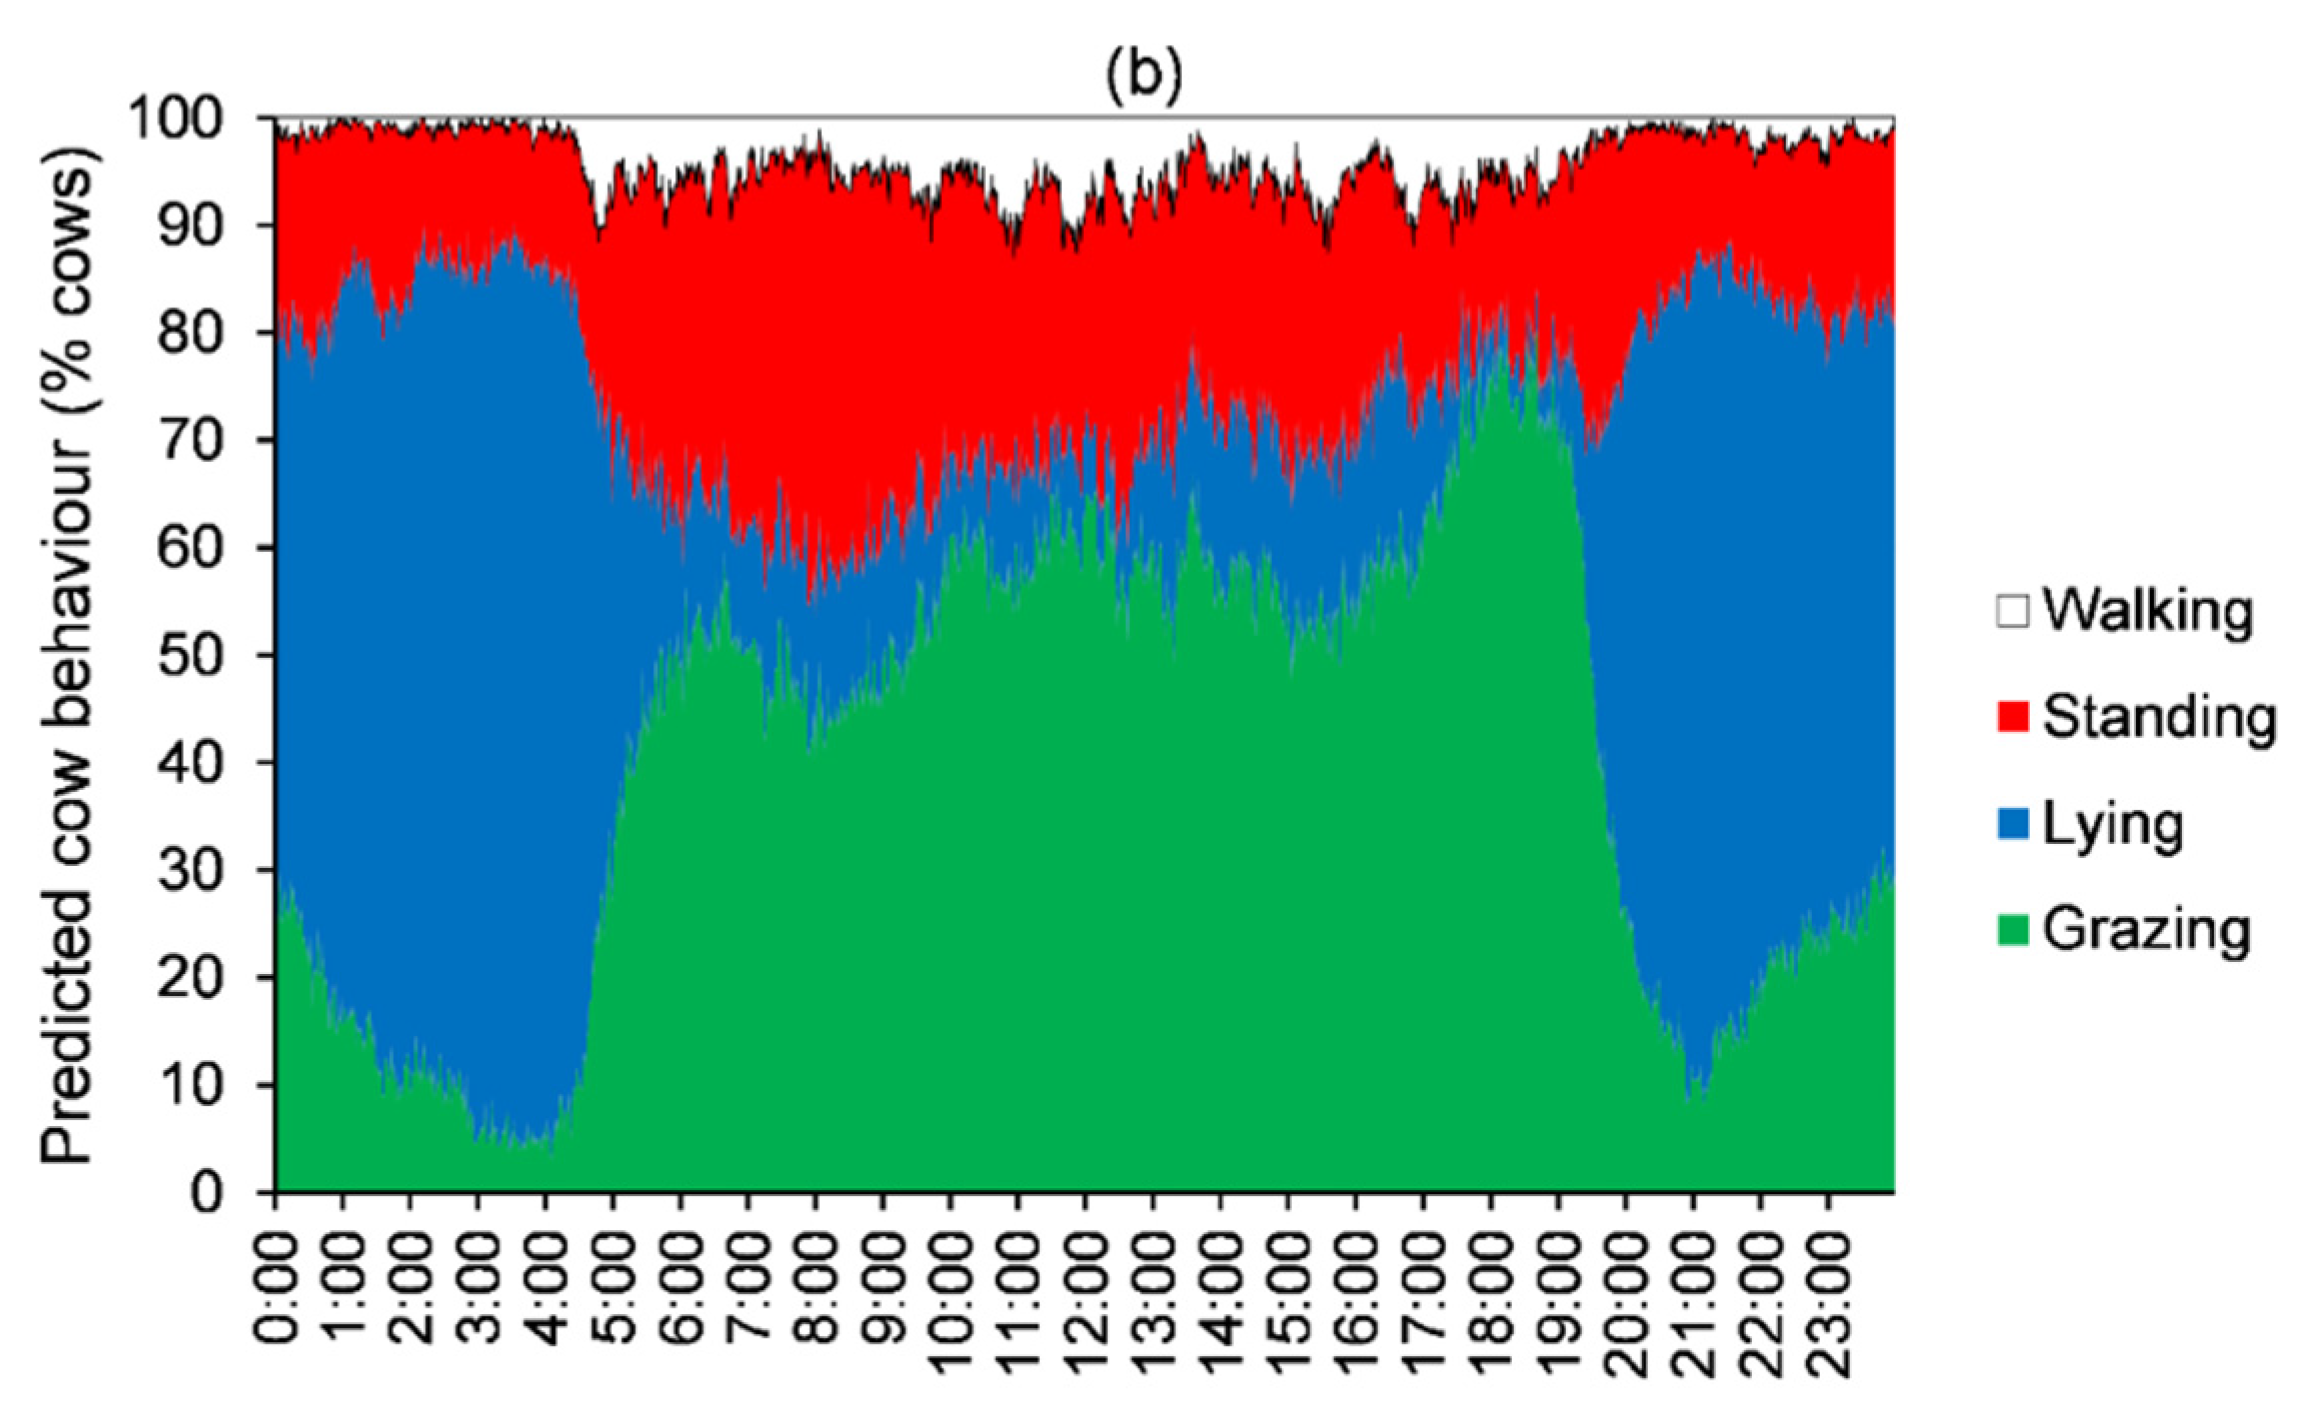
3.2. Predicted Dairy Cow Behaviour

The thresholds at 1 min intervals that included the IceTag lying index, steps, and motion index were used to predict dairy cow behaviour of the same focal animals within the same herd at 1 min intervals over the periods 10–19 September and 7–26 November 2018. The average predicted grazing time of cows in September was 500 min/day (range 397–609) and in November was 592 min/day (range 467–678, Figure 2). On average, across both time periods, it was predicted that cows spent 38% of the day both grazing and lying, 19% standing, and 5% of the day walking.
The average diurnal behaviour patterns of the cows in September and November showed that grazing is distributed during the day with peaks in the early morning, around midday, and in the early evening (Figure 3). Lying behaviour mainly occurred during the night. Walking occurred throughout the day and usually in less than 15% of the cows at any one time. Standing was more common during daylight hours compared to night. It is important to note that the data are averaged over cows and days, so distinct grazing or lying bouts of individual cows are not visible.

3.3. Correlations between Behaviour and Cow Characteristics

The average and range of cow characteristics and production data during the September and November experimental periods are shown in Table 3. There was a positive correlation between predicted grazing and walking times in both September and November, and a negative relationship between predicted grazing and standing time in November (Table 4). Grazing time was positively associated with milk solids (kg/cow) and milking frequency, but milk solids and milking frequency were also positively correlated. Walking time was positively associated with milking frequency in both months.

4. Discussion

4.1. Thresholds to Predict Behaviour

Visual observations are a more accurate method of collecting behaviour data, but they are time-consuming. Motion sensors may be a more practical method to collect behaviour data over more extended periods. The thresholds to predict dairy cow lying, standing, grazing, and walking behaviours utilising IceTag lying, steps, and the motion index was a better predictor than one based on IceTag lying and steps only. This was based on 5818 min of observed behaviours of 29 Holstein-Friesian cows fitted in a pasture-based AMS, utilising the 1 min interval IceTag data. Lying and walking behaviours were very well-predicted, but it was difficult to differentiate between grazing and standing behaviour (Figure 1 and Table 2). This may be attributed to the overlap of grazing behaviour and standing behaviour. While grazing is usually characterised by slow, intermittent movements, there are some instances of grazing when no steps were recorded (Figure 1). The IceTag sensor was attached on the leg, so when a cow was grazing in the same area for several bites without moving, grazing behaviour may be misclassified as standing. It is also possible that behaviour changes within the 1 min time frame caused misclassification because observers classified the behaviour as the one that occupied most of the minute. So, if a cow was standing for >30 s then started grazing, the visual observation would be classified as standing, but a number of steps would be recorded by the IceTag. The use of the IceTag motion index improved the distinction between grazing and standing, but the statistics in Table 2 demonstrate that under real grazing conditions, the difference between grazing and standing was hard to predict. Improvements in predictions may have been achieved if a shorter timestep for observation and prediction was used [23]. The requirement for shorter time intervals is supported by the lower accuracy of prediction in the 2 and 5 min intervals, particularly for walking and standing behaviours (Table 2).
Overall, the results of this study were consistent with previous studies that have examined the use of IceTag data to distinguish between grazing and other behaviours. A number of studies have reported that the IceTag data are very effective at separating lying and standing behaviour but that it is difficult to distinguish between grazing and upright behaviours (standing and walking) [10,13,25].

4.2. Predicted Dairy Cow Activity

This is the first study to quantify the temporal patterns of the grazing behaviour of dairy cows in pasture-based AMS on a 1 min timescale. One of the characteristics of AMS with voluntary cow traffic is the distributed milking pattern, and this is observed by the low proportion of cows showing walking behaviour at any one time but distributed throughout the day (Figure 3), which would contrast with walking behaviour in CMS when all or large groups of cows are herded to the dairy at the same time. The voluntary behaviour by cows in AMS is indicative of more natural patterns of grazing and lying bouts, compared to the imposed pattern of (mostly) twice daily milking followed by grazing.
In this study, the average predicted time that cows grazed was 9.1 h/day (range of average for individual cows 6.6–11.3 h/day), which is within the range of 6.8 to 13.0 h reported by John et al. (2017) [19]. The diurnal pattern of grazing and greater amount of grazing time in daylight compared to during the dark is consistent with previous studies conducted in either CMS [18,20,26,27] or AMS [19]. Several factors, for example, diurnal fluctuations in feed quality, photoperiods, predatory instincts, and satiety hormones might explain the diurnal pattern of grazing [26]. The highest amount of grazing events at dusk is in line with earlier studies [18,20,26,27]. It occupies over 45% of the daily grazing time and is associated with the highest diurnal values of bite rate and mass on a DM basis [26] and, thereby, intake rate [18,20,26,28]. Lying time in this study was predicted to be 9.1 h/day (range 4.8–12.6 h/day), which is consistent with a number of studies on dairy cows [17,29,30].

4.3. Correlations between Behaviour and Cow Characteristics

The only correlations between the predicted behaviour and cow characteristics that were >0.5 in both the September and November periods were positive correlations between grazing time and milk solids (kg) and milking frequency, and a positive correlation between walking time and milking frequency (Table 4). High-producing cows are expected to spend more time grazing, and in AMS, higher production has been previously associated with higher milking frequency [23]. Much of the cows’ walking activities would be to and from the milking parlour, so the positive correlation between milking frequency and walking time was expected.
Although cows were selected from the herd for this study to include a broad range of milking orders, there were relatively few correlations between milking order and cow characteristics particularly in September when pasture availability (and thus intake per cow) was estimated to be lower than November (Table 4). In November, higher milking order cows (later cows) had a higher standing time with reduced grazing and walking times. Higher standing times may have been due to the later cows waiting longer times in the milking yard, which may have negative consequences, such as reduced milk yield, that have also been reported in cows that are late in the milking order [23,31]. In addition, late cows are more likely to enter the pasture allocation later in the grazing cycle when the pasture mass and nutritive characteristics might be lower [31,32]. Conducting a further study to quantify the grazing behaviour and grazing duration of cows in AMS and the consequent impact on milk production would be worthwhile to develop improved grazing management strategies.

5. Conclusions

The thresholds utilising IceTag lying index, steps, and the motion index at 1 min intervals realistically predicted the lying, grazing, walking, and standing behaviour of dairy cows, although specificity and sensitivity were lower for grazing and standing due to the overlap in steps between the two behaviours. The application of these thresholds to predict the temporal variation in cow behaviours can be used to enhance the welfare and production of cows in pasture-based dairy systems.

Author Contributions

B.C.: Conceptualization, Methodology, Formal analysis, Writing—original draft, Writing—review, Editing, Supervision, and funding acquisition. Z.L.: Methodology, Formal analysis, Writing—original draft, Writing-review, and editing. S.T.: Methodology, Formal analysis, Writing—review, and editing. L.C.: Conceptualization, Methodology, Writing—review, and editing. E.C.J.: Conceptualization, Methodology, Writing—review, Editing, and supervision. All authors have read and agreed to the published version of the manuscript.

Funding

This research was funded by an Internal University of Melbourne research grant.

Institutional Review Board Statement

The study described was approved by the Faculty of Veterinary and Agricultural Sciences Animal Ethics committee at The University of Melbourne (ID number: 1814481.1).

Data Availability Statement

None of the data were deposited in an official repository. The data that support the study findings are available upon request.

Acknowledgments

We acknowledge the contribution of the Dookie dairy farm manager, Damien Finnigan, and farm staff in running the farm system where this research was undertaken, and the students who assisted with cow behaviour observations.

Conflicts of Interest

The authors declare no conflict of interest.

References

  1. Shalloo, L.; O’Donovan, M.; Leso, L.; Werner, J.; Ruelle, E.; Geoghegan, A.; Delaby, L.; O’Leary, N. Review: Grass-based dairy systems, data and precision technologies. Animal 2018, 12, s262–s271. [Google Scholar] [CrossRef] [PubMed] [Green Version]
  2. Clay, N.; Garnett, T.; Lorimer, J. Dairy intensification: Drivers, impacts and alternatives. Ambio 2019, 49, 35–48. [Google Scholar] [CrossRef] [PubMed] [Green Version]
  3. Beggs, D.; Jongman, E.; Hemsworth, P.; Fisher, A. The effects of herd size on the welfare of dairy cows in a pasture-based system using animal-and resource-based indicators. J. Dairy Sci. 2019, 102, 3406–3420. [Google Scholar] [CrossRef] [Green Version]
  4. Lyons, N.; Kerrisk, K.; Garcia, S. Milking frequency management in pasture-based automatic milking systems: A review. Livest. Sci. 2014, 159, 102–116. [Google Scholar] [CrossRef]
  5. Andriamandroso, A.; Bindelle, J.; Mercatoris, B.; Lebeau, F. A review on the use of sensors to monitor cattle jaw movements and behavior when grazing. Biotechnol. Agron. Société Environ. 2016, 20, 273–286. [Google Scholar] [CrossRef]
  6. Decruyenaere, V.; Buldgen, A.; Stilmant, D. Factors affecting intake by grazing ruminants and related quantification methods: A review. Biotechnol. Agron. Soc. Environ. 2009, 13, 559–573. [Google Scholar]
  7. McGowan, J.; Burke, C.; Jago, J. Validation of a technology for objectively measuring behaviour in dairy cows and its application for oestrous detection. In Proceedings of the New Zealand Society of Animal Production; NZSAP: Wanaka, New Zealand, 2007; Volume 67, pp. 136–142. [Google Scholar]
  8. MacKay, J.R.; Deag, J.M.; Haskell, M.J. Establishing the extent of behavioural reactions in dairy cattle to a leg mounted activity monitor. Appl. Anim. Behav. Sci. 2012, 139, 35–41. [Google Scholar] [CrossRef]
  9. Nielsen, L.R.; Pedersen, A.R.; Herskin, M.S.; Munksgaard, L. Quantifying walking and standing behaviour of dairy cows using a moving average based on output from an accelerometer. Appl. Anim. Behav. Sci. 2010, 127, 12–19. [Google Scholar] [CrossRef]
  10. Trénel, P.; Jensen, M.B.; Decker, E.L.; Skjøth, F. Quantifying and characterizing behavior in dairy calves using the IceTag automatic recording device. J. Dairy Sci. 2009, 92, 3397–3401. [Google Scholar] [CrossRef] [Green Version]
  11. Högberg, N.; Höglund, J.; Carlsson, A.; Saint-Jeveint, M.; Lidfors, L. Validation of accelerometers to automatically record postures and number of steps in growing lambs. Appl. Anim. Behav. Sci. 2020, 229, 105014. [Google Scholar] [CrossRef]
  12. Kokin, E.; Praks, J.; Veermäe, I.; Poikalainen, V.; Vallas, M. IceTag3D™ accelerometric device in cattle lameness detection. Agron. Res. 2014, 12, 223–230. [Google Scholar]
  13. Ungar, E.; Nevo, Y.; Baram, H.; Arieli, A. Evaluation of the IceTag leg sensor and its derivative models to predict behaviour, using beef cattle on rangeland. J. Neurosci. Methods 2018, 300, 127–137. [Google Scholar] [CrossRef] [PubMed]
  14. Johansson, B.; Redbo, I.; Svennersten-Sjaunja, K. Effect of feeding before, during and after milking on dairy cow behaviour and the hormone cortisol. J. Anim. Sci. 1999, 68, 597–604. [Google Scholar] [CrossRef]
  15. Spörndly, E.; Wredle, E. Automatic milking and grazing—Effects of distance to pasture and level of supplements on milk yield and cow behavior. J. Dairy Sci. 2004, 87, 1702–1712. [Google Scholar] [CrossRef] [PubMed] [Green Version]
  16. Kismul, H.; Spörndly, E.; Höglind, M.; Næss, G.; Eriksson, T. Morning and evening pasture access—Comparing the effect of production pasture and exercise pasture on milk production and cow behaviour in an automatic milking system. Livest. Sci. 2018, 217, 44–54. [Google Scholar] [CrossRef]
  17. Legrand, A.; Von Keyserlingk, M.; Weary, D. Preference and usage of pasture versus free-stall housing by lactating dairy cattle. J. Dairy Sci. 2009, 92, 3651–3658. [Google Scholar] [CrossRef] [PubMed] [Green Version]
  18. Gibb, M.; Huckle, C.; Nuthall, R.; Rook, A. Effect of sward surface height on intake and grazing behaviour by lactating Holstein Friesian cows. Grass Forage Sci. 1997, 52, 309–321. [Google Scholar] [CrossRef]
  19. John, A.; Garcia, S.; Kerrisk, K.; Freeman, M.; Islam, M.; Clark, C. The diurnal intake and behavior of dairy cows when access to a feed of consistent nutritive value is restricted. J. Dairy Sci. 2017, 100, 9279–9284. [Google Scholar] [CrossRef] [Green Version]
  20. Taweel, H.; Tas, B.; Dijkstra, J.; Tamminga, S. Intake regulation and grazing behavior of dairy cows under continuous stocking. J. Dairy Sci. 2004, 87, 3417–3427. [Google Scholar] [CrossRef]
  21. Fadul-Pacheco, L.; Liou, M.; Reinemann, D.J.; Cabrera, V.E. A Preliminary Investigation of Social Network Analysis Applied to Dairy Cow Behavior in Automatic Milking System Environments. Animals 2021, 11, 1229. [Google Scholar] [CrossRef]
  22. Albright, J. Feeding behavior of dairy cattle. J. Dairy Sci. 1993, 76, 485–498. [Google Scholar] [CrossRef]
  23. Cullen, B.; Weng, H.-M.; Talukder, S.; Cheng, L. Cow milking order and its influence on milk production in a pasture-based automatic milking system. Anim. Prod. Sci. 2020, 61, 306–312. [Google Scholar] [CrossRef]
  24. Primary Industries Standing Committee. Nutrient Requirements of Domesticated Ruminants; CSIRO Publishing: Melbourne, Australia, 2007. [Google Scholar]
  25. Ungar, E.D.; Schoenbaum, I.; Henkin, Z.; Dolev, A.; Yehuda, Y.; Brosh, A. Inference of the activity timeline of cattle foraging on a Mediterranean woodland using GPS and pedometry. Sensors 2010, 11, 362–383. [Google Scholar] [CrossRef] [Green Version]
  26. Gregorini, P. Diurnal grazing pattern: Its physiological basis and strategic management. Anim. Prod. Sci. 2012, 52, 416–430. [Google Scholar] [CrossRef]
  27. Rook, A. Principles of foraging and grazing behaviour. In Grass: Its Production and Utilisation; Hopkins, A., Ed.; Blackwell Science: Boston, MA, USA, 2000; pp. 229–246. [Google Scholar]
  28. Orr, R.; Penning, P.; Harvey, A.; Champion, R. Diurnal patterns of intake rate by sheep grazing monocultures of ryegrass or white clover. Appl. Anim. Behav. Sci. 1997, 52, 65–77. [Google Scholar] [CrossRef]
  29. Krawczel, P.D.; Lee, A.R. Lying time and its importance to the dairy cow: Impact of stocking density and time budget stresses. Vet. Clin. Food Anim. Pract. 2019, 35, 47–60. [Google Scholar] [CrossRef]
  30. Olmos, G.; Boyle, L.; Hanlon, A.; Patton, J.; Murphy, J.J.; Mee, J.F. Hoof disorders, locomotion ability and lying times of cubicle-housed compared to pasture-based dairy cows. Livest. Sci. 2009, 125, 199–207. [Google Scholar] [CrossRef]
  31. Dias, K.; Garcia, S.; Islam, M.; Clark, C. Milk yield, milk composition, and the nutritive value of feed accessed varies with milking order for pasture-based dairy cattle. Animals 2019, 9, 60. [Google Scholar] [CrossRef] [PubMed] [Green Version]
  32. Clark, C.; Kaur, R.; Millapan, L.; Golder, H.; Thomson, P.; Horadagoda, A.; Islam, M.; Kerrisk, K.; Garcia, S. The effect of temperate or tropical pasture grazing state and grain-based concentrate allocation on dairy cattle production and behavior. J. Dairy Sci. 2018, 101, 5454–5465. [Google Scholar] [CrossRef] [PubMed] [Green Version]
Figure 1. Percentage of grazing, walking, standing, and lying behaviour observations in each category of IceTag activity data for (a) lying, (b) steps, and (c) motion index. Note that the x-axis scale changes on each graph to highlight the important ranges in the data.
Dairy 04 00009 g001
Figure 2. The duration (minutes per day) of grazing, standing, walking, and lying behaviours estimated by the 1 min interval thresholds in September (15 cows over 10 days) and November (13 cows over 20 days).
Dairy 04 00009 g002
Figure 3. Average percentage of cows with predicted grazing, lying, standing, and walking behaviour for each minute of the day in (a) September period (15 cows over 10 days) and (b) November (data from 13 cows over 20 days) in a pasture-based AMS. Times are shown in Australian Eastern Standard Time. Sunrise and sunset times were 06:15 and 18:08 in September and 05:00 and 19:03 in November.
Dairy 04 00009 g003aDairy 04 00009 g003b
Table 1. Definition of the grazing, standing, walking, and lying behaviours used on the cow observations.
BehaviourDefinition
GrazingRecord as grazing when the cow is eating grass with jaw movement. Normally cow will be walking slowly, occasionally standing still for several seconds, sometimes moving a few steps to get to another spot. (Record as grazing if standing still for <30 s or walking < 10 m.)
StandingAll four feet stand on the ground, and cow is not grazing. (Record as standing when stationary for >30 s.)
WalkingCow walking with more than one leg moving continuously without grazing behaviour performed. (Record as walking when moving over a distance > 10 m.)
LyingThe cow has folded the front legs underneath her body or is laterally lying down (without grazing).
Table 2. Thresholds to predict lying, grazing, walking, and standing behaviour using the IceTag lying index with steps only or lying index with both steps and motion index at 1, 2, and 5 min intervals. The sensitivity (Se), specificity (Sp), positive predicted value (PPV), and negative predicted value (NPV) for each behaviour is shown. Lying behaviour did not use motion index so is only shown once.
BehaviourThresholdsIntervalSe (%)Sp (%)PPV (%)NPV (%)
Lying index and steps only
LyingLying > 501 min99.399.695.599.9
2 min95.6100.099.699.6
5 min83.498.080.298.4
GrazingLying ≤ 50, Steps ≥ 2– ≤ 141 min90.259.591.356.4
2 min92.456.491.060.9
5 min91.943.889.650.8
WalkingLying ≤ 50, Steps > 141 min78.397.870.198.6
2 min75.097.666.798.4
5 min44.795.232.597.1
StandingLying ≤ 50, Steps < 11 min45.392.744.392.9
2 min39.794.548.292.4
5 min30.595.948.091.7
Lying index, steps, and motion index
GrazingLying ≤ 50, Steps ≥ 2– ≤ 16, and Motion index < 50, and
Lying ≤ 50, Steps < 2, and Motion index ≥ 2
1 min92.060.391.661.6
2 min94.853.590.768.2
5 min94.436.588.755.4
WalkingLying ≤ 50, Steps ≥ 161 min74.998.577.098.4
2 min71.498.271.698.2
5 min38.996.033.396.8
StandingLying ≤ 50, Steps < 2, and Motion index < 21 min47.693.750.593.5
2 min39.096.458.092.5
5 min25.397.758.391.3
Table 3. Mean and range of cow lactation number and days in milk, milk production (kg milk solids/day), milking frequency, liveweight, and milking order (percentile rank) in the September and November experimental periods.
SeptemberNovember
Lactation number (parity)3.5 (1–7)3.2 (1–6)
Days in milk (day)261 (30–428)148 (102–244)
Milk solids (kg/day)2.0 (0.8–3.4)2.1 (1.5–3.2)
Milking frequency (time)1.9 (1.2–3.0)2.2 (1.0–3.6)
Liveweight (kg)648 (514–738)616 (500–731)
Milking order (percentile rank)51 (35–70)48 (20–85)
Table 4. Correlation matrix between average predicted grazing, lying, standing, and walking time (minutes/day), cow lactation number (parity), cow days in milk, milk production (kg milk solids/day), milking frequency, liveweight, and milking order (percentile rank) in the September (S) and November (N) experimental periods. Correlations >0.5 and < −0.5 are shaded.
GrazingLyingStandingWalkingLactation NumberDays in MilkMilk SolidsMilking FrequencyLiveweight
LyingS: −0.83
N: −0.49
StandingS: 0.49
N: −0.70
S: −0.88
N: −0.12
WalkingS: 0.59
N: 0.85
S: −0.49
N: −0.49
S: 0.14
N: −0.70
Lactation numberS: 0.13
N: 0.20
S: −0.06
N: −0.75
S: 0.01
N: 0.40
S: −0.05
N: 0.17
Days in milkS: −0.49
N: −0.52
S: 0.66
N: 0.19
S: −0.64
N: 0.50
S: −0.22
N: −0.55
S: −0.33
N: −0.08
Milk solidsS: 0.52
N: 0.61
S: −0.62
N: −0.37
S: 0.52
N: −0.45
S: 0.39
N: 0.60
S: 0.59
N: 0.33
S: −0.80
N: −0.60
Milking frequencyS: 0.51
N: 0.70
S: −0.49
N: −0.24
S: 0.27
N: −0.71
S: 0.63
N: 0.77
S: 0.36
N: 0.08
S: −0.63
N: −0.50
S: 0.85
N: 0.81
LiveweightS: −0.32
N: 0.06
S: 0.45
N: −0.38
S: −0.51
N: 0.21
S: 0.12
N: 0.22
S: 0.52
N: 0.72
S: 0.38
N: 0.12
S: 0.06
N: 0.51
S: 0.17
N: 0.29
Milking orderS: 0.20
N: −0.68
S: −0.14
N: 0.22
S: 0.02
N:0.73
S: 0.32
N: −0.87
S: 0.14
N: −0.11
S: 0.11
N: 0.54
S: 0.06
N: −0.51
S: 0.02
N: −0.71
S: −0.01
N: −0.23
Disclaimer/Publisher’s Note: The statements, opinions and data contained in all publications are solely those of the individual author(s) and contributor(s) and not of MDPI and/or the editor(s). MDPI and/or the editor(s) disclaim responsibility for any injury to people or property resulting from any ideas, methods, instructions or products referred to in the content.

