
Changes in the Concentration and Profile of Free Fatty Acids during the Ripening of a Spanish Blue-Veined Cheese Made from Raw and Pasteurized Cow and Goat Milk

 , , , and
Abstract
: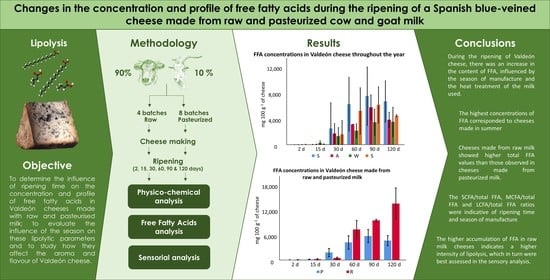
1. Introduction
2. Materials and Methods
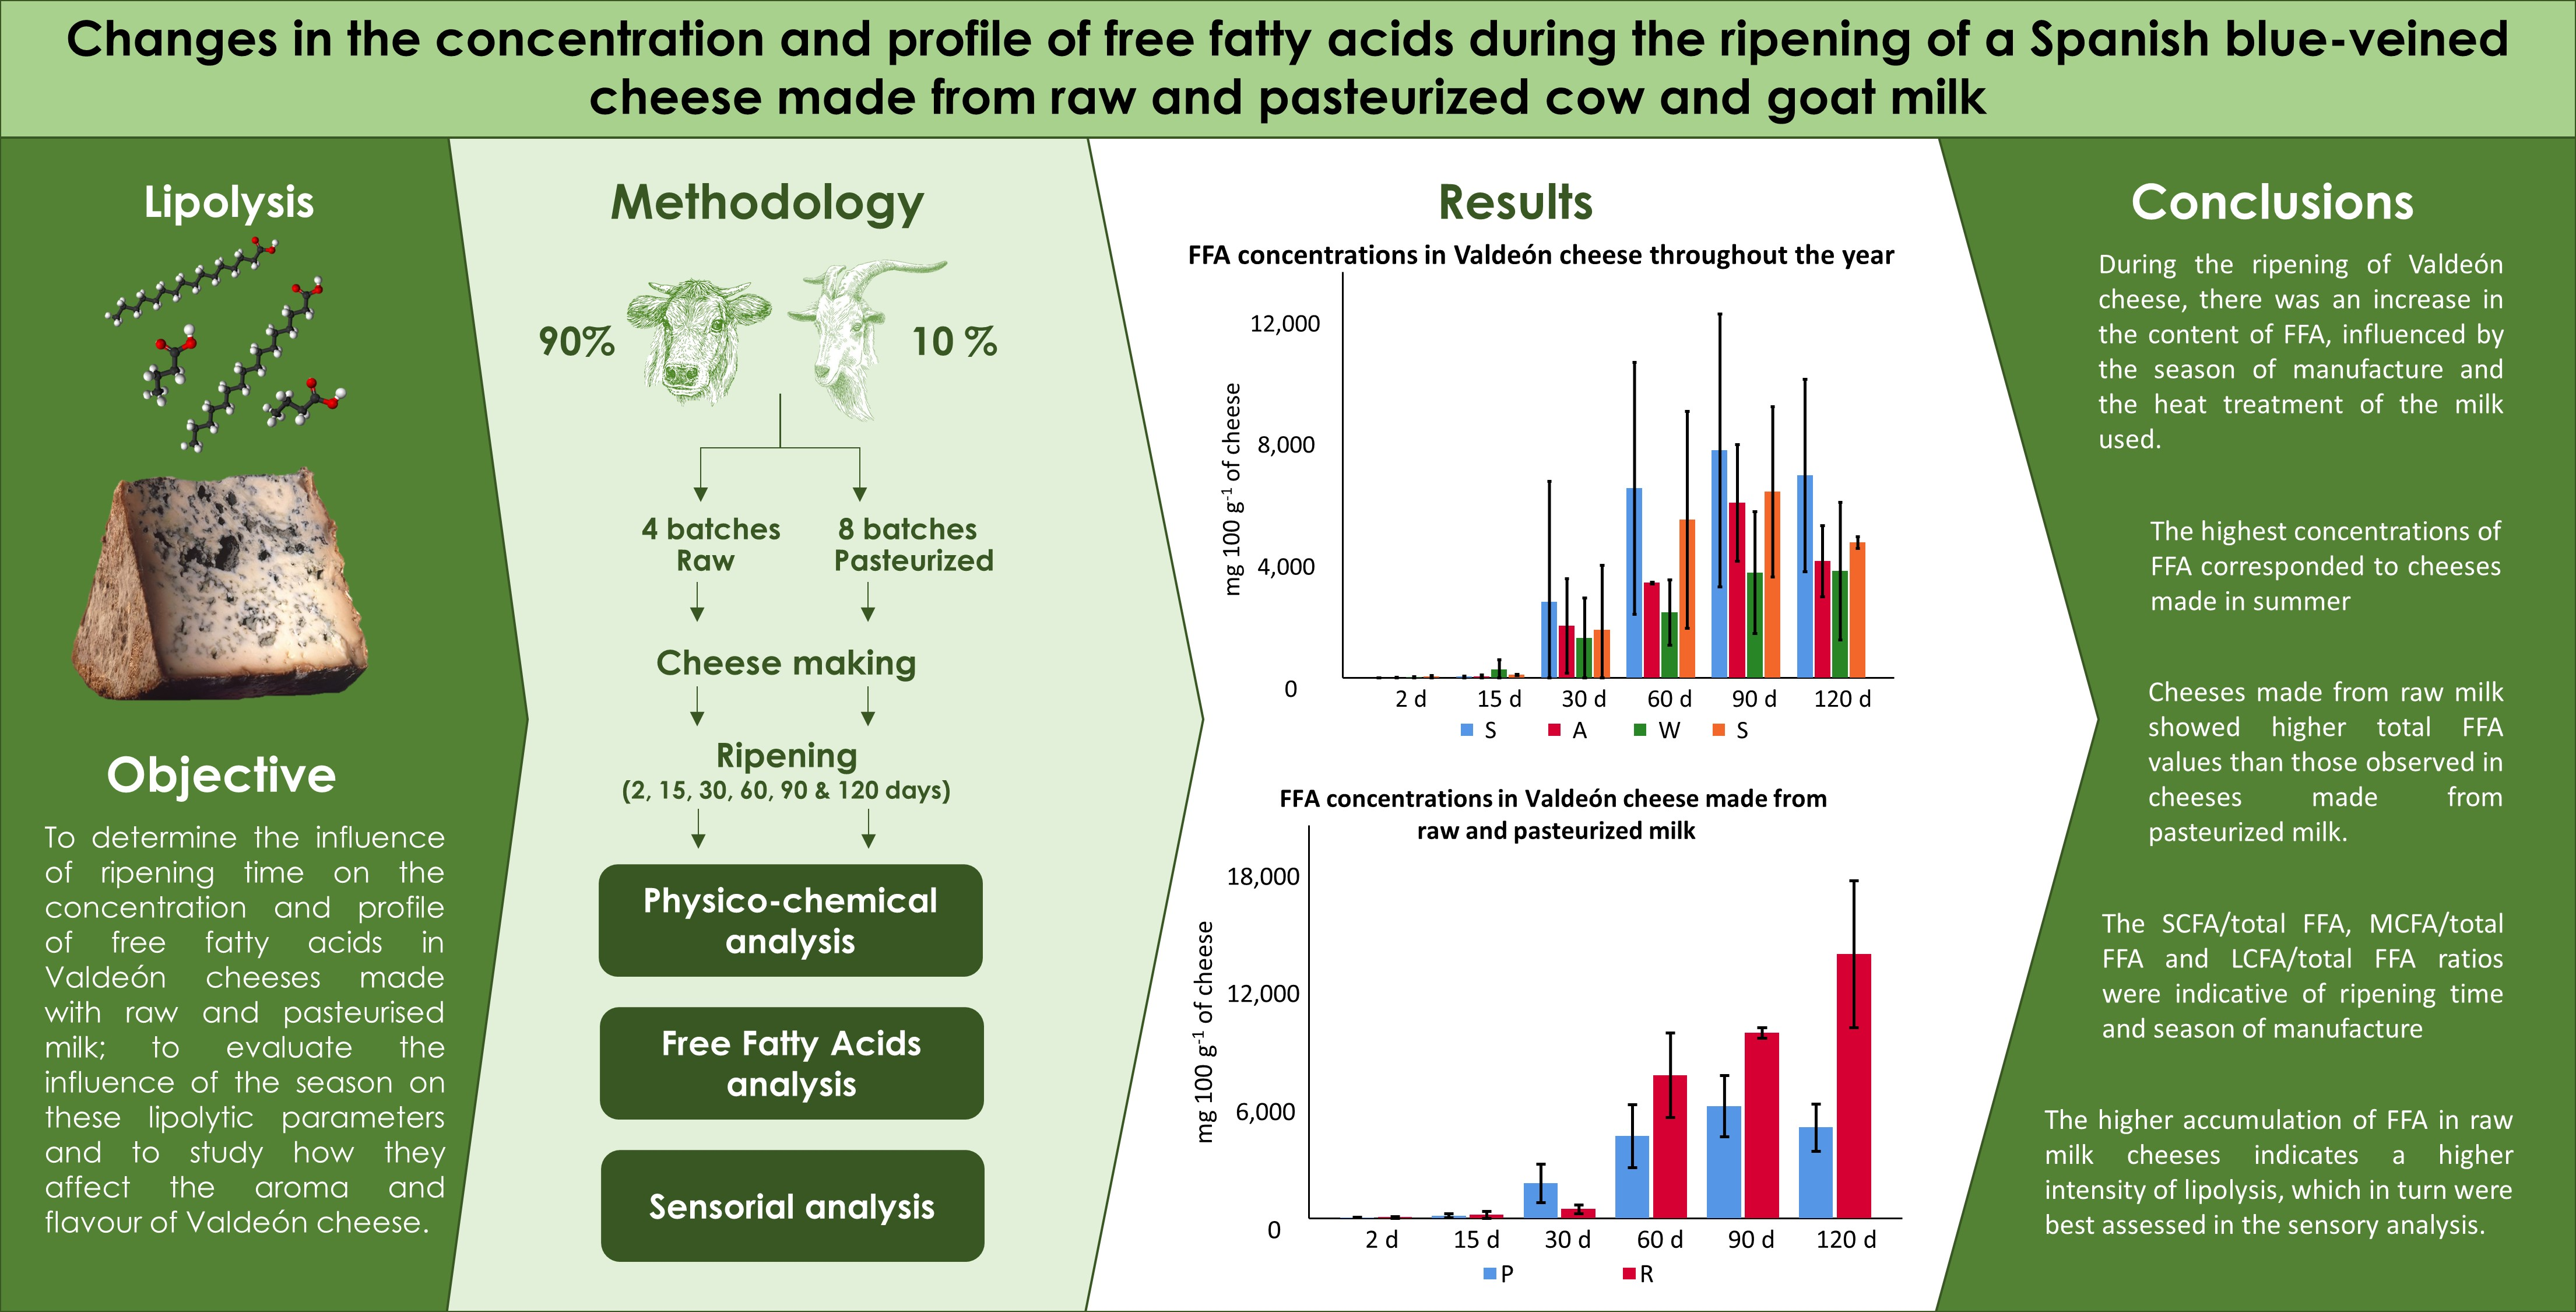
2.1. Cheese Making and Sampling
2.2. Physico-Chemical Analysis
2.3. Free Fatty Acids Analysis
2.4. Sensory Analysis
2.5. Statistical Analysis
3. Results and Discussion
3.1. Physico-Chemical Parameters
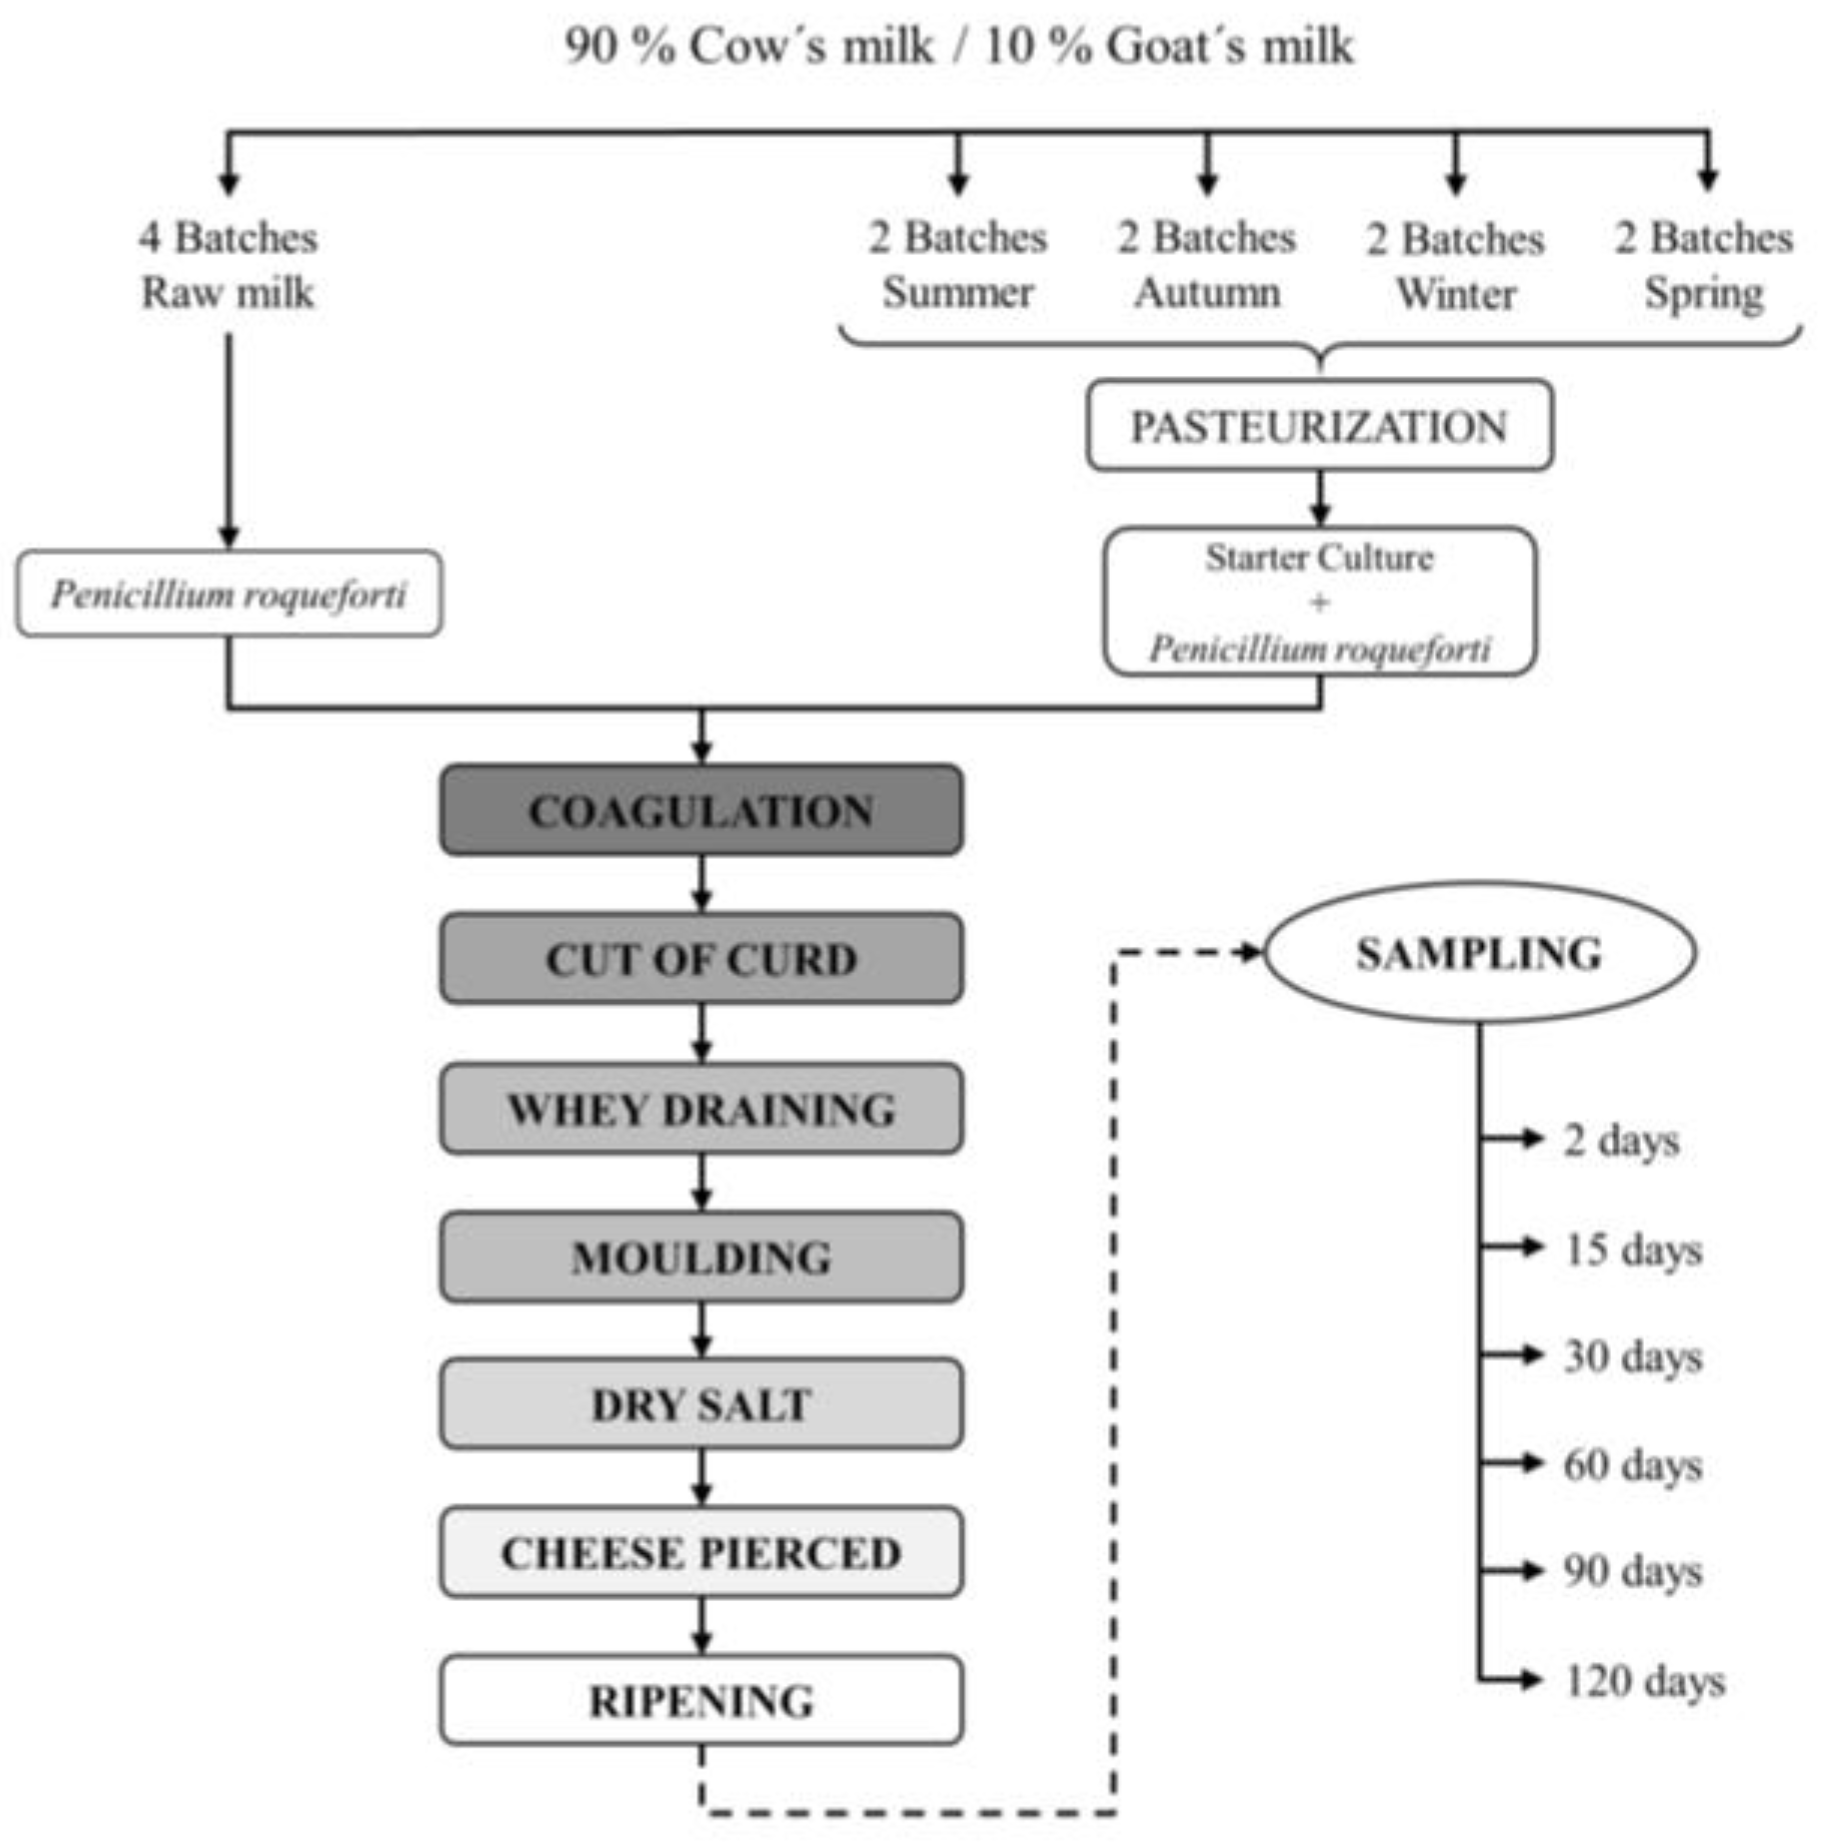
3.2. Free Fatty Acids
3.3. Sensory Analysis
4. Conclusions
Supplementary Materials
Author Contributions
Funding
Institutional Review Board Statement
Informed Consent Statement
Data Availability Statement
Acknowledgments
Conflicts of Interest
References
- Deeth, H.C. Lipoprotein lipase and lipolysis in milk. Int. Dairy J. 2006, 16, 555–562. [Google Scholar] [CrossRef]
- Deeth, H.C.; Fitz-Gerald, C.H. Lipolytic Enzymes and Hydrolytic Rancidity. In Advanced Dairy Chemistry Volume 2 Lipids; Fox, P.F., McSweeney, P.L.H., Eds.; Springer: Boston, MA, USA, 2006. [Google Scholar] [CrossRef]
- Kinsella, J.E.; Hwand, D.H.; Dwivedi, B. Enzymes of Penicillium roqueforti involved in the biosynthesis of cheese flavor. Crit. Rev. Food Sci. 1976, 8, 191–228. [Google Scholar] [CrossRef] [PubMed]
- McSweeney, P.L.; Sousa, M.J. Biochemical pathways for the production of flavour compounds in cheese during ripening: A review. Le Lait 2000, 80, 293–324. [Google Scholar] [CrossRef]
- Zheng, X.; Shi, X.; Wang, B. A Review on the General Cheese Processing Technology, Flavor Biochemical Pathways and the Influence of Yeasts in Cheese. Front. Microbiol. 2021, 12, 703284. [Google Scholar] [CrossRef]
- Wolf, I.V.; Perotti, M.C.; Zalazar, C.A. Composition and volatile profiles of commercial Argentinean blue cheeses. J. Sci. Food Agric. 2011, 91, 385–393. [Google Scholar] [CrossRef]
- Caron, T.; LePiver, M.; Péronc, A.C.; Lieben, L.; Lavigne, R.; Brunel, S.; Roueyre, D.; Place, M.; Bonnarme, P.; Giraud, T.; et al. Strong effect of Penicillium roqueforti populations on volatile and metabolic compounds responsible for aromas, flavor and texture in blue cheeses. Int. J. Food Microbiol. 2021, 354, 109174. [Google Scholar] [CrossRef]
- Collomb, M.; Bütikofer, U.; Spahni, M.; Jeangros, B.; Bosset, J. Composition en acides gras et en glycérides de la matière grasse du lait de vache en zones de montagne et de plaine. Sci. Aliment. 1999, 19, 97–110. [Google Scholar]
- Kalantzopoulos, G. Cheese from Ewe’s and Goat’s Milk. In Cheese: Chemistry, Physics and Microbiology; Springer: New York, NY, USA, 1999; pp. 507–553. [Google Scholar]
- Fernández-García, E.; Carbonell, M.; Calzada, J.; Núñez, M. Seasonal variation of the free fatty acids contents of Spanish ovine milk cheeses protected by a designation of origin: A comparative study. Int. Dairy J. 2006, 16, 252–261. [Google Scholar] [CrossRef]
- Poveda, J.M.; Pérez-Coello, M.S.; Cabezas, L. Seasonal variations in the free fatty acid composition of Manchego cheese and changes during ripening. Eur. Food Res. Technol. 2000, 210, 314–317. [Google Scholar] [CrossRef]
- Yunita, D.; Dood, C.E. Microbial community dynamics of a blue-veined raw milk cheese from the United Kingdom. J. Dairy Sci. 2017, 101, 4923–4935. [Google Scholar] [CrossRef]
- Diezhandino, I.; Fernández, D.; González, L.; McSweeney, P.L.; Fresno, J.M. Microbiological, physic-chemical and proteolytic changes in a Spanish blue cheese during ripening (Valdeón cheese). Food Chem. 2015, 168, 134–141. [Google Scholar] [CrossRef] [PubMed]
- Sánchez-Rivera, L.; Diezhandino, I.; Gómez-Ruiz, J.A.; Fresno, J.M.; Miralles, B.; Recio, I. Peptidomic study of Spanish blue cheese (Valdeón) and changes after simulated gastrointestinal digestion. Electrophoresis 2014, 35, 1627–1636. [Google Scholar] [CrossRef] [PubMed]
- Diezhandino, I.; Fernández, D.; Combarros-Fuertes, P.; Renes, E.; Fresno, J.M.; Tornadijo, M.E. Characteristics and proteolysis of a Spanish blue cheese made with raw or pasteurized milk. Int. J. Dairy Technol. 2022, 75, 630–642. [Google Scholar] [CrossRef]
- Diezhandino, I.; Fernández, D.; Sacristán, N.; Combarros-Fuertes, P.; Prieto, B.; Fresno, J.M. Rheological, textural, color and sensory characteristics of a Spansih blue cheese (Valdeón cheese). LWT-Food Sci. Technol. 2016, 65, 1118–1125. [Google Scholar] [CrossRef]
- Cantor, M.D.; van den Tempel, T.; Hansen, T.K.; Ardö, Y. Blue Cheese. In Cheese: Chemistry, Physics and Microbiology; McSweeney, P.L.H., Fox, P.F., Cotter, P.D., Everett, D.W., Eds.; Academic Press: Cambridge, MA, USA, 2017; Chapter 37; pp. 929–954. [Google Scholar] [CrossRef]
- FIL-IDF 004; Cheese and Processed Cheese-Determination of the Total Solids Content. Standard 004. International Dairy Federation: Brussels, Belgium, 2004.
- FIL-IDF20-1; Milk Determination of Nitrogen Content-Part 1: Kjeldhal Method. Standard 20-1. International Dairy Federation: Brussels, Belgium, 2001.
- FIL-IDF 221; Cheese. Determination of fat content. Van Gulik method. Standard 222. International Dairy Federation: Brussels, Belgium, 2008.
- AOAC Standard 935.43; Chloride (Total) in Cheese. Official Method of Analysis 953.43. Arlington. V.A. Association of Official Analytical Chemists: Arlington, VA, USA, 1990.
- AOAC Standard 14.022; Official Method of Analysis 14022. Hydrogen-Ion Activity (pH). Association of Official Analytical Chemists: Washington, DC, USA, 1980.
- De Jong, C.; Bandings, H.T. Determination of free fatty acids in milk and cheese procedures for extraction, clean up and capillary gas chromatographic analysis. J. High Res. Chromatog. 1990, 13, 94–98. [Google Scholar] [CrossRef]
- ISO 8586 2012; Sensory Analysis-General Guidelines for the Selection, Training and Monitoring of Selected Assessors and Expert Sensory Assessors. ISO: Geneva, Switzerland, 2012.
- Serrapica, F.; Masucci, F.; Di Francia, A.; Napolitano, F.; Braghieri, A.; Esposito, G.; Romano, R. Seasonal Variation of Chemical composition, fatty Acid Profile, and sensory properties of a mountain Pecorino cheese. Foods 2020, 9, 1091. [Google Scholar] [CrossRef]
- Gobbetti, M.; Burzigotti, R.; Smacchi, E.; Corsetti, A.; De Angelis, M. Microbiology and biochemistry of Gorgonzola cheese during ripening. Int. Dairy J. 1997, 7, 519–529. [Google Scholar] [CrossRef]
- Madkor, S.; Fox, P.; Shalabi, S.; Metwalli, N. Studies on the ripening of Stilton cheese: Lipolysis. Food Chem. 1987, 25, 93–109. [Google Scholar] [CrossRef]
- Contarini, G.; Toppino, P.M. Lipolysis in Gorgonzola cheese during ripening. Int. Dairy J. 1995, 5, 141–155. [Google Scholar] [CrossRef]
- Prieto, B.; Franco, I.; Fresno, J.M.; Bernardo, A.; Carballo, J. Picón Bejes-Tresviso blue cheese: An overall biochemical survey throughout the ripening process. Int. Dairy J. 2000, 10, 159–167. [Google Scholar] [CrossRef]
- González de Llano, D.; Ramos, M.; Rodríguez, A.; Montilla, A.; Juárez, M. Microbiological and physicochemical characteristics of Gamonedo blue cheese during ripening. Int. Dairy J. 1992, 2, 121–135. [Google Scholar] [CrossRef]
- Alonso, L.; Juárez, M.; Ramos, M.; Martín-Álvarez, P.J. Overall composition, nitrogen fractions and fat characteristics of Cabrales cheese during ripening. Z. Lebensm Unters For. 1987, 185, 481–486. [Google Scholar] [CrossRef]
- Woo, A.; Kollodge, S.; Lindsay, R. Quantification of major free fatty acids in several cheese varieties. J. Dairy Sci. 1984, 67, 874–878. [Google Scholar] [CrossRef]
- Guinee, T.M.; Fox, P.F. Salt in Cheese: Physical, Chemical and Biological Aspects. In Cheese, 4th ed.; McSweeney, P.L.H., Fox, P.F., Cotter, P.D., Everett, D.W., Eds.; Academic Press: Cambridge, MA, USA, 2017; Chapter 13; pp. 317–375. [Google Scholar] [CrossRef]
- Collins, Y.F.; McSweeney, P.L.; Wilkinson, M.G. Lipolysis and free fatty acid catabolism in cheese: A review of current knowledge. Int. Dairy J. 2003, 13, 841–866. [Google Scholar] [CrossRef]
- Medina, R.B.; Katz, M.B.; González, S.; Oliver, G. Determination of esterolytic and lipolytic activities of lactic acid bacteria. Methods Mol. Biol. 2004, 268, 465–470. [Google Scholar] [CrossRef]
- Paszczyk, B.; Łuczyńsk, A.J. The Comparison of Fatty Acid Composition and Lipid Quality Indices in Hard Cow, Sheep, and Goat Cheeses. Foods 2020, 15, 1667. [Google Scholar] [CrossRef]
- Ruso, G.L. Dietary n-6 and n-3 polyunsaturated fatty acids: From biochemistry to clinical implications in cardiovascular prevention. Biochem. Pharmacol. 2008, 77, 937–946. [Google Scholar] [CrossRef]
- De la Fuente, M.A.; Fontecha, J.; Juárez, M. Fatty acid composition of the triglyceride and free fatty acid fractions in different cows-, ewes- and goats-milk cheeses. Z. Lebensm. Unters For. 1993, 196, 155–158. Available online: http://hdl.handle.net/10261/115964 (accessed on 13 March 2023). [CrossRef]
- Molimard, P.; Spinner, H. Compounds involved in the flavour of surface mold ripened cheeses: Origins and properties. J. Dairy Sci. 1996, 79, 169–184. [Google Scholar] [CrossRef]


| FA | Concentration Range (mg L−1) | Equation | R2 | LOD (mg kg−1) | LOQ (mg kg−1) |
|---|---|---|---|---|---|
| C4:0 | 25–750 | y = 1.0979x − 0.0182 | 0.997 | 0.43 | 1.45 |
| C6:0 | 25–750 | y = 0.713x + 0.4033 | 0.993 | 1.21 | 4.02 |
| C8:0 | 25–800 | y = 1.1521x − 0.0572 | 0.998 | 0.42 | 1.39 |
| C10:0 | 25–850 | y = 0.9686x − 0.1051 | 0.998 | 0.56 | 1.88 |
| C12:0 | 30–850 | y = 0.7736x + 0.1735 | 0.996 | 0.89 | 2.97 |
| C14:0 | 30–950 | y = 0.7191x + 0.2375 | 0.997 | 0.99 | 3.31 |
| C14:1 | 30–900 | y = 0.8274 + 0.1774 | 0.996 | 0.82 | 2.74 |
| C16:0 | 30–850 | y = 0.764x + 0.8585 | 0.992 | 1.30 | 4.33 |
| C16:1 | 30–900 | y = 0.7019x + 0.7422 | 0.994 | 1.26 | 4.18 |
| C18:0 | 30–850 | y = 0.8442x + 0.8477 | 0.993 | 1.10 | 3.66 |
| C18:1 | 30–900 | y = 0.6342x + 0.9672 | 0.989 | 1.85 | 6.16 |
| C18:2 | 40–1100 | y = 0.7475x + 1.1192 | 0.992 | 1.69 | 5.62 |
| C18:3 | 30–850 | y = 1.1381x + 1.0715 | 0.991 | 0.89 | 2.95 |
| Milk | Ripening Time (Days) | Difference | ||||||||
|---|---|---|---|---|---|---|---|---|---|---|
| 2 | 15 | 30 | 60 | 90 | 120 | A | S | T | ||
| Dry matter | P | 51.93 ± 2.32 ** | 57.15 ± 2.98 ** | 58.61 ± 2.60 ** | 60.87 ± 2.79 ** | 61.78 ± 2.87 * | 62.74 ± 2.41 * | *** | * | *** |
| R | 44.65 ± 0.29 | 48.84 ± 0.00 | 49.33 ± 2.24 | 51.49 ± 0.12 | 54.25 ± 3.89 | 58.04 ± 2.11 | ** | |||
| Protein | P | 34.53 ± 2.33 | 33.56 ± 1.27 | 33.82 ± 1.61 | 33.93 ± 1.73 | 34.35 ± 1.31 | 33.98 ± 1.39 | NS | *** | *** |
| R | 36.86 ± 1.46 | 34.78 ± 0.28 | 36.33 ± 0.28 | 36.59 ± 0.85 | 35.99 ± 0.39 | 36.22 ± 0.29 | NS | |||
| Fat | P | 53.62 ± 1.19 ** | 53.16 ± 1.10 ** | 56.09 ± 2.16 * | 55.50 ± 2.24 | 56.33 ± 1.10 ** | 57.29 ± 1.92 | *** | NS | *** |
| R | 49.84 ± 1.90 | 49.14 ± 1.45 | 51.99 ± 2.00 | 51.70 ± 0.91 | 52.33 ± 0.82 | 55.12 ± 0.43 | * | |||
| Lactose | P | 0.78 ± 0.30 ** | 0.18 ± 0.12 * | 0.11 ± 0.10 | 0.14 ± 0.15 | 0.09 ± 0.10 | 0.07 ± 0.10 | *** | NS | NS |
| R | 1.89 ± 0.12 | 0.72 ± 0.58 | 0.20 ± 0.21 | ND | ND | ND | ** | |||
| L-lactic acid | P | 3.24 ± 0.33 * | 2.23 ± 0.51 | 1.21 ± 0.48 | 0.49 ± 0.24 | 0.43 ± 0.23 | 0.38 ± 0.21 | *** | NS | NS |
| R | 2.51 ± 0.06 | 2.02 ± 0.38 | 1.16 ± 0.15 | 0.56 ± 0.13 | 0.55 ± 0.30 | 0.31 ± 0.12 | *** | |||
| D-lactic acid | P | 0.33 ± 0.19 | 0.64 ± 0.39 | 0.36 ± 0.24 | 0.16 ± 0.14 | 0.17 ± 0.15 | 0.10 ± 0.10 | *** | NS | NS |
| R | 0.38 ± 0.12 | 0.77 ± 0.15 | 0.72 ± 0.21 | 0.39 ± 0.17 | 0.15 ± 0.14 | 0.20 ± 0.09 | * | |||
| Salt/moisture | P | 2.03 ± 0.87 | 6.25 ± 0.47 * | 6.79 ± 0.59 | 7.60 ± 0.96 | 7.79 ± 1.24 | 8.92 ± 1.12 | *** | NS | NS |
| R | 1.64 ± 0.37 | 5.40 ± 0.07 | 5.87 ± 0.38 | 6.57 ± 0.45 | 7.39 ± 1.55 | 8.81 ± 1.29 | ** | |||
| aw | P | 0.98 ± 0.01 | 0.96 ± 0.00 | 0.95 ± 0.01 ** | 0.94 ± 0.01 ** | 0.93 ± 0.01 | 0.92 ± 0.01 | *** | NS | NS |
| R | 0.98 ± 0.01 | 0.95 ± 0.01 | 0.97 ± 0.01 | 0.96 ± 0.01 | 0.93 ± 0.01 | 0.92 ± 0.01 | * | |||
| pH | P | 5.03 ± 0.14 * | 5.19 ± 0.13 | 5.97 ± 0.27 | 7.07 ± 0.39 | 6.83 ± 0.37 | 6.85 ± 0.41 | *** | NS | NS |
| R | 5.47 ± 0.48 | 5.32 ± 0.22 | 5.85 ± 0.11 | 6.57 ± 0.06 | 6.59 ± 0.01 | 6.53 ± 0.18 | ** | |||
| FFA | Milk | Ripening Time (Days) | Difference | |||||||
|---|---|---|---|---|---|---|---|---|---|---|
| 2 | 15 | 30 | 60 | 90 | 120 | A | S | T | ||
| C4:0 | P | 10.46 ± 4.53 | 14.46 ± 5.55 | 217.71 ± 223.70 | 635.16 ± 308.14 | 788.03 ± 319.50 | 678.34 ± 231.91 | *** | NS | NS |
| R | 11.27 ± 1.52 | 13.41 ± 3.31 | 40.55 ± 6.94 | 1093.42 ± 517.63 | 1094.58 ± 178.77 | 1082.82 ± 214.84 | ** | |||
| C6:0 | P | ND | ND | 108.81 ± 110.11 | 317.88 ± 181.61 | 406.23 ± 165.72 * | 379.88 ± 89.67 * | ** | NS | ** |
| R | ND | ND | 30.44 ± 18.46 | 709.87 ± 380.50 | 768.75 ± 284.60 | 912.92 ± 554.01 | NS | |||
| C8:0 | P | ND | ND | 37.90 ± 36.72 | 97.90 ± 46.94 * | 122.06 ± 44.77 * | 127.87 ± 39.89 * | *** | * | * |
| R | 13.25 ± 3.43 | 15.97 ± 2.79 | 18.43 ± 2.39 | 340.64 ± 268.99 | 362.44 ± 286.89 | 459.13 ± 360.31 | NS | |||
| C10:0 | P | 25.38 ± 4.93 | 30.02 ± 12.38 | 108.33 ± 77.54 | 252.65 ± 107.90 ** | 301.05 ± 106.88 * | 331.76 ± 120.88 *** | *** | NS | ** |
| R | 32.21 ± 8.01 | 41.54 ± 18.13 | 70.62 ± 31.27 | 605.89 ± 223.55 | 662.42 ± 299.89 | 1147.21 ± 473.27 | * | |||
| C12:0 | P | ND | ND | 86.49 ± 59.38 | 182.96 ± 74.58 ** | 236.81 ± 93.24 * | 247.67 ± 108.17 *** | ** | NS | *** |
| R | ND | ND | 26.02 ± 14.42 | 484.44 ± 169.44 | 561.75 ± 325.11 | 1049.91 ± 351.43 | NS | |||
| C14:0 | P | ND | 14.53 ± 10.34 | 198.92 ± 148.63 | 370.70 ± 159.84 ** | 488.71 ± 216.26 * | 525.60 ± 336.46 *** | *** | * | *** |
| R | ND | 30.13 ± 0.00 | 55.08 ± 5.94 | 1090.39 ± 508.60 | 1328.58 ± 803.54 | 2499.28 ± 591.10 | NS | |||
| C14:1 | P | ND | ND | 32.25 ± 26.23 | 59.92 ± 26.01 ** | 73.82 ± 37.56 * | 94.03 ± 62.43 ** | NS | NS | *** |
| R | ND | ND | ND | 152.75 ± 57.34 | 169.95 ± 99.68 | 343.69 ± 107.42 | NS | |||
| C16:0 | P | 34.77 ± 38.50 | 76.77 ± 54.60 | 571.38 ± 409.09 | 1175.23± 646.45 ** | 1778.97±519.88 *** | 1372.69±576.76 *** | *** | NS | *** |
| R | 68.62 ± 0.00 | 181.80 ± 0.00 | 195.79 ± 118.21 | 3240.48 ± 664.37 | 4171.81 ± 234.47 | 5844.36 ± 45.94 | *** | |||
| C16:1 | P | ND | ND | 126.07 ± 60.90 | 169.12 ± 111.71 | 247.07 ± 66.04 | 164.60 ± 65.75 ** | NS | ** | ** |
| R | ND | ND | ND | 325.67 ± 45.31 | 345.40 ± 19.95 | 369.79 ± 123.38 | NS | |||
| C18:0 | P | 0.38 ± 0.00 | 43.81 ± 16.05 | 103.03 ± 51.47 | 262.04 ± 110.05 ** | 383.12 ± 267.15 | 293.52 ± 211.75 ** | * | NS | *** |
| R | ND | ND | ND | 552.46 ± 7.36 | 679.31 ± 133.96 | 864.75 ± 122.84 | NS | |||
| C18:1 | P | 14.81 ± 0.00 | 130.01 ± 192.01 | 1495.2 ± 1221.9 | 3097.6 ± 2266.5 | 4103.4 ± 2275.8 | 2909.6 ± 1204.3 *** | ** | NS | NS |
| R | 0.56 ± 0.00 | 174.67 ± 85.47 | 481.45 ± 175.55 | 5183.5 ± 54.64 | 6905.9 ± 2834.3 | 7897.2 ± 811.70 | ** | |||
| C18:2 | P | ND | ND | 79.98 ± 47.46 | 128.11 ± 88.06 | 145.74 ± 70.03 | 118.60 ± 78.43 ** | NS | * | *** |
| R | ND | ND | ND | 267.38 ± 97.75 | 242.74 ± 67.97 | 456.39 ± 290.98 | NS | |||
| C18:3 | P | ND | ND | 36.19 ± 20.04 | 66.46 ± 26.00 | 86.26 ± 35.19 | 82.92 ± 18.94 ** | ** | * | NS |
| R | ND | ND | 19.95 ± 5.20 | 83.58 ± 19.58 | 106.88 ± 30.69 | 154.47 ± 14.17 | * | |||
| FFA | Milk | Ripening Time (Days) | Difference | |||||||
|---|---|---|---|---|---|---|---|---|---|---|
| 2 | 15 | 30 | 60 | 90 | 120 | A | S | T | ||
| Total FFA | P | 55.13 ± 36.59 | 214.76 ± 246.73 | 3013.32 ± 2346.89 | 6815.71 ± 3505.87 * | 9161.27 ± 3349.41 * | 7327.09 ± 2550.09 *** | *** | NS | * |
| R | 91.31 ± 61.87 | 351.56 ± 259.55 | 938.32 ± 364.50 | 14130.45 ± 2909.73 | 17400.46 ± 906.95 | 23081.89 ± 3723.84 | *** | |||
| SFA | P | 53.28 ± 36.81 | 133.50 ± 94.27 | 1368.80 ± 1018.70 | 3294.52 ± 1419.37 ** | 4504.97 ± 1253.68 ** | 3957.33 ± 1403.18 *** | *** | NS | ** |
| R | 91.03 ± 61.48 | 176.89 ± 174.09 | 406.48 ± 165.29 | 8117.59 ± 2725.72 | 9629.63 ± 1810.37 | 13860.38 ± 2376.19 | *** | |||
| MUFA | P | 1.85 ± 5.24 | 81.26 ± 159.98 | 1578.34 ± 1300.22 | 3326.64 ± 2340.98 | 4424.30 ± 2334.26 | 3168.25 ± 1276.44 *** | ** | NS | NS |
| R | 0.56 ± 0.00 | 174.67 ± 85.47 | 481.45 ± 175.55 | 5661.90 ± 66.68 | 7421.21 ± 2754.60 | 8610.65 ± 1042.50 | ** | |||
| PUFA | P | ND | ND | 66.18 ± 66.57 | 194.56 ± 95.00 | 232.00 ± 90.83 | 201.52 ± 84.37 ** | ** | * | ** |
| R | ND | ND | 19.95 ± 5.20 | 350.96 ± 117.33 | 349.62 ± 37.29 | 610.86 ± 305.15 | NS | |||
| PUFA/SFA | P | NC | NC | 0.047 ± 0.021 | 0.064 ± 0.033 | 0.050 ± 0.010 | 0.051 ± 0.016 | NS | NS | NS |
| R | NC | NC | 0.051 ± 0.008 | 0.043 ± 0.000 | 0.037 ± 0.003 | 0.043 ± 0.015 | NS | |||
| n-6/n-3 | P | NC | NC | 1.075 ± 0.853 | 0.727 ± 0.466 | 0.710 ± 0.348 | 1.061 ± 0.729 | NS | NS | NS |
| R | NC | NC | NC | 0.321 ± 0.044 | 0.477 ± 0.260 | 0.412 ± 0.232 | NS | |||
| AI | P | NC | 2.345 ± 1.700 | 0.928 ± 0.369 | 0.899 ± 0.247 | 0.924 ± 0.252 | 1.131 ± 0.342 * | ** | NS | * |
| R | NC | 1.286 ± 0.000 | 0.883 ± 0.006 | 1.338 ± 0.436 | 1.456 ± 0.935 | 1.830 ± 0.022 | *** | |||
| Descriptor | Milk | Ripening Time (Days) | Difference | ||||
|---|---|---|---|---|---|---|---|
| 60 | 90 | 120 | A | T | |||
| Aroma (1–7) | Lactic | P | 3.08 ± 0.47 | 3.54 ± 0.65 | 3.32 ± 0.39 | NS | NS |
| R | 3.39 ± 0.07 | 3.68 ± 0.09 | 3.55 ± 0.09 | NS | |||
| Spicy | P | 3.04 ± 0.56 | 3.03 ± 0.50 | 3.99 ± 0.58 | ** | NS | |
| R | 2.91 ± 0.11 | 3.26 ± 0.28 | 3.90 ± 0.19 | NS | |||
| Musty | P | 4.27 ± 0.35 | 3.97 ± 0.75 | 4.41 ± 0.37 | NS | NS | |
| R | 3.91 ± 0.18 | 3.82 ± 0.29 | 4.30 ± 0.42 | NS | |||
| Sour | P | 2.69 ± 0.37 | 2.72 ± 0.44 | 3.54 ± 0.38 | ** | NS | |
| R | 3.23 ± 0.11 | 2.71 ± 0.18 | 3.44 ± 0.27 | NS | |||
| Fruity | P | 2.07 ± 0.49 | 2.22 ± 0.30 | 2.69 ± 0.66 | NS | NS | |
| R | 2.48 ± 0.37 | 2.46 ± 0.65 | 2.74 ± 0.67 | NS | |||
| Taste (1–7) | Salty | P | 4.39 ± 0.46 | 4.52 ± 0.40 | 4.74 ± 0.33 | *** | NS |
| R | 4.11 ± 0.19 | 4.48 ± 0.73 | 4.65 ± 0.18 | NS | |||
| Bitter | P | 4.01 ± 0.40 * | 3.40 ± 0.35 | 3.65 ± 0.57 | ** | * | |
| R | 2.83 ± 0.21 | 3.15 ± 0.44 | 3.27 ± 0.26 | NS | |||
| Astringent | P | 3.47 ± 0.60 | 3.13 ± 0.40 | 3.57 ± 0.61 | NS | NS | |
| R | 2.61 ± 0.17 | 2.96 ± 0.40 | 3.82 ± 0.31 | NS | |||
| Spicy | P | 3.27 ± 0.47 | 3.21 ± 0.63 | 4.09 ± 0.63 | *** | NS | |
| R | 3.11 ± 0.26 | 3.55 ± 0.87 | 4.99 ± 0.12 | NS | |||
| Sweet | P | 1.86 ± 0.35 | 2.17 ± 0.29 | 2.11 ± 0.49 | NS | NS | |
| R | 2.61 ± 0.08 | 2.28 ± 0.04 | 2.22 ± 0.22 | NS | |||
| Acid | P | 3.29 ± 0.52 | 3.22 ± 0.59 | 3.49 ± 0.29 | NS | NS | |
| R | 3.48 ± 0.19 | 3.07 ± 0.23 | 3.83 ± 0.38 | NS | |||
| Persistence | P | 4.54 ± 0.42 | 4.48 ± 0.32 | 5.13 ± 0.33 | ** | NS | |
| R | 4.43 ± 0.23 | 4.75 ± 0.14 | 5.55 ± 0.11 | * | |||
| Global impression (1–10) | P | 6.83 ± 0.49 | 7.16 ± 0.27 | 7.11 ± 0.53 | *** | NS | |
| R | 7.57 ± 0.22 | 7.19 ± 0.27 | 7.43 ± 1.12 | NS | |||
Disclaimer/Publisher’s Note: The statements, opinions and data contained in all publications are solely those of the individual author(s) and contributor(s) and not of MDPI and/or the editor(s). MDPI and/or the editor(s) disclaim responsibility for any injury to people or property resulting from any ideas, methods, instructions or products referred to in the content. |
© 2023 by the authors. Licensee MDPI, Basel, Switzerland. This article is an open access article distributed under the terms and conditions of the Creative Commons Attribution (CC BY) license (https://creativecommons.org/licenses/by/4.0/).
Share and Cite
Diezhandino, I.; Fernández, D.; Abarquero, D.; Prieto, B.; Renes, E.; Fresno, J.M.; Tornadijo, M.E. Changes in the Concentration and Profile of Free Fatty Acids during the Ripening of a Spanish Blue-Veined Cheese Made from Raw and Pasteurized Cow and Goat Milk. Dairy 2023, 4, 222-234. https://doi.org/10.3390/dairy4010016
Diezhandino I, Fernández D, Abarquero D, Prieto B, Renes E, Fresno JM, Tornadijo ME. Changes in the Concentration and Profile of Free Fatty Acids during the Ripening of a Spanish Blue-Veined Cheese Made from Raw and Pasteurized Cow and Goat Milk. Dairy. 2023; 4(1):222-234. https://doi.org/10.3390/dairy4010016
Chicago/Turabian StyleDiezhandino, Isabel, Domingo Fernández, Daniel Abarquero, Bernardo Prieto, Erica Renes, José María Fresno, and María Eugenia Tornadijo. 2023. "Changes in the Concentration and Profile of Free Fatty Acids during the Ripening of a Spanish Blue-Veined Cheese Made from Raw and Pasteurized Cow and Goat Milk" Dairy 4, no. 1: 222-234. https://doi.org/10.3390/dairy4010016