Article

Inline Particle Size Analysis during Technical-Scale Processing of a Fermented Concentrated Milk Protein-Based Microgel Dispersion: Feasibility as a Process Control

Institute of Food Science and Biotechnology, University of Hohenheim, D-70593 Stuttgart, Germany
*
Author to whom correspondence should be addressed.
Current Address: Zifo Technologies GmbH, D-80798 Munich, Germany.
Current Address: Department of Safety and Quality of Milk and Fish Products, Max Rubner-Institut, D-24103 Kiel, Germany.
Dairy 2023, 4(1), 180-199; https://doi.org/10.3390/dairy4010013
Submission received: 19 December 2022 / Revised: 13 February 2023 / Accepted: 18 February 2023 / Published: 21 February 2023
(This article belongs to the Special Issue Tailoring Physical Properties of Fermented Dairy Products)

Abstract

:
Particle size is not only important for the sensory perception of fat-free fermented concentrated milk products, but also for processing operations because of the direct relationship with apparent viscosity. The aim of this study was to apply inline particle size analysis using focused beam reflectance measurement (FBRM) to obtain real-time information regarding the particle size of a fat-free fermented concentrated milk product, namely, fresh cheese. By comparing inline particle size data to offline particle size, apparent viscosity, protein content and processing information, the potential to use inline particle size analysis as a process monitoring and control option during fresh cheese production was assessed. Evaluation of inline particle size after fermentation and before further processing, e.g., after a buffering tank, shows promise as a means to control variance of product entering downstream processing and, thus, improve final product consistency over time. Measurement of inline particle size directly before filling could allow for precise control of final product characteristics by the use of mechanical or mixing devices placed before the inline measurement. However, attention should be given to the requirements of the inline measurement technology for accurate measurement, such as product flow rate and pressure.

1. Introduction

Fat-free fermented concentrated milk products, such as fresh cheese, quark and high-protein yoghurt, have similar structures [1]. The basic structure is composed of protein aggregates containing large amounts of serum and can thereby be referred to as fat-free fermented concentrated milk protein-based (MPb) microgel particles [2]. Microgel particles can swell or shrink in response to changes in environmental and serum conditions, e.g., mechanical input and temperature, which results in gain or loss of serum from the microgel particles [3,4].
The main step in the processing of fat-free fermented concentrated MPb microgel dispersions is fermentation, where a gel network is formed by the aggregation of milk proteins, mainly caseins [5]. Upon stirring and pumping, the (macro)gel network is broken down into smaller (micro)gel particles, which are suspended in the dispersion medium. Additional steps, such as heat treatments and concentration steps, may be carried out upstream or downstream from fermentation. Modifying the parameters at each stage of processing alters the micro- and macrostructure, which is directly related to the texture [2].
The texture of fat-free fermented concentrated MPb microgel dispersions should be creamy, smooth, free of lumps and grainy particles, and have no apparent syneresis [2,6]. More specifically, particle size is a main factor that affects the sensory perception of fermented milk products [7]. Previously, a threshold of 40 μm (volume-weighted diameter d(75,3) evaluated using static light scattering (SLS)) was defined for the in-mouth graininess of fresh cheese [8]. Furthermore, particle size is important for processing operations because of the direct relationship with rheological parameters, e.g., apparent viscosity [4].
The relationships that upstream, fermentation and downstream processing parameters have with particle size in fat-free fermented concentrated MPb microgel dispersions have recently been reviewed [2]. Downstream processing parameters are of particular interest, since microgel particle aggregation and breakdown can be tailored based on the applied conditions, such as tempering [8,9] and mechanical treatments [10,11,12,13], in order to control rheological properties. However, how specific processes alter particle size in technical-scale environments is not well understood, since process–structure–function relationships drawn from lab- and pilot-scale experiments cannot easily be transferred. Thus, knowledge of particle size at different stages during technical-scale processing, i.e., “live” and at final scale, would be advantageous to be able to adjust both the aggregation of microgel particles and the breakup of aggregated particle clusters during processing and to tailor final product properties.
SLS is a method often applied to offline particle size analysis [14] and has been successfully applied for the analysis of fat-free fermented concentrated MPb microgel dispersions [15,16]. Particle size is evaluated as volume-based particle diameter, and particles are assumed to be spherical in shape. Samples are procured, analyzed and the data is viewed later, i.e., after sample production. SLS measurements require samples with low volume concentrations (<1%); therefore, this technique is not commonly used for inline particle size measurement. For offline evaluation using SLS, samples often must be diluted to reach the required particle volume concentration and the dilution procedure itself, e.g., mixing conditions and dispersion medium, must be optimized for repeatable results. Despite this, SLS is the most popular particle size evaluation technique because of its versatility, fast measurement, broad size range and high reproducibility [17].
To obtain a more accurate representation of the particle size at different stages during processing, inline particle size analysis may be a beneficial tool. Inline usually means that a sampler, disperser, and/or sensor are mounted in the processing line. Hence, major advantages of inline analysis are, e.g., real-time analysis and subsequent corrective actions, non-invasive and continuous measuring, higher product quality within narrower specification limits, and decreased product losses [18,19].
A number of techniques can be used to evaluate particle size inline, e.g., focused beam reflectance measurement (FBRM) and 3-fold dynamical optical reflectance measurement (3D ORM) [16,20,21]. Both techniques employ a laser that focuses on one circular path in the sample. The raw measurement signal data consists of pulse durations of reflected laser light as the laser rotates at constant speed, after which these distances are converted to particle size and reported as chord length. With this technique, it is possible to evaluate samples with high solid concentrations [17]. FBRM has been applied successfully to yoghurt in order to evaluate particle size inline [20]. Additionally, 3D ORM has been effectively used to analyze inline particle size of fresh cheese, where results correlated well (R2 = 0.8250) with offline (SLS) particle size [16]. To our knowledge, there has been no study investigating the use of inline particle size during the processing of fat-free fermented concentrated MPb microgel dispersions at the technical scale.
The aim of this study was to evaluate particle size inline at different stages during the processing of a fat-free fermented concentrated MPb microgel dispersion, namely, fresh cheese. Inline particle size analysis using FBRM was adapted to a technical-scale processing environment and compared with offline particle size analysis (SLS). The relationships between processes, inline and offline particle size, rheology, and protein content were examined to assess the potential of inline particle size analysis as a process monitoring and control tool.

2. Materials and Methods

2.1. Study Design

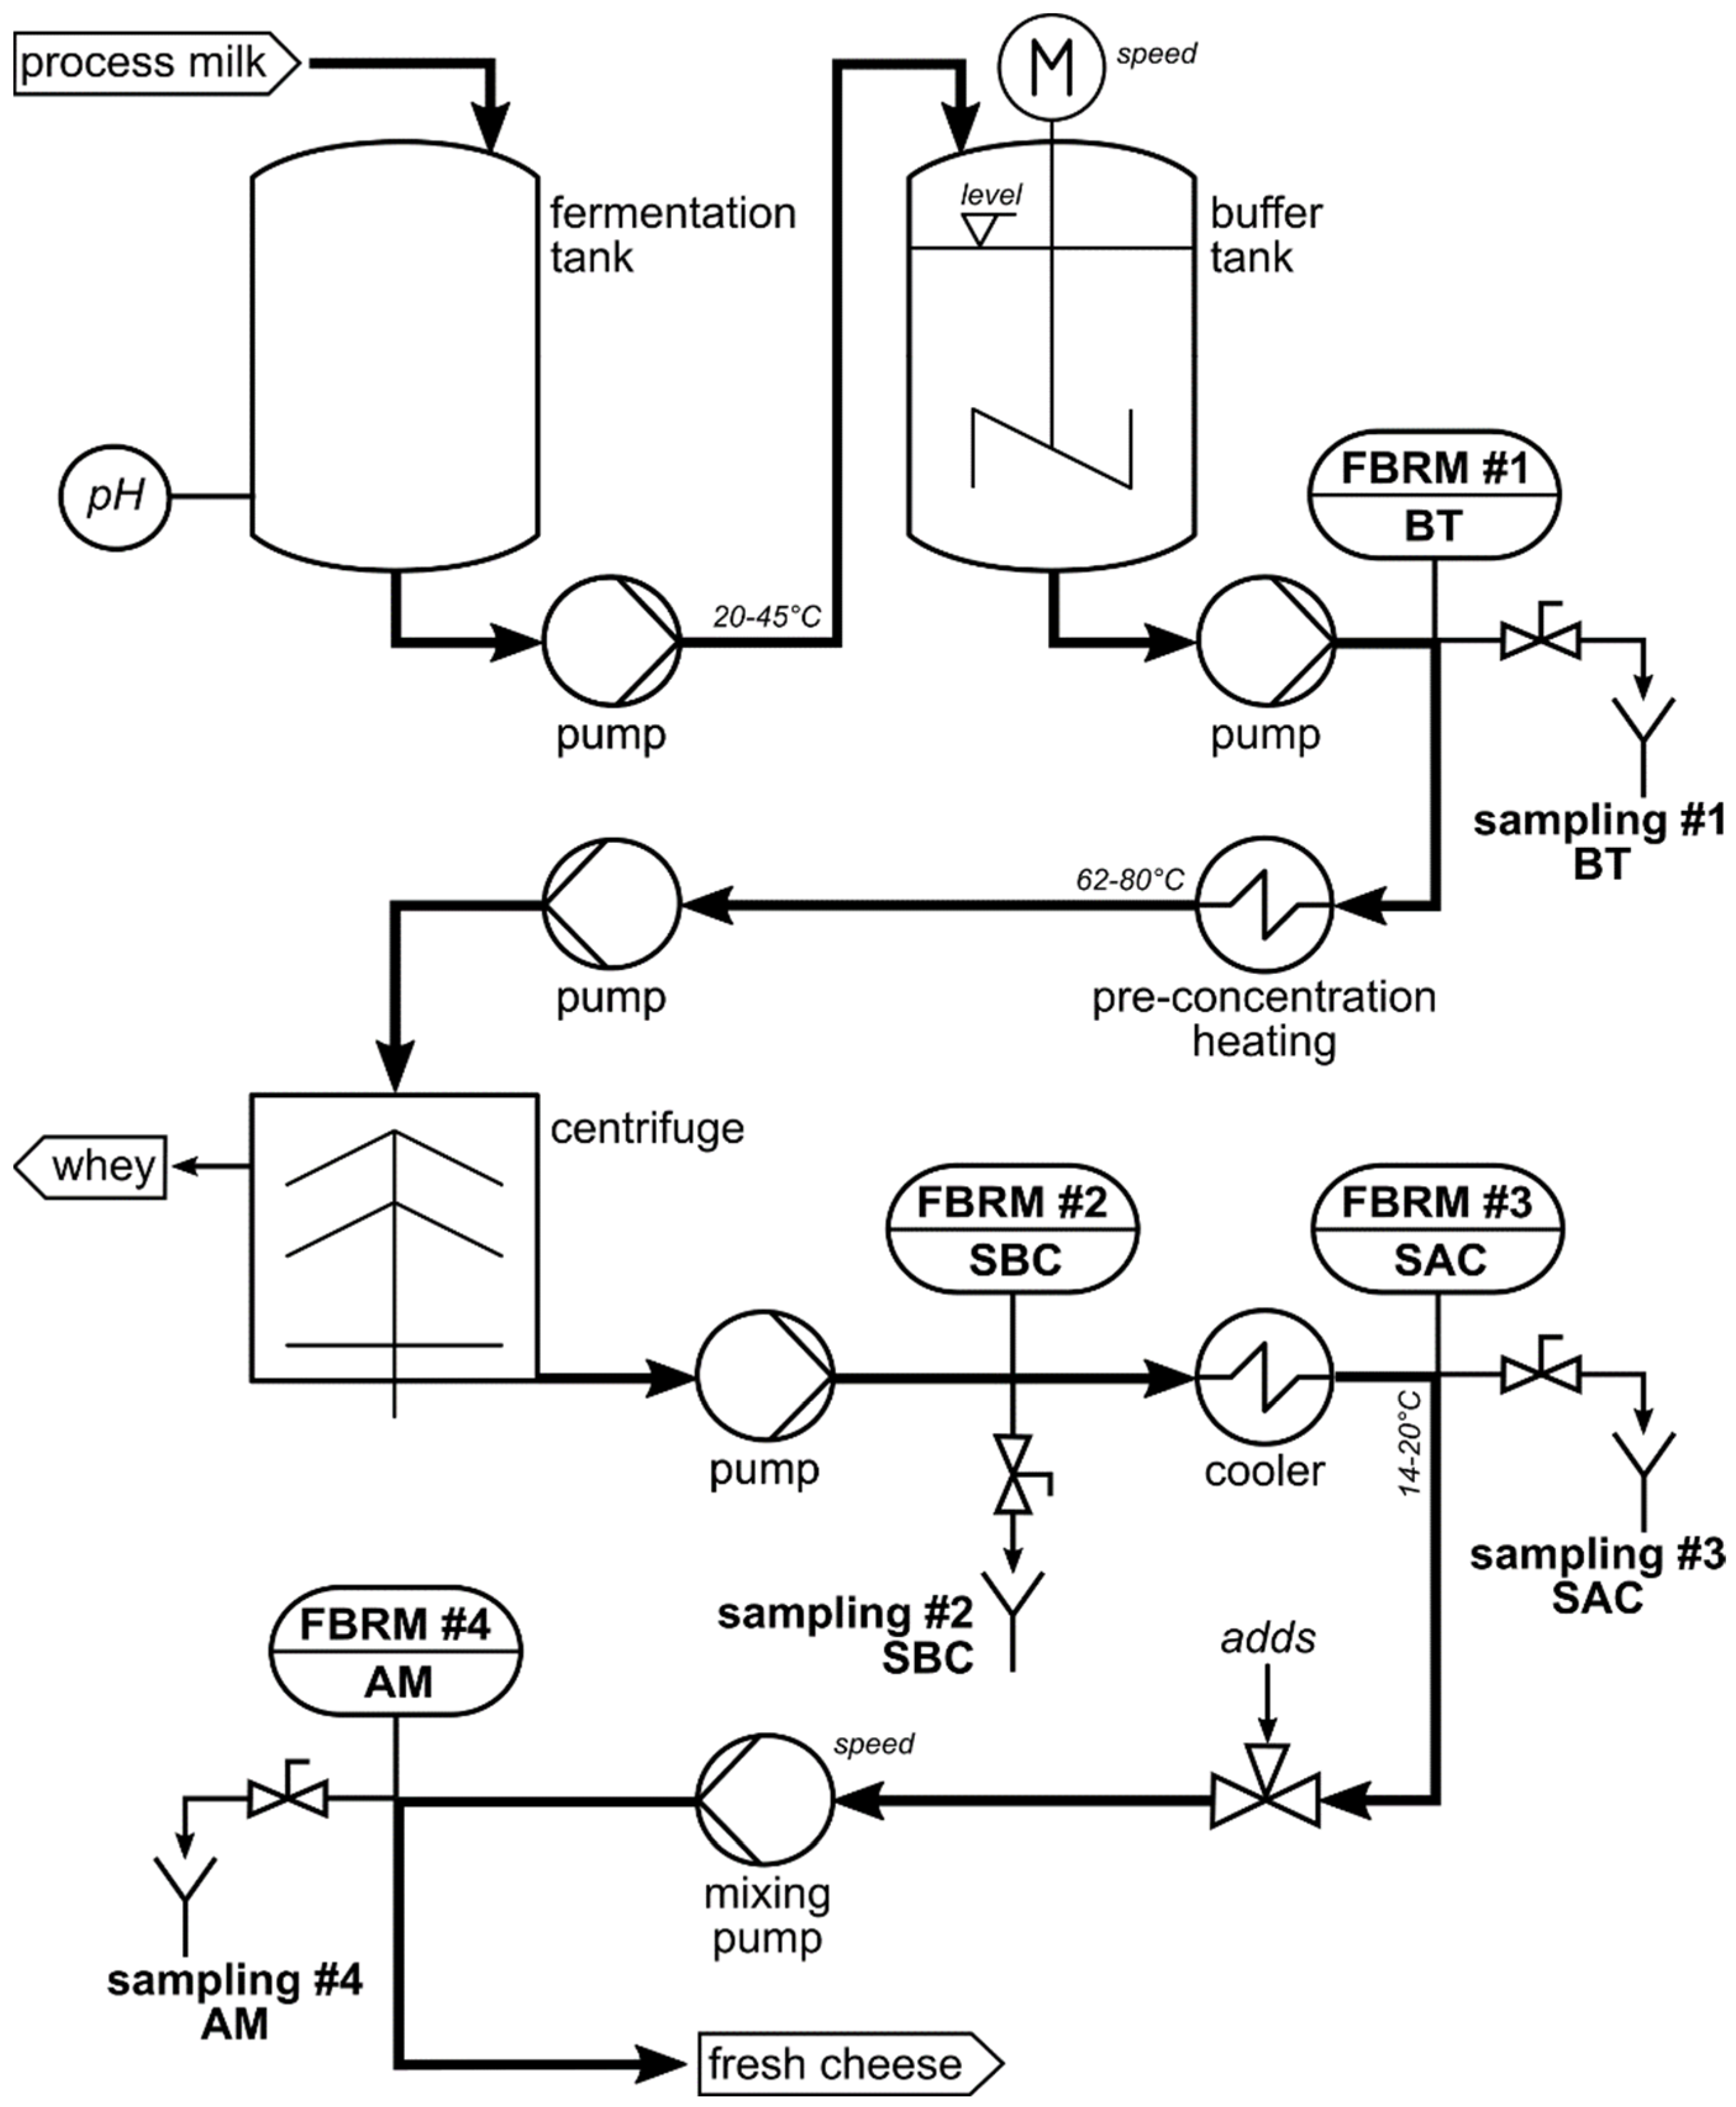
Inline measurements and offline sampling were conducted in a technical-scale fresh cheese processing facility. For this reason, the formulation and more specific details of the processing are not disclosed, as this is proprietary. A simplified overview of the processing line is depicted in Figure 1.
In brief, (fat-free) process milk was acidified in a fermentation tank, followed by pumping to a buffer tank. After storage in a buffer tank, the fat-free fermented gel was pumped through a heat exchanger and pumped into a centrifuge for concentration. After obtaining the desired protein content, the fat-free fermented concentrated MPb microgel dispersion was pumped through a cooler, followed by a mixing pump, and lastly filled into packages. It is important to note that although one processing line is shown, there were, in fact, multiple processing lines that were interconnected, e.g., multiple buffer tanks and separators interconnected. Four locations in the processing line were chosen for investigation, namely, after a buffer tank (FBRM#1/BT), after a separator/before a cooler (FBRM#2/SBC), after a separator/after a cooler (FBRM#3/SAC), and after a mixing pump/before a filler (FBRM#4/AM). These are referred to in the text as: (1) after the buffer tank (BT); (2) after the separator/before the cooler (SBC); (3) after the separator/after the cooler (SAC); and (4) after the mixer (AM). Offline samples were taken from the product stream via sampling valves built into the processing line at the same locations. Samples were cooled (6 °C) until further analysis. Preliminary work showed that storage times between 6 days and 7 weeks did not impact results. Therefore, all analyses were conducted between 6 and 18 days of storage. An additional offline sample type was defined as the end product (END), where two packages of the final product were stored at 6 °C until further analysis. Sampling for offline evaluation was performed at intervals between 3 and 6 h. Since the offline sampling valves were at various physical locations within the processing facility, a tolerance of +10 min was given for manual sample collection. For example, if offline sampling was conducted at 4:00, all offline samples were collected between 4:00 and 4:10. Protein content (Section 2.5), offline particle size (Section 2.3), and apparent viscosity (Section 2.4) were determined for the offline samples. Since only one FBRM probe was available for this study, inline measurements at each location were collected at different absolute times. Therefore, the inline particle size data cannot be directly compared between inline measurement locations. Furthermore, since this study was conducted during real processing in a technical-scale environment, several factors were out of our control. For example, offline samples at all four sampling valves could not always be taken at each sampling time, since cleaning at that sample valve location or processing at a different processing line was being carried out.
Information on the processing conditions listed below was kindly provided by the fresh cheese processor from the production protocol in order to facilitate drawing conclusions between processing, inline and offline particle size, protein content, and apparent viscosity. For the time frame of the experiment, details regarding fermentation (time and final pH), buffer tank (batch numbers, fill level in the buffer tank, whether the material in the buffer tank was being stirred quickly, slowly, or not at all), separator (bowl speed), and mixing pump (when material was being mixed in at this pump and the speed of the mixing) were shared by the fresh cheese producer.

2.2. Inline Particle Size Measurement

2.2.1. Measuring System

The particle size distributions of fresh cheese were measured inline using FBRM technology. A detailed explanation of the measuring principle, data acquisition, and numerical calculation of microgel particles is found in the literature [20]. In short, a laser focuses on the sample in a circular path a few micrometers in front of the measurement window at the end of the FBRM probe. When the focal point encounters a particle, the laser light is reflected back and collected in the probe. Hence, the measurement raw signal consists of pulse length distributions caused by different sized reflectors. Unlike laser scattering and diffraction, reflectance intensity or angle will not be considered. Since the focal point of the laser rotates through the measurement window in a circle at 2 m/s, much faster than the speed of the particles passing by the measurement window, particles are regarded as stationary in relation to the focal point. From the time of reflection on the particle and the speed of the rotating laser, the chord length is obtained as a measure of particle size, and each measured particle is counted. With a sufficient number of particles, the so-called chord length distribution is obtained. The chord length distribution is initially number-weighted. The distribution can be converted to other weighting, e.g., volume, by assuming a spherical particle shape [20]. It should be noted that the evaluated length is not necessarily the particle diameter, a spherical shape is assumed, and all reflective particles are measured, independent of particle properties, e.g., refractive index [16].

2.2.2. Adaptation for Technical-Scale Process Line

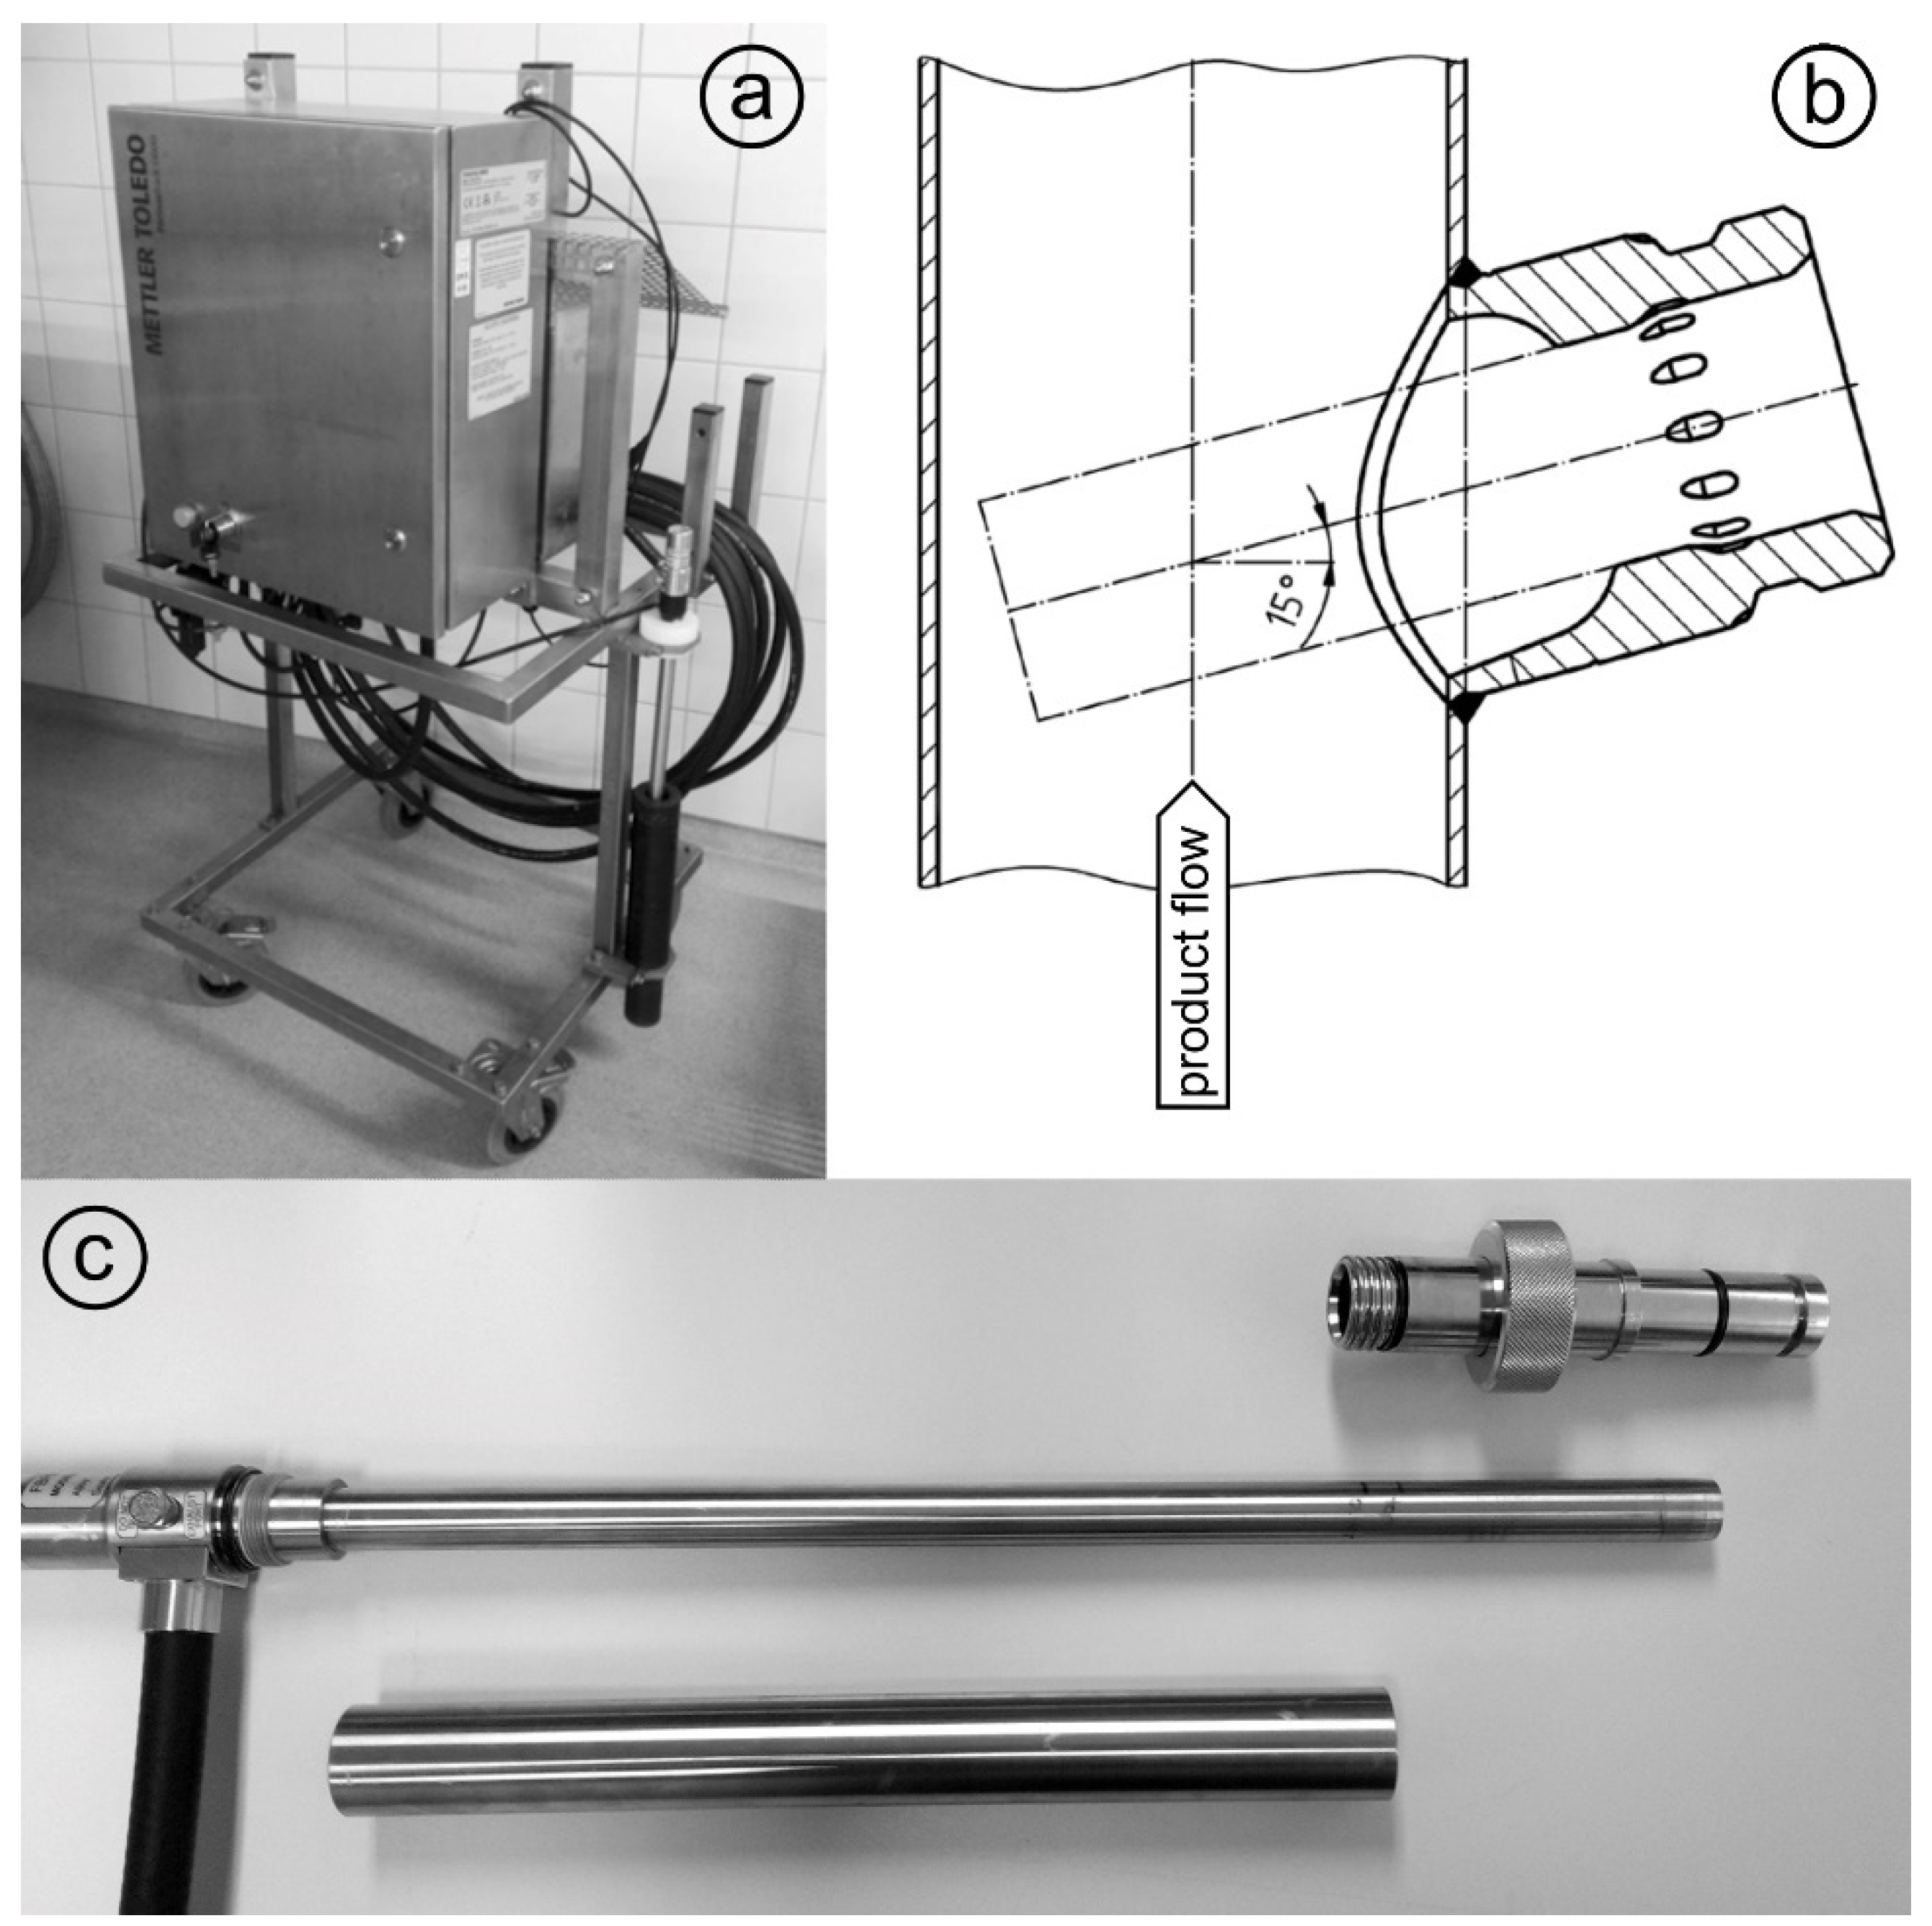
Since the FBRM probe of the measuring instrument (ParticleTrack G600B, 19 mm diameter sensor; Mettler Toledo, Columbus, OH, USA) is typically used for laboratory-scale experiments, where it is immersed in beakers or tanks, it was necessary to design: (i) a mobile measurement setup; and (ii) an adapter in order to install the probe into the pipelines of the technical-scale processing line (Figure 2). In addition to the FBRM probe (cable length = 15 m), the mobile measurement setup consists of a mobile trolley with a laptop tray. When designing the probe adapter, it was important to install the probe at an angle of 15–60° to avoid product accumulation and fouling at the measurement window (communication with Mettler Toledo). Clean-in-place and sterilize-in-place -compliant, pressure-resistant Ingold weld-in adapters (bbi/biotech GmbH, Berlin, Germany) were procured and modified for use in the processing line. These adapters can be used to install the FBRM probe in processing lines with flowing media at pressures of up to 1 MPa (corresponding to the maximum permissible pressure of the probe). Adapters, with accompanying sampling valves kindly provided by the fresh cheese producer, were built into the processing line at each measuring location before the start of the experiment.
Before each set of inline particle size measurements, the probe was cleaned thoroughly with ethanol and distilled water until the total counts (total measured number of particles) in air measured less than 300 counts per 10 s. The probe was built into the processing line via the adapter during a cleaning and sanitizing cycle at the inline measurement location. Inline measurements were initiated and continued until the next cleaning and sanitizing cycle at that inline measurement location, at which point the probe was removed and inserted at the next measurement location.

2.2.3. Data Acquisition

The iC FBRM Software V3 (Mettler Toledo, Columbus, OH, USA) was used to collect all FBRM data. Data were collected at 10 s intervals with the stuck particle correction function turned on. This function removes the data being collected from particles that appear with the same size at the same position on the lens in two consecutive measurements, with a maximum of 10% of the total particles. The particle sizes were calculated in MACRO mode, meaning that there was low sensitivity to slight disturbances in the detected signal (as opposed to PRIMARY mode, where there is high sensitivity to signal disturbances). For example, loosely aggregated particles would be observed as one larger particle in MACRO mode, whereas in PRIMARY mode, the loose aggregates would instead be observed as many smaller particles very close together. The collected particle sizes were converted to cube-weighted size distributions. Data smoothing was performed by calculating a moving average with a window of 30 data points as outlined in Section 3. Representative cube-weighted inline particle sizes (chord lengths) of .x10, .x50, .x75, and .x90 were collected, representing the cube-weighted percentiles, e.g., x10 is the 10th percentile of the cube-weighted chord length. The span (xspan) was calculated as .x90 minus .x10. For the purpose of comparison, inline particle size values at the same time points as offline sampling were evaluated, e.g., at 1 h. Since inline measurements are relatively fast (1 data point every 10 s) compared to taking offline samples (hourly), the recorded data was averaged for two separate minutes for comparison with offline data. A first data point was calculated by averaging the data points collected during the first minute that offline data were collected. A second data point was calculated for the fifth minute, also averaging the data recorded for a complete minute. For example, for an offline particle size sample collected at hour 5, inline data points for 5:01 and 5:05 were calculated.

2.3. Offline Particle Size Measurement

SLS was used to evaluate the particle size of the offline samples. In this technique, a laser beam is directed through the sample. As the laser beam passes through the sample, the angular change of the scattered laser beam is used to calculate the size of the particles responsible for generating the scattering pattern. The particle sizes are given as the volume-equivalent sphere diameter, from which the particle size distribution is calculated. Representative particle sizes of .d10, .d50, .d75, and .d90 were evaluated, representing the volume-weighted percentiles containing 10%, 50%, 75% and 90%, respectively, of all particles being smaller than this size. The span (dspan) was calculated as .d90 minus .d10.
A Beckman Coulter LS 13 320, connected to a Universal Liquid Module and control software v6.01 (Beckman Coulter Inc., Miami, FL, USA) was used to analyze the particle size as described by Heck et al. [15]. The imaginary refractive indices (RI) for particles and water were fixed at 0.00, since they are white or transparent materials [22]. The real RI of the particles and water were set at 1.57 and 1.33, respectively.
Particle size analysis was conducted in duplicate for each offline sample.

2.4. Rheological Characterization

A stress-controlled rheometer AR 2000 (minimum torque: 9.1 nMm; TA Instruments Inc., Eschborn, Germany) with a concentric cylinder cup and bob system (stator inner radius = 15.0 mm, rotor outer radius = 14.0 mm) was used to evaluate flow curves of the samples using the procedure described by Fysun et al. [23]. In brief, each sample was stirred gently for 15 to 20 s with a plastic spoon before the measurement. A sample weighing 16 to 17 g was added to the cup, followed by equilibration at 10 °C for 7 min. Then, the shear rate was increased from γ ˙ = 0.001 to 1000 1/s over a period of 8 min with ten points per decade. The apparent viscosity at a shear rate of 100 s−1 ( η 100   s 1 ), found to correlate with in-mouth viscosity [24], was extracted from the flow curve. Each sample was measured in duplicate.

2.5. Protein Analysis

The protein content of each offline sample was evaluated using the method of Dumas (IDF 185) using a nitrogen analyzer (Dumatherm DT; C. Gerhardt GmbH & Co. KG, Königswinter, Germany). The total nitrogen content was multiplied by a conversion factor of 6.38 to calculate the protein content. Samples were analyzed in triplicate.

2.6. Statistical Analysis

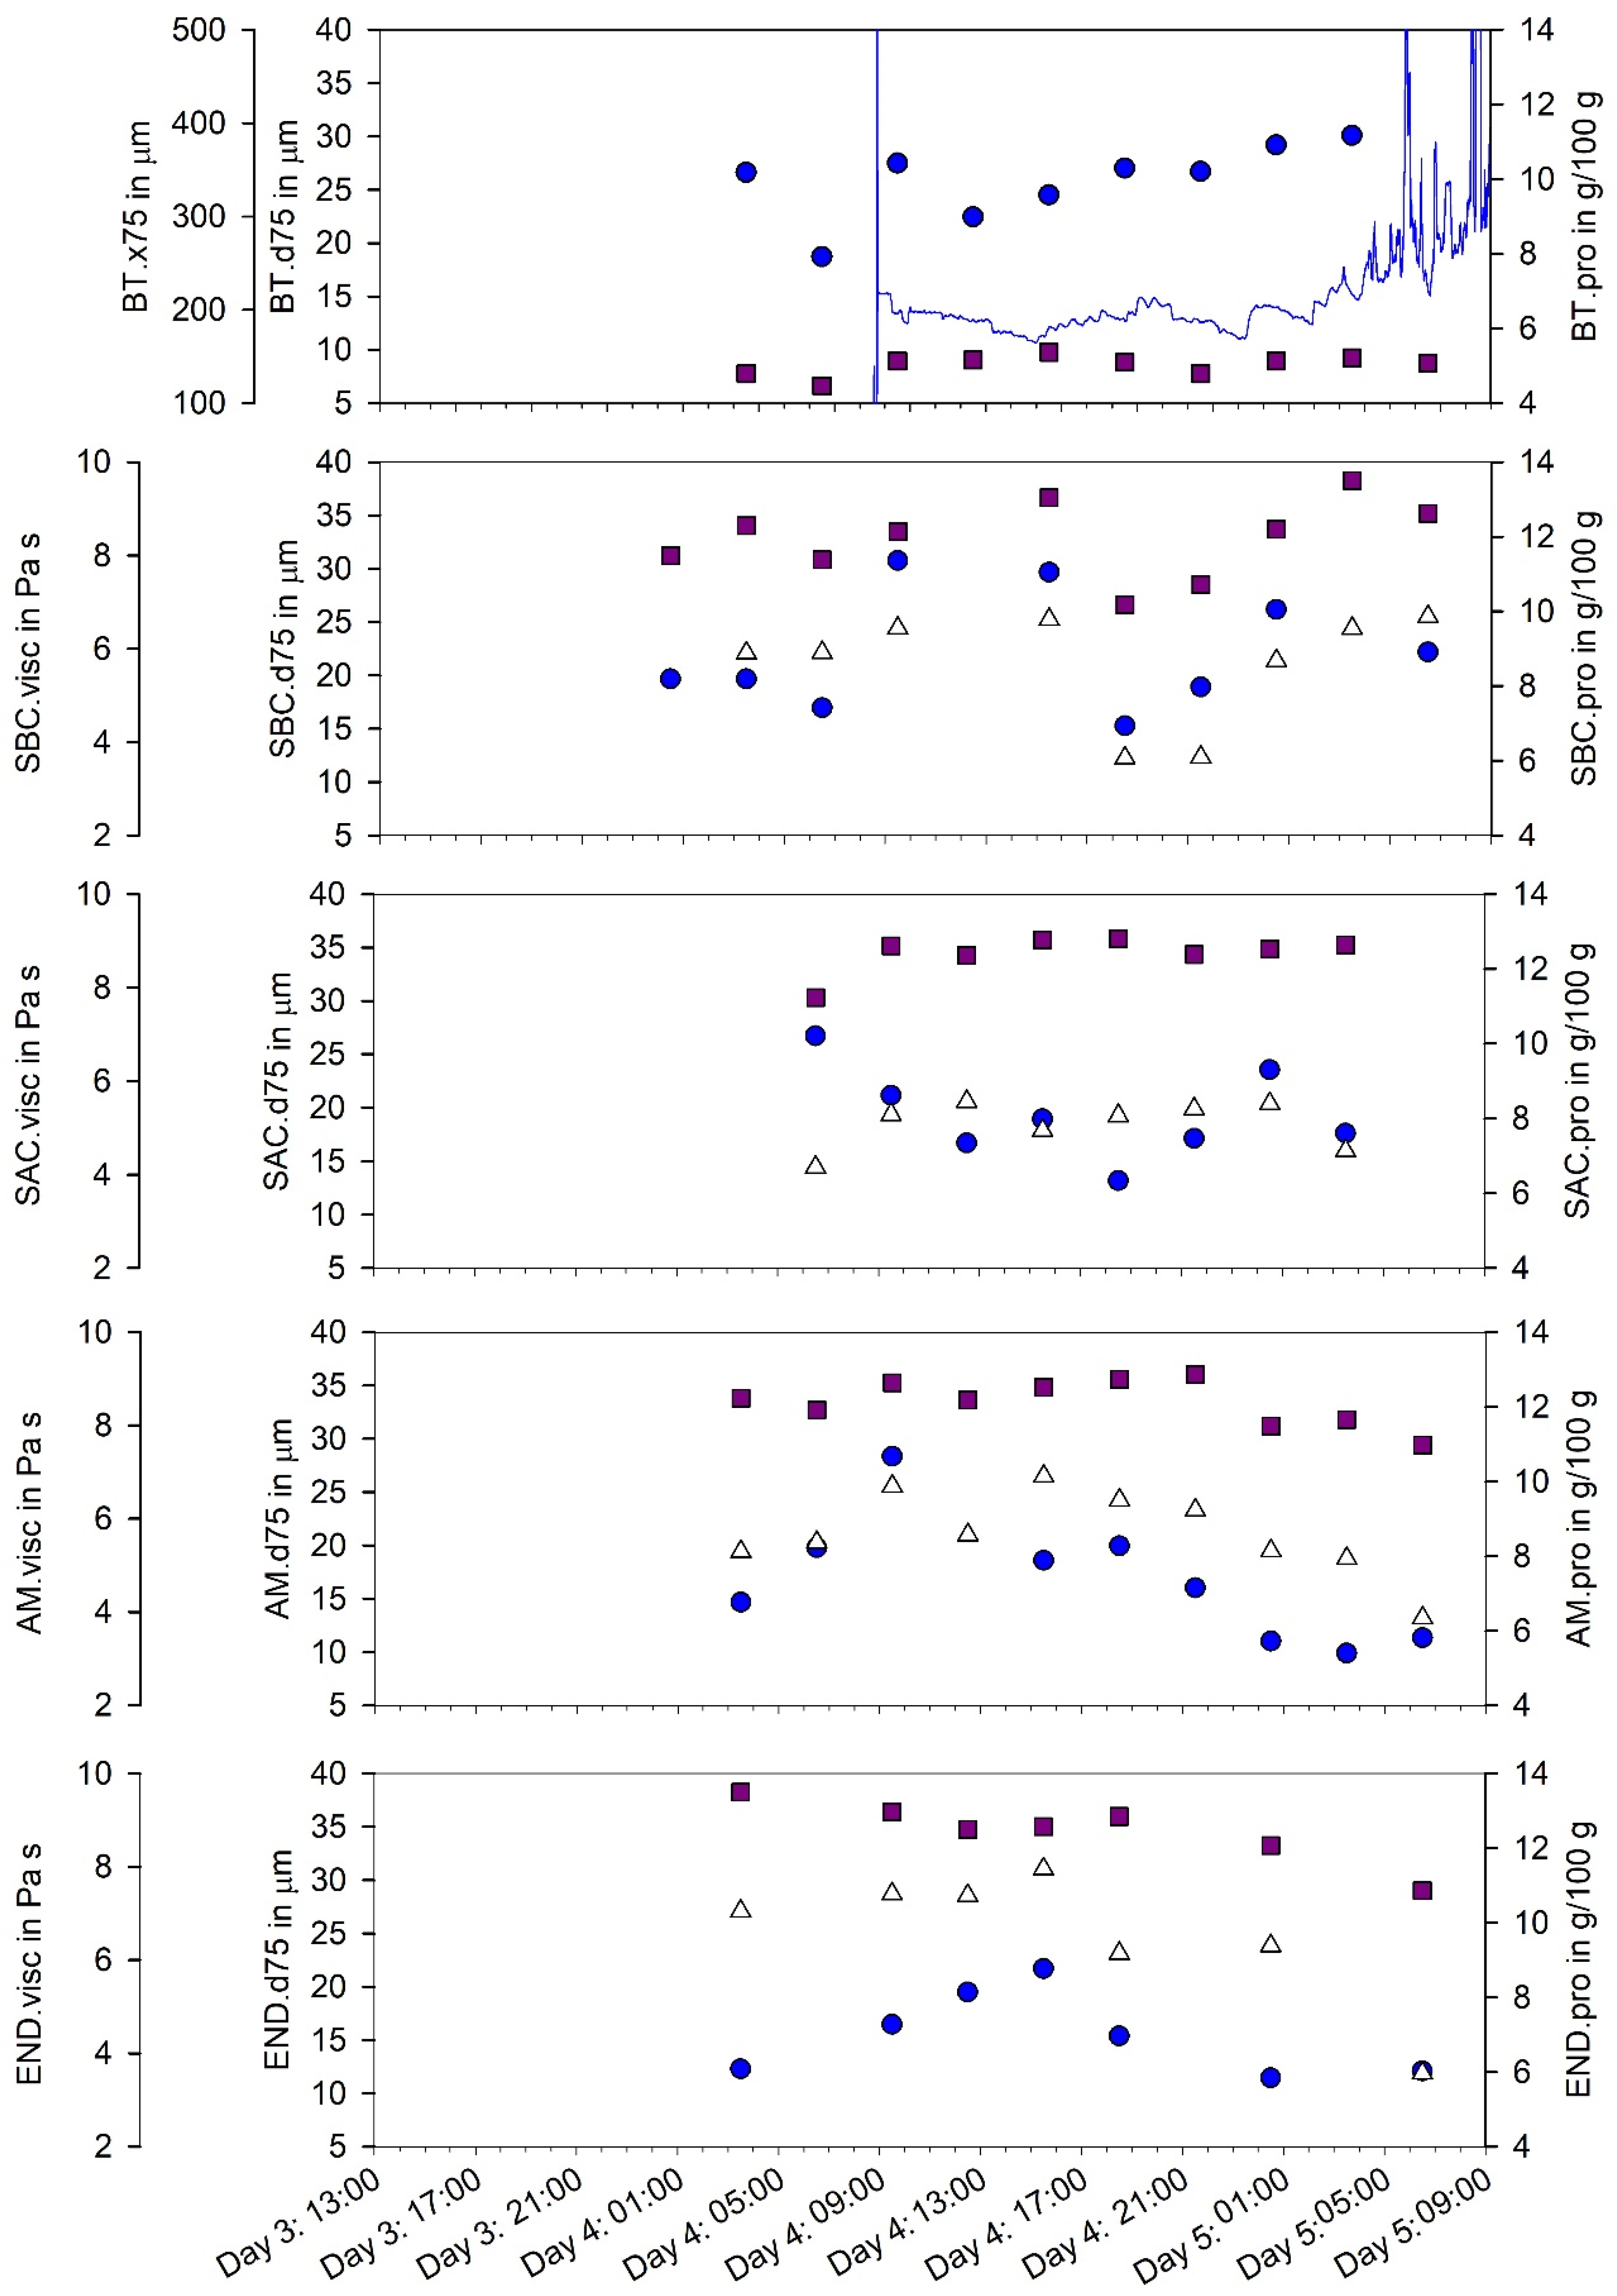
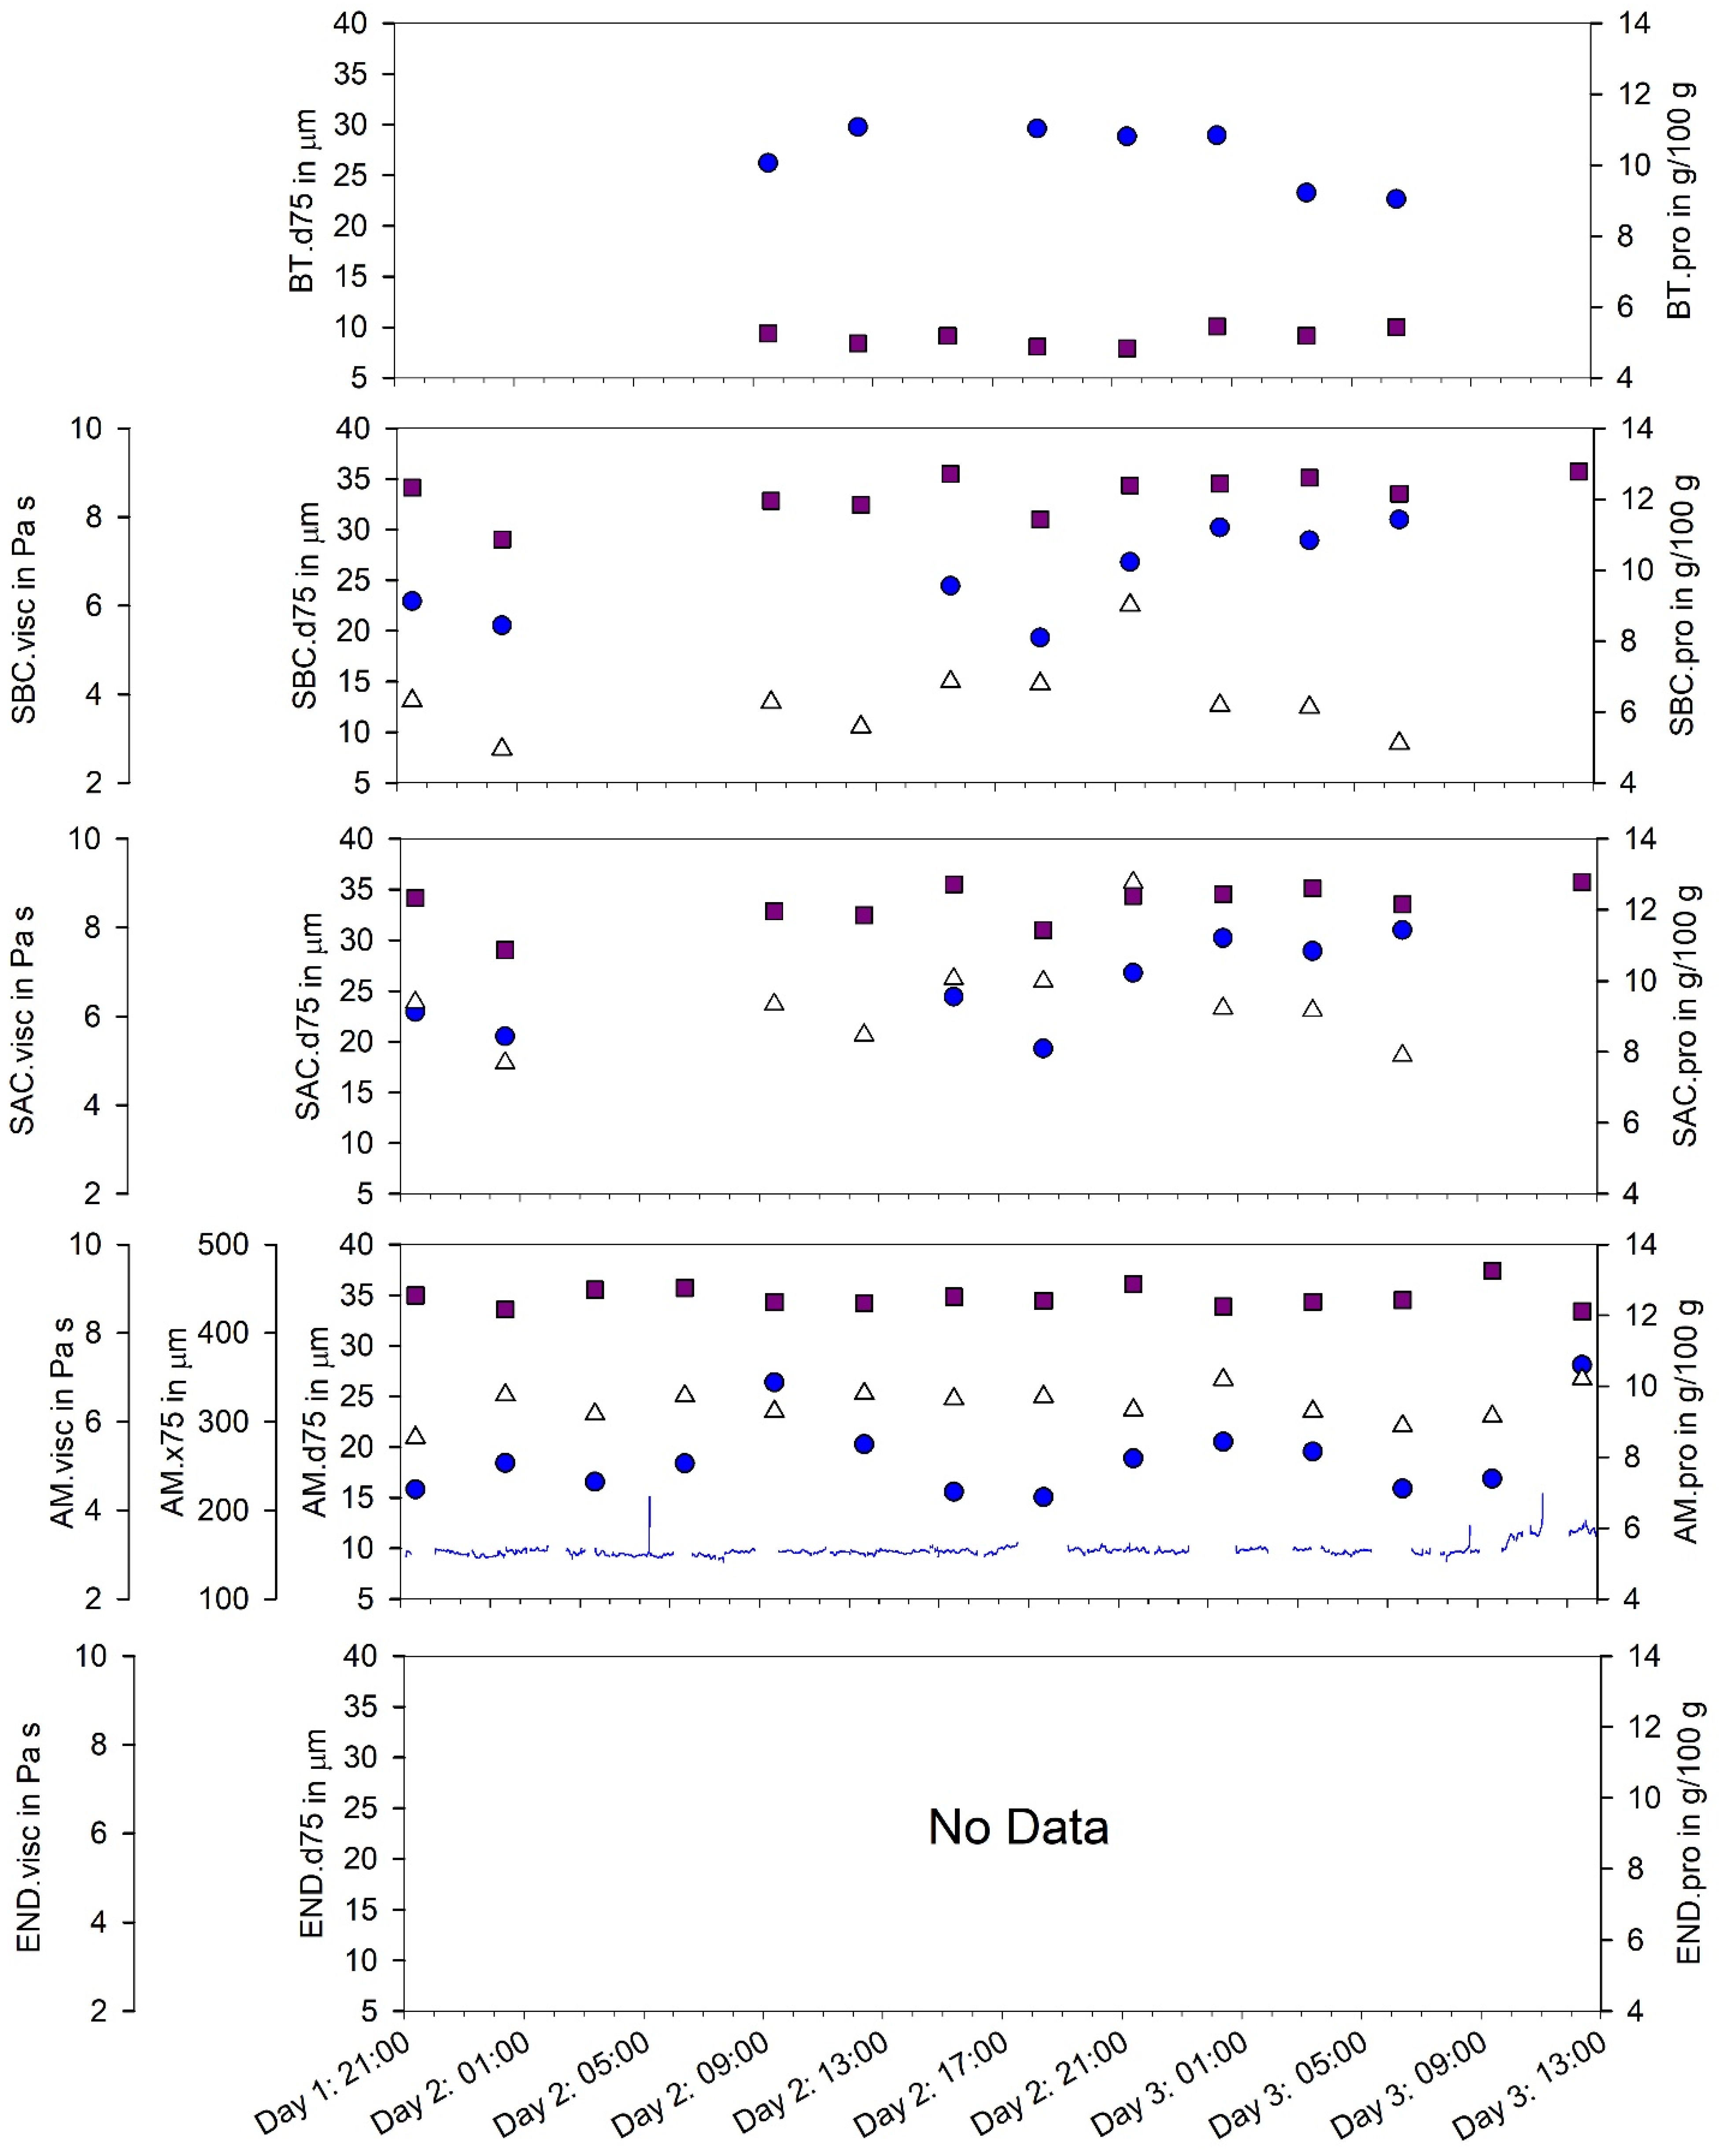
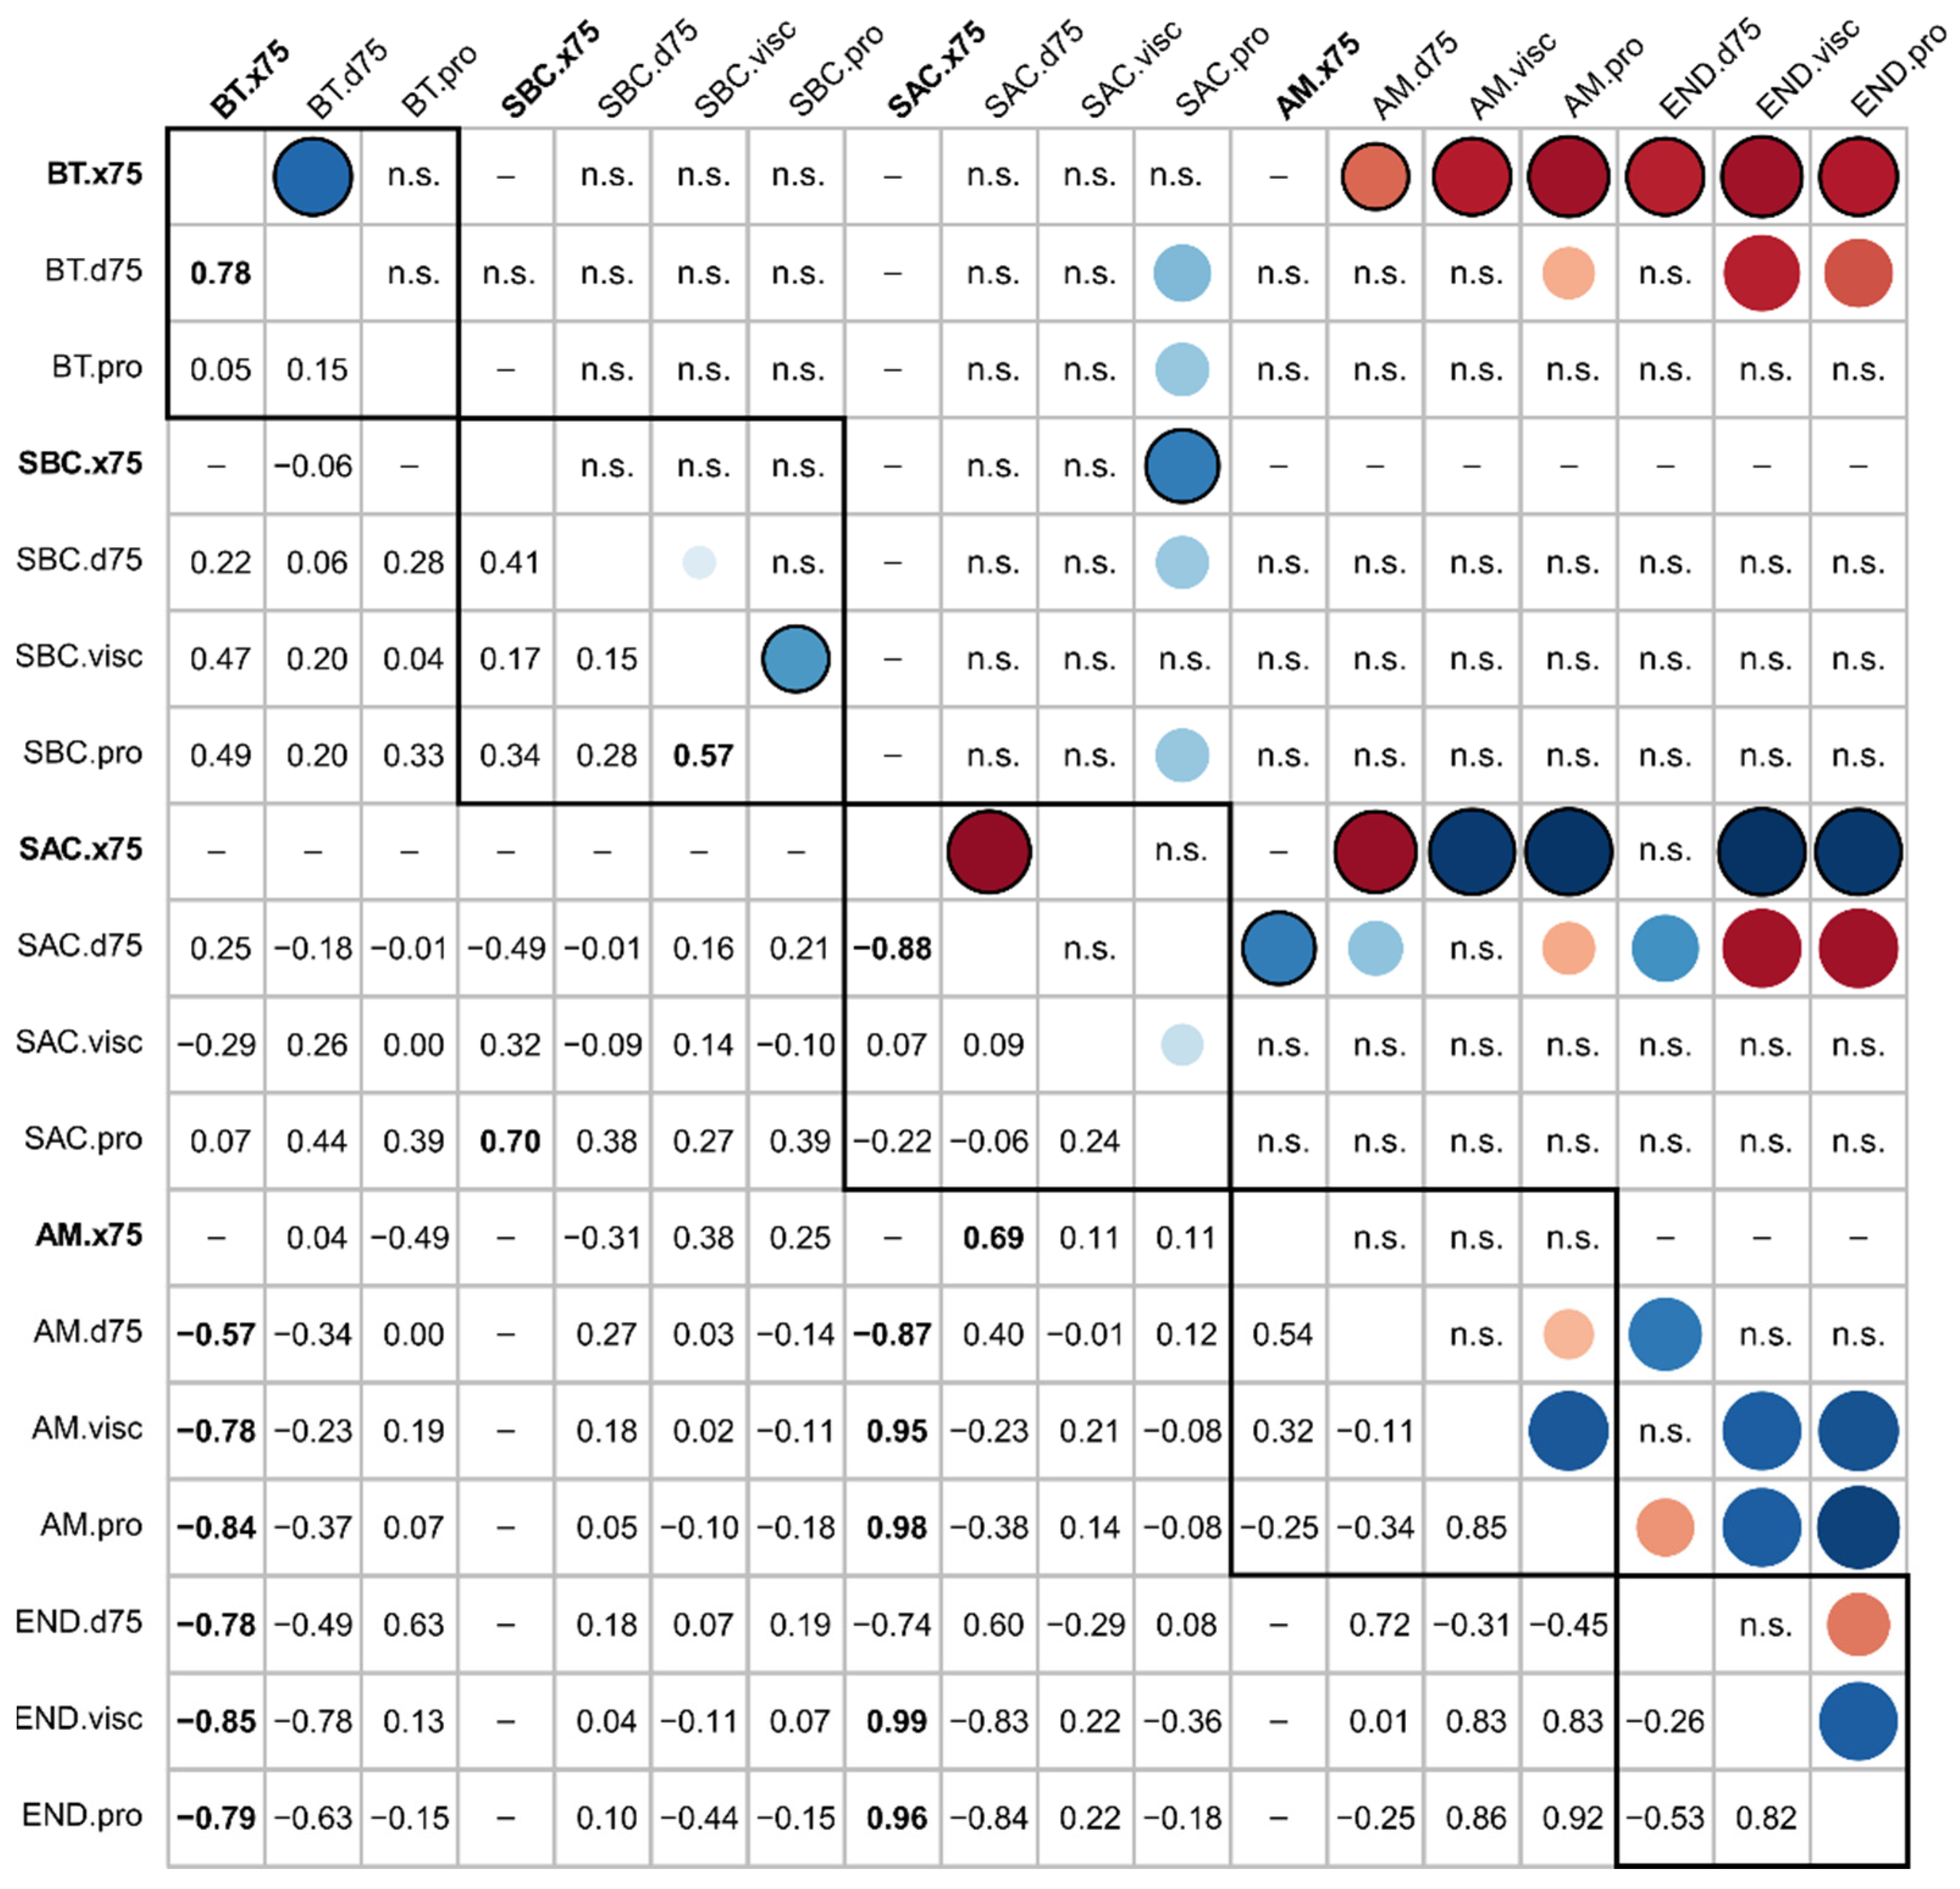
For inline and offline particle size, viscosity, and protein content, the statistics are given in combination with a measurement location abbreviation and the measurement abbreviation, e.g., for the buffer tank, the abbreviations would be BT.x75, BT.d75, BT.visc and BT.pro, respectively. Arithmetic means and standard deviations for the evaluated parameters are presented in Section 3.
To investigate the relationships between inline particle size, offline particle size, protein content, and apparent viscosity, Pearson correlation coefficients were calculated. p-values of ≤0.10 indicate significant correlations. All statistical analyses were performed using SigmaPlot 12.5 (Systat Software Inc., San Jose, CA, USA).

3. Results and Discussion

3.1. Technical Considerations

Figure 3, Figure 4, Figure 5 and Figure 6 show the inline .x75 and offline .d75 particle size, protein, and apparent viscosity η 100   s 1 data collected at all measurement locations. Inline .x75 and offline .d75 particle size were selected as representative particle size statistics, since Pearson correlation coefficients between the x(chord length) and d(particle diameter) for the 10th, 50th, 75th and 90th percentiles and span at each measurement location were the highest for inline .x75 and offline .d75 (BT: R = 0.78, p < 0.001; SBC: R = 0.41, p = 0.12; SAC: R = −0.88, p = 0.001; AM R = 0.54, p = 0.003). It is noted that no correlation coefficients for the measurement location SBC were significant (p > 0.10).
Figure 3, Figure 4, Figure 5 and Figure 6 display the inline .x75 particle size data collected at a specific inline measurement location, along with the offline data collected at the same time for all offline sampling locations. As mentioned in Section 2, data for each offline sampling time are not available for all the time ranges for which inline data were collected. For example, in Figure 4, no samples are shown for AM or END, because this part of the processing line was not in use at this time. Collection of inline particle size data began after insertion of the probe into the processing line during the cleaning process. Data collection proceeded until removal of the probe during the next cleaning cycle. As such, some cleaning cycles can be observed in Figure 3, Figure 4, Figure 5 and Figure 6, where particle sizes appear to increase dramatically. In fact, these large and fast increases of inline particle size are artifacts and do not represent real “product” inline particle sizes (Figure 3: Day 5, 5:00–9:00; Figure 4: Day 6, 15:30–16:00 and Day 7, 08:00–10:00; Figure 5: Day 5, 09:00–12:45 and Day 6, 05:30–06:30). There are two things to consider about the material flowing past the FBRM measurement window from the start of the cleaning and sanitization cycle until the next product flows through the processing line. First, the material is of a different composition, e.g., decreasing protein content as product is removed from the pipeline; second, the speed of flow past the measurement window of the FBRM probe is variable and is even set at zero at some points in time. These factors result in high variability between the collected inline particle size data points. Most importantly, (very) low flow rates result in apparent particle sizes far larger than present in the processing line, since multiple particles are evaluated as one larger particle by the rotating FBRM laser and could not be omitted by digital signal processing. Those artifacts should be excluded from further data processing for control purposes.
There are both advantages and disadvantages of the individual measuring locations with respect to the relationships between inline and offline data, as well as the relationship between the analytical result and actual product characteristics. Both aspects must be considered when evaluating the measuring locations and the potential of inline particle size analysis as a process monitoring tool during the production of fresh cheese.

3.2. Evaluating Measurement Locations in the Processing Line

3.2.1. After Fermentation, before Concentration: After Buffer Tank (BT)

The first location in the processing line where we evaluated inline and offline product characteristics was the point after fermentation and before separation, namely, after a BT and before further processing, e.g., heating and concentration via separator. The particle size at this stage of processing is largely dependent on the upstream and fermentation parameters [2]. For example, the particle size directly after fermentation is influenced by any added components (e.g., increased protein content), upstream milk heating time/temperature, and the fermentation time/temperature. Additionally, downstream mechanical energy input such as the unavoidable/inevitable pipe flow or any intended shearing is a significant factor affecting particle size and rheological characteristics of stirred fermented milk products [13], e.g., breaking up the gel after fermentation. Properties of the raw material tend to be measurable in the final product, while the influences of the processing parameters can be reduced or eliminated by further downstream processing of the fat-free fermented concentrated MPb microgel dispersion. This could be a suitable place for inline measurement of particle size and process control when different products are made or when fermentation and successive agitation (i.e., stirring after fermentation) times vary during and between productions (feed forward control).
In Figure 3, the BT.x75 values are displayed. The offline particle size, protein content, and apparent viscosity are also shown for the same absolute time frame at all measurement locations. BT.x75 values ranged between 175 and 250 μm before cleaning began at 20 h, while BT.d75 values ranged between 17 and 30 μm (Figure 3). The particle size was slightly larger directly after concentration when evaluated inline (SBC.x75 = 175–320 μm), whereas offline particle size (SBC.d75 = 20–31 μm) was comparable to measurements after the buffer tank (Figure 3 and Figure 4). After concentration, particle size tended to reduce with added processing steps (Figure 3, Figure 4, Figure 5 and Figure 6). This is in line with previous observations on the impact of mechanical input during downstream processing on the characteristics of fermented milk products [13].
The offline sampling procedure after the buffer tank could have an influence on the evaluated offline particle size values of the samples: Immediately after fermentation (before concentration), the gel is weak and the particles are soft, the extent of which being dependent on upstream and fermentation processing, e.g., milk heating and mechanism of gelation [1]. The product is mechanically stressed (sheared) at the holding temperature from the buffer tank (similar to fermentation temperatures; typically between 20 and 34 °C for fresh cheese [2]) when it is taken using the offline sampling valve, likely resulting in reduced particle size and increased product homogeneity when evaluated at a later time [13]. A phenomenon referred to as “rebodying”, where viscosity and firmness increase during storage (from sampling until analysis), likely occurred in these samples [13]; however, little is known regarding changes of particle size during rebodying [13]. BT.x75 and BT.d75 values (Figure 3) correlate strongly with each other, with R = 0.78 (Figure 7). Therefore, despite any effect of the sampling valve and procedure on the BT.d75 values, directional differences are still identifiable.
During the time frame shown in Figure 3, the BT.x75 values initially decreased until 8 h, followed by an increase until 12 h, then a slight decrease until 16 h, after which there was an increase. It was found that BT.x75 was negatively correlated with AM.d75 (R = −0.57) and END.d75 (R = −0.83). Furthermore, BT.d75 correlated negatively with AM.d75 (R = −0.34; Figure 7). It is hypothesized that the larger the particles are in the buffer tank, the more unstable they are to mechanical treatment; as such, the larger particles are broken down and are even smaller later in processing.
BT.x75 correlated negatively with AM.pro (R = −0.86) and AM.visc (R = −0.78). Similarly, BT.d75 correlated negatively with AM.pro (R = −0.37), though the correlation was weaker than that for inline particle size (Figure 7). In addition, BT.x75 correlated negatively with END.pro (R = −0.84) and END.visc (R = −0.86). Likewise, BT.d75 correlated negatively with END.pro (R = −0.63) and END.visc (R = −0.78; Figure 7). A potential explanation for these correlations is the relationship between particle size and centrifugation during the separation process: Larger particles at the same protein content are more difficult to separate than smaller particles because the density difference is smaller. This indicates that inline particle size information could be used to set the separator parameters (e.g., bowl speed) in order to achieve desired protein contents (feed forward process control). Another explanation relates to the mechanical stability of the particles, which depends on a variety of factors, including fermentation time and temperature [2]. The formation of large “soft” protein aggregates can be induced by vibrations during fermentation, which are transferred to the fermentation tanks via pipelines, e.g., those from pumps, homogenizers and switching valves [25]. These aggregates are easily broken down by mechanical input, such as that during the separation process [26]. In addition to this, longer separation times, resulting in higher protein contents, lead to smaller particle sizes [26].
There were moderate positive correlations between BT.d75 and SAC.d75 (R = 0.44), as well as between BT.pro and SBC.pro (R = 0.33), and BT.pro and SAC.pro (R = 0.39; Figure 7). Considering that there were no significant correlations between BT.pro and AM.pro or END.pro, the results suggest that both BT.x75 and BT.d75 are potential indicators of apparent viscosity of the fat-free fermented MPb microgel dispersion after concentration. However, further information concerning the volume fraction, which provides more information about the microstructure and serum-binding, is necessary to make further conclusions, as this is an essential piece of information to describe the textural properties of fat-free fermented concentrated milk products [22].

3.2.2. After Concentration: After Separator and before Cooler (SBC) or after Cooler (SAC)

Concentration via separation is accompanied by high mechanical energy input, which would be expected to reduce particle size in comparison to the particle size directly after the buffer tank. Any change in size at this stage in processing would be dependent on upstream parameters, e.g., milk heating and fermentation parameters, since these will define the response of the microgel particles to further downstream parameters. Downstream parameters affecting the microgel dispersion between the buffer tank and after the separator include the separator and separator settings. It is also noted that the processing line includes a heat exchanger between the buffer tank and the separator (Figure 1) and that pre-concentration heating results in larger particle sizes in the final product when compared without pre-concentration heating [27]. Thus, this would be a suitable measurement location for inline particle size in order to map the influences of pre-concentration heating and the separation process on product characteristics, and to implement a strategy to take these into account to achieve the desired final product characteristics. Some examples based on the following correlations are given in Section 3.2.2.
The SBC.x75 values ranged between 175 and 320 μm for times when product was being processed (values during cleaning procedure omitted), while SBC.d75 values in the same time frame ranged from 20 to 31 μm (Figure 4). While the offline particle size was similar to that evaluated offline after the buffer tank, the inline particle size was slightly higher than that evaluated after the buffer tank (Figure 3 and Figure 4). An increase in particle size from after fermentation to after separation is attributed to the pre-concentration heating step [15,27]. No correlation was found between SBC.x75 and SBC.d75 (R = 0.41; Figure 7) and a visual plot of the data did not show any trends. In contrast, there were some significant correlations between other product characteristics and particle size evaluated after the separator. For example, SBC.x75 was strongly correlated with SAC.pro (R = 0.70; Figure 7), while SBC.d75 correlated weakly with SBC.pro (R = 0.28) and SAC.pro (R = 0.38; Figure 7). Furthermore, SBC.pro and SBC.visc correlated moderately with each other (R = 0.57; Figure 7). Since the bulk protein content does not change during this processing step (from after separator and before cooler to after separator and after cooler), this is likely a spurious correlation. However, one hypothesis is that the larger particles mean there are fewer fines left in the separated whey, resulting in a relationship between higher protein content and larger particles. No significant correlations were found between product characteristics after the separator/before the cooler and later stages of processing, i.e., after the mixer and the final product.
The SAC.x75 values ranged from 140 to 150 μm for times when product was being processed (values during cleaning procedure omitted), whereas SAC.d75 in the same measurement time ranged from 20 to 38 μm (Figure 5). The range of SAC.x75 values was smaller than for BT.x75 (Figure 3) and SBC.x75 (Figure 4). The inline particle size is smaller after the cooler than previous measurement locations; however, the offline particle size is similar to previous measurement locations (Figure 3, Figure 4 and Figure 5). It was found that SAC.x75 was strongly negatively correlated with SAC.d75 (R = −0.88) and strongly positively correlated with AM.d75, AM.pro and AM.visc, with correlation coefficients of R = 0.87 R = 0.98 and R = 0.96, respectively (Figure 7). There is no clear explanation for the inverse relationship between inline and offline particle sizes at this measuring location. However, the offline procedure via a sampling valve and handling until evaluation are important to mention at this point.
Sampling after a separator could have an influence on the state of the sample, which would explain the higher variability of the offline results. Possible influencing factors include storage and sampling temperatures, as well as mechanical stress from the sampling valve. The sampling valve acts in a similar way to a needle valve [28] because of the high pressures in the product pipeline during sampling. Since the sampling procedure changes the state of the sample, offline product characteristics after the separator may not represent actual product characteristics. Despite this, a number of significant correlations were found between SBC.d75 and other data, namely, with values after the mixer (AM.x75: R = 0.69; AM.d75: R = 0.40; and AM.pro: R = −0.38) and with the end product (END.d75: R = 0.60; END.pro: R = −0.85; and END.visc: R = −0.83; Figure 7). Since SAC.x75 and SAC.d75 are strongly negatively correlated (R = −0.88; Figure 7), these findings indicate that, with higher inline particle size after the separator, product after the mixer and in the final packages could be expected to have higher protein content, higher apparent viscosities and smaller particles. Further data is required to confirm this theory.

3.2.3. After Post-Processing: After Mixer (AM)

A number of downstream processing options can be carried out for fat-free fermented concentrated MPb microgel dispersions, e.g., mechanical treatments, thermal treatments and standardization by adding different components [2]. In the processing line in this study, inline and offline sampling were conducted after a mixing pump, referred to as a mixer (Figure 1). The particle size after mixing will depend on the previous treatments during upstream, fermentation, and downstream processing and mixing conditions, e.g., added/dosed ingredients and mixing rate. This would be a suitable place to measure the inline particle size to monitor the particle size of the final (near) packaged product or to derive a prediction on the product properties.
To interpret the inline measurement results after the mixer, it was ascertained that the product volume flow (pump speed) must be considered. For example, extremely large particles were evaluated during the times when the pump speed was set at zero. Since product flow is required for accurate particle sizing by way of FBRM, such data must be eliminated to avoid erroneous conclusions. A statistic referred to in the FBRM software as “fouling” indicates the similarity between two successive measurements and the degree to which the result has not changed. High values mean that: 1) material is adhering to the measurement window; and/or 2) the particles are optically the same or very similar. From observing the complete data set of inline particle size measurements, fouling values of ≤80% were determined to be acceptable for the range of flow velocities in this processing line. Values of >80% fouling were observed when the mixing pump speed was set to zero. Therefore, the large particles recorded at times of high fouling are likely to be false readings, as particles will accumulate on the measurement window when product flow is reduced. Thus, the data was processed to eliminate “artificially erroneously” detected large particles.
Figure 6 shows such pre-processed data where AM.x75 values at times with fouling ≥80% have been removed. The data points for the subsequent 1 min after fouling returned to <80% were also removed to ensure that the product was flowing at sufficiently high rates before data was included in analysis. The AM.x75 values ranged between 145 and 210 μm, though the largest particles (around Day 2, 5:00) are hypothesized to be artifacts based on the very short time over which large particles were detected (Figure 6). Omitting the particles at around 9 h, the size range for AM.x75 is reduced to 15 μm, ranging between 145 and 160 μm. The AM.d75 values ranged between 15 and 26 μm during the same time period (Figure 6). Similar to the sampling valves after the separator, high pressures in the product pipeline result in high shear as the sample is taken [28], causing a change in the state of the sample. Therefore, offline product characteristics after the mixing pump may not represent actual product characteristics. On the other hand, AM.d75 correlated positively with END.d75 (R = 0.72; Figure 7), suggesting that offline particle size after the mixing pump is able to predict final product particle size. Sampling bias might apply in the same fashion at both sampling valves. Furthermore, strong positive correlations were found between AM.pro and AM.visc (R = 0.85), AM.pro and END.pro (R = 0.92), AM.pro and END.visc (R = 0.83), AM.visc and END.visc (R = 0.83), and END.pro and END.visc (R = 0.82; Figure 7), indicating not only the expected conclusion that apparent viscosity is higher for higher protein contents, but also that the offline product characteristic of apparent viscosity after the mixer is a good indicator of the apparent viscosity in the final packaged product. Furthermore, END.d75 and END.pro were negatively correlated (R = −0.53; Figure 7), signifying that the processing and/or composition of higher protein products in this processing line is related to smaller particle sizes in the final packaged product.

3.3. Relationships with Process Conditions

3.3.1. Processing before Concentration

While the fat-free fermented milk gel is in the buffer tank, it is either not stirred, or stirred at one of two different set speeds, representing fast and slow stirring. The fresh cheese producer indicated that the stirrer is typically fixed to stir quickly when the tank is full, whereas the speed is reduced to “slow” when the tank is being emptied and, finally, stirring is stopped when the tank is almost empty, mainly to avoid bringing air into the product. This was also confirmed by a positive correlation of the buffer tank fill level and the stirring speed (R = 0.82, p ≤ 0.001).
There was a very weak negative correlation between BT.x75 and the fill level in the buffer tank (R = −0.20, p < 0.05). These changes are likely due to the mechanical energy input caused by agitation in the buffer tank [13] such that faster stirring would cause particles to break down more than slower stirring and therefore have smaller particle sizes. In the future, a larger data set should be collected where time is evaluated in relation to the fill level and material composition, e.g., fermentation tank and pH, since the mechanical stability of fat-free fermented MPb microgel particles is related to the physico-chemical composition [2]. That being said, it is hypothesized that the larger particle sizes observed after the buffer tank when the fill level is low and the stir speed is slow or zero are also a result of temperature-driven aggregation that is related to the holding time [8,29] and the omission of mechanical input to break down these aggregates. Since BT.x75 was strongly negatively correlated with AM.visc and END.visc (Section 3.2), it is theorized that the stirring intensity in the buffer tank can be used to control the final viscosity and be monitored via evaluation of BT.x75 during processing. To support this theory, a pilot-scale experiment could be carried out in which the stirring of the fat-free fermented MPb gel is varied in time and intensity.
In contrast to inline particle size after the buffer tank, AM.x75 correlated significantly with the fill level of the buffer tank (R = 0.54, p ≤ 0.001) and the stir speed of the buffer tank (R = 0.28, p ≤ 0.001). However, since we were unable to find any correlations between AM.x75 and product characteristics other than AM.d75 (negative correlation) (Section 3.2.3), links with processes cannot be defined.
Correlations were also found between the pH of the fermentation material entering the buffer tank and BT.x75 (R = 0.26, p ≤ 0.001) and SAC.x75 (R = 0.13, p ≤ 0.001). In contrast, Körzendörfer & Hinrichs [30] concluded that higher final fermentation pH (pH 4.8 or 5.0) of concentrated yoghurt gels resulted in less grainy gels compared to a lower final pH of 4.6. The differing conclusions are likely due to the different ranges of pH values, with the pH ranging from 4.39 to 4.59 in the current study. It is also noted that the current study was conducted on gels containing approximately 4.5% protein that were concentrated downstream, in contrast to the high protein (10% protein) gels without downstream concentration in the previous study [25]. These authors also found that gels fermented to a higher final pH were softer and had lower apparent viscosities than when fermented to a lower final pH of 4.6, which is the isoelectric point of caseins [7].

3.3.2. Processing during and after Concentration

The speed of the separator was negatively correlated with SAC.x75 (R = −0.88, p ≤ 0.001) but not with SBC.x75 (R = 0.07, p ≤ 0.001). Since significant positive correlations were identified between SAC.x75 and AM.visc, as well as AM.visc and END.visc (Section 3.2.2), the following links are drawn: Higher centrifugation speeds lead to smaller particle sizes that are identifiable after centrifugation and in the final product. As particles are broken down during centrifugation, serum is released, which results in lower apparent viscosities measurable in the final product. These findings are supported by the results of Korolczuk & Mahaut [31], where higher concentration factors, and thereby mechanical input, resulted in lower apparent viscosities, even after controlling for protein content.
No correlation could be identified between when material was being mixed into the processing line at the mixing pump and any product characteristic after the mixer or in the end product. This has two likely explanations. First, FBRM measurements may not be sensitive enough to quantify the differences attributed to small amount of components differing in particle size. Second, the materials may have similar particle sizes to the product particle size and therefore show no apparent difference when evaluated using this technique. Furthermore, it is likely that not one constant material is mixed in at this point. A number of different ingredients can be added to fat-free fermented concentrated MPb microgel dispersions during downstream standardization, e.g., acidified skim milk, concentrated acidified skim milk, and re-work [2].
Depending on the microgel particle characteristics of the added ingredient, there can be different outcomes. For example, different size ratios can increase or decrease the apparent viscosity of concentrated systems, based on the Farris effect [32]. The standardization step in the processing of fat-free fermented concentrated MPb microgel dispersions has the potential to be used to maximize viscosity with minimal protein content or vice versa, e.g., by selectively adjusting particle size distributions and volume ratios by mixing different product streams [33]. It is proposed that an inline particle size measurement, optionally supplemented by process elements for mixing and shearing/mechanical treatment at the end of the line, could be used for defined control of product characteristics. Further investigations should be conducted to explore this aspect. Since inline measurements allow for time-accurate monitoring, this inline measurement is the ideal addition to the data that could be collected during the processing of fresh cheese and, with the help of artificial intelligence (AI), could be used to control the process with regard to the optimal texture. This optimized processing line with inline sensors, and an integrated approach to data collection and use, would minimize quality deviations and the production of defective products, ultimately reducing food waste.

4. Conclusions

Measuring particle size inline has the advantage that changes are already visible during processing, making it possible to monitor the manufacturing process and adjust the desired product properties in situ. For the processing line in this study, measuring inline particle size directly after the buffer tank and after the mixing pump (after concentration and before filling) show potential for use as process controls.
The impact of stirring procedures in the buffer tank were observable in the inline particle size evaluated after the buffer tank. As such, inline data collected after the buffer tank could allow for adjustment of the product before it enters further processing, such as tailored stirring procedures resulting in precise control of the product characteristics when exiting the buffer tank (feed forward control). Thus, the variance of product entering the remaining downstream processing would be reduced, also minimizing the variance in the final product. Inline particle size after the mixer was related to final product particle size and viscosity. Therefore, this measurement location should be investigated further to define the potential to control final product properties by adjusting the particle size distribution directly before filling, e.g., using added material or mechanical treatment. Inline particle size measurement after the mixing pump would allow for precise control of these processes at the end of the processing line (closed loop control). Proper selection of locations in the processing line for inline measurement is required for collection of quality data; consistent product flow rate and pressure are essential.
The inline measurement proved to be a suitable tool to reveal processing-dependent differences in particle sizes, which would not have been detected using an offline measurement. To further clarify whether the FBRM technology has potential as a tool for process control, it is recommended to include an analysis of final product syneresis and sensory properties in future studies.

Author Contributions

A.H.: conceptualization, methodology, formal analysis, visualization, writing—original draft, writing—review and editing. S.N.: conceptualization, methodology, formal analysis, visualization, writing—review and editing. J.H.: conceptualization, resources, writing—review and editing, supervision, project administration, funding acquisition. All authors have read and agreed to the published version of the manuscript.

Funding

This IGF Project of the FEI was supported via AiF within the program for promoting the Industrial Collective Research (IGF) of the German Ministry of Economic Affairs and Energy (BMWi), based on a resolution of the German Parliament; Project AiF 21545 N.

Institutional Review Board Statement

Not applicable.

Informed Consent Statement

Not applicable.

Data Availability Statement

Not applicable.

Acknowledgments

The authors thank Lena Butz for performing parts of the rheological and particle size measurements, as well as Birgit Greif for conducting the protein analyses. We also thank Thomas Schubert and Darius Hummel for carrying out the inline particle size measurements and for fruitful discussions regarding the collection of data from the fresh cheese processing line.

Conflicts of Interest

This study was conducted in collaboration with a fresh cheese producer. A representative of the company has read and approved of this manuscript.

References

  1. Schulz-Collins, D.; Senge, B. Acid- and Acid/Rennet-Curd Cheeses Part A: Quark, Cream Cheese and Related Varieties. Cheese Chem. Phys. Microbiol. 2004, 2, 301–328. [Google Scholar] [CrossRef]
  2. Heck, A.; Schäfer, J.; Nöbel, S.; Hinrichs, J. Fat-Free Fermented Concentrated Milk Products as Milk Protein-Based Microgel Dispersions: Particle Characteristics as Key Drivers of Textural Properties. Compr. Rev. Food Sci. Food Saf. 2021, 20, 1–32. [Google Scholar] [CrossRef] [PubMed]
  3. Fernandez-Nieves, A.; Wyss, H.; Mattsson, J.; Weitz, D. (Eds.) Microgel Suspensions: Fundamentals and Applications; Wiley-VCH: Weiheim, Germany, 2011; ISBN 9783527321582. [Google Scholar]
  4. Loewen, A.; Nöbel, S.; Hinrichs, J. Microgel Particles and Their Effect on the Textural Properties of Foods. In Reference Module in Food Science; Elsevier: Amsterdam, The Netherlands, 2017; pp. 1–9. ISBN 978-0-08-100596-5. [Google Scholar]
  5. Lucey, J.A.; van Vliet, T.; Grolle, K.; Geurts, T.; Walstra, P. Properties of Acid Casein Gels Made by Acidification with Glucono-Delta-Lactone. 1. Rheological Properties. Int. Dairy J. 1997, 7, 381–388. [Google Scholar] [CrossRef]
  6. Lucey, J.A.; Singh, H. Formation and Physical Properties of Acid Milk Gels: A Review. Food Res. Int. 1997, 30, 529–542. [Google Scholar] [CrossRef]
  7. Lucey, J.A. Formation, Structural Properties and Rheology of Acid-Coagulated Milk Gels. In Cheese: Chemistry, Physics and Microbiology; Academic Press: Cambridge, MA, USA, 2004; Volume 1, pp. 105–122. ISBN 9780122636523. [Google Scholar]
  8. Hahn, C.; Wachter, T.; Nöbel, S.; Weiss, J.; Eibel, H.; Hinrichs, J. Graininess in Fresh Cheese as Affected by Post-Processing: Influence of Tempering and Mechanical Treatment. Int. Dairy J. 2012, 26, 73–77. [Google Scholar] [CrossRef]
  9. Hahn, C.; Sramek, M.; Nöbel, S.; Hinrichs, J. Post-Processing of Concentrated Fermented Milk: Influence of Temperature and Holding Time on the Formation of Particle Clusters. Dairy Sci. Technol. 2012, 92, 91–107. [Google Scholar] [CrossRef] [Green Version]
  10. Weidendorfer, K.; Bienias, A.; Hinrichs, J. Investigation of the Effects of Mechanical Post-Processing with a Colloid Mill on the Texture Properties of Stirred Yogurt. Int. J. Dairy Technol. 2008, 61, 379–384. [Google Scholar] [CrossRef]
  11. Cayot, P.; Schenker, F.; Houzé, G.; Sulmont-Rossé, C.; Colas, B. Creaminess in Relation to Consistency and Particle Size in Stirred Fat-Free Yogurt. Int. Dairy J. 2008, 18, 303–311. [Google Scholar] [CrossRef]
  12. Rasmussen, M.A.; Janhøj, T.; Ipsen, R. Effect of Fat, Protein and Shear on Graininess, Viscosity and Syneresis in Low-Fat Stirred Yoghurt. Milchwissenschaft 2007, 62, 54–58. [Google Scholar]
  13. Mokoonlall, A.; Nöbel, S.; Hinrichs, J. Post-Processing of Fermented Milk to Stirred Products: Reviewing the Effects on Gel Structure. Trends Food Sci. Technol. 2016, 54, 26–36. [Google Scholar] [CrossRef]
  14. Shekunov, B.Y.; Chattopadhyay, P.; Tong, H.H.Y.; Chow, A.H.L. Particle Size Analysis in Pharmaceutics: Principles, Methods and Applications. Pharm. Res. 2007, 24, 203–227. [Google Scholar] [CrossRef] [PubMed]
  15. Heck, A.; Schäfer, J.; Hitzmann, B.; Hinrichs, J. Fat-Free Fermented Concentrated Milk Protein-Based Microgel Dispersions Manufactured at Technical Scale: Production Parameters as Drivers of Textural Properties. Int. Dairy J. 2021, 127, 1–10. [Google Scholar] [CrossRef]
  16. Hahn, C.; Wachter, T.; Weiss, J.; Hinrichs, J. Application of an Inline Particle Size Device to Microgel Particles during Post-Processing of Fresh Cheese. Int. Dairy J. 2013, 29, 75–81. [Google Scholar] [CrossRef]
  17. Li, M.; Wilkinson, D.; Patchigolla, K. Comparison of Particle Size Distributions Measured Using Different Techniques. Part. Sci. Technol. 2005, 23, 265–284. [Google Scholar] [CrossRef]
  18. Bijnen, F.G.C.; Van Aalst, H.; Baillif, P.Y.; Blonk, J.C.G.; Kersten, D.; Kleinherenbrink, F.; Lenke, R.; Vander Stappen, M.L.M. In-Line Structure Measurement of Food Products. Powder Technol. 2002, 124, 188–194. [Google Scholar] [CrossRef]
  19. Heuer, M.; Schwechten, D.; Faraday, P. Advances in In-Line Particle Size Analysis in the Fines Outlet of an Air Classifier. Part. Sci. Technol. 1997, 15, 144. [Google Scholar] [CrossRef]
  20. Weidendorfer, K.; Hinrichs, J. Online Particle Size Measurement in Microgel Particle Suspensions: Principles and Data Analysis. Chem. Ing. Tech. 2010, 82, 1685–1691. [Google Scholar] [CrossRef]
  21. Weidendorfer, K.; Hinrichs, J. On-Line Microgel Particle Size Measurement in Stirred Skim Milk Yoghurt. Milchwissenschaft 2011, 66, 152–155. [Google Scholar]
  22. Heck, A.; Nöbel, S.; Hitzmann, B.; Hinrichs, J. Volume Fraction Measurement of Soft (Dairy) Microgels by Standard Addition and Static Light Scattering. Food Biophys. 2021, 16, 237–253. [Google Scholar] [CrossRef]
  23. Fysun, O.; Nöbel, S.; Loewen, A.; Hinrichs, J. Tailoring Yield Stress and Viscosity of Concentrated Microgel Suspensions by Means of Adding Immiscible Liquids. LWT-Food Sci. Technol. 2018, 93, 51–57. [Google Scholar] [CrossRef]
  24. Krzeminski, A.; Tomaschunas, M.; Köhn, E.; Busch-Stockfisch, M.; Weiss, J.; Hinrichs, J. Relating Creamy Perception of Whey Protein Enriched Yogurt Systems to Instrumental Data by Means of Multivariate Data Analysis. J. Food Sci. 2013, 78, S314–S319. [Google Scholar] [CrossRef] [PubMed]
  25. Körzendörfer, A.; Temme, P.; Nöbel, S.; Schlücker, E.; Hinrichs, J. Vibration-Induced Particle Formation during Yogurt Fermentation-Industrial Vibration Measurements and Development of an Experimental Setup. Food Res. Int. 2016, 85, 44–50. [Google Scholar] [CrossRef] [PubMed]
  26. Hahn, C.; Sramek, M.; Nöbel, S.; Hinrichs, J. Reduction of the particle size in fresh cheese by mechanical post-processing. Dtsch. Molk. Ztg. 2010, 131, 16–18. [Google Scholar]
  27. Heck, A.; Nöbel, S.; Hitzmann, B.; Hinrichs, J. Tailoring the Textural Characteristics of Fat-Free Fermented Concentrated Milk-Protein Based Microgel Dispersions by Way of Upstream, Downstream and Post-Production Thermal Inputs. Foods 2022, 11, 635. [Google Scholar] [CrossRef] [PubMed]
  28. Weidendorfer, K. Die Gelpartikelsuspension Rührjoghurt: Mechanisch-Dynamische Eigenschaften, Inline-Partikelgrößenmessung Und Apparate Zum Glätten Der Textur. Ph.D. Thesis, Universität Hohenheim, Stuttgart, Germany, 2008. [Google Scholar]
  29. Hahn, C.; Müller, E.; Wille, S.; Weiss, J.; Atamer, Z.; Hinrichs, J. Control of Microgel Particle Growth in Fresh Cheese (Concentrated Fermented Milk) with an Exopolysaccharide-Producing Starter Culture. Int. Dairy J. 2014, 36, 46–54. [Google Scholar] [CrossRef]
  30. Körzendörfer, A.; Hinrichs, J. Manufacture of High-Protein Yogurt without Generating Acid Whey–Impact of the Final PH and the Application of Power Ultrasound on Texture Properties. Int. Dairy J. 2019, 99, 1–10. [Google Scholar] [CrossRef]
  31. Korolczuk, J.; Mahaut, M. Rheological Properties of UF-Fresh Cheeses. Inorg. Membr. ICIM2-91 1991, 61–62, 491–494. [Google Scholar] [CrossRef]
  32. Farris, R.J. Prediction of the Viscosity of Multimodal Suspensions from Unimodal Viscosity Data. J. Rheol. 1968, 12, 281. [Google Scholar] [CrossRef]
  33. Hahn, C.; Nöbel, S.; Maisch, R.; Rösingh, W.; Weiss, J.; Hinrichs, J. Adjusting Rheological Properties of Concentrated Microgel Suspensions by Particle Size Distribution. Food Hydrocoll. 2015, 49, 183–191. [Google Scholar] [CrossRef]
Figure 1. Simplified process flow diagram and common parameters according to Heck (2021) [2] for processing of a fat-free fermented concentrated MPb microgel dispersion. Bold: combined inline particle size analysis (FBRM) and sampling points for fresh cheese for offline analysis; italics: processing conditions further discussed in this study.
Dairy 04 00013 g001
Figure 2. Mobile measurement setup for (a) the ParticleTrack G600B FBRM measuring device and a cable length/distance from the control box of ≤15 m; (b) an Ingold weld-in spigot with a mounting angle of 15° (relative to the pipe); and (c) an adapter set consisting of an Ingold insert (DN 25) made up of a spacer with screw fitting and seals.
Dairy 04 00013 g002
Figure 3. Inline volume-weighted percentiles .x75 of the chord length distribution (blue line) evaluated after the buffer tank and offline percentiles of the cubic-weighted .d75 particle size distribution (blue circles), protein content .pro (squares), and apparent viscosity η 100   s 1 .visc (triangles) at different points during processing (BT: after buffer tank; SBC: after separator/before cooler; SAC: after separator/after cooler; AM: after mixer; END: end product) of a fat-free fermented concentrated MPb microgel dispersion. Inline measured values are presented as a moving average with a 30-value window, where one value is recorded every 10 s. Offline measurements taken within a 10 min window at the sampling valves or analysis of filled packages (i ≥ 2; n ≥ 1).
Dairy 04 00013 g003
Figure 4. Inline volume-weighted percentiles .x75 of the chord length distribution (blue line) evaluated after the separator/before the cooler and offline percentiles of the cubic-weighted .d75 particle size distribution (blue circles), protein content .pro (squares), and apparent viscosity η 100   s 1 .visc (triangles) at different points during processing (BT: after buffer tank; SBC: after separator/before cooler; SAC: after separator/after cooler; AM: after mixer; END: end product) of a fat-free fermented concentrated MPb microgel dispersion. Inline measured values are presented as a moving average with a 30-value window, where one value is recorded every 10 s. Offline measurements taken within a 10 min window at the sampling valves or analysis of filled packages (i ≥ 2; n ≥ 1).
Dairy 04 00013 g004
Figure 5. Inline volume-weighted percentiles .x75 of the chord length distribution (blue line) evaluated after the separator/after the cooler and offline percentiles of the cubic-weighted .d75 particle size distribution (blue circles), protein content .pro (squares), and apparent viscosity η 100   s 1 .visc (triangles) at different points during processing (BT: after buffer tank; SBC: after separator/before cooler; SAC: after separator/after cooler; AM: after mixer; END: end product) of a fat-free fermented concentrated MPb microgel dispersion. Inline measured values are presented as a moving average with a 30-value window, where one value is recorded every 10 s. Offline measurements taken within a 10 min window at the sampling valves or analysis of filled packages (i ≥ 2; n ≥ 1).
Dairy 04 00013 g005
Figure 6. Inline volume-weighted percentiles .x75 of the chord length distribution (blue line) evaluated after the mixer and offline percentiles of the cubic-weighted .d75 particle size distribution (blue circles), protein content .pro (squares), and apparent viscosity η 100   s 1 .visc (triangles) at different points during processing (BT: after buffer tank; SBC: after separator/before cooler; SAC: after separator/after cooler; AM: after mixer; END: end product) of a fat-free fermented concentrated MPb microgel dispersion. Inline measured values are presented as a moving average with a 30-value window, where one value is recorded every 10 s. Offline measurements taken within a 10 min window at the sampling valves or analysis of filled packages (i ≥ 2; n ≥ 1).
Dairy 04 00013 g006
Figure 7. Correlation matrix of all measurement locations (BT, SBC, SAC, END) and variables’ inline particle size (.x75), offline particle size (.d75), viscosity (.visc), and protein content (.pro); right-hand side: circle plot of correlations after striking insignificant values (n.s.; p > 0.05), area of circles corresponds to the value of the coefficient with either negative (red) or positive impact (blue); left-hand side: complete set of Pearson coefficients of correlation determined by pairwise linear regression; dash: no correlation and significance calculated from less than four complete data pairs; bold face: correlations with inline measured volume-weighted percentiles (.x75) of the chord length distribution.
Dairy 04 00013 g007
Disclaimer/Publisher’s Note: The statements, opinions and data contained in all publications are solely those of the individual author(s) and contributor(s) and not of MDPI and/or the editor(s). MDPI and/or the editor(s) disclaim responsibility for any injury to people or property resulting from any ideas, methods, instructions or products referred to in the content.

