Article

Assessing Compositional and Quality Parameters of Unconcentrated and Refractive Window Concentrated Milk Based on Color Components

by
Asaad R. Al-Hilphy
1,
Haider I. Ali
1,
Sajedah A. Al-IEssa
1,
Mohsen Gavahian
2,* and
Amin Mousavi-Khaneghah
3,*
1
Department of Food Science, College of Agriculture, University of Basrah, Basrah 61001, Iraq
2
Department of Food Science, National Pingtung University of Science and Technology, 1, Shuefu Road, Neipu, Pingtung 91201, Taiwan
3
Department of Food Science and Nutrition, Faculty of Food Engineering, University of Campinas (UNICAMP), Rua Monteiro Lobato, 80, Caixa Postal: 6121, Campinas 13083-862, São Paulo, Brazil
*
Authors to whom correspondence should be addressed.
Dairy 2022, 3(2), 400-412; https://doi.org/10.3390/dairy3020030
Submission received: 30 April 2022 / Revised: 26 May 2022 / Accepted: 2 June 2022 / Published: 8 June 2022

Abstract

:
In this study, a multiple linear regression equation was developed to measure and predict quality parameters of unconcentrated and concentrated milk based on color components. The viscosity, density, pH, moisture, and fat content could be measured using image processing technology. The multiple linear regression model had a good fitting on experimental data considering the limited errors (0.00–1.12%), standard deviation (0.000–0.043), and root mean square error (0.0007–0.3721). Therefore, these models can be used to predict the quality parameters of milk, including fat percentage, pH, viscosity, density, and moisture content, based on color components of unconcentrated and concentrated milk. The maximum and minimum of color change were 12.28 and 5.96, respectively. The values of browning index were also well-predicted and were within the standard limits. The non-destructive and quick procedure that proposed in this study showed a percentage of accuracy in assessing and predicting the quality parameters milk based on color components. Overall, the color correlates with different compositional and physical characteristics, and provide a possible internet of things (IoT)-based approach to accompany the conventional approaches in the future after further evaluation at large scale for various types of milks subjected to various processes.

1. Introduction

Color is the important qualitative characteristic of food evaluation by consumers, so it is a significant parameter that reflects the food quality related to product acceptability in the market [1]. As far as food industry is concerned, implementation of color measurement systems are considered vital in accessing product acceptability and quality [2]. L* (lightness), a* (redness-greenness), and b* (yellowish-blueish) parameters are greatly used for color assessment and have been suggested by the International Commission on Illumination (CIE). In addition, researchers are interested in using a computer vision system for measuring color parameters nowadays [3]. De-Marchi et al. [4] used mild infrared to predict the milk fat, protein, casein, and lactose concentration. In part I of our previous study, we designed new RW (refractance window) milk concentrator, optimized processing variables, and assessed their effect on physicochemical properties of product [5]. RW is a novel technology to remove moisture from liquid and semi liquids foods [6]. For advantages about RW concentration, especially in dairy technology, RW drying of yogurt was reduced count of Bactria at temperature of 50 °C higher than 60 and 70 °C, and increased shelf life of yogurt [7]. RW technique needs very short time due to effective heat transfer by conduction and radiation, and little effect on the color and nutritive values for food processed using RW [8]. RW concentrating milk reduced energy consumption, count of bacteria, improved color of concentrated milk compared to conventional concentration, and produced concentrated milk with high quality [2,5]. Moreover, in part II, the productivity, thermo-physical properties, microbiological tests, color assessment, peroxide value, and sensory assessment were performed [2]. At the same time, the dairy industry demands reliable non-destructive, and quick approaches to assess and predict quality parameters of unconcentrated and concentrated milk. There are no published papers on using color components to predict unconcentrated and concentrated milk quality characteristics to the best of the author’s knowledge. Therefore, the current study uses the previously designed RW apparatus to evaluate and predict the milk quality parameters (fat, pH, viscosity, density, and moisture content) based on color parameters and mathematical models.

2. Materials and Methods

2.1. Materials

Twenty-one liters of full-fat cow milk was used and taken from the Agricultural Research Station of the College of Agriculture, University of Basrah. Skim milk powder was also used as France-made Régilait mark from the Régilait Company (Saint-Martin-Belle-Roche, France) to standardize the ratio of solids not fat (SNF). A cream (Kalleh Dairy, Tehran, Iran) containing 30% fat was utilized to adjust the processed milk fat. Then, 7 samples at deferent days (7 days) were used, and each sample was replicated 3 times.

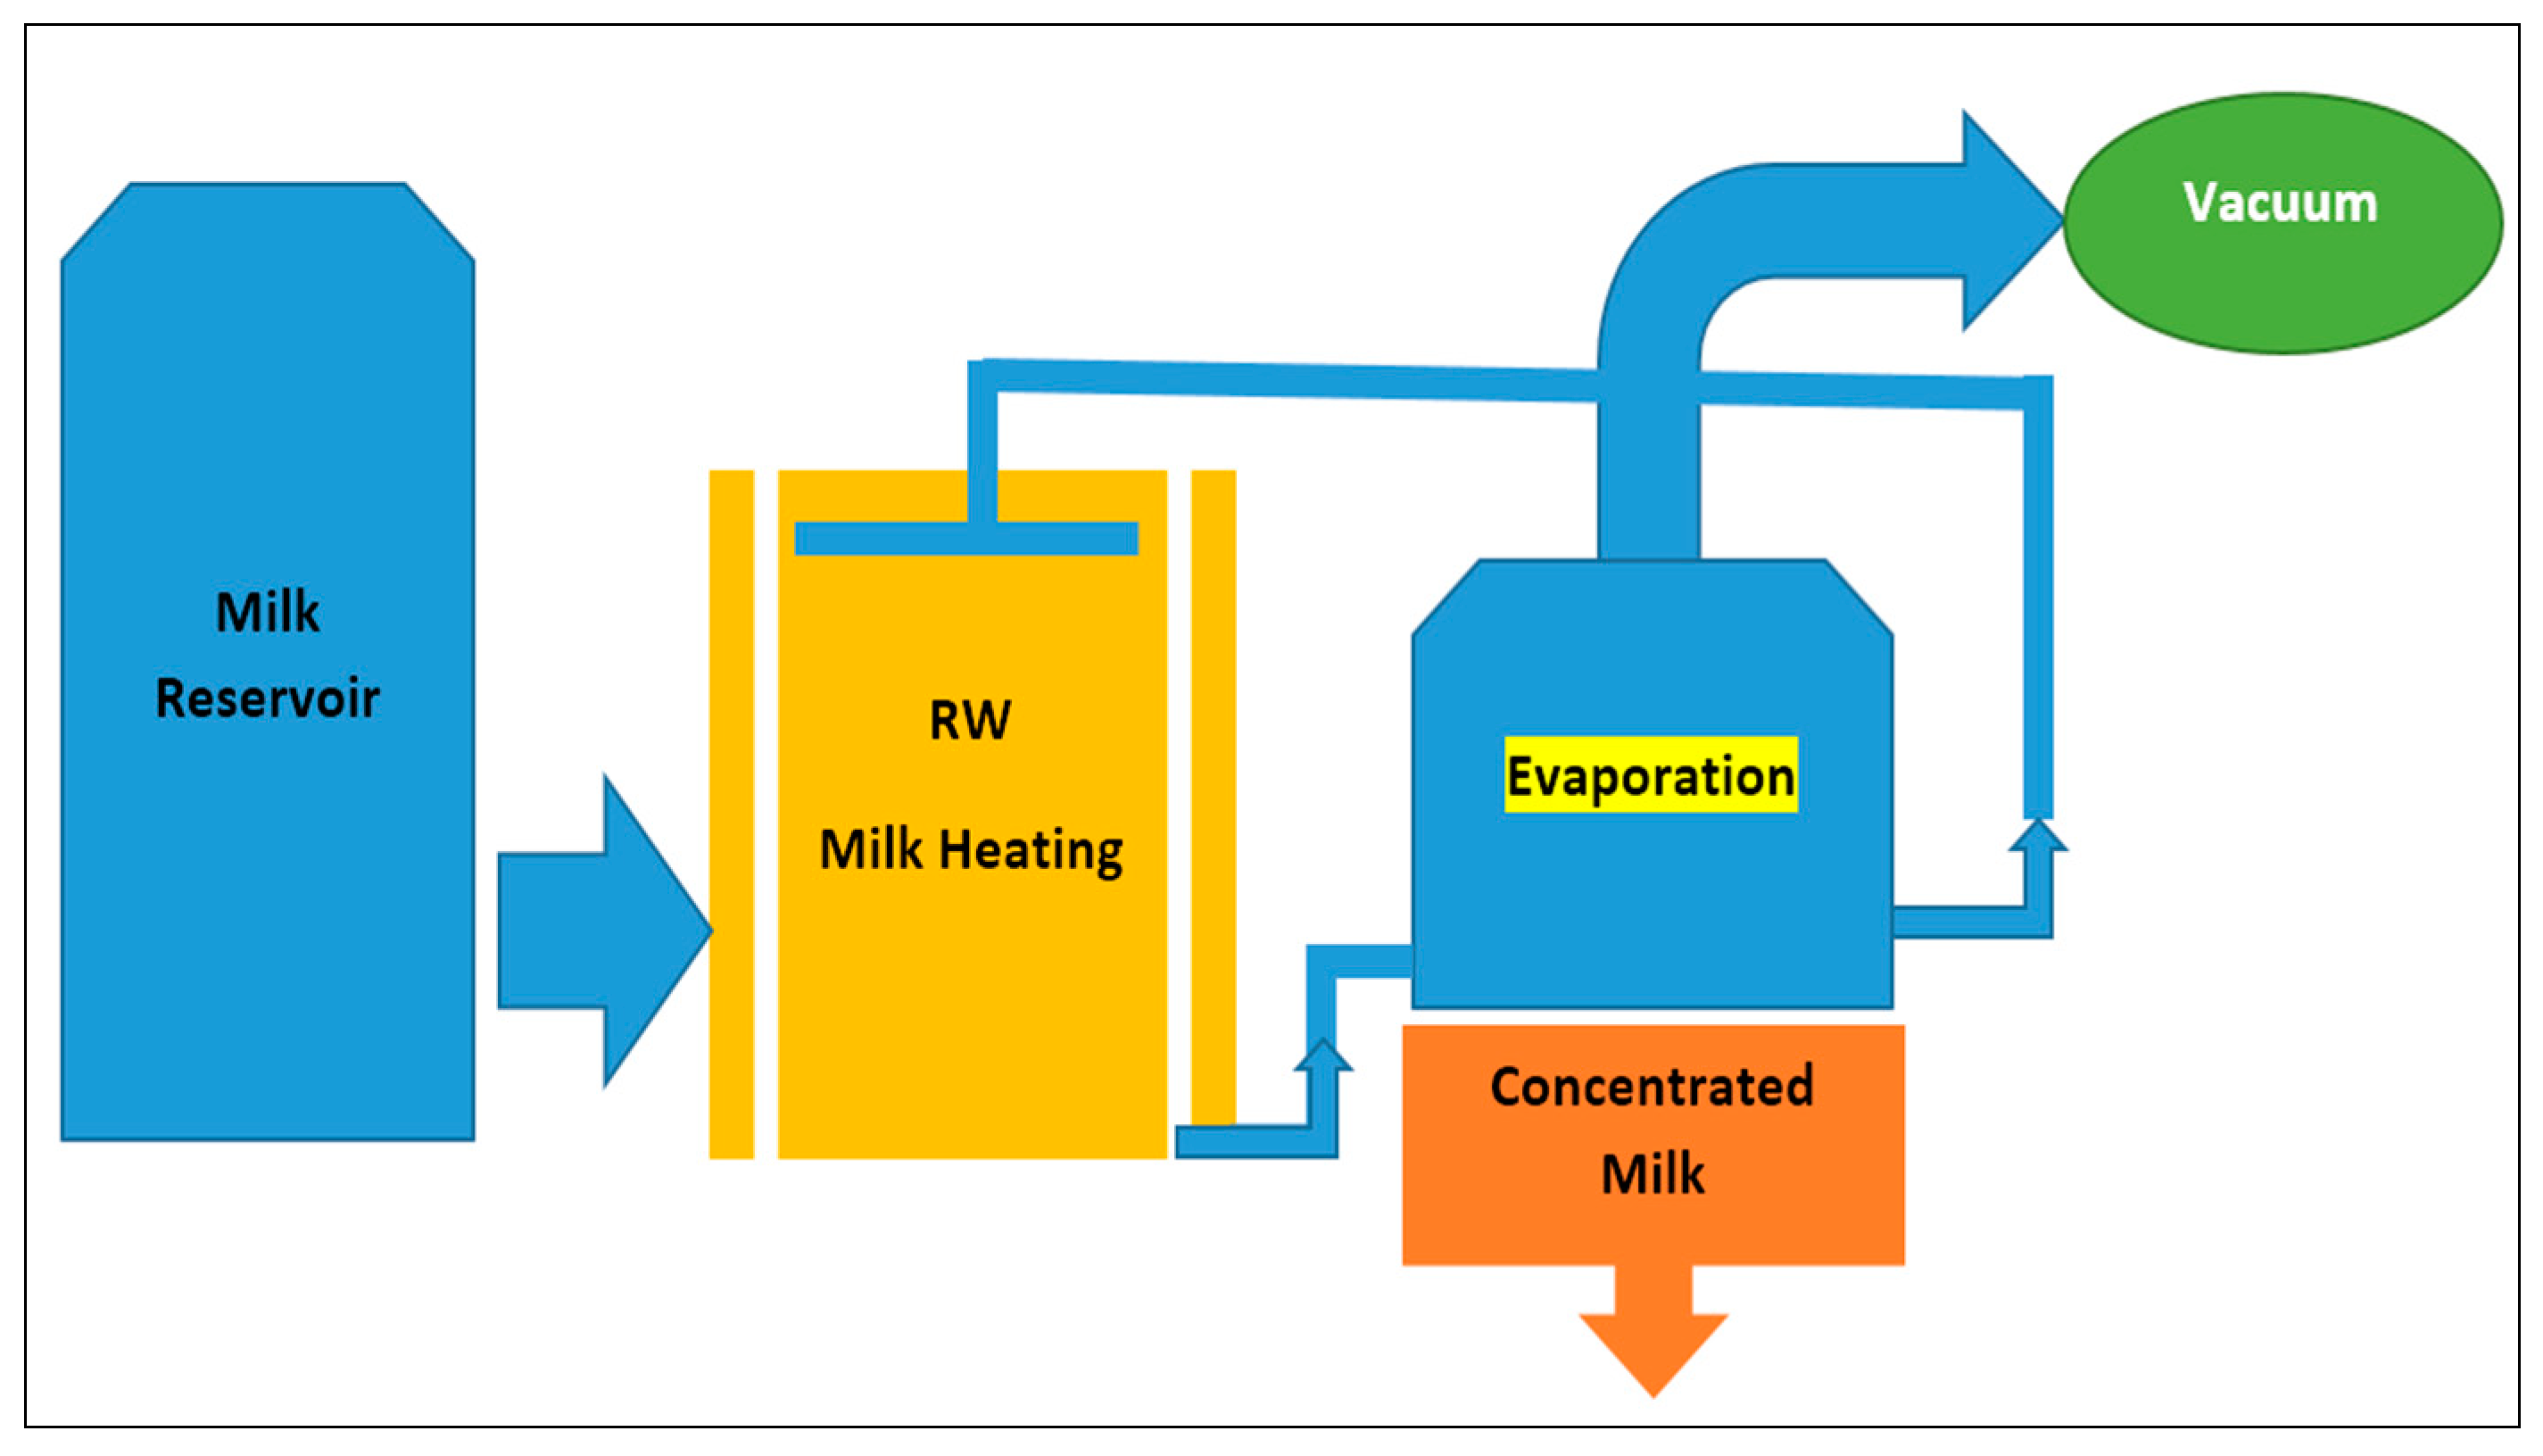
2.2. The Concentration of Milk Using the Refractance Window

The refractance window milk concentrator for concentration of milk was developed as described by Al-Hilphy et al. [5]. It constitutes a Pyrex glass cylinder, hot water tank, and control panel (Figure 1). The concentration was performed at 0.45 bar pressure and 70 °C temperature until it reached the desired concentration (26%).

2.3. Chemical Analysis

Fat, protein, ash, moisture, and pH of unconcentrated and concentrated milk were determined according to AOAC [9].

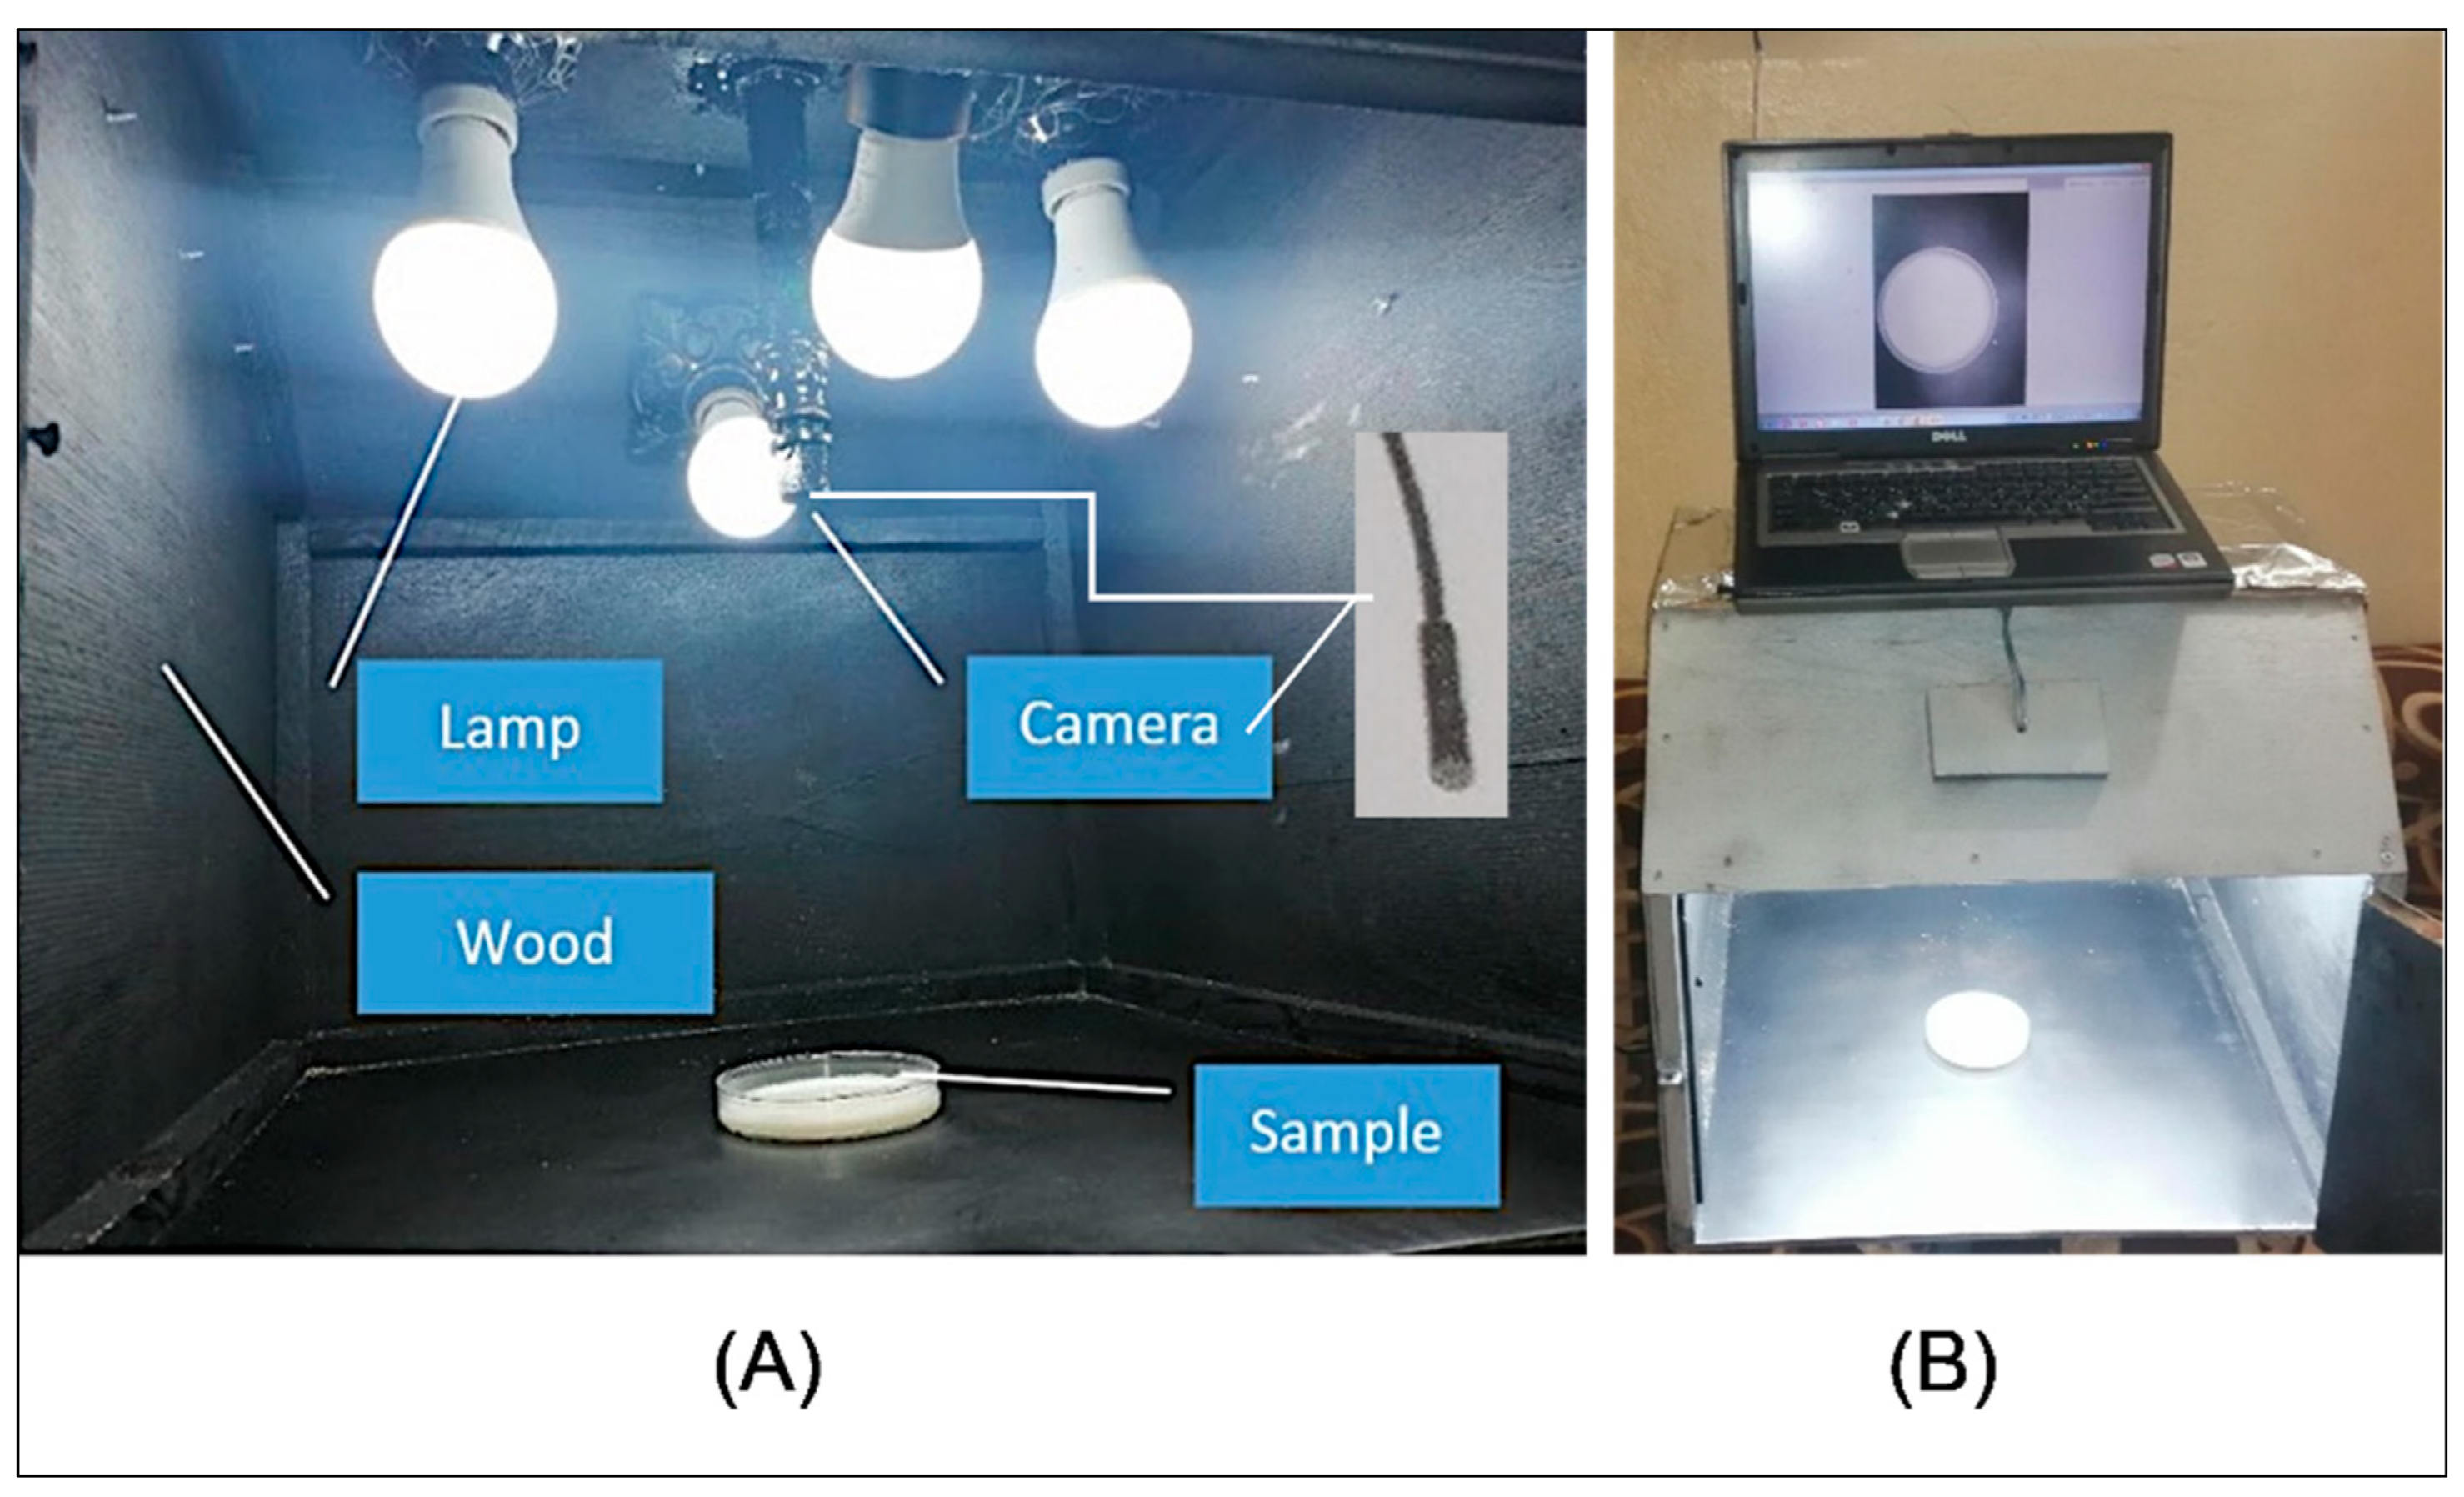
2.4. Color Assessment

The computer vision system developed by Al-Hilphy et al. [2] was utilized in the present study, which consists of a computer, HD camera, and 4 LED light lamps (Figure 2). The Image J software version 1.52 (Wayne Rasband, national institute health, USA) was used to find the color components (L, a, and b values) of unconcentrated and concentrated milk from digital images. These values were then corrected to L*, a*, and b* value are given in Equations (1)–(3) [10,11]:
L * = 100 255 × L
a * = 240 a 255 120
b * = 240 b 255 120
where L * is lightness, a * is reddish/greenish, and b * is yellowish/bluish.
Chroma represents saturation or vividness of color and it given in Equation (4) as fellows [12]:
C = a * 2 + b * 2  
Hue angle refers to degree of the dominant spectral components such as red, green, and blue. The h ranging between 0–360°. When h equal 0° or 360°, the color is red hue, and it is yellow, green, and blue hue when h equal 90°, 180°, and 290°, respectively. h is given in Equation (5) [9]:
h = tan 1 ( a * b * )
Whiteness index is the degree of whiteness and mathematically combines lightness and yellow-blue. WI is calculated from Equation (6) [13]:
WI = 100 ( 100 L * ) 2 + a * 2 + b * 2
Yellow index is a color measurement related to browning index as follows:
YI = 142.86 ( b * L * )
Browning index is a brown color purity, and it refers to browning food containing sugar, and it is calculated from Equation (8) [14]:
BI = [ 100 ( X 0.31 ) ] 0.172
X = ( a * + 1.75 L * ) ( 5.645 L * + a * 3.012 b * )  
where X is the constant used in Equation (8).
Color change is calculated according to Equation (10) [15]:
E = ( L o * L * ) 2 + ( a o * a * ) 2 + ( b o * b * ) 2
where C is the chroma, h is the hue angle (degree), WI is the whiteness index, YI is the yellowness index, BI is the browning index, and o is refer to fresh milk.

2.5. Viscosity and Density Determination

Size A of Ostwald glass viscometer type PSL-Rheotek (USA) was utilized to measure milk viscosity at a temperature of 25 °C by following the protocols of AOAC [9]. A 25 mL pycnometer assessed the density of milk samples according to AOAC [9].

2.6. Mathematical Modeling

A multiple linear regression equation (Equation (4)) was used to predict the physicochemical properties of unconcentrated and concentrated milk based on the color components (L*, a*, and b*). Solver program in excel 2013 was used to predict the physicochemical properties of unconcentrated and concentrated milk according to several statistical indicators such as the minimum mean square root equation (RMSE) and correlation coefficient (R), which are clarified in Equations (11) and (12):
Y   ( % ) = γ + γ 1 L * + γ 2 a * + γ 3 b *
where γ, γ 1 ,  γ 2 , and γ 3 are constants, Y is the physicochemical property of Unconcentrated and concentrated milk, L* is luminosity, a* is reddish/greenish, and b* is yellowish/bluish.
RMSE = [ i = 1 N ( x Exp . x Pre . ) 2 N ]
R = [ i = 1 n ( x pre . x Pre . ¯ ) 2 i = 1 n ( x exp . x exp . ¯ ) 2 ]
where x exp . is the experimental data, and x pre . is the predicted data.
Percentage of error was calculated according to Equation (14) [16]:
Error   ( % ) = A exp . A pre . A exp . × 100
where A exp . is the experimental data, and A pre . is the predicted data.

2.7. Statistical Analysis

t-test was used to compare the predicted and experimental data at the level of 0.05 using SPSS ver.26. Moreover, standard deviation and error percentages were used to evaluate the mathematical models compared to experimental data.

3. Results and Discussion

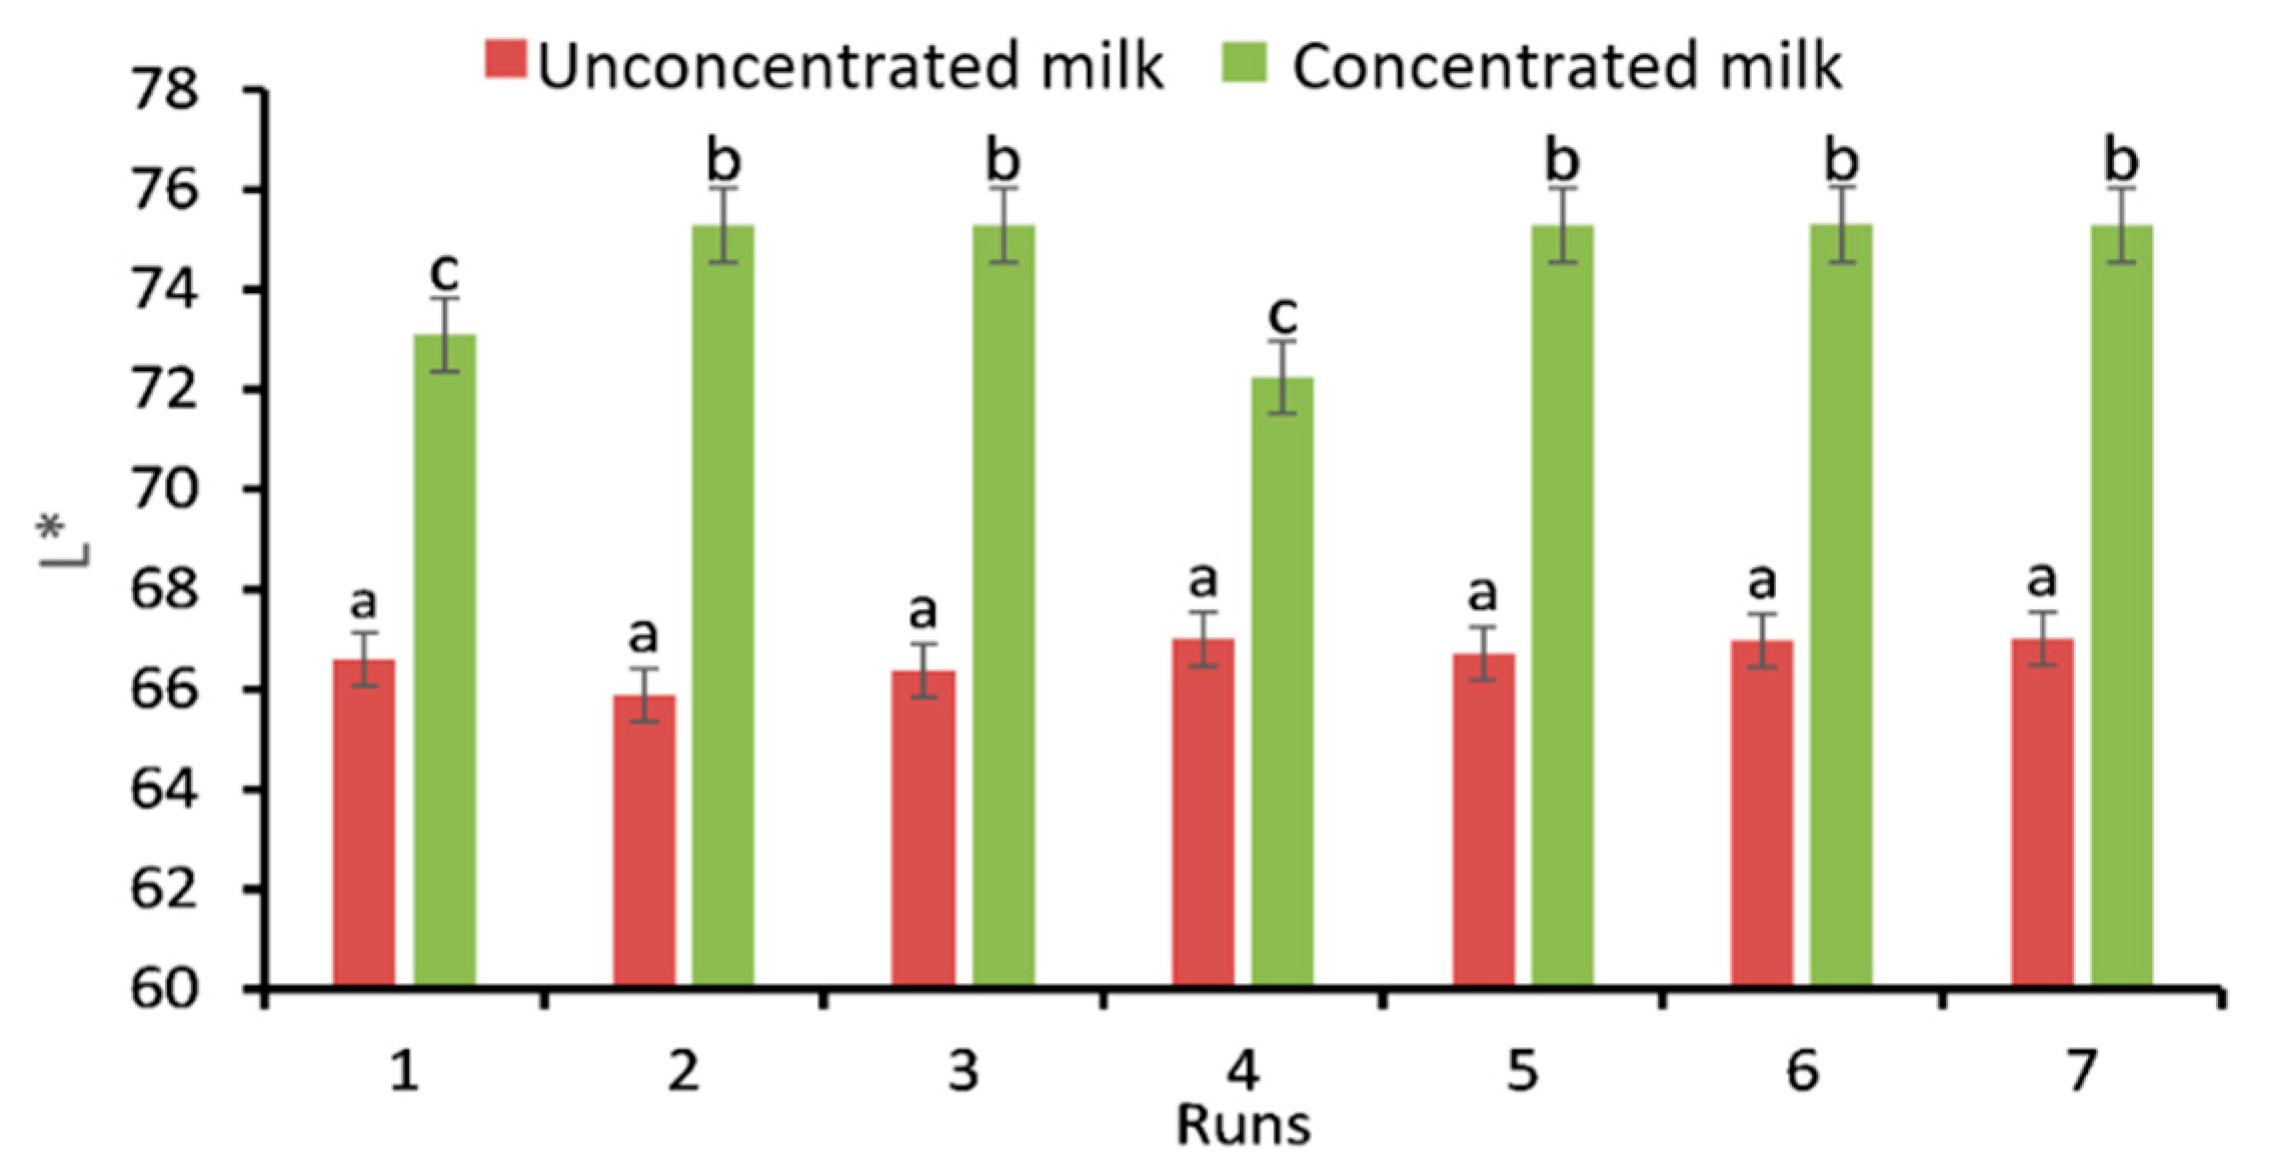
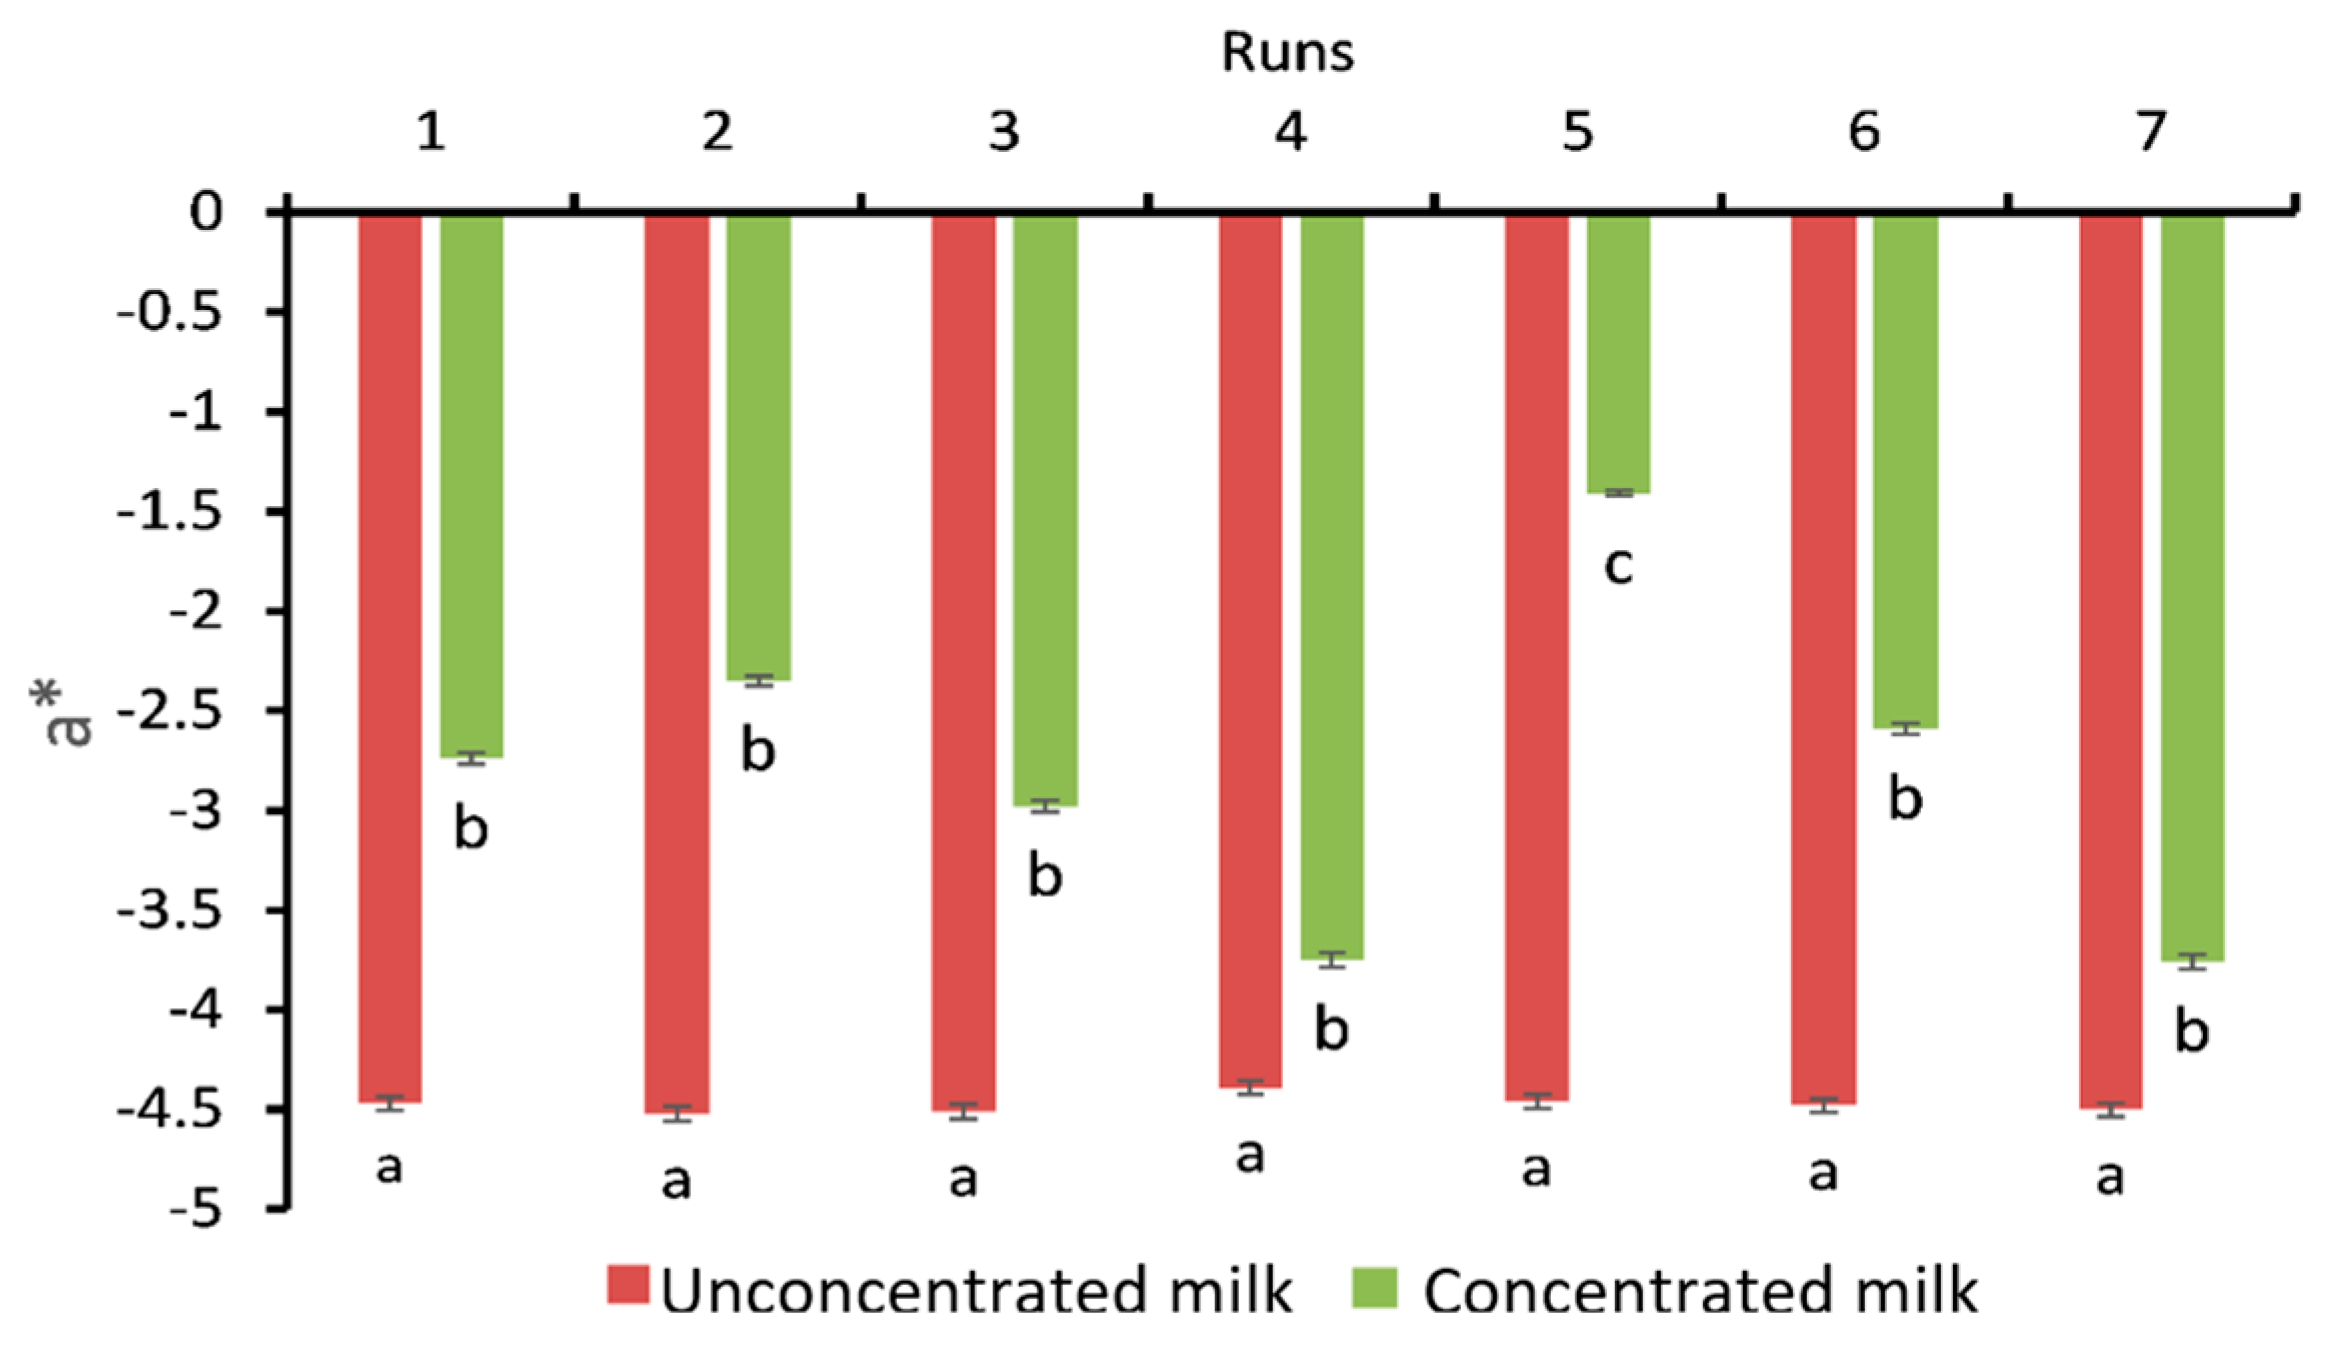
3.1. Color Components

Figure 3 shows the L* value for unconcentrated and concentrated milk. The results depicted that the L* value of unconcentrated milk significantly (p < 0.05) lesser than the concentrated milk i.e., L* of unconcentrated and concentrated milk was ranged between 65.89–67.02, and 73.1–75.3, respectively. This is because adding cream and skimmed milk powder increased the white color, and therefore increased in L* value was noticed, also due to the occurrence of certain transformations, e.g., non-enzymatic browning reactions (Maillard reactions), oxidation. Cheng et al. [17] reported that the L* value of milk (2% fat) was 70. AL-Hilphy et al. [2] declared that the L* value of raw and concentrated milk reached 90.98 and 74.88, respectively. Patange et al. [18] found that the L* value of cow and buffalo milk ranged between 43.99 and 49.50 and 60.50 and 68.77, respectively.
The results in Figure 4 depicted that the differences between unconcentrated and concentrated milk were significant (p < 0.05). a* value for unconcentrated milk was lower than the concentrated milk, i.e., a* for unconcentrated and concentrated milk was ranged between −4.52 to −4.39 and −3.76 to −1.41, respectively. The increasing a* value for concentrated milk compared to unconcentrated milk because it is color whiter (higher L*) due to add cream and skim milk during standardization. Scarso et al. [19] depicted that a* value of milk was −3.88. Ávila et al. [20] declared that a* value of milk reached −1.85. Patange et al. [18] found that the a* value of cow and buffalo milk ranged between 2.57 and 2.82 and 1.73 and 2.88, respectively.
The results clarified that the b* value of unconcentrated milk higher than the concentrated milk (Figure 5). i.e., the maximum b* value of unconcentrated and concentrated milk reached 15.52 and 9.93, respectively. This is because of unconcentrated milk fat pigment, but it diluted (reduced yellowish color) due to the standardization of concentrated milk and heat treatment. In this study, the b* value was closed to the results of Misawa et al. [21], who stated that the b* value of milk (2% fat) was 4.55. The b* value of cow and buffalo milk ranged between 16.49 and 18.59 and 6.52 and 8.82, respectively [18]. As for color change (∆E), the results in Figure 6 showed that the maximum and minimum of ∆E were 12.28 and 5.96, respectively. This change in the ∆E value may be attributed to the heat treatment for concentrated milk compared to unconcentrated milk. Wu et al. [22] find out that ∆E of concentrated milk ranged between 4.2 and 5.0. The researchers attributed that to Maillard reactions. For Chroma (Table 1), the differences between unconcentrated and concentrated milk were significant (p < 0.05). Chroma for unconcentrated milk was ranged from 15.19–16.15., while it ranged from 7.20–20.12, respectively for concentrated milk. Parmar et al. [23] stated that the chroma of concentrated milk reached 9. Hue angle ranged between −17.29 to 15.84 for unconcentrated milk, and ranged between −19.56 to −7.83 for concentrated milk. The whiteness index for concentrated milk was significantly (p < 0.05) higher than the unconcentrated milk because the effect of standardization. The maximum whiteness index for unconcentrated and concentrated milk were 63.30 and 74.26, respectively. Fematt-Flores et al. [24] clarified that the whiteness index of milk protein (casine) reached 95.04. The differences among unconcentrated and concentrated milk was significant (p < 0.05), and the maximum values were 33.54 and 20.77, respectively. Browning index was ranged between 18.79–20.77 and 8.22–28.11 for unconcentrated milk and concentrated milk, respectively. The values of browning index are within the natural limits. In general, the results presented in Table 1 do not indicate a clear tendency of changes of properties in the results of the refractive windows process. This is may be attributed to adding milk powder and cream during standardizing to concentrated milk. Moreover, this could be due to taking samples on different days.

3.1.1. Fat

Table 2 illustrated the effect of color parameters on the experimental and predicted unconcentrated and concentrated milk fat. A multiple linear regression equation (MLRE) was used to predict fat, as shown in Equations (15) and (16):
F fresh   milk ( % ) = 3.7554 + 0.004732573 L * 5.25 E 03 a * + 0.4856 b *
F conc .   milk   ( % ) = 6.6344 + 0.0088 L * 0.0132 a * + 0.6745 b *
The statistical parameters for fitting MLRE on the experimental data were RMSE = 0.0041, R = 0.896, and the error (%) and SD were ranged between 0.00–0.14% and 0.00–0.0048, respectively, for unconcentrated milk, and were RMSE = 0.0064, R = 0.850, and the error was ranged between 8.401 × 10⁻⁵–0.966% for concentrated milk. These parameters indicated that the MLRE could be used to predict the fat content. Moreover, the differences between experimental and predicted were not significant (p < 0.05). In addition, the results clarified that the range of fat content in unconcentrated and concentrated milk between 4.091–4.12% and 7.317–7.489%, respectively. The obtained data are closed to the results of Al-Hilphy et al. [25] as they revealed that the fat (%) in raw milk was 3.7%. In addition, Guetouache et al. [26] reported that cow’s milk contained 3.5% fat. The results of concentrated milk in this study were in harmony with outcomes of Sharma et al. [27], who declared that the fat in concentrated milk was 7.5%.

3.1.2. pH

Experimental and predicted unconcentrated and concentrated milk pH values were affected by color components, as illustrated in Table 3. MLRE was used to predict unconcentrated and concentrated milk pH because the statistical parameters such as RMSE, R, error (%), and SD were very small and reached 0.0082, 0.865, 0.001–0.29%, and 0.00006–0.135, respectively. This is indicated that the MLRE can be used for predicting pH milk as given in Equations (17) and (18):
pH fresh   milk = 1.1384 + 0.0609 L * 0.2946 a * + 0.1474 b *
pH conc .   milk = 6.569 + 9.65 E 07 L * 1 E 06 a * + 0.6507 b *
The results depicted that the differences between experimental and predicted pH were non-significant (p < 0.05). The highest and lowest experimental pH values were 6.480 and 6.53, respectively. The present study results agreed with Al-Hilphy et al. [28], who stated that the pH of raw milk was 6.8. The pH of concentrated milk ranged between 6.40–6.6. This is more than that found by Park and Drake [29], who mentioned that pH in concentrated milk was 6.25 at 63 °C.

3.1.3. Density

It can be seen from Table 4 that experimental and predicted unconcentrated concentrated milk density values were affected by color components. From the mathematical modeling, the MLRE gave the best fitting for the experimental data according to the statistical parameters, for example, RMSE = 0.00102, R = 0.851, and the error (%) and SD were ranged between 0.022–0.85%, and 0.00016–0.0064, respectively for unconcentrated milk, and were RMSE = 0.001585, R = 0.947, and the error was ranged between 0.040–0.51% for concentrated milk. Equations (19) and (20) indicated the effect of color components on the unconcentrated and concentrated milk density. The results pointed out that the differences between experimental and predicted density were not significant (p < 0.05).
ρ fresh   milk = 0.9674 + 6.25 × 10 5 L * 0.01325 a * 0.000294 b *
ρ conc .   milk   ( % ) = 0.5069 + 0.0068 L * 0.0093 a * + 0.0516 b *
The highest and lowest unconcentrated and concentrated milk density was 1.027 and 1.025 g/cm3, was 1.027 and 1.025 g/cm3, respectively. These results agreed with Al-Hilphy et al. [5], who stated that the density of milk ranged between 1025.02–1031.12 kg/m3. Minim et al. [30] found that the density of whole and concentrated milk varied from 1011.8 to 1049.5 and 1000 to 1034 kg/m3, respectively.

3.1.4. Viscosity

Table 5 illustrates the experimental and predicted unconcentrated milk viscosity values affected by color components. The results showed that the maximum and minimum experimental and predicted unconcentrated and concentrated milk viscosity values were 2.08 and 2.07 cp and 3.28 and 3.23 cp, respectively. These results are close to Nieuwenhuijse et al. [31], who disclosed that the viscosity at 30 °C temperature for different types of milk ranged from 3.33–7.70 cp. Moreover, the results agreed with Al-Hilphy et al. [5], who stated that the viscosity of unconcentrated milk was 0.00186 pa s (1.86 cp). Equations (21) and (22) were obtained from mathematical modeling and can predict viscosity because the statistical evidence was RMSE = 0.0035, R = 0.883, and the error (%) and SD ranged between 0.01–0. 36% and 0.001–0.0053, respectively, for unconcentrated milk, and were RMSE = 0.00070, R = 0.888, and the error and SD were ranged between 0.002–0.63%, and 0.00005–0.0145% for concentrated milk.
v fresh   milk = 0.8542 + 1.37 × 10 2 L * 0.0681 a * + 0.1107 b *
v   conc .   milk = 1.034 + 5.29 × 10 6 L * 3.68 × 10 3 a * + 0.104 b *

3.1.5. Moisture Content

The moisture content of the experimental and predicted unconcentrated and concentrated milk varied from 85.60–86.81%, as illustrated in Table 6. The results in this study (experiment and predicted) were close to that reported by Al-Hilphy et al. [28], who revealed that the percentage of moisture content in raw milk was 83.53%. Keršienė et al. [32] estimated the percentage of moisture in cow’s milk in Lithuania to be 86.9%; Pinto et al. [33] found that the percentage of moisture was 87.1% in German cow milk. MLRE has been utilized to predict moisture content as given in Equations (23) and (24) as follows:
MC fresh   milk   ( % ) = 31.2141 + 0.82806671 L * 1.54 × 10 10 a * + 4.050 b *
MC conc .   milk   ( % ) = 0.664 + 0.96 L * 0.98 a * + 0.194 b *
The statistical parameters for fitting MLRE on the experimental data were RMSE = 0.1853, R = 0.866, and the error (%) and SD were ranged between 0.00–0.37% and 0.00–0.2255, respectively, for unconcentrated milk, and were RMSE = 0.3721, R = 0.900, and the error and SD were ranged between 0.00–0.004% for concentrated milk. These parameters indicated that the MLRE could be used to predict the moisture content. Moreover, the differences between experimental and predicted were non-significant (p < 0.05).

4. Conclusions

Herein, for the first time, a multiple linear regression model was utilized to predict unconcentrated and concentrated milk fat percentage, pH, viscosity, density, and moisture content depending on the color components (L*, a*, and b*). Hence, combining a mathematical approach and a computer vision system possesses a good potential for online product quality control. Browning index, and moisture content for concentrated milk by RW were lower than the unconcentrated milk. In contrast, fat percentage, pH, viscosity, and density for concentrated milk were higher than the unconcentrated. Means of C, YI, and BI for unconcentrated milk were higher than the concentrated, but h and WI means of unconcentrated milk were lower than the concentrated. The food industry may benefit from such approaches in the future after further up-scaling studies This process does not need chemical materials or devices for testing. This study proposed the possibility of a non-destructive approach for milk analysis while it should be noted that the values reported are for specific raw material and process. The future prospects include using this method to predict physicochemical properties of milk from various resources, and in a computer-based continuous mode which capture photo of milk and analyses color components. Additionally, internet of things (IOT) can be used with this method.

Author Contributions

Conceptualization, Writing—original draft, Software, Supervision, A.R.A.-H. Methodology, Data curation, H.I.A. Investigation, Validation, Formal analysis, Methodology, Resources, S.A.A.-I. Writing—review & editing, Supervision, Visualization, M.G. Software, Writing—review & editing, A.M.-K. All authors have read and agreed to the published version of the manuscript.

Funding

This research received no external funding.

Institutional Review Board Statement

No applicable.

Informed Consent Statement

No applicable.

Data Availability Statement

The data presented in this study are available on request from the corresponding author.

Acknowledgments

The authors thank the Department of Food Science, College of Agriculture, the University of Basrah for providing the laboratory of food engineering and facilities.

Conflicts of Interest

The author declare no conflict of interest.

References

  1. Wu, D.; Sun, D.W. Colour measurements by computer vision for food quality control–A review. Trends Food Sci. Technol. 2013, 29, 5–20. [Google Scholar] [CrossRef]
  2. Al-Hilphy, A.R.; Ali, H.I.; Al-IEssa, S.A.; Lorenzo, J.M.; Barba, F.J.; Gavahian, M. Refractance window (RW) concentration of milk Part II Computer vision approach for optimizing microbial and sensory qualities. J. Food Process. Preserv. 2021, 45, e15702. [Google Scholar] [CrossRef]
  3. Hadimani, L.; Mittal, N. Development of a computer vision system to estimate the colour indices of Kinnow mandarins. J. Food Sci. Technol. 2019, 56, 2305–2311. [Google Scholar] [CrossRef] [PubMed]
  4. De Marchi, M.; Toffanin, V.; Cassandro, M.; Penasa, M. Invited review Mid-infrared spectroscopy as a phenotyping tool for milk traits. J. Dairy Sci. 2014, 97, 1171–1186. [Google Scholar] [CrossRef]
  5. Al-Hilphy, A.R.; Ali, H.I.; Al-IEssa, S.A.; Lorenzo, J.M.; Barba, F.J.; Gavahian, M. Optimization of process variables on physicochemical properties of milk during an innovative refractance window concentration. J. Food Process. Preserv. 2020, 44, e14782. [Google Scholar] [CrossRef]
  6. Raghavi, L.M.; Moses, J.A.; Anandharamakrishnan, C. Refractance window drying of foods: A review. J. Food Eng. 2018, 222, 267–275. [Google Scholar] [CrossRef]
  7. Tontul, İ.; Ergin, F.; Eroğlu, E.; Küçükçetin, A.; Topuz, A. Physical and microbiological properties of yoghurt powder produced by refractance window drying. Int. Dairy J. 2018, 85, 169–176. [Google Scholar] [CrossRef]
  8. Tontul, I.; Topuz, A. Effects of different drying methods on the physicochemical properties of pomegranate leather (pestil). LWT 2017, 80, 294–303. [Google Scholar] [CrossRef]
  9. AOAC. Official Methods of Analysis of AOAC. International; Rockville, M.D., Ed.; AOAC International: Rockville, MA, USA, 2016. [Google Scholar]
  10. Wasnik, P.G.; Menon, R.R.; Sivaram, M.; Nath, B.S.; Balasubramanyam, B.V.; Manjunatha, M. Development of mathematical model for prediction of adulteration levels of cow ghee with vegetable fat using image analysis. J. Food Sci. Technol. 2019, 56, 2320–2325. [Google Scholar] [CrossRef]
  11. Yam, K.L.; Papadakis, S.E. A simple digital imaging method for measuring and analyzing color of food surfaces. J. Food Eng. 2004, 61, 137–142. [Google Scholar] [CrossRef]
  12. Bermúdez-Aguirre, D.; Mawson, R.; Versteeg, K.; Barbosa-Cánovas, G.V. Composition properties, physicochemical characteristics and shelf life of whole milk after thermal and thermo-sonication treatments. J. Food Qual. 2009, 32, 283–302. [Google Scholar] [CrossRef]
  13. Vargas, M.; Chafer, M.; Albors, A.; Chiralt, A.; Gonzalez-Martinez, M. Physicochemical and sensory characteristics of yoghurt produced from mixtures of cows’ and goats’ milk. Int. J. Dairy Technol. 2008, 18, 1146–1152. [Google Scholar] [CrossRef]
  14. Erbay, Z.; Koca, N. Efects of whey or maltodextrin addition during production on physical quality of white cheese powder during storage. J. Dairy Sci. 2015, 98, 8391–8404. [Google Scholar] [CrossRef] [PubMed] [Green Version]
  15. Fernandez-Avila, C.; Gutierrez-Merida, C.; Trujillo, A.J. Physicochemical and sensory characteristics of a UHT milk-based product enriched with conjugated linoleic acid emulsified by Ultra-High-Pressure Homogenization. Innov. Food Sci. Emerg. Technol. 2017, 39, 275–283. [Google Scholar] [CrossRef]
  16. Garg, D.; Chakraborty, S.; Gokhale, J.S. Optimizing the extraction of proteinfrom Prosopis cineraria seeds using response surface methodology and characterization of seed protein concentrate. LWT 2020, 117, 108630. [Google Scholar] [CrossRef]
  17. Cheng, N.; Barbano, D.M.; Drake, M.A. Effect of pasteurization and fat, protein, casein to serum protein ratio, and milk temperature on milk beverage color and viscosity. J. Dairy Sci. 2019, 102, 2022–2043. [Google Scholar] [CrossRef]
  18. Patange, D.D.D.; Virshasen Vinayak, D.; Chandran, D.; Kumar, M.; Lorenzo, J.M. Comparative Effect of Cooling on the Physico-chemical-sensory Properties of Ghee from Cow and Buffalo Milk, and Evaluation of the Low-fat Spread Prepared from Cow and Buffalo Milk Ghee. Food Anal. Methods 2022, 5, 1–11. [Google Scholar] [CrossRef]
  19. Scarso, S.; McParland, S.; Visentin, G.; Berry, D.P.; McDermott, A.; De Marchi, M. Genetic and nongenetic factors associated with milk color in dairy cows. J. Dairy Sci. 2017, 100, 7345–7361. [Google Scholar] [CrossRef]
  20. Ávila, M.; Gómez-Torres, N.; Delgado, D.; Gaya, P.; Garde, S. Effect of high-pressure treatments on proteolysis, volatile compounds, texture, color, and sensory characteristics of semi-hard raw ewe milk cheese. Food Res. Int. 2017, 100, 595–602. [Google Scholar] [CrossRef]
  21. Misawa, N.; Barbano, D.M.; Drake, M.A. Influence of casein as a percentage of true protein and protein level on color and texture of milks containing 1 and 2% fat1. J. Dairy Sci. 2016, 99, 5284–5304. [Google Scholar] [CrossRef]
  22. Wu, J.; Chen, S.; Nyiransabimana, L.; Van Damme, E.J.; De Meulenaer, B.; Van der Meeren, P. Improved heat stability of recombined filled evaporated milk emulsions by wet heat pre-treatment of skim milk powder dispersions at different pH values. LWT 2022, 154, 112739. [Google Scholar] [CrossRef]
  23. Parmar, P.; Singh, A.K.; Meena, G.S.; Borad, S.; Raju, P.N. Application of ohmic heating for concentration of milk. J. Food Sci. Technol. 2018, 55, 4956–4963. [Google Scholar] [CrossRef] [PubMed]
  24. Fematt-Flores, G.E.; Aguiló-Aguayo, I.; Marcos, B.; Camargo-Olivas, B.A.; Sánchez-Vega, R.; Soto-Caballero, M.C.; Rodríguez-Roque, M.J. Milk protein-based edible films: Influence on mechanical, hydrodynamic, optical and antioxidant properties. Coatings 2022, 12, 196. [Google Scholar] [CrossRef]
  25. Al-Hilphy, A.R.S.; Niamah, A.K.; Altemimi, A.B. Effect of ultrasonic treatment on buffalo milk homoginization and Numbers bacterial. Int. J. Food Sci. Nutr. Eng. 2012, 2, 113–118. [Google Scholar] [CrossRef] [Green Version]
  26. Guetouache, M.; Guessas, B.; Medjekal, S. Composition and nutritional value of raw milk. Biol. Sci. Pharm. Res. 2014, 2, 115–122. [Google Scholar] [CrossRef]
  27. Sharma, P.; Patel, H.; Patel, A. Evaporated and Sweetened Condensed Milks. In Dairy Processing and Quality Assurance; Ramesh, C., Chandan, R.C., Kilara, A., Shah, N.P., Eds.; John Wiley and Sons Ltd.: Hoboken, NJ, USA, 2015; pp. 310–332. [Google Scholar] [CrossRef]
  28. AL-Hilphy, A.R.S.; Mahmud, I.A.; AL Rubaiy, H.H.M. Designing and Construction Solar Milk Pasteurization and studying Its Efficiency. Misan J. Acad. Stud. 2012, 11, 128–146. [Google Scholar]
  29. Park, C.W.; Drake, M. Condensed milk storage and evaporation affect the flavor of nonfat dry milk. J. Dairy Sci. 2016, 99, 9586–9597. [Google Scholar] [CrossRef]
  30. Minim, L.A.; Coimbra, J.S.; Minim, V.P.; Telis-Romero, J. Influence of temperature and water and fat contents on the thermophysical properties of milk. J. Chem. Eng. Data 2002, 47, 1488–1491. [Google Scholar] [CrossRef]
  31. Nieuwenhuijse, J.A.; Van Vliet, T.; Walstra, P. Kinetic aspects of the heat-induced coagulation of concentrated skim milk. Neth. Milk Dairy J. 1992, 46, 45–68. [Google Scholar]
  32. Keršienė, M.; Jasutienė, I.; Kubiliūtė, M.; Ruzgas, T.; Leskauskaitė, D. Composition and processing characteristics of milk from Lithuanian black and white cows. J. Food Nutr. Res. 2019, 7, 114–121. [Google Scholar] [CrossRef]
  33. Pinto, S.; Hoffmann, G.; Ammon, C.; Amon, B.; Heuwieser, W.; Halachmi, I.; Banhazi, T.; Amon, T. Influence of barn climate, body postures and milk yield on the respiration rate of dairy cows. Ann. Anim. Sci. 2019, 19, 469–481. [Google Scholar] [CrossRef] [Green Version]
Figure 1. A layout of the locally refractance window milk concentrator and operation.
Dairy 03 00030 g001
Figure 2. The image acquisition system applied in the current study (A): inside view of the system; (B): outside view of system.
Dairy 03 00030 g002
Figure 3. L* value of unconcentrated and concentrated milk. Different letters refer to significant differences between means.
Dairy 03 00030 g003
Figure 4. a* value of unconcentrated and concentrated milk. Different letters refer to significant differences between means.
Dairy 03 00030 g004
Figure 5. b* value of unconcentrated and concentrated milk. Different letters refer to significant differences between means.
Dairy 03 00030 g005
Figure 6. ∆E between unconcentrated and concentrated milk.3.2. Modeling of milk physico-chemical properties. The deferent letters (a,b,c,d,e,f) refer to significant differences (p < 0.05) between treatments.
Dairy 03 00030 g006
Table 1. Chroma, hue angle, whiteness index, yellowing index, and browning index of unconcentrated and concentrated milk.
RunsCWIYIBI
FMCMFMCMFMCMFMCMFMCM
116.15 ± 0.9820.12 ± 1.11−16.08 ± 0.11−7.83 ± 0.1262.90 ± 2.2366.41 ± 3.1233.29 ± 1.9838.95 ± 1.7720.67 ± 1.9928.11 ± 1.55
216.12 ± 0.8810.00 ± 1.32−16.30 ± 0.66−13.60 ± 0.9862.27 ± 2.8973.34 ± 3.0933.54 ± 2.2318.44 ± 1.7820.77 ± 1.5611.15 ± 1.04
315.19 ± 1.079.58 ± 0.12−17.29 ± 0.97−18.14 ± 0.9663.11 ± 2.1173.50 ± 2.9931.21 ± 2.1117.27 ± 1.0118.79 ± 1.559.61 ± 0.99
416.09 ± 1.0313.25 ± 0.14−15.84 ± 0.78−16.45 ± 0.8963.30 ± 2.3569.25 ± 2.7833.00 ± 2.1525.13 ± 1.0320.54 ± 1.9814.93 ± 1.04
515.95 ± 0.977.20 ± 0.87−16.25 ± 0.99−11.30 ± 0.8863.10 ± 2.9074.26 ± 3.9732.78 ± 1.8813.40 ± 1.2220.24 ± 2.028.22 ± 1.56
616.13 ± 0.998.63 ± 0.77−16.13 ± 0.87−17.48 ± 0.6863.25 ± 2.3673.84 ± 3.0233.06 ± 1.5615.61 ± 1.1120.48 ± 1.458.73 ± 0.78
716.10 ± 0.8511.24 ± 0,90−16.24 ± 0.99−19.56 ± 0.6763.30 ± 2.9972.85 ± 2.9832.95 ± 1.8720.09 ± 1.0720.37 ± 1.5611.02 ± 0.93
C: chroma, h°: hue angle, WI: whiteness index, YI: yellowing index, BI: browning index, FM: unconcentrated milk, and CM: concentrated milk.
Table 2. Statistical parameters of experimental and predicted unconcentrated and concentrated milk fat values affected by color components.
RunsExp. F. (%)Pre. F. (%)Error (%)SDRMSER
Unconcentrated Milk
14.120 a4.120 a0.000.000000.00410.896
24.090 a4.091 a0.020.0006
34.100 a4.093 a0.170.0048
44.100 a4.096 a0.110.0032
54.090 a4.095 a0.110.0032
64.090 a4.096 a0.140.0041
74.100 a4.096 a0.090.0027
Concentrated Milk
17.49 a7.489 a8.401 × 10−54.44 × 10−60.00640.850
27.31 a7.330 a0.2730.021
37.41 a7.338 a0.9660.043
47.31 a7.321 a0.1610.015
57.33 a7.317 a0.1690.008
67.31 a7.333 a0.3180.023
77.40 a7.348 a0.6920.036
Exp. F.: experimental fat, Pre. F.: predicted fat, SD: standard deviation, RMSE: root mean square error, and R: correlation coefficient. The same letters in the rows refer to no significant differences between means (triplicates).
Table 3. Statistical parameters of experimental and predicted unconcentrated and concentrated milk pH values affected by color components.
RunsExp. pH Pre. pH Error (%)SDRMSER
Unconcentrated Milk
16.520 a6.520 a0.0010.000060.00820.864
26.480 a6.481 a0.020.0008
36.500 a6.508 a0.120.0056
46.530 a6.511 a0.290.0135
56.510 a6.514 a0.060.0028
66.530 a6.536 a0.090.0040
76.530 a6.544 a0.210.0099
Concentrated Milk
16.40 a6.40 a0.0090.0000.01260.79
26.51 a6.57 a0.9200.042
36.60 a6.57 a0.4570.021
46.60 a6.57 a0.4570.021
56.63 a6.57 a0.9070.043
66.51 a6.57 a0.9200.042
76.54 a6.57 a0.4570.021
Exp. pH: experimental pH, Pre. pH: predicted pH, SD: standard deviation, RMSE: root mean square error, and R: correlation coefficient. The same letters in the rows refer to no significant differences between means (triplicates).
Table 4. Statistical parameters of experimental and predicted unconcentrated milk density values affected by color components.
Runs Exp .   ρ Pre .   ρ Error (%)SDRMSER
Unconcentrated Milk
11.026 a1.027 a0.0280.000200.001020.851
21.027 a1.026 a0.0075.46 × 10−5
31.027 a1.027 a0.0107.51 × 10−5
41.025 a1.025 a0.0260.00018
51.026 a1.027 a0.0750.00054
61.026 a1.026 a0.0440.00031
71.027 a1.027 a0.0260.00018
Concentrated Milk
11.045 a1.045 a0.0400.000290.0015850.947
21.044 a1.042 a0.170.0012
31.045 a1.048 a0.300.0022
41.034 a1.035 a0.050.0004
51.032 a1.034 a0.150.0011
61.046 a1.045 a0.140.0010
71.050 a1.055 a0.510.0038
Exp. ρ : experimental density, Pre ρ : predicted density, SD: standard deviation, RMSE: root mean square error, and R: correlation coefficient. The same letters in the rows refer to no significant differences between means (triplicates).
Table 5. Statistical parameters of experimental and predicted unconcentrated milk viscosity values affected by color components.
RunsExp. V. (cp)Pre. V.(cp)Error (%)SDRMSER
Unconcentrated Milk
12.08 a2.078 a0.0960.001410.00350.883
22.07 a2.063 a0.360.0053
32.07 a2.069 a0.070.0010
42.07 a2.069 a0.050.0007
52.07 a2.070 a0.010.0001
62.08 a2.075 a0.250.0037
72.08 a2.077 a0.160.0024
Concentrated Milk
13.23 a3.23 a0.0020.00000.000700.888
23.28 a3.28 a0.110.0026
33.29 a3.28 a0.290.0069
43.28 a3.29 a0.160.0036
53.25 a3.27 a0.630.0145
63.29 a3.28 a0.370.0086
73.29 a3.29 a0.150.0034
Exp. V.: experimental viscosity, Pre. V.: predicted viscosity, SD: standard deviation, RMSE: root mean square error, and R: correlation coefficient. The same letters in the rows refer to no significant differences between means (triplicates).
Table 6. Statistical parameters of experimental and predicted unconcentrated milk moisture content affected by color components.
RunsExp. V. (cp)Pre. V.(cp)Error (%)SDRMSER
Unconcentrated Milk
186.80 a86.80 a0.000.00000.18530.866
285.60 a85.77 a0.200.1240
386.52 a86.18 a0.370.2255
486.41 a86.70 a0.350.2141
586.50 a86.46 a0.040.0264
686.81 a86.67 a0.140.0863
786.60 a86.71 a0.130.0786
Concentrated Milk
176.01 a76.01 a0.0040.002390.37210.9001
276.04 a75.19 a1.120.6014
375.50 a75.81 a0.410.2186
474.01 a73.65 a0.490.2541
574.21 a74.26 a0.070.0388
675.30 a75.44 a0.180.0955
776.10 a76.58 a0.630.3368
Exp. MC.: experimental moisture content, Pre. MC.: predicted moisture content, SD: standard deviation, RMSE: root mean square error, and R: correlation coefficient. The same letters in the rows refer to no significant differences between means (triplicates).
Publisher’s Note: MDPI stays neutral with regard to jurisdictional claims in published maps and institutional affiliations.

