
Detecting Differential Item Functioning in 2PL Multistage Assessments

1
Department for Psychology, University of Zurich, 8050 Zurich, Switzerland
2
School of Psychology and Psychotherapy, Witten/Herdecke University, 58448 Witten, Germany
3
Faculty of Psychology and Educational Sciences, Ghent University, 9000 Gent, Belgium
4
Department of Psychology and Psychotherapy, Witten/Herdecke University, 58448 Witten, Germany
*
Author to whom correspondence should be addressed.
Psych 2023, 5(2), 461-477; https://doi.org/10.3390/psych5020031
Submission received: 29 March 2023
/
Revised: 26 May 2023
/
Accepted: 29 May 2023
/
Published: 31 May 2023
(This article belongs to the Special Issue Computational Aspects and Software in Psychometrics II)
Abstract
:The detection of differential item functioning is crucial for the psychometric evaluation of multistage tests. This paper discusses five approaches presented in the literature: logistic regression, SIBTEST, analytical score-based tests, bootstrap score-based tests, and permutation score-based tests. First, using an simulation study inspired by a real-life large-scale educational assessment, we compare the five approaches with respect to their type I error rate and their statistical power. Then, we present an application to an empirical data set. We find that all approaches show type I error rates close to the nominal alpha level. Furthermore, all approaches are shown to be sensitive to uniform and non-uniform DIF effects, with the score-based tests showing the highest power.
1. Introduction
Multistage tests (MSTs) are based on a testing approach that splits the assessment into multiple stages [1]. At each stage, there can be different item sets, also referred to as modules, which may have different psychometric properties, and test takers are administered only one of these possible modules per stage, typically in an adaptive manner. Multistage testing designs can be considered a compromise between linear tests, where all test takers work on the same set of items, and computerized adaptive tests (CATs), where items are sequentially selected after each response given by a test taker [2]. As is the case of linear tests and CATs, it is necessary to evaluate the reliability, validity, and fairness of MSTs. This paper addresses an important aspect of this evaluation, that is, the detection of differential item functioning (DIF [3]) for individual items in an MST.
If DIF is present, test takers from different groups with the same ability level differ in their probability of answering specific items correctly [4]. Failure to consider DIF can lead to biased ability estimates and unfair assessments. Therefore, it is also of high practical relevance to detect DIF in data from MSTs. Since in MSTs, the individual test takers typically work on different items, tests designed for linear tests (for an overview, see [5]) typically cannot be applied, as discussed later in this paper. Therefore, several methods for the detection of DIF in MSTs have been proposed.
This paper offers the following contributions to the literature on the detection of DIF in MSTs. First, we discuss five methods for detecting DIF in the context of MSTs, as well as a score-based testing framework for item-wise DIF detection in MSTs. This framework motivates three of the five DIF tests considered in this paper. Second, we compare these five tests in a simulation study of MSTs by evaluating their power, type I error rate, and overall agreement, in addition to illustrating their application to empirical data. Third, we provide some practical suggestions for the application of item-wise DIF tests based on our results. An R package named mstDIF that allows for the application of all statistical tests described in this paper is publicly available. In contrast to previous work [6], the focus of this work is detecting DIF with respect to a categorical covariate and on settings that are inspired by empirical large-scale educational assessments.
The remainder of this paper is structured as follows. In the next section, we introduce the item response theory (IRT) framework, which is widely used in practical applications of MSTs. Subsequently, we discuss the five DIF tests for MSTs, followed by an evaluation of these tests using both simulated and real data in the fourth and fifth sections, respectively. In the final section, we conclude our paper with a discussion of our findings.
1.1. The Item Response Theory Framework
Throughout this paper, we assume that all items are dichotomously scored and that the person–item interaction can be described by the two-parametric logistic model (2PL; [7]), which is a widely used IRT model in educational testing (e.g., [8]). The 2PL models the probability (P) of a correct response () of person i on item j as follows:
In this notation, the person-specific parameter is commonly referred to as the ability parameter; and are two item-specific parameters, respectively referred to as the item discrimination and the item difficulty parameter. Because the construction of the modules in an MST, as well as the selection of the modules during the MST assessment, is based on how the item is expected to function, the item parameters and are usually calibrated using data from a calibration sample or from a previous test administration. With these calibrated item parameters, it is possible to select modules that are optimal with regard to their item information given the test takers’ responses to earlier modules in the test. Based on the item calibrations and the observed responses, it is possible to estimate the ability parameters of all test takers in an MST. For a more technical treatment of adaptive testing, see [1,2].
1.2. The Role of Differential Item Functioning in Adaptive Testing
MSTs that use IRT models (e.g., the 2PL model) for ability estimation and module selection can only be expected to provide valid and accurate results if the underlying IRT model provides a sufficiently accurate description of the interaction of test takers and items. In the presence of DIF, this assumption is violated. In the context of adaptive tests, this model violation might not only affect the estimation of the person parameters but also which modules are presented to the test takers.
In the literature, two types of DIF are commonly distinguished [9]. In the presence of uniform DIF, there are consistent differences in the probability of providing a correct response across different groups (despite equal ability) for all ability levels. Technically, this difference is often considered a shift in the difficulty parameter for individual items between various groups. In contrast, in the presence of non-uniform DIF, the differences in probability change depending on the ability level. In the context of the 2PL model, uniform DIF corresponds to a difference in the difficulty parameter, whereas non-uniform DIF corresponds to a difference in the discrimination parameter (and possibly the difficulty parameter) for one or more subgroups. Steinberg and Thissen [10] discuss several effect sizes for both types of DIF.
DIF tests typically test the null hypothesis that all item parameters are invariant against the alternative hypothesis that a specific item shows item parameters that systematically differ for various subgroups. In cases in which multiple items are tested for DIF, it is usually necessary to define a set of anchor items for which the item parameters can be assumed to be invariant. Item purification procedures can be used to heuristically construct such an item set if it is not available. We return to this point at the end of this paper.
If DIF is absent, the proportion of correct responses on a specific item should not differ across test takers with equal abilities from different groups. Hence, classical DIF tests compare the proportion of correct responses for a specific item across groups, conditional on a measure of the ability of the respondents (cf. [11]). Such a measure could be the number of correct responses on the other items in the test. In MSTs and CATs, where test takers typically work on different sets of items, this reasoning is not valid anymore. This motivated the adaptation of some classical DIF tests to account for the adaptive test design of CATs and MSTs. We review two of these tests herein, namely MSTSIB and a logistic regression test. These tests were adapted to MSTs by using ability parameter estimates instead of raw scores as a proxy for the abilities of the test takers. Several authors [6,12,13,14] also discuss several DIF tests for MSTs and CATs.
1.2.1. MSTSIB
The MSTSIB method was proposed in [15] and is based on the Simultaneous Item Bias Test (SIBTEST) procedure proposed in [16]. It was developed for a scenario involving two predefined groups of respondents: a focal group and a reference group. MSTSIB aims to test whether the item parameters for both groups in a specific item are identical. If there is no DIF, the expected raw score of respondents with the same latent ability () must be equal, regardless of which group they belong to. Let denote the expected raw item score of members of the focal group with ability estimate , which can be obtained from the MST, and let be the corresponding term for members of the reference group. If there is no DIF present, it can be expected that for all values of .
As a test statistic, MSTSIB computes a weighted mean of over different intervals across the -range. The weights in this calculation correspond to the frequency of different values of within each interval in the tested sample. If there is no DIF, the resulting test statistic is approximately normally distributed, which allows a test of the null hypothesis that the difference in the expected raw item scores between both groups is 0. Usually, a regression correction procedure is applied to correct for measurement bias in the estimation of the expected item scores. For technical details on the MSTSIB procedure, see [15] or [17].
1.2.2. Logistic Regression
The DIF test for MSTs that is based on logistic regression was also developed for a scenario with a focal group and a reference group. This method assumes that the relationship between the probability of a correct response on a specific item and the ability parameter () can be described by a logistic regression model, such as the one- and two-parametric logistic test model [7]. The statistical test for detecting DIF effects is based on the comparison of two logistic regression models using a likelihood ratio test. In the first logistic regression model, the ability estimate (), which can be obtained from the MST, is the only independent variable, while the observed response on a specific item is the dependent variable. The second logistic regression model contains two additional predictors, the first of which is a dummy variable that indicates the membership in the focal or reference group and the second of which is an interaction effect of the ability parameter and the group membership. If no DIF effect is present, both logistic regression models should show a comparable fit to the data. If the second model provides a more accurate description of the data than the more parsimonious first model, this indicates that DIF effects are present. An evaluation of this method was provided by [17,18]. Technically, the logistic regression test assumes that a logistic regression model provides an accurate description of the empirical data. This assumption might be violated, for instance, in the presence of guessing.
1.2.3. Asymptotic Score-Based Measurement Invariance Tests
The score-based test approach builds on the tradition of M-fluctuation tests (e.g., [19,20]) and was introduced into the educational and psychological measurement literature as a method to check measurement invariance in linear tests along categorical, ordinal, or metric covariates [4,21,22,23,24], which are closely related to DIF detection. This approach is related to the Lagrange multiplier test, which has been proposed for the detection of DIF in both linear [25] and adaptive tests [26]. By design, response data from MSTs contain a lot of missing data (i.e., test takers only respond to a limited set of items). However, because this pattern of missingness can be considered to be missing at random (MAR) [27], likelihood-based inferences are allowed [28]. Score-based tests aim to check the invariance of maximum likelihood estimators with regard to given person covariates. In contrast to MSTSIB and logistic regression, it was not necessary to adapt these tests for an application with MSTs.
The conceptual idea of score-based DIF tests can be summarized as follows. We first estimate an IRT model, e.g., the 2PL model, which assumes that the item parameters are stable over the focal and reference groups. If this IRT model provides an accurate description of the interaction of test takers and items, the observed deviations between the model predictions and the data are unsystematic and random. Technically, the deviations are the contributions to the maximum-likelihood-based score function (e.g., [19,20]); hence, the term: score-based tests. If, on the other hand, item parameters differ for the focal and reference groups, this leads to systematic deviations from the model predictions. For instance, if an item is easier for test takers from the focal group than for test takers from the reference group of the same ability, more correct responses are provided by the focal group than the model predicts. When summarized over the focal group, these model deviations accumulate and allow for the detection of DIF. For an introduction to the technical details, we refer the reader to [4,21,22,23,24,29,30,31].
Compared to logistic regression and MSTSIB, score-based DIF tests provide four distinctive advantages. First, they can be used for the detection of DIF effects that are related to ordinal and metric person covariates. In contrast, both MSTSIB and logistic regression were proposed for unordered categorical covariates (traditionally with only two categories), and extensions to ordinal or metric covariates are not straightforward. Second, although we describe an item-wise approach, score-based tests can also be applied to detect the presence of DIF on the level of individual item parameters, modules (i.e., item sets), or on the complete item set. Third, they are conceptually very flexible and can be essentially applied with any model that can be estimated via maximum likelihood estimation, including the three-parametric logistic test model and models for polytomous items [30]. Finally, these tests are applied to the observed response matrix itself and do not require ability or item parameter estimates.
A disadvantage could be that these score-based DIF tests check the invariance of maximum likelihood estimates of the item parameters. This implies that the item parameters need to be estimated based on data collected with the MST before this DIF test can be carried out. In some cases, however, estimating the item parameters may not be appropriate, for instance, when the number of responses per item is too small. For these situations, we consider two modifications of the score-based DIF test—permutation and bootstrap score-based tests—in the next subsection. Hereafter, we refer to the original approach as asymptotic score-based tests to discern it from these other approaches.
1.2.4. Permutation and Bootstrap Score-Based Tests
Permutation and bootstrap score-based tests can be used to detect DIF in MSTs when accurate maximum likelihood estimates of the item parameters are not available for an MST, for instance, because the collected dataset is too small. They use precalibrated item parameters, which are usually available in MSTs, rather than maximum likelihood estimates obtained from the data. The calibrated item parameters are combined with the estimated ability parameters to estimate the individual contributions to the score function. Similar to asymptotic score-based invariance tests, these contributions are used to measure the accuracy of the response predictions. If the item parameters are stable and, hence, if the true item parameters in the operational test are identical to the calibrated item parameters for all test takers, the individual contributions should fluctuate randomly around 0. However, if the true item parameters in the operational test systematically differ from the calibrated item parameters for specific groups of respondents (i.e., DIF), the individual contributions systematically differ from 0, depending on the respondent’s group membership. By summarizing the score contributions across the subgroups, the systematic score deviations accumulate and allow for the detection of DIF.
Unlike the asymptotic score-based test, which relies on asymptotic theory, both permutation and bootstrap score-based tests use different methods to check the statistical significance of the observed differences between the assumed model and the data, i.e., the methods to obtain p values. On the one hand, bootstrap score-based tests use the calibrated item parameters and the person parameter estimates to generate a large number of bootstrap samples (i.e., artificial response data) for which the item parameters are stable. Considering the observed differences from the assumed model and these data leads to a reference distribution for deviations between the data and the model under the null hypothesis that the item parameters are stable across the focal and reference groups. On the other hand, permutation score-based tests obtain such a reference distribution from permutation samples. In each permutation sample, the observed responses are identical to those of the empirical dataset, but each respondent is randomly assigned to the focal or reference group. These artificial focal and reference groups differ between the permutation samples but are of the same size as in the original sample.
In general, the precision of the obtained p-value increases with the number of artificially generated permutation/bootstrap samples. To limit computing time, the following strategy can be applied. First, an initial number of datasets (e.g., 1000) is sampled. Second, only when the resulting p value is close to the predefined alpha level, a larger additional number of datasets can be sampled in order to increase the precision.
Because permutation and bootstrap score-based tests use the calibrated item parameters rather than maximum likelihood estimates for DIF detection, they may be especially useful in cases in which (a) the calibrated item parameters and the estimated person parameters are sufficiently accurate and (b) the operational sample size is too small for an accurate item parameter estimation. The authors of [32] presented the results of a small simulation study, demonstrating that these tests show a type I error rate close to the nominal alpha level when DIF is absent, even when the test takers are drawn from different ability groups, and have power against uniform and non-uniform DIF. We extend these findings below.
Of the five methods outlined above, i.e., logistic regression, MSTSIB, and the family of three score-based tests, the first two have already been applied with CATs [11,17], but there have been limited evaluations with respect to MSTs. In addition, the score-based test framework has been investigated for linear tests in a variety of simulation studies [21], but they have not been considered for item-wise DIF detection in adaptive testing designs such as MSTs under conditions that occur in empirical large-scale assessments. This motivates their evaluation through a simulation study, which is reported in the next section.
2. An Evaluation with a Simulation Study
To investigate the comparative type I error rates and the power of the five DIF tests presented in the introduction, a simulation study was carried out that was inspired by the CHECK assessments, an empirical large-scale assessment conducted in Switzerland (see below). We first present the design of the simulation study, then summarize and discuss the results. The data of the simulation study were generated using the software package mstR [33] in the R framework for statistical computing [34].
2.1. Simulation Design
Each simulated dataset consisted of 21,873 test takers who were administered an MST. The simulated MST had four stages and used a design. This notation indicates the number of available modules at each stage. In the entry stage, the test takers were randomly assigned to one of four modules, each module consisting of seven items. The second, third, and fourth stages consisted of five modules each. The five modules in the second stage consisted of seven items, while the modules in the third and fourth stages contained ten items. As a result, the complete item set consisted of 163 items, and each test taker responded to 34 items.
From the second stage on, the modules were assigned to the test takers adaptively using the maximum (Fisher) information criterion. After each module, the ability of the test taker was estimated using warm likelihood estimation (WLE; [35]), and based on this ability estimate, the test takers were assigned to the module in the next stage for which the Fisher information was maximized.
Item responses were generated using the 2PL model. The item discrimination and item difficulty parameters of the simulated items were the estimated parameter values from 163 empirical items from the CHECK assessments (see below). In the simulation study, these item parameter estimates were used as calibrated item parameters, which are the parameter values used to estimate the person ability in the MST and to decide which modules should be presented to the test takers. If DIF was absent, they were identical to the true item parameters, which are the parameters used for generating the responses of the test takers. In conditions with DIF, the calibrated item parameters differed from the true item parameters for the focal group.
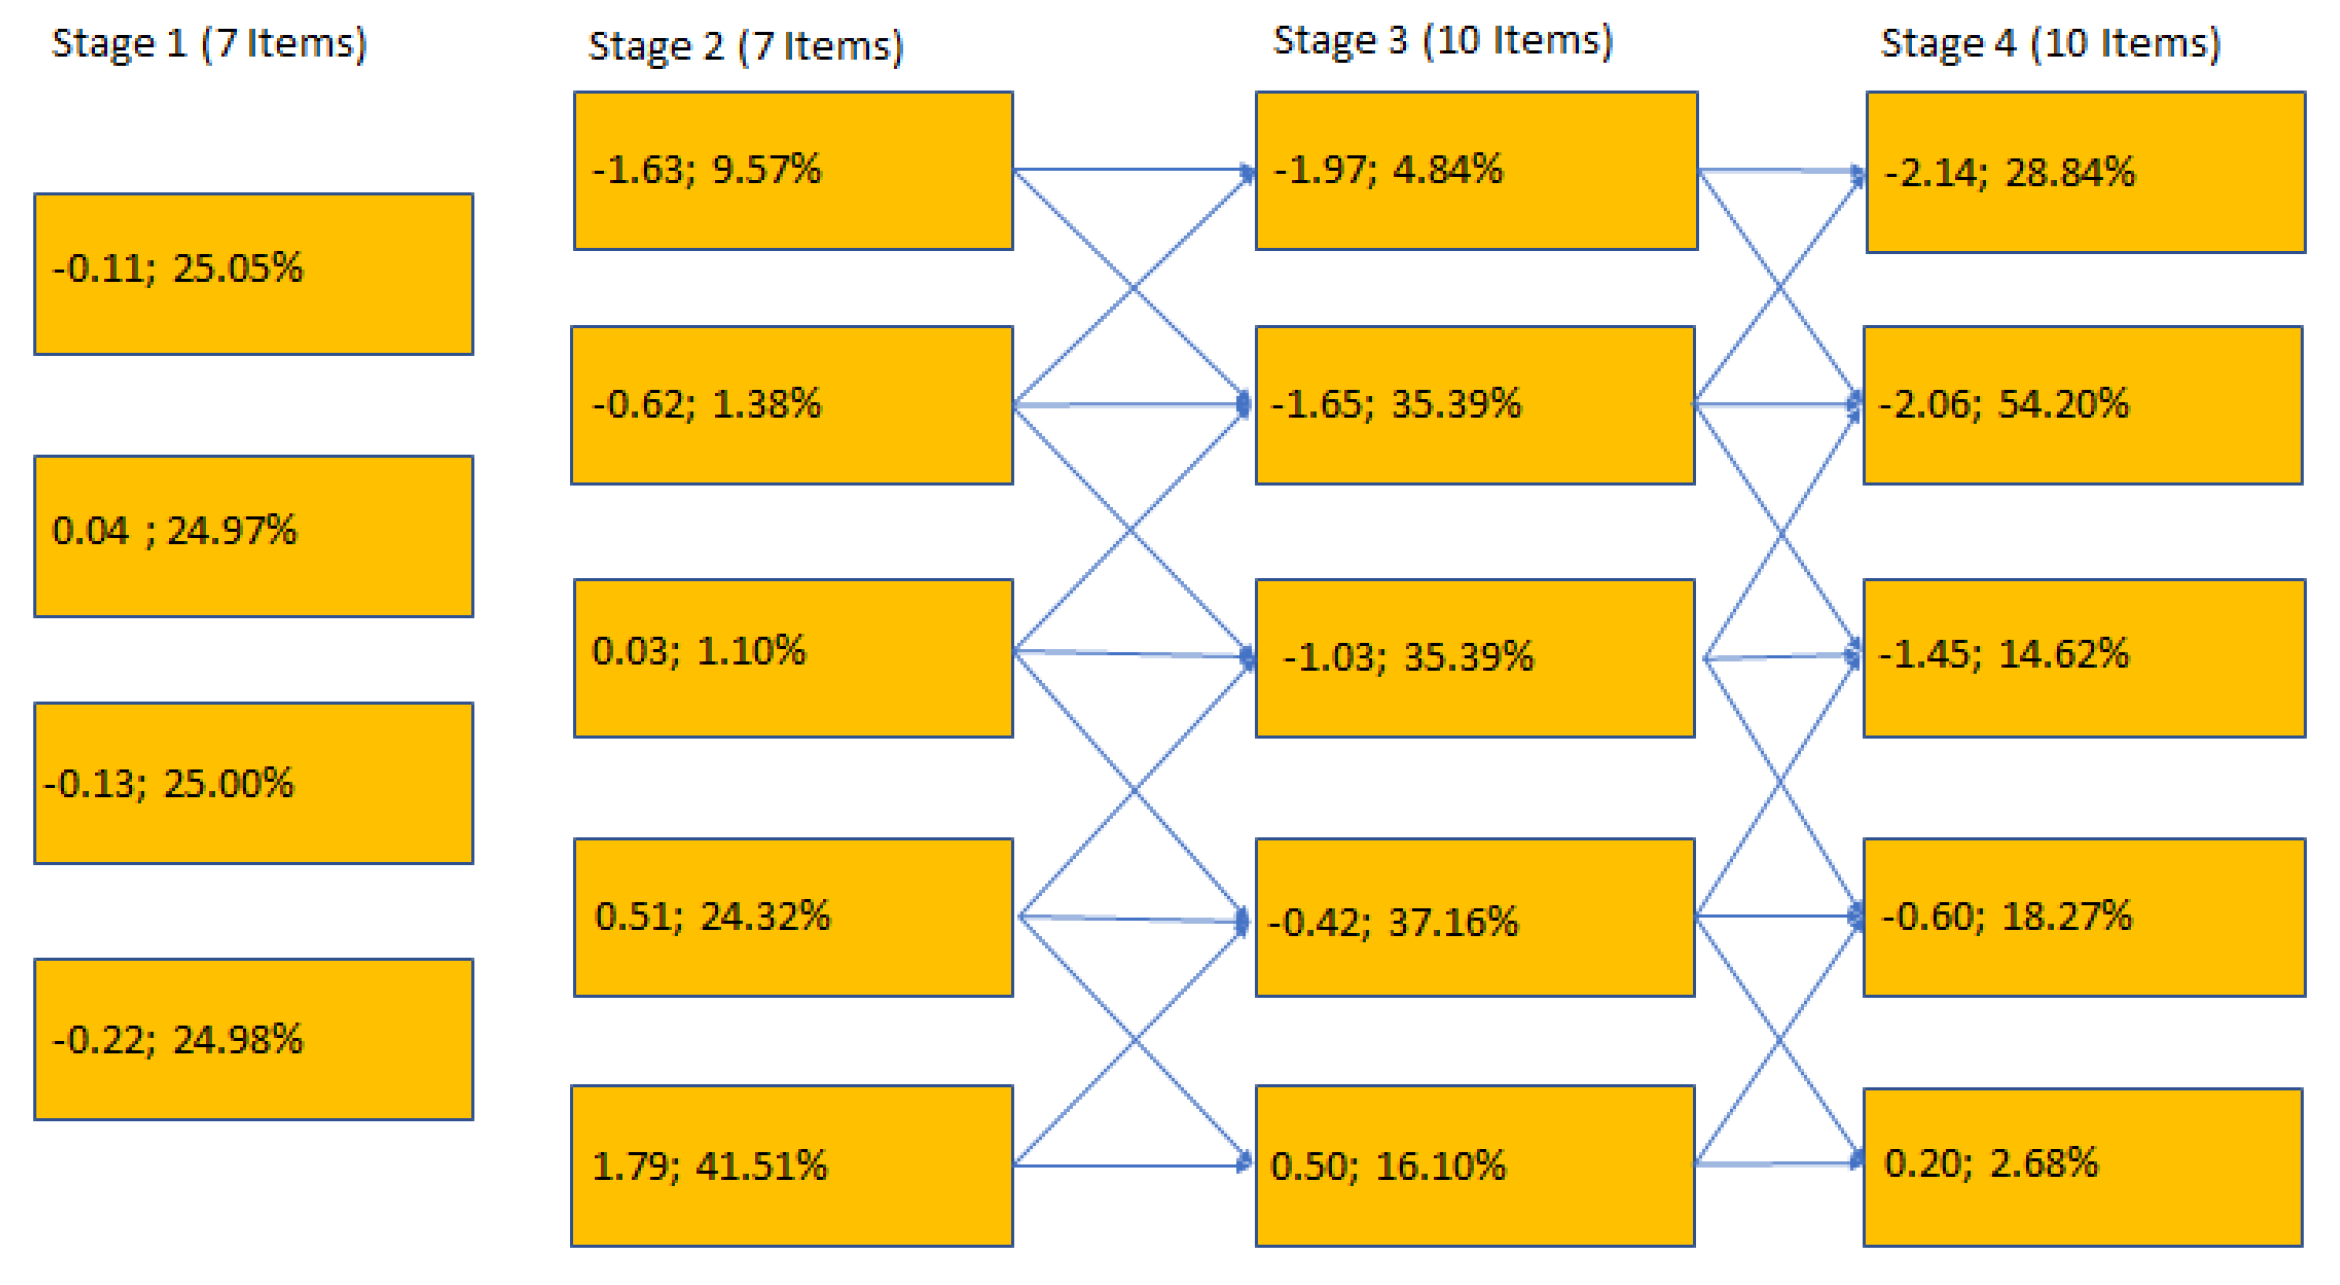
Figure 1 shows the conceptual setup of the simulated multistage test. For each stage, all modules are given, together with the average difficulty parameters for each module and the percentage of the sample that worked on each module when the ability parameter was drawn from a normal distribution and DIF was absent. The modules in stage 1 were all of comparable, medium difficulty, whereas the five modules in each of the other stages systematically differed in their mean difficulty. For the modules in stage 2 to stage 4, all possible paths in the multistage test are also presented. Every module in stage 2 could be reached from each module in stage 1, and these paths are omitted in the Figure.
Each simulated test taker belonged to either the focal group or the reference group. The reference group consisted of 12,872 test takers, and the focal group consisted of 9043 test takers based on the CHECK assessments (i.e., the first and the third cohort; see below). In both groups, the ability was usually assumed to follow a normal distribution with a mean of 0.02 and a standard deviation of 1.08, which, again, was inspired by the empirical results found for the CHECK assessments. The only exception was the condition that considered ability differences between the groups, which we describe below.
In the simulation study, we analyzed two conditions without DIF effects:
- A condition with identical ability distributions for the focal and reference groups;
- A condition in which the mean of the ability parameter distribution was increased by 0.5 for the reference group, resulting in groups of different mean abilities.
In these conditions without DIF, the tests should, for all items, show a rate of significant results that is close to the nominal alpha error of 0.05. Importantly, the tests should not confuse ability differences with DIF effects.
Furthermore, we analyzed eight conditions with DIF effects in a design. First, the number of DIF items was either 16 or 32 (corresponding to about 10 to 20 percent of the items in the test). Second, the DIF was either uniform or non-uniform. Third, the DIF effects were either balanced or unbalanced across the DIF items. In all conditions, the DIF items were randomly chosen. In addition, the following settings were chosen:
- In the unbalanced uniform DIF condition, the true item difficulty parameter was increased by 0.6 for the focal group for all DIF items;
- In the unbalanced non-uniform DIF condition, the true item discrimination parameter was increased by 0.3 for the focal group for all DIF items;
- In the balanced uniform DIF condition, the true item difficulty parameter was increased by 0.6 for half of the DIF items for the focal group but decreased by 0.6 for the other half;
- In the balanced non-uniform DIF condition, the true item discrimination parameter was increased by 0.3 for half of the DIF items for the focal group but decreased by 0.3 for the other half.
In these conditions, it is desirable that all tests show a high rate of significant results for all DIF items but a rate of significant results that is close the type I error rate for non-DIF items. Under each condition, 100 datasets were generated and analyzed with all five DIF tests.
The five DIF tests (MSTSIB, logistic regression, asymptotic, permutation, and bootstrap score-based tests) were used to test item-wise DIF between the focal and reference groups, with an alpha level of 0.05. For the logistic regression approach, MSTSIB, as well as the bootstrap and permutation score-based tests, the final ability parameters were estimated using WLE. For the bootstrap and permutation score-based tests, the (known) true item parameters were used as the calibrated item parameters. For the asymptotic score-based DIF test, the item parameters were estimated using marginal maximum likelihood estimation (MML). It was assumed that the item parameters were invariant for the focal and reference groups.
2.2. Results
In the two conditions without DIF effects, all tests showed a type I error rate in the range of 0.04 to 0.06 and thus close to 0.05. The only two exceptions were the permutation and bootstrap score-based tests, which showed a slightly increased type I error rate of 0.07 and 0.08, respectively, in the condition with ability differences.
Table 1, Table 2, Table 3 and Table 4 present the rate of significant results of all tests under conditions with DIF effects, grouped according to whether or not and which type of DIF was present in the items. For items with simulated DIF effects, the rate of significant results corresponds to the power to detect DIF (cf. Table 3 and Table 4); for non-DIF items, the rate corresponds to the type I error rate (cf. Table 1 and Table 2).
In the presence of DIF items, all methods showed a slightly increased type I error rate, with the score-based test demonstrating the lowest type I error rate. With respect to power, all methods were sensitive to DIF in both parameters. Under the simulated conditions, the power to detect DIF in the difficulty parameter () (i.e., uniform DIF) was generally higher than the power to detect DIF in the discrimination parameter () (i.e., non-uniform DIF). All methods, with the exception of MSTSIB, reached satisfactory power levels between about 0.65 and 0.85, depending on the type of DIF effect. The permutation and bootstrap score-based tests had the highest power to detect DIF, regardless of the DIF type.
2.3. Agreement between the Tests
To assess the agreement across the DIF detection methods, two methods were used. First, we measured the similarity of the p values for all pairs of DIF tests by calculating Spearman’s rank correlation between the p values obtained under each of the ten conditions. Second, we measured to which extent the DIF tests agreed in labeling an item as showing DIF by considering how often p values were above or below 0.05 for each DIF test. To measure this type of agreement for each DIF test, Yule’s Q was computed for each pair of tests (analogous to the correlation coefficient for continuous variables, Yule’s Q is equal to 1 (or −1) when there is a perfect (dis)agreement, whereas a value of 0 corresponds to no association.). This analysis was carried out separately for each of the ten conditions. We report the main results for the conditions without DIF and with DIF in 16 items in six separate Table 5, Table 6, Table 7, Table 8, Table 9 and Table 10. In conditions with 32 DIF items, very similar results were found, so we omit them for brevity. In each table, the entries above the diagonal report Spearman’s rank correlation, whereas the entries below the diagonal report Yule’s Q.
We can conclude that under these simulation conditions, the type I error rates and power were acceptable for all tests, with the exception of MSTSIB, which showed an increased rate of false-positive and false-negative results. In addition, all tests (with the exception of MSTSIB) displayed a strong agreement in their assessments.
3. An Empirical Application: Detection of Parameter Drift in the CHECK Assessments
We further illustrate the application of the five DIF tests for the investigation of item parameter drift in an MST. The analyzed dataset was collected in Switzerland as part of an educational assessment called CHECKS.
CHECKS is a series of standardized achievement tests carried out in four cantons of northwestern Switzerland (i.e., Argovia, Basle-City, Basle-County, and Soleure, all of which are German-speaking). CHECKS serves to measure the students’ achievements across different school grades and visualize individual learning levels. Although the aim of CHECKS is to support students by providing personalized feedback, it also includes reporting of aggregated results at the level of school classes and entire schools, which are used for teaching and school development.
CHECKS is currently conducted at the beginning of the third (CHECK P3) and sixth grades (CHECK P6) of elementary school, as well as in the middle of the second grade (CHECK S2) and at the end of the third grade (CHECK S3) of secondary school. Depending on the school grade, the assessed domains are “mathematics” (including the sub-domains “algebra”, “geometry”, and “functions”), “German reading comprehension”, “German grammar”, “English reading comprehension”, “English listening comprehension”, “French reading comprehension”, “French listening comprehension”, and “science and technology”. In elementary school, CHECKS is administered by paper and pencil, whereas in secondary school, there are computer-based online assessments that allow for more complex assessment designs. In our real-world application, we focus on the "German grammar" subtest that was part of the CHECK S2 and S3. Items in this subtest could, for example, ask the student to correctly apply rules for using commas in a sentence.
To allow for comparison of a student’s performance with that of other student cohorts, it is necessary to check for the presence of parameter drift (i.e., a possible instability of the psychometric characteristics of the test items across student cohorts). In this illustration, the DIF tests described above are used to detect parameter drift across three cohorts.
3.1. Sample
The analyzed dataset comprised 25,671 students from three cohorts that participated in the CHECK S2 and S3 assessments. The first cohort consisted of 9043 students assessed in 2016 (51.3% male; 74.4% native speakers; 4.9% with “individual learning goals”), the second cohort consisted of 3756 students assessed in 2016 (52.0% male; 74.0% native speakers; 3.2% with “individual learning goals”), and the third cohort consisted of 12,872 S2 students assessed in 2017 (51.0% male; 70.7% native speakers; 3.6% with “individual learning goals”). The samples represent the full population of public school students in the respective canton (in 2016, only from Argovia and Soleure; in 2017, from Argovia, Basle-City, Basle-County, and Soleuere) enrolled in eighth or ninth grade. Students partaking in the S2 assessment were, on average, 14.5 years old, and those partaking in S3 were one year older. In the following section, we refer to the three cohorts as cohort 1, cohort 2, and cohort 3.
3.2. Item Pool and Adaptive Algorithm
In each of the three cohorts, a multistage testing design was used for item presentation. The item pool and the adaptive testing design were different in each cohort, with the largest differences found between cohort 3 and the two other cohorts. Across all cohorts, the interaction of items and students is modeled by the 2PL model. In the following, we provide an overview of the item pool and the adaptive testing designs in each of the three cohorts. Note that the three cohorts shared the characteristic that students were assigned randomly to one of the modules of the entry stage.
In cohorts 1 and 2, a four-stage MST design was employed, with 109 items in total. This means that there were four modules in the first stage and three modules in each of the remaining stages. Students were randomly assigned to one of the four modules at the entry stage. After the end of each module, the next module was selected based on raw score cutoff values. While the modules of the first and second stage had a length of seven items, the modules in the third and fourth stage had a length of ten items. Overall, each student worked on 34 items. All modules were designed to meet specific criteria with regard to item content. Furthermore, the modules in stages 2 to 4 systematically differed with regard to their item difficulty so that in each of these stages, an easy module, a difficult module, and a module of medium difficulty were available.
In cohort 3, a four-stage MST design was employed. In contrast to the other cohorts, the ability parameter of every test taker was estimated by using WLE [35] at the end of each module. The next module was selected based on cutoff scores for this estimation. The total size of the item pool was 163 items. The setup of this MST was identical to that of the assessment used in the simulation study. Table 11 displays the overlap between the administered items per cohort.
We further report the exposure of the individual items per cohort, that is, the relative frequency with which they have been presented. In the first cohort, all items were responded to by between 1776 and 5102 students, which corresponds to 19.64% to 56.42% of the sample. In the second cohort, all items were worked on by between 607 (16.16% of this cohort) and 2022 (53.83% of this cohort) students. In the third cohort, all items were worked on by between 1450 (11.26%) and 3398 (26.40%) students.
3.3. Method
The empirical dataset differed from the datasets used in the simulation study with regard to several points. First, three groups instead of two groups were compared. Second, the multistage design and the item sets differed across the three groups. To illustrate the five DIF tests investigated in the simulation study with this empirical item set, the following steps were taken. First, we estimated the item parameters of all 219 items for the 2PL model using MML estimation via the mirt package [36] in the statistical software program R [34]. This estimation was based on a model that took possible ability differences between the cohorts into account by assuming separate normal distributions as priors across the cohorts with different means and variances but assumed that all item parameters were invariant across the cohorts. We note that this model demonstrated a better fit to the data according to a likelihood ratio test (, ) than a model that did not account for possible ability differences. Second, based on the estimated item parameters (cf. above) and the response patterns, the ability of each test taker was estimated using WLE [35] utilizing the PP R package [37]. It should be noted that we estimated the person parameters based on the maximum likelihood estimates, in contrast to the simulation study, in which the item parameters were assumed to stem from previous calibration studies, which were not available for this dataset.
The resulting item and person parameter estimates were used to apply all five DIF tests for three DIF situations: (a) DIF between cohort 1 and cohort 2, (b) DIF between cohort 1 and cohort 3, and (c) DIF between cohort 2 and cohort 3. In the following section, we report the rate of items showing DIF (i.e., a p value below the nominal alpha level of 0.05) for each DIF test, as well as the agreement between the five tests as measured by Spearman’s rank correlation and Yule’s Q for each of these situations.
3.4. Results and Discussion
We report the results separately for each pair of cohorts that served as the focal and reference groups. When testing for DIF across cohort 1 and cohort 2, the logistic regression test flagged 24 items (26.13%) as showing DIF, whereas MSTSIB did so for 11 items (12.50%), and all three score-based tests detected DIF in 25 items (28.41%). As was the case in the simulation study, the agreement between the bootstrap and the permutation score-based tests was highest overall (Spearman’s rank correlation > 0.99, Yule’s Q = 1.00), while the agreement between these two tests and the asymptotic score-based test was lower (Spearman’s rank correlation = 0.60, Yule’s Q = 0.869 for both test pairs). The logistic regression test showed an overall good agreement with the three score-based tests (Spearman’s rank correlations between 0.71 and 0.73, Yule’s Q between 0.94 and 0.96 for all three test pairs). The overall lowest agreement was found between MSTSIB and the four other tests (Spearman’s rank correlations between 0.14 and 0.30, Yule’s Q between 0.27 and 0.41 for all test pairs). This corresponds with the findings of the simulation study.
When testing for DIF across cohort 1 and cohort 3, the five DIF tests showed a comparatively low agreement. The logistic regression test detected DIF in 38 items (65.52%), whereas MSTSIB did so for only one item (1.72%). The asymptotic score-based test labeled 42 items (72.42%) as DIF items, whereas the Bootstrap and permutation score-based tests detected DIF in 31 items (53.45%). As in the simulation studies, the agreement between the bootstrap and the permutation score-based tests was highest overall (Spearman’s rank correlation = 0.98, Yule’s Q = 1.00), while the agreement between these two tests and the asymptotic score-based test was much lower (Spearman’s rank correlation between 0.19 and 0.21, Yule’s Q = 0.095 for both test pairs). The logistic regression test agreed well with the bootstrap and permutation score-based tests (Spearman’s rank correlations between 0.82 and 0.83, Yule’s Q = 0.933 for both test pairs) but much lower with the asymptotic score-based test (Spearman’s rank correlation = 0.15, Yule’s Q = −0.1), indicating that these tests flagged mostly different items as showing DIF. Again, the overall lowest agreement was found between MSTSIB and the four other tests. MSTSIB and the asymptotic score-based tests flagged different item sets as showing DIF (Spearman’s rank correlation = 0.04, Yule’s Q = −1.00). The correspondence between MSTSIB and the three other tests was slightly higher overall (Spearman’s rank correlations between 0.46 and 0.53, Yule’s Q = 1.0). This last result for Yule’s Q indicates that the item flagged as showing DIF by MSTSIB was among the DIF items labeled by these three other tests.
The results of testing DIF between cohort 2 and cohort 3 were comparable to those for cohorts 1 and 3. The logistic regression test detected DIF effects in 35 items (66.03%), whereas MSTSIB, again, found DIF in only one item (1.89%). The asymptotic score-based test detected DIF in 39 items (73.58%), whereas the bootstrap and permutation score-based tests found DIF in 24 (45.28%) and 25 (47.17%) items, respectively. The asymptotic score-based test showed an overall low agreement with the other DIF tests, with the lowest agreement found for MSTSIB (Spearman’s rank correlation = −0.05, Yule’s Q = −1.00). For the other three DIF tests, the agreement with the asymptotic score-based test was slightly higher (Spearman’s rank correlations between 0.11 and 0.12, Yule’s Q between −0.266 and 0.256). The one item flagged as a DIF item by MSTSIB was not among the items found by the logistic regression test or the permutation or bootstrap score-based tests, leading to an overall low agreement for these three pairs of DIF tests (Spearman’s rank correlations between 0.30 and 0.51, Yule’s Q = −1.00). The logistic regression test agreed overall well with the permutation and bootstrap score-based tests (Spearman’s rank correlations between 0.68 and 0.70, Yule’s Q between 0.79 and 0.86). As before, the highest agreement was found between the permutation and the bootstrap score-based tests (Spearman’s rank correlation > 0.99, Yule’s Q = 1.00).
Overall, the results for all DIF tests when comparing cohort 1 and 2 were in line with the simulation study, although the multistage design, as well as the application of the DIF test, differed between the simulation study and this empirical illustration. In particular, the person parameter estimates used in four DIF tests (logistic regression, MSTSIB, and the permutation/bootstrap score-based tests) were calculated based on maximum-likelihood estimates of the item parameters in the empirical example, whereas they were estimated based on the calibrated item parameters in the simulation study.
For the other two DIF scenarios (DIF between cohort 1 and cohort 3 and DIF between cohort 2 and cohort 3), we found a much higher rate of positive results for most DIF tests compared to the simulation study. These high rates might have been caused by real DIF effects but may also have been caused by the obvious differences in the multistage design between cohort 3 and the other two cohorts, which may have affected the psychometric characteristics of the items. It is plausible that these differences in psychometric characteristics led to a bias in the person parameter estimation, which, in turn, may explain the lower agreement between the five DIF tests in these scenarios compared to the simulation study.
In contrast to the simulation study, we also found that MSTSIB showed extremely conservative behavior in these scenarios, i.e. it detected very few DIF items. The contrast between this finding and the results of our simulation study and other studies (e.g., [15]) could be partly explained by the differences in the adaptive design in the focal and reference group and the presence of many DIF items. We feel that this finding should be further investigated in future research. However, since the person parameter estimates must be regarded as biased in the presence of many DIF items, this test cannot be recommended for such applications. A similar point applies to the logistic regression test, the permutation score-based test, and the bootstrap score-based test, all of which make use of the person parameter estimates. Instead, the asymptotic score-based test, which does not rely on person parameter estimates, is recommended as the most robust method for DIF detection in the presence of many DIF items.
4. General Discussion
The detection of DIF effects is an important part of the evaluation of MSTs, and this study evaluated five different statistical tests for this purpose. Using a simulation study, we found that all tests showed a type I error rate close to the nominal alpha level if DIF is absent. Importantly, the tests were not sensitive to a difference in the mean abilities of the focal and reference groups.
All tests were sensitive to uniform and non-uniform DIF effects, with MSTSIB being the least sensitive. These results are in line with [38], which reported that DIF tests based on logistic regression are more powerful than the SIBTEST in linear tests; contrasting results were reported in [39] for a different set of conditions. In addition, three of the five tests were applied to an empirical dataset from the Swiss CHECKS assessment.
Among our five tests, the bootstrap and permutation score-based tests are based on very similar concepts and were found to be essentially equivalent with regard to their type I error rates and power; therefore, we refer to these tests as the permutation/bootstrap score-based test in the remainder of this section. Because we also found an overall lower power of MSTSIB in the simulation study compared to the other tests, we limit our discussion to three methods: logistic regression, the asymptotic score-based test, and the permutation/bootstrap score-based test.
An important finding in our simulation study is that all of these tests showed an increased type I error rate if a large number of DIF items was present in the data, that is, items were incorrectly flagged as showing DIF. This finding is particularly important for interpreting the results in the empirical application, where very high rates of positive results were found under some scenarios. The reason for this might differ between the individual DIF tests. In the case of logistic regression and the permutation/bootstrap score-based test, the presence of a large amount of DIF items might lead to a bias in the person parameter estimates. As a consequence of this bias, there will be a systematic deviation between the observed responses and the response pattern that is expected based on the biased ability estimates, which can be expected to lead to this increased rate of false-positive results. The asymptotic score-based test, on the other hand, does not make use of the ability parameter estimates but only shows an increased type I error when a large portion of the items was affected by unbalanced DIF effects in the difficulty parameters. Conceptually, these tests are based on checking the stability of maximum likelihood estimates of the item parameters while accounting for differences in the ability levels of the focal and reference groups. We provide the following conceptual explanation for this increased type I error rate in this test. An unbalanced DIF effect in the difficulty parameter of a large portion of items is equivalent to a difference in the ability distribution for some items, and as a result, a portion of this DIF effect might be modeled as an ability difference between the focal and reference groups. However, this approach leads to a mismatch between the observed and expected data for DIF and non-DIF items alike, which could explain the high power and the increased type I error for this test.
On an abstract level, logistic regression, the asymptotic score-based test, and the permutation/bootstrap score-based test can be categorized based on several criteria. First, asymptotic and permutation/bootstrap score-based tests are based on the item parameters of IRT models, whereas logistic regression does not directly rely on the item parameters of an IRT model. Second, permutation/bootstrap score-based tests use the calibrated item parameters and can therefore be used in small samples if the person parameter estimates are sufficiently accurate. Asymptotic score-based tests do not use person parameter estimates but require the estimation of item parameters and therefore a sufficiently large sample. The logistic regression approach does not make use of item parameter estimates but uses person parameter estimates. Based on these conceptual differences and the reported simulation results, the following recommendations for practical applications seem to be in order:
If the sample is sufficiently large, asymptotic score-based tests can be used to test for DIF. Simulation studies (e.g., [21]) indicate that the sample size required by these tests depends on the used IRT model and the required power. While 200 respondents may be sufficient to apply these tests with the 2PL model in linear tests, larger samples usually increase their power. Similar results were reported in previous studies for linear tests [21], as well as for DIF tests, with respect to continuous covariates [6,32]. As shown in the simulation study that was inspired by an empirical large-scale study in education, responses may be unevenly distributed across the modules based on the psychometric characteristics of the items, so the power of these tests might depend on the chosen adaptive design. For specific adaptive designs, additional simulation studies may help to determine whether these tests have a type I error rate close to the alpha level and sufficiently large power. Of all tests considered here, asymptotic score-based tests also showed a type I error rate close to 0.05 in most conditions, which is another desirable result.
In small samples that do not allow for a sufficiently accurate estimation of item parameters, score-based permutation and bootstrap tests can be useful, in particular when few items are affected by DIF. Both tests are based on IRT models. Their application to other IRT models such as the three-parametric logistic model (3PL; [7]), models for polytomous items, and multidimensional IRT models [40] seem straightforward, but this is a topic for future research. Other interesting topics for future research include the evaluation of these DIF tests for other designs of multistage tests, other ratios of the focal and reference groups, or assessments with complex DIF patterns.
Our simulation study indicated that the logistic regression test is useful for the detection of DIF in the 2PL model. Since this test was proposed for DIF detection in 2PL models and the related, simpler one-parametric logistic (1PL) models, its usefulness can be expected to decrease when the items follow a more general IRT model; an explanation and further discussion are provided in [41]. For instance, Finch and French [39] reported an increased type I error rate in the 3PL model for logistic regression DIF tests.
As stated in the Introduction, item-wise DIF tests, such as the tests presented here, typically assume that the parameters of all items that are not investigated for DIF remain invariant. If more than one item shows a DIF effect, this assumption is violated, as pointed out in [42] and others. As shown in the simulation study, as well as the empirical application, a violation of this assumption can lead to an increased rate of false-positive results and a reduced agreement between the individual DIF tests. To address this problem, at least two approaches can be considered, of which the first is based on item anchoring and the second is based on purification strategies for the anchor. For score-based tests, the authors of [24] proposed a sequential item purification approach, where items that were found to shown DIF are iteratively removed from the item pool until no remaining item is found to show DIF. This approach can be applied with all five tests evaluated here and can be expected to reduce the rate of false-positive results reported in the presence of many DIF items.
Author Contributions
Conceptualization, R.D., D.D. and M.J.T.; methodology, R.D., S.A. and D.D.; software, R.D., S.A. and D.D.; validation, R.D., S.A., D.D. and M.J.T.; formal analysis, R.D., S.A. and D.D.; investigation, R.D., S.A. and D.D.; resources, R.D. and M.J.T.; data curation, R.D. and M.J.T.; writing—original draft preparation, R.D., S.A., D.D. and M.J.T.; writing—review and editing, R.D., D.D. and M.J.T.; visualization, R.D. and D.D.; supervision, M.J.T.; project administration, R.D.; funding acquisition, R.D. All authors have read and agreed to the published version of the manuscript.
Funding
This research was funded by Scientific Exchange Grant 186516 of the Swiss National Science Foundation.
Institutional Review Board Statement
Not applicable.
Informed Consent Statement
Not applicable.
Data Availability Statement
The empirical datasets reported in this study will not be made publicly available because northwestern Switzerland’s (i.e., the contracting authorities) four cantonal authorities own them. Requests to access the datasets should be directed to Martin Brändli ([email protected]). The code used for data generation and data analysis in the simulation studies is available at: https://osf.io/68ch7/?view_only=4e60e309f851447a9d73129dd7c4d577 (accessed on 28 May 2023).
Conflicts of Interest
The authors declare no conflict of interest.
References
- Yan, D.; Lewis, C.; Von Davier, A.A. Overview of Computerized Multistage Tests. In Computerized Multistage Testing: Theory and Applications; Yan, D., Von Davier, A.A., Lewis, C., Eds.; CRC Press: Boca Raton, FL, USA, 2014; pp. 3–20. [Google Scholar]
- van der Linden, W.J.; Glas, C.A. (Eds.) Elements of Adaptive Testing; Springer: Berlin/Heidelberg, Germany, 2010. [Google Scholar]
- Holland, P.W.; Wainer, H. Differential Item Functioning; Taylor & Francis: New York, NJ, USA, 1993. [Google Scholar]
- Strobl, C.; Kopf, J.; Zeileis, A. Rasch trees: A new method for detecting differential item functioning in the Rasch model. Psychometrika 2015, 80, 289–316. [Google Scholar] [CrossRef]
- Magis, D.; Béland, S.; Tuerlinckx, F.; De Boeck, P. A general framework and an R package for the detection of dichotomous differential item functioning. Behav. Res. Methods 2010, 42, 847–862. [Google Scholar] [CrossRef] [PubMed]
- Debelak, R.; Debeer, D. An Evaluation of DIF Tests in Multistage Tests for Continuous Covariates. Psych 2021, 3, 618–638. [Google Scholar] [CrossRef]
- Birnbaum, A. Some latent trait models and their use in inferring an examinee’s ability. In Statistical Theories of Mental Test Scores; Lord, F.M., Novick, M.R., Eds.; Addison-Wesley: Reading, MA, USA, 1968; pp. 392–479. [Google Scholar]
- OECD. PISA 2015 Technical Report; OECD Publishing: Paris, France, 2015. [Google Scholar]
- Mellenbergh, G.J. Contingency Table Models for Assessing Item Bias. J. Educ. Stat. 1982, 7, 105–118. [Google Scholar] [CrossRef]
- Steinberg, L.; Thissen, D. Using effect sizes for research reporting: Examples using item response theory to analyze differential item functioning. Psychol. Methods 2006, 11, 402–415. [Google Scholar] [CrossRef] [PubMed]
- Nandakumar, R.; Roussos, L. Evaluation of the CATSIB DIF procedure in a pretest setting. J. Educ. Behav. Stat. 2004, 29, 177–199. [Google Scholar] [CrossRef]
- Sadeghi, K.; Khonbi, Z.A. An overview of differential item functioning in multistage computer adaptive testing using three-parameter logistic item response theory. Lang. Test. Asia 2017, 7, 7. [Google Scholar] [CrossRef]
- Zwick, R. The Investigation of Differential Item Functioning in Adaptive Tests. In Elements of Adaptive Testing; van der Linden, W.J., Glas, C.A.W., Eds.; Springer: Berlin/Heidelberg, Germany, 2010; pp. 331–352. [Google Scholar] [CrossRef]
- Zwick, R.; Bridgeman, B. Evaluating Validity, Fairness, and Differential Item Functioning in Multistage Tests. In Computerized Multistage Testing: Theory and Applications; Yan, D., Von Davier, A.A., Lewis, C., Eds.; CRC Press: Boca Raton, FL, USA, 2014; pp. 271–284. [Google Scholar]
- Gierl, M.J.; Lai, H.; Li, J. Identifying differential item functioning in multi-stage computer adaptive testing. Educ. Res. Eval. 2013, 19, 188–203. [Google Scholar] [CrossRef]
- Shealy, R.; Stout, W. A model-based standardization approach that separates true bias/DIF from group ability differences and detects test bias/DTF as well as item bias/DIF. Psychometrika 1993, 58, 159–194. [Google Scholar] [CrossRef]
- Lei, P.W.; Chen, S.Y.; Yu, L. Comparing methods of assessing differential item functioning in a computerized adaptive testing environment. J. Educ. Meas. 2006, 43, 245–264. [Google Scholar] [CrossRef]
- Kristjansson, E.; Aylesworth, R.; Mcdowell, I.; Zumbo, B.D. A Comparison of Four Methods for Detecting Differential Item Functioning in Ordered Response Items. Educ. Psychol. Meas. 2005, 65, 935–953. [Google Scholar] [CrossRef]
- Hjort, N.L.; Koning, A. Tests for constancy of model parameters over time. J. Nonparametric Stat. 2002, 14, 113–132. [Google Scholar] [CrossRef]
- Zeileis, A. Implementing a Class of Structural Change Tests: An Econometric Computing Approach. Comput. Stat. Data Anal. 2006, 50, 2987–3008. [Google Scholar] [CrossRef]
- Debelak, R.; Strobl, C. Investigating Measurement Invariance by Means of Parameter Instability Tests for 2PL and 3PL Models. Educ. Psychol. Meas. 2019, 79, 385–398. [Google Scholar] [CrossRef]
- Merkle, E.C.; Zeileis, A. Tests of measurement invariance without subgroups: A generalization of classical methods. Psychometrika 2013, 78, 59–82. [Google Scholar] [CrossRef]
- Merkle, E.C.; Fan, J.; Zeileis, A. Testing for Measurement Invariance with Respect to an Ordinal Variable. Psychometrika 2014, 79, 569–584. [Google Scholar] [CrossRef] [PubMed]
- Wang, T.; Strobl, C.; Zeileis, A.; Merkle, E.C. Score-Based Tests of Differential Item Functioning via Pairwise Maximum Likelihood Estimation. Psychometrika 2018, 83, 132–155. [Google Scholar] [CrossRef]
- Glas, C.A.W. Detection of differential item functioning using Lagrange Multiplier tests. Stat. Sin. 1998, 8, 647–667. [Google Scholar]
- Glas, C.A.W. Item parameter estimation and item fit analysis. In Elements of Adaptive Testing; Van der Linden, W.J., Glas, C.A.W., Eds.; Springer: New York, NY, USA, 2010; pp. 269–288. [Google Scholar] [CrossRef]
- Little, R.J.; Rubin, D.B. Statistical Analysis with Missing Data; John Wiley & Sons: New York, NY, USA, 2002. [Google Scholar]
- Eggen, T.J.; Verhelst, N.D. Item calibration in incomplete testing designs. Psicológica 2011, 32, 107–132. [Google Scholar]
- Komboz, B.; Strobl, C.; Zeileis, A. Tree-Based Global Model Tests for Polytomous Rasch Models. Educ. Psychol. Meas. 2018, 78, 128–166. [Google Scholar] [CrossRef]
- Schneider, L.; Strobl, C.; Zeileis, A.; Debelak, R. An R toolbox for score-based measurement invariance tests in IRT models. Behav. Res. Methods 2022, 54, 2101–2113. [Google Scholar] [CrossRef] [PubMed]
- Wang, T.; Merkle, E.C.; Zeileis, A. Score-based tests of measurement invariance: Use in practice. Front. Psychol. 2014, 5, 438. [Google Scholar] [CrossRef]
- Debelak, R.; Debeer, D. Score-Based Measurement Invariance Tests for Multistage Testing (A Tale of Two and a Half Tests). In Proceedings of the International Workshop on Psychometric Computing Psychoco 2020, Dortmund, Germany, 25–26 February 2020. [Google Scholar]
- Magis, D.; Yan, D.; von Davier, A. mstR: Procedures to Generate Patterns under Multistage Testing. R Package Version 1.2. 2018. Available online: https://rdrr.io/cran/mstR/ (accessed on 28 May 2023).
- R Core Team. R: A Language and Environment for Statistical Computing; R Foundation for Statistical Computing: Vienna, Austria, 2019. [Google Scholar]
- Warm, T.A. Weighted likelihood estimation of ability in item response theory. Psychometrika 1989, 54, 427–450. [Google Scholar] [CrossRef]
- Chalmers, R.P. mirt: A multidimensional item response theory package for the R environment. J. Stat. Softw. 2012, 48, 1–29. [Google Scholar] [CrossRef]
- Reif, M.; Steinfeld, J. PP: Estimation of person parameters for the 1,2,3,4-PL model and the GPCM. R Package Version 0.6.2. 2019. Available online: https://rdrr.io/cran/PP/man/PP.html (accessed on 28 May 2023).
- Li, H.H.; Stout, W. A new procedure for detection of crossing DIF. Psychometrika 1996, 61, 647–677. [Google Scholar] [CrossRef]
- Finch, W.H.; French, B.F. Detection of Crossing Differential Item Functioning: A Comparison of Four Methods. Educ. Psychol. Meas. 2007, 67, 565–582. [Google Scholar] [CrossRef]
- Reckase, M. Multidimensional Item Response Theory; Springer: New York, NY, USA, 2009. [Google Scholar]
- DeMars, C.E. Type I Error Inflation for Detecting DIF in the Presence of Impact. Educ. Psychol. Meas. 2010, 70, 961–972. [Google Scholar] [CrossRef]
- Bechger, T.M.; Maris, G. A Statistical Test for Differential Item Pair Functioning. Psychometrika 2015, 80, 317–340. [Google Scholar] [CrossRef]
Figure 1.
The modules of the simulated multistage tests ordered by stage. For each module, the mean item difficulty parameter and the percentage of the overall sample working on this module is presented if the ability parameters are drawn from a normal distribution. In the simulations, 1% corresponds to about 200 test takers. For stages 2 to 4, paths through the multistage test are given.


Table 1.
Type I error rate per method for the simulated data in conditions with 16 DIF items and different types (balanced or unbalanced, uniform or non-uniform) of DIF effects.
Table 1.
Type I error rate per method for the simulated data in conditions with 16 DIF items and different types (balanced or unbalanced, uniform or non-uniform) of DIF effects.
| Method | bal., non-unif. | unbal., non-unif. | bal., unif. | unbal., unif. |
|---|---|---|---|---|
| Asymptotic SC test | 0.049 | 0.049 | 0.053 | 0.107 |
| MSTSIB | 0.055 | 0.056 | 0.063 | 0.079 |
| Logistic regression | 0.057 | 0.053 | 0.083 | 0.154 |
| Bootstrap SC test | 0.053 | 0.05 | 0.073 | 0.143 |
| Permutation SC test | 0.053 | 0.05 | 0.071 | 0.143 |
SC test = score-based test.
Table 2.
Type I error rate per method for the simulated data in conditions with 32 DIF items and different types (balanced or unbalanced, uniform or non-uniform) of DIF effects.
Table 2.
Type I error rate per method for the simulated data in conditions with 32 DIF items and different types (balanced or unbalanced, uniform or non-uniform) of DIF effects.
| Method | bal., non-unif. | unbal., non-unif. | bal., unif. | unbal., unif. |
|---|---|---|---|---|
| Asymptotic SC test | 0.046 | 0.052 | 0.059 | 0.253 |
| MSTSIB | 0.056 | 0.057 | 0.065 | 0.117 |
| Logistic regression | 0.055 | 0.061 | 0.116 | 0.326 |
| Bootstrap SC test | 0.053 | 0.057 | 0.095 | 0.315 |
| Permutation SC test | 0.052 | 0.057 | 0.095 | 0.314 |
SC test = score-based test.
Table 3.
Power per method for the simulated data in conditions with 16 DIF items and different types (balanced or unbalanced, uniform or non-uniform) of DIF effects.
Table 3.
Power per method for the simulated data in conditions with 16 DIF items and different types (balanced or unbalanced, uniform or non-uniform) of DIF effects.
| Method | bal., non-unif. | unbal., non-unif. | bal., unif. | unbal., unif. |
|---|---|---|---|---|
| Asymptotic SC test | 0.666 | 0.666 | 0.873 | 0.852 |
| MSTSIB | 0.141 | 0.131 | 0.284 | 0.292 |
| Logistic regression | 0.675 | 0.664 | 0.876 | 0.853 |
| Bootstrap SC test | 0.695 | 0.681 | 0.890 | 0.862 |
| Permutation SC test | 0.675 | 0.681 | 0.889 | 0.863 |
SC test = score-based test.
Table 4.
Power per method for the simulated data in conditions with 32 DIF items and and different types (balanced or unbalanced, uniform or non-uniform) of DIF effects.
Table 4.
Power per method for the simulated data in conditions with 32 DIF items and and different types (balanced or unbalanced, uniform or non-uniform) of DIF effects.
| Method | bal., non-unif. | unbal., non-unif. | bal., unif. | unbal., unif. |
|---|---|---|---|---|
| Asymptotic SC test | 0.651 | 0.606 | 0.855 | 0.832 |
| MSTSIB | 0.132 | 0.125 | 0.273 | 0.273 |
| Logistic regression | 0.661 | 0.628 | 0.870 | 0.833 |
| Bootstrap SC test | 0.677 | 0.647 | 0.882 | 0.857 |
| Permutation SC test | 0.675 | 0.645 | 0.881 | 0.859 |
SC test = score-based test.
Table 5.
Agreement between the dif tests in simulated data for conditions without DIF and groups of equal mean ability.
Table 5.
Agreement between the dif tests in simulated data for conditions without DIF and groups of equal mean ability.
| Method | As. SC test | MSTSIB | Log. regr. | Boot. SC test | Perm. SC test |
|---|---|---|---|---|---|
| As. SC test | 1.000 | 0.199 | 0.938 | 0.821 | 0.821 |
| MSTSIB | 0.447 | 1.000 | 0.204 | 0.250 | 0.250 |
| Log. regr. | 0.994 | 0.486 | 1.000 | 0.835 | 0.836 |
| Boot. SC test | 0.969 | 0.527 | 0.973 | 1.000 | 0.998 |
| Perm. SC test | 0.969 | 0.503 | 0.973 | 0.999 | 1.000 |
Entries above the diagonal report Spearman’s rank correlation between the p values of two DIF tests. Entries below the diagonal report Yule’s Q for the labeling of DIF items between two DIF tests. SC test = score-based test.
Table 6.
Agreement between the DIF tests in simulated data for conditions without DIF and groups of unequal mean ability.
Table 6.
Agreement between the DIF tests in simulated data for conditions without DIF and groups of unequal mean ability.
| Method | As. SC test | MSTSIB | Log. regr. | Boot. SC test | Perm. SC test |
|---|---|---|---|---|---|
| As. SC test | 1.000 | 0.099 | 0.885 | 0.630 | 0.630 |
| MSTSIB | 0.373 | 1.000 | 0.115 | −0.047 | −0.051 |
| Log. regr | 0.988 | 0.447 | 1.000 | 0.663 | 0.657 |
| Boot. SC test | 0.893 | 0.132 | 0.890 | 1.000 | 0.995 |
| Perm. SC test | 0.897 | 0.162 | 0.887 | 0.998 | 1.000 |
Entries above the diagonal report Spearman’s rank correlation between the p values of two DIF tests. Entries below the diagonal report Yule’s Q for the labeling of DIF items between two DIF tests. SC test = score-based test.
Table 7.
Agreement between the DIF tests in simulated data for conditions with balanced DIF in the a parameter.
Table 7.
Agreement between the DIF tests in simulated data for conditions with balanced DIF in the a parameter.
| Method | As. SC test | MSTSIB | Log. regr. | Boot. SC test | Perm. SC test |
|---|---|---|---|---|---|
| As. SC test | 1.000 | 0.232 | 0.935 | 0.851 | 0.852 |
| MSTSIB | 0.529 | 1.000 | 0.250 | 0.278 | 0.278 |
| Log. Regr | 0.996 | 0.547 | 1.000 | 0.869 | 0.869 |
| Boot. SC test | 0.987 | 0.579 | 0.989 | 1.000 | 0.998 |
| Perm. SC test | 0.987 | 0.594 | 0.989 | 1.000 | 1.000 |
Entries above the diagonal report Spearman’s rank correlation between the p values of two DIF tests. Entries below the diagonal report Yule’s Q for the labeling of DIF items between two DIF tests. SC test = score-based test.
Table 8.
Agreement between the DIF Tests in simulated data for conditions with unbalanced DIF in the a parameter.
Table 8.
Agreement between the DIF Tests in simulated data for conditions with unbalanced DIF in the a parameter.
| Method | As. SC test | MSTSIB | Log. regr. | Boot. SC test | Perm. SC test |
|---|---|---|---|---|---|
| As. SC test | 1.000 | 0.246 | 0.936 | 0.850 | 0.850 |
| MSTSIB | 0.505 | 1.000 | 0.256 | 0.279 | 0.280 |
| Log. regr | 0.997 | 0.507 | 1.000 | 0.866 | 0.866 |
| Boot. SC test | 0.989 | 0.526 | 0.989 | 1.000 | 0.998 |
| Perm. SC test | 0.988 | 0.520 | 0.988 | 1.000 | 1.000 |
Entries above the diagonal report Spearman’s rank correlation between the p values of two DIF tests. Entries below the diagonal report Yule’s Q for the labeling of DIF items between two DIF tests. SC test = score-based test.
Table 9.
Agreement between the dif tests in simulated data for conditions with balanced DIF in the b parameter.
Table 9.
Agreement between the dif tests in simulated data for conditions with balanced DIF in the b parameter.
| Method | As. SC test | MSTSIB | Log. regr. | Boot. SC test | Perm. SC test |
|---|---|---|---|---|---|
| As. SC test | 1.000 | 0.288 | 0.884 | 0.829 | 0.829 |
| MSTSIB | 0.661 | 1.000 | 0.311 | 0.333 | 0.333 |
| Log. regr | 0.992 | 0.616 | 1.000 | 0.873 | 0.873 |
| Boot. SC test | 0.986 | 0.636 | 0.989 | 1.000 | 0.998 |
| Perm. SC test | 0.987 | 0.644 | 0.989 | 1.000 | 1.000 |
Entries above the diagonal report Spearman’s rank correlation between the p values of two DIF tests. Entries below the diagonal report Yule’s Q for the labeling of DIF items between two DIF tests. SC test = score-based test.
Table 10.
Agreement between the DIF Tests in simulated data for conditions with unbalanced DIF in the b Parameter.
Table 10.
Agreement between the DIF Tests in simulated data for conditions with unbalanced DIF in the b Parameter.
| Method | As. SC test | MSTSIB | Log. regr. | Boot. SC test | Perm. SC test |
|---|---|---|---|---|---|
| As. SC test | 1.000 | 0.299 | 0.920 | 0.871 | 0.871 |
| MSTSIB | 0.578 | 1.000 | 0.330 | 0.331 | 0.334 |
| Log. regr | 0.990 | 0.546 | 1.000 | 0.904 | 0.904 |
| Boot. SC test | 0.980 | 0.566 | 0.986 | 1.000 | 0.998 |
| Perm. SC test | 0.981 | 0.568 | 0.987 | 0.999 | 1.000 |
Entries above the diagonal report Spearman’s rank correlation between the p values of two DIF tests. Entries below the diagonal report Yule’s Q for the labeling of DIF items between two DIF tests. SC test = score-based test.
Table 11.
Administered number of items per cohort in the empirical application.
| Number | Administered in... | Possible DIF | ||
|---|---|---|---|---|
| Cohort 1 | Cohort 2 | Cohort 3 | ||
| 7 | Yes | |||
| 40 | Yes | Yes | 1 vs. 2 | |
| 48 | Yes | Yes | Yes | 1 vs. 2 vs. 3 |
| 10 | Yes | Yes | 1 vs. 3 | |
| 5 | Yes | Yes | 2 vs. 3 | |
| 10 | Yes | |||
| 99 | Yes | |||
| 219 | 105 | 103 | 162 | |
Disclaimer/Publisher’s Note: The statements, opinions and data contained in all publications are solely those of the individual author(s) and contributor(s) and not of MDPI and/or the editor(s). MDPI and/or the editor(s) disclaim responsibility for any injury to people or property resulting from any ideas, methods, instructions or products referred to in the content. |
© 2023 by the authors. Licensee MDPI, Basel, Switzerland. This article is an open access article distributed under the terms and conditions of the Creative Commons Attribution (CC BY) license (https://creativecommons.org/licenses/by/4.0/).
Share and Cite
MDPI and ACS Style
Debelak, R.; Appelbaum, S.; Debeer, D.; Tomasik, M.J. Detecting Differential Item Functioning in 2PL Multistage Assessments. Psych 2023, 5, 461-477. https://doi.org/10.3390/psych5020031
AMA Style
Debelak R, Appelbaum S, Debeer D, Tomasik MJ. Detecting Differential Item Functioning in 2PL Multistage Assessments. Psych. 2023; 5(2):461-477. https://doi.org/10.3390/psych5020031
Chicago/Turabian StyleDebelak, Rudolf, Sebastian Appelbaum, Dries Debeer, and Martin J. Tomasik. 2023. "Detecting Differential Item Functioning in 2PL Multistage Assessments" Psych 5, no. 2: 461-477. https://doi.org/10.3390/psych5020031