Next Article in Journal
Exploring Approaches for Estimating Parameters in Cognitive Diagnosis Models with Small Sample Sizes
Next Article in Special Issue
Developing Psycho-Behavioural Skills: The Talent Development Coach Perspective
Previous Article in Journal / Special Issue
Improvement of the Learning Strategies of University Students through a Program Based on Service-Learning
 
 
Please note that, as of 22 March 2024, Psych has been renamed to Psychology International and is now published here.
Article

Adaptation and Validation of the Arabic Version of the University Student Engagement Inventory (A-USEI) among Sport and Physical Education Students

1
Higher Institute of Sport and Physical Education of Kef, University of Jendouba, Jendouba 7100, Tunisia
2
Department of Education, Higher Institute of Sport, and Physical Education of Sfax, University of Sfax, Sfax 3000, Tunisia
3
Department of Health Sciences (DISSAL), Postgraduate School of Public Health, University of Genoa, 16126 Genoa, Italy
4
Group for the Study of Development and Social Environment (GEDES), Faculty of Human and Social Science of Sfax, Sfax 3000, Tunisia
5
Department of Educational Foundations, University of Education, Winneba P.O. Box 25, Ghana
6
Department of Health: Physical Education and Recreation, University of Cape Coast, Cape Coast PMB TF0494, Ghana
7
Neurocognition and Action-Biomechanics-Research Group, Faculty of Psychology and Sports Science, Bielefeld University, Postfach 10 01 31, 33501 Bielefeld, Germany
8
Department of Health, Physical Education, Recreation and Sports, University of Education, Winneba P.O. Box 25, Ghana
9
Department of Health and Nursing Science, Faculty of Social and Health Studies, Inland Norway University of Applied Sciences, 2406 Elverum, Norway
10
Department of Health: Faculty of Health Studies, VID Specialized University, 4304 Sandnes, Norway
11
Department of Education, Higher Institute of Sport, and Physical Education of Gafsa, University of Gafsa, Gafsa 2100, Tunisia
*
Author to whom correspondence should be addressed.
Psych 2023, 5(2), 320-335; https://doi.org/10.3390/psych5020022
Submission received: 3 March 2023 / Revised: 11 April 2023 / Accepted: 21 April 2023 / Published: 26 April 2023
(This article belongs to the Special Issue Feature Papers in Psych)

Abstract

:
The present study validated the University Student Engagement Inventory (USEI) in the Arabic language (A) by assessing its factor structure, construct validity, reliability, and concurrent validity. A total of 864 Tunisian Physical Education and Sport students provided data which was used to perform exploratory and confirmatory factor analyses, using samples comprising 366 (aged 19–25 years) and 498 (aged 19–26 years) students, respectively. The A-USEI, grade-point average (GPA), and Physical Education Grit (PE–Grit) scales were completed via online surveys. The exploratory factor analysis revealed that the A-USEI had three dimensions. The confirmatory factor analysis indicated that the second-order model was more suitable than the first-order multi-factor model. Using the indicators for the second-order model, the three factors showed good reliability, with their average variance extracted (AVE) values reflecting sufficient validity. The correlation analyses between the two scales’ scores and the A-USEI scores showed a moderate correlation, confirming the adapted scale’s concurrent validity. The study concludes that A-USEI is a valid tool for assessing student engagement among Arabic students. In addition, the practical implications and directions for future research are discussed.

1. Introduction

One of the most prominent subjects in current educational research is the exploration of pedagogy in universities and other higher-education institutions, and how it relates to academic achievement [1]. In recent years, research focused on factors influencing students’ perceptions of successful learning, the development of students’ critical thinking, the teaching perspectives of university faculties, and pedagogical techniques and interventions [2], and academic success has begun to emerge. Therefore, student engagement is an emerging area of research worldwide.
The concept of engagement has been extensively discussed through the use of the Engagement Theory, which stipulates that when conditions are appropriate, people engage in their work [3]. Engagement is defined as a motivational concept and is described as “the simultaneous employment and expression of a person’s ‘preferred self’ in task-related behaviors that promote connections with work and others, personal presence (physical, cognitive, and emotional), and active and complete role performance” [3]. Thus, the individual is vigorously, emotionally, and psychologically present at the time of role performance [4].
The most well-known conceptualization of engagement was outlined by Schaufeli et al. [5], who described it as a positive, fulfilling, and work-related mindset characterized by absorption, dedication, and vigor. Vigor is marked by mental resilience, persistence against obstacles, and a higher energy level [5,6]. Dedication refers to a sense of self-worth, inspiration, and pride [7], while absorption refers to total concentration and a state of total immersion in the activity related to the task at hand [8,9].
Within educational settings, the Engagement Theory assumes that students must be engaged in their courses to learn effectively [10,11,12,13]. This definition is based on the pioneering work of Wellborn [14]. Similarly, student engagement refers to the active participation of students in effective educational practices and engagement in learning and educational objectives, and it is an essential means of achieving excellent academic results [15,16,17,18]. According to Kuh and Hu [19], student engagement is how students strive to carry out educational activities to achieve desired outcomes. An alternative definition of engagement was provided by Krause [20], who argued that engagement comprises the energy, time, and resources used for activities to increase learning at the university. Subsequently, the focus of research began to move to student behavior during classroom tasks and participation in academic work [21,22].
In relation to Physical Education (PE) and in compliance with UNESCO (United Nations Educational, Scientific and Cultural Organization), student engagement appears to be essential to achieving the goals of curricula around the world, and it is demonstrated by physically competent and educated individuals [23]. This means that it is reasonable to assume that an individual achieves high levels of motor competence, accumulates moderate-to-vigorous levels of health-enhancing physical activity, and absorbs knowledge related to physical fitness and movement performance through some level of engagement in classroom activities. In fact, according to Hastie et al., a quick literature search using the terms “physical education” and “engagement” yields over 3000 results [24].
From the perspective of sports pedagogy, some researchers have developed an extensive survey of the concept of learner engagement, with the goal of examining how it is conceptualized, as well as the scope and nature of research [25,26]. Along with this perspective, investigations have linked Physical Education teachers and their teaching styles to students’ engagement and motivation in Physical Education [27,28,29]. Researchers have shown that the teaching styles of Physical Education teachers can substantially shape climates of positive motivation [30], which appears to predict the satisfaction of students’ basic psychological needs [27,31], the quality of their motivation [32,33], and their intentions and engagement in physical activity [30,34].
The Utrecht Work Engagement Scale (UWES) [35] is probably one of the widest-used and most frequently cited instruments for assessing work engagement. The initial version of the UWES consisted of 17 items (UWES-17) [5] and had three sub-dimensions: absorption (six items), dedication (five items), and vigor (six items). Subsequently, a 15-item revised version (UWES-15) was developed by removing two items of concern [35]. Thereafter, the original authors [36] selected the most typical items of the original UWES to develop the short nine-item version (UWES-9), incorporating three items for every dimension. Although prior studies supported reasonable psychometrics in terms of both construct validity and internal consistency for the UWES-17, the UWES-9 has proven to be a very useful tool for researchers [5,37,38], and was found to have stronger factorial validity [39,40]. Given the strong inter-correlations across the three UWES sub-dimensions, Schaufeli et al. [36] advocated the use of the composite score as a predictor of aggregate engagement, which involves the potential for single-factor UWES constructs.
For the same purpose of measuring engagement among university students, other instruments have also been developed, such as the Student–Faculty Engagement (SFE) [41] instrument, the Utrecht Work Engagement Scale–Student Version (UWES-SS) [5], which was designed to measure professional engagement in a student population, and the National Survey of Student Engagement (NSSE, 2016) [42]. Although the NSSE is one of the most widely used instruments for measuring student engagement, it has been strongly criticized for its poor psychometric properties [43,44] and emphasis on the habits of learners rather than the psychological characteristics that underpin the concept of engagement [45].
Recently, a new tool, the University Student Engagement Inventory (USEI) [46], was developed to assess student engagement. In line with Fredricks’ conceptualization [47], the USEI is based upon both a first-order conceptualization of engagement, making it a multidimensional construct that includes cognitive, emotional, and behavioral dimensions, and a second-order construct (engagement) comprising the three first-order dimensions [48]. Although the USEI is quite recent, its psychometric properties have been widely assessed in Portugal [46,49], Italy [48], and other countries [50]. These previous studies showed how the USEI can generate adequate factorial validity (i.e., considering both the three-factor and second-order models), reliability, and convergent–discriminant validity for all three dimensions. In addition, the USEI exhibits robust metric invariance across both genders and fields of study and significantly predicts educational outcomes. Overall, these results demonstrate the adequate internal structural validity of the USEI and a significant relationship between the measure’s scores and certain important academic issues.
Further, studies regarding the validation and cross-cultural adaptation of the USEI have yielded similar results. While these studies confirmed and maintained the original structure of the USEI, other scholars have argued that the tool has a second-order structure. Additionally, the three factors of the constructed model showed good reliability. For example, a study was carried out with Chilean Engineering students [51], and another cross-cultural validation was performed in Spanish, with Spanish, Argentinian, and Uruguayan students [52]. Moreover, a version of the USEI was validated with Turkish university students [53]. In this study, the USEI was used because it is specifically designed to measure student engagement in academic settings, and thus, makes the inventory the most appropriate instrument for our research question.
Despite the strong psychometric characteristics of the USEI, the need for improvement has emerged from previous studies. It has been observed that the behavioral dimension is the most significant factor in the overall USEI score, and some items have low factor loadings [50]. It is important for continuous calibration to further evaluate consistently non-functioning items and factors. Moreover, there is a need to understand the model structure of the USEI within the Tunisian context, given that the inventory can assume both first-order and second-order structures [48]. The implications are that participants with little understanding of the English language might misinterpret the items, leading to inaccurate responses [54,55]. The translation of the USEI provides insights into the reproducibility of the inventory across different cultures [56]. Besides, language and culture are closely related, hence the meaning of items on the USEI may change depending on the language used and the cultural setting [57]. In general, individuals are attached to their language and, as a result, are likely to respond enthusiastically to the survey instrument in their language.
To date, there seems to be no Arabic version of the USEI, and the studies that have adopted this scale in the Arabic context administer it using the English language. Additionally, considering the importance of student engagement in higher education and the lack of a validated Arabic version of the USEI for Sport and Physical Education students in the Arab region, it is necessary to conduct this study to provide a culturally suitable tool to assess student engagement and inform educational practices in this specific context It is worth mentioning that the various validations of the USEI are based on very limited data, with the number of cross-cultural validations somewhat restricted. This research examined the psychometric properties of an Arabic-translated version of the USEI using a sample of university students of Physical Education in Tunisia, focusing on the USEI’s factor structure, construct validity, and concurrent validity.

2. Materials and Methods

2.1. Study Design

We adopted a validation study as the research design. This design was suitable because of its rigorous scientific steps, from the planning phase to the estimation of the sample size, collection of the data, and assessment of the reliability and validity with different statistical tools [58]. While the use of a cross-sectional survey design is prevalent in recent validation studies [59,60,61,62], the use of validation study as a research design is gaining attention in the literature [63,64]. Moreover, the main difference between these two designs is that validation studies focus on assessing the psychometric properties of a measurement tool [65], whereas cross-sectional studies describe and analyse the prevalence and distribution of a phenomenon in a population at a specific point in time [66].

2.2. Participants and Data Collection

The researchers obtained from the Institute of Physical Education and Sport of Kef-Tunisia ’s administration a list of all students enrolled in the bachelor’s degree program at the Institute. Through randomly sampling, 864 students from this list were selected to participate in the study using the Table of Random Numbers approach. Participants received invitations to participate through social-networking sites (Facebook) and electronic mail. An e-form was set up online utilizing the survey portal, Google Forms®. The students who participated in this study were classified according to their level of study: students enrolled in their first year (n= 307; 35.89%), second year (n = 339; 39.18%) and third year (n = 218; 24.93%).
Participants ranged in age from 19 to 26 years. The average age of the participants was 20.85 ± 1.36 years. The number of female (n = 458; 53.26%) and male (n = 406; 46.73%) participants were similar. Participants enrolled in the survey were randomly assigned to two groups for the exploratory and confirmatory studies. The primary group data, which was used for conducting exploratory factor analysis, comprised 366 students aged 19–25 years (M = 20.76 ± 1.39), including 54.92% females (n = 201) and 45.08% males (n = 165). The sample-size selection for the exploratory factor analysis was guided by the recommendation of Comrey and Lee [67], who suggested that a minimum of 300 cases is a good sample with which to execute the EFA. The remaining sample of 498 students was used for the confirmatory factor analysis, with an age distribution of 19–26 years (M = 20.95 ± 1.34), and a gender distribution of 48.39% and 51.61% male (n = 241) and female (n = 257) students, respectively. For the confirmatory factor analysis, the sample size was considered sufficient to estimate the parameters accurately [68].

2.3. Measures

The variables age and gender were treated as baseline demographic characteristics in this study. Other measures were also used to conceptualize the major variables in the study, namely, grade-point average (GPA), the University Student Engagement Inventory (USEI), and the Physical Education Grit scale (PE–Grit). These measures are described in subsequent sub-sections.

2.3.1. Grade-Point Average (GPA)

The grade-point average is the mean of all final scores for courses within a program, weighted by the unit value of each course. This unit score ranges from 0 to 20, with higher values depicting better academic achievement and lower values signifying poor academic attainment on the specified courses. Usually, the classification system is used to place the GPA within five categories, as follows:
-
Under 10: GPA ranges from 0 to 9.99.
-
10–11.99: GPA ranges from 10 to 11.99.
-
12–13.99: GPA ranges from 12 to 13.99.
-
14–15.99: GPA ranges from 14 to 15.99.
-
16–20: GPA ranges from 16 to 20.

2.3.2. The University Student Engagement Inventory (USEI)

The USEI [46] is a tool to assess university students’ engagement and is measured on a Likert-type self-report scale, with responses ranging from 1, for “never,” to 5, for “always.” The scale consists of 15 items divided into three dimensions of school engagement: emotional (EE), behavioral (BE), and cognitive (CE). The inventory has shown acceptable reliability and good evidence for both convergent and discriminant factorial validity in previous studies [46]. Reliability coefficients in terms of item consistency were above 0.63 for all three dimensions.
In this study, the English version of the USEI was used and translated into the Arabic Language (see Appendix A), following the International Test Commission’s guidelines for cross-cultural-test adaptation of the Hambleton [69] method to improve its comprehension by Tunisian students. The translated scale evolved from a set of focus-group meetings with university professors. Four male and female academic educators/researchers formed the focus group. To identify possible issues related to problems with the cultural context, a discussion was held by the focus group, and a pre-test was conducted on a group of students (n = 10) to assess comprehension of the items.

2.3.3. Physical Education Grit Scale (PE–Grit)

The Physical Education Grit (PE–Grit) scale [59] is a measurement scale consisting of 16 items in Arabic, which measures grit across four dimensions, each consisting of four items: physical-activity interest, interest in academic studies, physical-activity effort, and academic effort. The internal-consistency indices of McDonald’s ω/Cronbach’s α for the PE–Grit’s four dimensions ranged from 0.83 to 0.86. They were scored on a 7-point Likert scale, from 0, for strongly disagree, to 6, for strongly agree.

2.4. Ethical Statement

The present study received approval from the local Ethics Committee of the Institut supérieur du sport et de l’éducation physique d’El Kef, Université de Jendouba, Jendouba, Tunisie. Additionally, the research was deemed to comply with the legal norms of the Declaration of Helsinki 2013 and its corresponding amendments. An informed consent form was received and completed by each participant before administering the questionnaires. On this consent form, the participants were advised that there was no obligation to take part in the research, and that refusal to participate would not need to be explained.

2.5. Statistical Analysis

First, in the exploratory phase, we tested the normality of the data using the skewness and kurtosis tests. If skewness values were greater than ±7 or kurtosis values were greater than ±3, we considered the data to be non-normal with low psychometric sensitivity. In addition, we checked for multivariate and univariate normality during the confirmatory phase, using Mardia’s coefficient. For exploratory factor analysis, which was performed through parallel analysis [70], the unweighted least squares with direct Promax rotation were utilised. To determine whether the data were appropriate for factor analysis, we evaluated the Kaiser–Meyer–Olkin (KMO) statistics [71]. According to Hair et al. (2014)’s recommendations, the KMO value has to be greater than 0.50 for the factorial solution to be acceptable [72]. We also calculated the chi-square value of Bartlett’s test of sphericity [71], which had to be significant. Factors with an eigenvalue greater than 1 and items with a factor load of less than 0.5, as determined by examining the scree plot, were retained [73]. Additionally, Pearson Product Moment correlation tests were used to examine and measure the strength and direction of the linear relationship among the continuous variables [74]. The purpose was to explore the concurrent validity of the A-USEI by examining its degree of association with other measures such as academic achievement (GPA) and PE–Grit.
Regarding to the confirmatory factor analysis, first-order and second-order analyses were performed, and the models were compared using the model-fit indices. The optimal model was selected, and its specific indicators were studied to evaluate the construct validity. To assess the reliability of the instrument, we calculated Cronbach’s alpha internal-consistency coefficient [75]. Values greater than 0.70 were considered acceptable, values greater than 0.80 was considered good, and those between 0.90 and 0.95 were considered excellent [76]. The average variance extracted (AVE) estimates were calculated to supplement the construct-validity evidence of the inventory. The AVE reflects the amount of variance explained by the trait relative to the variance through the measurement error. The ideal AVE value should not be less than 0.50.
We used SPSS for Windows, version 26 (IBM Corps., Armonk, NY, USA), to conduct descriptive statistical analyses of item distributions and internal-consistency indices. For exploratory (EFA) and confirmatory factor analyses (CFA), we used the Laavan package of the open-source software R. Hu and Bentler (1999) proposed that Comparative Fit Indices (CFI) and Tucker-Lewis Index (TLI) values greater than 0.95 and Root Mean Square Error of Approximation (RMSEA) values less than 0.08 indicate a good fit for CFA indices, as well as lower values for log likelihood ratio (LLR), Akaike information criterion (AIC), and Bayesian information criterion (BIC) [77].

3. Results

Table 1 displays descriptive statistics, such as the means, standard deviations, and the skewness and kurtosis normality coefficients, together with the lambda factor loadings for each element across all the dimensions of the Arabic USEI (A-USEI). The coefficients of normality provide evidence for the hypothesis that the distributions would not deviate from the normal distribution.

3.1. Exploratory Factor Analysis: Factor Structure

The results indicated that the scale is appropriate for performing factor analyses. The KMO = 0.959, while the Bartlett’s test of sphericity was significant: χ2 (105) = 2769.09, p < 0.001.
We conducted a parallel analysis on 1000 simulated random data sets and used EFA with Promax rotation to determine the eigenvalues, which indicated a three-factor solution (behavioral engagement, cognitive engagement, and emotional engagement). The factorial solution explained 54.90% of the total variance, with the first factor explaining 47.80%, the second factor explaining 3.70%, and the third factor explaining 3.40% of the total variance (see Figure 1).

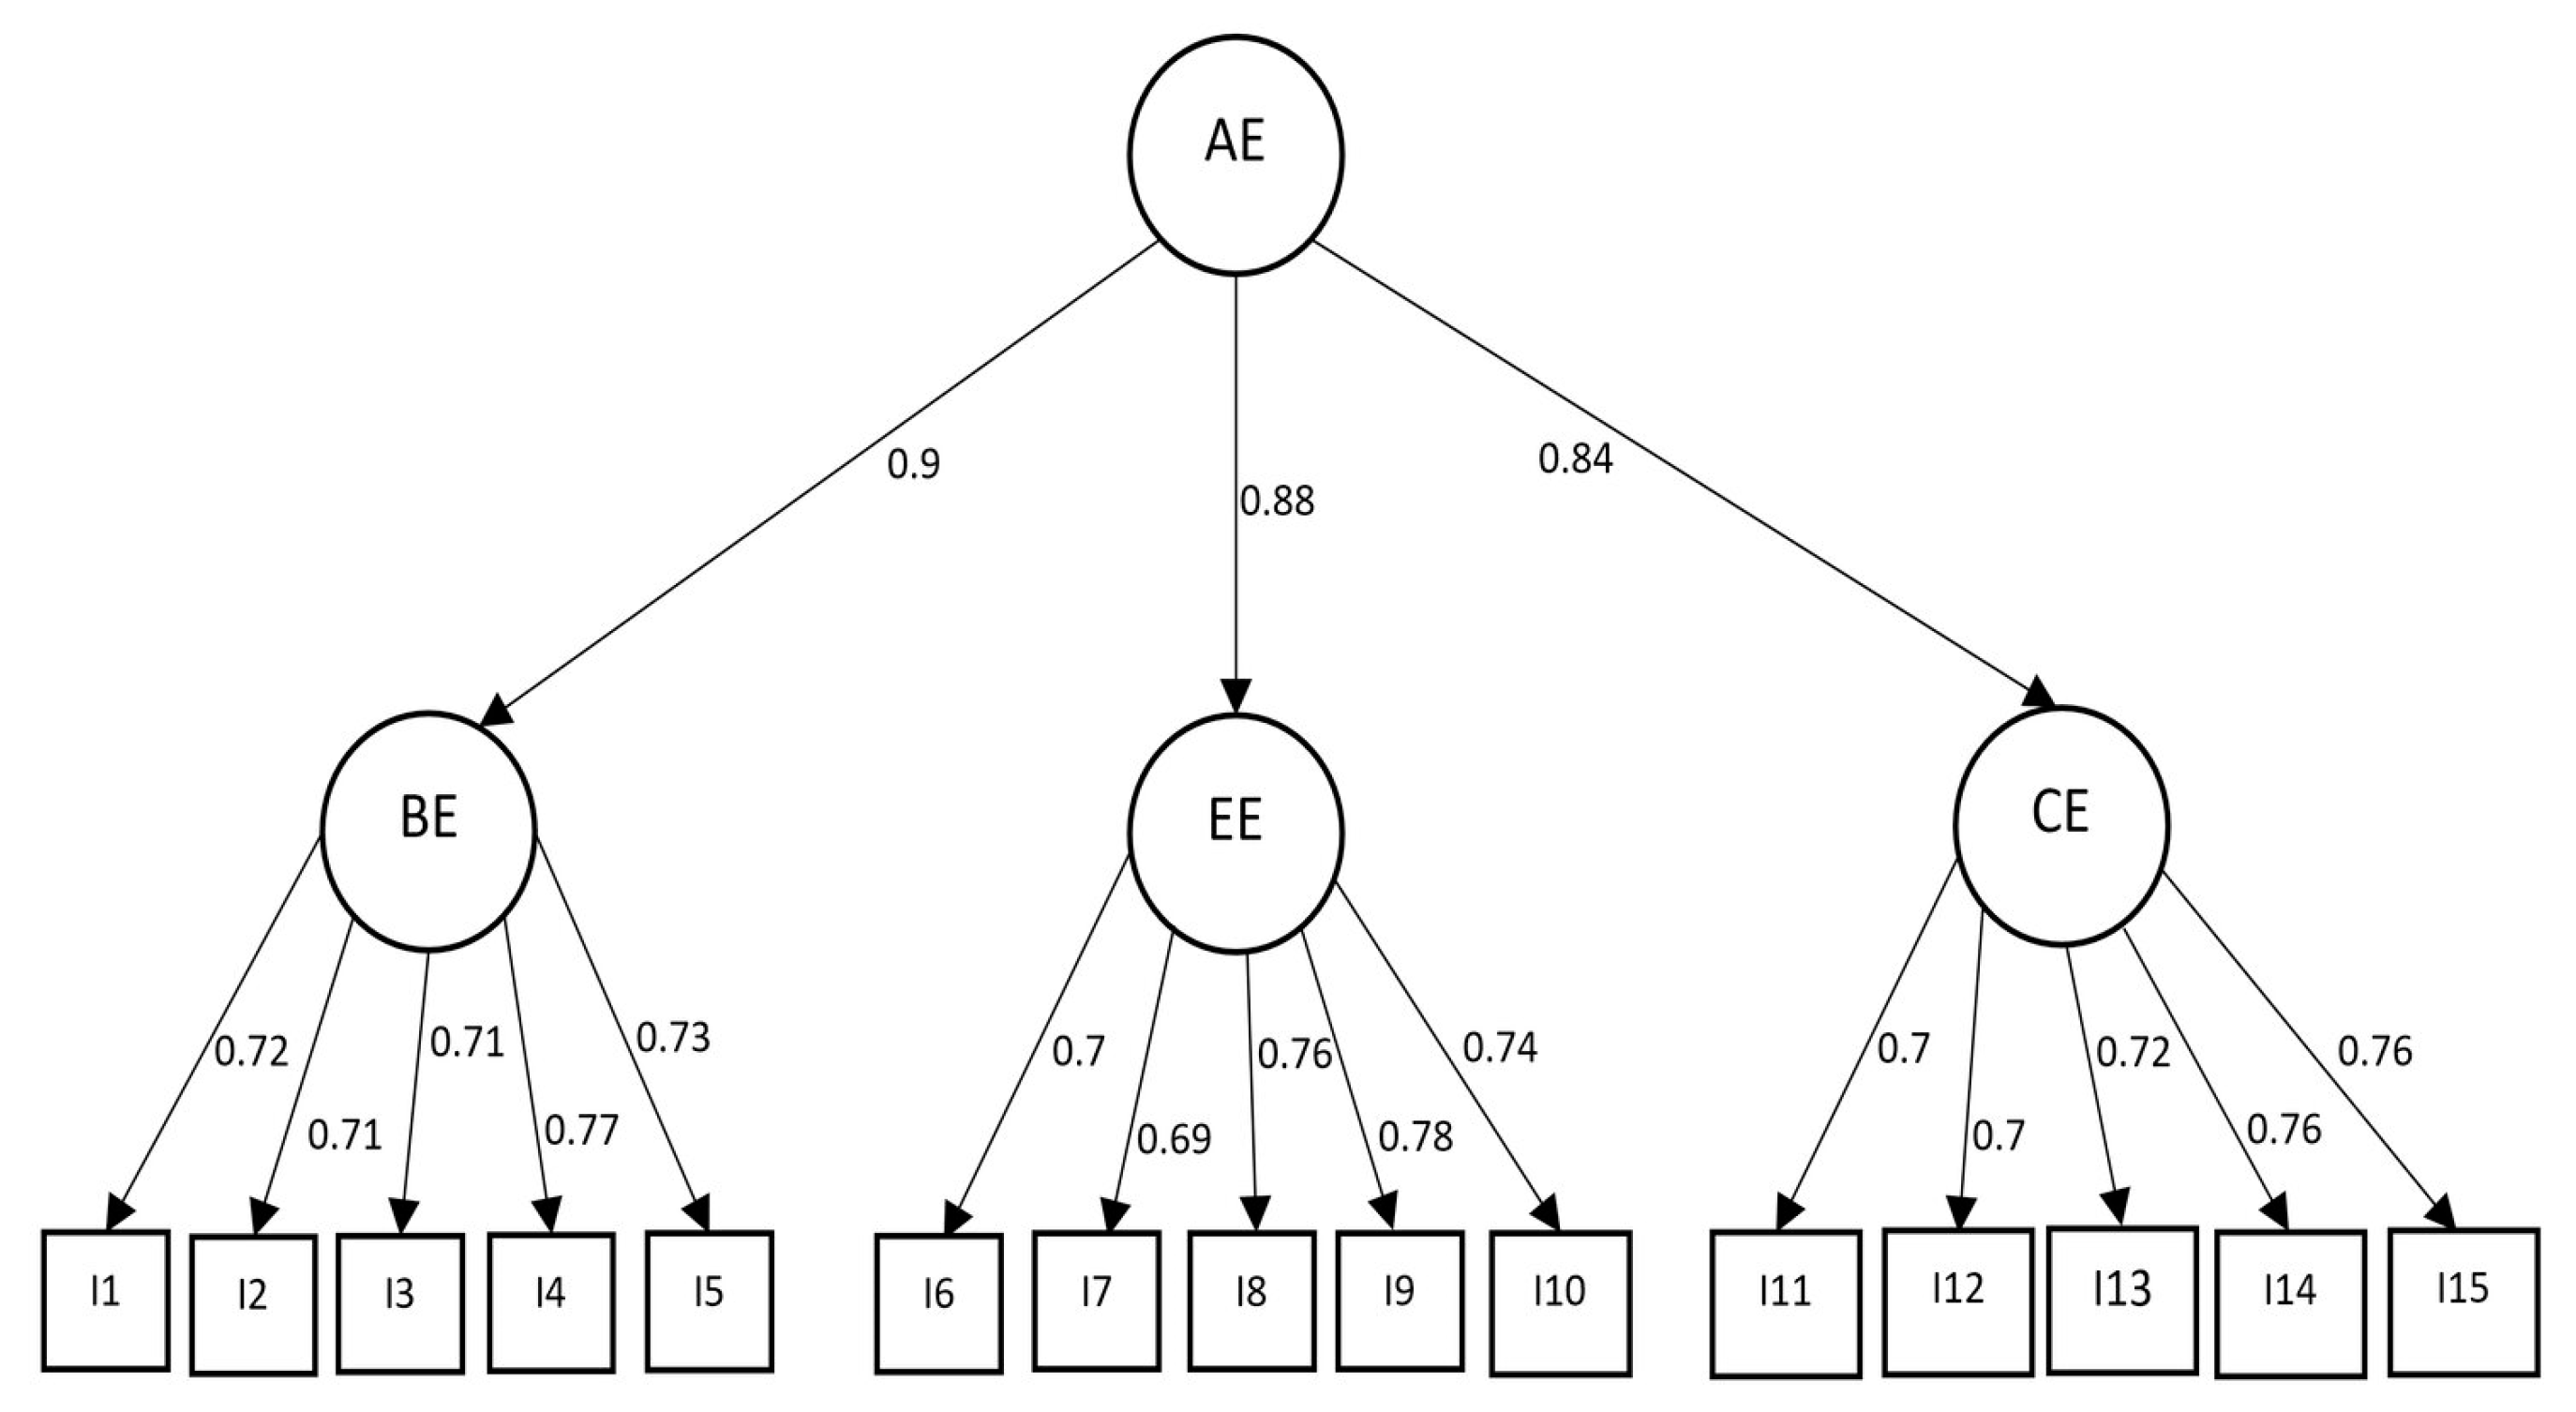
3.2. Confirmatory Factor Analysis: Construct Validity

Before proceeding with the confirmatory factor analysis, we performed univariate and multivariate normality tests. The results indicated that the item distribution was Gaussian (as shown in Table 2). However, the multivariate Mardia normality coefficient revealed skewness and kurtosis values of 904.76 and 5.19, respectively, indicating that the multivariate normality assumption was not satisfied. It should be noted that the Mardia coefficient is sensitive to sample size.
Following the preliminary analysis, two confirmatory-factor-analysis models were fitted, as earlier indicated. The first-order model had 15 items with three dimensions, and the dimensions were correlated. Similarly, the second-order model had 15 items, with three sub-scales, all of which reflected a general abstract construct, academic engagement. Comparing the two models, it was revealed that the second-order model (e.g., GFI = 0.960; CFI = 0.981; AGFI = 0.946; χ2/df = 1.2; TLI = 0.977; RMSEA = 0.04, SRMR = 0.041; AIC = 13,284; BIC = 13,915; LLR = −1032.03; see Figure 2) was superior to the first-order model (e.g., GFI = 0.940; CFI = 0.947; RMSEA = 0.06, SRMR = 0.067 AIC = 17,043; BIC = 17,322; LLR = −11,789.02). According to Hu and Bentler (1999), the following are commonly accepted cut-off values for model-fit indices: the goodness-of-fit index (GFI), where values above 0.90 indicate an acceptable fit, and values above 0.95 indicate a good fit; the standardized mean square residual (SRMR), where values lower than 0.10 indicate an acceptable fit, and values lower than 0.05 indicate a good fit; and the root mean square error of approximation (RMSEA), where values lower than 0.08 indicate an acceptable fit, and values lower than 0.05 indicate a good fit [77]. Given these results, we focused on the specific indicators in the second-order model. It should be noted that we used the maximum likelihood as an estimator to perform the CFA.
The AVE estimates were calculated, in addition to the factor-loading indices, to strengthen the evidence for the construct validity. Following the Fornell–Larcker criterion. AVE values of 0.7 or higher were deemed highly satisfactory, and a value of 0.5 was considered acceptable. The AVE values for the BE, EE, and CE were 0.531, 0.539, and 0.530, respectively.

3.3. Reliability Analysis

The internal consistency (Cronbach’s alpha) coefficients based on the CFA data were 0.858, 0.842, and 0.863 for the behavioral engagement (BE), emotional engagement (EE), and cognitive engagement (CE) dimensions respectively. In addition, the corrected item–total correlation varied from 0.66 to 0.71 for the BE, from 0.61 to 0.68 for the EE, and from 0.65 to 0.72 for CE, and demonstrated good scale reliability. Additionally, all 15 items on the scale provided an alpha value of 0.931 (see Table 3).

3.4. Concurrent Validity

All the components of the scale and the total scale score were moderately correlated with GPA. Similarly, the A-USEI score and its total were moderately correlated with the physical interest (PHI), academic interest (AI), and academic effort (AE) on the PE–Grit scale. However, a weak positive correlation was found between physical effort (PHE) and academic effort (see Table 4). An interesting point to note is that the general construct (i.e., student engagement) was significantly associated with the GPA, PHI, PHE, AI, and AE in a similar fashion to the dimensions of student engagement.

4. Discussion

The objectives of this study were to adapt and validate the University Student Engagement Inventory (USEI) in the Arabic language for Tunisian university Physical Education and Sport students, in terms of the A-USEI’s factor structure, reliability, construct validity, and criterion validity. The exploratory factor analysis suggested a three-factor structure; moreover, no elements were removed from the measurement scale. The internal-consistency indices and corrected item–total correlation were used to assess the reliability of the instrument. The results indicated that all three dimensions of the instrument were reliable and accurately represented the concepts. Subsequently, the confirmatory factor analysis suggested a second-order structure with adequate fit indices. The construct validity of the measurement instrument was established. The interaction of the three dimensions of the tool and its total score with the GPA and the PE–Grit scale showed positive associations, ranging from weak to moderate, supporting the concurrent validity of the Arabic version of the scale.
The results found were aligned with the psychometric properties of the initial version of the USEI in terms of the factorial stability, the reliability of the scale, and its convergent validity. This finding was also supported by an adapted version in Iran, which suggested a three-factor structure of the P-USEI, with 15 items and a second-order academic engagement component and adequate reliability [78]. Similarly, the robust psychometric properties of the USEI have been demonstrated across nine countries in Europe, North and South America, Africa, the United States of America, and Asia using students’ samples. The Cronbach’s alpha and McDonald’s omega internal consistency coefficients established the reliability of the instrument. In addition, the USEI scores were related to self-rated academic achievement [50]. Comparing the results of our study with those of Albornoz et al. [51], who specifically focused on Engineering students in Chile using the USEI, the results from their study showed that the USEI had good psychometric properties and a three-factor solution. Similarly, in the study by Freiberg-Hoffmann et al. [52], the USEI was adapted and validated in Spanish for use in Latin American countries. Their results showed that the adapted USEI had good psychometric properties, with a three-factor solution similar to the results in this study [52]. In addition, the study by Gün et al. [53] adapted the USEI to Turkish culture and also revealed good psychometric properties, with a three-factor solution. Their study confirmed the cross-cultural validity of the USEI.
In the higher education context, the version developed by Sinval et al. confirmed the reliability of the three-factor structure. In addition, a confirmatory factor analysis validated the second-order structure [49]. Similarly, research on university students in Italy across two different areas (Biology and Psychology) provided good test–retest reliability and good internal consistency, in addition to convergent and adequate validities. Moreover, the robustness of the first- and second-order-structure measures was similar. The scale scores predicted GPA, academic motivation, and academic achievement positively, and intention to drop out negatively [48].
Regarding the subject of high academic achievement, academic engagement has been shown to positively influence students in obtaining higher degrees [79,80,81] and predicts career adaptability [82]. Furthermore, previous academic research indicated a positive association between Grit, engagement, and academic productivity [83,84]. In the present study, we conducted a new validation of an engagement inventory for academic students in Physical Education and Sport for the reason that engagement is identified as an essential component of students’ academic success [85,86,87] and represents a goal-directed interaction with the learning environment [88,89,90]. Strong associations exist between engagement and a wide range of positive outcomes, including better academic performance, better learning outcomes, and achievements, expressed through academic performance and the grade-point average (GPA) [79,91], as well as improved attendance [92]. Across Physical Education studies, several research findings have reported that student motivation and engagement are significantly correlated and enhance sustainable development [27,93,94].

4.1. Limitations

In summary, the findings in this study showed that the Arabic version of the USEI is a useful inventory for Physical Education researchers to analyze the relationship between students’ academic engagement and other variables, such as study processes and teaching styles. However, despite the good psychometric quality of the A-USEI data, this study has certain drawbacks. The first limitation concerns the study population: while this study focused only on Physical Education and Sport students, the results may have implications for other academic disciplines, as engagement is an important factor in academic achievement regardless of the field of study. Additionally, only the population of students in Tunisia was recruited, which limited the generalization of the scale to other countries of the same language.
Furthermore, the invariance of the scale according to gender was not performed in the present study because the USEI was found to demonstrate measurement invariance across gender [49]. Moreover, this study did not address the fact that academic engagement is a dynamic process and that students’ involvement levels may fluctuate, depending on their experiences. Academic engagement grows via transitions, experience, and sharing, and these characteristics cannot be overlooked. For instance, a student who is highly engaged at the beginning of his or her academic career may become disengaged over time due to various factors, such as academic pressure, personal problems, or lack of motivation. Similarly, an initially disengaged student may become highly engaged after finding his or her academic path or being inspired by a particular teacher.

4.2. Practical Implications and Future Directions

The findings in the present research offer a more all-encompassing perspective of the notion of engagement, which is typically viewed as a unified and conceptually coherent. This perspective suggests that student engagement, as a concept, can be understood clearly from three perspectives, namely, cognitive, behavioral, and emotional. These three domains strongly reflect the general construct of engagement. Based on this conception, this study endorses the use of a composite score for the A-USEI in future studies, as proposed by Schaufeli et al. [36]. Using a given dimension independently from the others may not only distort the meaning and structure of the concept of engagement as measured by the A-USEI, but may also lead to the communication of inaccurate findings to the Physical Education/Sport stakeholders and the general public.
We recommend that future studies continue to explore and compare the current USEI model with other model structures (such as the bifactor confirmatory model) to place this structural argument in perspective. Furthermore, to overcome the fact that the dynamic nature of academic engagement levels is not addressed in this study, future studies could consider implementing longitudinal models that follow students over time and track changes in their engagement levels. This would provide a better understanding of how academic engagement fluctuates over time and how it is influenced by various factors.
The findings from this research support the use and functionality of the A-USEI by scholars who conduct studies on engagement. In addition to researchers, university administrators would find this instrument useful for assessing the state of student engagement in their institutions to make data-driven decisions and help to drive the sustainable development of these institutions.

5. Conclusions

Our study aimed to adapt and validate the USEI in Arabic for university students in Physical Education and Sport. The findings suggest that the A-USEI scale has a second-order three-factor structure that is suitable for assessing engagement among Physical Education and Sport students. The instrument is reliable and has good construct validity. The A-USEI is associated with academic performance, as measured by GPA and PE–Grit scores, establishing its concurrent validity. The A-USEI is a highly effective psychometric instrument that can be used to measure academic engagement levels among students in Arabic-speaking regions.

Author Contributions

Conceptualization, A.T., F.Q. and J.E.H.J.; methodology, A.T. and F.Q. and J.E.H.J.; data curation, A.T and M.S.-S.; writing—original draft preparation, A.T., F.Q. and J.E.H.J.; writing—review and editing, A.T., F.Q., M.S.-S.; T.B.; N.C.; G.B.; C.A. and H.S.; supervision, F.A. All authors have read and agreed to the published version of the manuscript.

Funding

This study received no external funding. However, the authors sincerely thank Bielefeld University, Germany, for providing financial support through the Institutional Open Access Publication Fund for the article-processing charge (APC).

Institutional Review Board Statement

Following adherence to the last Declaration of Helsinki (2013), the protocol was fully approved by a local research ethics committee of the Higher Institute of Sport and Physical Education of Kef, University of Jendouba, kef, Tunisia, with reference number (n◦ 030/2022) dated 29 November 2021.

Informed Consent Statement

An informed consent form was received and completed by each participant.

Data Availability Statement

The original contributions presented in the study are included in the article. Further inquiries can be directed to the corresponding author.

Acknowledgments

The authors would like to thank all the students who participated in the study.

Conflicts of Interest

The authors declare that the research was conducted in the absence of any commercial or financial relationships that could be construed as potential conflicts of interest.

Appendix A. Arabic Version of the USEI

Psych 05 00022 g0a1

References

  1. Costa, C.; Cardoso, A.P.; Lima, M.P.; Ferreira, M.; Abrantes, J.L. Pedagogical Interaction and Learning Performance as Determinants of Academic Achievement. Procedia-Soc. Behav. Sci. 2015, 171, 874–881. [Google Scholar] [CrossRef]
  2. Lavidas, K.; Barkatsas, T.; Manesis, D.; Gialamas, V. A structural equation model investigating the impact of tertiary students’attitudes toward statistics, perceived competence at mathematics, and engagement on statistics performance. Stat. Educ. Res. J. 2020, 19, 27–41. [Google Scholar] [CrossRef]
  3. Kahn, W.A. Psychological Conditions of Personal Engagement and Disengagement at Work. Acad. Manag. J. 1990, 33, 692–724. [Google Scholar] [CrossRef]
  4. Ford, D.; Myrden, S.E.; Jones, T.D. Understanding “Disengagement from Knowledge Sharing”: Engagement Theory versus Adaptive Cost Theory. J. Knowl. Manag. 2015, 19, 476–496. [Google Scholar] [CrossRef]
  5. Schaufeli, W.B.; Salanova, M.; González-Romá, V.; Bakker, A.B. The Measurement of Engagement and Burnout: A Two Sample Confirmatory Factor Analytic Approach. J. Happiness Stud. 2002, 3, 71–92. [Google Scholar] [CrossRef]
  6. Bresó, E.; Schaufeli, W.B.; Salanova, M. Can a Self-Efficacy-Based Intervention Decrease Burnout, Increase Engagement, and Enhance Performance? A Quasi-Experimental Study. High. Educ. 2011, 61, 339–355. [Google Scholar] [CrossRef]
  7. Bakker, A.B.; Demerouti, E.; Sanz-Vergel, A.I. Burnout and Work Engagement: The JD–R Approach. Annu. Rev. Organ. Psychol. Organ. Behav. 2014, 1, 389–411. [Google Scholar] [CrossRef]
  8. Ouweneel, E.; Le Blanc, P.M.; Schaufeli, W.B. Flourishing Students: A Longitudinal Study on Positive Emotions, Personal Resources, and Study Engagement. J. Posit. Psychol. 2011, 6, 142–153. [Google Scholar] [CrossRef]
  9. Tayama, J.; Schaufeli, W.; Shimazu, A.; Tanaka, M.; Takahama, A. Validation of a Japanese Version of the Work Engagement Scale for Students. JPN Psychol. Res. 2019, 61, 262–272. [Google Scholar] [CrossRef]
  10. Miliszewska, I.; Horwood, J. Engagement Theory: A Framework for Supporting Cultural Differences in Transnational Education. High. Educ. Res. Soc. Australas. 2004, 3, 1–7. [Google Scholar]
  11. Hiver, P.; Al-Hoorie, A.H.; Vitta, J.P.; Wu, J. Engagement in Language Learning: A Systematic Review of 20 Years of Research Methods and Definitions. Lang. Teach. Res. 2021, 13621688211001288. [Google Scholar] [CrossRef]
  12. Dubovi, I. Cognitive and Emotional Engagement While Learning with VR: The Perspective of Multimodal Methodology. Comput. Educ. 2022, 183, 104495. [Google Scholar] [CrossRef]
  13. Song, B.L.; Lee, K.L.; Liew, C.Y.; Ho, R.C.; Lin, W.L. Business Students’ Perspectives on Case Method Coaching for Problem-Based Learning: Impacts on Student Engagement and Learning Performance in Higher Education. Educ. Train. 2022, 64, 416–432. [Google Scholar] [CrossRef]
  14. Wellborn, J.G. Engaged and Disaffected Action: The Conceptualization and Measurement of Motivation in the Academic Domain; University of Rochester: Rochester, NY, USA, 1992. [Google Scholar]
  15. Christenson, S.; Reschly, A.L.; Wylie, C. Handbook of Research on Student Engagement; Springer: Berlin/Heidelberg, Germany, 2012; Volume 840. [Google Scholar]
  16. Lei, H.; Cui, Y.; Zhou, W. Relationships between Student Engagement and Academic Achievement: A Meta-Analysis. Soc. Behav. Personal. Int. J. 2018, 46, 517–528. [Google Scholar] [CrossRef]
  17. Bradley, G.L.; Ferguson, S.; Zimmer-Gembeck, M.J. Parental Support, Peer Support and School Connectedness as Foundations for Student Engagement and Academic Achievement in Australian Youth. In Handbook of Positive Youth Development; Springer: Berlin/Heidelberg, Germany, 2021; pp. 219–236. [Google Scholar]
  18. Hsieh, T.-L.; Yu, P. Exploring Achievement Motivation, Student Engagement, and Learning Outcomes for STEM College Students in Taiwan through the Lenses of Gender Differences and Multiple Pathways. Res. Sci. Technol. Educ. 2022, 1–16. [Google Scholar] [CrossRef]
  19. Kuh, G.D.; Hu, S. The Effects of Student-Faculty Interaction in the 1990s. Rev. High. Educ. 2001, 24, 309–332. [Google Scholar] [CrossRef]
  20. Krause, K.-L. Understanding and Promoting Student Engagement in University Learning Communities: Engaged, Inert or Otherwise Occupied. In Proceedings of the James Cook University Symposium, Townsville/Cairns, QLD, Australia, 21–22 September 2005; pp. 21–22. [Google Scholar]
  21. af Ursin, P.; Järvinen, T.; Pihlaja, P. The Role of Academic Buoyancy and Social Social Support in Mediating Associations between Academic Stress and School Engagement in Finnish Primary School Children. Scand. J. Educ. Res. 2021, 65, 661–675. [Google Scholar] [CrossRef]
  22. Yévenes-Márquez, J.N.; Badilla-Quintana, M.G.; Sandoval-Henríquez, F.J. Measuring Engagement to Academic Tasks: Design and Validation of the Comp-TA Questionnaire. Educ. Res. Int. 2022, 2022, 4783994. [Google Scholar] [CrossRef]
  23. United Nations Educational, Scientific and Cultural Organization. UNESCO Roadmap for Implementing the Global Action Programme on Education for Sustainable Development; UNESCO: Paris, France, 2014. [Google Scholar]
  24. Hastie, P.A.; Stringfellow, A.; Johnson, J.L.; Dixon, C.E.; Hollett, N.; Ward, K. Examining the Concept of Engagement in Physical Education. Phys. Educ. Sport Pedagog. 2022, 27, 1–18. [Google Scholar] [CrossRef]
  25. Quennerstedt, M. Physical Education and the Art of Teaching: Transformative Learning and Teaching in Physical Education and Sports Pedagogy. Sport Educ. Soc. 2019, 24, 611–623. [Google Scholar] [CrossRef]
  26. Nols, Z.; Jones, G.J.; Theeboom, M. Re-Imagining Sport Pedagogy through Youth Engagement: An Exploration of the Youth Engagement Continuum. Leis. Sci. 2021, 1–20. [Google Scholar] [CrossRef]
  27. Leo, F.; Mouratidis, A.; Pulido, J.; López-Gajardo, M.; Sánchez-Oliva, D. Perceived Teachers’ Behavior and Students’ Engagement in Physical Education: The Mediating Role of Basic Psychological Needs and Self-Determined Motivation. Phys. Educ. Sport Pedagog. 2022, 27, 59–76. [Google Scholar] [CrossRef]
  28. De Meyer, J.; Soenens, B.; Vansteenkiste, M.; Aelterman, N.; Van Petegem, S.; Haerens, L. Do Students with Different Motives for Physical Education Respond Differently to Autonomy-Supportive and Controlling Teaching? Psychol. Sport Exerc. 2016, 22, 72–82. [Google Scholar] [CrossRef]
  29. Zhang, B.G.; Qian, X.F. Perceived Teacher’s Support and Engagement among Students with Obesity in Physical Education: The Mediating Role of Basic Psychological Needs and Autonomous Motivation. J. Sport. Sci. 2022, 40, 1–11. [Google Scholar] [CrossRef]
  30. Tidmarsh, G.; Kinnafick, F.E.; Johnston, J.P. The Role of the Motivational Climate in Female Engagement in Secondary School Physical Education: A Dual Study Investigation. Qual. Res. Sport Exerc. Health 2022, 14, 68–83. [Google Scholar] [CrossRef]
  31. de Bruijn, A.G.; Mombarg, R.; Timmermans, A. The Importance of Satisfying Children’s Basic Psychological Needs in Primary School Physical Education for PE-Motivation, and Its Relations with Fundamental Motor and PE-Related Skills. Phys. Educ. Sport Pedagog. 2022, 27, 422–439. [Google Scholar] [CrossRef]
  32. Treasure, D.C.; Robert, G.C. Students’ Perceptions of the Motivational Climate, Achievement Beliefs, and Satisfaction in Physical Education. Res. Q. Exerc. Sport 2001, 72, 165–175. [Google Scholar] [CrossRef]
  33. Jaakkola, T.; Yli-Piipari, S.; Barkoukis, V.; Liukkonen, J. Relationships among Perceived Motivational Climate, Motivational Regulations, Enjoyment, and PA Participation among Finnish Physical Education Students. Int. J. Sport Exerc. Psychol. 2017, 15, 273–290. [Google Scholar] [CrossRef]
  34. Pereira, P.; Marinho, D.A.; Santos, F. Positive Motivational Climates, Physical Activity and Sport Participation Through Self-Determination Theory: Striving for Quality Physical Education. J. Phys. Educ. Recreat. Danc. 2021, 92, 42–47. [Google Scholar] [CrossRef]
  35. Schaufeli, W.B.; Bakker, A.B.; Salanova, M. Utrecht Work Engagement Scale-9. Educ. Psychol. Meas. 2003. [Google Scholar] [CrossRef]
  36. Schaufeli, W.B.; Bakker, A.B.; Salanova, M. The Measurement of Work Engagement with a Short Questionnaire: A Cross-National Study. Educ. Psychol. Meas. 2006, 66, 701–716. [Google Scholar] [CrossRef]
  37. Schaufeli, W.B.; Bakker, A.B. Job Demands, Job Resources, and Their Relationship with Burnout and Engagement: A Multi-sample Study. J. Organ. Behav. Int. J. Ind. Occup. Organ. Psychol. Behav. 2004, 25, 293–315. [Google Scholar] [CrossRef]
  38. Van Doornen, L.J.; Houtveen, J.H.; Langelaan, S.; Bakker, A.B.; Van Rhenen, W.; Schaufeli, W.B. Burnout versus Work Engagement in Their Effects on 24-hour Ambulatory Monitored Cardiac Autonomic Function. Stress Health: J. Int. Soc. Investig. Stress 2009, 25, 323–331. [Google Scholar] [CrossRef]
  39. Shimazu, A.; Schaufeli, W.; Kosugi, S.; Suzuki, A.; Nashiwa, H.; Kato, A.; Sakamoto, M.; Irimajiri, H.; Amano, S.; Hirohata, K. Work Engagement in Japan: Validation of the Japanese Version of the Utrecht Work Engagement Scale. Appl. Psychol. 2008, 57, 510–523. [Google Scholar] [CrossRef]
  40. Nerstad, C.G.; Richardsen, A.M.; Martinussen, M. Factorial Validity of the Utrecht Work Engagement Scale (UWES) across Occupational Groups in Norway. Scand. J. Psychol. 2010, 51, 326–333. [Google Scholar] [CrossRef]
  41. Carle, A.C.; Jaffee, D.; Vaughan, N.W.; Eder, D. Psychometric Properties of Three New National Survey of Student Engagement Based Engagement Scales: An Item Response Theory Analysis. Res. High. Educ. 2009, 50, 775–794. [Google Scholar] [CrossRef]
  42. Nusche, D. Assessment of Learning Outcomes in Higher Education: A Comparative Review of Selected Practices; OECD Publishing: Paris, France, 2008. [Google Scholar]
  43. Campbell, C.M.; Cabrera, A.F. How Sound Is NSSE?: Investigating the Psychometric Properties of NSSE at a Public, Research-Extensive Institution. Rev. High. Educ. 2011, 35, 77–103. [Google Scholar] [CrossRef]
  44. LaNasa, S.M.; Cabrera, A.F.; Trangsrud, H. The Construct Validity of Student Engagement: A Confirmatory Factor Analysis Approach. Res. High. Educ. 2009, 50, 315–332. [Google Scholar] [CrossRef]
  45. Wefald, A.J.; Downey, R.G. Construct Dimensionality of Engagement and Its Relation with Satisfaction. J. Psychol. 2009, 143, 91–112. [Google Scholar] [CrossRef]
  46. Maroco, J.; Maroco, A.L.; Campos, J.A.D.B.; Fredricks, J.A. University Student’s Engagement: Development of the University Student Engagement Inventory (USEI). Psicol. Reflexão E Crítica 2016, 29, 21. [Google Scholar] [CrossRef]
  47. Fredricks, J.A. Academic Engagement. In International Encyclopedia of the Social & Behavioral Sciences; Wright, J.D., Ed.; Routledge: Abingdon, UK, 2015; Volume 2, pp. 31–36. [Google Scholar]
  48. Esposito, G.; Marôco, J.; Passeggia, R.; Pepicelli, G.; Freda, M.F. The Italian Validation of the University Student Engagement Inventory. Eur. J. High. Educ. 2022, 12, 35–55. [Google Scholar] [CrossRef]
  49. Sinval, J.; Casanova, J.R.; Marôco, J.; Almeida, L.S. University Student Engagement Inventory (USEI): Psychometric Properties. Curr. Psychol. 2021, 40, 1608–1620. [Google Scholar] [CrossRef]
  50. Assunção, H.; Lin, S.-W.; Sit, P.-S.; Cheung, K.-C.; Harju-Luukkainen, H.; Smith, T.; Maloa, B.; Campos, J.Á.D.B.; Ilic, I.S.; Esposito, G. University Student Engagement Inventory (USEI): Transcultural Validity Evidence across Four Continents. Front. Psychol. 2020, 10, 2796. [Google Scholar] [CrossRef] [PubMed]
  51. Albornoz, J.M.; Contreras, M.V.; Mujica, A.D.; Bernardo, A.B. Propiedades Psicométricas Del University Student Engagement Inventory En Estudiantes de Ingeniería Chilenos. Rev. Iberoam. Diagnóstico Evaluación-E Avaliação Psicológica 2020, 4, 77–90. [Google Scholar] [CrossRef]
  52. Freiberg-Hoffmann, A.; Romero-Medina, A.; Curione, K.; Marôco, J. Cross-Cultural Adaptation and Validation of the University Student Engagement Inventory into Spanish. Rev. Latinoam. De Psicol. 2022, 54, 187–195. [Google Scholar]
  53. Gün, F.; Turabik, T.; Arastaman, G.; Akbaşlı, S. Adaptation of University Student Engagement Inventory to Turkish Culture: Validity and Reliability Study. Inönü Univ. J. Fac. Educ. 2019, 20, 507–520. [Google Scholar]
  54. Nora, C.R.D.; Zoboli, E.; Vieira, M.M. Validation by Experts: Importance in Translation and Adaptation of Instruments. Rev. Gaúcha De Enferm. 2018, 38, e64851. [Google Scholar] [CrossRef]
  55. Sousa, V.D.; Rojjanasrirat, W. Translation, Adaptation and Validation of Instruments or Scales for Use in Cross-cultural Health Care Research: A Clear and User-friendly Guideline. J. Eval. Clin. Pract. 2011, 17, 268–274. [Google Scholar] [CrossRef]
  56. Hawkins, M.; Cheng, C.; Elsworth, G.R.; Osborne, R.H. Translation Method Is Validity Evidence for Construct Equivalence: Analysis of Secondary Data Routinely Collected during Translations of the Health Literacy Questionnaire (HLQ). BMC Med. Res. Methodol. 2020, 20, 1–13. [Google Scholar] [CrossRef]
  57. Quansah, F.; Ankomah, F.; Hagan, J.E., Jr.; Srem-Sai, M.; Frimpong, J.B.; Sambah, F.; Schack, T. Development and Validation of an Inventory for Stressful Situations in University Students Involving Coping Mechanisms: An Interesting Cultural Mix in Ghana. Psych 2022, 4, 173–186. [Google Scholar] [CrossRef]
  58. Arafat, S.Y. Validation Study Can Be a Separate Study Design. Int. J. Med. Sci. Public Health 2016, 5, 2421–2422. [Google Scholar] [CrossRef]
  59. Guelmami, N.; Chalghaf, N.; Tannoubi, A.; Puce, L.; Azaiez, F.; Bragazzi, N.L. Initial Development and Psychometric Evidence of Physical Education Grit Scale (PE-GRIT). Front. Public Health 2022, 10, 818749. [Google Scholar] [CrossRef] [PubMed]
  60. Tannoubi, A.; Guelmami, N.; Bonsaksen, T.; Chalghaf, N.; Azaiez, F.; Bragazzi, N.L. Development and Preliminary Validation of the Physical Education-Study Process Questionnaire: Insights for Physical Education University Students. Front. Public Health 2022, 10, 856167. [Google Scholar] [CrossRef]
  61. Li, W.; Yu, H.; Li, B.; Zhang, Y.; Fu, M. The Transcultural Adaptation and Validation of the Chinese Version of the Attitudes Toward Recognizing Early and Noticeable Deterioration Scale. Front. Psychol. 2022, 13, 7599. [Google Scholar] [CrossRef] [PubMed]
  62. Villar Hernández, A.R.; Molero Alonso, F.; Aguado Marín, Á.J.; Posada de la Paz, M. Transcultural Validation of a Spanish Version of the Quality of Life in Epidermolysis Bullosa Questionnaire. Int. J. Environ. Res. Public Health 2022, 19, 7059. [Google Scholar] [CrossRef] [PubMed]
  63. Arafat, S.; Chowdhury, H.R.; Qusar, M.; Hafez, M. Cross Cultural Adaptation & Psychometric Validation of Research Instruments: A Methodological Review. J. Behav. Health 2016, 5, 129–136. [Google Scholar]
  64. Hagan, J.E., Jr.; Quansah, F.; Ankomah, F.; Agormedah, E.K.; Srem-Sai, M.; Schack, T. Examining the Underlying Latent Structure of the Sports Emotion Questionnaire: Insights from the Bifactor Multidimensional Item Response Theory. Front. Psychol. 2022, 13, 1038217. [Google Scholar] [CrossRef]
  65. Lalkhen, A.G.; McCluskey, A. Clinical Tests: Sensitivity and Specificity. Contin. Educ. Anaesth. Crit. Care Pain 2008, 8, 221–223. [Google Scholar] [CrossRef]
  66. Gelman, A.; Hill, J. Data Analysis Using Regression and Multilevel/Hierarchical Models; Cambridge University Press: Cambridge, UK, 2006. [Google Scholar]
  67. Comrey, A.; Lee, H. A First Course in Factor Analysis: Psychology Press; Taylor &Francis: Abingdon, UK, 2013. [Google Scholar]
  68. Kyriazos, T.A. Applied Psychometrics: Sample Size and Sample Power Considerations in Factor Analysis (EFA, CFA) and SEM in General. Psychology 2018, 9, 2207. [Google Scholar] [CrossRef]
  69. Hambleton, R.K. Translating Achievement Tests for Use in Cross-National Studies; ERIC: Washington, DC, USA, 1993.
  70. Kim, J.-O.; Mueller, C.W. Factor Analysis: Statistical Methods and Practical Issues; SAGE Publications: Thousand Oaks, CA, USA, 1978; Volume 14. [Google Scholar]
  71. Tabachnick, B.G.; Fidell, L.S.; Ullman, J.B. Using Multivariate Statistics; Pearson: Boston, MA, USA, 2013; Volume 6. [Google Scholar]
  72. Hair, J.; Babin, B.; Anderson, R.; Black, W. Multivariate Data Analysis, 7th Pearson New International ed.; Pearson: Harlow, UK, 2014. [Google Scholar]
  73. Sass, D.A. Factor Loading Estimation Error and Stability Using Exploratory Factor Analysis. Educ. Psychol. Meas. 2010, 70, 557–577. [Google Scholar] [CrossRef]
  74. Cohen, J.; Cohen, P.; West, S.G.; Aiken, L.S. Applied Multiple Regression/Correlation Analysis for the Behavioral Sciences; Routledge: New York, NY, USA, 2013. [Google Scholar]
  75. DeVellis, R. An Overview of Item Response Theory. Scale Development: Theory and Applications, 4th ed.; SAGE Publications Inc.: Thousand Oaks, CA, USA, 2017; pp. 213–224. [Google Scholar]
  76. Bland, J.; Altman, D.G. Cronbach’s Alpha. BMJ 1997, 314, 572. [Google Scholar] [CrossRef] [PubMed]
  77. Hu, L.; Bentler, P.M. Cutoff Criteria for Fit Indexes in Covariance Structure Analysis: Conventional Criteria versus New Alternatives. Struct. Equ. Model. A Multidiscip. J. 1999, 6, 1–55. [Google Scholar] [CrossRef]
  78. Sharif Nia, H.; Azad Moghddam, H.; Marôco, J.; Rahmatpour, P.; Allen, K.-A.; Kaur, H.; Kaveh, O.; Gorgulu, O.; Pahlevan Sharif, S. A Psychometric Lens for E-Learning: Examining the Validity and Reliability of the Persian Version of University Students’ Engagement Inventory (P-USEI). Asia-Pac. Educ. Res. 2022, 1–10. [Google Scholar] [CrossRef]
  79. Bugbee, B.A.; Beck, K.H.; Fryer, C.S.; Arria, A.M. Substance Use, Academic Performance, and Academic Engagement among High School Seniors. J. Sch. Health 2019, 89, 145–156. [Google Scholar] [CrossRef] [PubMed]
  80. Roebken, H. The Influence of Goal Orientation on Student Satisfaction, Academic Engagement and Achievement. Electron. J. Res. Educ. Psychol. 2007, 5, 679–704. [Google Scholar]
  81. Wu, Z. Academic Motivation, Engagement, and Achievement among College Students. Coll. Stud. J. 2019, 53, 99–112. [Google Scholar]
  82. Datu, J.A.D.; Buenconsejo, J.U. Academic Engagement and Achievement Predict Career Adaptability. Career Dev. Q. 2021, 69, 34–48. [Google Scholar] [CrossRef]
  83. Huo, J. The Role of Learners’ Psychological Well-Being and Academic Engagement on Their Grit. Front. Psychol. 2022, 13, 504. [Google Scholar] [CrossRef]
  84. Suzuki, Y.; Tamesue, D.; Asahi, K.; Ishikawa, Y. Grit and Work Engagement: A Cross-Sectional Study. PLoS ONE 2015, 10, e0137501. [Google Scholar] [CrossRef]
  85. Jia, C.; Hew, K.F.; Bai, S.; Huang, W. Adaptation of a Conventional Flipped Course to an Online Flipped Format during the COVID-19 Pandemic: Student Learning Performance and Engagement. J. Res. Technol. Educ. 2022, 54, 281–301. [Google Scholar] [CrossRef]
  86. Johnson, S.R.; Stage, F.K. Academic Engagement and Student Success: Do High-Impact Practices Mean Higher Graduation Rates? J. High. Educ. 2018, 89, 753–781. [Google Scholar] [CrossRef]
  87. Serrano, C.; Murgui, S.; Andreu, Y. Improving the Prediction and Understanding of Academic Success: The Role of Personality Facets and Academic Engagement. Rev. De Psicodidáctica (Engl. Ed.) 2022, 27, 21–28. [Google Scholar] [CrossRef]
  88. Cornell, D.; Shukla, K.; Konold, T.R. Authoritative School Climate and Student Academic Engagement, Grades, and Aspirations in Middle and High Schools. Aera Open 2016, 2, 2332858416633184. [Google Scholar] [CrossRef]
  89. Opdenakker, M.-C.; Minnaert, A. Relationship between Learning Environment Characteristics and Academic Engagement. Psychol. Rep. 2011, 109, 259–284. [Google Scholar] [CrossRef] [PubMed]
  90. Tatiana, B.; Kobicheva, A.; Tokareva, E.; Mokhorov, D. The Relationship between Students’ Psychological Security Level, Academic Engagement and Performance Variables in the Digital Educational Environment. Educ. Inf. Technol. 2022, 27, 1–15. [Google Scholar] [CrossRef]
  91. Anokye Effah, N.A.; Nkwantabisa, A.O. The Influence of Academic Engagement on Academic Performance of University Accounting Students in Ghana. S. Afr. J. Account. Res. 2022, 36, 105–122. [Google Scholar] [CrossRef]
  92. Singh, K.; Granville, M.; Dika, S. Mathematics and Science Achievement: Effects of Motivation, Interest, and Academic Engagement. J. Educ. Res. 2002, 95, 323–332. [Google Scholar] [CrossRef]
  93. Curran, T.; Standage, M. Psychological Needs and the Quality of Student Engagement in Physical Education: Teachers as Key Facilitators. J. Teach. Phys. Educ. 2017, 36, 262–276. [Google Scholar] [CrossRef]
  94. Garn, A.C.; Ware, D.R.; Solmon, M.A. Student Engagement in High School Physical Education: Do Social Motivation Orientations Matter? J. Teach. Phys. Educ. 2011, 30, 84–98. [Google Scholar] [CrossRef]
Figure 1. Scree plot of the parallel analysis of the Arabic University Student Engagement Inventory (A-USEI).
Psych 05 00022 g001
Figure 2. The final second-order CFA of the Arabic 15-item University Student Engagement Inventory (A-USEI). Factor-correlation coefficients were 0.670 (between BE and EE), 0.649 (between BE and CE), and 0.657 (between EE and CE). Factor loadings ranged from 0.78 to 0.85. CFA statistics: χ2(89) = 158.181, p < 0.001; χ2/df = 1.2; goodness-of-fit index = 0.960; adjusted goodness-of-fit index = 0.946; Tucker–Lewis’s index = 0.977; comparative-fit index = 0.981; root mean square error of approximation = 0.040 (90% CI 0.029–0.049); standardized root mean residual = 0.041.
Psych 05 00022 g002
Table 1. Descriptive statistics, skewness and kurtosis coefficients, and lambda factor loadings for each element in all the dimensions of the Arabic-USEI (n = 366).
ItemMeanSDSkewnessKurtosisLamda
I12.640.870.480.340.647
I22.690.950.27−0.080.763
I32.590.920.430.100.665
I42.610.960.490.050.693
I52.640.920.37−0.140.609
I62.610.900.12−0.440.573
I72.590.880.320.060.519
I82.570.910.39−0.120.685
I92.550.910.12−0.540.741
I102.630.850.21−0.150.755
I112.580.940.550.030.475
I122.520.920.450.050.679
I132.560.930.32−0.090.629
I142.570.950.35−0.120.625
I152.570.940.42−0.110.848
Table 2. Descriptive statistics and univariate normality of confirmatory data.
MeanSDSkewnessKurtosis
I12.850.820.300.30
I22.840.880.02−0.20
I32.800.900.20−0.17
I42.850.890.27−0.11
I52.790.930.17−0.31
BE2.830.690.550.15
I62.750.900.07−0.31
I72.760.890.25−0.20
I82.720.950.19−0.36
I92.790.930.05−0.52
I102.750.890.21−0.03
EE2.750.720.40−0.09
I112.630.980.25−0.36
I122.670.850.280.08
I132.690.900.22−0.26
I142.730.920.21−0.26
I152.690.910.30−0.18
CE2.680.730.540.07
Footnote: (BE): behavioral engagement; (CE): cognitive engagement; and (EE): emotional engagement.
Table 3. Reliability of the Arabic University Student Engagement Inventory (A-USEI).
ItemsCronbach’s Alpha Scale Mean if Item DeletedScale Variance if Item DeletedCorrected Item-Total CorrelationCronbach’s Alpha if Item Deleted
1 BE0.85810.539.370.660.83
210.498.940.670.83
310.589.130.660.83
410.578.710.710.82
510.539.050.670.83
6 EE0.84210.338.140.610.82
710.348.250.610.82
810.377.810.680.80
910.397.790.680.80
1010.318.200.650.81
11 CE0.86310.229.490.660.84
1210.289.610.650.84
1310.239.400.690.83
14 10.477.610.740.80
15 10.487.310.750.81
Table 4. Correlation matrix between the Arabic University Student Engagement Inventory (A-USEI) factors, its total score with GPA, and the PE–Grit scale factors.
BEEECETotalGPAPHIPHEAI
BE0.728
EE0.670 **0.734
CE0.649 **0.657 **0.728
Total0.875 **0.884 **0.877 **
GPA0.425 **0.432 **0.419 **0.484 **
PHI0.273 **0.283 **0.280 **0.317 **0.200 **
PHE0.161 **0.167 **0.203 **0.201 **0.091 *0.546 **
AI0.321 **0.335 **0.325 **0.372 **0.307 **0.463 **0.374 **
AE0.288 **0.245 **0.281 **0.309 **0.256 **0.386 **0.405 **0.610 **
(PHI): physical interest; (PHE): physical effort; (AI): academic interest; (AE): academic effort; (GPA): grade-point average; ** p < 0.01, * p < 0.1.
Disclaimer/Publisher’s Note: The statements, opinions and data contained in all publications are solely those of the individual author(s) and contributor(s) and not of MDPI and/or the editor(s). MDPI and/or the editor(s) disclaim responsibility for any injury to people or property resulting from any ideas, methods, instructions or products referred to in the content.

