Article

Synthesis and Structure of COE-11, a New Borosilicate Zeolite with a Two-Dimensional Pore System of 12-Ring Channels

1
Institute of Geology, Mineralogy and Geophysics, Ruhr-University Bochum, 44780 Bochum, Germany
2
Process Research and Chemical Engineering, BASF SE, 67056 Ludwigshafen, Germany
3
State Key Laboratory of Fine Chemicals, Dalian University of Technology, Dalian 116024, China
4
Chemical Resources Laboratory, Tokyo Institute of Technology, Yokohama 226-8503, Japan
5
College of Chemical and Biological Engineering, Zhejiang University, Hangzhou 310028, China
6
Department of Chemistry, Zhejiang University, Hangzhou 310028, China
7
Centre for Membrane separations, Adsorption, Catalysis and Spectroscopy for Sustainable Solutions (cMACS), KU Leuven, 3001 Leuven, Belgium
8
Institute for Inorganic Chemistry and Analytical Chemistry, Johannes Gutenberg-University, 55128 Mainz, Germany
*
Author to whom correspondence should be addressed.
Chemistry 2023, 5(2), 730-752; https://doi.org/10.3390/chemistry5020052
Submission received: 17 February 2023 / Revised: 18 March 2023 / Accepted: 20 March 2023 / Published: 28 March 2023

Abstract

:
The new zeolite, COE-11, was synthesized at 155 °C to 168 °C by hydrothermal synthesis from a reaction mixture of SiO2/tetraethylammonium hydroxide/H3BO3/NaOH/H2O. Because tetraethylammonium is an unspecific structure directing agent, COE-11 crystallizes in all cases together with at least one impurity phase from a selection of phases: zeolite types *BEA, CHA, FER, MFI, MOR, MTW; the layered silicates magadiite and kenyaite; and searlsite and silica polymorph quartz. The crystal structure was solved from 3D electron diffraction (3D ED) data. Subsequent structure refinements of X-ray powder diffraction (PXRD) data and single crystal electron diffraction data converged to residual values of RF = 0.039, chi2 = 3.6 (PXRD) and RF = 21.81% (3D ED) confirming the structure model. COE-11 crystallizes in space group C2 with unit cell dimensions of a0 = 17.3494(11) Å, b0 = 17.3409(11) Å, c0 = 14.2789(4) Å and β = 113.762(2) °. The structure of COE-11 is characterized by a microporous borosilicate framework with intersecting, highly elliptical 12-ring channels running parallel (110) and (1–10) and forming a two-dimensional pore system. The Rietveld refinement provided a hint that boron partly substitutes silicon on three specific T sites of the framework. The idealized chemical composition of as-made COE-11 is [(CH3CH2)4N]4[B4Si62O132] per unit cell. Physico-chemical characterization using solid-state NMR spectroscopy, SEM, TG-DTA, and ATR-FTIR spectroscopy confirmed that COE-11 is a microporous borosilicate zeolite. COE-11 is structurally closely related to zeolite beta polymorph B but differs concerning the dimensionality of the pore system, which is 2D instead of 3D.

Graphical Abstract

1. Introduction

Zeolites are used for many purposes in industry, for environmental or domestic issues. The applications of zeolites are based on their specific properties, which are characteristic for this class of microporous silicates in their enabling of ion exchange and adsorption and the ability to act as a shape selective catalyst or a catalyst support [1].
Although a multitude of zeolites exists, the search for new zeolite framework types remains of great interest. Each new framework type, with its specific and unique pore geometry, might lead to new properties and new applications. Additionally, the composition of the framework comprising Si, Al, B, Ga or other elements and the specific distribution of the heteroelements (e.g., Al or B) about the T sites has a decisive influence on the catalytic properties in particular [2,3].
Typically, zeolites are prepared by hydrothermal synthesis from reaction mixtures containing SiO2, a mineralizer such as a base (e.g., NaOH), a trivalent element to replace silicon in the framework (e.g., Al, B, Ga, ...) and a cation to compensate the negative charge of the framework. To obtain zeolites with a specific framework topology the use of organic structure-directing agents, OSDAs, has been very successful. The most frequently used organic compounds are amines or ammonium compounds. Some compounds have been shown to be able to stabilize only one or very few zeolite types while others are less specific and lead to the crystallization of several zeolite types. Not only do the nature and the geometry of the OSDAs influence the type of product obtained [4,5,6,7], but other synthesis parameters as well. A variation of the synthesis temperature, the concentration and ratio of compounds, the pH value, a specific agitation of the reaction mixture or the silica source, to mention just some parameters, can lead to completely different products [8].
Although some promising novel routes to synthesize new zeolites have been developed, such as topotactic condensation of layer silicates [9,10], reacting dry mixtures [11], interzeolite conversion [12], the fluoride route [13], charge matching [14], the use of Ge as a T atom [15], the ADOR method [16], and others [17], the classical hydrothermal synthesis is still the most frequently used method.
For many years, the tetraethylammonium ion (TEA) has frequently been used as an ammonium compound to stabilize various zeolites. It is known that the use of TEA leads to the formation of zeolites with at least eight different framework topologies: CHA (e.g., SSZ-13), MFI, MTW, FER, *BEA, MOR, AFI (AlPO-5) [18]. For zeolite framework types please refer to the Database of Zeolite Structure Types [19,20]. The tetraethylammonium ion used in this study can exist in two conformations with the designation tg.tg (approximately “ball” shaped) and tt.tt (“discus” like) (see Figure 1). Schmidt et al. [18] analysed the particular conformation that the TEA cation adopts in different zeolite structures. It was concluded that the experimentally determined conformer distribution in each material is related to the calculated stabilization energy difference between the occluded conformers E(tg.tg-tt.tt): e.g., the TEA cation in zeolite Beta with E(tg.tg-tt.tt) = +8.7 kJ (molTEA) is exclusively occluded as the tt.tt conformer. This is in contrast with the zeolite MFI with E(tg.tg-tt.tt) = −9.8 kJ (molTEA), which contains exclusively the tg.tg conformer. For zeolite structures with E(tg.tg-tt.tt) values close to zero, the presence of both conformers is reported: CHA with E(tg.tg-tt.tt) = +3.4 kJ (molTEA) and MOR with +2.1 kJ (molTEA) include mixtures comprising 23% and 12% of the tg.tg conformer, respectively, as indicated in Table 1 of Ref. [18]. TEAOH solutions contain both conformers, with the tg.tg conformer dominating at higher temperatures and higher concentration. As will be shown in the Results section (see below), even when using identical synthesis temperatures and TEAOH concentrations, COE-11 frequently crystallizes together with either zeolite Beta (100% tt.tt) or MFI (100% tg.tg) or with both zeolites. Other synthesis experiments have led to the formation of CHA- and MOR-type zeolites as impurity phases. This again illustrates that the TEA cation is a structure-directing agent with low specificity.
In systematic series of synthesis experiments performed to investigate the crystallization of tetraethylammonium ions containing silicates, a thus-far unknown zeolite, COE-11, appeared in several synthesis runs. Here we report on the synthesis, the physical and chemical properties and the crystal structure of this new borosilicate zeolite.

2. Experimental

2.1. Synthesis

COE-11 was synthesized from reaction mixtures with molar ratios of 1 SiO2/0.05–0.15 H3BO3/0.2–0.5 NaOH/0.33 OSDA/16 H2O at temperatures between 155 and 168 °C. In most cases tetraethylammonium hydroxide (TEAOH) was used to act as an organic structure-directing agent (OSDA). Aiming at the crystallization of a pure COE-11 sample, the synthesis parameters were varied across a wide range of the following:
-
variable concentrations of the reaction compounds;
-
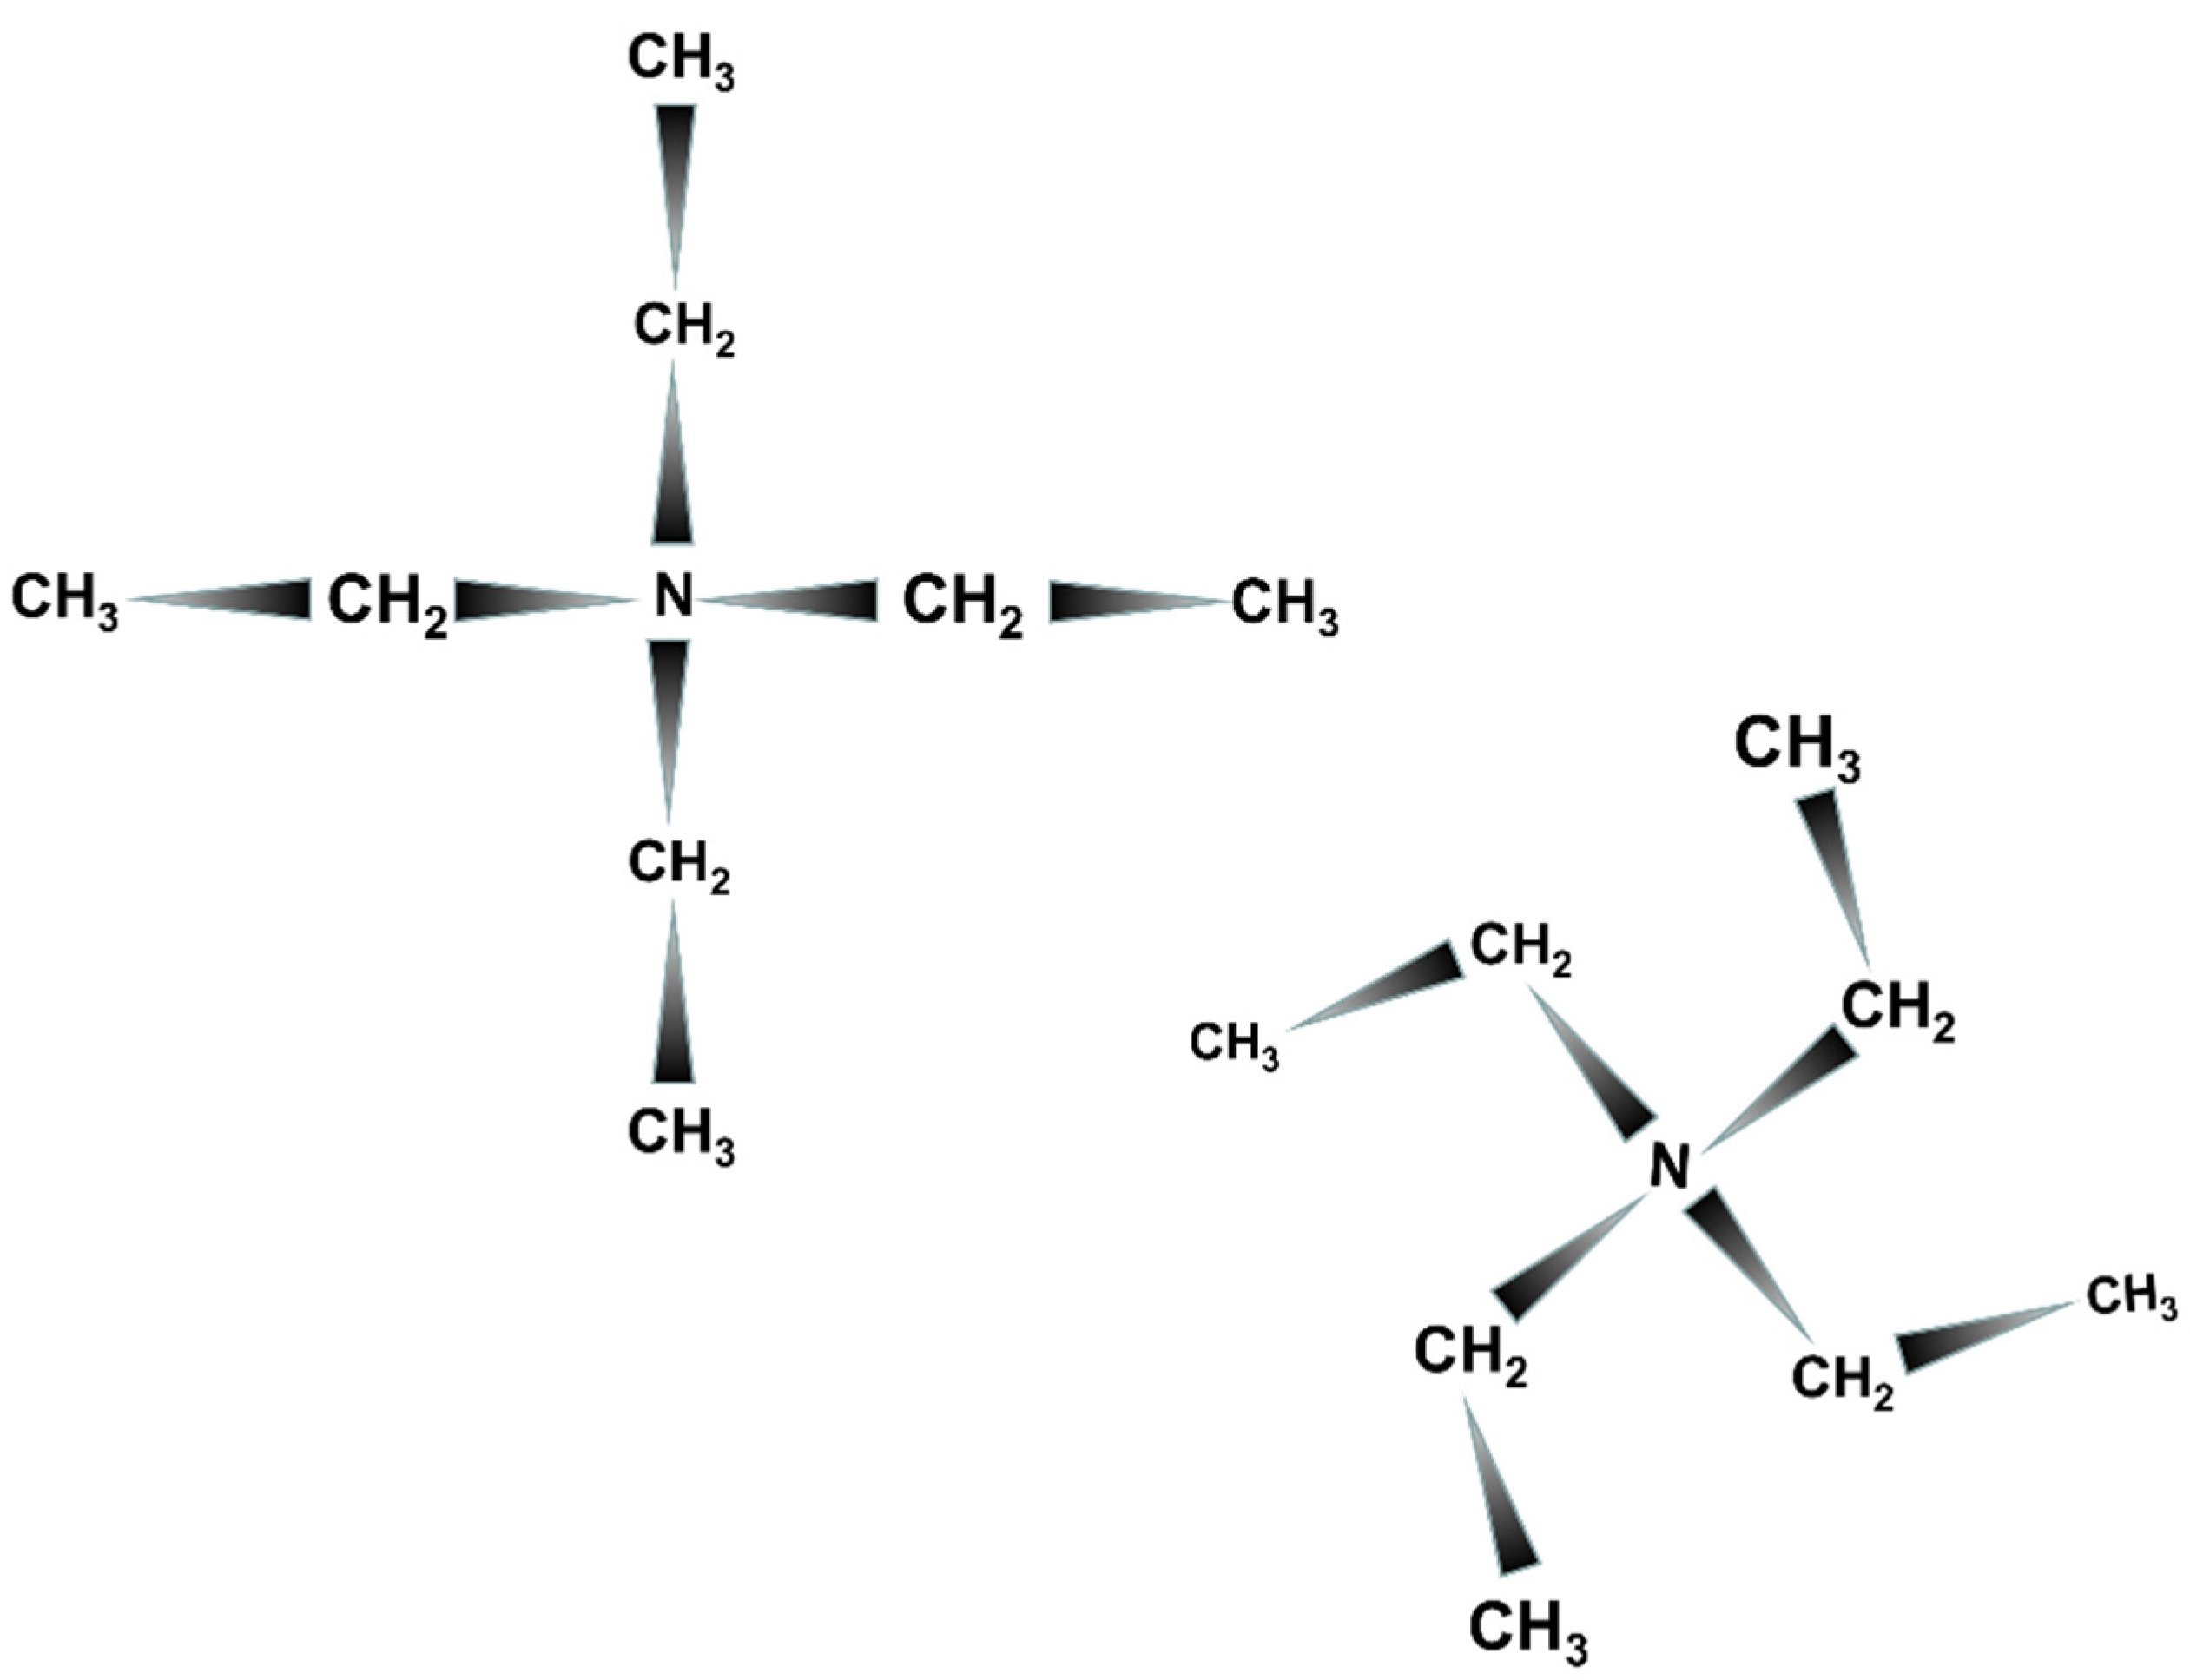
the type of the OSDA: TEAOH (Aldrich, 40% in water), TEABr (Sigma-Aldrich, 98%), tetraethylphosphonium bromide (Merck, 99%), tetraphenylphosphonium bromide (abcr, 98%), triethylamine (Merck, for synthesis), TEAOH + tetramethylammonium hydroxide (Merck, 25% in water);
-
the type of silica source: silica sol (Ludox HS40, Ludox TM50, Levasil 200A, Syton-HT50 Colloidal Silica Slurry), silica gel (Merck and homemade), borosilicate gel (homemade), fumed silica (Aerosil), mesoporous silica (calcined MCM-41, calc. MCM-48), mesoporous borosilicate (calc. B-MCM-41), crystalline sodium silicate (Na-RUB-18) and tetramethoxysilane (Sigma-Aldrich, 98%);
-
the type of the boron source: boric acid (J.T.Baker, p.a.), borosilicate gel (homemade), borax (Na₂B₄O₇·10H₂O) (Merck, p.a.);
-
the application of different heating schemes to the reaction mixture (preheated at 155 °C for different times), using preheated steel autoclaves, aged at room temperature;
-
and the addition of seeds.
Several synthesis series were carried out with about four hundred individual synthesis experiments. Three different series representing the most relevant experiments are listed in Section 3.1. The different reaction mixtures are presented in the synthesis results section.
In a typical experiment an aqueous solution of tetraethylammonium (40% in water) was mixed under stirring with the appropriate amount of distilled water. Subsequently, NaOH pellets were added. After the pellets had dissolved, the silica source was added. Finally, boric acid was added as a powder. The complete mixture was stirred for an additional 30 min.
The completed reaction mixtures were transferred to Teflon-lined steel autoclaves and heated for 3 to 21 days in an oven under rotation or static conditions. After reaction, the autoclaves were cooled and the solid products were then separated from the mother liquor, washed with distilled water and dried overnight at room temperature. Most synthesis series were carried out at 20 mL scale and selected recipes were also tested at 200 mL scale.
A part of the as-made COE-11 was calcined in air under static conditions. The oven was heated from RT to 550 °C with 1 K/min. This temperature was kept for an additional 10 h.

2.2. General Characterization

The general characterization and structural analysis were performed on the as synthesized material using the sample with highest COE-11 content (sample S21 with ca. 75 wt % COE-11, 15 wt % beta and 10% MTW-type zeolite). In the case of SEM, we used sample S08 to analyse the frequently occurring impurity phases beta, MTW and MFI (see Section 3.1, below).
Scanning electron micrographs were taken using a Zeiss Merlin Gemini 2 electron microscope to study the morphology of the crystals and the presence of impurities. The samples were gold coated by vacuum vapour deposition prior to analysis. For a semi- quantitative chemical analysis, an OXFORD AZtecEnergy X-ray microanalysis system attached to the electron microscope was used.
Thermal properties of the as-synthesized COE-11 were investigated by simultaneous DTA/TG measurements using a TA Instruments SDT650 thermal analyser. The samples were heated in air from 30 to 1200 °C with a heating rate of 10 °C/min.
A Nicolet 6700 FT-IR spectrometer equipped with a Smart Orbit Diamond ATR unit was used for FTIR-ATR spectroscopy on COE-11 and a sample of classical zeolite beta. The two spectra were recorded at room temperature in dry air between 400 and 4000 cm−1 with a resolution of 4 cm−1.
Solid-state MAS NMR spectra were recorded at room temperature with a Bruker ASX-400 spectrometer using standard Bruker MAS probes and operated at 400.147 MHz (1H), 100.631 MHz (13C) or 79.497 MHz (29Si). In order to average the chemical shift anisotropies, samples were spun about the magic angle. In all cases tetramethylsilane (TMS) was used as a chemical shift standard. Experimental parameters are listed in Table S1 of the Supplementary Materials.

2.3. Structure Analysis

The crystals of COE-11 were too small to perform conventional single-crystal X-ray diffraction experiments.
The collection of three-dimensional electron diffraction (3D ED) data from single crystals were carried out using the automated electron diffraction tomography (ADT) method [21] with a transmission electron microscope (TEM) FEI Tecnai F30 S-TWIN equipped with a field emission gun (300 kV). The powdered samples were dispersed in ethanol using an ultrasonic bath and sprayed on carbon-coated copper grid which was transferred to a cryo-transfer tomography holder (Fischione Instruments, M2040). Three-dimensional electron diffraction data were collected at room temperature as were the cryo conditions using the FAST-ADT module [22] implemented in GMS3 (Gatan GmbH), developed for FEI microscopes [23], on a Gatan UltraScan4000 CCD camera (16-bit, 4096 × 4096 pixels, bin 2). Mild illumination settings were used (condenser aperture of 10 μm, gun lens 8, spot size 8) in order to produce a semi-parallel beam of 200 nm in diameter (0.078 e-/Å2 s). The 3D ED data were collected with electron beam precession to improve the reflection intensity integration quality. The precession angle was kept at 1.0°. The eADT software package [24] and PETS2.0 [25,26] were used for 3D electron diffraction data processing. The structure was determined ab initio assuming the kinematic approximation I ~ |Fhkl|2 by direct methods as implemented in the program SIR2019 [27]. Scattering factors for electrons were taken from Doyle and Turner. The subsequent structure refinement of the initial structure model supported by repeated difference Fourier mapping was performed with the software SHELXL implemented in the SHELXLE interface [28,29]. While the coordinates of the framework atoms were refined freely, soft distance restraints were used for the TEA cation.
Powder XRD data were recorded from a Siemens D5000 powder diffractometer in modified Debye–Scherrer geometry using CuKα1 radiation (λ = 1.54059 Å). The samples were sealed in glass capillaries (0.3 mm in diameter) to avoid a preferred orientation of the crystals. The diffractometer was equipped with a curved germanium (111) primary monochromator and a Braun linear position-sensitive detector (2θ coverage = 6°). The structure model was refined using the FullProf 2K program [30] with scattering factors as implemented there. No absorption correction was necessary. Soft distance restraints were used for d(Si-O) = 1.60 (1) Å, d(Si...Si) = 3.05 (1) Å, d(O...O) = 2.62 (2) Å, d(C-C) = 1.54 (1) Å and d(N-C) = 1.50 (1) Å, d(C…C, next-next neighbour) = 2.50 (3) Å d(N…C, next-next neighbour) = 2.40 (3) Å. The isotropic displacement parameters Biso for crystal chemically similar atoms (all Si, all framework oxygen atoms and all atoms of the TEA cation) were constrained to be equal and fixed at crystal chemically meaningful values: Biso(Si) = 0.8 Å2, Biso(O) = 1.5 Å2 and Biso(N, C) = 2.0 Å2. The occupancy factors of the carbon atoms were increased to account for the protons as part of the methylene (occ. = 1.333) and methyl groups (occ. = 1.5). Anisotropic Lorentzian peak broadening, modelled by using spherical harmonics (nine parameters), was applied to the peak shapes. Drawings of the structure were made using the VESTA program [31].

3. Results and Discussion

3.1. Synthesis

Several synthesis runs led to the crystallization of COE-11, however, never as a pure phase. In most cases, COE-11 crystallizes together with zeolite Beta. Varying the synthesis parameters, many more porous and non-porous phases crystallized without or together with COE-11: the zeolite types *BEA, CHA, FER, MFI, MOR, MTW; the layered silicates magadiite [32] and kenyaite [33]; and searlsite [34] and quartz.
Synthesis Series I (Table 1): Variation of temperature. COE-11 crystallizes in a narrow temperature range of 160 to 167 °C. Lower temperatures yielded either amorphous material or predominantly zeolite beta. Higher temperatures led to the crystallization of quartz. In the course of synthesis experiments it seemed that an induction phase was necessary at a relatively low temperature (150–155 °C) to initially generate the crystal nuclei of COE-11 which then grew at ca. 160 to 168 °C. It is particularly favourable if the reaction mixture is heated first at 155 °C for 1–4 days before the autoclave is moved to an oven with 160–168 °C for 3–6 days.
Synthesis Series II (Table 2): Using different reaction times. A relatively short reaction time of ca. 1–4 days at 155 °C and 1–5 days at 165 °C appears to be most favourable for the production of COE-11. A prolonged reaction time at 165 °C (larger than ca. 7 days) hampers the crystallization of COE-11.
Synthesis Series III (Table 3): Variation of the silica source. It turned out that the silica source has an important impact on the solid product concerning the zeolite type formed. Although several silica sources led to the formation of COE-11, the best sources to obtain COE-11 are Ludox HS40 and fumed silica (Aerosil). Still, COE-11 always crystallizes together with at least one impurity phase.
All attempts to synthesize COE-11 using a different type of OSDA (tetraethylphosphonium bromide, tetraphenylphosphonium bromide, triethylamine, TEABr or tetramethylammonium hydroxide plus TEAOH) instead of TEAOH were unsuccessful.
Varying additional parameters, such as the concentrations of NaOH and boric acid, the purity of the water (deionized or distilled), the amount of water (3 to 28 mol), aging the reaction mixtures at room temperature, adding seeds or preheating the autoclaves, did not lead to a phase-pure COE-11 sample.
A first attempt to upscale the synthesis from 20 mL to 200 mL based on the best receipt as revealed from the systematic synthesis experiments (Table 1, Table 2 and Table 3) led predominantly to the formation of zeolite beta together with only a little COE-11 (see Figure S1).
Although COE-11could be produced in quite a number of synthesis experiments, only a small percentage of synthesis runs was successful, indicating that the experimental window for obtaining this phase is very narrow. In several cases, identical synthesis experiments led to the formation of different products—seemingly because of subtle, unrecognized differences of the synthesis parameters. No pure COE-11 sample could be synthesized and COE-11 crystals could not be separated from the impurity phases due to their similarities in crystal sizes, chemical stability and densities. Nevertheless, as TEA had already frequently been used in the past as an organic structure-directing agent in various synthesis mixtures, it was surprising to obtain a new and so far unknown zeolite under the synthesis conditions used in this case.
Figure S2 presents a comparison of the XRD powder diagrams of the purest sample (S21) and of a typical beta zeolite.

3.2. Characterization

COE-11 consists of plate-like, intergrown crystals (Figure 2). Individual crystals have diameters of ca. 1–3 μm and a thickness of about 0.2 μm. Typically, COE-11 is mixed with zeolite beta crystals which form the typical capped bipyramids. In the upper part of the SEM photograph one long needle representing a MTW type zeolite shows up as an additional impurity phase. The elements C, Si and O were observed in the chemical analysis. The sample is free of sodium and aluminium. Boron cannot be detected by the EDX analysis.
Thermal analysis (DTA and TG) of as-made COE-11 presents a first weight loss between 30 and 110 °C of about 0.9% which is due to the loss of a small amount of adhesive water (Figure 3). The following slight weight loss (ca. 0.7%) between 100 °C and 220 °C is assigned to pore filling water. The main decrease in weight starting at ca. 220 °C amounts to 14.0% and represents the burn off and expulsion of the organic material included in the structure. A strong exothermal peak of the DTA curve at 415 °C indicates the combustion of the TEA cation. Another exothermal peak at 915 °C indicates the phase transition of the organic-free COE-11 framework into cristobalite (confirmed by a PXRD measurement). Adjusted to a unit cell content of 66 TO2 units (4 B + 62 Si, see the structure analysis below) the weight losses indicate a composition of 66 TO2, 1.6 H2O and 4.4 tetraethylammonium cations. The slight deviation from the composition, as obtained by the structure analysis, is probably due to the presence of some zeolite beta as an impurity phase.
The FTIR spectrum of COE-11 (Figure 4) was compared with the spectrum of a classical zeolite beta sample that was additionally synthesized with tetraethylammonium [35]. The spectrum of COE-11 shows only a very weak adsorption band at ca. 2970 cm−1 which can be assigned to asymmetric C-H stretching vibrations. However, two sharp and intense signals at 1484 cm−1 and 1394 cm−1 are typical for the C-H bending vibrations of the TEA cation and indicate that this cation is present in the structure. In accordance with the TGA, the FTIR spectrum proves that as-made COE-11 contains very little water. There are hardly any absorption bands around 3300 cm−1 (OH stretching) and around 1630 cm−1 (OH bending) that are typical for water. The region between 400 and 1250 cm−1 is difficult to interpret since lattice vibrations of the silicate layer and absorption bands of the TEA cation coincide here. The bands can be tentatively assigned as follows [36]: the bands at 1211 and 1170 cm−1 and the strong band at 1041 cm−1 represent the asymmetric stretching vibration of Si-O-Si units; the band at 782 cm−1 can be assigned to symmetric stretching vibrations of the silicate framework; and the band at 427 cm−1 represents the bending vibrations. Other bands cannot be assigned to specific units of the structure. The spectra of zeolite beta and COE-11 are very similar but differ particularly in the regions of 500 to 700 cm−1 and 850 to 950 cm−1. As an example of this, the signals at 627 cm−1 (weak) and 902 cm−1 (strong) distinguish the COE-11 from beta.
The 11B MAS NMR spectrum (Figure 5) presents one sharp peak at −3.8 ppm, indicating that boron is part of the structure of COE-11 and possesses a very symmetric coordination sphere [37]. It can be concluded that boron is tetrahedrally coordinated, occupying T sites in the silicate framework of COE-11.
The 29Si CP MAS NMR spectrum (Figure 6) shows two broad signals representing 4-connected Si-units which are assigned to Q4-type silicon atoms [Si3B1] for the peak at δ -103.0 ppm, and Q4-type silicon [Si4] at δ −109.3 ppm. The intensity ratio of the signals is Q4[Si3B1]:Q4[Si4] ≈ 1:5. The low Q4[Si3B1]:Q4[Si4] ratio and the fact that there are no 4-connected Si-units with [Si2B2] are indicative of a low boron content of about Si/B ≈ 10.
The 1H spectrum (Figure 7) displays one asymmetric signal with a strong, sharp peak at 1.31 ppm, a shoulder at ca. 3.5 ppm—both attributed to the protons of the TEA cation—and an additional shoulder at ca. 5 ppm assigned to the presence of a few water molecules. For comparison, the 1H chemical shift values of N(C2H5)4-BF4: are reported as 3.2 ppm and 1.2 ppm [38].
The 13C CP NMR spectrum (Figure 8) shows two fairly sharp peaks with chemical shift values of 6.9 ppm and 52.0 ppm. Corresponding values for the TEA cation from the literature are 7.9 ppm (methyl group) and 52.3 ppm (ethylene group) [39] proving that tetraethylammonium cations are in fact occluded in the pore volume of COE-11.

3.3. Structure Analysis

3.3.1. Structure Determination

The X-ray powder diagram (see Figures S2 and S4) presents reasonably sharp reflections which are indicative of a structurally well-ordered material. A list of reflections of COE-11 is presented in Table 4. A first attempt at indexing the X-ray powder reflections yielded a monoclinic lattice with lattice parameters a0 = 12.28 Å, b0 = 12.29 Å, c0 = 27.41 Å and ß = 107.3° in space group Pc or P2/c. A LeBail fit based on this unit cell seemed to confirm the indexing since it converged to an excellent chi2 value of 2.3. However, because of the complex structure (see below) all attempts to solve the structure directly from the XRD powder data failed. Therefore, 3D electron diffraction data were collected.
Four isolated crystals were measured under cryo conditions using the FAST-ADT method and the acquired 3D ED datasets were reconstructed as 3D diffraction volume using eADT [24]. The analysis of the 3D electron diffraction data at room temperature revealed the true unit cell of COE-11 with approximate dimensions of a0 = 17.34 Å, b0 = 17.67 Å, c0 = 14.42 Å and β = 113.7° leading to a volume of 3957 Å3. The unit cell parameters were refined on the XRPD diagram (a = 17.3598Å, b = 17.3396Å, c = 14.2876Å, α = 90°, β = 113.756°, γ = 90°) and used for crystal structure solution and refinement procedures. The reconstructed reciprocal volume as shown exemplarily in Figure 9 reveals the C-centering of the determined cell. No c-glide plane perpendicular to b could be detected, leaving three possible space groups: C2, Cm and C2/m.
Attempts to introduce the mirror plane failed, but by using space group C2 the subsequent ab initio structure solution with SIR2019 [25] using reflections down to a resolution of 1Å was successful for all four data sets. The largest data set had 2148 independent reflections, a completeness of 99% with an internal R-value of 11.81%, and an overall Biso of 0.73. Details on structure solution and refinement are listed in Table S2. The detected maxima could be assigned to 19 silicon atoms (4.26–2.49 e/A3) and 33 oxygen atoms (2.49 to 1.59 e/A3). The next maxima (0.61–0.41 e/A3) are situated in the pores and represent parts of the TEA template molecule. The structure solution gave a residual of R = 19.6% and atomic positions below a residual of 0.4 e/A3, maxima close to the silicate network and those exhibiting a high temperature factor were neglected.

3.3.2. 3D Electron Diffraction—Structure Refinement

The solved structure of the silicate network was refined without restraints using isotropic atomic displacement parameters (ADPs) to RF = 23.04% using SHELXL [28]. Atomic distances Si-O vary from 1.51–1.68 Å. None of the silicon positions could be assigned to be partly occupied by boron. Prominent broad scattering potential maxima in the pore volume of the framework are likely to origin from the tetraethylammonium template. In a second step, soft restraints (Si-O 1.60 Å and O-O 2.62 Å) were applied to the silicate network and the remaining potential in the pores was described by the addition of a TEA cation. The refinement converged to RF = 22.87%. Finally, the EXTI command was applied, leading to an RF = 21.81%. Table S3 lists the atom types, atom coordinates, occupancies, and isotropic atomic displacement parameters. TEA cations are located on a general position in the channel-like pores of the framework. Soft restraints d(N-C) 1.50 Å and d(C-C) 1.54 Å, carbon–carbon distance (C-N-C) 2.50 Å, and nitrogen–carbon distance (N-C-C) 2.40 Å) and a common ADP were used for refinement. Hydrogen atoms were defined as riding atoms. Common atomic occupancy factors of N, C and H atoms representing the cation were refined to only 0.5. A relatively high common ADP of the organic cations (U = 0.31 Å) indicate their flexibility in the pore. The highest remaining residual potential that could not be assigned to a specific atom had a value of 0.34 e3 and was not included in the refinement.

3.3.3. Structure Refinement Based on PXRD Data

For the Rietveld structure refinement, the atomic coordinates of the Si and O atoms, as determined by the ADT analysis, were used as a starting model. The XRD pattern of sample S21 exhibits the presence of two additional phases: zeolite beta and a zeolite of the MTW type.
Since the structure of beta is disordered and cannot be included in the refinement as a crystalline phase, the powder pattern of a pure (boron containing) beta sample synthesized from the same reaction mixture as COE-11 was subtracted from the XRD pattern of sample S21 (after adjusting the scale factor). The structure of the MTW-type zeolite was included in the refinement to generate the corresponding reflection intensities, but without refining structural parameters. Only the lattice parameters were refined. The powder pattern confirms that COE-11 possesses a C-centered lattice. The refinement of the complete model was performed with the FullProf 2K program [30] assuming space group symmetry C2. The details of the data collection and the results of the structure refinement are summarized in Table S4. Soft distance restraints were used during the refinement as described in the experimental part.
The starting model was sufficient to locate the positions of the nitrogen and carbon atoms of the TEA cations after refining the atomic coordinates of the framework atoms. A difference Fourier map, taking into account only the framework atoms, presented some remaining electron density in the channel-like voids. Separated electron density “clouds” resemble rather flat, roughly cross-like spots (see Figure S3). No electron density was observed at the channel intersections (around 0.0, 0.25, 0.0). The structure refinement finally proved that four TEA cations per unit cell complete the structure of COE-11 and that the occupancy factor of the cation refined to 1.003(24). COE-11 does not contain any structural water, though it is possible that a few water molecules (1–2 molecules per unit cell) are occluded in the channel intersections partly occupying random positions in the structure.
As indicated by the 11B NMR spectrum, the silicate framework contains some boron atoms at T sites. In a final step, all occupancy factors of the Si atoms were refined. It turned out that the factors of three particular Si atoms decreased significantly, indicating that the boron atoms preferentially occupy the T sites 14, 16 and 19. It cannot completely be excluded that small amounts of boron replace Si at other T sites as well. The boron content was fixed at 4 B atoms per unit cell.
The refinement in the space group C2 finally converged to residual values RF = 0.039 and chi2 = 3.6 confirming the structure model (see also Figure S4).

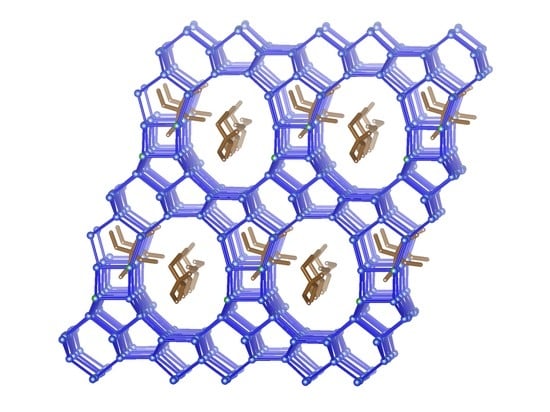
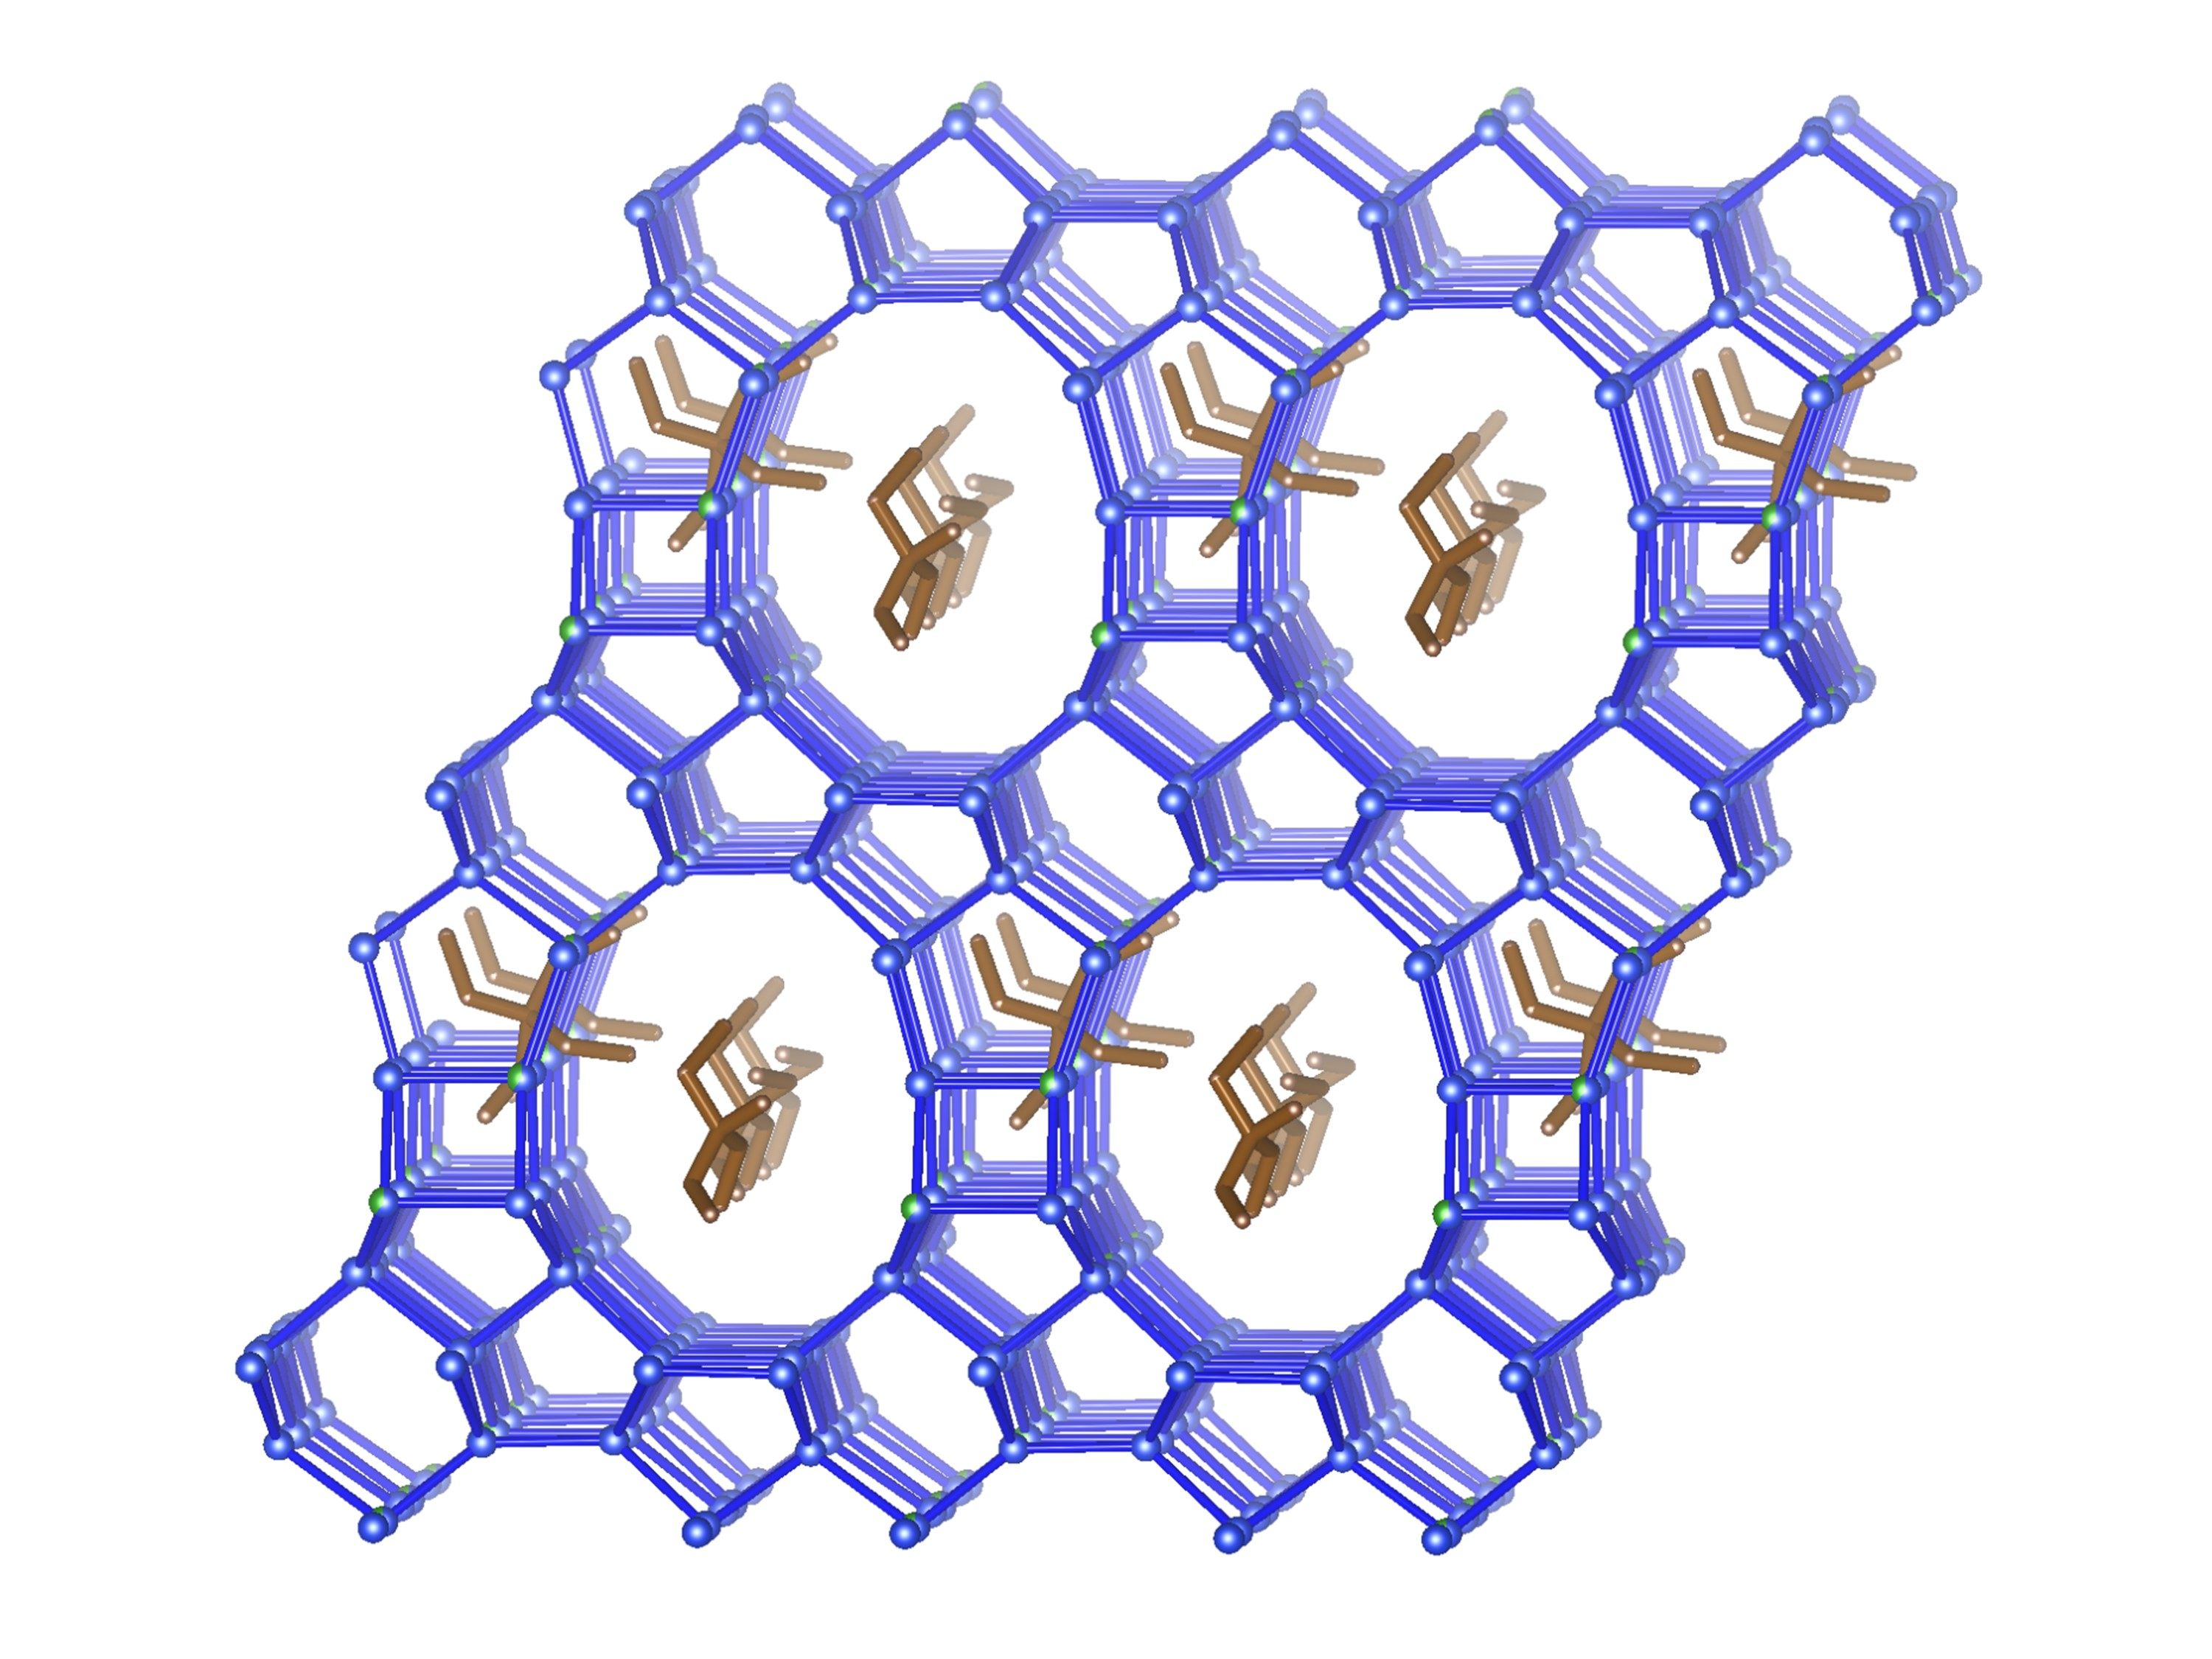
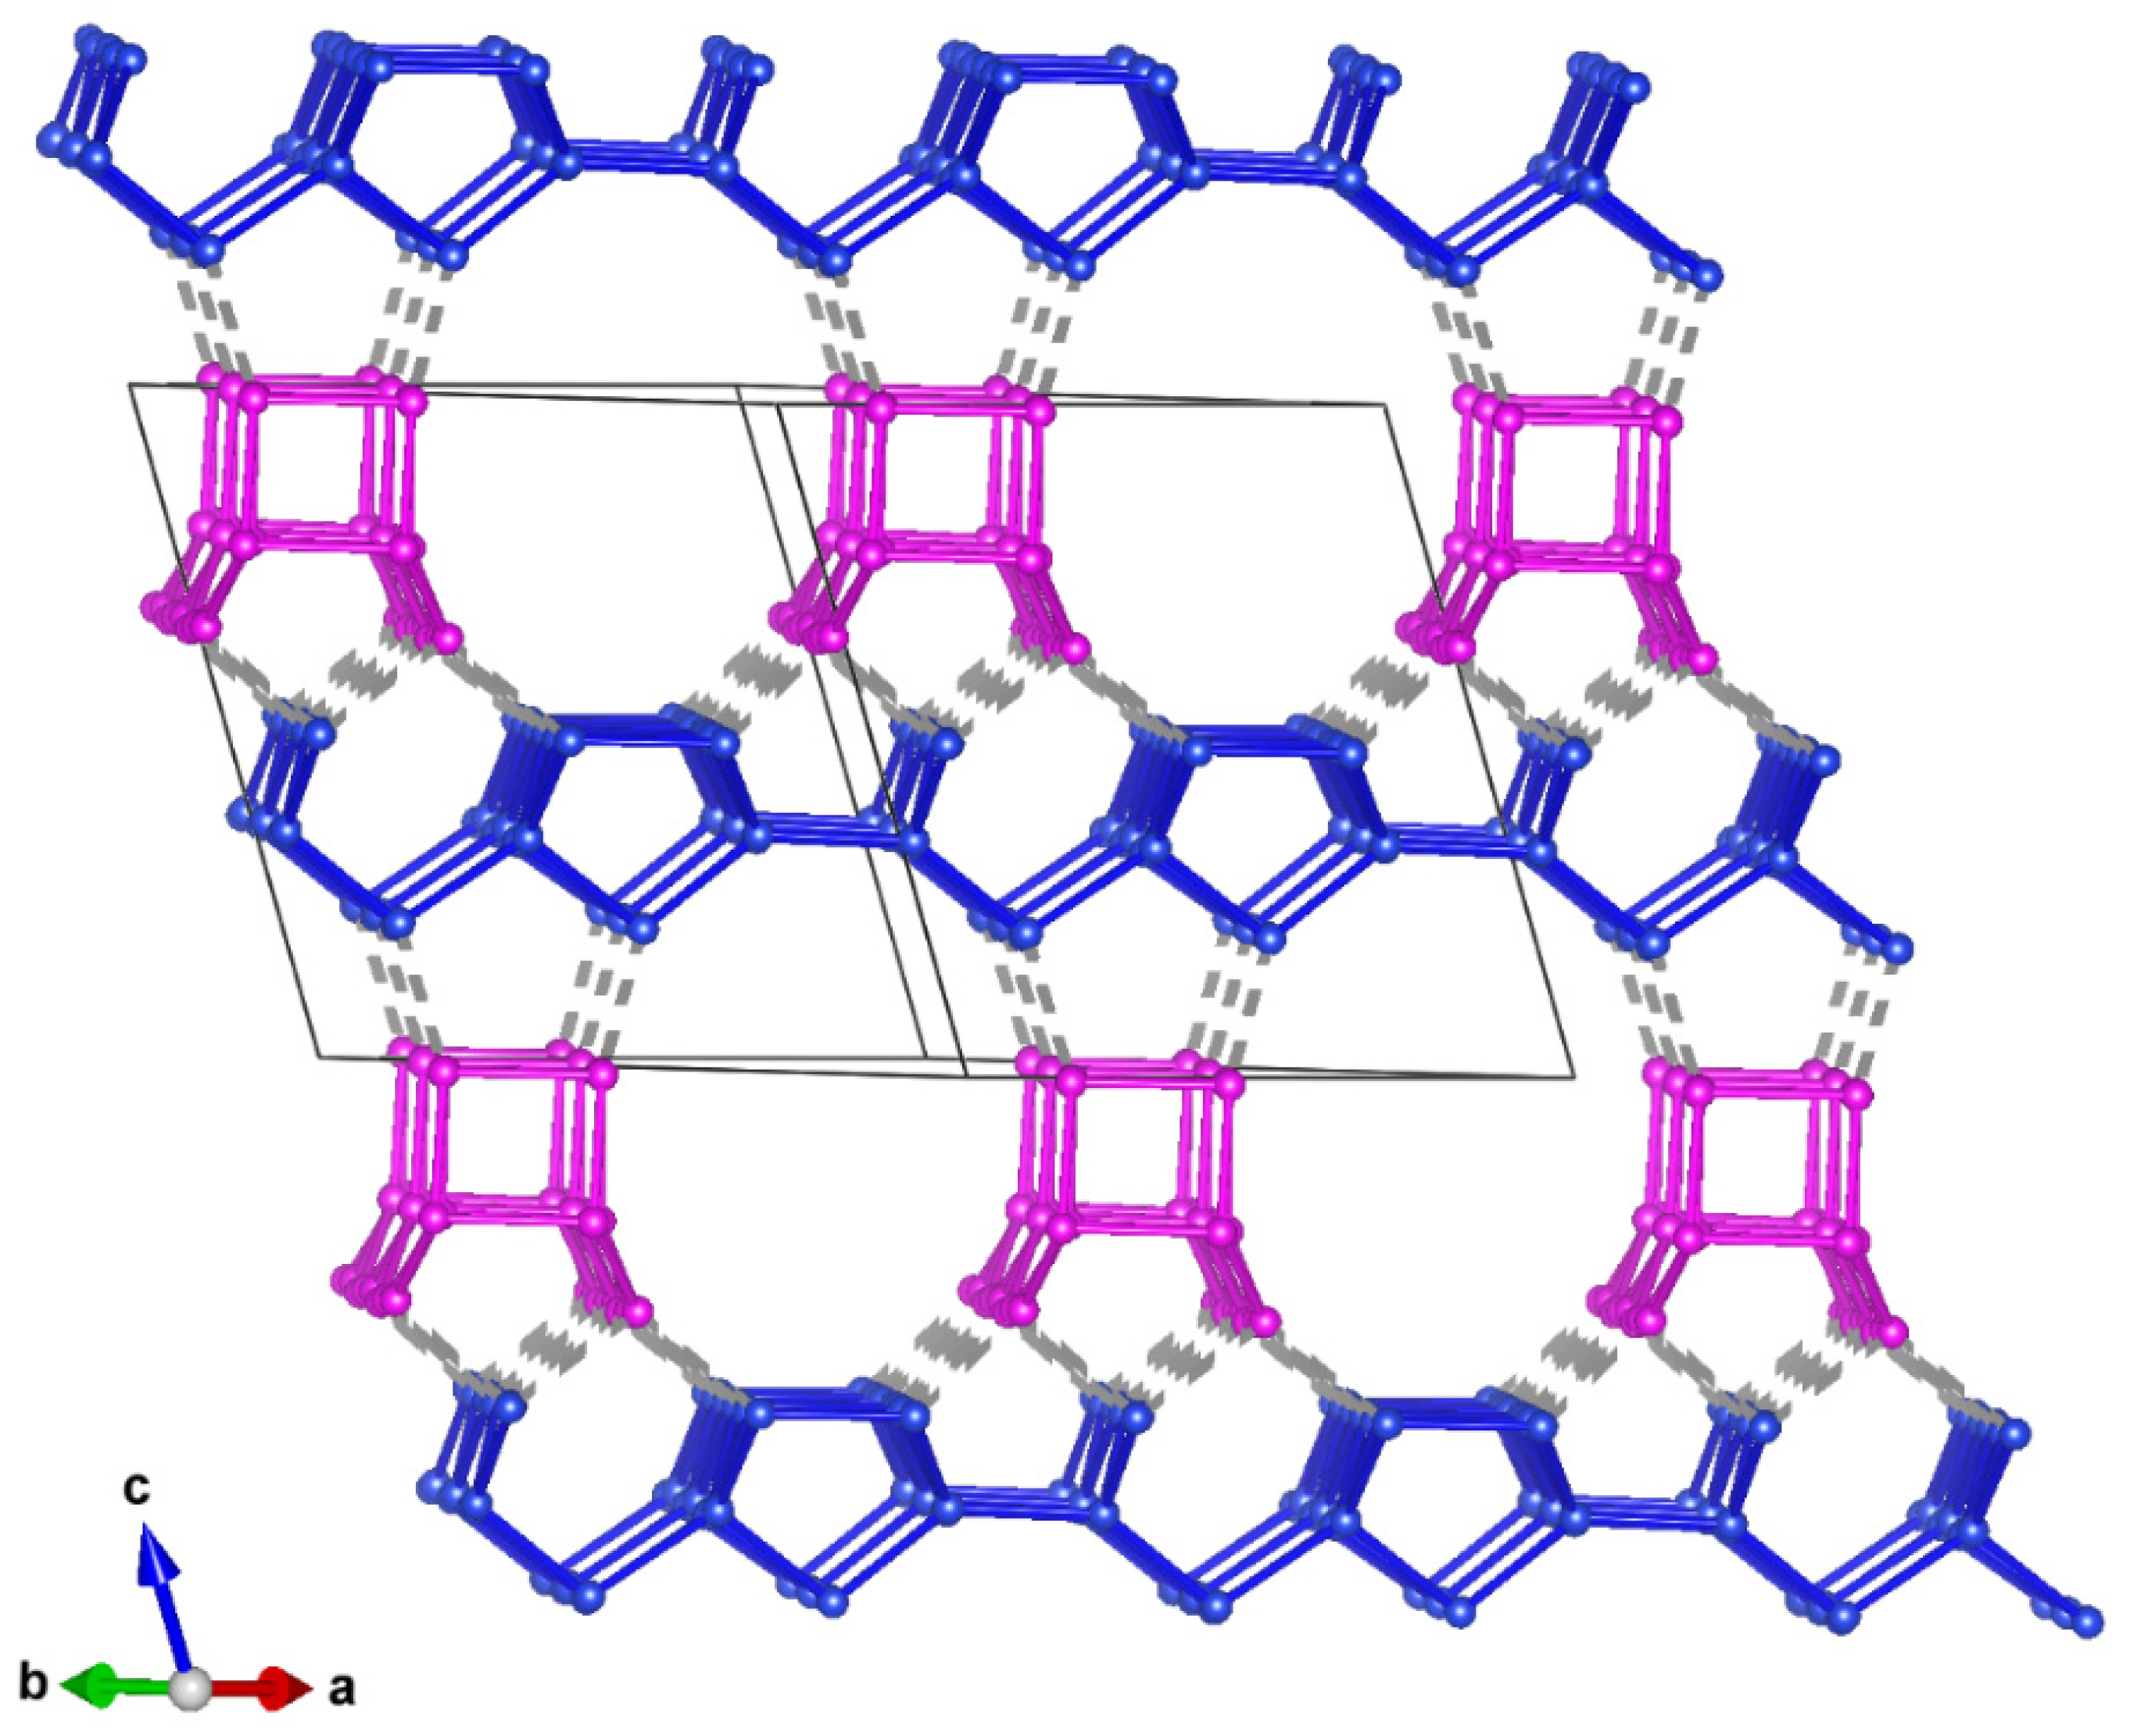
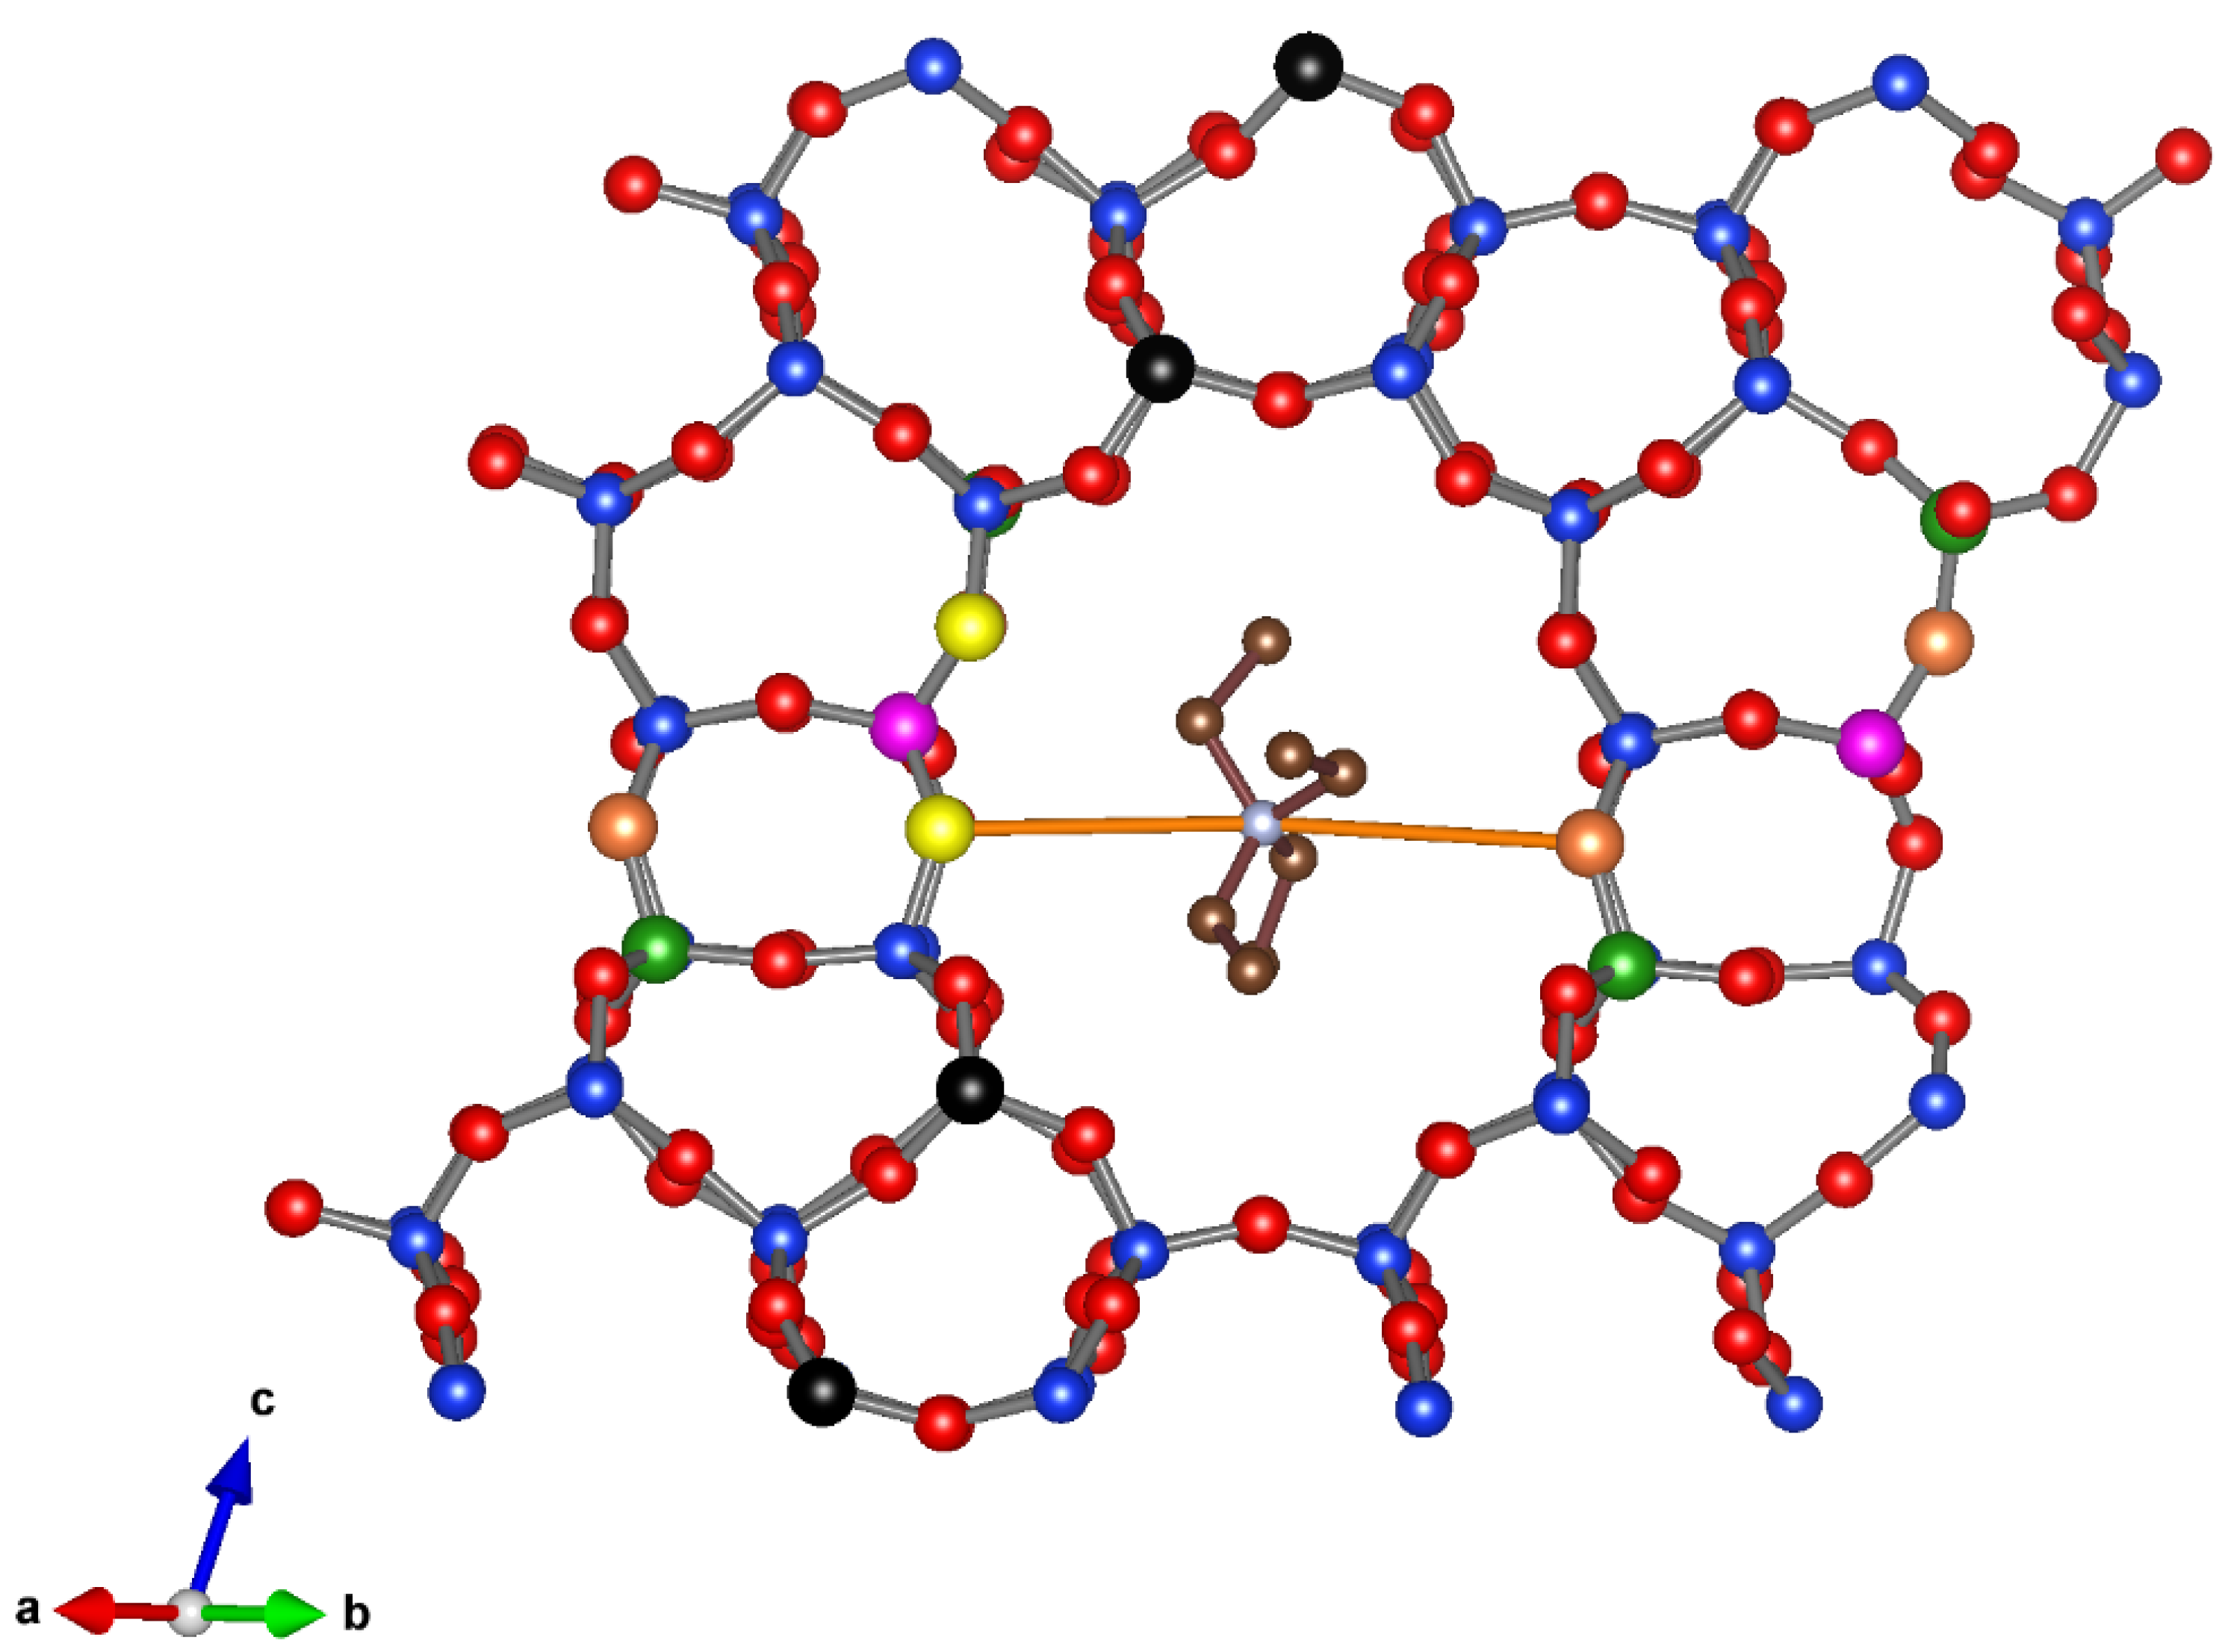
3.3.4. Description of the Structure

The idealized unit cell content of COE-11, according to both structure analyses, chemical analysis (EDX), charge compensation, TG and NMR spectra, is [(C2H5)4N]4 [B4Si62O132]. COE-11 has a quite complex structure. There are 19 symmetrically independent Si/B sites and 33 independent oxygen sites in the framework. The pore volume contains the tetraethylammonium cations used as structure directing agents during synthesis. According to the Rietveld structure analysis the distances between atoms vary in the ranges d(Si-O) = 1.55(5) Å to 1.64(5) Å, d(Si…Si) = 2.95(2) Å to 3.18(4) Å, d(O…O) = 2.44(4) Å to 2.75(6) Å, d(N-C) = 1.50(6) Å to 1.53(5) Å and d(C-C) = 1.53(9) Å to 1.55(12) Å. Atomic coordinates, displacement parameters and occupancy factors can be taken from the cif. file. Estimated standard deviations must be multiplied by a factor of 3.05.
The projections of the framework structure of COE-11 along (110) and (1–10) look nearly identical to the corresponding projections of zeolite Beta polytype B (see Figure 10). COE-11, however, has a two-dimensional pore system of intersecting 12-ring channels running parallel with (110) and (1–10) and with four channel intersections per unit cell. The channels of COE-11 are highly elliptical with free diameters of 5.9 Å × 7.9 Å, different to the channels running along (100) of the idealized beta Polymorph A (6.6 Å * 6.7 Å) [40]. There are only two other zeolite framework types that have a two-dimensional pore system of intersecting 12-ring channels: IWV (alumosilicate ITQ-27) and SSF (borosilicate SSZ-65) [19,20].
The fact that the structure of COE-11 is closely related to the structures of the beta family becomes obvious if cutting the framework of COE-11 parallel to (001) into two layer-like building units: dense layer-like building unit (LLBU-A) and interjected rod-like units LLBU-B. The LLBU-A is made up of 4-, 5- and 6-rings, forming a complete layer of interconnected tetrahedra (see Figure 11).
The LLBU-A of COE-11 is very similar to the layer-like building unit of zeolite beta (Figure 11, bottom) with the significant difference that the 12-ring pore of the beta LLBU is closed in COE-11. The LLBUs are stacked along the c axis in a sequence—LLBU-A => LLBU-B => LLBU-A … (see Figure 12). The intercalation of the rod-like LLBU-B units between LLBU-A units creates a two-dimensional pore system of intersecting 12-ring channels.
Both structure refinements prove that the tetraethylammonium cations complete the structure of COE-11 occupying one (four-fold) crystallographic site in the structure with individual positions in both 12-ring channels and show that it is surrounded by channel walls. The channel intersections are empty. The TEA cations are occluded in approximately the tt.tt conformation (see Figure 10 and Figure 13), similar to zeolite beta.
According to the Rietveld refinement, the boron atoms are not randomly distributed about all T sites and do not exclusively occupy specific T sites of the framework. This finding may be regarded as a provisional result since the PXRD data contained reflection intensities of two impurity phases which may have not perfectly been covered by the Rietveld refinement. It seems that boron preferentially occupies the T sites no. 14, 16 and 19. This can be rationalized looking at the distances between the positively charged nitrogen atom of the TEA cation and the oxygen atoms of the framework, the shortest distances are observed for d(N1…O8) = 4.29(6) Å and d(N1…O10) = 4.22(9) Å. O8 and O10 are bonded to boron containing sites T14 and T19, respectively and will carry a (partial) negative charge (Figure 13). All other N…O distances are larger than 4.5 Å. T14 and T19 are part of the same 4-ring and it can be assumed that in a particular ring either T14 or T19 is occupied by boron. The reason why T16 seems, as well, to be partially occupied by boron cannot be explained.
A comparison of the structure analyses based on 3D ED and PXRD data shows a good correspondence of the two analyses. The refinements led to the same framework topology with closely matching atomic coordinates. Also, the location and conformation of the TEA cation is very similar. In both cases no water molecules or sodium cations were detected in the structure. Two differences, however, exist. The Rietveld refinement indicated that boron partly replaces silicon at three T sites (T14, T16 and T19) while the refinement on 3D ED data gave no indication of specific boron sites, suggesting a random distribution of boron about all T sites. It must be kept in mind that the PXRD data contained reflection intensities of two impurity phases, which may not have been perfectly covered by the Rietveld refinement. While the displacement parameters of the carbon and nitrogen atoms refined to quite high values when using 3D ED data, these parameters had to be fixed in the Rietveld refinement. Large displacement parameters of the TEA cations seem plausible because only weak interactions exist between the silicate framework and the large cation carrying a single positive charge.
The COE-11 crystals can be calcined and dehydrated by heating the material in air at 550 °C without destruction of the framework structure (see Figure S5). The diffraction peaks are still sharp, indicative of a well-ordered structure. The unit cell volume of the guest-free COE-11 is slightly smaller than of the as-made COE-11. Heating COE-11 up to 926 °C or higher leads to a breakdown of the structure and disordered cristobalite is formed.

4. Conclusions

Since TEA has very often been used in the past as an organic structure-directing agent in various synthesis mixtures, it is quite surprising that another new zeolite type could be made with TEA as presented in this study. Yet, the synthesis of COE-11 proved to be difficult. In all synthesis runs, impurity phases (primarily zeolite beta) were present. In spite of the systematic variation of synthesis parameters it was not possible to crystallize pure COE-11. Moreover, quite often identical synthesis runs led to different crystalline products.
The structure of COE-11 could be solved from 3D electron diffraction data and was subsequently refined based on the 3D ED data and also on X-ray powder diffraction data. The structure analysis based on powder diffraction data is of somewhat limited quality because of the presence of impurity phases (zeolite beta and MTW-type zeolite) which contribute to the diffraction diagram. Nevertheless, structure determination and refinement still provide key information to recognize the potential of COE-11 for industrial application and for a further development of the material in the future. Structural characterization of a new zeolite is most important in order to realize e.g., the accurate pore sizes and the distribution of hetero atoms about the framework. In the case of COE-11 the structure analysis revealed the existence of highly elliptical 12-ring channels with free diameters of 5.9 × 7.9 Å2 and disclosed that boron may partly occupy three distinct T sites within a total of 19 T sites of the silicate framework. The presence of boron at specific T sites of the framework, combined with the elliptical channel geometry may lead to interesting (shape selective) catalytic properties. The structure analysis also allows one to locate the TEA cation within the pore system and can show the specific geometry which the cation adopts in the channel-like pore (close to the tt.tt conformation).
COE-11 is a new example of a large-pore zeolite with a two-dimensional pore system of intersecting 12-ring channels. Only very few zeolites possess this type of pore geometry: IWV and SSF. Other zeolite framework types with a two-dimensional pore system and 12-ring channels combine these channels with 8- (AFR, EON, MOR, SFO), 10- (OKO, *PCS, SEW, SFS, USI) or 14-ring (UTL) channels. There is a close structural correspondence between COE-11 and zeolite beta polymorph B, they differ mainly in terms of the dimensionality of the pore system (2D instead of 3D).

Supplementary Materials

The following supporting information can be downloaded at: https://www.mdpi.com/article/10.3390/chemistry5020052/s1, Figure S1: XRD powder patterns of products from 200 mL scale syntheses with gel composition 1 SiO2/0.1 H3BO3/0.25 NaOH/0.33 OSDA/16 H2O using Ludox HS-30 as Si-source and crystalized for (a) 4 days at 155 °C, (b) 4 days at 155 °C followed by 3 days at 165 °C, (c) 4 days at 155 °C followed by 4 days at 165 °C and (d) 4 days at 155 °C followed by 5 days at 165 °C. Figure S2: Comparison of XRD powder patterns of COE-11 (sample S21, top) and classical disordered Beta (bottom). Figure S3: Left: Difference Fourier map based on PXRD data considering only the framework atoms. The remaining positive electron density in the channel-like voids (yellow) represents the TEA cations; right: Section of a Fourier map based on 3D ED data showing a similar potential in the zeolite pores being related to the TEA cation. Figure S4: Plot of diffraction patterns after Rietveld analysis: Experimental data (red), calculated data (black), the difference plot (blue) and allowed reflections (green tick marks) are presented. Figure S5: Comparison of PXRD patterns of as-made COE-11 (bottom), calcined and dehydrated COE-11 (middle) and disordered cristobalite obtained by heating COE-11 up to 1000 °C (top). Table S1: Recording conditions of the NMR spectra. Table S2: Crystallographic information about 3DED/FAST-ADT measurements, structure solution and refinement of COE-11. Table S3: Atomic coordinates, isotropic atomic displacement parameters and occupancies of as-made COE-11 (3D ED data). Table S4: Experimental and crystallographic parameters for the Rietveld analysis of COE-11.

Author Contributions

B.M.: Investigation (synthesis and general characterization of the materials, and the structure analysis based on PXRD data) and writing (original draft preparation); U.K.: investigation (structure analysis based on 3D ED data) and writing (original draft preparation); T.D.B.: investigation (synthesis of materials), project administration and funding acquisition; A.-N.P.: investigation (synthesis of materials), project administration and funding acquisition; D.D.V.: investigation (synthesis of materials); F.-S.X.: investigation (synthesis of materials); X.M.: investigation (synthesis of materials); H.G.: conceptualization (synthesis methods) and writing (original draft preparation); U.M.: conceptualization (design of promising materials); W.Z.: investigation (general characterization of the materials); T.Y.: investigation (general characterization of the materials). All authors have read and agreed to the published version of the manuscript.

Funding

This research was funded by the International Network of Centers of Excellence (INCOE) project coordinated by BASF SE, Germany.

Data Availability Statement

Data is contained within the article or Supplementary Material.

Acknowledgments

The authors would like to thank Antje Grünewald-Lüke, Sandra Grabowski, Nina Becker and Adam Wieczorek (Bochum, Germany) for a multitude of synthesis experiments and would like to thank anonymous reviewers for helpful comments which led to an improved manuscript.

Conflicts of Interest

There are no known conflict of interest to declare.

References

  1. Rhodes, C.J. Properties and applications of zeolites. Sci. Prog. 2010, 93, 223–284. [Google Scholar] [CrossRef] [PubMed]
  2. Dedecek, J.; Balgova, V.; Pashkova, V.; Klein, P.; Wichterlová, B. Synthesis of ZSM-5 Zeolites with Defined Distribution of Al Atoms in the Framework and Multinuclear MAS NMR Analysis of the Control of Al Distribution. Chem. Mater. 2012, 24, 3231–3239. [Google Scholar] [CrossRef]
  3. Dedecek, J.; Sobalík, Z.; Wichterlová, B. Siting and Distribution of Framework Aluminium Atoms in Silicon-Rich Zeolites and Impact on Catalysis. Catal. Rev. Sci. Eng. 2012, 54, 135–223. [Google Scholar] [CrossRef]
  4. Gies, H.; Marler, B. The structure controlling role of organic templates for the synthesis of porosils in the system SiO2/template/H2O. Zeolites 1992, 12, 42–49. [Google Scholar] [CrossRef]
  5. Lobo, R.F.; Zones, S.I.; Davis, M.E. Structure-Direction in Zeolite Synthesis. In Inclusion Chemistry with Zeolites: Nanoscale Materials by Design; Topics in Inclusion Science; Herron, N., Corbin, D.R., Eds.; Springer: Dordrecht, The Netherlands, 1995; Volume 6. [Google Scholar]
  6. Burton, A.W.; Zones, S.I. Organic Molecules in Zeolite synthesis: Their preparation and Structure-Directing effects. In Studies in Surface Science and Catalysis; Cejka, J., van Bekkum, H., Corma, A., Schueth, F., Eds.; Elsevier: Amsterdam, The Netherlands, 2007; Volume 168, pp. 137–179. [Google Scholar]
  7. Gómez-Hortigüela, L. Insights into the Chemistry of Organic Structure-Directing Agents in the Synthesis of Zeolitic Materials. In Structure and Bonding; Springer: Berlin, Germany, 2018; p. 175. [Google Scholar]
  8. Szostak, R. Hydrothermal Zeolite Synthesis. In Molecular Sieves, Principles of Synthesis and Identification; Springer: Dordrecht, The Netherlands, 1989; pp. 51–132. [Google Scholar]
  9. Marler, B.; Gies, H. Hydrous layer silicates as precursors for zeolites obtained through topotactic condensation: A review. Eur. J. Mineral. 2012, 24, 405–428. [Google Scholar] [CrossRef]
  10. Roth, W.J.; Nachtigall, P.; Morris, R.E.; Čejka, J. Two-Dimensional Zeolites: Current Status and Perspectives. Chem. Rev. 2014, 114, 4807−4837. [Google Scholar] [CrossRef]
  11. Wu, Q.; Meng, X.; Gao, X.; Xiao, F.-S. Solvent-Free Synthesis of Zeolites: Mechanism and Utility. Acc. Chem. Res. 2018, 51, 1396–1403. [Google Scholar] [CrossRef]
  12. Goel, S.; Zones, S.I.; Iglesia, E. Synthesis of Zeolites via Interzeolite Transformations without Organic Structure-Directing Agents. Chem. Mater. 2015, 27, 2056–2066. [Google Scholar] [CrossRef]
  13. Caullet, P.; Paillaud, J.-L.; Simon-Masseron, A.; Soulard, M.; Patarin, J. The fluoride route: A strategy to crystalline porous materials. C. R. Chim. 2005, 8, 245–266. [Google Scholar] [CrossRef]
  14. Lewis, G.J.; Miller, M.A.; Moscoso, J.G.; Wilson, B.A.; Knight, L.M.; Wilson, S.T. Experimental Charge Density Matching Approach to Zeolite Synthesis. Stud. Surf. Sci. Catal. 2004, 154, 364–372. [Google Scholar]
  15. Opanasenko, M.; Shamzhy, M.; Wang, Y.; Yan, W.; Nachtigall, P.; Čejka, J. Synthesis and Post-Synthesis Transformation of Germanosilicate Zeolites. Angew. Chem. Int. Ed. 2020, 59, 19380–19389. [Google Scholar] [CrossRef] [PubMed]
  16. Eliášová, P.; Opanasenko, M.; Wheatley, P.S.; Shamzhy, M.; Mazur, M.; Nachtigall, P.; Roth, W.J.; Morris, R.E.; Čejka, J. ADOR mechanism for the synthesis of new zeolites. Chem. Soc. Rev. 2015, 44, 7177–7206. [Google Scholar] [CrossRef] [PubMed] [Green Version]
  17. Deneyer, A.; Ke, Q.; Devos, J.; Dusselier, M. Zeolite Synthesis under Nonconventional Conditions: Reagents, Reactors, and Modi Operandi. Chem. Mater. 2020, 32, 4884–4919. [Google Scholar] [CrossRef]
  18. Schmidt, J.E.; Fu, D.; Deem, M.W.; Weckhuysen, B.M. Template–Framework Interactions in Tetraethylammonium-Directed Zeolite Synthesis. Angew. Chem. Int. Ed. 2016, 55, 16044–16048. [Google Scholar]
  19. Baerlocher, C.; Cusker, L.B.M.; Olson, D.H. Atlas of Zeolite Framework Types, 6th Revised ed.; Elsevier: Amsterdam, The Netherlands, 2007. [Google Scholar]
  20. Database of Zeolite Structures. Available online: http://www.iza-structure.org/databases/ (accessed on 1 March 2023).
  21. Kolb, U.; Gorelik, T.; Kübel, C.; Otten, M.T.; Hubert, D. Towards automated diffraction tomography: Part I—Data acquisition. Ultramicroscopy 2007, 107, 507–513. [Google Scholar]
  22. Plana-Ruiz, S.; Krysiak, Y.; Portillo, J.; Alig, E.; Estrade, S.; Peiro, F.; Kolb, U. Fast-ADT: A fast and automated electron diffraction tomography setup for structure determination and refinement. Ultramicroscopy 2020, 211, 112951. [Google Scholar] [CrossRef]
  23. Kolb, U.; Mugnaioli, E.; Gorelik, T.E. Automated Electron Diffraction Tomography—A New Tool for Nano Crystal Structure Analysis. Cryst. Res. Technol. 2011, 46, 542–554. [Google Scholar] [CrossRef]
  24. Kolb, U.; Krysiak, Y.; Plana-Ruiz, S. Automated electron diffraction tomography—Development and applications. Acta Cryst. 2019, B75, 463–474. [Google Scholar]
  25. Palatinus, L. PETS: Program for Analysis of Electron Diffraction Data. Available online: http://pets.fzu.cz/ (accessed on 1 March 2023).
  26. Palatinus, L.; Brázda, P.; Jelínek, M.; Hrdá, J.; Steciuk, G.; Klementová, M. Specifics of the Data Processing of Precession Electron Diffraction Tomography Data and Their Implementation in the Program PETS2.0. Acta Crystallogr. 2019, B75, 512–522. [Google Scholar] [CrossRef]
  27. Burla, M.C.; Caliandro, R.; Carrozzini, B.; Cascarano, G.L.; Cuocci, C.; Giacovazzo, C.; Mallamo, M.; Mazzone, A.; Polidori, G. Crystal structure determination and refinement via SIR2014. J. Appl. Cryst. 2015, 48, 306–309. [Google Scholar] [CrossRef]
  28. Sheldrick, G.M. A short history of SHELX. Acta Crystallogr. Sect. A Found. Crystallogr. 2008, 64, 112–122. [Google Scholar] [CrossRef] [PubMed] [Green Version]
  29. Hübschle, C.B.; Sheldrick, G.M.; Dittrich, B. ShelXle: A Qt graphical user interface for SHELXL. J. Appl. Cryst. 2011, 44, 1281–1284. [Google Scholar] [CrossRef] [PubMed] [Green Version]
  30. Rodriguez-Carvajal, F. A Program for Rietveld Refinement and Profile Matching Analysis of Complex Powder Diffraction Patterns-Version 7.30; ILL: Grenoble, France, 2020; Available online: http://www.ill.eu/sites/fullprof/index.html (accessed on 1 March 2023).
  31. Momma, K.; Izumi, F. VESTA: A Three-Dimensional Visualization System for Electronic and Structural Analysis. Available online: https://jp-minerals.org/vesta/en/ (accessed on 1 March 2023).
  32. Marler, B.; Krysiak, B.Y.; Großkreuz, I.; Gies, H.; Kolb, U. The crystal structure of mineral magadiite, Na2Si14O28(OH)2 × 8 H2O. Am. Mineral. 2022, 107, 2101–2110. [Google Scholar] [CrossRef]
  33. Marler, B.; Großkreuz, I.; Gies, H. The crystal structure of synthetic kenyaite, Na2 Si20O40(OH)2 × 8 H2O. J. Solid State Chem. 2021, 300, 122215. [Google Scholar] [CrossRef]
  34. Ghose, S.; Wan, C. Structural chemistry of borosilicates, part II: Searlesite, NaBSi2O5(OH): Absolute configuration, hydrogen locations, and refinement of the structure. Am. Mineral. 1976, 61, 123–129. [Google Scholar]
  35. Robson, H.; Lillerud, K.P. (Eds.) The sample of classical zeolite beta was synthesized according to J.P.-P. Pariente and M. Camblor. In Verified Syntheses of Zeolitic Materials, 2nd ed.; Elsevier: Amsterdam, The Netherlands, 2001; pp. 115–116. [Google Scholar]
  36. Karge, H.G. Characterization by IR spectroscopy. In Verified Syntheses of Zeolitic Materials, 2nd ed.; Robson, H., Lillerud, K.P., Eds.; Elsevier: Amsterdam, The Netherlands, 2001; pp. 69–71. [Google Scholar]
  37. Scholle, K.F.M.G.J.; Veeman, W.S. The influence of hydration on the coordination state of boron in H-Boralite studied by 11B magic angle spinning n.m.r. Zeolites 1985, 5, 118–122. [Google Scholar] [CrossRef]
  38. Chemical Book, Tetraethylammonium Tetrafluoroborate, CAS 429-06-1. Available online: https://www.chemicalbook.com/SpectrumEN_429-06-1_1HNMR.htmc (accessed on 1 March 2023).
  39. NMR Shift Database. Available online: https://nmrshiftdb.nmr.uni-koeln.de (accessed on 1 March 2023).
  40. Database of Disordered Zeolite Structures. Available online: https://europe.iza-structure.org/IZA-SC/DO_structures/DO_family.php?IFN=Beta (accessed on 1 March 2023).
Figure 1. Schematic drawing of the two different conformations of the tetraethylammoniumion ion as observed in the zeolite pores: tt.tt (left) and tg.tg (right).
Chemistry 05 00052 g001
Figure 2. SEM photograph of COE-11 crystals and impurities (beta, MFI and MTW type zeolite).
Chemistry 05 00052 g002
Figure 3. DTA (blue) and TG (green) curves of as-made COE-11. At 112.9 °C the loss of adhesive water is completed, at 415.1 °C TEA is combusted, and at 926.0 °C the transition to cristobalite is complete.
Chemistry 05 00052 g003
Figure 4. (ATR)-FTIR spectra of as-made COE-11 (top) and a classical zeolite beta sample (bottom).
Chemistry 05 00052 g004
Figure 5. 11B MAS NMR spectrum of as-made COE-11.
Chemistry 05 00052 g005
Figure 6. 29Si MAS NMR spectrum of as-made COE-11.
Chemistry 05 00052 g006
Figure 7. 1H MAS NMR spectrum of as-made COE-11.
Chemistry 05 00052 g007
Figure 8. 1H-13C CP MAS NMR spectrum of as-made COE-11.
Chemistry 05 00052 g008
Figure 9. STEM image of COE-11 crystal with marked position for diffraction acquisition (left side); 3D reconstructed diffraction volume viewed down the a-axis (middle) showing that no c-glide perpendicular b is present and viewed down the c-axis (right side) showing C-centering. Cell units are marked by yellow lines with b* direction drawn vertical.
Chemistry 05 00052 g009
Figure 10. (Top) the framework structure of COE-11, containing dense silicate layers and intersecting 12-ring channel-like pores. TEA cations (green and brown spheres) occupy the pores; (bottom) the framework structure of zeolite beta polymorph B.
Chemistry 05 00052 g010
Figure 11. The building blocks of the COE-11 framework: LLBU-A representing a dense layer (upper left), and LLBU-B consisting of individual silicate rods (upper right). The layer-like building unit of zeolite beta is presented for comparison (bottom).
Chemistry 05 00052 g011
Figure 12. The stacking of the dense LLBU-A (blue) and rod-like LLBU-B (purple).
Chemistry 05 00052 g012
Figure 13. Three T sites of the COE-11 framework seem partly occupied by boron: T14 (green), T16 (black) and T19 (purple). Other Si atoms are displayed as blue spheres. The shortest N…O distances (orange lines) exist between nitrogen and O8 (orange) and O10 (yellow). Other O atoms are displayed as red spheres.
Chemistry 05 00052 g013
Table 1. Synthesis of COE-11 with a variation of temperature. Molar composition of the reaction mixtures (water = 16 molar). Silica source: Ludox HS40. The products are listed in order of their percentage, traces in brackets. The products were identified on the basis of their XRD powder diagrams.
SampleSiO2SDANaOHH3BO3T1, TimeT2, TimeSolid Products
S011.000.330.50.1130 °C, 7 days-Magadiite (silica source: silica gel)
S021.000.330.50.1140 °C, 7 days-Amorphous, Beta, unknown phase
S031.000.330.50.1150 °C, 7 days-Beta
S041.000.330.50.1160 °C, 7 days-MFI, Beta, COE-11
S051.000.330.50.1168 °C, 7 days-Kenyaite, MFI, COE-11
S061.000.330.50.1155 °C, 1 day160 °C, 6 daysBeta, COE-11
S071.000.330.50.1155 °C, 1 day165 °C, 6 daysBeta, COE-11, MFI
S081.000.330.50.1155 °C, 1 day165 °C, 6 daysCOE-11, Beta, MFI, MTW
S091.000.330.50.1155 °C, 1 day170 °C, 6 daysMFI, quartz, kenyaite
S101.000.330.50.1155 °C, 1 day170 °C, 6 daysMFI, quartz
S111.000.030.50.1155 °C, 1 day180 °C, 6 daysQuartz
S121.000.030.50.1155 °C, 1 day180 °C, 6 daysQuartz
Table 2. Synthesis of COE-11 with different reaction times. Molar composition of the reaction mixtures (water = 16 molar). Silica source: Ludox HS40.
SampleSiO2SDANaOHH3BO3T1, TimeT2, TimeSolid Products
S131.000.330.50.1-165 °C, 7 daysMFI, COE-11, Beta, kenyaite
S141.000.330.50.1155 °C, 1 day165 °C, 6 daysBeta, COE-11
S151.000.330.50.1155 °C, 1 day165 °C, 6 daysBeta COE-11, MFI
S161.000.330.50.1155 °C, 2 days165 °C, 5 daysBeta, COE-11, little MFI
S171.000.330.50.1155 °C, 2 days165 °C, 5 daysBeta, MFI, (COE-11)
S181.000.330.50.1155 °C, 3 days165 °C, 4 daysBeta, COE-11, little MFI
S191.000.330.50.1155 °C, 3 days165 °C, 4 daysBeta, MFI, (COE-11)
S201.000.330.50.1155 °C, 4 days165 °C, 3 daysBeta, COE-11
S211.000.030.50.1155 °C, 4 days165 °C, 3 daysCOE-11, Beta, MTW
S221.000.330.50.1155 °C, 5 days165 °C, 2 daysMFI
S231.000.330.50.1155 °C, 5 days165 °C, 2 daysBeta, MFI, COE-11
S241.000.330.50.1155 °C, 7 days-Beta, MFI, COE-11
S251.000.330.50.1157 °C, 1 day165 °C, 9 daysMFI, Beta, COE-11
S261.000.330.50.1157 °C, 1 day165 °C, 14 daysMFI, Beta
S271.000.330.50.1157 °C, 1 day165 °C, 17 daysQuartz, MFI
S281.000.330.50.1157 °C, 1 day165 °C, 21 daysNo product
Table 3. Synthesis of COE-11 using different silica sources. Molar composition of the reaction mixtures (water = 16 molar, silica source = 1 molar).
SampleSiO2TEAOHNaOHH3BO3T1, TimeT2, TimeSolid Products
S29Ludox HS400.330.50.1155 °C, 1 day165 °C, 6 daysMFI, COE-11, Kenyaite
S30Ludox HS400.330.50.1155 °C, 1 day165 °C, 6 daysCOE-11, Beta, MFI, kenyaite
S31Ludox HS400.330.50.1155 °C, 1 day165 °C, 6 daysBeta, COE-11, (MFI)
S32Ludox HS400.330.50.1155 °C, 1 day165 °C, 6 daysCOE-11, beta, MFI
S33Gel, Merck0.330.50.1155 °C, 1 day165 °C, 6 daysUnidentified phases
S34Gel, Merck0.330.50.1155 °C, 1 day165 °C, 6 daysKenyaite, MFI, COE-11, unknown phase
S35Gel, lab made0.330.50.1155 °C, 4 days165 °C, 3 daysCOE-11, Searlsite, MFI, (Beta)
S36Gel, lab made0.330.50.1155 °C, 4 days165 °C, 3 daysSearlsite, MFI, Beta, COE-11
S37 *B-Si-Gel, lab made0.330.50.1155 °C, 4 days165 °C, 3 daysAmorphous, quartz, MFI
S38 *B-Si-Gel, lab made0.330.50.1155 °C, 4 days165 °C, 3 daysAmorphous, Beta, MFI
S39Levasil 1500.330.50.1155 °C, 1 day165 °C, 6 daysBeta, MFI
S40Levasil 1500.330.50.1155 °C, 1 day165 °C, 6 daysMFI, beta, kenyaite, COE-11
S41 §Levasil 5000.330.50.1155 °C, 1 day165 °C, 6 daysMOR
S42 §Levasil 5000.330.50.1155 °C, 1 day165 °C, 6 daysMOR
S43Syton HT500.330.50.1155 °C, 1 day165 °C, 6 daysMFI, COE-11, Beta
S44Syton HT500.330.50.1155 °C, 1 day165 °C, 6 daysMFI
S45Ludox SM300.330.50.1155 °C, 1 day165 °C, 6 daysMFI, Beta, COE-11
S46Ludox SM300.330.50.1155 °C, 1 day165 °C, 6 daysMFI, Beta, COE-11
S47Tetramethoxisilane0.330.50.1155 °C, 1 day165 °C, 6 daysQuartz, amorphous
S48Tetramethoxisilane0.330.50.1155 °C, 1 day165 °C, 6 daysQuartz, amorphous
S49Na-RUB-180.330.50.1155 °C, 4 days165 °C, 3 daysQuartz, Beta, searlsite, MOR
S50Na-RUB-180.330.50.1155 °C, 4 days165 °C, 3 daysAmorphous, Beta, MOR, quartz, searlsite
S51Calc. MCM-480.330.50.1155 °C, 4 days165 °C, 3 daysBeta, MFI, COE-11, kenyaite
S52Calc. MCM-480.330.50.1155 °C, 4 days165 °C, 3 daysBeta, COE-11, CHA
S53Calc. MCM-410.330.50.1155 °C, 4 days165 °C, 3 daysAmorphous, Beta
S54Calc. MCM-410.330.50.1155 °C, 4 days165 °C, 3 daysBeta
S55Calc. B-MCM-410.330.50.1155 °C, 4 days165 °C, 3 daysMFI, MTW, magadiite, kenyaite
S56Calc. B-MCM-410.330.50.1155 °C, 4 days165 °C, 3 daysAmorphous, Beta
S57Fumed silica0.330.50.1155 °C, 1 day165 °C, 6 daysMFI, COE-11, kenyaite
S58Fumed silica0.330.50.1155 °C, 1 day165 °C, 6 daysMFI, kenyaite, COE-11
* water content: 8 molar, § water content: 28 molar.
Table 4. List of reflections of COE-11 (λ = 1.54059 Å).
HKL2thetaIobsd-hklHKL2thetaIobsd-hkl
0016.7582198.113.06822223.197117.63.831
1107.5432399.411.71124023.36099.73.805
−1118.5031454.510.390−42223.36786.13.804
02010.194102.98.670−40323.4433.33.792
−20110.4417.48.46611323.79764.43.736
20011.13633.47.939−13324.34746.53.653
11111.539175.77.66304224.62412.83.612
02112.241152.57.22542024.64536.23.609
−11213.401102.96.602−24224.67850.93.605
00213.54074.56.534−20424.9243.73.570
−20213.63652.56.48924125.5969.93.477
−22114.61253.46.057−42325.62119.73.474
22015.11968.35.85533125.664483.73.468
20115.2028.45.823−33325.702486.13.463
−31116.14330.15.48640125.9333.23.433
13016.30622.25.432−11426.02513.53.421
−13116.77755.95.28031226.07122.23.415
02216.9777.75.218−31426.12720.53.408
−22217.05474.35.195−51226.2750.43.389
11217.382163.45.09815026.2813.23.388
31017.5051.95.062−51126.5589.23.354
−31217.532171.05.055−15126.5822.33.351
22118.337385.34.834−22426.991300.33.301
13118.51956.34.78720327.00311.73.299
−20318.8640.04.70000427.274136.13.267
−11319.50148.34.548−40427.47016.83.244
−13219.74651.14.49215127.739108.83.213
00320.3704.44.356−51327.75177.13.212
04020.47016.24.33542127.9305.23.192
−40120.58122.14.31213327.94311.33.190
20220.7810.04.271−24327.97616.43.187
−40220.9703.74.23351028.55276.73.124
31121.10615.84.206−15228.59152.63.120
−31321.15132.14.19722328.932255.13.084
−22321.487402.84.13204329.03526.63.073
04121.57964.94.11502429.18627.33.057
−33121.72162.04.088−44129.18769.43.057
40022.37836.23.97024229.33131.53.043
13222.66623.13.920−42429.37010.83.039
33022.7621186.73.904−44229.46911.43.029
−33222.7831016.43.900−13429.88426.12.987
02322.82723.83.89233229.92558.12.983
−42123.016115.03.861−33429.974108.32.979
−24123.030160.93.859
Disclaimer/Publisher’s Note: The statements, opinions and data contained in all publications are solely those of the individual author(s) and contributor(s) and not of MDPI and/or the editor(s). MDPI and/or the editor(s) disclaim responsibility for any injury to people or property resulting from any ideas, methods, instructions or products referred to in the content.

