

Environmental Applications of Zeolites: Preparation and Screening of Cu-Modified Zeolites as Potential CO Sensors
 , ,
, ,
Abstract
:1. Introduction
2. Materials and Methods
2.1. Materials
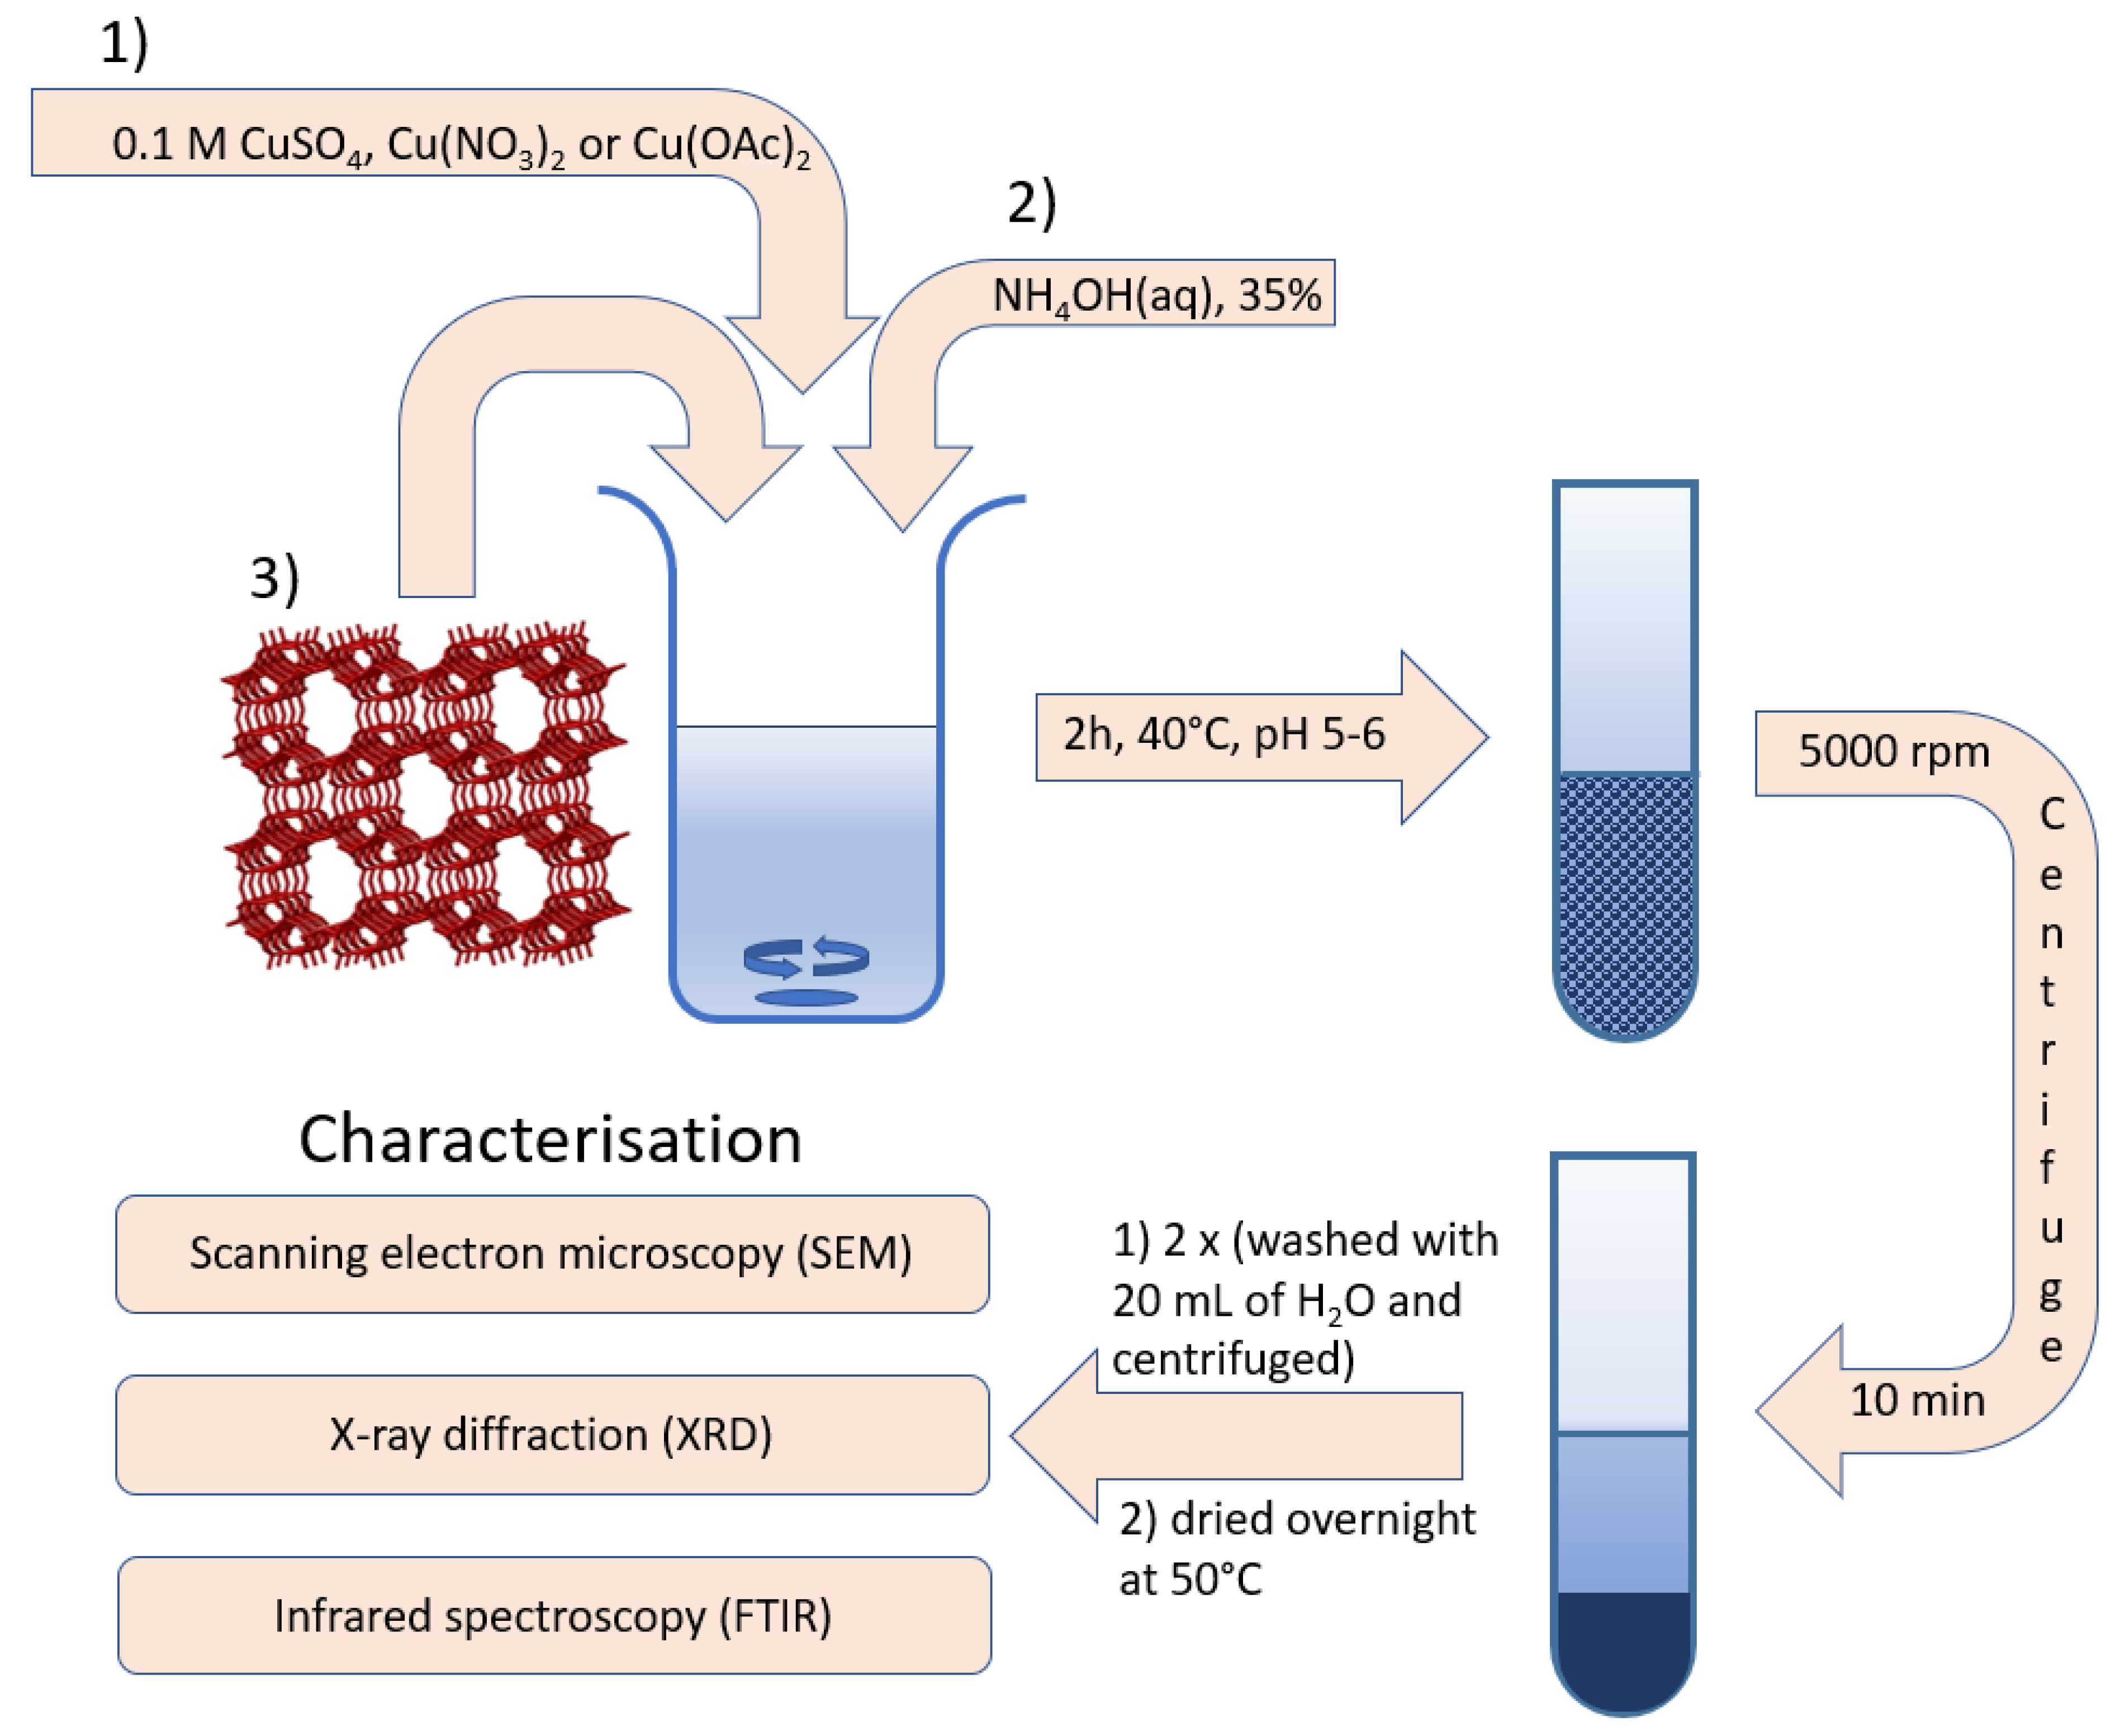
2.2. Sensor Preparation
2.3. Sensor Characterisation
2.4. Operando Gas Detection
3. Results and Discussion
3.1. SEM-EDX
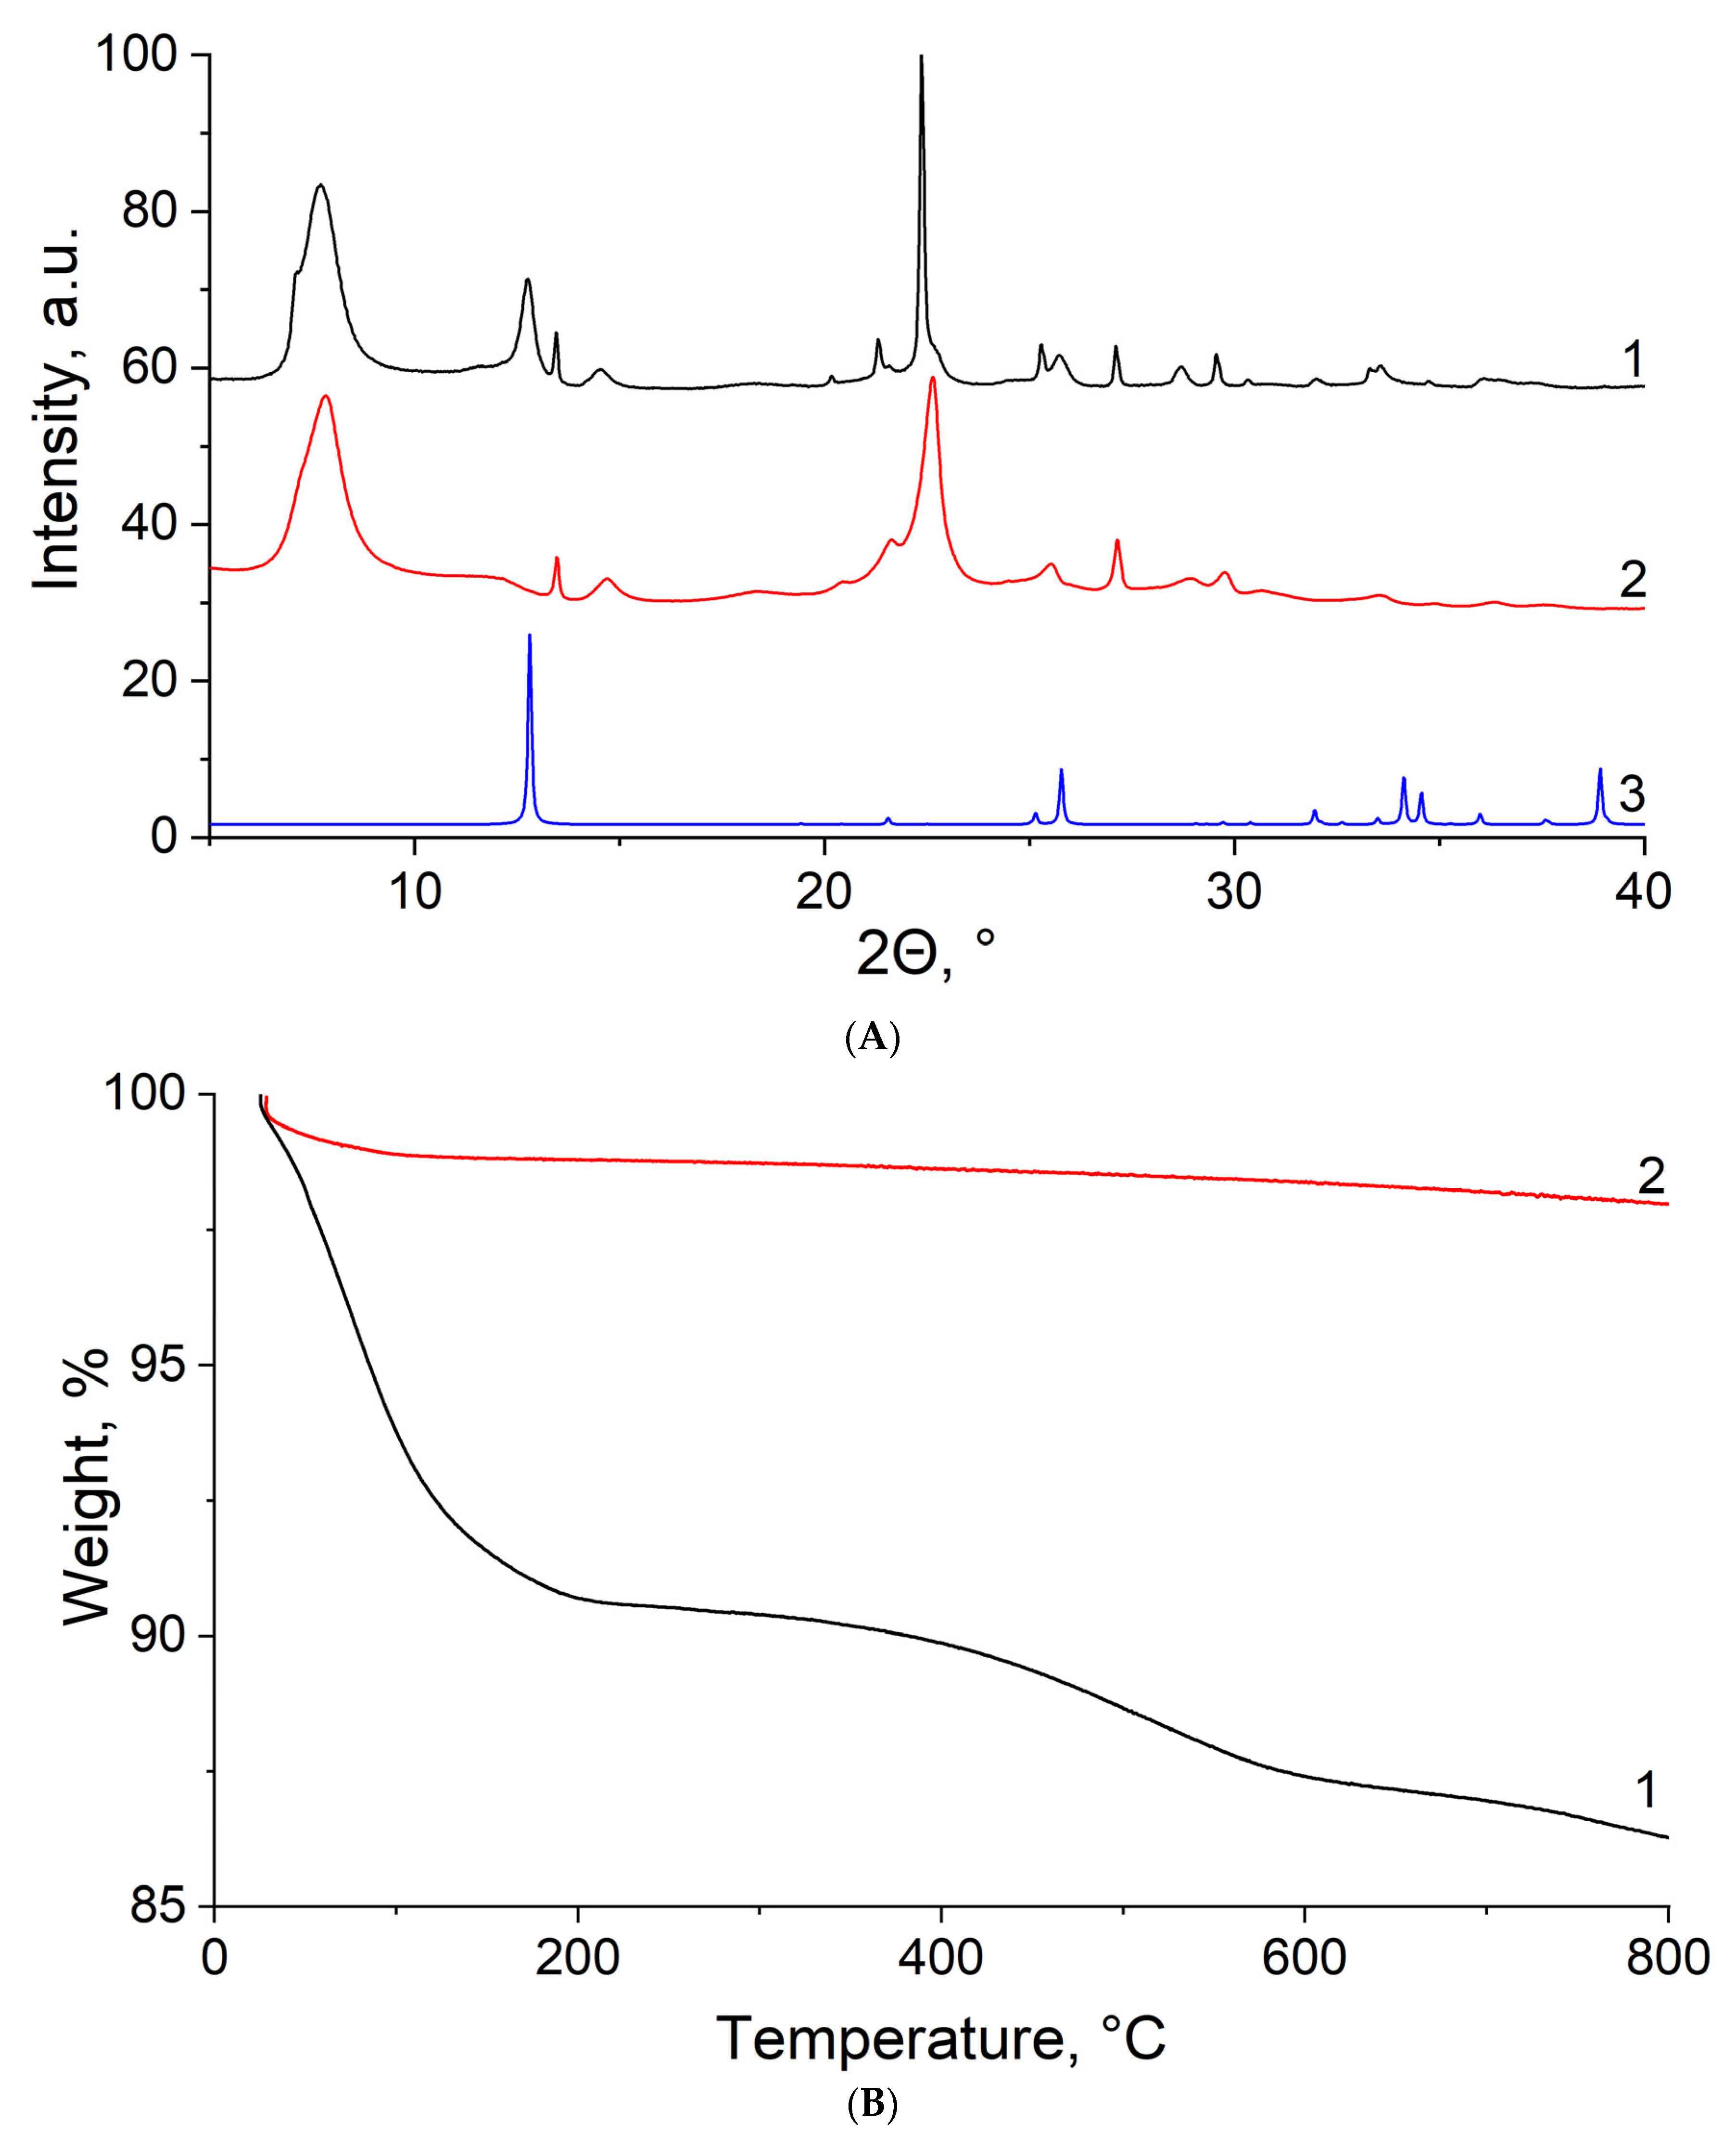
3.2. XRD
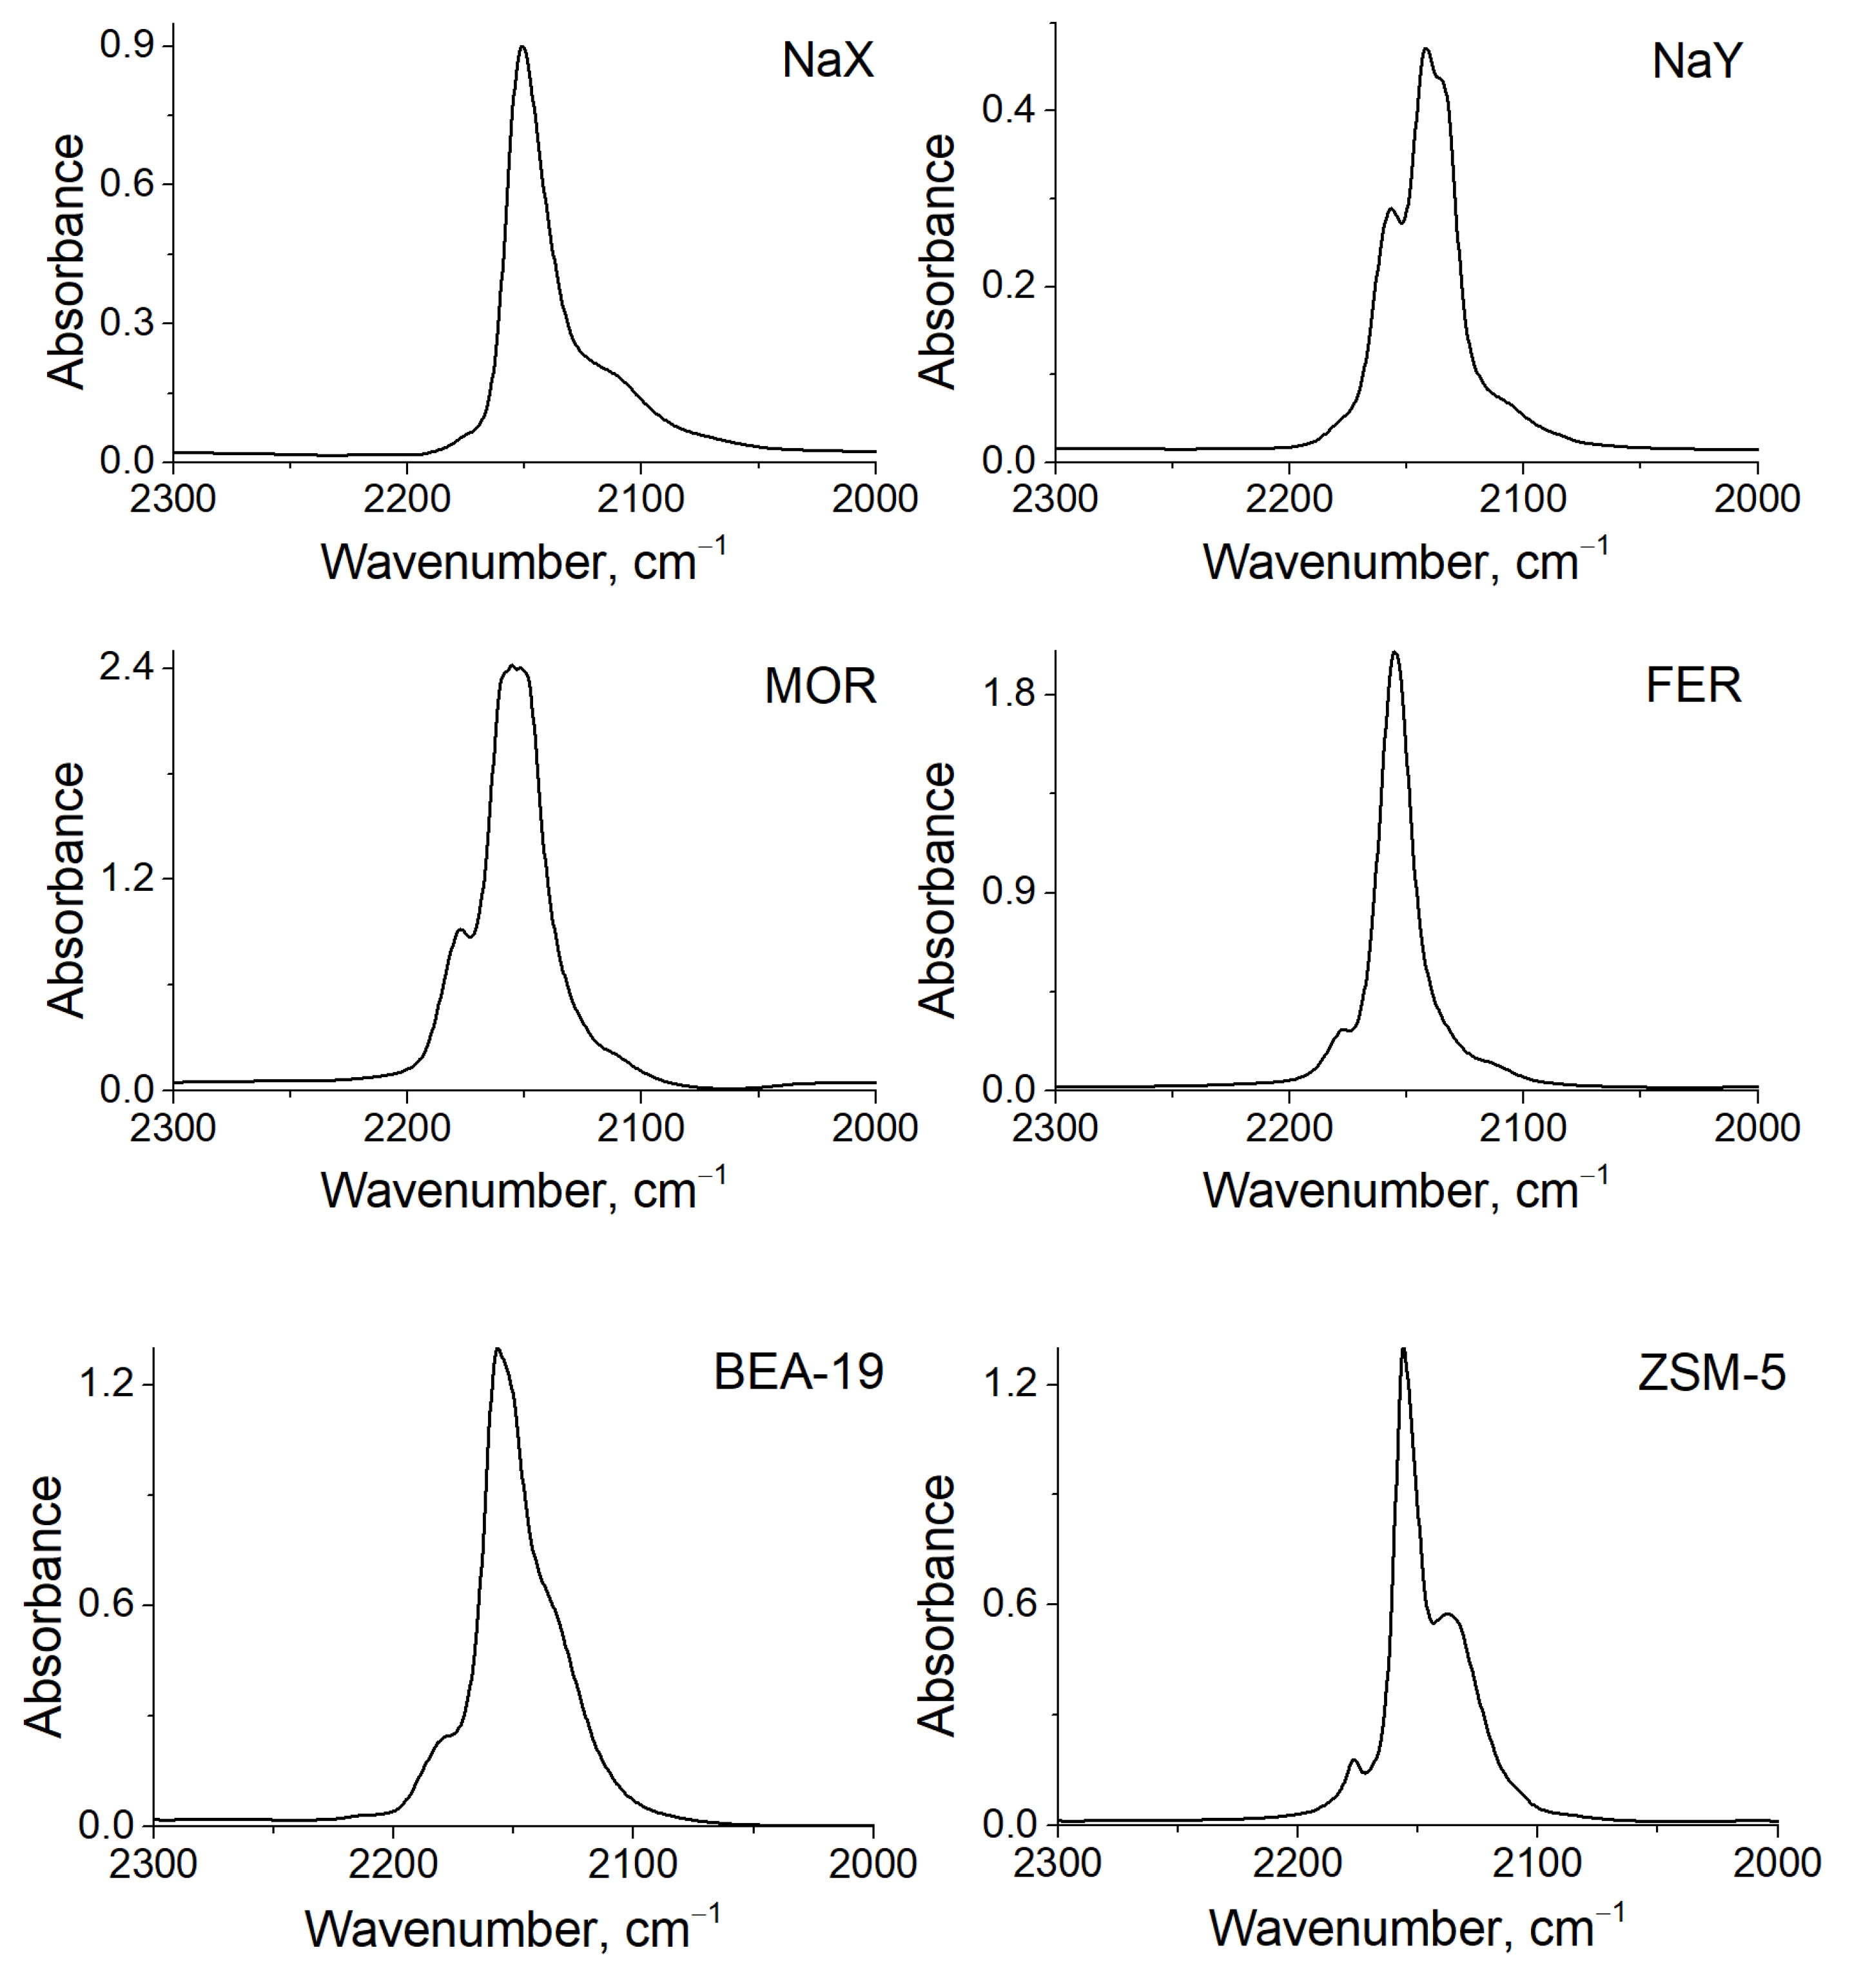
3.3. FTIR
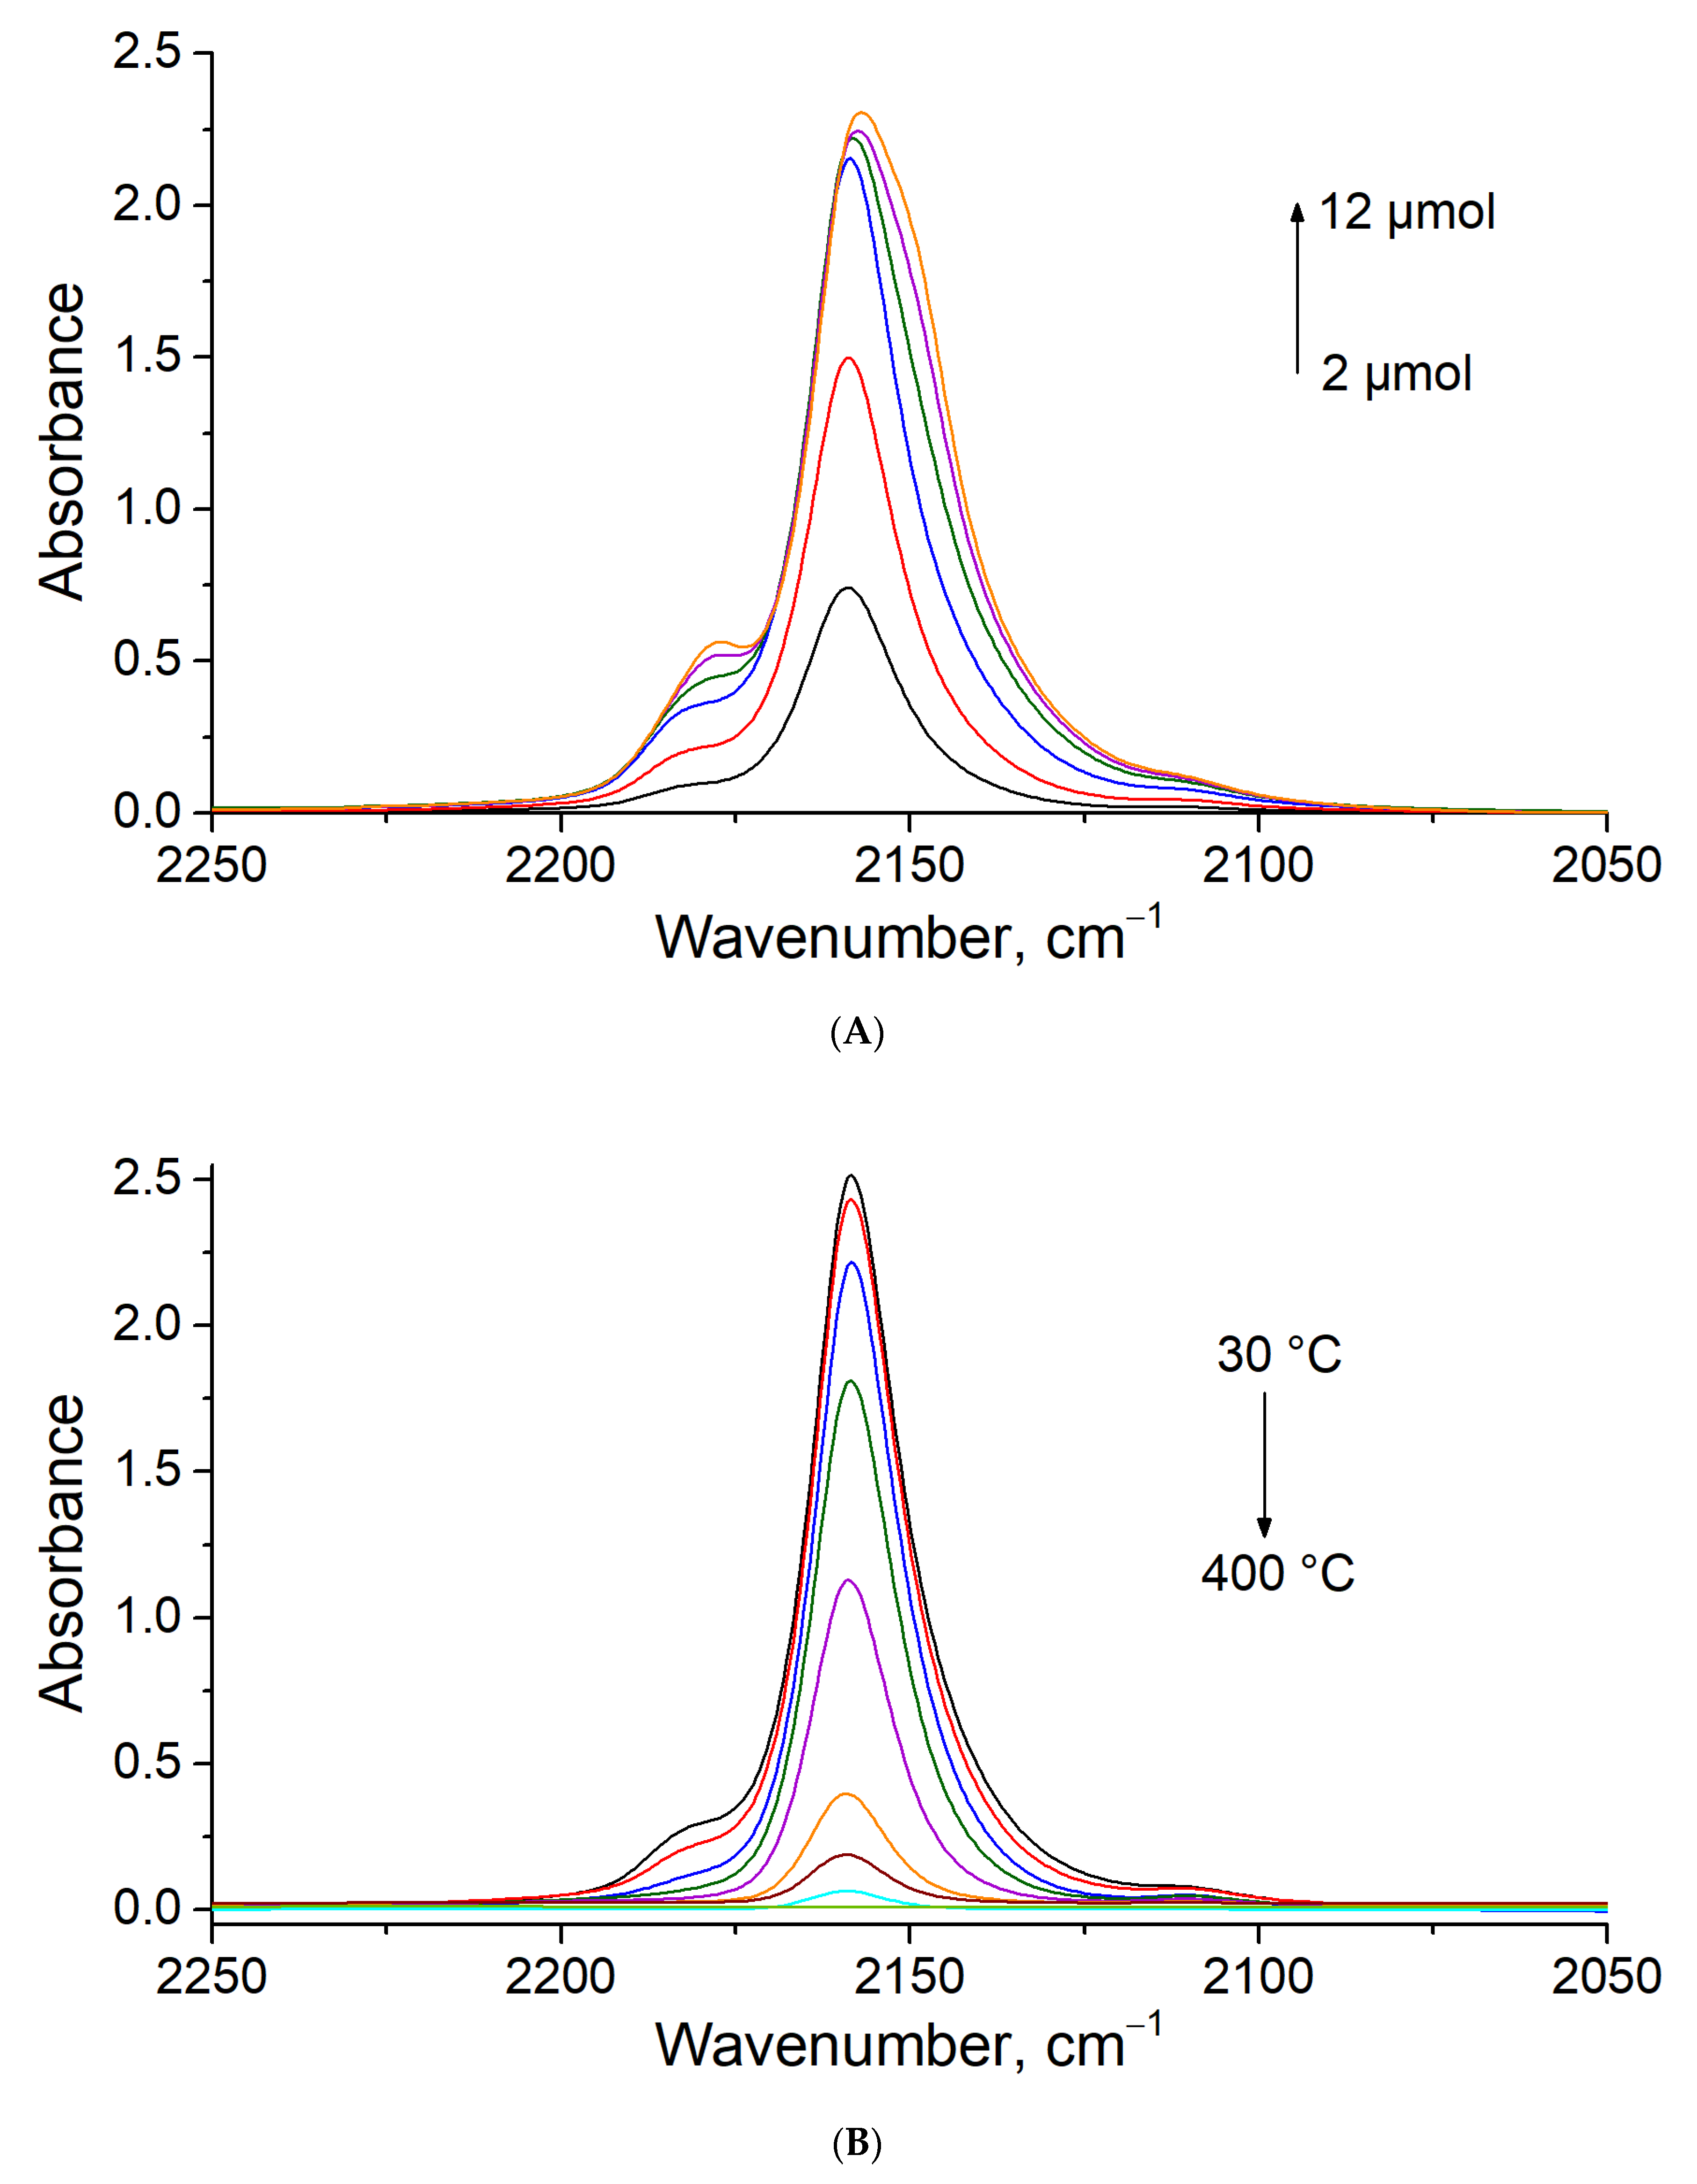
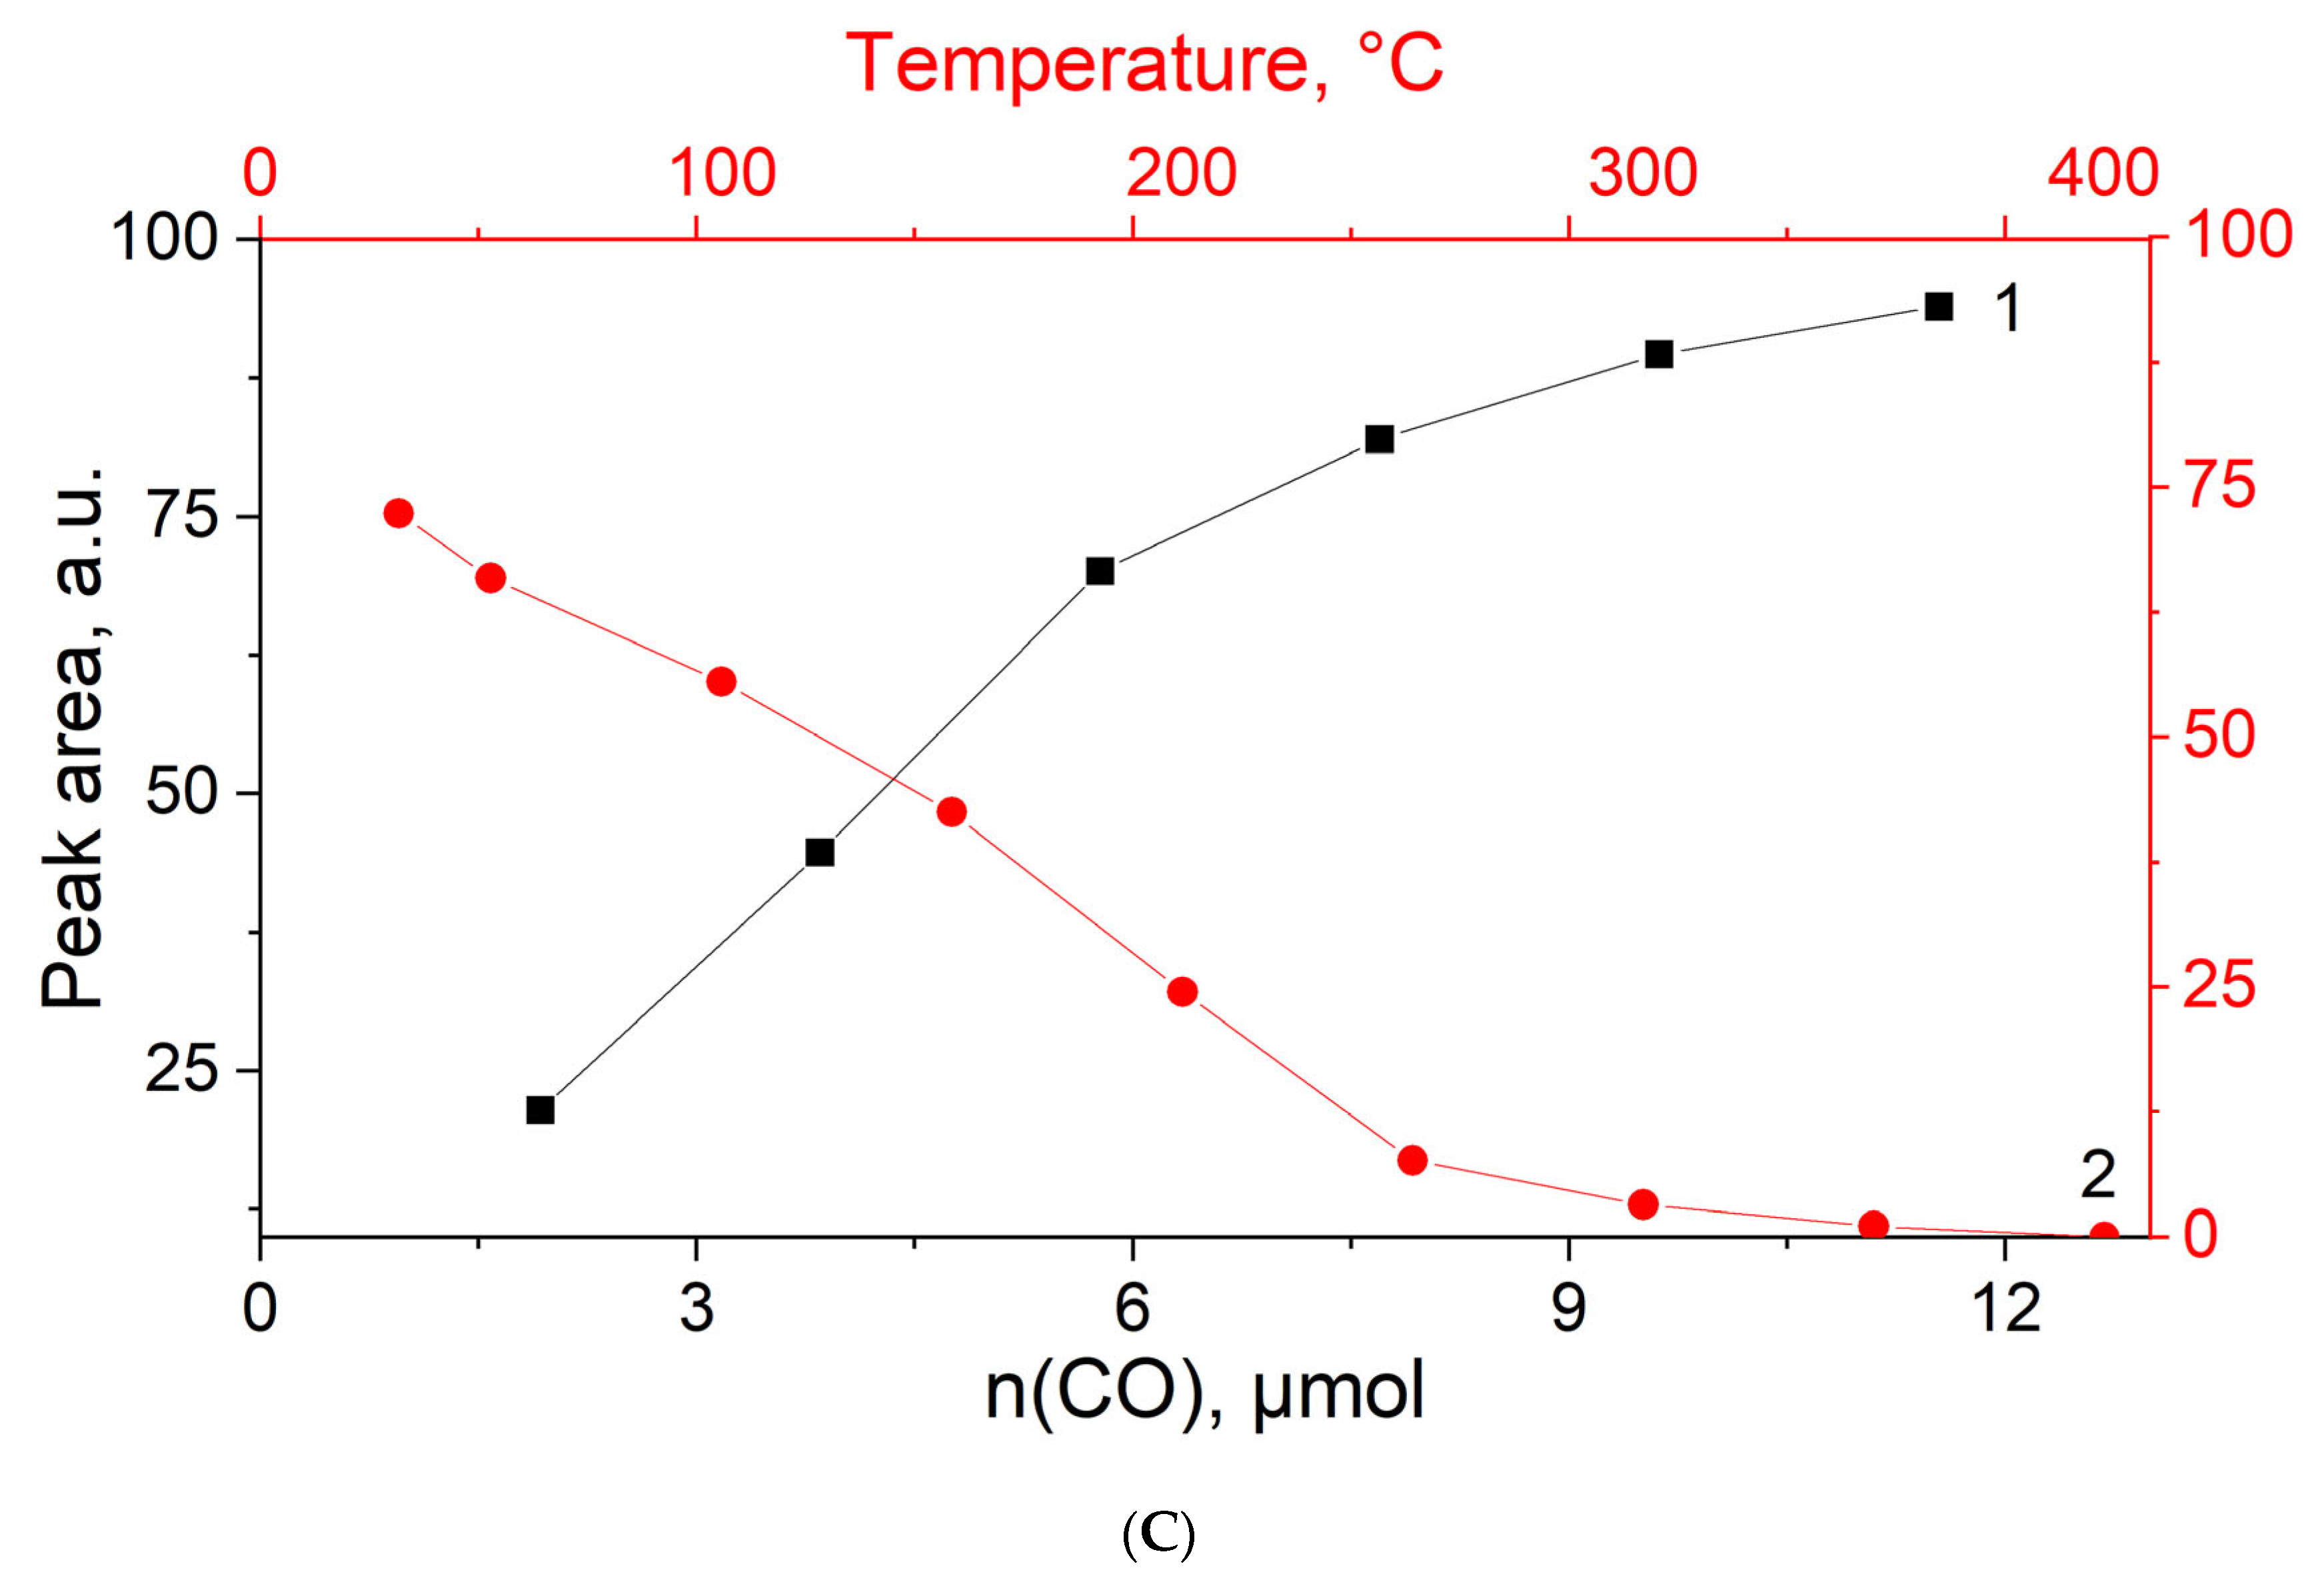
3.4. CO Titration and Stepwise Desorption at Different Temperatures on MOR-Cu(NO3)2
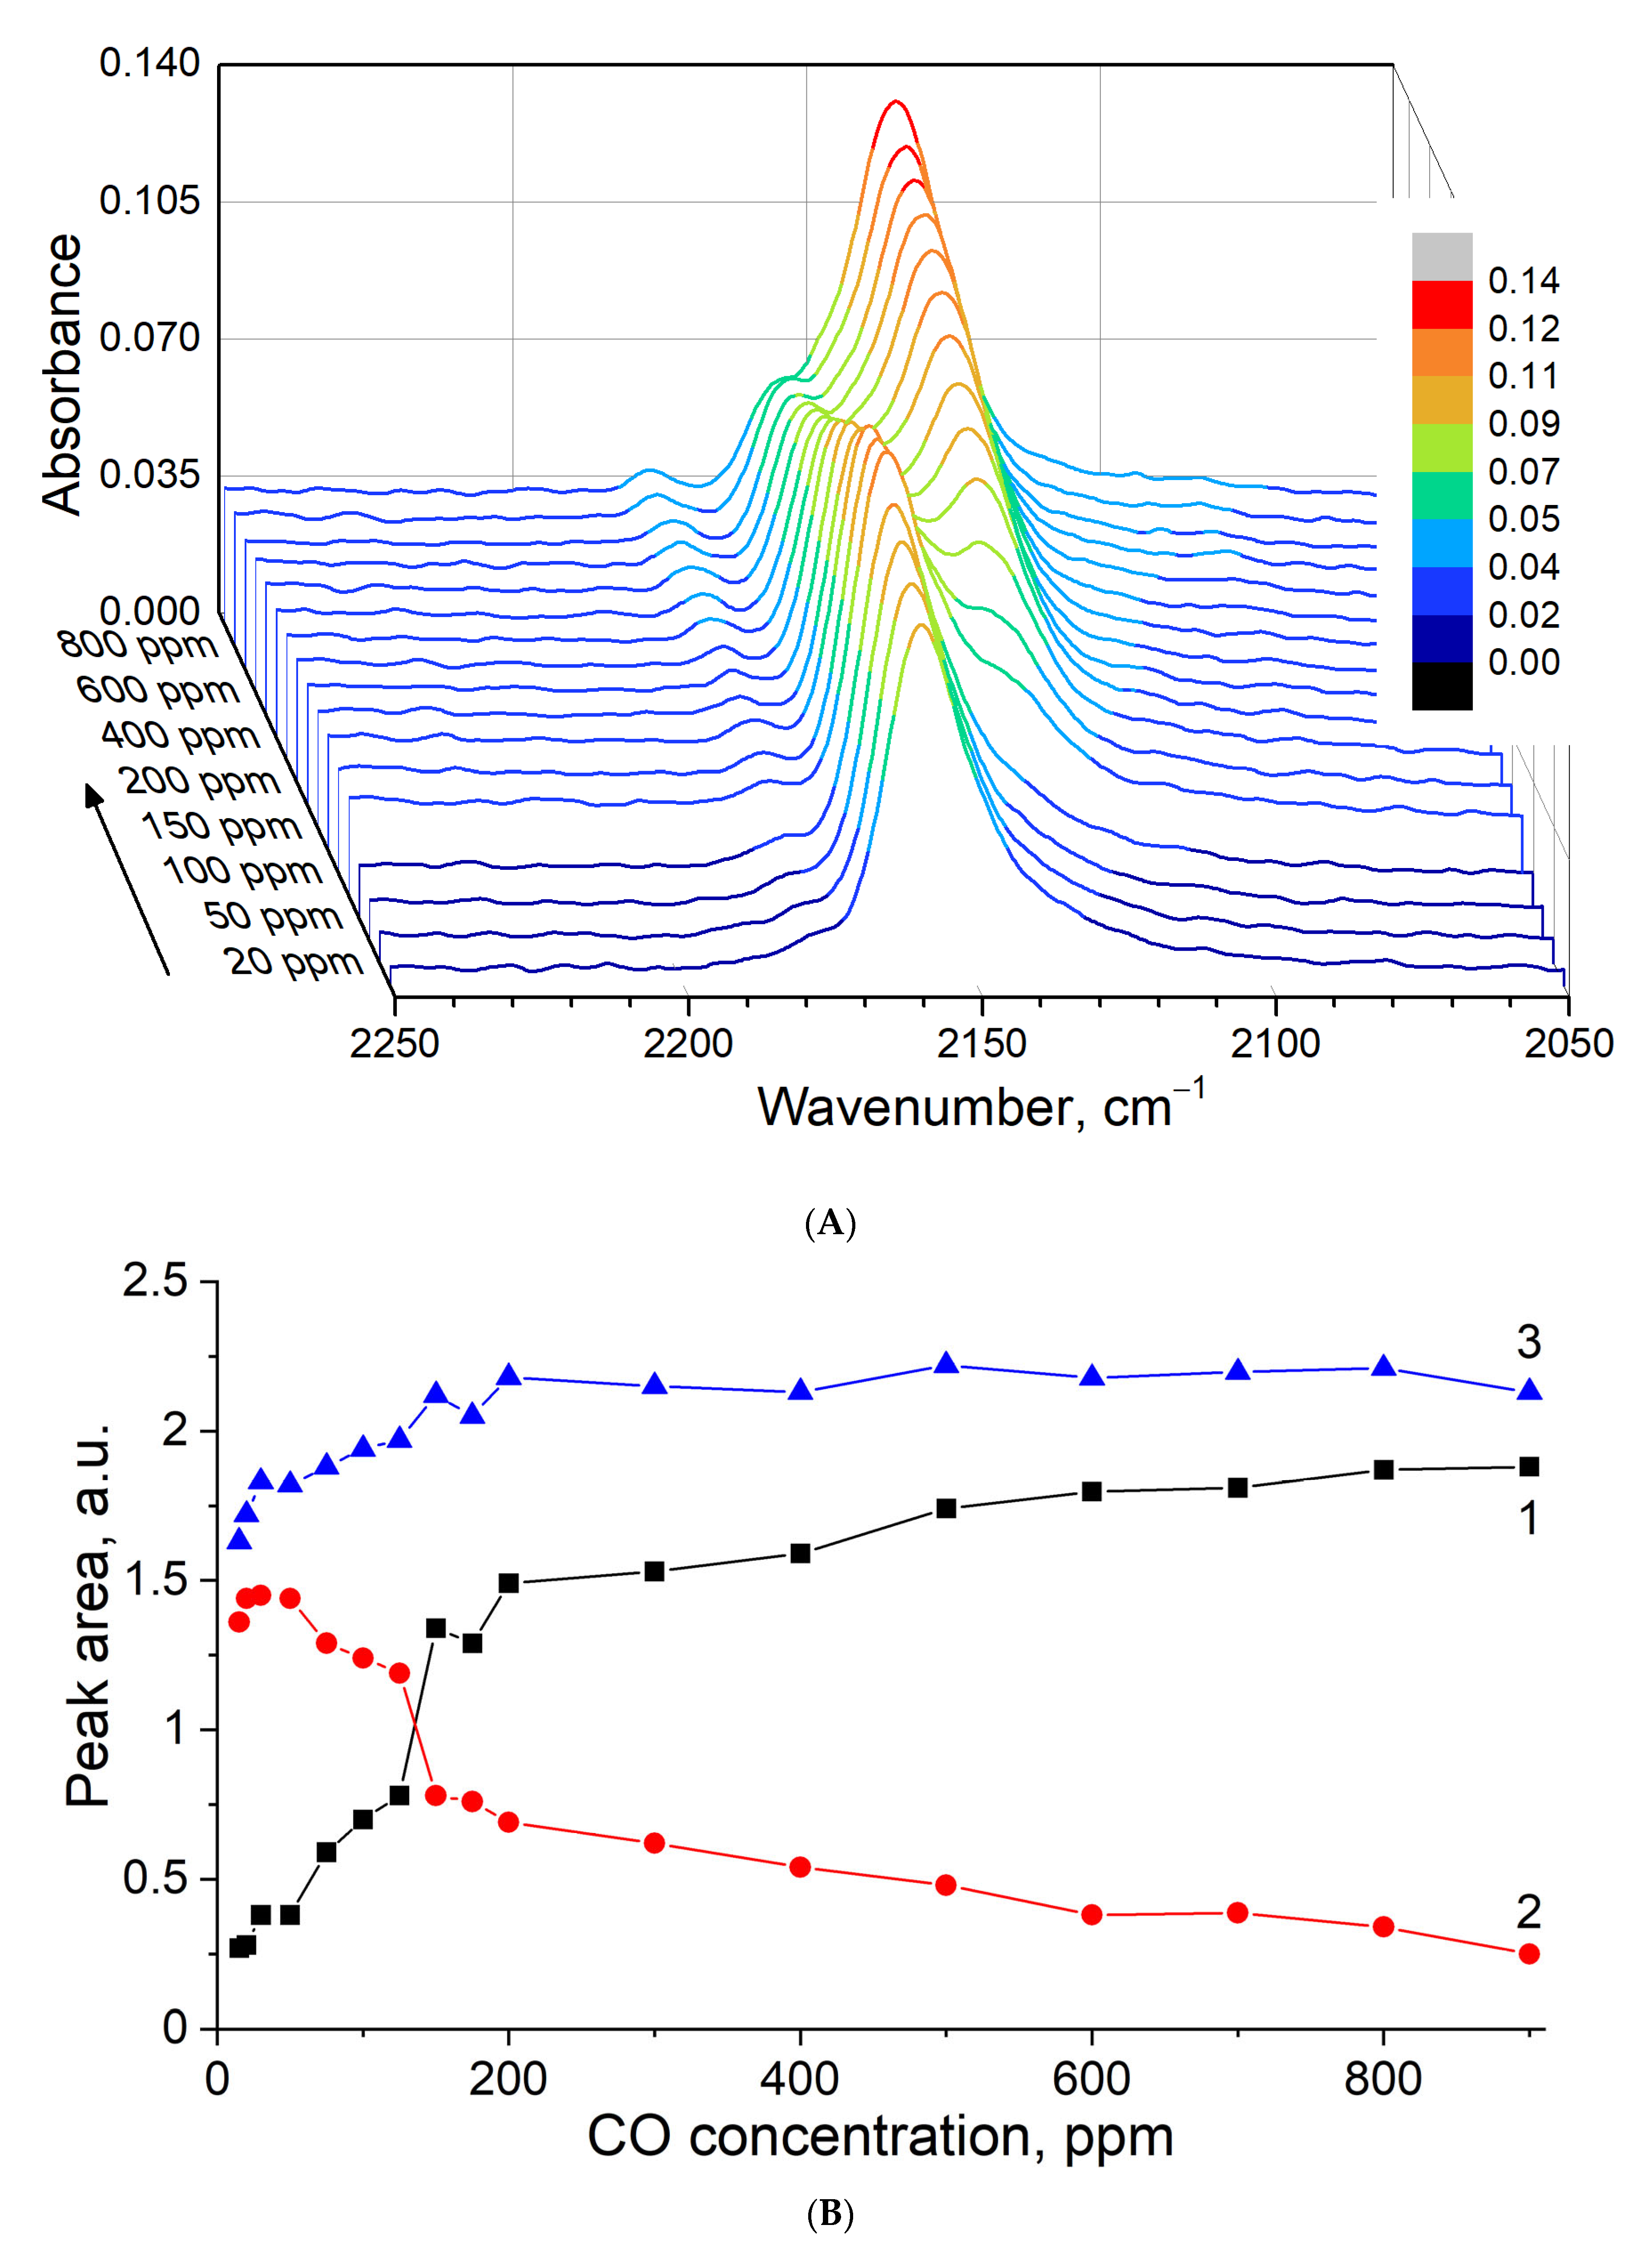
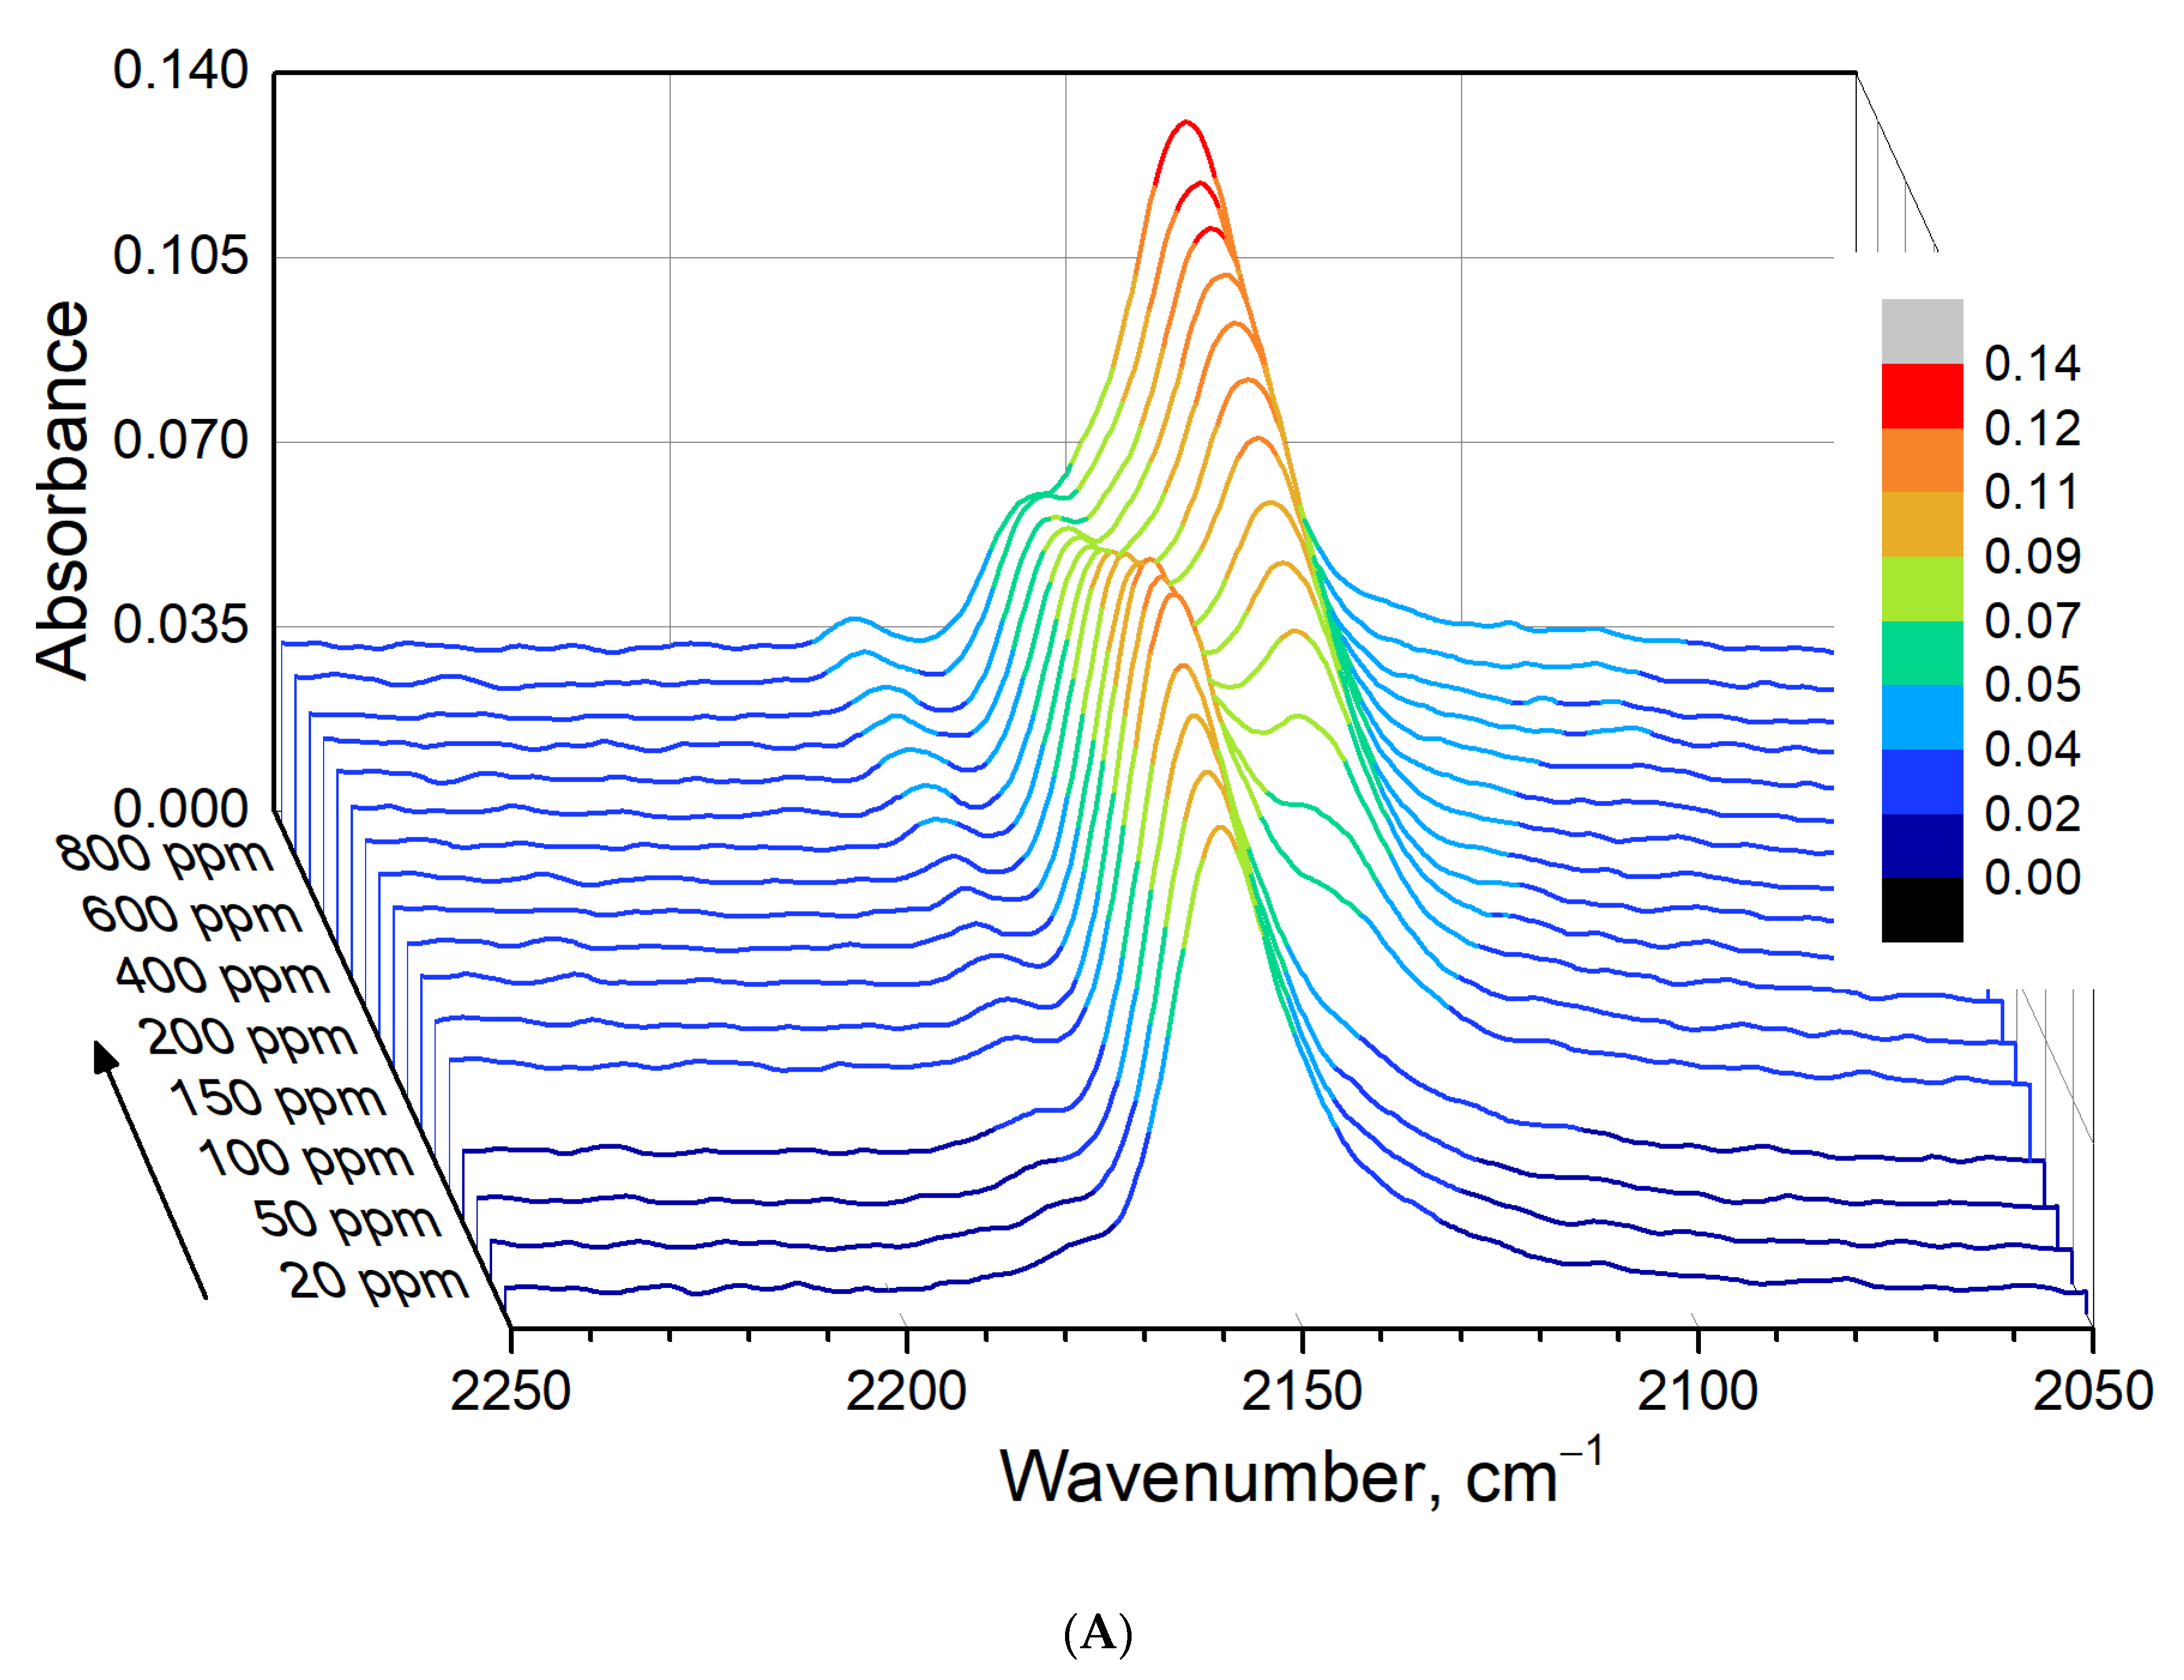
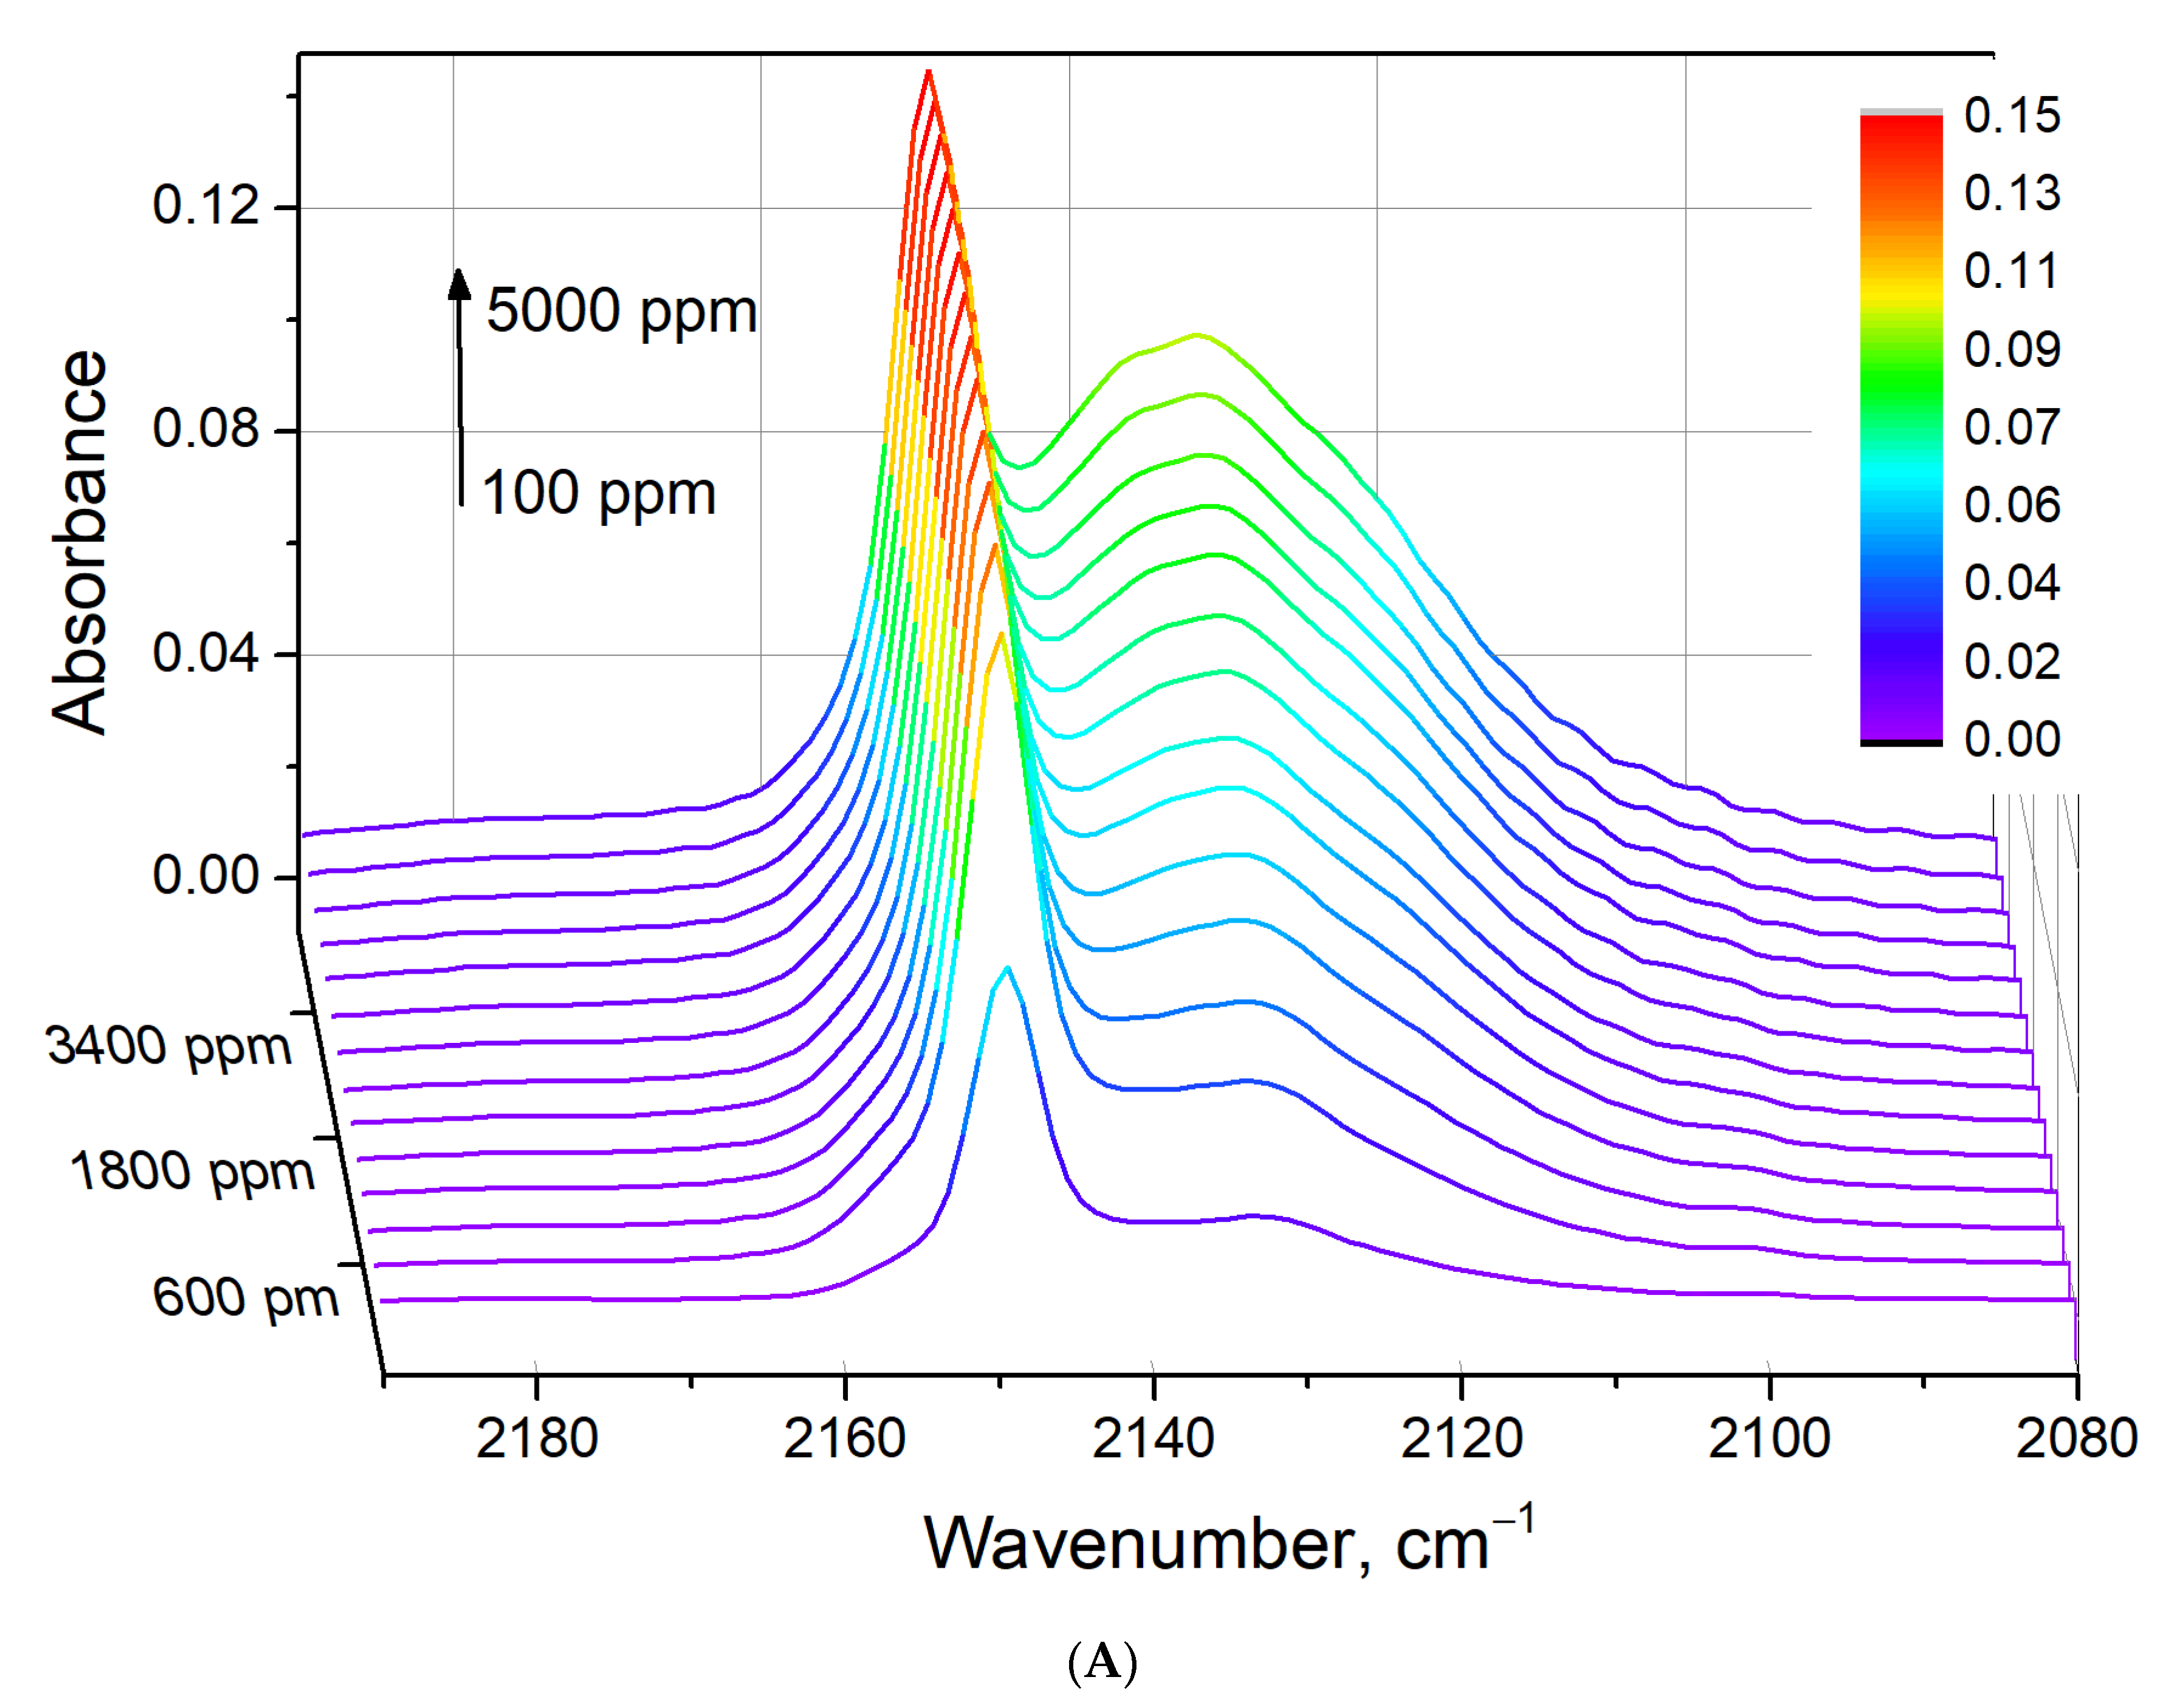
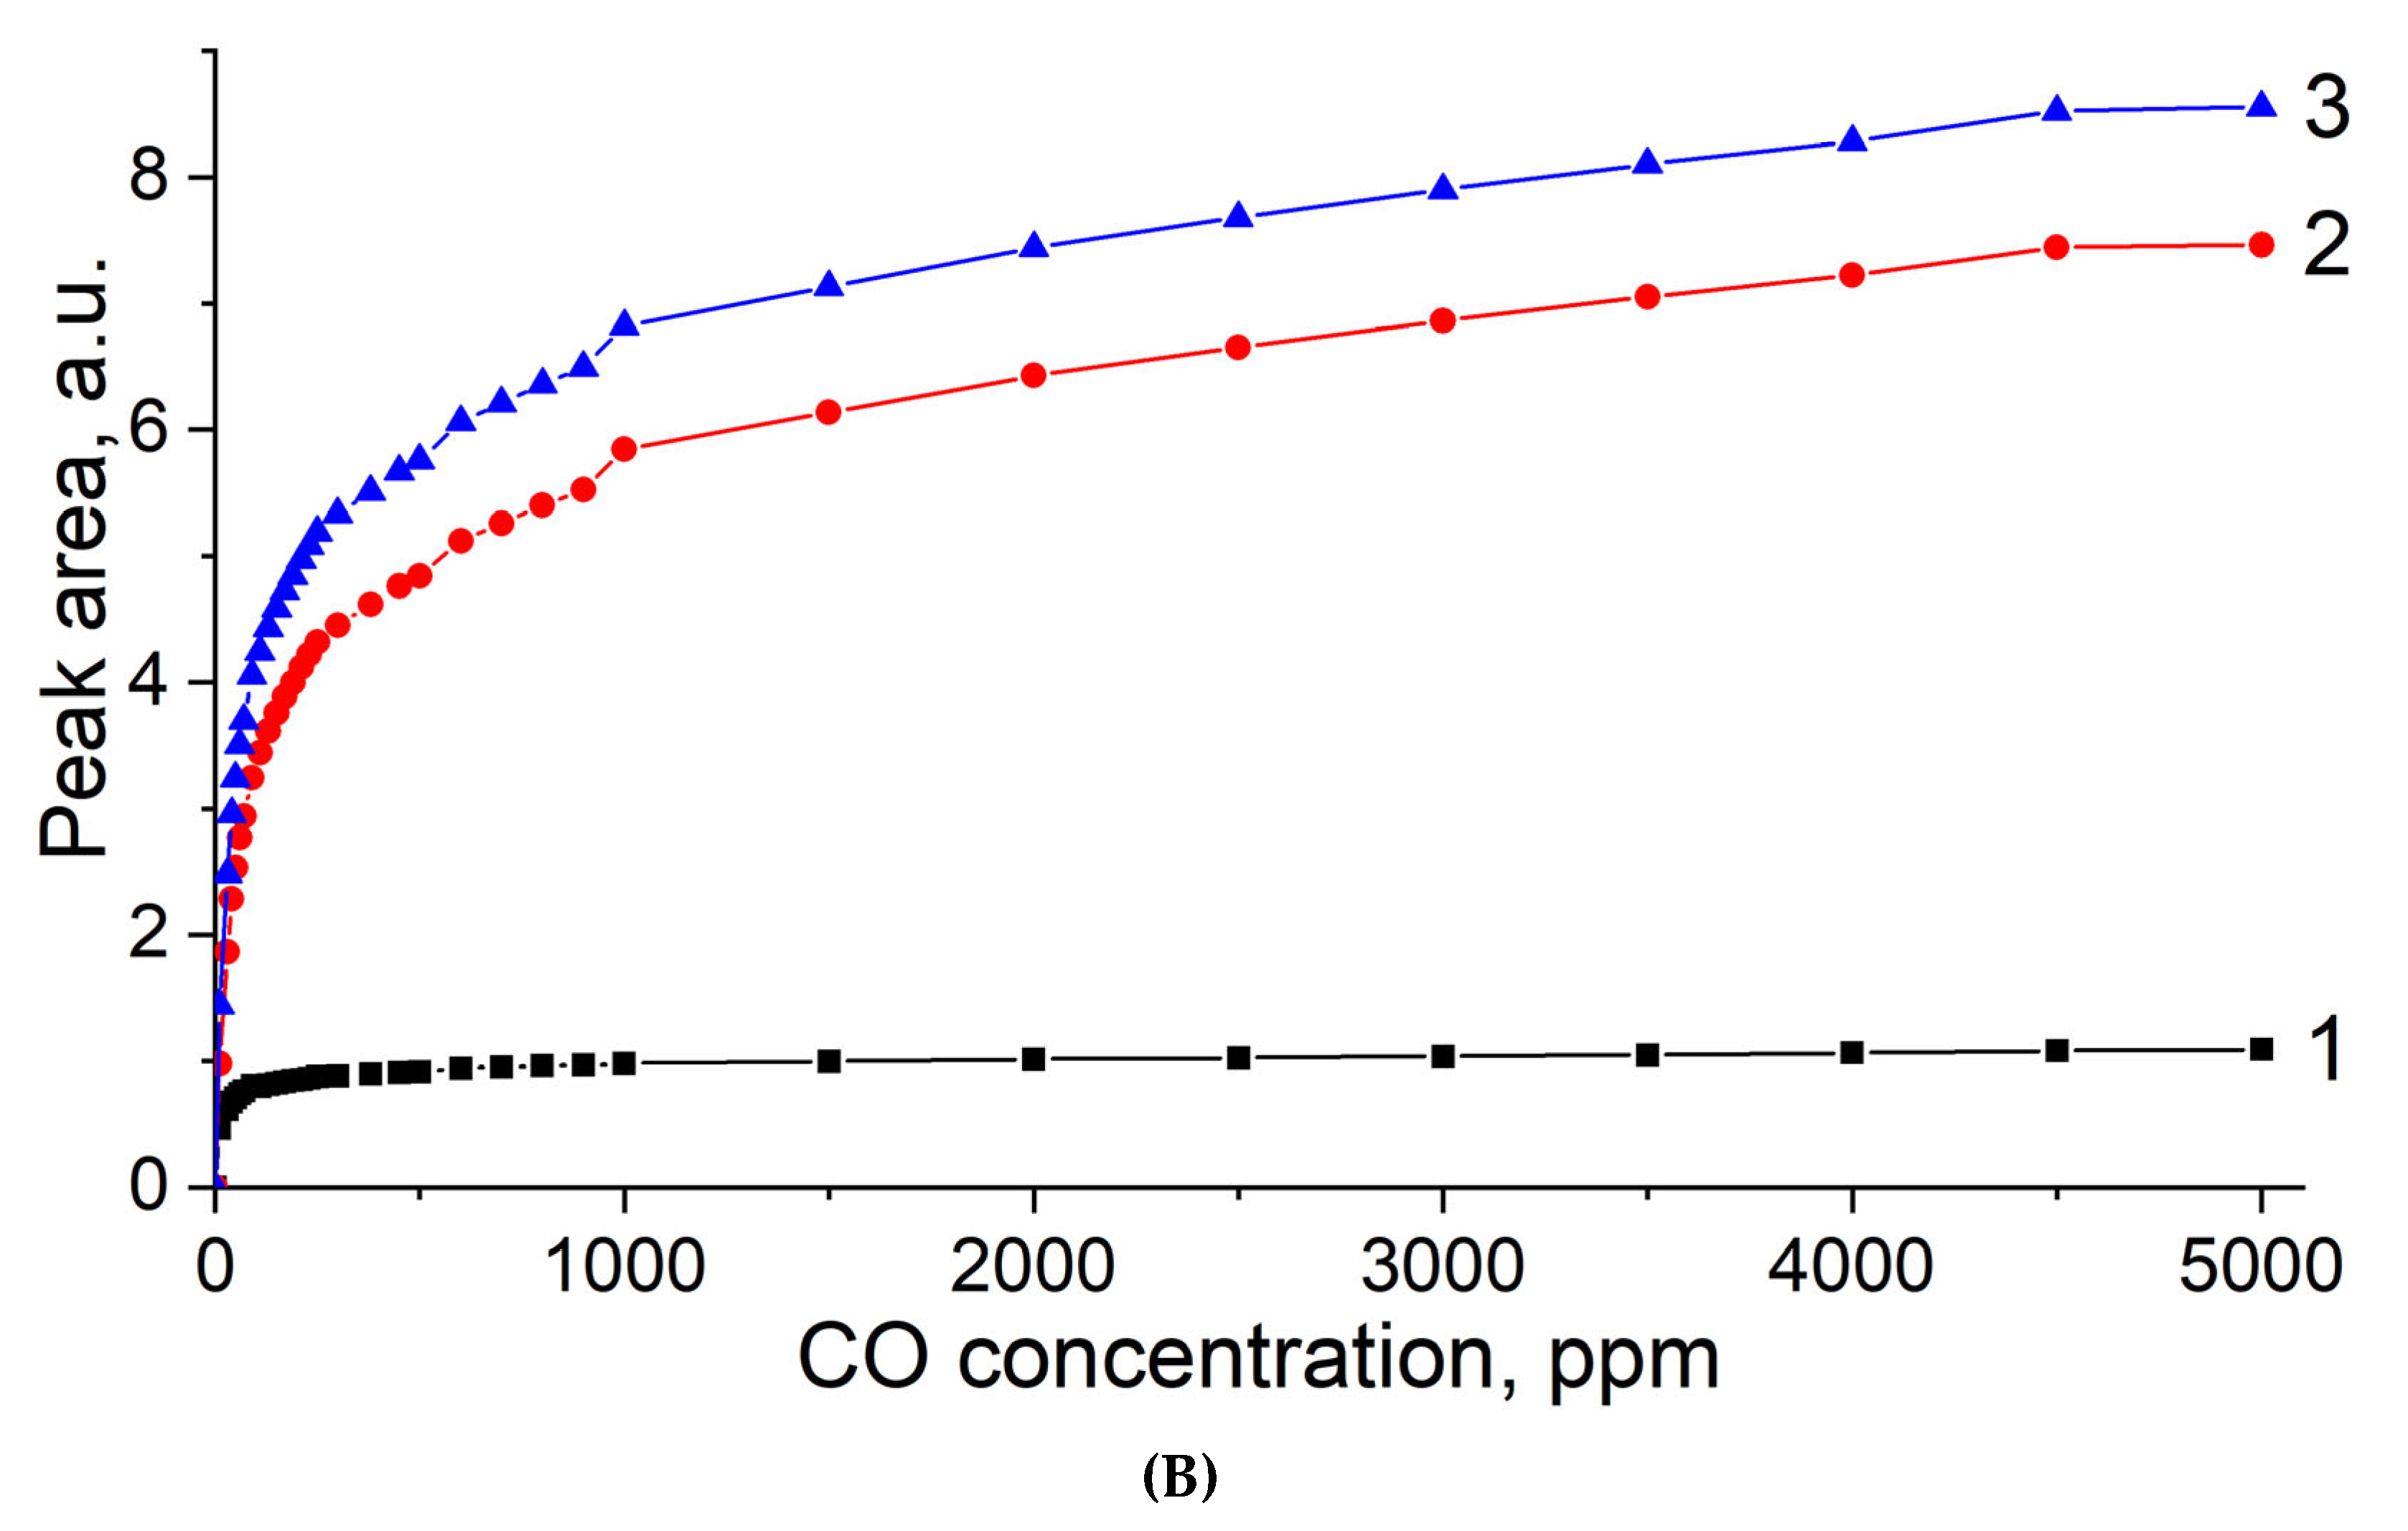
3.5. In Situ CO Adsorption on Cu(NO3)2-Impregnated MOR
3.6. In Vacuo CO–H2O Coadsorption on Cu(NO3)2-MOR
3.7. Cu-Impregnated Sn-BEA
3.8. CO–H2O Co-Adsorption on CuSn-BEA
4. Conclusions
Supplementary Materials
Author Contributions
Funding
Institutional Review Board Statement
Informed Consent Statement
Data Availability Statement
Acknowledgments
Conflicts of Interest
References
- Cobb, N.; Etzel, R.A. Unintentional Carbon Monoxide—Related Deaths in the United States, 1979 Through 1988. JAMA 1991, 266, 659–663. [Google Scholar] [CrossRef] [PubMed]
- Goldstein, M. Carbon Monoxide Poisoning. J. Emerg. Nurs. 2008, 34, 538–542. [Google Scholar] [CrossRef] [PubMed] [Green Version]
- Struttmann, T.; Scheerer, A.; Scott Prince, T.; Goldstein, L. Unintentional Carbon Monoxide Poisoning From an Unlikely Source. J. Am. Board Fam. Pract. 1998, 11, 481–484. [Google Scholar] [CrossRef] [PubMed] [Green Version]
- Fine, G.F.; Cavanagh, L.M.; Afonja, A.; Binions, R. Metal Oxide Semi-Conductor Gas Sensors in Environmental Monitoring. Sensors 2010, 10, 5469–5502. [Google Scholar] [CrossRef] [PubMed] [Green Version]
- Nandy, T.; Coutu, R.A.; Ababei, C. Carbon monoxide sensing technologies for next-generation cyber-physical systems. Sensors 2018, 18, 3443. [Google Scholar] [CrossRef] [Green Version]
- Kosterev, A.A.; Bakhirkin, Y.A.; Tittel, F.K. Ultrasensitive gas detection by quartz-enhanced photoacoustic spectroscopy in the fundamental molecular absorption bands region. Appl. Phys. B Lasers Opt. 2005, 80, 133–138. [Google Scholar] [CrossRef]
- Li, L.; Cao, F.; Wang, Y.; Cong, M.; Li, L.; An, Y.; Song, Z.; Guo, S.; Liu, F.; Wang, L. Design and characteristics of quantum cascade laser-based CO detection system. Sens. Actuators B Chem. 2009, 142, 33–38. [Google Scholar] [CrossRef]
- Wiegleb, G.; Heitbaum, J. Semiconductor gas sensor for detecting NO and CO traces in ambient air of road traffic. Sens. Actuators B Chem. 1994, 17, 93–99. [Google Scholar] [CrossRef]
- Carbon Monoxide Detector Market—Forecasts from 2021 to 2026; Research and Markets: Dublin, Ireland, 2021.
- Mahajan, S.; Jagtap, S. Metal-oxide semiconductors for carbon monoxide (CO) gas sensing: A review. Appl. Mater. Today 2020, 18, 100483. [Google Scholar] [CrossRef]
- Basu, A.K.; Chauhan, P.S.; Awasthi, M.; Bhattacharya, S. α-Fe2O3 loaded rGO nanosheets based fast response/recovery CO gas sensor at room temperature. Appl. Surf. Sci. 2019, 465, 56–66. [Google Scholar] [CrossRef]
- Zhang, D.; Wu, J.; Cao, Y. Cobalt-doped indium oxide/molybdenum disulfide ternary nanocomposite toward carbon monoxide gas sensing. J. Alloys Compd. 2019, 777, 443–453. [Google Scholar] [CrossRef]
- Introduction to Zeolite Science and Practice; Cejka, J.; van Bekkum, H.; Corma, A.; Schuth, F. (Eds.) Elsevier Science: Amsterdam, The Netherlands, 2007. [Google Scholar]
- Bordiga, S.; Lamberti, C.; Bonino, F.; Travert, A.; Thibault-Starzyk, F. Probing zeolites by vibrational spectroscopies chemical society reviews probing zeolites by vibrational spectroscopies. Chem. Soc. Rev. 2015, 44, 7262–7341. [Google Scholar] [CrossRef] [PubMed]
- Hadjiivanov, K.I.; Vayssilov, G.N. Characterization of oxide surfaces and zeolites by carbon monoxide as an IR probe molecule. Adv. Catal. 2002, 47, 307–511. [Google Scholar]
- Nachtigallová, D.; Bludský, O.; Otero Aerán, C.; Bulánek, R.; Nachtigall, P. The vibrational dynamics of carbon monoxide in a confined space-CO in zeolites. Phys. Chem. Chem. Phys 2006, 8, 4849–4852. [Google Scholar] [CrossRef]
- Kharchenko, A.; Zholobenko, V.; Vicente, A.; Fernandez, C.; Vezin, H.; De Waele, V.; Mintova, S. Formation of copper nanoparticles in LTL nanosized zeolite: Spectroscopic characterization. Phys. Chem. Chem. Phys. 2018, 20, 2880–2889. [Google Scholar] [CrossRef] [PubMed]
- Spoto, G.; Zecchina, A.; Bordiga, S.; Ricchiardi, G.; Martra, G.; Leofanti, G.; Petrini, G. Cu (I)-ZSM-5 zeolites prepared by reaction of H-ZSM-5 with gaseous CuCl: Spectroscopic characterization and reactivity towards carbon monoxide and nitric oxide. Appl. Catal. B Environ. 1994, 3, 151–172. [Google Scholar] [CrossRef]
- Harris, J.W.; Cordon, M.J.; Di Iorio, J.R.; Vega-Vila, J.C.; Ribeiro, F.H.; Gounder, R. Titration and quantification of open and closed Lewis acid sites in Sn-Beta zeolites that catalyze glucose isomerization. J. Catal. 2016, 335, 141–154. [Google Scholar] [CrossRef]
- Kobler, J.; Abrevaya, H.; Mintova, S.; Bein, T. High-Silica Zeolite-: From Stable Colloidal Suspensions to Thin Films. J. Phys. Chem. C 2008, 112, 14274–14280. [Google Scholar] [CrossRef]
- Al-Ani, A.; Haslam, J.J.C.; Mordvinova, N.E.; Lebedev, O.I.; Vicente, A.; Fernandez, C.; Zholobenko, V. Synthesis of nanostructured catalysts by surfactantlating of large-pore zeolites. Nanoscale Adv. 2019, 1, 2029–2039. [Google Scholar] [CrossRef] [Green Version]
- Baerlocher, C.; Mccusker, L.B.; Olson, D.H. Atlas of Zeolite Framework Types; Elsevier: Amsterdam, The Netherlands, 2007. [Google Scholar]
- Bordiga, S.; Lamberti, C.; Geobaldo, F.; Zecchina, A.; Palomino, G.T.; Areán, C.O. Fourier-Transform Infrared Study of CO Adsorbed at 77 K on H-Mordenite and Alkali-Metal-Exchanged Mordenites. Langmuir 1995, 11, 527–533. [Google Scholar] [CrossRef]
- Palomino, G.T.; Zecchina, A.; Giamello, E.; Fisicaro, P.; Berlier, G.; Lamberti, C.; Bordiga, S. Polycarbonylic and polynitrosylic species in Cu I-exchanged ZSM-5, β, Mordenite and Y zeolites: Comparison with homogeneous complexes. Stud. Surf. Sci. Catal. 2000, 130, 2915–2920. [Google Scholar]
- Lamberti, C.; Bordiga, S.; Zecchina, A.; Salvalaggio, M.; Geobaldoc, F.; Otero, C. XANES, EXAFS and FTIR characterization of copper-exchanged mordenite. J. Chem. Soc. Faraday Trans. 1998, 94, 1519–1525. [Google Scholar] [CrossRef]
- Turnes Palomino, G.; Bordiga, S.; Lamberti, C.; Zecchina, A.; Otero Areán, C. Vibrational and optical spectroscopic studies on copper-exchanged ferrierite. Stud. Surf. Sci. Catal. 2002, 1142, 199–206. [Google Scholar]
- Giordanino, F.; Vennestrøm, P.N.R.; Lundegaard, L.F.; Stappen, F.N.; Mossin, S.; Beato, P.; Bordiga, S.; Lamberti, C. Characterization of Cu-exchanged SSZ-13: A comparative FTIR, UV-Vis, and EPR study with Cu-ZSM-5 and Cu-β with similar Si/Al and Cu/Al ratios. Dalt. Trans 2013, 42, 12741. [Google Scholar] [CrossRef]
- Lamberti, C.; Bordiga, S.; Salvalaggio, M.; Spoto, G.; Zecchina, A.; Geobaldo, F.; Vlaic, G.; Bellatreccia, M. XAFS, IR, and UV−Vis Study of the CuI Environment in CuI-ZSM-5. J. Phys. Chem. B 1997, 101, 344–360. [Google Scholar] [CrossRef]
- Zholobenko, V.; Freitas, C.; Jendrlin, M.; Bazin, P.; Travert, A.; Thibault-Starzyk, F. Probing the acid sites of zeolites with pyridine: Quantitative AGIR measurements of the molar absorption coefficients. J. Catal. 2020, 385, 52–60. [Google Scholar] [CrossRef] [Green Version]
- Corma, A.; Nemeth, L.T.; Renz, M.; Valencia, S. Sn-zeolite beta as a heterogeneous chemoselective catalyst for Baeyer-Villiger oxidations. Nature 2001, 412, 423–425. [Google Scholar] [CrossRef]
- Jendrlin, M.; Grand, J.; Lakiss, L.; Dubray, F.; Bazin, P.; El Fallah, J.; Mintova, S.; Zholobenko, V. Environmental applications of zeolites: Hydrophobic Sn-BEA as a selective gas sensor for exhaust fumes. Submitt. Chem. 2023. [Google Scholar]


| Zeolite | Si (at.%) | Al (at.%) | Cu (at.%) | Si/Al | Cu/Al |
|---|---|---|---|---|---|
| MOR-CuSO4 | 76.6 | 8.2 | 12.6 | 9.3 | 1.5 |
| MOR-Cu(NO3)2 | 78.4 | 8.4 | 13.2 | 9.4 | 1.6 |
| MOR-Cu(OAc)2 | 80.5 | 8.1 | 11.4 | 9.9 | 1.4 |
| MOR-Cu(NO3)2-IE * | 89.4 | 8.3 | 2.3 | 10.7 | 0.3 |
| BEA-12-CuSO4 | 78.8 | 6.3 | 11.6 | 12.5 | 1.8 |
| BEA-12-Cu(NO3)2 | 63.7 | 5.2 | 13.5 | 12.2 | 2.6 |
| BEA-12-Cu(OAc)2 | 84.2 | 6.6 | 9.2 | 12.8 | 1.4 |
| BEA-19-CuSO4 | 80.1 | 4.2 | 12.5 | 19.0 | 3.0 |
| BEA-19-Cu(NO3)2 | 80.0 | 4.5 | 15.5 | 17.9 | 3.5 |
| BEA-19-Cu(OAc)2 | 87.2 | 4.5 | 8.4 | 19.5 | 1.9 |
| ZSM-5-CuSO4 | 84.1 | 2.4 | 10.8 | 35.2 | 4.5 |
| ZSM-5-Cu(NO3)2 | 68.5 | 2.0 | 13.4 | 33.7 | 6.6 |
| ZSM-5-Cu(OAc)2 | 87.1 | 2.4 | 10.5 | 36.1 | 4.4 |
| NaX-CuSO4 | 39.9 | 30.4 | 11.7 | 1.3 | 0.4 |
| NaX-Cu(NO3)2 | 42.1 | 31.6 | 11.0 | 1.3 | 0.4 |
| NaX-Cu(OAc)2 | 44.9 | 31.7 | 8.6 | 1.4 | 0.3 |
| NaY-CuSO4 | 54.5 | 20.3 | 12.6 | 2.7 | 0.6 |
| NaY-Cu(NO3)2 | 55.4 | 20.4 | 15.3 | 2.7 | 0.7 |
| NaY-Cu(OAc)2 | 59.9 | 21.6 | 9.1 | 2.8 | 0.4 |
| FER-CuSO4 | 81.3 | 8.4 | 8.2 | 9.7 | 1.0 |
| FER-Cu(NO3)2 | 74.3 | 7.4 | 11.4 | 10.1 | 1.5 |
| FER-Cu(OAc)2 | 82.6 | 8.7 | 8.8 | 9.5 | 1.0 |
| Zeolite | Cu+-CO *, cm−1 | Cu+-(CO)2 *, cm−1 | Cu+-CO, cm−1 | Cu+-(CO)2, cm−1 |
|---|---|---|---|---|
| NaX | 2153 | 2176, 2113 | - | - |
| NaY | 2148 | 2157, 2108 | 2143 [24] | 2168, 2135 [24] |
| MOR | 2156 | 2178, 2108 | 2159 [25] | 2180, 2152 [25] |
| FER | 2155 | 2177, 2115 | 2157 [26] | 2178, 2142 [26] |
| BEA-12 | 2154 | 2180, 2130 | 2157 [24] 2158 [27] | 2180, 2152 [24] 2180, 2152 [27] |
| BEA-19 | 2157 | 2179, 2132 | - | - |
| ZSM-5 | 2156 | 2176, 2133 | 2158 [24] 2157 [28] | 2178, 2150 [24] 2178, 2151 [28] |
| Zeolite | Area CO | μmol CO/g of zeolite # | μmol Cu/g of zeolite, total † | Cu+/Cu ** |
|---|---|---|---|---|
| MOR-CuSO4 | 74.3 | 672 | 1227 | 0.55 |
| MOR-Cu(NO3)2 | 88.7 | 801 | 1101 | 0.73 |
| MOR-Cu(OAc)2 | 60.8 | 549 | 899 | 0.61 |
| MOR-Cu(NO3)2 * | 26.2 | 237 | 229 | 1.03 |
| BEA-12-CuSO4 | 18.1 | 164 | 1545 | 0.11 |
| BEA-12-Cu(NO3)2 | 40.9 | 370 | 1279 | 0.29 |
| BEA-12-Cu(OAc)2 | 54.7 | 495 | 1192 | 0.42 |
| BEA-19-CuSO4 | 20.1 | 181 | 1190 | 0.15 |
| BEA-19-Cu(NO3)2 | 46.1 | 417 | 1126 | 0.37 |
| BEA-19-Cu(OAc)2 | 69.5 | 628 | 735 | 0.86 |
| ZSM-5-CuSO4 | 11.3 | 102 | 1498 | 0.07 |
| ZSM-5-Cu(NO3)2 | 34.0 | 307 | 1315 | 0.23 |
| ZSM-5-Cu(OAc)2 | 32.3 | 292 | 797 | 0.37 |
| NaX-CuSO4 | 16.4 | 148 | 1173 | 0.13 |
| NaX-Cu(NO3)2 | 26.1 | 236 | 1096 | 0.21 |
| NaX-Cu(OAc)2 | 47.8 | 432 | 858 | 0.50 |
| NaY-CuSO4 | 5.8 | 52 | 1228 | 0.04 |
| NaY-Cu(NO3)2 | 16.0 | 144 | 1432 | 0.10 |
| NaY-Cu(OAc)2 | 13.4 | 121 | 829 | 0.15 |
| FER-CuSO4 | 29.3 | 265 | 820 | 0.32 |
| FER-Cu(NO3)2 | 46.7 | 422 | 1135 | 0.37 |
| FER-Cu(OAc)2 | 44.5 | 402 | 877 | 0.46 |
Disclaimer/Publisher’s Note: The statements, opinions and data contained in all publications are solely those of the individual author(s) and contributor(s) and not of MDPI and/or the editor(s). MDPI and/or the editor(s) disclaim responsibility for any injury to people or property resulting from any ideas, methods, instructions or products referred to in the content. |
© 2023 by the authors. Licensee MDPI, Basel, Switzerland. This article is an open access article distributed under the terms and conditions of the Creative Commons Attribution (CC BY) license (https://creativecommons.org/licenses/by/4.0/).
Share and Cite
Jendrlin, M.; Grand, J.; Lakiss, L.; Bazin, P.; Mintova, S.; Zholobenko, V. Environmental Applications of Zeolites: Preparation and Screening of Cu-Modified Zeolites as Potential CO Sensors. Chemistry 2023, 5, 314-333. https://doi.org/10.3390/chemistry5010024
Jendrlin M, Grand J, Lakiss L, Bazin P, Mintova S, Zholobenko V. Environmental Applications of Zeolites: Preparation and Screening of Cu-Modified Zeolites as Potential CO Sensors. Chemistry. 2023; 5(1):314-333. https://doi.org/10.3390/chemistry5010024
Chicago/Turabian StyleJendrlin, Martin, Julien Grand, Louwanda Lakiss, Philippe Bazin, Svetlana Mintova, and Vladimir Zholobenko. 2023. "Environmental Applications of Zeolites: Preparation and Screening of Cu-Modified Zeolites as Potential CO Sensors" Chemistry 5, no. 1: 314-333. https://doi.org/10.3390/chemistry5010024