Article

Theoretical Study of Excited-State Dynamics of Hypercoordinated Carbon Molecule

by
Probal Nag
and
Sivaranjana Reddy Vennapusa
*
School of Chemistry, Indian Institute of Science Education and Research Thiruvananthapuram, Maruthamala P.O., Vithura, Thiruvananthapuram 695551, India
*
Author to whom correspondence should be addressed.
Chemistry 2023, 5(1), 269-280; https://doi.org/10.3390/chemistry5010021
Submission received: 10 January 2023 / Revised: 6 February 2023 / Accepted: 14 February 2023 / Published: 15 February 2023
(This article belongs to the Special Issue Hypercoordinate Carbon)

Abstract

:
Structural and dynamical aspects of vibronically coupled S 1 (dipole-allowed, “bright”) and S 2 (dipole-forbidden, “dark”) states of hypercoordinated carbon molecule, 1,8-dimethoxy-9-dimethoxymethylanthracene monocation, are investigated. Potential energy surfaces are modeled within the linear vibronic coupling scheme. Quantum dynamics simulation show that the nuclear wavepacket initiated on the “bright” S 1 state would move to “dark” S 2 within a few femtoseconds via an accessible conical intersection. A dynamical equilibrium of wavepacket exchange between S 1 and S 2 is observed after 50 fs of propagation time. The activity of vibrational motions associated with the hypercoordinated carbon and C−H vibrations is analyzed using the reduced nuclear densities. Our findings illustrate that the excited-state nonadiabatic behavior has to be taken into account while analyzing the optical properties of this hypercoordinated carbon molecule.

1. Introduction

Despite the harsh conditions present in the interstellar medium, various organic molecules have been found to exist. Most common of those are perhaps H 2 , CH, CN, CH + , to mention a few [1]. Subjected to UV radiation, various photochemical processes take place, thus opening an interesting area of research to understand the photoinduced processes of such molecules. One such molecule which has gathered attention in this area is the methanium ion CH 5 + [2]. This molecule is a positively charged complex ion containing a carbon atom connected to three hydrogen atoms and a hydrogen molecule. Main point of interest here is the presence of a 3-centered, 2-electron bond between the C−atom and the adjacent H-atoms, giving rise to a hypercoordinated carbon system which violates the general coordination number of carbon, viz., 4 [3].
Since the discovery of protonated methane, CH 5 + [4,5], interest has widely grown towards studying hypercoordinate carbon compounds. Characterization of the molecule posed to be challenging due to its highly fluxional nature. However, with developments in spectroscopic techniques over the years, studying such systems became possible. Computational studies using dynamics simulations of the small hypercoodinated carbon system helped understand the stability of the cation [6,7]. Such developments challenged the conventional thought of carbon being tetracoordinated.
The most common S N 2 nucleophilic substitution reaction studied in organic chemistry is perhaps the closest one can experimentally observe a pentacoordinate carbon centre which is generated during formation of the transition state [8]. Efforts were spent on stabilizing the transition state to be able to characterize the molecules. It was found that a trigonal bipyramidal structure would exist around the central carbon atom. Akiba et al. synthesized and characterized the first stable hypercoordinate carbon system—1,8-dimethoxy-9-dimethoxymethylanthracene monocation (cf., Figure 1, hereafter referred to as 1)—as a model system for the S N 2 transition state [9]. Similar such systems were further developed, focusing on the stability of the molecules [10,11]. Apart from purely organic systems, many metallated carbon hypercoordinated systems were also studied over the years, which are stabilized by metal-metal interactions [12,13,14,15,16].
Even though there are a large number of studies focusing on the ground-state properties of hypercoordinated systems, the excited-state properties are still open for interpretation. Generally, photoinduced processes are studied along a single potential energy surface (PES), considering well-separated electronic states. However, with development in computational techniques, it is now possible to analyze the excited-state decay mechanism in the case of near-degenerate states. In the scenario where the states are near-degenerate, photorelaxation might take place on an ultrafast time scale (within femtoseconds), in contrast to internal conversion (IC) which usually occurs on a slower time frame (<10 12 s).
In this study, we focus on the excited-state photorelaxation dynamics of the hypercoordinate system, 1, using quantum dynamics simulation. We utilize the linear vibronic coupling (LVC) approximation to generate the PESs of the low-lying singlet excited states. Subsequently, we study the IC dynamics by performing wavepacket dynamics simulation using the well-established multiconfiguration time-dependent Hartree (MCTDH) method. We then analyze the dynamical events based on the electronic population and reduced nuclear densities.

2. Computational Methodology

2.1. Static Calculations

Ground-state geometry optimization of 1 was performed within the C 2 v point group using the hybrid density functional B3LYP [17] combined with the cc-pVDZ basis set [18]. The geometry of the equilibrium minimum was confirmed by frequency analysis, which resulted in no imaginary frequencies. Excitation energies and the corresponding oscillator strengths were subsequently computed using the time-dependent density functional (TDDFT) method—coulomb attenuating method B3LYP (TD-CAM-B3LYP) [19]—using aug-cc-pVDZ basis set [20].
To validate the energies and the state characters, we benchmark the results using various time-dependent variants of functionals like M06-2X [21] and ω B97XD [22]. We also utilize two wavefunction-based methods, resolution-of-the-identity second-order approximate coupled-cluster singles and doubles (RI-CC2) [23], and algebraic diagrammatic construction method to second-order (ADC(2)) [24], to obtain the relevant energies for comparison. All benchmark tests were performed using the aug-cc-pVDZ basis set. All DFT computations were performed using the Gaussian 16 program package [25], while the wavefunction-based calculations were done in TURBOMOLE 7.4 [26].

2.2. Vibronic Hamiltonian

We use a 2 × 2 vibronic Hamiltonian to explore the photophysical relaxation process happening on the coupled S 1 S 2 PESs. The Hamiltonian is generated within the LVC approximation in terms of the normal dimensionless coordinates [27], given by
H = ( T N + V 0 ) 1 2 + S 1 0 + i a 1 κ i ( 1 ) Q i j a 2 λ j Q j j a 2 λ j Q j S 2 0 + i a 1 κ i ( 2 ) Q i
where T N and V 0 are the ground-state kinetic and potential energy matrix elements. 1 2 denotes a 2 × 2 unit matrix. S n 0 is the vertical excitation energy (n = 1, 2) at the Franck-Condon (FC) geometry (Q 0 ). κ and λ are the intrastate and interstate coupling constants along totally symmetric ( a 1 symmetry) and non-totally symmetric vibrational modes, respectively. The former provides us with the gradient of the PES, thereby tuning the energy gap between the two states, while the latter couples the two states. Vibrational modes having irreducible representation the same as that obtained by the direct product of the two states would couple the states, i.e., S 1 and S 2 states having A 1 and A 2 symmetries, respectively, will be coupled via a 2 vibrational modes. The coupling parameters are computed using the following equations [27]:
κ ( S n ) = V S n Q i | Q 0 , i a 1
λ i / j ( S m S n ) = 1 8 2 Q i / j 2 | V S m ( Q ) V S n ( Q ) | 2 Q 0 1 / 2 , i a 1 ; j a 2
where V S m and V S n are the adiabatic potential energies of the electronic states S m and S n , respectively.

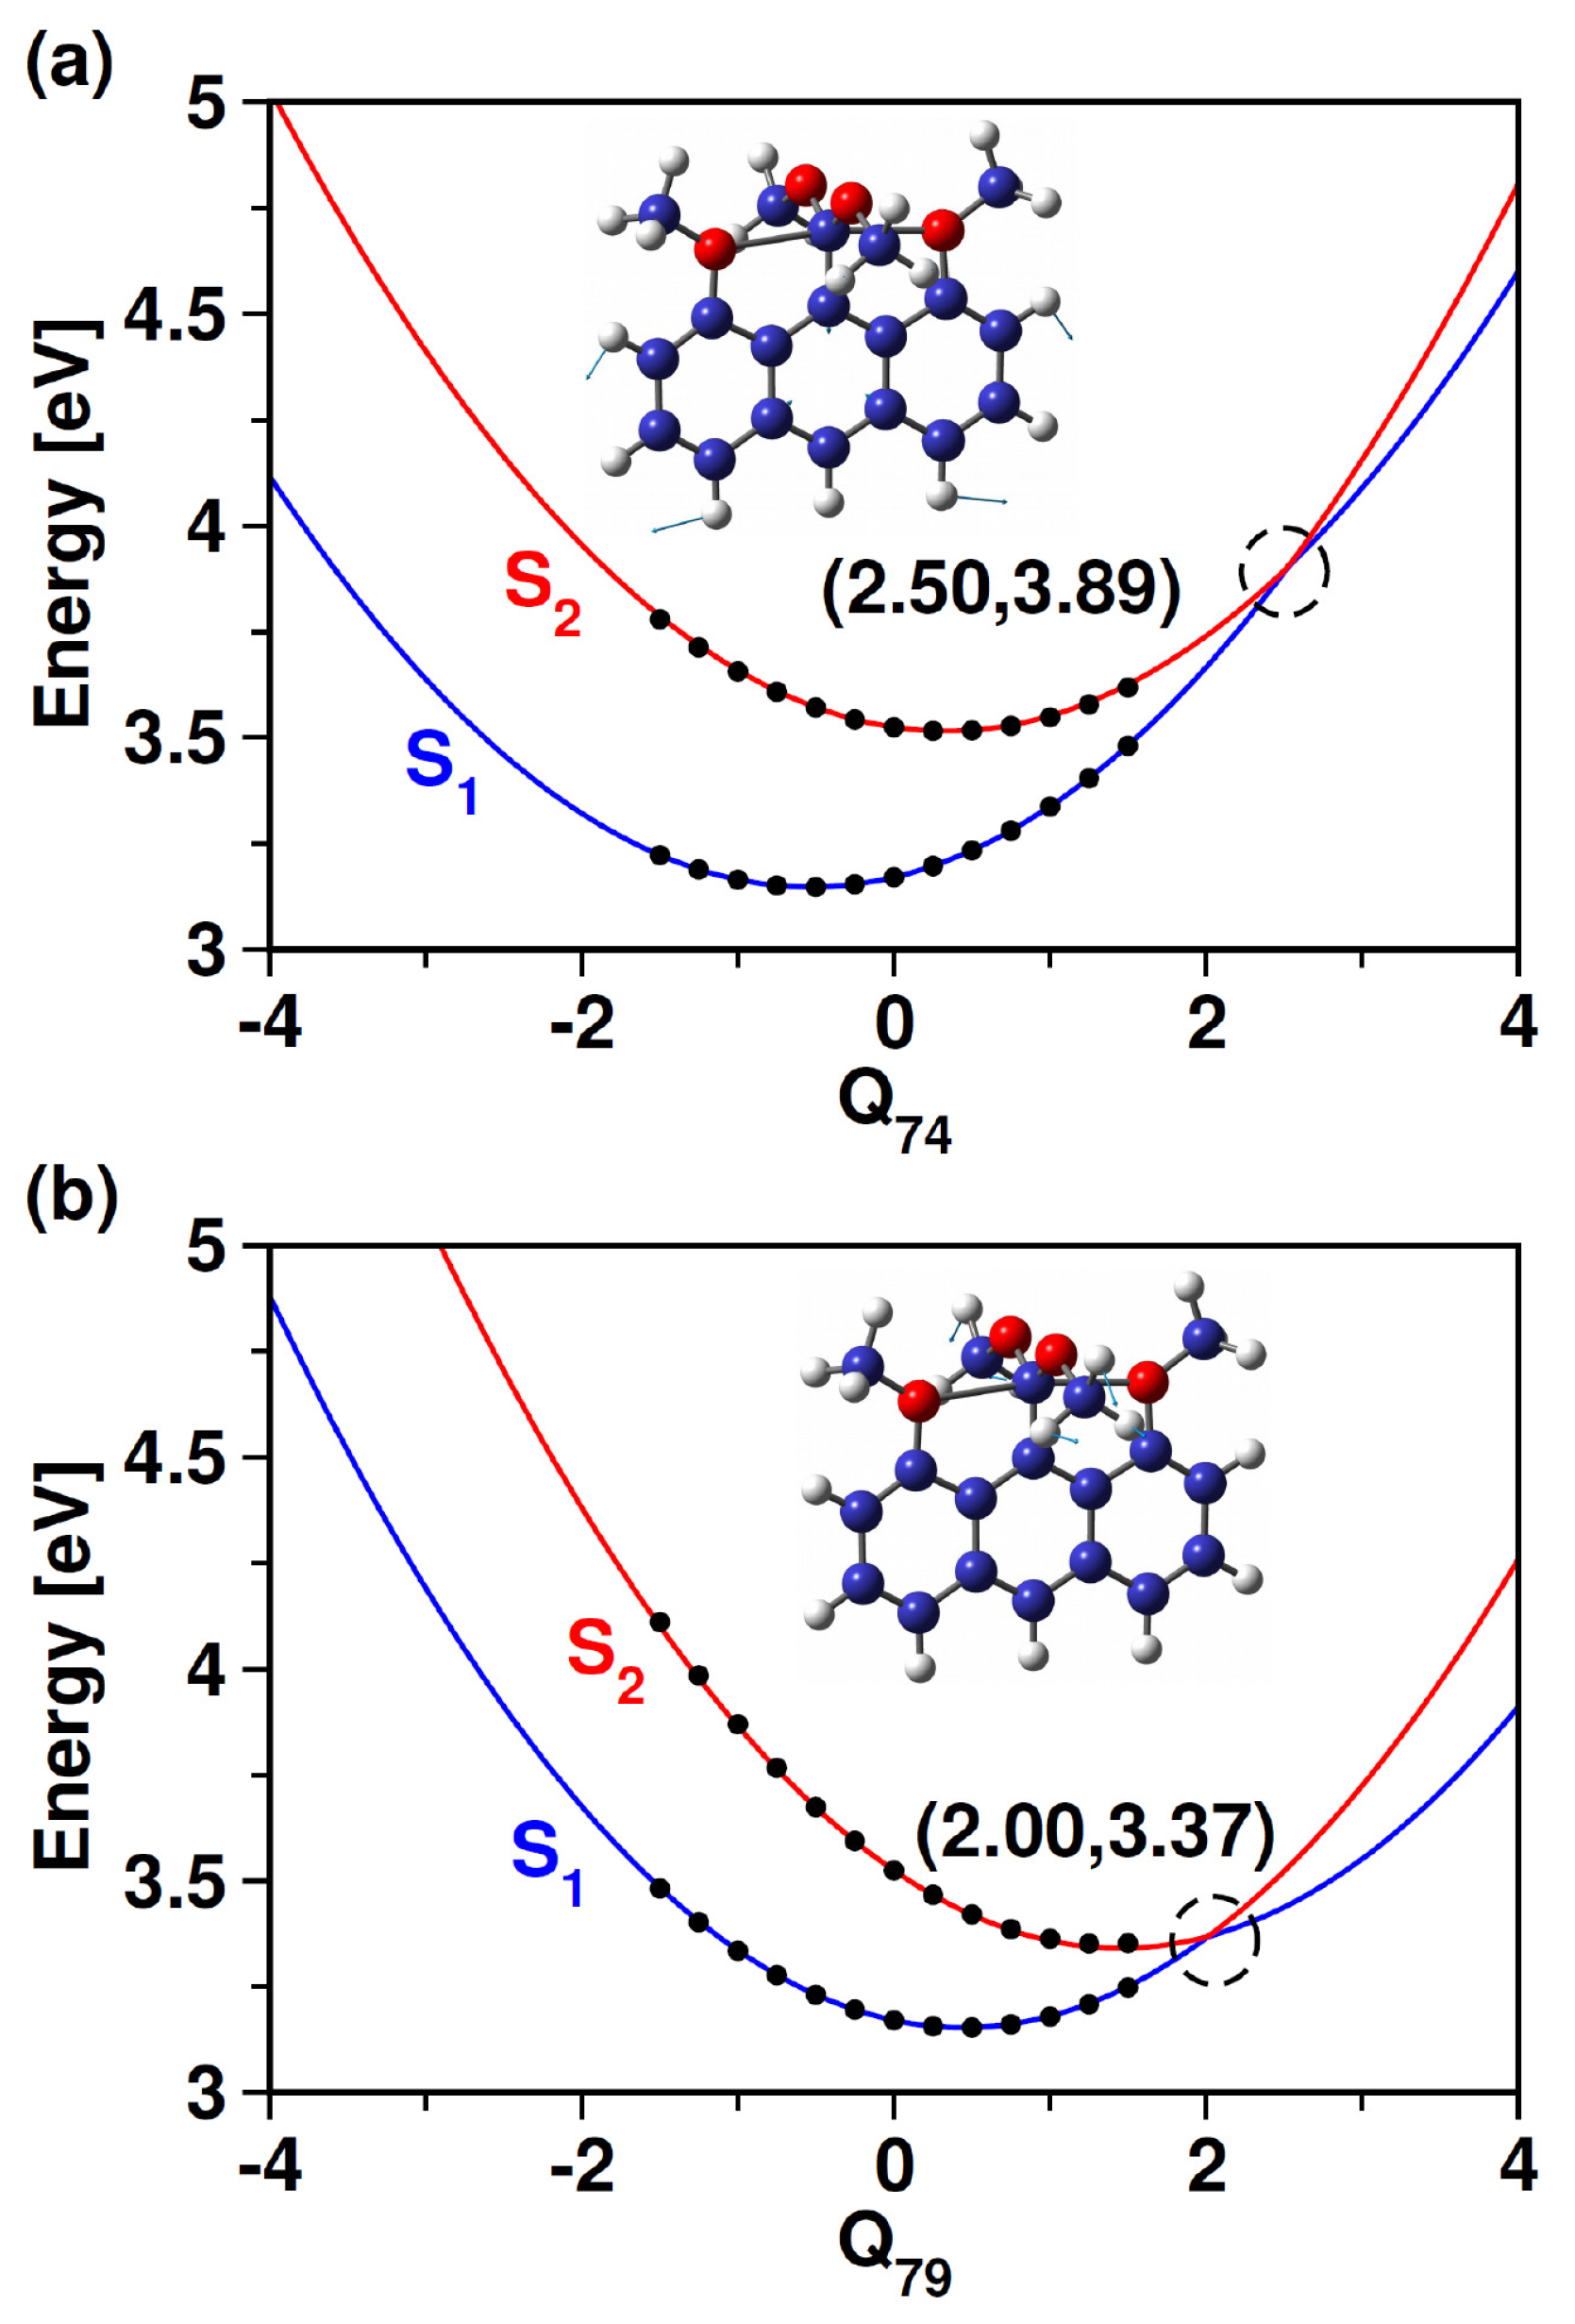
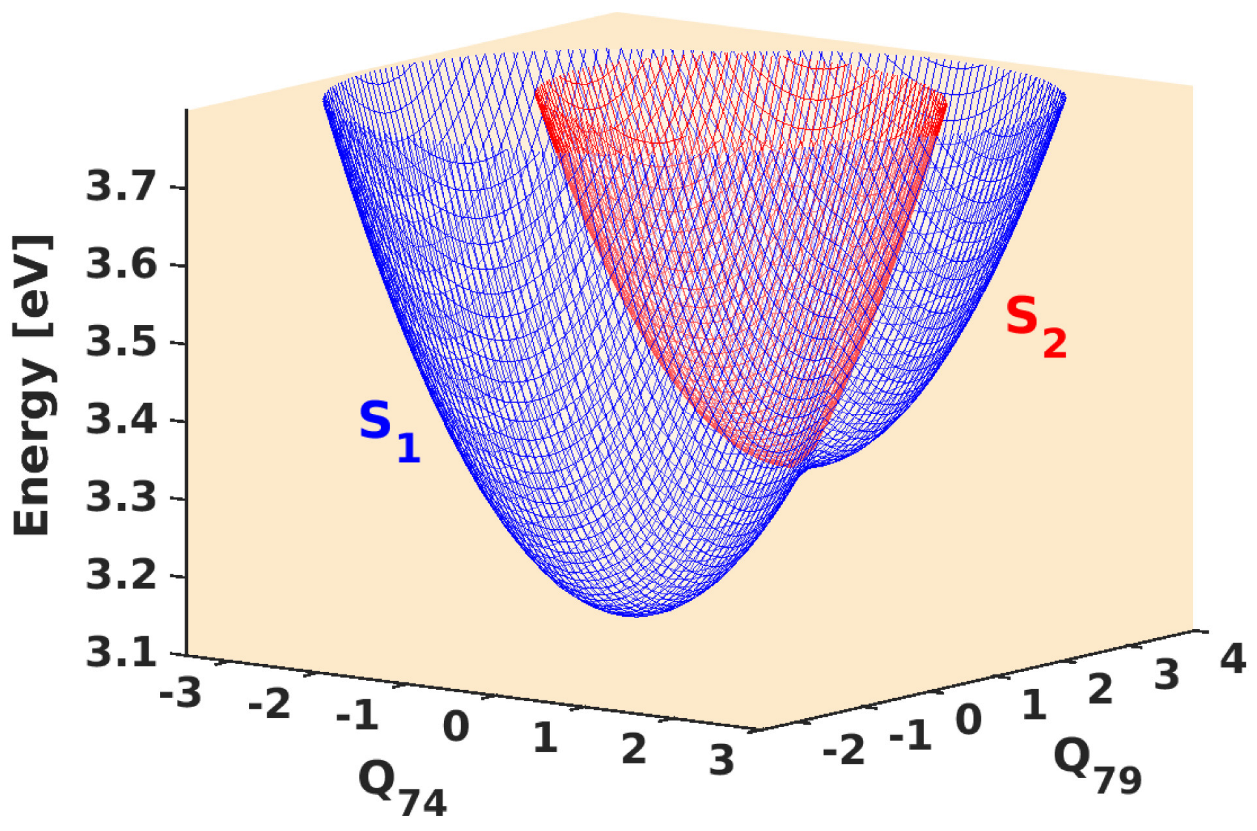
2.3. State Minima and Conical Intersection

The energetic location of the minimum energy conical intersection (MECI) on the coupled S 1 S 2 PESs were estimated within the LVC approach using the following expressions [27]:
MECI = a + ( A b ) 2 2 B 1 2 n v σ n 2 ω n ,
where,
a = S 2 0 + S 1 0 2
b = S 2 0 S 1 0 2
A = n v δ n σ n ω n
and
B = n v δ n 2 ω n
with
σ n = κ n ( 2 ) + κ n ( 1 ) 2
δ n = κ n ( 2 ) κ n ( 1 ) 2
Here, S 1 0 and S 2 0 are the vertical excitation energies of S 1 and S 2 states, respectively. ω n denotes the harmonic frequency of nth totally symmetric vibrational mode. The total number of such vibrational modes is given by v. κ ( 1 ) and κ ( 2 ) are the intrastate coupling parameters of S 1 and S 2 states, respectively.
The equilibrium minimum of a given excited-electronic state S i is given by
S i , min = S i 0 n v κ n , i 2 2 ω n .
To validate the obtained location of the MECI within the LVC approximation, we optimize the MECI between the two states using the CI optimization code implemented in the global reaction route mapping (GRRM) program [28]. Within this code, a gradient projection (GP) method is utilized, where the intersection point is estimated via the difference in the gradient vector between the involved PESs [29,30,31]. Using this method, we obtain the energetic location of the MECI, as well as the geometry, enabling us to infer the molecular distortion required to reach the MECI point from the FC geometry.

2.4. MCTDH Wavepacket Dynamics

To investigate the IC decay upon photoexcitation to the dipole-allowed “bright” S 1 state, we perform quantum wavepacket dynamics simulation using the MCTDH method [32,33]. The suitability of this method for systems with vibronically coupled PESs and large nuclear degrees of freedom (DOF) has been well-established in the literature [34,35]. The wavefunction for f DOF in this method can be written as
Ψ ( Q 1 , , Q f , t ) = i 1 = 1 n 1 i f = 1 n f P i 1 i f ( t ) k = 1 f ϕ i k ( k ) ( Q k , t ) .
where Q 1 , …, Q f are the nuclear coordinates of vibrational modes. P i 1 i f and ϕ i k ( k ) denote the MCTDH expansion coefficients and single-particle functions (SPFs), respectively. n k represents the number of SPFs to describe the k-th DOF. Basis functions in the form of discrete variable representations are used in this study to describe the SPFs before solving the MCTDH equations of motion.
Further, we use the “mode combination” strategy to reduce the memory requirement, wherein a set of DOF are combined and each such set is represented as SPFs. In this scenario, the wavefunction can be rewritten as a multi-configuration over p generalized particles as:
Ψ ( Q 1 , Q 2 , , Q f , t ) = j 1 = 1 n 1 j p = 1 n p R j 1 , j p ( t ) ϕ j 1 ( 1 ) ( Q 1 , t ) ϕ j p ( p ) ( Q p , t )
with
ϕ j ( k ) ( Q k , t ) = ϕ j ( k ) ( Q 1 , Q 2 , , Q w , t )
where Q k = (Q 1 , Q 2 , …, Q w ) represents the multidimensional coordinate for mode k.
We select 26 relevant modes based on the excitation strength of the individual modes ( κ 2 /2 ω 2 or λ 2 /2 ω 2 , where ω is the frequency of the respective mode). The ground-state nuclear wavepacket is prepared at the FC point of S 1 by vertical transition and propagated for 300 fs. Subsequently, the wavepacket motion is tracked based on the diabatic electronic population (B γ ( t ) ) and reduced nuclear densities ( ρ γ ( Q i , t ) ) of a given diabatic electronic state, γ . These are obtained using the following expressions:
B γ ( t ) = | Ψ γ ( t ) | 2 d t
ρ γ ( Q i , t ) = Ψ γ ( t ) Ψ γ ( t ) j i d Q j
We used the Heidelberg MCTDH code version 8.5 Revision 11 [36] for the nuclear wavepacket simulation. Details of relevant vibrations, primitive basis, and SPFs employed in this simulation are given in Supplementary Material.

3. Results

3.1. Stationary Point Analysis

Table 1 collects the FC vertical excitation energies, oscillator strengths and symmetries of S 1 and S 2 states of 1. Both TDDFT and wavefunction methods predict S 1 to be the “bright” state with A 1 symmetry, while S 2 is the “dark” state (zero oscillator strength) with A 2 symmetry. TDDFT methods yield a relatively higher S 1 S 2 gap (∼0.4 eV) than the wavefunction methods (∼0.3 eV). As there are no reports on the experimental excited-state energies to match our computed energies, we chose the TD-CAM-B3LYP method to construct the model PESs of electronic states of interest.
Here, we analyze the origin of the electronic transitions based on the natural transition orbitals (NTOs). Relevant NTOs are collected in the Supplementary Material (Figure S1). The S 1 state originates predominantly from a π π * transition, thus leading to the observation of a noticeable oscillator strength. We also find that the S 2 state possesses π π * character. However, the virtual and occupied molecular orbitals associated with this transition are orthogonal, resulting in a minor or no overlap between those orbitals. Hence, S 2 appears as a “dark” state with zero oscillator strength.
Even though S 1 and S 2 states are relatively well-separated at the FC geometry (i.e., equilibrium geometry), these states might converge upon distorting the molecule. To unravel this, we perform distortion of the molecule along the normal vibrational modes and compute the energies at each distorted geometry. We plot those energies along the normal dimensionless coordinates along two vibrational modes in Figure 2. In Figure 2a, we observe that the states tend to converge upon distortion caused by in−plane bending of the C−H bond of the aromatic ring. The states become degenerate at Q = 2.50. We also observe a similar convergence of the states upon bending of the C−H bond present in the methoxy groups (cf., Figure 2b). Compared to the C−H bending vibration in the aromatic ring, the latter vibration induces the crossing between S 1 and S 2 states at a slightly smaller distortion (Q = 2.00) and a lower energy level (difference of ∼0.5 eV). These curve-crossing features show that the nuclear motion would bring the seemingly well-separated states closer. We also identified such curve crossing for other vibrational modes. These curve crossings form the seam of the multidimensional conical intersection. A pictorial representation of the conical intersection in the coordinate space of C−H bending vibrational modes is shown in Figure 3.
To gain a detailed insight into the conical intersection, we calculate the energetic position of the MECI in the multidimensional coordinate space using the LVC potentials (cf., Section 2.3). The MECI location and the excited-state minima are collected in Table 2. From Table 1 and Table 2, we find that the MECI lies only ∼0.15 eV below the S 1 FC point. The S 1 minimum is located at 2.89 eV, thereby having a stabilization energy of ∼0.28 eV. While relaxing to the S 1 state minimum, the molecule would encounter the low-lying MECI. Such an encounter within the FC region would be possible on a prerequisite that the structural distortions that transform the FC geometry to the MECI geometry should be minimal.
To evaluate the extent of distortion required to obtain the MECI geometry, we optimize the MECI using the GRRM program (cf., Section 2.3). The energetic location of the conical intersection using this approach is estimated to be ∼3.09 eV (cf., Table 2). This energy value is similar to that obtained using the LVC potentials (∼3.02 eV), suggesting that model PESs of the LVC approach would be sufficient to track the relaxation dynamics within the FC region. To gain further insights into the extent of distortions required to reach the MECI geometry from the FC geometry, we compute the variation in the bond lengths along those atoms connected to the hypercoordinated C−atom (cf., Table 3). We note that the MECI geometry optimized using GRRM retains the C 2 v point group, same as the FC geometry. A 2% variation in the C−C bond length occurs among the two structures, while the highest distortion required is a meager 3% taking place along the C−O bonds. On analyzing the bond angles around the hypercoordinate center, we observe that the distortions required are even less than that required for the bond lengths. The maximum variation observed in the angles is ∼1% (cf., Table 3). We also observe negligible variations in the dihedral angles around the hypercoordinated center. Overall, we find minute variations of geometrical parameters involving the hypercoordinated C−center. The energetic and spatial locations estimated within the LVC approach show that the MECI can be easily accessible by the photoexcited molecule. Thus, one would expect nonadiabatic effects to dominate the excited-state dynamics of this molecule.

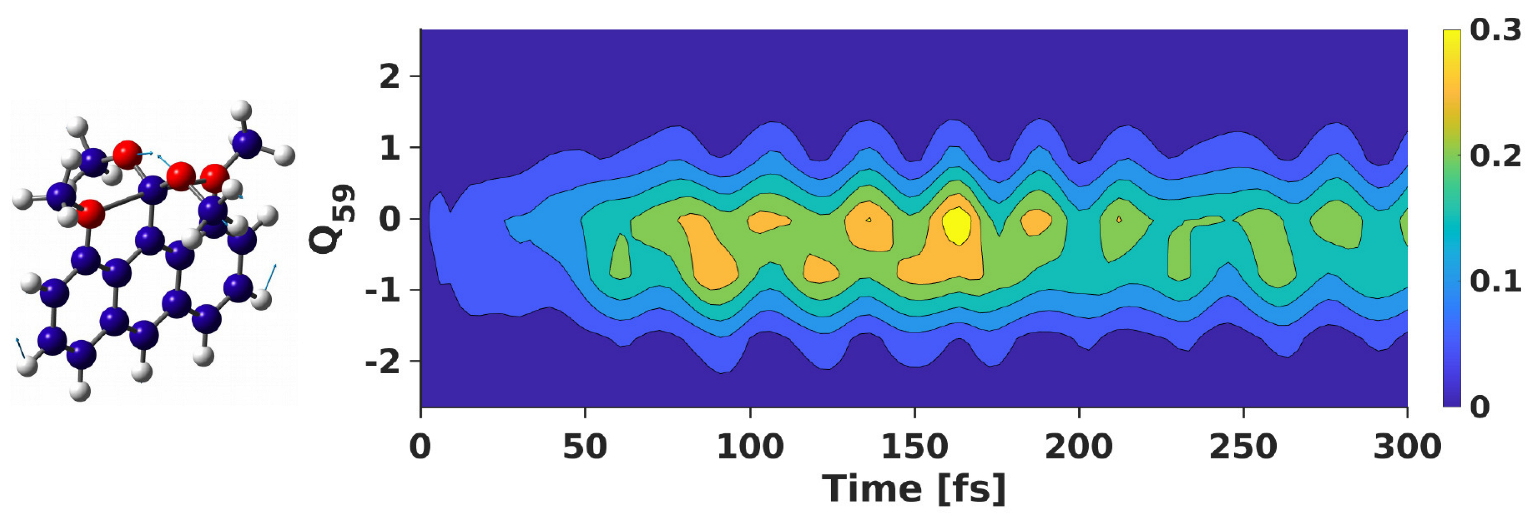
3.2. Wavepacket Simulation Analysis

Based on the above analyses, we infer that the MECI lies close to the “bright” excited state, and minor vibrational displacements would suffice to reach the intersection geometry. To get a clear picture of the photorelaxation processes, we perform dynamics simulation by launching the initial wavepacket at the FC point of the “bright” S 1 state. Electronic populations obtained from this simulation are shown in Figure 4.
The proximity of the S 1 /S 2 MECI from the FC point of S 1 enables the evolving wavepacket to access the intersection. This feature can be understood from the population trend, where a simultaneous S 1 population decay and S 2 population rise from t = 0 fs to t = 85 fs takes place. Almost 50% population is retained on S 1 while the other half exists on the higher excited state at t = 85 fs. After that, the population profile exhibits oscillatory behavior. This behavior arises due to the population exchange between S 1 and S 2 . From Table 2, we find that the MECI lies only ∼0.10 eV above the S 1 /S 2 minima, making it possible for the back-and-forth population exchange between these two states.
Next, we analyze the role of vibrational modes in the nonadiabatic dynamics, especially the vibrational motions associated with the hypercoordinated C−center. We plot the reduced nuclear density of the “dark” S 2 state along the O−C−O bend vibration with the wavepacket propagated on the “bright” S 1 state (cf., Figure 5). At t = 0 fs, the nuclear density is zero on this “dark” state. However, within the first few fs, the density rises in S 2 , which depicts the wavepacket accumulation in this state from S 1 . We observe a steady increase in the density in S 2 till t ∼ 80 fs, reaching a maximum at about 150 fs. This feature is associated with the maximum electronic population at the specified propagation time, as depicted in Figure 4.
Similar to the vibration involving the hypercoordinate center, we also observe a similar nuclear density profile along other vibrational modes. For instance, the nuclear density of the “dark” S 2 state along the C−H bending vibrations of the aromatic ring and methoxy groups are shown in Figure 6a and Figure 6b, respectively. Along the former vibrational mode, we see a rise in the S 2 density as soon as propagation starts on the “bright” S 1 state. This keeps on increasing till t ∼ 160 fs, where it attains the maximum density. Afterwards, the density decreases gradually.
Such density profile is also observed along the C−H bend vibrational mode of the methoxy groups (cf., Figure 6b). However, compared to the density observed along the C−H vibration of the aromatic ring, we find a slightly higher density accumulation by t ∼ 160 fs. This can be attributed to the ease of reaching the intersection point along this vibrational mode. The vibrational motion involving the methoxy groups would be relatively more active compared to that involving the aromatic ring, thereby facilitating a higher density transfer from the “bright” S 1 state to the “dark” S 2 state.
These observations indicate that the vibrational motions, in general, and that associated with the hypercoordinated center, play a crucial role in the ultrafast IC happening within the S 1 S 2 FC region. It is also vital to understand the role of these vibration in the S 1 → S 0 nonradiative decay. The investigation of this process provides details on the molecule’s fluorescence properties; however, such an investigation is out of the scope of the present study.
Overall, we observe the following important features of S 1 S 2 PESs: (i) S 1 and S 2 states are “bright” and “dark” states at the ground-state minimum geometry, respectively, which can be attributed to the overlap between the molecular orbitals, (ii) the seemingly well-separated excited states (∼0.35 eV) at the FC point converge upon distortion of the molecular geometry, (iii) minor displacements along the vibrational modes lead to the formation of the conical intersection, and (iv) accessibility of the intersection determines the IC decay process. Our findings demonstrate the requirement of involving the multi-state effect arising due to coupled PESs while analyzing the photophysical aspects of the molecule.
We now discuss the optical properties of the hypercoordinate molecule. The simulated normalized absorption spectrum is shown in Figure 7. This spectrum is obtained by damping the autocorrelation function generated during the wavepacket calculation. We employed an exponential function of 15 fs for damping. A ∼1.16 eV shift was applied to the abscissa of the generated spectrum to account for zero-point energy correction. To our knowledge, this molecule has no experimental absorption spectrum for a direct comparison. Our result shows a well-resolved spectrum originating from transition to the allowed S 1 state, with a characteristic vibronic feature having an absorption maximum at ∼3.10 eV.
As the first excited-state S 1 is a “bright” state, the molecule, in principle, can show fluorescence. State minima calculated using the LVC potentials predicted S 1 and S 2 to stabilize at ∼2.89 eV and ∼2.90 eV, respectively (cf., Table 2). As these minima are near-degenerate, we can expect both states to be involved in the emission process: the direct emission from S 1 and the emission from S 2 enabled by the vibronic mixing. The upper limit of the emission spectrum would be ∼2.90 eV, leading to a broad spectrum. Experimental spectroscopic measurements would be highly valuable in understanding and confirming the results discussed here.

4. Conclusions

We provide insights into the IC dynamics of 1 in purview of the presence of conical intersections within the FC region of S 1 S 2 PESs. These states are energetically well-separated at the FC point. The molecule attains the conical intersection geometry upon subjecting its FC geometry to minor vibrational distortions. Such an easily accessible intersection enables the wavepacket transfer from the allowed S 1 state to the forbidden S 2 state within a few femtoseconds. Vibrational motions associated with the hypercoordinate center play an important role during the IC dynamics. The stable minimum of S 1 and S 2 are near-degenerate; hence, a broad emission spectrum is expected if the emission from S 2 becomes dipole-allowed via vibronic mixing, in addition to the direct emission from S 1 . Our findings bring new insights into the photodynamics of a hypercoordinate carbon system, which would highly interest readers working in both experimental and theoretical spectroscopy.

Supplementary Materials

The following supporting information can be downloaded at: https://www.mdpi.com/article/10.3390/chemistry5010021/s1, Table S1: Harmonic vibrational frequencies of 1,8-dimethoxy-9-dimethoxymethylanthracene monocation computed at B3LYP/cc-pVDZ level of theory; Table S2: Ground-state (S 0 ) equilibrium geometry of 1,8-dimethoxy-9-dimethoxymethylanthracene monocation optimized at B3LYP/cc-pVDZ level of theory; Table S3: Linear intrastate coupling parameters ( κ ) of 1,8-dimethoxy-9-dimethoxymethylanthracene monocation computed at TD-CAM-B3LYP/aug-cc-pVDZ level of theory; Table S4: Linear interstate coupling parameters ( λ ) of 1,8-dimethoxy-9-dimethoxymethylanthracene monocation computed at TD-CAM-B3LYP/aug-cc-pVDZ level of theory; Table S5: MCTDH details of S 1 -S 2 vibronic dynamics of 1,8-dimethoxy-9-dimethoxymethylanthracene monocation; Table S6: S 1 -S 2 MECI geometry of 1,8-dimethoxy-9-dimethoxymethylanthracene monocation optimized at TD-CAM-B3LYP/aug-cc-pVDZ level of theory using GRRM; Figure S1: Natural transition orbitals of S 1 and S 2 states of 1,8-dimethoxy-9-dimethoxymethylanthracene monocation.

Author Contributions

Conceptualization, S.R.V.; methodology, S.R.V.; validation, S.R.V.; formal analysis, P.N.; investigation, P.N.; data curation, P.N.; writing—original draft preparation, P.N.; writing—review and editing, S.R.V.; supervision, S.R.V. All authors have read and agreed to the published version of the manuscript.

Funding

This research received no external funding.

Data Availability Statement

Data is contained within the article or Supplementary Materials.

Acknowledgments

P.N. thanks Ministry of Education, Government of India, for the doctoral fellowship under the Prime Minister’s Research Fellows (PMRF) scheme. We gratefully acknowledge IISER TVM for the computational resources.

Conflicts of Interest

The authors declare no conflict of interest.

Abbreviations

The following abbreviations are used in this manuscript:
LVCLinear vibronic coupling
PESPotential energy surface
ICInternal conversion
MCTDHMulticonfiguration time-dependent Hartree
TDDFTTime-dependent density functional theory
RI-CC2Resolution-of-the-identity second-order approximate coupled-cluster singles and doubles
ADC(2)Algebraic diagrammatic construction method to second-order
FCFranck-Condon
MECIMinimum energy conical intersection
GRRMGlobal reaction route mapping
GPGradient projection

References

  1. Guélin, M.; Cernicharo, J. Organic Molecules in Interstellar Space: Latest Advances. Front. Astron. Space Sci. 2022, 9, 787567. [Google Scholar] [CrossRef]
  2. Asvany, O.; Schlemmer, S.; Gerlich, D. Deuteration of CHn+ (n = 3-5) in Collisions with HD Measured in a Low-Temperature Ion Trap. Astrophys. J. 2004, 617, 685. [Google Scholar] [CrossRef]
  3. Das, P.; Chattaraj, P.K. Structure and Bonding in Planar Hypercoordinate Carbon Compounds. Chemistry 2022, 4, 1723–1756. [Google Scholar] [CrossRef]
  4. Tal’rose, V.L.; Lyubimova, A.K. Secondary Processes in the Ion Source of the Mass Spectrometer. Dokl. Akad. Nauk SSSR 1952, 86, 909–912. [Google Scholar]
  5. Stevenson, D.P.; Schissler, D.O. Rate of the Gaseous Reactions, X++YH=XH++Y. J. Chem. Phys. 1955, 23, 1353. [Google Scholar] [CrossRef]
  6. Jin, Z.; Braams, B.J.; Bowman, J.M. An ab Initio Based Global Potential Energy Surface Describing CH5+ → CH3+ + H2. J. Phys. Chem. A 2006, 110, 1569–1574. [Google Scholar] [CrossRef]
  7. Tachikawa, H.; Orr-Ewing, A.J. Ab Initio Molecular Dynamics Study on the Electron Capture Processes of Protonated Methane (CH5+). J. Phys. Chem. A 2008, 112, 11575–11581. [Google Scholar] [CrossRef]
  8. Chabinyc, M.L.; Craig, S.L.; Regan, C.K.; Brauman, J.I. Gas-Phase Ionic Reactions: Dynamics and Mechanism of Nucleophilic Displacements. Science 1998, 279, 1882–1886. [Google Scholar] [CrossRef]
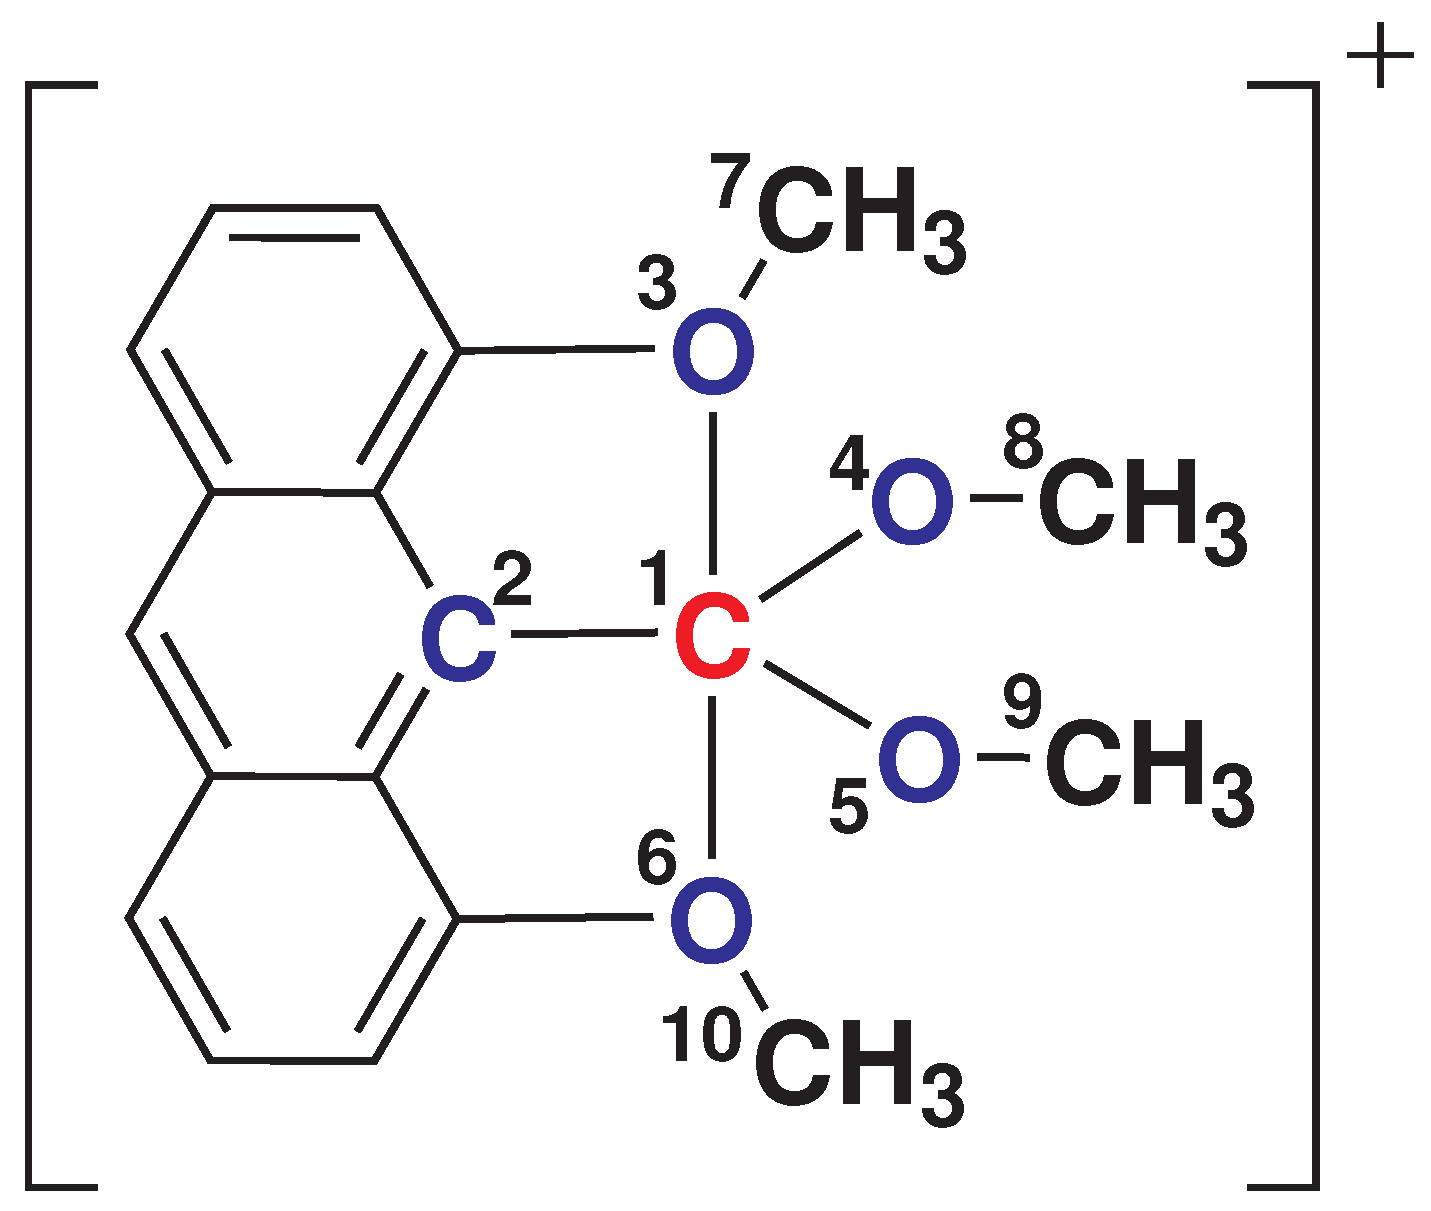
  9. Akiba, K.y.; Yamashita, M.; Yamamoto, Y.; Nagase, S. Synthesis and Isolation of Stable Hypervalent Carbon Compound (10-C-5) Bearing a 1,8-Dimethoxyanthracene Ligand. J. Am. Chem. Soc. 1999, 121, 10644–10645. [Google Scholar] [CrossRef]
  10. Yamamoto, Y.; Akiba, K.-y. Synthesis of Hypervalent Pentavalent Carbon and Boron Compounds. J. Synth. Org. Chem. Jpn. 2004, 62, 1128–1137. [Google Scholar] [CrossRef]
  11. Kikuchi, Y.; Ishii, M.; Akiba, K.-y.; Nakai, H. Discovery of hexacoordinate hypervalent carbon compounds: Density functional study. Chem. Phys. Lett. 2008, 460, 37–41. [Google Scholar] [CrossRef]
  12. Schleyer, P.v.R.; Wuerthwein, E.U.; Kaufmann, E.; Clark, T.; Pople, J.A. Effectively hypervalent molecules. 2. Lithium carbide (CLi5), lithium carbide (CLi6), and the related effectively hypervalent first row molecules, CLi5-nHn and CLi6-nHn. J. Am. Chem. Soc. 1983, 105, 5930–5932. [Google Scholar] [CrossRef]
  13. Scherbaum, F.; Grohmann, A.; Müller, G.; Schmidbaur, H. Synthesis, Structure, and Bonding of the Cation [{(C6H5)3PAu}5C]+. Angew. Chem. Int. Ed. Engl. 1989, 28, 463–465. [Google Scholar] [CrossRef]
  14. Dufour, N.; Schier, A.; Schmidbaur, H. Hypercoordinate carbon in bis(trimethylsilyl)tris[(triphenylphosphine)aurio(I)]methanium tetrafluoroborate. Organometallics 1993, 12, 2408–2410. [Google Scholar] [CrossRef]
  15. Jimenez-Halla, J.O.C.; Wu, Y.B.; Wang, Z.X.; Islas, R.; Heine, T.; Merino, G. CAl4Be and CAl3Be2: Global minima with a planar pentacoordinate carbon atom. Chem. Commun. 2010, 46, 8776–8778. [Google Scholar] [CrossRef]
  16. Leyva-Parra, L.; Diego, L.; Inostroza, D.; Yañez, O.; Pumachagua-Huertas, R.; Barroso, J.; Vásquez-Espinal, A.; Merino, G.; Tiznado, W. Planar Hypercoordinate Carbons in Alkali Metal Decorated CE32− and CE22− Dianions. Chem.—A Eur. J. 2021, 27, 16701–16706. [Google Scholar] [CrossRef]
  17. Becke, A.D. Density-functional thermochemistry. III. The role of exact exchange. J. Chem. Phys. 1993, 98, 5648–5652. [Google Scholar] [CrossRef] [Green Version]
  18. Dunning, T.H. Gaussian basis sets for use in correlated molecular calculations. I. The atoms boron through neon and hydrogen. J. Chem. Phys. 1989, 90, 1007–1023. [Google Scholar] [CrossRef]
  19. Yanai, T.; Tew, D.P.; Handy, N.C. A new hybrid exchange–correlation functional using the Coulomb-attenuating method (CAM-B3LYP). Chem. Phys. Lett. 2004, 393, 51–57. [Google Scholar] [CrossRef] [Green Version]
  20. Kendall, R.A.; Dunning, T.H.; Harrison, R.J. Electron affinities of the first-row atoms revisited. Systematic basis sets and wave functions. J. Chem. Phys. 1992, 96, 6796–6806. [Google Scholar] [CrossRef] [Green Version]
  21. Zhao, Y.; Truhlar, D.G. Comparative DFT Study of van der Waals Complexes: Rare Gas Dimers, Alkaline Earth Dimers, Zinc Dimer, and Zinc Rare Gas Dimers. J. Phys. Chem. A 2006, 110, 5121–5129. [Google Scholar] [CrossRef]
  22. Chai, J.D.; Head-Gordon, M. Long-range corrected hybrid density functionals with damped atom–atom dispersion corrections. Phys. Chem. Chem. Phys. 2008, 10, 6615–6620. [Google Scholar] [CrossRef] [Green Version]
  23. Hättig, C.; Weigend, F. CC2 excitation energy calculations on large molecules using the resolution of the identity approximation. J. Chem. Phys. 2000, 113, 5154–5161. [Google Scholar] [CrossRef]
  24. Trofimov, A.; Krivdina, I.; Weller, J.; Schirmer, J. Algebraic-diagrammatic construction propagator approach to molecular response properties. Chem. Phys. 2006, 329, 1–10. [Google Scholar] [CrossRef]
  25. Frisch, M.J.; Trucks, G.W.; Schlegel, H.B.; Scuseria, G.E.; Robb, M.A.; Cheeseman, J.R.; Scalmani, G.; Barone, V.; Petersson, G.A.; Nakatsuji, H.; et al. Gaussian 16 Revision C.01; Gaussian Inc.: Wallingford, CT, USA, 2016. [Google Scholar]
  26. TURBOMOLE V7.4 2019, a Development of University of Karlsruhe and Forschungszentrum Karlsruhe GmbH, 1989–2007, TURBOMOLE GmbH, Since 2007. Available online: http://www.turbomole.com (accessed on 11 August 2021).
  27. Köppel, H.; Domcke, W.; Cederbaum, L.S. Multimode Molecular Dynamics Beyond the Born-Oppenheimer Approximation. Adv. Chem. Phys. 1984, 57, 59–246. [Google Scholar]
  28. Maeda, S.; Ohno, K.; Morokuma, K. Systematic exploration of the mechanism of chemical reactions: The global reaction route mapping (GRRM) strategy using the ADDF and AFIR methods. Phys. Chem. Chem. Phys. 2013, 15, 3683–3701. [Google Scholar] [CrossRef]
  29. Banerjee, A.; Adams, N.; Simons, J.; Shepard, R. Search for stationary points on surfaces. J. Phys. Chem. 1985, 89, 52–57. [Google Scholar] [CrossRef]
  30. Bearpark, M.J.; Robb, M.A.; Bernhard Schlegel, H. A direct method for the location of the lowest energy point on a potential surface crossing. Chem. Phys. Lett. 1994, 223, 269–274. [Google Scholar] [CrossRef]
  31. Maeda, S.; Ohno, K.; Morokuma, K. Updated Branching Plane for Finding Conical Intersections without Coupling Derivative Vectors. J. Chem. Theory Comput. 2010, 6, 1538–1545. [Google Scholar] [CrossRef]
  32. Meyer, H.D.; Manthe, U.; Cederbaum, L.S. The multi-configurational time-dependent Hartree approach. Chem. Phys. Lett. 1990, 165, 73–78. [Google Scholar] [CrossRef]
  33. Manthe, U.; Meyer, H.D.; Cederbaum, L.S. Wave-packet dynamics within the multiconfiguration Hartree framework: General aspects and application to NOCl. J. Chem. Phys. 1992, 97, 3199–3213. [Google Scholar] [CrossRef]
  34. Beck, M.H.; Jäckle, A.; Worth, G.A.; Meyer, H.D. The multiconfiguration time-dependent Hartree (MCTDH) method: A highly efficient algorithm for propagating wavepackets. Phys. Rep. 2000, 324, 1–105. [Google Scholar] [CrossRef]
  35. Meyer, H.D.; Gatti, F.; Worth, G.A. Multidimensional Quantum Dynamics: MCTDH Theory and Applications; Wiley-VCH: Weinheim, Germany, 2009. [Google Scholar]
  36. Worth, G.A.; Beck, M.H.; Jäckle, A.; Meyer, H.D. The MCTDH Package, Version 8.5, 2019. Available online: http://mctdh.uni-hd.de (accessed on 21 April 2021).
Figure 1. Molecular structure of 1,8-dimethoxy-9-dimethoxymethylanthracene monocation (hereafter referred to as 1). The hypercoordinated carbon, and the corresponding bonded groups, are labelled.
Chemistry 05 00021 g001
Figure 2. Adiabatic potential energy curves of S 1 and S 2 states along (a) Q 74 (C−H in−plane bending of aromatic ring), and (b) Q 79 (C−H bending of methoxy groups) of 1. The filled black circles represent the ab initio points plus ground-state harmonic potential energy, while the dashed black circle marks the point where the two states are near-degenerate. A sketch of the corresponding vibration is also shown.
Chemistry 05 00021 g002
Figure 3. Pictorial representation of S 1 S 2 conical intersection of 1 formed in the Q 74 (C−H in−plane bending of aromatic ring) and Q 79 (C−H bending of methoxy groups) vibrational space.
Chemistry 05 00021 g003
Figure 4. Diabatic electronic population of S 1 and S 2 states of 1 obtained by exciting the initial wavepacket and allowing propagation on the allowed “bright” state, S 1 .
Chemistry 05 00021 g004
Figure 5. Nuclear density of the “dark” S 2 state of 1 along the O−C−O bending vibrational mode (Q 59 ) throughout the propagation period, with the wavepacket propagated on “bright” S 1 . A sketch of the vibration is also shown.
Chemistry 05 00021 g005
Figure 6. Nuclear density of the “dark” S 2 state of 1 along the C−H bending vibrational mode of (a) aromatic ring (Q 74 ), and (b) methoxy groups (Q 79 ) throughout the propagation period, with the wavepacket propagated on “bright” S 1 . A sketch of the vibrations is also shown.
Chemistry 05 00021 g006
Figure 7. Normalized absorption spectrum of 1 obtained following wavepacket dynamics simulation on “bright” S 1 state.
Chemistry 05 00021 g007
Table 1. FC vertical excitation energies of 1 computed using different levels of theory in combination with aug-cc-pVDZ basis set. All values are in eV. Oscillator strengths are given in parenthesis. The S 2 –S 1 gap ( Δ S 2 S 1 ) at the FC point is also given.
MethodsS 1 (A 1 )S 2 (A 2 ) Δ S 2 S 1
TD-CAM-B3LYP3.17 (0.10)3.52 (0.00)∼0.35
TD- ω B97XD3.20 (0.10)3.60 (0.00)∼0.40
TD-M062X3.19 (0.09)3.60 (0.00)∼0.41
ADC(2)3.12 (0.10)3.37 (0.00)∼0.25
RI-CC23.16 (0.09)3.43 (0.00)∼0.27
Table 2. Excited-state minima and MECI of the coupled S 1 S 2 PESs of 1 calculated at TD-CAM-B3LYP/aug-cc-pVDZ level of theory within the LVC approach. All values are in eV.
Stationary PointEnergy
S 1 min 2.89
S 2 min 2.90
MECI 1 3.02 (3.09)
1 The value in parenthesis is estimated using GRRM.
Table 3. Important bond lengths (in Å), bond angles and dihedral angles (both in ) of 1 at different geometries calculated at TD-CAM-B3LYP/aug-cc-pVDZ level of theory.
Ground-State GeometryMECI Geometry 1% Change
C 1 -C 2 1.501.472.00
C 1 -O 3 2.462.543.25
C 1 -O 4 1.291.322.33
C 1 -O 5 1.291.322.33
C 1 -O 6 2.462.543.25
C 2 -C 1 -O 3 85.7685.160.70
O 3 -C 1 -O 4 92.3892.790.44
O 4 -C 1 -O 5 111.61110.510.99
O 5 -C 1 -O 6 92.3892.740.39
C 2 -C 1 -O 6 85.7685.160.70
C 2 -C 1 -O 3 -C 7 180179.970.02
C 2 -C 1 -O 4 -C 8 360360.060.02
C 2 -C 1 -O 5 -C 9 360360.050.01
C 2 -C 1 -O 6 -C 10 180179.980.01
1 Optimized using GRRM.
Disclaimer/Publisher’s Note: The statements, opinions and data contained in all publications are solely those of the individual author(s) and contributor(s) and not of MDPI and/or the editor(s). MDPI and/or the editor(s) disclaim responsibility for any injury to people or property resulting from any ideas, methods, instructions or products referred to in the content.

