
In Silico, Combined Plasmonic Photothermal and Photodynamic Therapy in Mice


Abstract
:1. Introduction
2. Materials and Methods
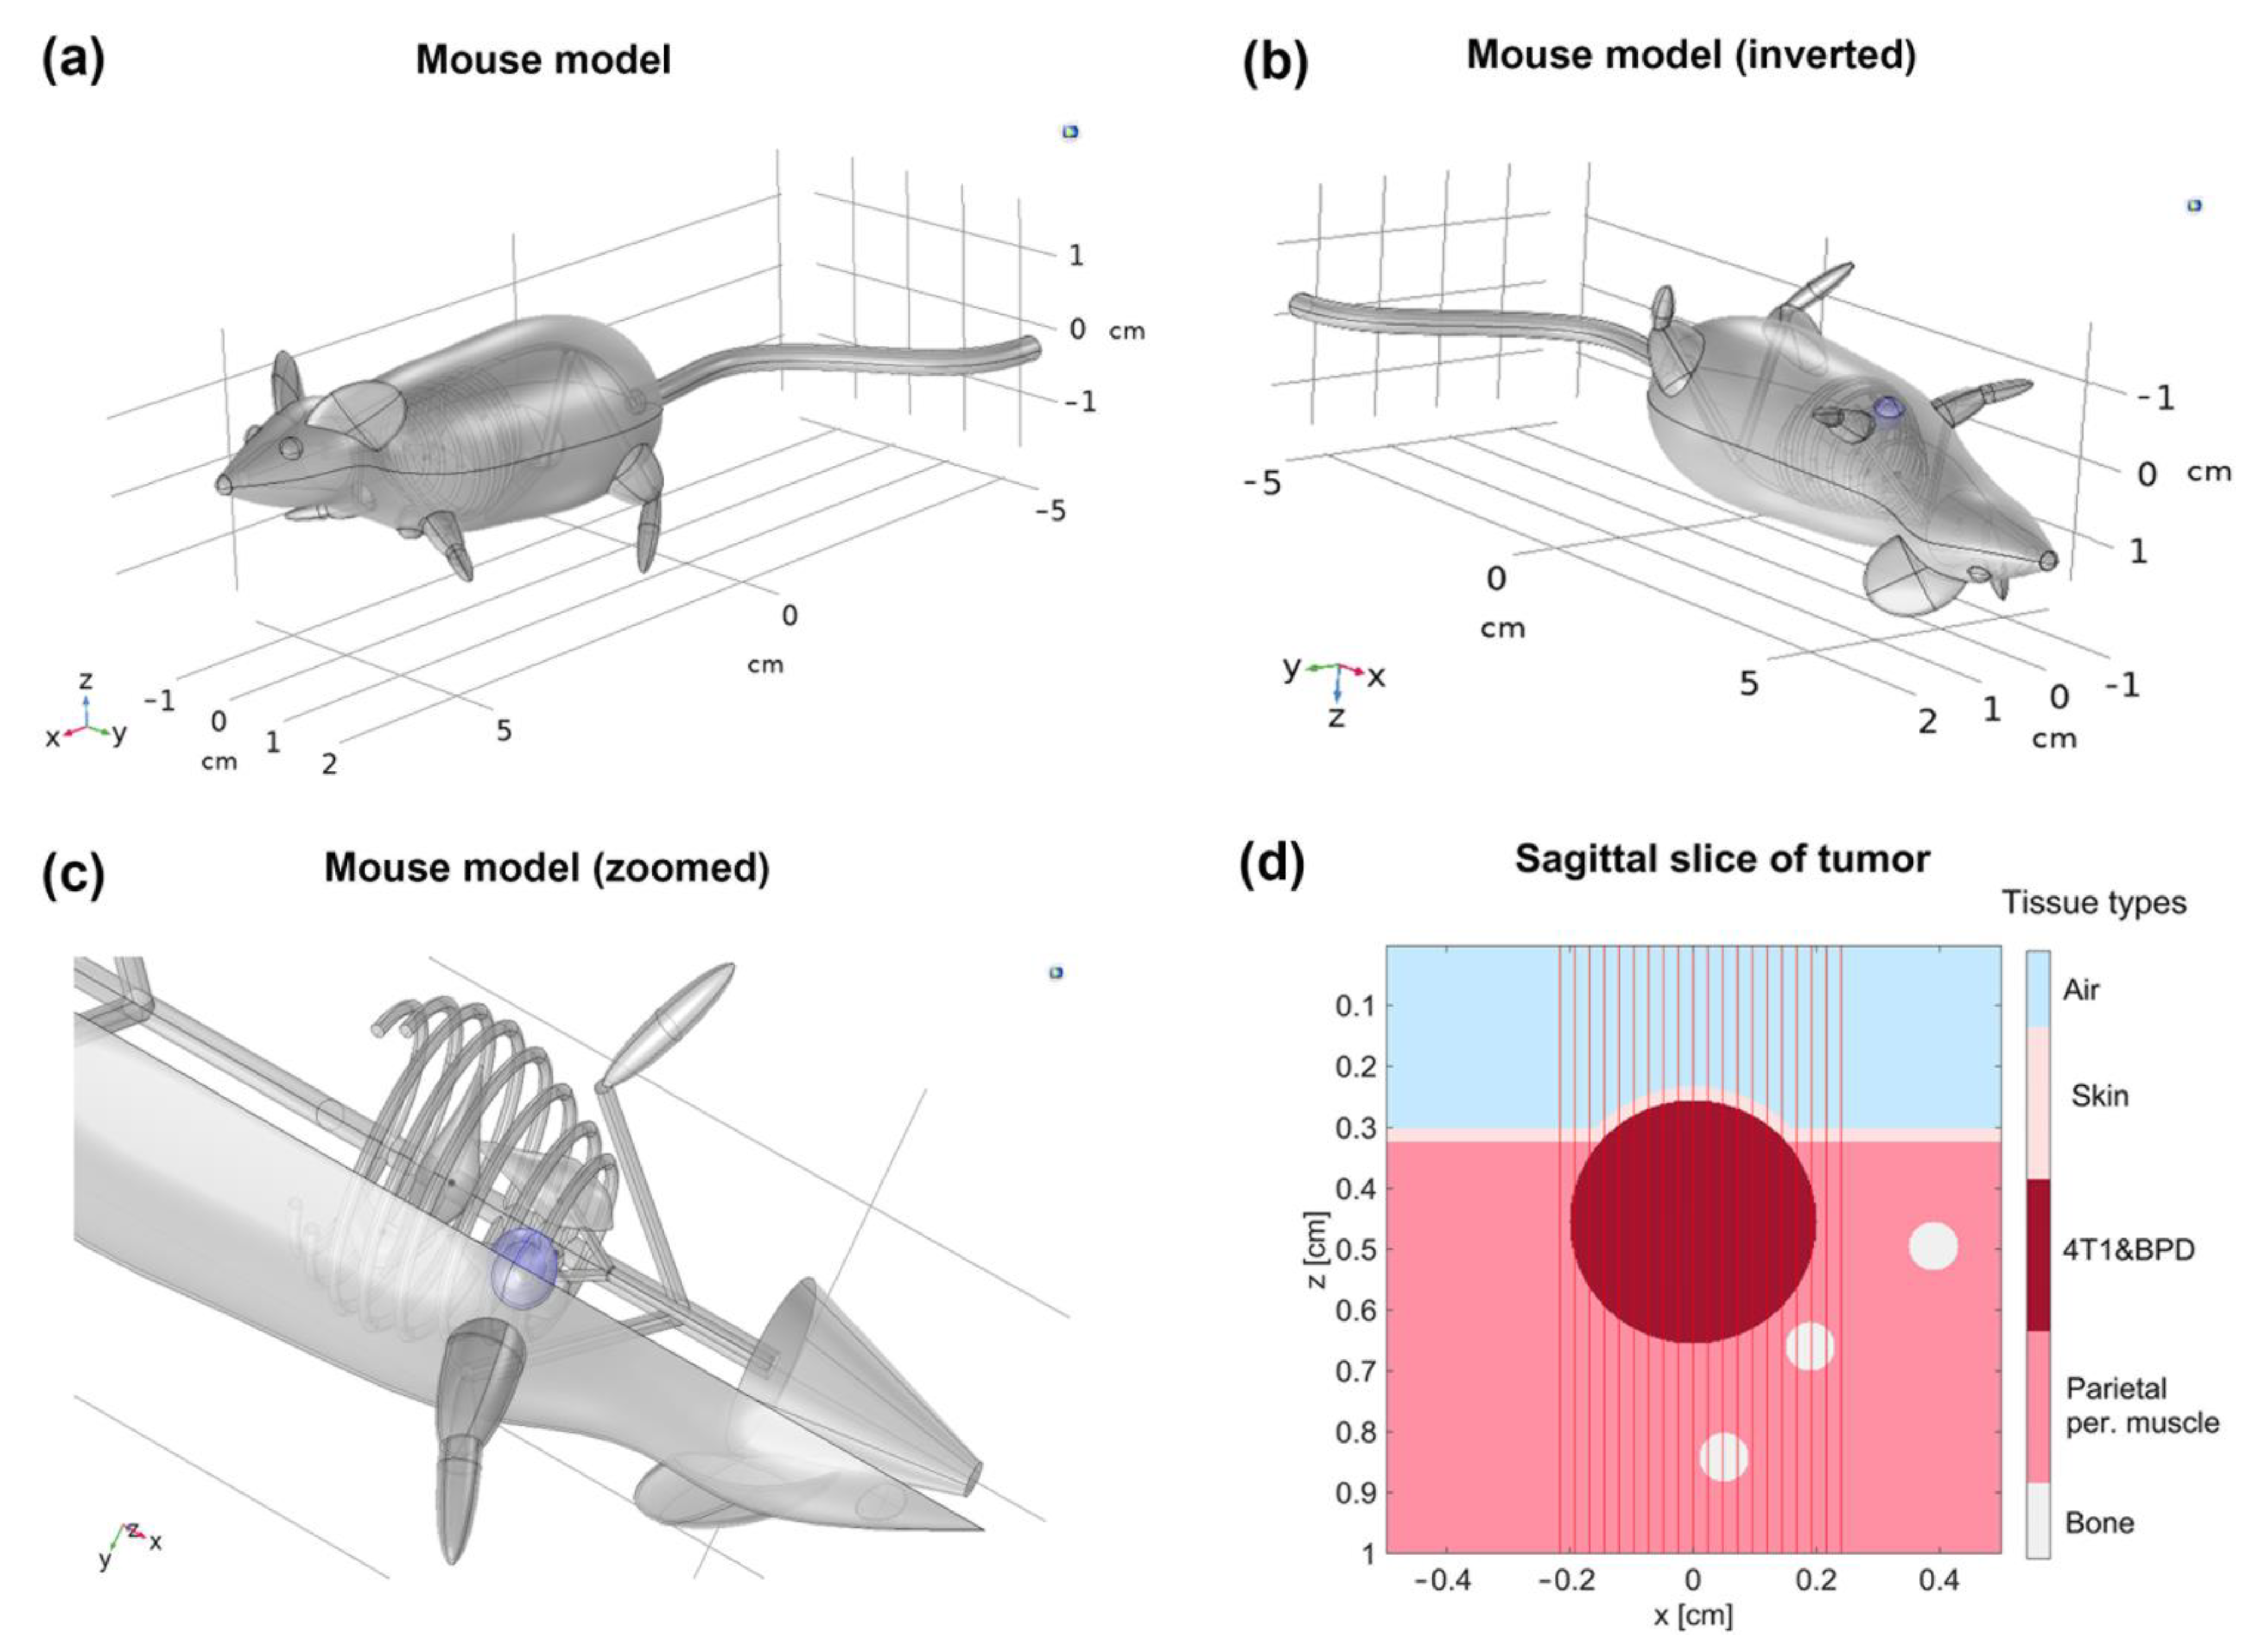
2.1. Animal Model
2.2. PDT Model
2.2.1. Computational Simulation
2.2.2. Photosensitizer and Parameters
2.3. PPTT Model
2.3.1. Computational Simulation
2.3.2. Nanoparticles and Parameters
2.4. Combined PPTT-PDT Model
3. Results
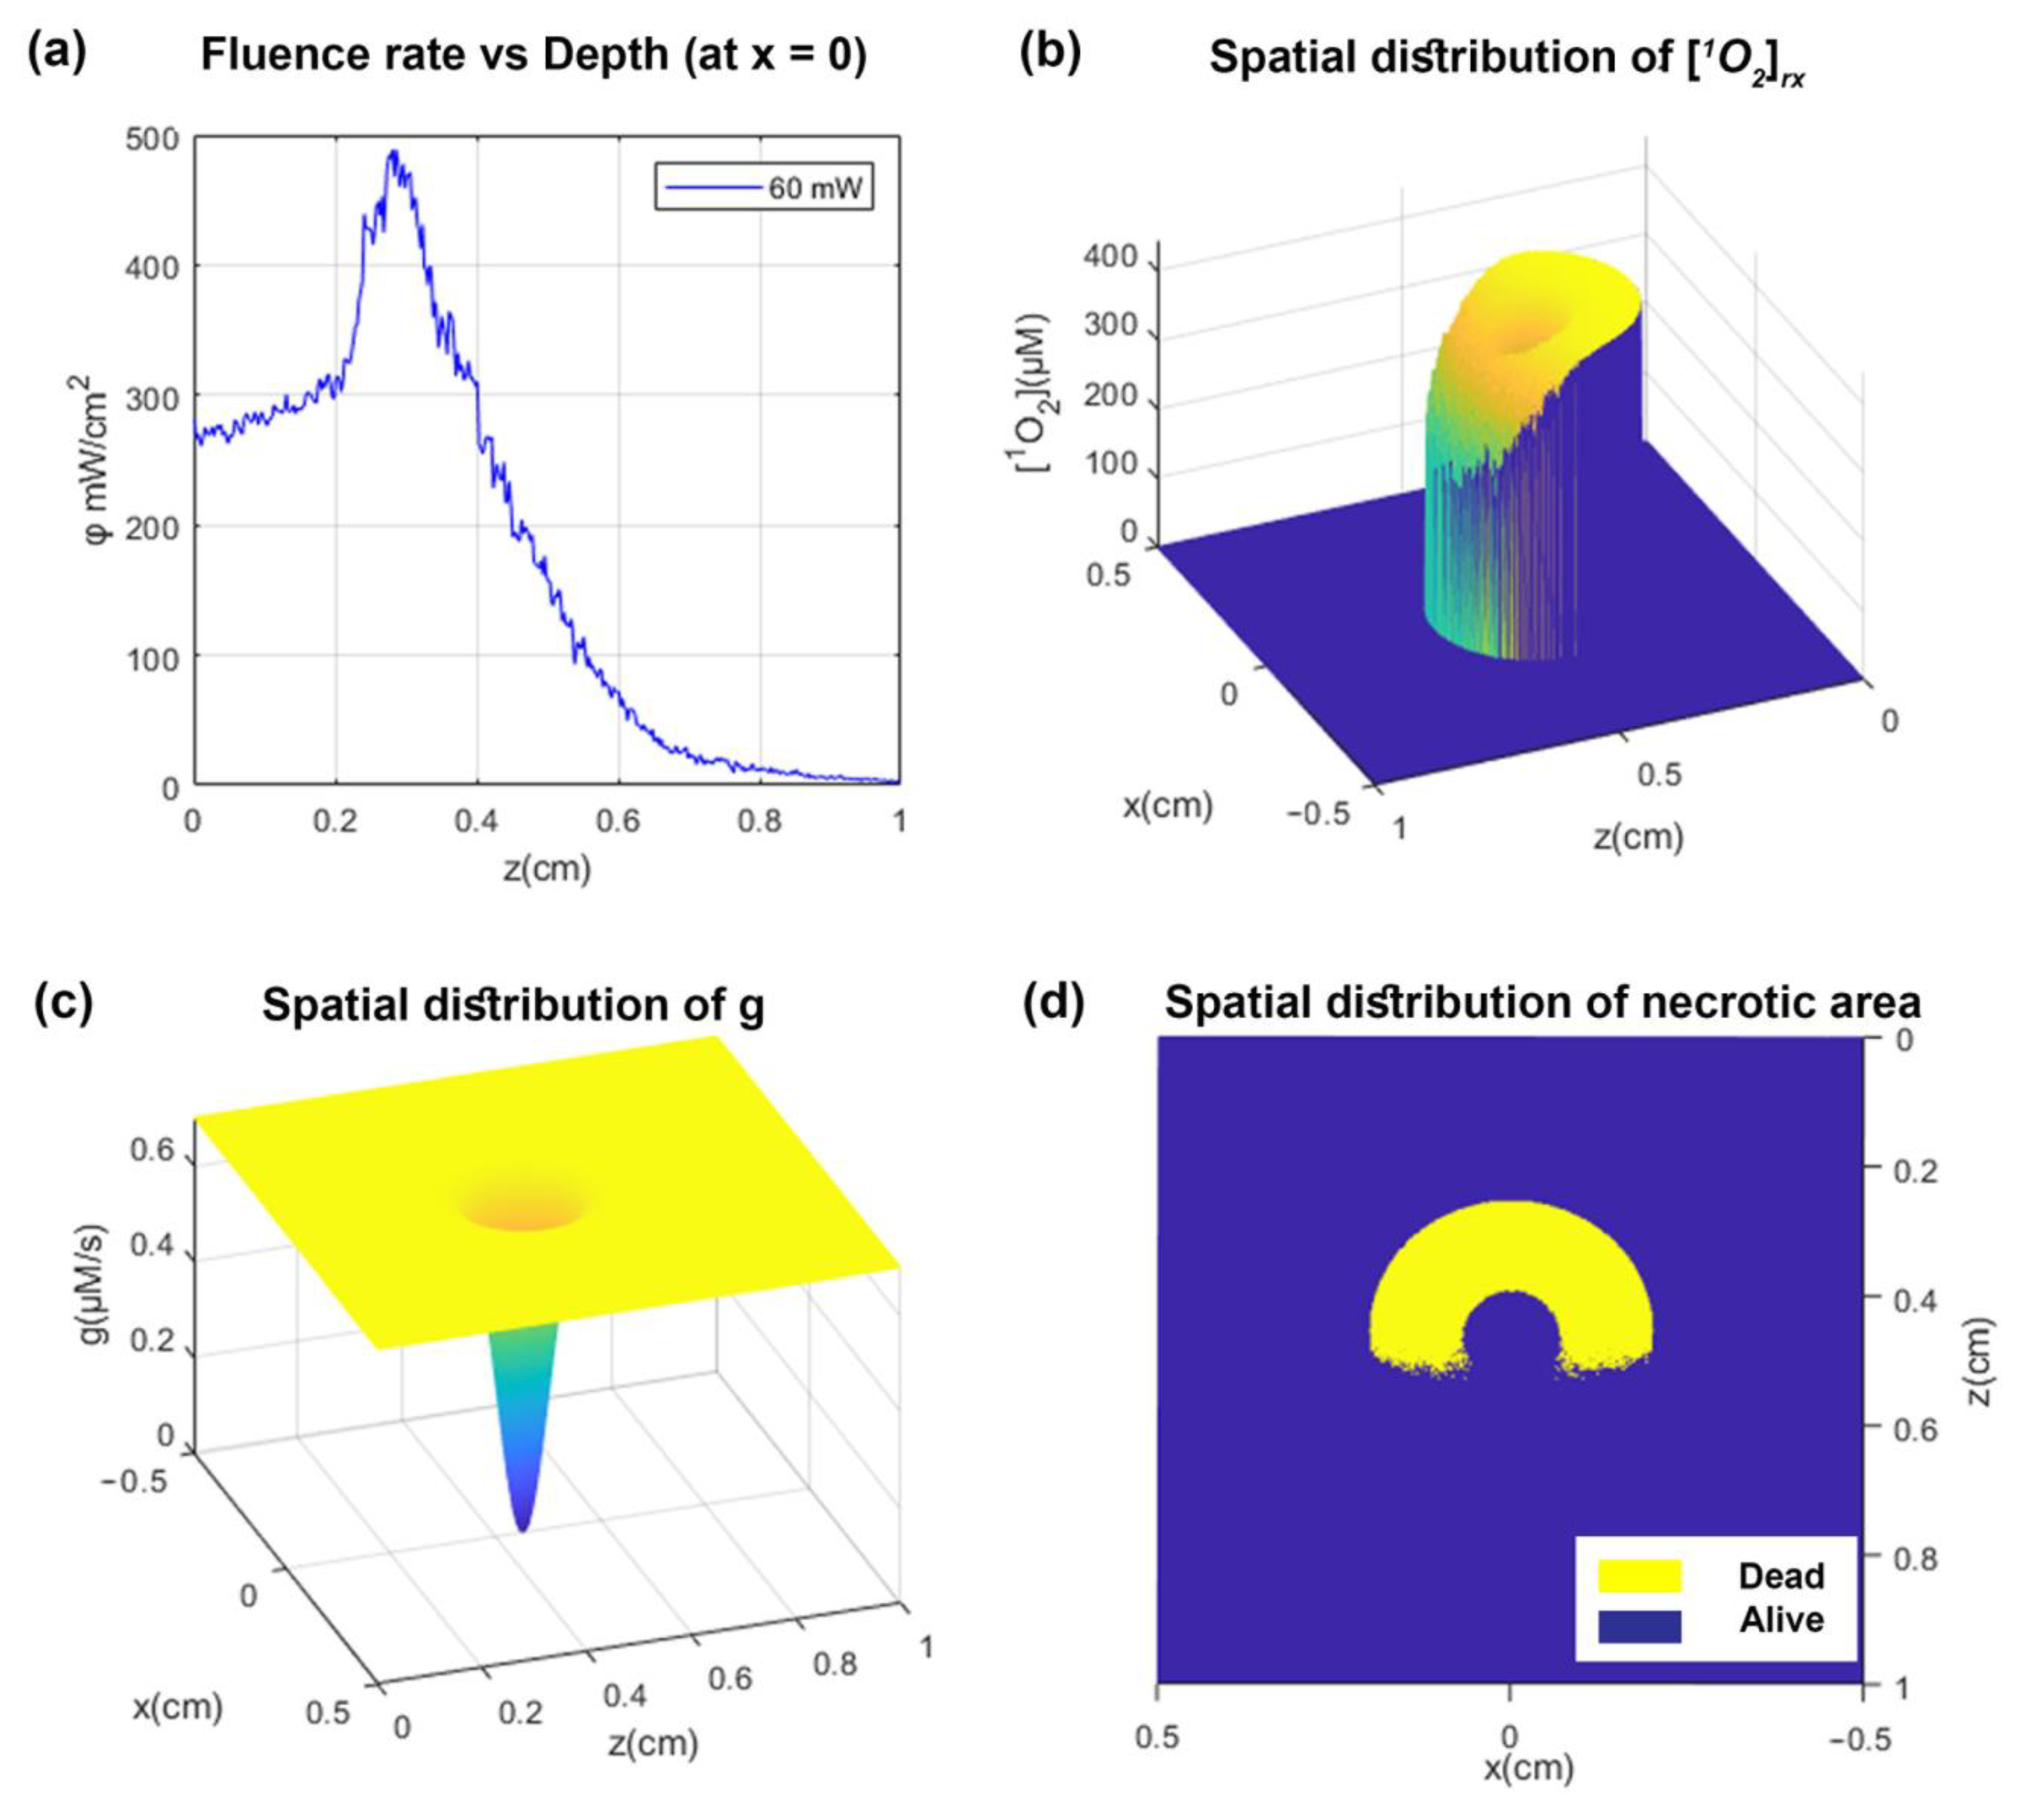
3.1. PDT Results
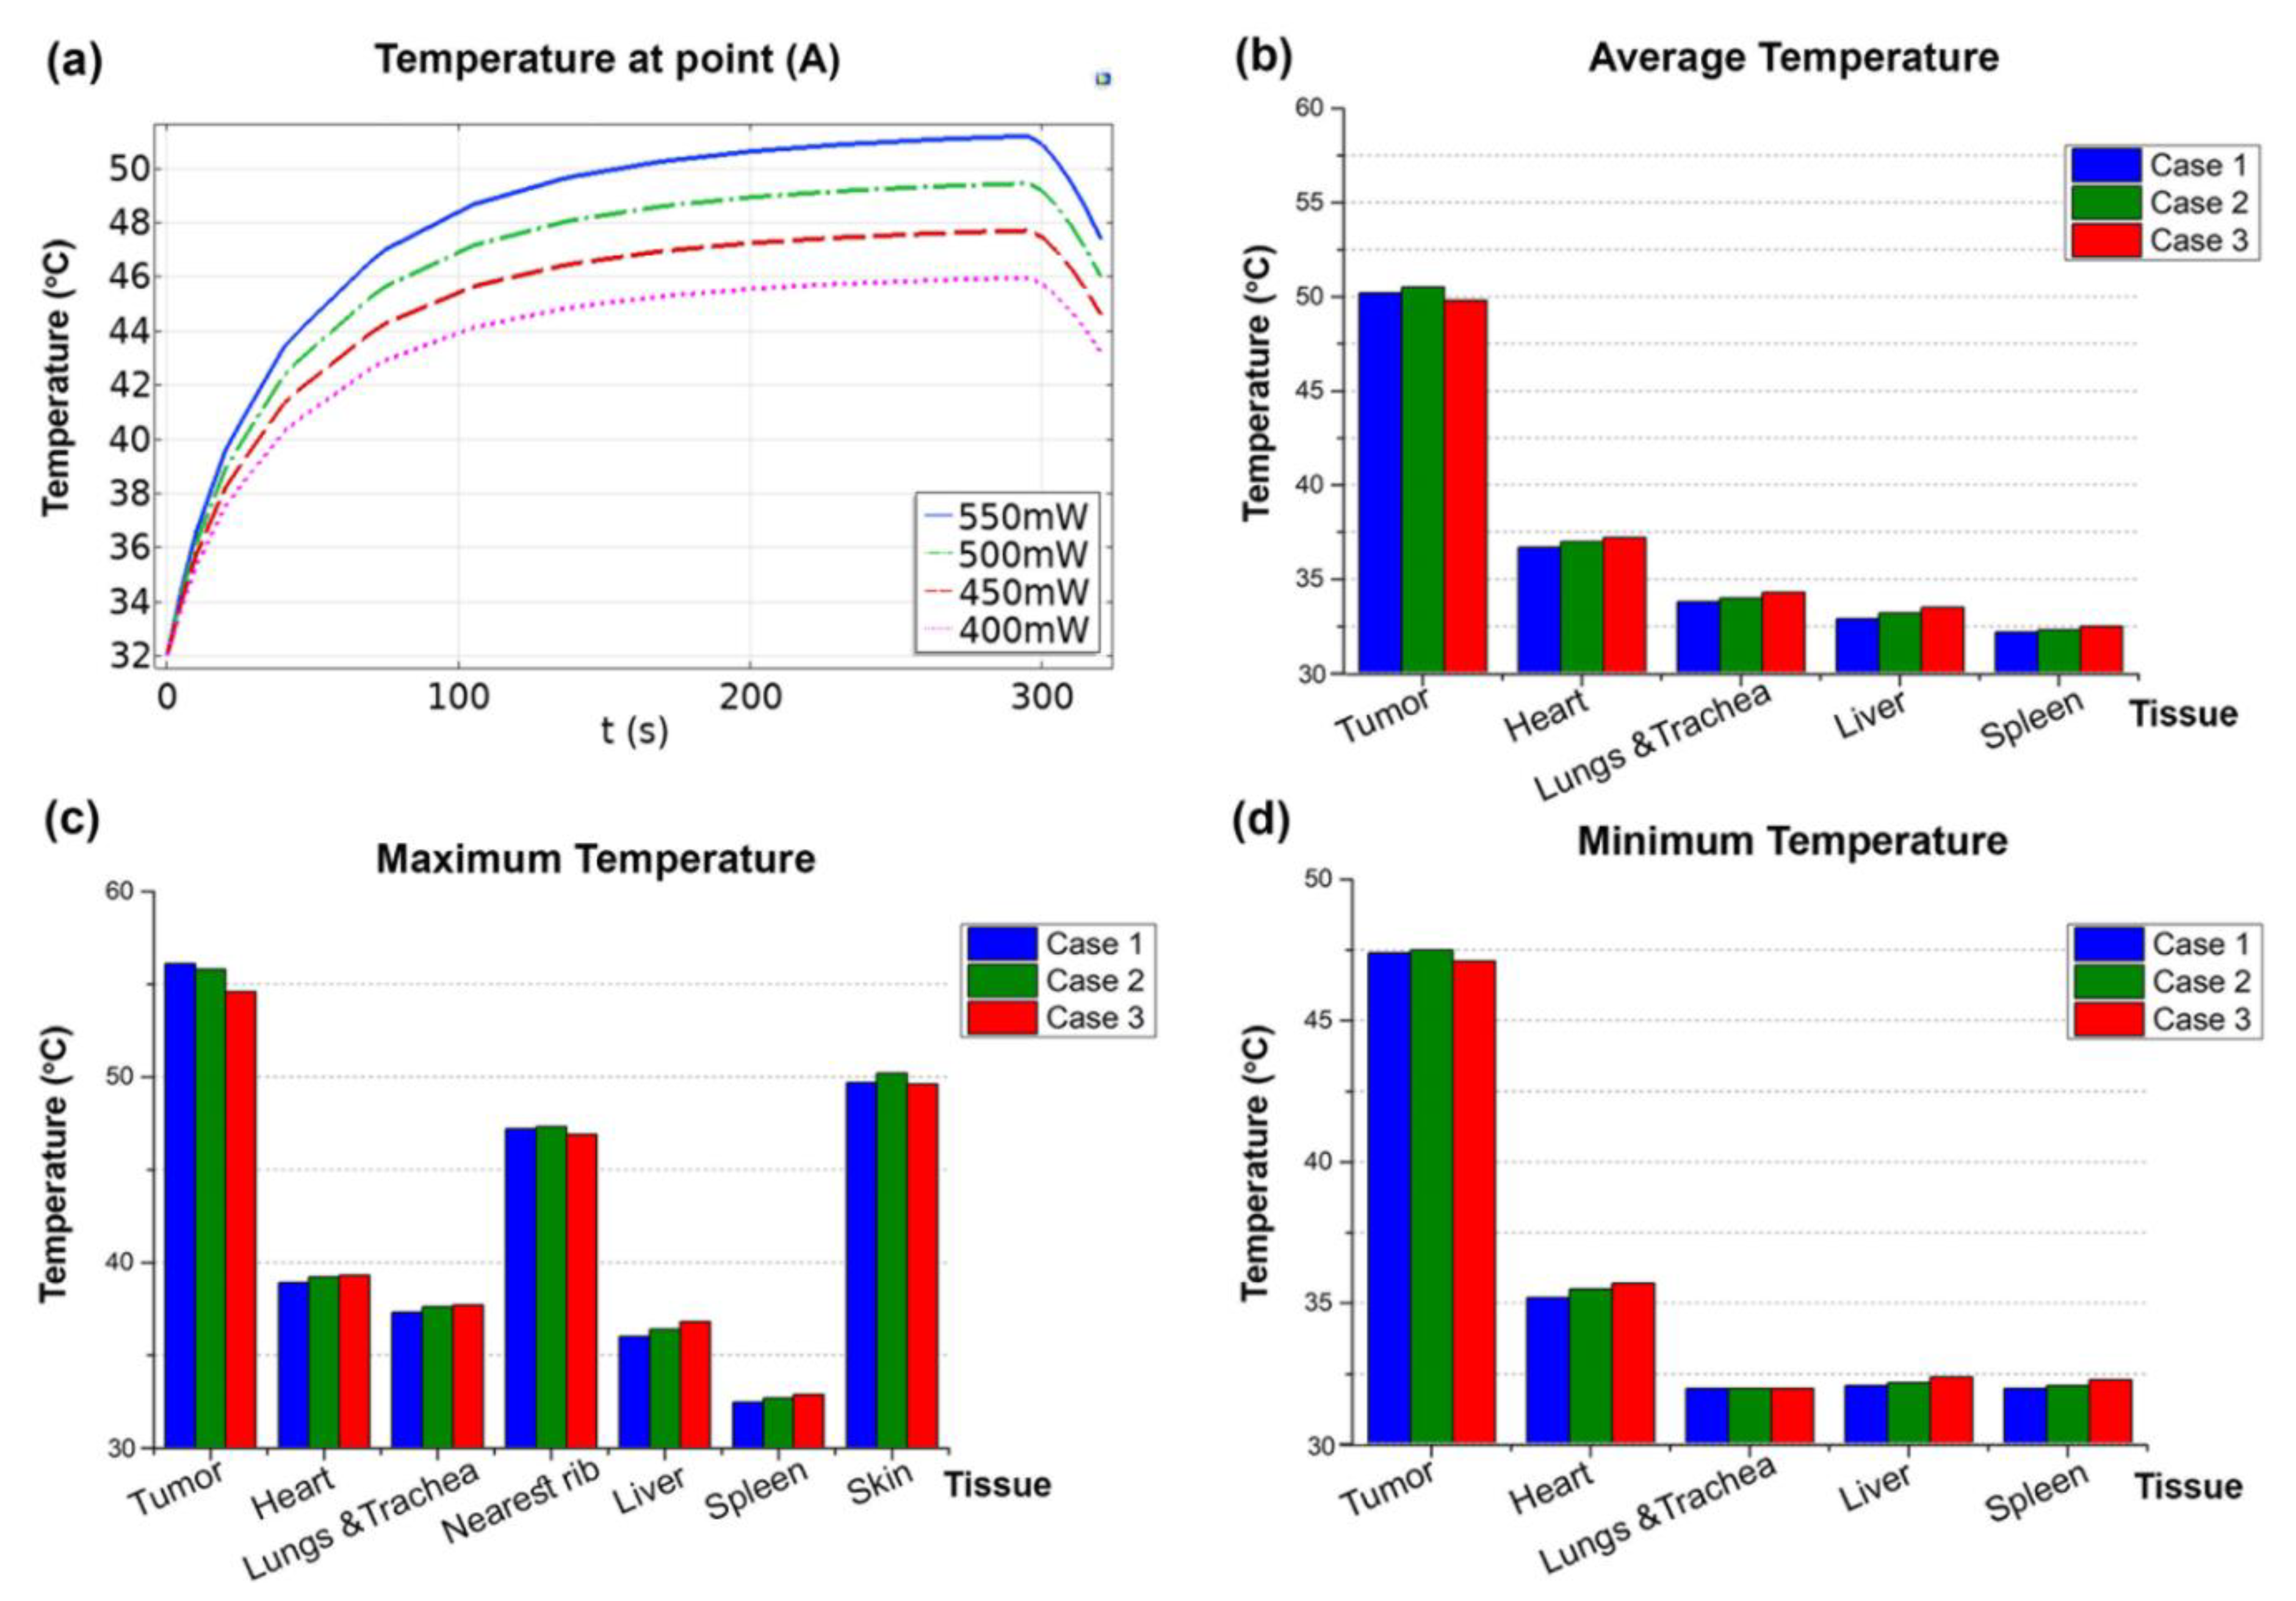
3.2. PPTT Results
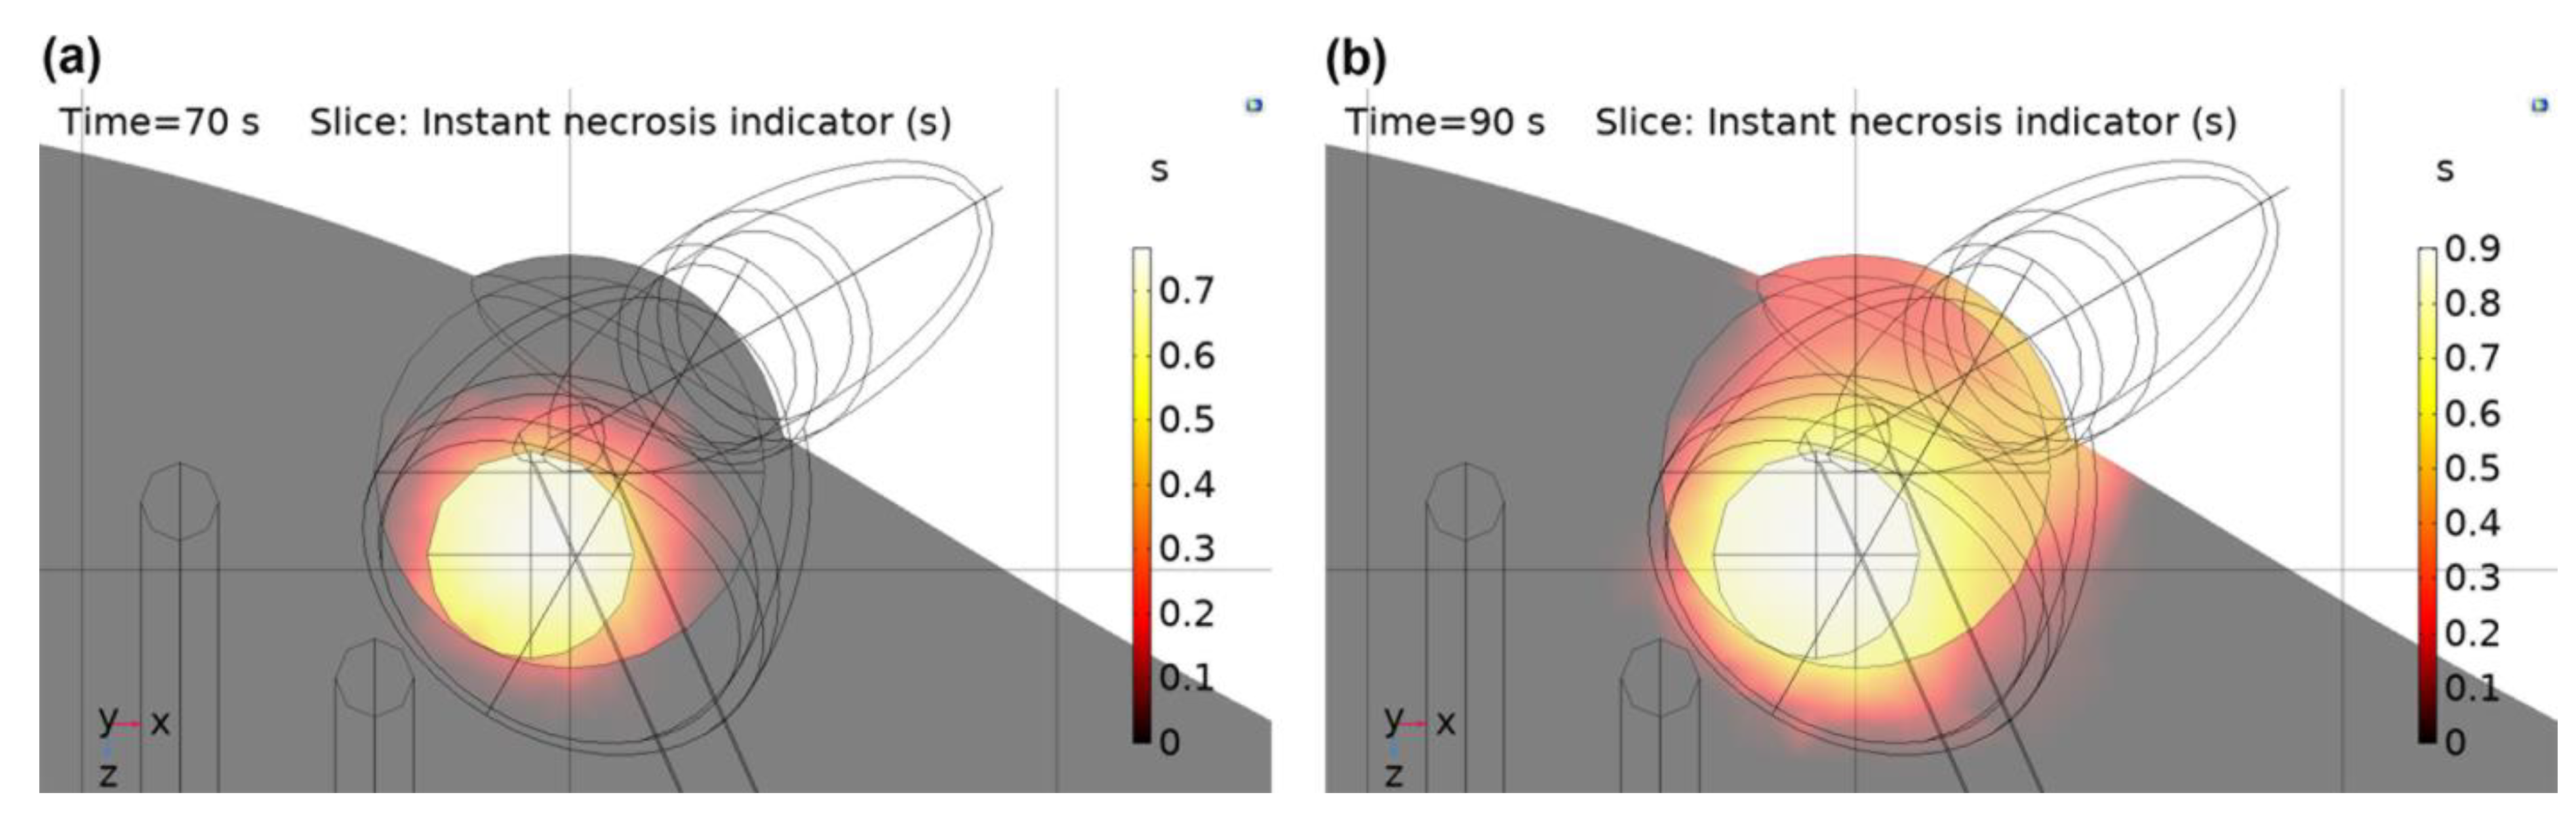
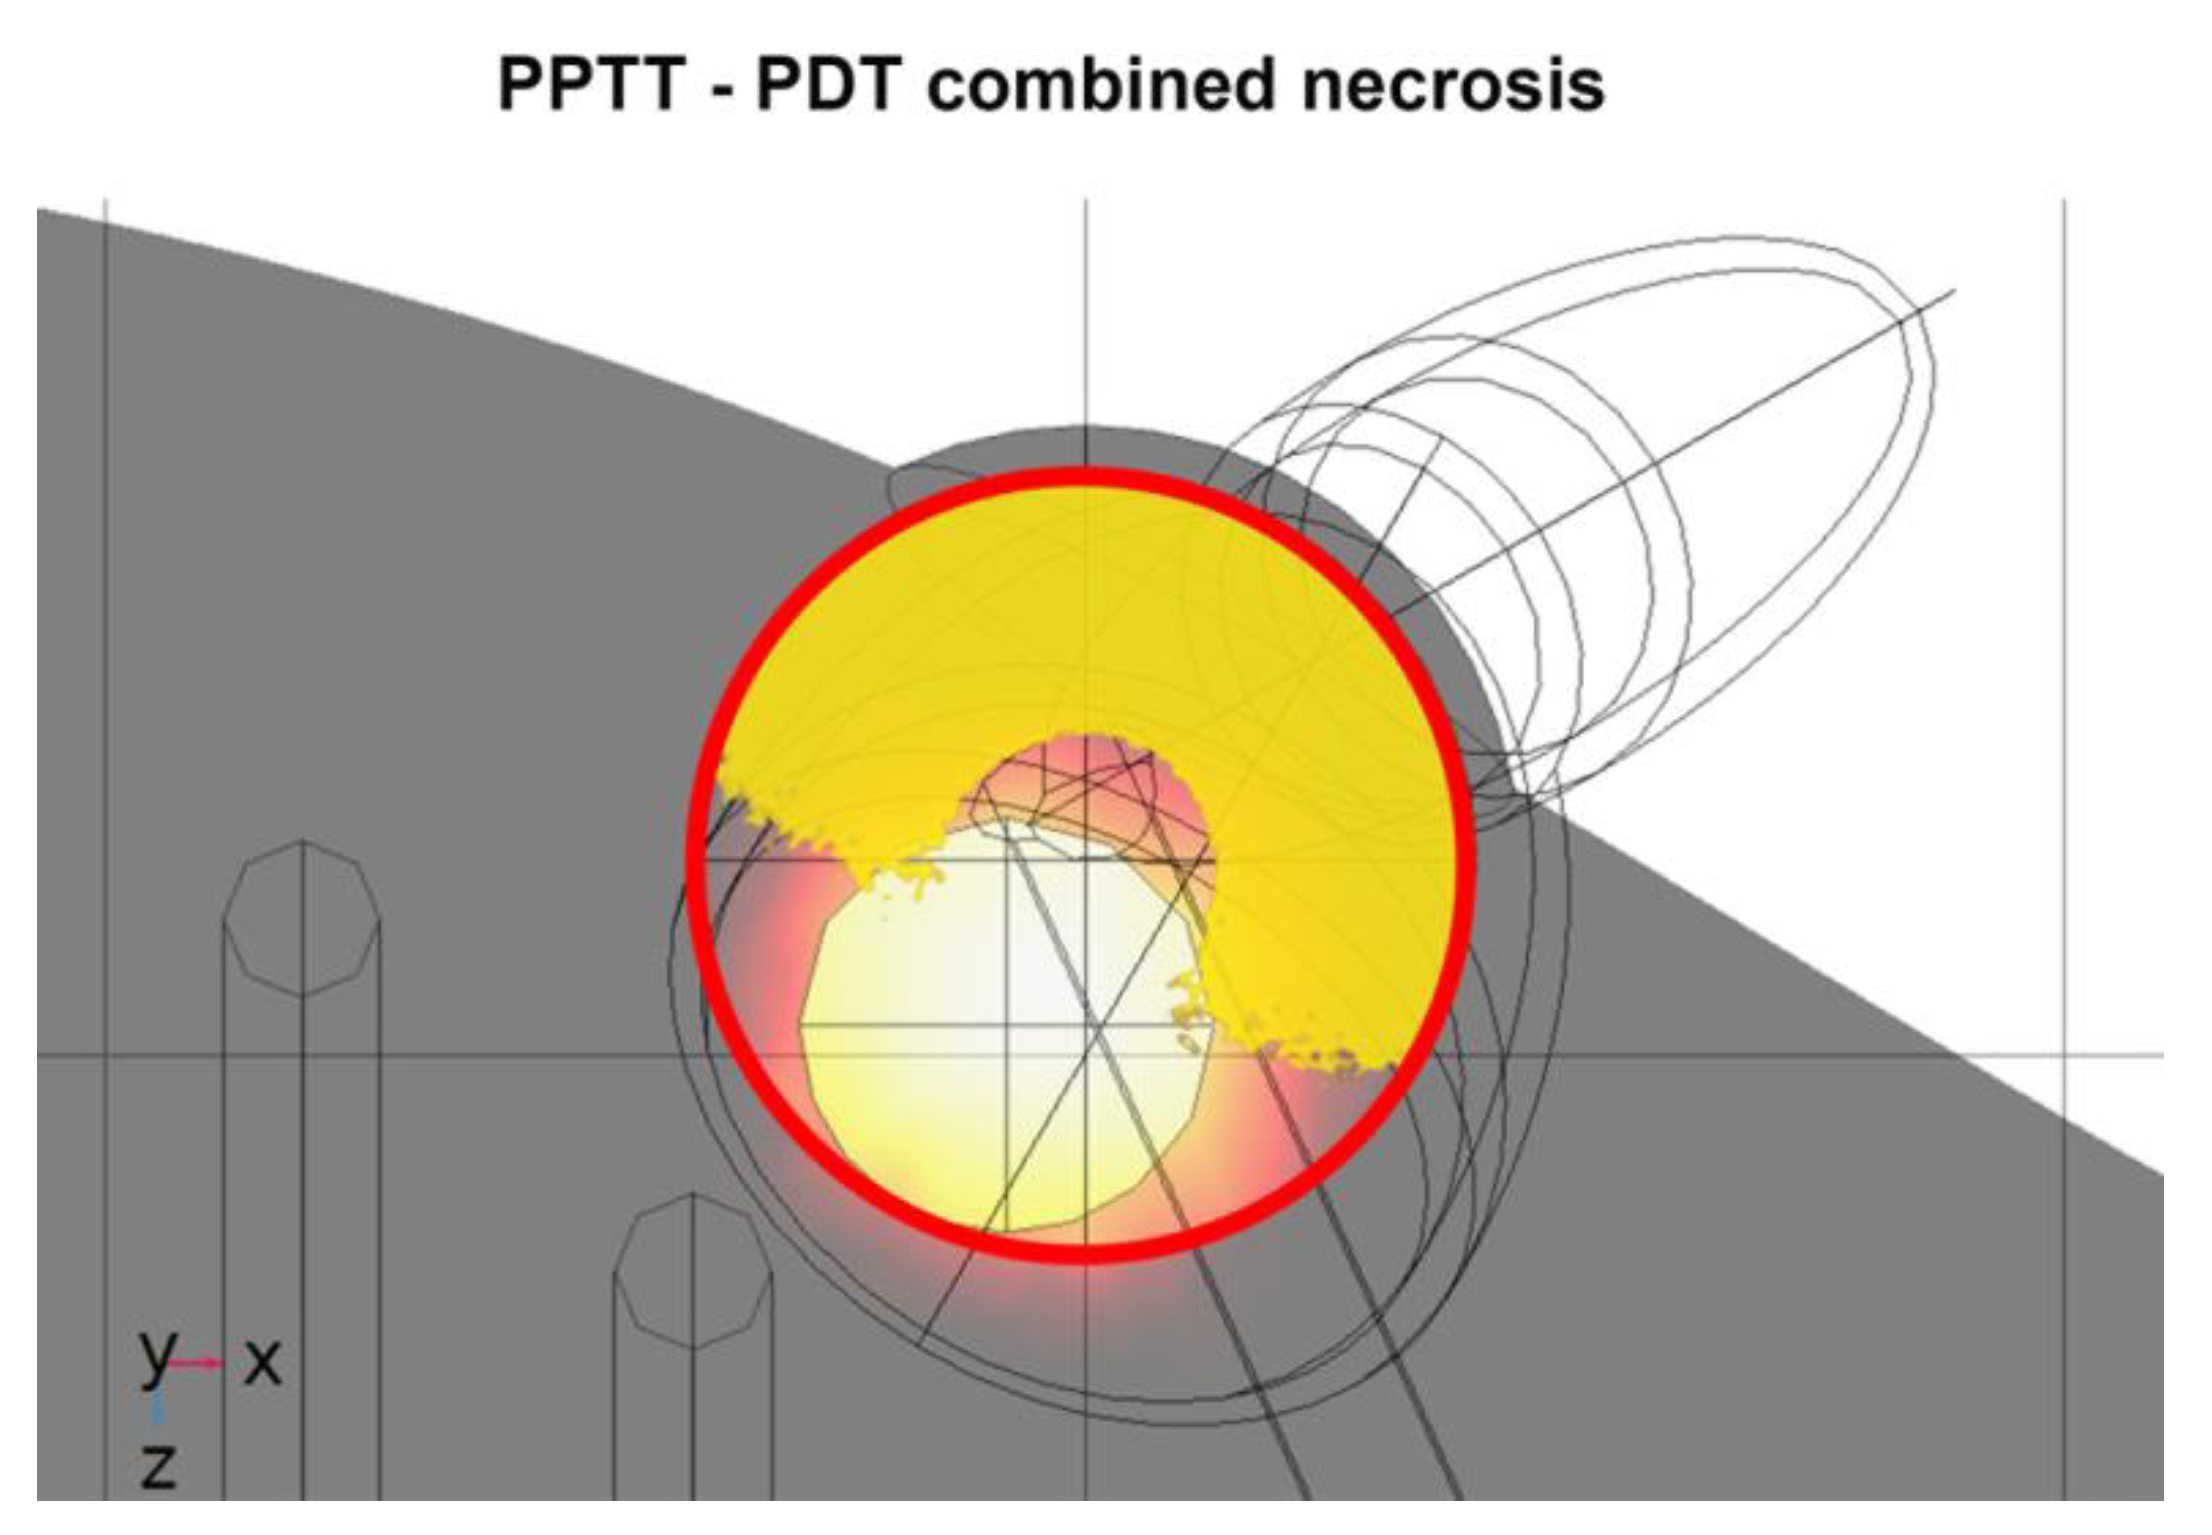
3.3. PPTT–PDT Combination Results
4. Discussion
5. Conclusions
Author Contributions
Funding
Institutional Review Board Statement
Informed Consent Statement
Data Availability Statement
Acknowledgments
Conflicts of Interest
References
- Kareliotis, G.; Tremi, I.; Kaitatzi, M.; Drakaki, E.; Serafetinides, A.A.; Makropoulou, M.; Georgakilas, A.G. Combined radiation strategies for novel and enhanced cancer treatment. Int. J. Radiat. Biol. 2020, 96, 1087–1103. [Google Scholar] [CrossRef] [PubMed]
- Agostinis, P.; Berg, K.; Cengel, K.A.; Foster, T.H.; Girotti, A.W.; Gollnick, S.O.; Hahn, S.M.; Hamblin, M.R.; Juzeniene, A.; Kessel, D.; et al. Photodynamic therapy of cancer: An update. CA Cancer J. Clin. 2011, 61, 250–281. [Google Scholar] [CrossRef]
- Yang, W.; Liang, H.; Ma, S.; Wang, D.; Huang, J. Gold nanoparticle based photothermal therapy: Development and application for effective cancer treatment. Sustain. Mater. Technol. 2019, 22, e00109. [Google Scholar] [CrossRef]
- Huang, X.; El-Sayed, M.A. Plasmonic photo-thermal therapy (PPTT). Alex. J. Med. 2011, 47, 1–9. [Google Scholar] [CrossRef] [Green Version]
- Jain, S.; Hirst, D.G.; O’Sullivan, J.M. Gold nanoparticles as novel agents for cancer therapy. Br. J. Radiol. 2012, 85, 101–113. [Google Scholar] [CrossRef] [PubMed]
- Kouloulias, V.; Triantopoulou, S.; Uzunoglou, N.; Pistevou-Gompaki, K.; Barich, A.; Zygogianni, A.; Kyrgias, G.; Kardamakis, D.; Pectasidis, D.; Kouvaris, J. Hyperthermia is now included in the NCCN clinical practice guidelines for breast cancer recurrences: An analysis of existing data. Breast Care 2015, 10, 109–116. [Google Scholar] [CrossRef] [Green Version]
- Dimitriou, N.M.; Pavlopoulou, A.; Tremi, I.; Kouloulias, V. Prediction of gold nanoparticle and microwave-induced hyperthermia effects on tumor control via a simulation approach. Nanomaterials 2019, 9, e167. [Google Scholar] [CrossRef] [Green Version]
- Zheng, Y.B.; Huang, T.J.; Desai, A.Y.; Wang, S.J.; Tan, L.K.; Gao, H.; Huan, A.C.H. Thermal behavior of localized surface plasmon resonance of Au/TiO2 core/shell nanoparticle arrays. Appl. Phys. Lett. 2007, 90, 183117. [Google Scholar] [CrossRef] [Green Version]
- Jauffred, L.; Samadi, A.; Klingberg, H.; Bendix, P.M.; Oddershede, L.B. Plasmonic heating of nanostructures. Chem. Rev. 2019, 119, 8087–8130. [Google Scholar] [CrossRef]
- Ali, M.R.K.; Wu, Y.; El-Sayed, M.A. Gold-nanoparticle-assisted plasmonic photothermal therapy advances toward clinical application. J. Phys. Chem. C 2019, 123, 15375–15393. [Google Scholar] [CrossRef]
- Von Tappeiner, H.; Jodlbauer, A. Uber die wirkung der photodynamischen (fluorescierenden) stoffe auf protozoen und enzyme. Dtsch. Arch. Klin. Med. 1904, 80, 427–487. [Google Scholar]
- Von Tappeiner, H.; Jodlbauer, A. Die Sensiblilisierende Wirkung Fluoreszierender Substanzer Gesammte Untersuchungen uber Die Photodynamische Erscheinerung; Vogel: Leipzig, Germany, 1907. [Google Scholar]
- Moan, J. On the diffusion length of singlet oxygen in cells and tissues. J. Photochem. Photobiol. B Biol. 1990, 6, 343–344. [Google Scholar] [CrossRef]
- Huang, Z. A review of progress in clinical photodynamic therapy. Technol. Cancer Res. Treat. 2005, 4, 283–293. [Google Scholar] [CrossRef] [PubMed] [Green Version]
- Usuda, J.; Kato, H.; Okunaka, T.; Furukawa, K.; Tsutsui, H.; Yamada, K.; Suga, Y.; Honda, H.; Nagatsuka, Y.; Ohira, T.; et al. Photodynamic therapy (PDT) for lung cancers. J. Thorac. Oncol. 2006, 1, 489–493. [Google Scholar] [CrossRef] [Green Version]
- Wu, H.; Minamide, T.; Yano, T. Role of photodynamic therapy in the treatment of esophageal cancer. Dig. Endosc. 2019, 31, 508–516. [Google Scholar] [CrossRef] [PubMed] [Green Version]
- Mroz, P.; Yaroslavsky, A.; Kharkwal, G.B.; Hamblin, M.R. Cell death pathways in photodynamic therapy of cancer. Cancers 2011, 3, 2516–2539. [Google Scholar] [CrossRef] [PubMed] [Green Version]
- Soriano, J.; Mora-Espí, I.; Alea-Reyes, M.E.; Pérez-García, L.; Barrios, L.; Ibáñez, E.; Nogués, C. Cell death mechanisms in tumoral and non-tumoral human cell lines triggered by photodynamic treatments: Apoptosis, necrosis and parthanatos. Sci. Rep. 2017, 7, 41340. [Google Scholar] [CrossRef] [Green Version]
- Bacellar, I.O.L.; Tsubone, T.M.; Pavani, C.; Baptista, M.S. Photodynamic efficiency: From molecular photochemistry to cell death. Int. J. Mol. Sci. 2015, 16, 20523–20559. [Google Scholar] [CrossRef] [Green Version]
- Kareliotis, G.; Papachristou, M.; Priftakis, D.; Datseris, I.; Makropoulou, M. Computational study of necrotic areas in rat liver tissue treated with photodynamic therapy. J. Photochem. Photobiol. B 2019, 192, 40–48. [Google Scholar] [CrossRef]
- Kareliotis, G.; Liossi, S.; Makropoulou, M. Assessment of singlet oxygen dosimetry concepts in photodynamic therapy through computational modeling. Photodiagn. Photodyn. Ther. 2018, 21, 224–233. [Google Scholar] [CrossRef]
- Wang, K.K.; Finlay, J.C.; Busch, T.M.; Hahn, S.M.; Zhu, T.C. Explicit dosimetry for photodynamic therapy: Macroscopic singlet oxygen modeling. J. Biophotonics 2010, 3, 304–318. [Google Scholar] [CrossRef] [PubMed] [Green Version]
- Beeson, K.W.; Parilov, E.; Potasek, M.; Kim, M.M.; Zhu, T.C. Validation of combined Monte Carlo and photokinetic simulations for the outcome correlation analysis of benzoporphyrin derivative-mediated photodynamic therapy on mice. J. Biomed. Opt. 2019, 24, 035006. [Google Scholar] [CrossRef]
- Isabelle, M.; Klubben, W.; He, T.; Laughney, A.M.; Glaser, A.; Krishnaswamy, V.; Hoopes, P.J.; Hasan, T.; Pogue, B.W. Assessment of biophysical tumor response to PDT in pancreatic cancer using localized reflectance spectroscopy. Opt. Methods Tumor Treat. Detect. Mech. Tech. Photodyn. Ther. XX 2011, 7886, 78860S. [Google Scholar] [CrossRef]
- Runnels, J.M.; Chen, N.; Ortel, B.; Kato, D.; Hasan, T. BPD-MA-mediated photosensitization in vitro and in vivo: Cellular adhesion and β1 integrin expression in ovarian cancer cells. Br. J. Cancer 1999, 80, 946–953. [Google Scholar] [CrossRef] [Green Version]
- Tong, Z.S.; Miao, P.T.; Liu, T.T.; Jia, Y.S.; Liu, X.D. Enhanced antitumor effects of BPD-MA-mediated photodynamic therapy combined with adriamycin on breast cancer in mice. Acta Pharmacol. Sin. 2012, 33, 1319–1324. [Google Scholar] [CrossRef] [PubMed] [Green Version]
- Kim, M.M.; Penjweini, R.; Liang, X.; Zhu, T.C. Explicit macroscopic singlet oxygen modeling for benzoporphyrin derivative monoacid ring A (BPD)-mediated photodynamic therapy. J. Photochem. Photobiol. B Biol. 2016, 164, 314–322. [Google Scholar] [CrossRef] [PubMed] [Green Version]
- Kim, M.M.; Penjweini, R.; Zhu, T.C. In vivo outcome study of BPD-mediated PDT using a macroscopic singlet oxygen model. In Proceedings of the SPIE BIOS, San Francisco, CA, USA, 7–12 February 2015; Volume 9308. [Google Scholar] [CrossRef] [Green Version]
- Liu, B.; Liang, X.; Zhu, T. Singlet oxygen modeling of BPD mediated-PDT using COMSOL. In Proceedings of the 2012 COMSOL Conference, Boston, MA, USA, 3–5 October 2012. [Google Scholar]
- McMillan, D.D.; Chen, D.; Kim, M.M.; Liang, X.; Zhu, T.C. Parameter determination for singlet oxygen modeling of BPD-Mediated PDT. In Proceedings of the Optical Methods for Tumor Treatment and Detection: Mechanisms and Techniques in Photodynamic Therapy XXII, San Francisco, CA, USA, 2–7 February 2013; Volume 8568, p. 856810. [Google Scholar] [CrossRef] [Green Version]
- Kareliotis, G.; Xanthopoulos, S.; Drakaki, E.; Papachristou, M.; Datseris, I.; Bouziotis, P.; Makropoulou, M. Photodynamic therapy of 4T1 tumors in NOD-SCID mice. arXiv 2020, arXiv:2008.03537v2. [Google Scholar]
- Bashkatov, A.N.; Berezin, K.V.; Dvoretskiy, K.N.; Chernavina, M.L.; Genina, E.A.; Genin, V.D.; Kochubey, V.I.; Lazareva, E.N.; Pravdin, A.B.; Shvachkina, M.E.; et al. Measurement of tissue optical properties in the context of tissue optical clearing. J. Biomed. Opt. 2018, 23, 1–31. [Google Scholar] [CrossRef]
- Sabino, C.P.; Deana, A.M.; Yoshimura, T.M.; da Silva, D.F.T.; França, C.M.; Hamblin, M.R.; Ribeiro, M.S. The optical properties of mouse skin in the visible and near infrared spectral regions. J. Photochem. Photobiol. B. 2016, 160, 72–78. [Google Scholar] [CrossRef] [Green Version]
- Xu, Y.; Long, S.; Yang, Y.; Zhou, F.; Dong, N.; Yan, K.; Wang, B.; Zeng, Y.; Du, N.; Li, X.; et al. Mathematical simulation of temperature distribution in tumor tissue and surrounding healthy tissue treated by laser combined with indocyanine green. Theor. Biol. Med. Model. 2019, 16, 12. [Google Scholar] [CrossRef]
- Jacques, S.L. Optical properties of biological tissues: A review. Phys. Med. Biol. 2013, 58, R37–R61. [Google Scholar] [CrossRef] [PubMed]
- National Center for Biotechnology Information Compound Summary for CID 31296. Available online: https://pubchem.ncbi.nlm.nih.gov/compound/Visudyne (accessed on 22 November 2020).
- Kim, M.M.; Ghogare, A.A.; Greer, A.; Zhu, T.C. On the in vivo photochemical rate parameters for PDT reactive oxygen species modeling. Phys. Med. Biol 2017, 62, R1–R48. [Google Scholar] [CrossRef] [PubMed] [Green Version]
- Makropoulou, M. Cancer and electromagnetic radiation therapy: Quo Vadis? arXiv 2016, arXiv:1602.02077. [Google Scholar]
- Bost, C. Heat Transfer in Biological Tissue with Thermal Damage Analysis. Available online: https://www.comsol.com/blogs/heat-transfer-in-biological-tissue-with-thermal-damage-analysis/ (accessed on 20 February 2022).
- Weissig, V.; Pettinger, T.K.; Murdock, N. Nanopharmaceuticals (Part 1): Products on the market. Int. J. Nanomed. 2014, 9, 4357–4373. [Google Scholar] [CrossRef] [PubMed] [Green Version]
- Suk, J.S.; Xu, Q.; Kim, N.; Hanes, J.; Ensign, L.M. PEGylation as a strategy for improving nanoparticle-based drug and gene delivery. Adv. Drug Deliv. Rev. 2016, 99, 28–51. [Google Scholar] [CrossRef] [Green Version]
- Stiufiuc, R.; Iacovita, C.; Nicoara, R.; Stiufiuc, G.; Florea, A.; Achim, M.; Lucaciu, C.M. One-step synthesis of PEGylated gold nanoparticles with tunable surface charge. J. Nanomater. 2013, 2013, 146031. [Google Scholar] [CrossRef]
- Carrillo-Cazares, A.; Jiménez-Mancilla, N.P.; Luna-Gutiérrez, M.A.; Isaac-Olivé, K.; Camacho-López, M.A. Study of the optical properties of functionalized gold nanoparticles in different tissues and their correlation with the temperature increase. J. Nanomater. 2017, 2017, 3628970. [Google Scholar] [CrossRef] [Green Version]
- Cheong, S.-K.; Krishnan, S.; Cho, S.H. Modeling of plasmonic heating from individual gold nanoshells for near-infrared laser-induced thermal therapy. Med. Phys. 2009, 36, 4664–4671. [Google Scholar] [CrossRef]
- Vignion-Dewalle, A.-S.; Betrouni, N.; Tylcz, J.-B.; Vermandel, M.; Mortier, L.; Mordon, S. Comparison of three light doses in the photodynamic treatment of actinic keratosis using mathematical modeling. J. Biomed. Opt. 2015, 20, 58001. [Google Scholar] [CrossRef] [Green Version]
- Pattani, V.P.; Tunnell, J.W. Nanoparticle-mediated photothermal therapy: A comparative study of heating for different particle types. Lasers Surg. Med. 2012, 44, 675–684. [Google Scholar] [CrossRef] [Green Version]
- Javidi, M.; Heydari, M.; Attar, M.M.; Haghpanahi, M.; Karimi, A.; Navidbakhsh, M.; Amanpour, S. Cylindrical agar gel with fluid flow subjected to an alternating magnetic field during hyperthermia. Int. J. Hyperth. 2015, 31, 33–39. [Google Scholar] [CrossRef] [PubMed]
- Zhang, X.; Xie, X.; Qu, D.; Ning, J.; Zhou, H.; Pan, J.; Yang, G. Determining organ dose conversion coefficients for external neutron irradiation by using a voxel mouse model. J. Radiat. Res. 2016, 57, 182–188. [Google Scholar] [CrossRef] [PubMed] [Green Version]
- Foundation for Research on Information Technologies in Society (IT’IS) Thermal Conductivity. Available online: https://itis.swiss/virtual-population/tissue-properties/database/thermal-conductivity/ (accessed on 15 November 2021).
- Giering, K.; Lamprecht, I.; Minet, O. Specific heat capacities of human and animal tissues. In Laser-Tissue Interaction and Tissue Optics; Delacretaz, G.P., Steiner, R.W., Svaasand, L.O., Albrecht, H., Meier, T.H., Eds.; SPIE: Bellingham, WA, USA, 1996; Volume 2624, pp. 188–197. [Google Scholar]
- Wilson, B.C. Measurement of Tissue Optical Properties: Methods and Theories. In Optical-Thermal Response of Laser-Irradiated Tissue; Welch, A.J., Van Gemert, M.J.C., Eds.; Springer: Boston, MA, USA, 1995; pp. 233–303. ISBN 978-1-4757-6092-7. [Google Scholar]
- Durkee, M.S.; Nooshabadi, F.; Cirillo, J.D.; Maitland, K.C. Optical model of the murine lung to optimize pulmonary illumination. J. Biomed. Opt. 2018, 23, 1–12. [Google Scholar] [CrossRef] [PubMed] [Green Version]
- Parsa, P.; Jacques, S.L.; Nishioka, N.S. Optical properties of rat liver between 350 and 2200 nm. Appl. Opt. 1989, 28, 2325–2330. [Google Scholar] [CrossRef] [PubMed]
- Liu, K.; Lu, Y.; Tian, J.; Qin, C.; Yang, X.; Zhu, S.; Yang, X.; Gao, Q.; Han, D. Evaluation of the simplified spherical harmonics approximation in bioluminescence tomography through heterogeneous mouse models. Opt. Express 2010, 18, 20988–21002. [Google Scholar] [CrossRef]
- Yang, T.D.; Choi, W.; Yoon, T.H.; Lee, K.J.; Lee, J.-S.; Joo, J.H.; Lee, M.-G.; Yim, H.S.; Choi, K.M.; Kim, B.; et al. In vivo photothermal treatment by the peritumoral injection of macrophages loaded with gold nanoshells. Biomed. Opt. Express 2015, 7, 185–193. [Google Scholar] [CrossRef] [Green Version]
- Gutwein, L.G.; Singh, A.K.; Hahn, M.A.; Rule, M.C.; Knapik, J.A.; Moudgil, B.M.; Brown, S.C.; Grobmyer, S.R. Fractionated photothermal antitumor therapy with multidye nanoparticles. Int. J. Nanomed. 2012, 7, 351–357. [Google Scholar] [CrossRef] [Green Version]
- Basu, S.; Binder, R.J.; Suto, R.; Anderson, K.M.; Srivastava, P.K. Necrotic but not apoptotic cell death releases heat shock proteins, which deliver a partial maturation signal to dendritic cells and activate the NF-kappa B pathway. Int. Immunol. 2000, 12, 1539–1546. [Google Scholar] [CrossRef]
- Sugiura, T.; Matsuki, D.; Okajima, J.; Komiya, A.; Mori, S.; Maruyama, S.; Kodama, T. Photothermal therapy of tumors in lymph nodes using gold nanorods and near-infrared laser light with controlled surface cooling. Nano Res. 2015, 8, 3842–3852. [Google Scholar] [CrossRef]
- O’Neal, D.P.; Hirsch, L.R.; Halas, N.J.; Payne, J.D.; West, J.L. Photo-thermal tumor ablation in mice using near infrared-absorbing nanoparticles. Cancer Lett. 2004, 209, 171–176. [Google Scholar] [CrossRef]
- Hirsch, L.R.; Stafford, R.J.; Bankson, J.A.; Sershen, S.R.; Rivera, B.; Price, R.E.; Hazle, J.D.; Halas, N.J.; West, J.L. Nanoshell-mediated near-infrared thermal therapy of tumors under magnetic resonance guidance. Proc. Natl. Acad. Sci. USA 2003, 100, 13549–13554. [Google Scholar] [CrossRef] [PubMed] [Green Version]
- Zhang, Y.; Sun, X.; Nan, N.; Cao, K.-X.; Ma, C.; Yang, G.-W.; Yu, M.-W.; Yang, L.; Li, J.-P.; Wang, X.-M.; et al. Elemene inhibits the migration and invasion of 4T1 murine breast cancer cells via heparanase. Mol. Med. Rep. 2017, 16, 794–800. [Google Scholar] [CrossRef] [PubMed] [Green Version]
- Yang, Y.; Zhu, D.; Liu, Y.; Jiang, B.; Jiang, W.; Yan, X.; Fan, K. Platinum-carbon-integrated nanozymes for enhanced tumor photodynamic and photothermal therapy. Nanoscale 2020, 12, 13548–13557. [Google Scholar] [CrossRef]
- Dickerson, E.B.; Dreaden, E.C.; Huang, X.; El-Sayed, I.H.; Chu, H.; Pushpanketh, S.; McDonald, J.F.; El-Sayed, M.A. Gold nanorod assisted near-infrared plasmonic photothermal therapy (PPTT) of squamous cell carcinoma in mice. Cancer Lett. 2008, 269, 57–66. [Google Scholar] [CrossRef] [PubMed] [Green Version]
- Kareliotis, G.; Kalkou, M.; Tsigaridas, G.; Makropoulou, M.; Serafetinides, A.A. Assessing temperature increase during photodynamic therapy: A simulation model. J. Phys. Conf. Ser. 2021, 1859, 12048. [Google Scholar] [CrossRef]
- Rasband, W.S. ImageJ; U.S. National Institutes of Health: Bethesda, MD, USA, 1997–2018. Available online: https://imagej.nih.gov/ij/ (accessed on 5 February 2021).
- Chen, Q.; Xu, L.; Liang, C.; Wang, C.; Peng, R.; Liu, Z. Photothermal therapy with immune-adjuvant nanoparticles together with checkpoint blockade for effective cancer immunotherapy. Nat. Commun. 2016, 7, 13193. [Google Scholar] [CrossRef]
- Dimitriou, N.M.; Tsekenis, G.; Balanikas, E.C.; Pavlopoulou, A.; Mitsiogianni, M.; Mantso, T.; Pashos, G.; Boudouvis, A.G.; Lykakis, I.N.; Tsigaridas, G.; et al. Gold nanoparticles, radiations and the immune system: Current insights into the physical mechanisms and the biological interactions of this new alliance towards cancer therapy. Pharmacol. Ther. 2017, 178, 1–17. [Google Scholar] [CrossRef] [Green Version]
- Xu, W.; Qian, J.; Hou, G.; Wang, Y.; Wang, J.; Sun, T.; Ji, L.; Suo, A.; Yao, Y. A dual-targeted hyaluronic acid-gold nanorod platform with triple-stimuli responsiveness for photodynamic/photothermal therapy of breast cancer. Acta Biomater. 2019, 83, 400–413. [Google Scholar] [CrossRef]
- Yan, J.; Sun, H.; Li, J.; Qi, W.; Wang, H. A theranostic plaster combining photothermal therapy and photodynamic therapy based on chlorin e6/gold nanorods (Ce6/Au nrs) composite. Colloids Surf. A Physicochem. Eng. Asp. 2018, 537, 460–466. [Google Scholar] [CrossRef]
- Jang, B.; Park, J.-Y.; Tung, C.-H.; Kim, I.-H.; Choi, Y. Gold nanorod-photosensitizer complex for near-infrared fluorescence imaging and photodynamic/photothermal therapy in vivo. ACS Nano 2011, 5, 1086–1094. [Google Scholar] [CrossRef]
- Wang, S.; Huang, P.; Nie, L.; Xing, R.; Liu, D.; Wang, Z.; Lin, J.; Chen, S.; Niu, G.; Lu, G.; et al. Single continuous wave laser induced photodynamic/plasmonic photothermal therapy using photosensitizer-functionalized gold nanostars. Adv. Mater. 2013, 25, 3055–3061. [Google Scholar] [CrossRef] [PubMed] [Green Version]
- Sun, Q.; You, Q.; Pang, X.; Tan, X.; Wang, J.; Liu, L.; Guo, F.; Tan, F.; Li, N. A photoresponsive and rod-shape nanocarrier: Single wavelength of light triggered photothermal and photodynamic therapy based on AuNRs-capped & Ce6-doped mesoporous silica nanorods. Biomaterials 2017, 122, 188–200. [Google Scholar] [CrossRef] [PubMed]


| Total Light Dose (J/cm2) * | Fluence Rate (mW/cm2) * | Irradiation Time (min) | Dose (mg/kg) | Injected Volume (μL) | Refs. |
|---|---|---|---|---|---|
| 20 (J/cm) | 74 (mW/cm) | 4.5 | 1 | 75 | [24] |
| 40 | - | - | 2 | - | [25] |
| 120 | - | - | 1 | - | [26] |
| 22.5–135 (J/cm) | 12–150 (mW/cm) | - | 0.17–0.99 (μΜ) | - | [27] |
| 100–250 | 50–150 | 15–45 | 1 | - | [28] |
| - | 12–150 | 3–100 | 1 | - | [29] |
| - | 12–150 (mW/cm) | 3–100 | 1 | - | [30] |
| Layer | Parameter | Value | Parameter | Value a | |
|---|---|---|---|---|---|
| Skin | μa | 0.94 cm−1 | ε | 0.071 (cm−1 μΜ−1) | |
| μs | 37.1 cm−1 | ξ | 55 × 10−3 (cm2 mW−1 s−1) | ||
| gf | 0.8 | σ | 1.7 × 10⁻⁵ (μΜ−1) | ||
| d | 220 μm | β | 11.9 (μΜ) | ||
| f | 1 | ||||
| 4T1 tumor | μa | 0.76 cm−1 | δ | 33 (μΜ) | |
| μs | 98.0 cm−1 | 0.7 (μΜ s−1) b | |||
| gf | 0.9 | [3O2]0 | 60 (μΜ) | ||
| r | 0.2 cm | [1O2]rx,0 c | 0 | ||
| [1O2]rx,sh | 400 (μΜ) | ||||
| BPD-MA | μa | 0.05 cm−1 | |||
| μs | 98.0 cm−1 | ||||
| gf | 0.9 | ||||
| Parietal peritoneum muscle tissue | μa | 2.2 cm−1 | |||
| μs | 19.2 cm−1 | ||||
| gf | 0.8 | ||||
| Bone (ribs) | μa | 0.8 cm−1 | |||
| μs | 309.6 cm−1 | ||||
| gf | 0.93 | ||||
| r | 0.05 cm | ||||
| Tissue | μa (cm−1) | ρ (kg/m3) [48] | k W/(m·K) [49] | Cp (J/(kg·K)) [50] |
|---|---|---|---|---|
| Tumor a | 0.06 | 1150 | 0.56 | 4200 |
| NPs b | 7.52 | 998 | 0.64 | 4180 |
| Skin | 1.26 [32] | 1090 | 0.58 | 2291 |
| Heart | 0.98 [51] | 1060 | 0.56 | 2291 |
| Lungs | 1.06 [52] | 260 | 0.39 | 3890 |
| Liver | 5.7 [53] | 1060 | 0.52 | 3620 |
| Muscle | 2.4 [32] | 1000 | 0.49 | 3550 |
| Bone | 0.21 [54] | 1400 | 0.32 | 1313 |
| Spleen | 1.26 [54] | 1060 | 0.53 | 3720 |
| Fluence Rate (W/cm2) | Irradiation Time (min) | Nanoparticle Concentration a | Injected Volume (μL) | Area/Way of Injection | Refs. |
|---|---|---|---|---|---|
| - | 6.7 | 3.6∙1012 prtcl./mL | 30 | Lymph nodes | [58] |
| 4 | 3 | 2.4∙1011 prtcl./mL | 100 | Tail vein | [59] |
| 4 | 6 | 1.4∙1010 prtcl./mL | 20–50 | Interstitial | [60] |
| 0.8 | 10 | 80 μg/ml | - | Tail vein | [61] |
| 1 | 5 | 10 mg/kg | - | Tail vein | [62] |
| 1 | 2 | 27.5 pM | 10 | Tumor | [55] |
| 1.7–1.9 | 10 | 120 OD | 100 | Tail vein | [63] b |
| 0.9–1.1 | 10 | 40 OD | 15 | Tumor |
Publisher’s Note: MDPI stays neutral with regard to jurisdictional claims in published maps and institutional affiliations. |
© 2022 by the authors. Licensee MDPI, Basel, Switzerland. This article is an open access article distributed under the terms and conditions of the Creative Commons Attribution (CC BY) license (https://creativecommons.org/licenses/by/4.0/).
Share and Cite
Kareliotis, G.; Chronopoulou, E.; Makropoulou, M. In Silico, Combined Plasmonic Photothermal and Photodynamic Therapy in Mice. J. Nanotheranostics 2022, 3, 39-54. https://doi.org/10.3390/jnt3010004
Kareliotis G, Chronopoulou E, Makropoulou M. In Silico, Combined Plasmonic Photothermal and Photodynamic Therapy in Mice. Journal of Nanotheranostics. 2022; 3(1):39-54. https://doi.org/10.3390/jnt3010004
Chicago/Turabian StyleKareliotis, Georgios, Eleni Chronopoulou, and Mersini Makropoulou. 2022. "In Silico, Combined Plasmonic Photothermal and Photodynamic Therapy in Mice" Journal of Nanotheranostics 3, no. 1: 39-54. https://doi.org/10.3390/jnt3010004