
Ultra-Low-Power Architecture for the Detection and Notification of Wildfires Using the Internet of Things


School of Engineering, Eastern Michigan University, Ypsilanti, MI 48197, USA
IoT 2023, 4(1), 1-26; https://doi.org/10.3390/iot4010001
Submission received: 3 January 2023
/
Revised: 19 January 2023
/
Accepted: 20 January 2023
/
Published: 25 January 2023
Abstract
:Wildfires kill and injure people, destroy residences, pollute the air, and cause economic loss. In this paper, a low-power Internet of Things (IoT)-based sensor network is developed, which automatically detects fires in forests and sends the location to a central monitoring station with smartphone notifications in a real-time setting. This action helps in the early detection of a fire and firefighters can be notified immediately—thus the spread of the fire and the harm caused by it can be reduced. The proposed system detects fires from the presence of smoke and a sudden increase in temperature. The system also logs the temperature, humidity, carbon dioxide, rain, light, and wind speed in different areas of the forest. The sensor nodes transmit the data to a hub using a long-range wireless transmitter and the hub then sends the data to the central monitoring station using the cellular Internet. The sensor nodes and hub are designed with ultra-low-power hardware and software architecture, consuming current of only 0.37 and 1.4 mA, respectively, so that they can be powered by solar panels throughout the year. The central server and smartphone app contain maps, and the wildfire locations are marked in the case of a fire. In the present study, a prototype of the proposed system is successfully developed and tested.
1. Introduction
In recent years, wildfires have become a recurrent phenomenon in many parts of the world. The forests that become hot and dry during the summer are the most vulnerable to wildfires. They can be started by campfires being left unattended, downed power lines, lightning, or lava. The cause of 50% of wildfires is unknown [1]. One way to reduce the spread of wildfires is to detect the fire early on and notify the firefighters as soon as possible. The goal and objective of this paper is to develop an ultra-low-power Internet of Things (IoT)-based sensor network that automatically detects a fire in a forest and sends the location to a central monitoring station with smartphone notifications in a real-time setting. The sensor nodes are placed in different areas of the forest, and they detect fires by measuring the level of smoke and the sudden increase in temperature. The system also collects temperature, humidity, carbon dioxide, rain, light, and wind speed data at regular intervals—for instance, every 15 min. These data can help us to monitor the forest environment and can be used to predict wildfire occurrence using machine learning (ML) algorithms. These sensor nodes transmit the data to a hub using a long-range (LoRa) wireless transmitter and the hub then sends the data to the central monitoring station using the cellular Internet. The key challenge for the sensor and hub nodes’ design is to create a system that consumes ultra-low power so that the battery can be charged using solar panels without the need for manual recharging. The proposed devices are designed with low-power-consumption in mind, so that they can be powered by solar panels throughout the year. The overall operation of the proposed system is shown in Figure 1. The needs and significances of the proposed system are mentioned below:
- During 1998–2017, wildfires and volcanic activities caused 2400 deaths, and about 6.2 million people have been affected by suffocation, injuries, and burns worldwide [1]. Exposure to wildfire smoke affects the body’s respiratory and cardiovascular systems almost immediately [2]. It may also irritate the eyes and nose, and cause coughing and wheezing, lung diseases, such as bronchitis and asthma, and heart failure [1]. Witnessing the destruction caused by a wildfire can present mental hardships that may manifest as psychological disorders [3]. The proposed system will help to prevent the fire early on and help to reduce deaths, injuries, and physical and mental health problems.
- According to a Congressional Research Service report, over 44,000 wildfires have burned nearly 7.7 million acres in the United States in 2020 alone. In 2019–2020, wildfires destroyed approximately 10,000 structures and over 46 million acres of forest in Australia. Between 15,000–18,000 personal residences are destroyed and an average of 1.2 million acres of forest burn every year in the US due to wildfires [4]. The annualized losses are estimated to range from USD 63.5 to 285.0 billion in the US [3]. The early detection of wildfires using the proposed system can save structures and forests.
Several studies exist in the literature on the detection of wildfires using satellite images, optical cameras, and wireless sensor networks [6]. Some studies conducted on forest-monitoring practices based on the IoT are present in [7,8,9,10,11]; however, they lack the integration of low-power hardware and event-based software designs for power saving and Internet-connection challenges in a forest environment. The study in [7] used a flame sensor to detect fires. However, the sensor required a direct line of sight in front of the flame, which reduces the detection rate. Moreover, the flame sensor continuously consumes a 20 mA current [12]. The sensor node uses an HM-10 Bluetooth module to send a notification to a nearby passenger’s smartphone, and the smartphone then notifies the responders via a push notification using its cellular network. This is impractical because the fire may start in a forest, and no one is in the 100 m range of the HM-10 module [13]. In this case, the firefighters receive no notification of the fire. Moreover, at present, there is no discussion of optimizing power-consumption and how to recharge the battery. The system uses an Arduino Uno board that only draws approximately 42 mA [14]. Considering only the microcontroller and flame sensor, the sensor node consumes a 62 mA current.
The work in [8] detects fires when increased levels of CO and NO are in the air and when temperature significantly increases. However, this approach may cause false alarms because these situations may arise, even without a fire, due to air pollution on a hot day. The sensor nodes are connected using the LoRa mesh network and one last sensor node is connected to a Raspberry Pi (RPi) microcontroller, which is connected to the Wi-Fi. In this approach, the LoRa modules in the sensor nodes must constantly be in the receive mode for the mesh network to work, which consumes a significant amount of power. If LoRa modules are kept in cycles of sleep and wake-up modes, then the transmission through hundreds of LoRa nodes will consume a significant amount of time.
In [9], the authors used PixyCam 2 to detect fires along with temperature levels and humidity data. For the sensor node, the camera consumes 140 mA [15] and the UNO board consumes 42 mA [13]—thus the system becomes power-hungry, and large and expensive solar panels are required to power them. The study only depicts one sensor node transmitting data using LoRa to a The Things Network (TTN) LoRaWAN gateway, which is connected to the Internet. The study does not describe how a remote forest area that is larger than the LoRa range will be covered by several sensor nodes. If TTN LoRaWANs are used in the forest as hubs, they will require a cellular network and the current-consumption rate of the gateway will be greater than 500 mA [16].
The study in [10] used an FIR thermal sensor [17] to detect fire as it is cheaper than FLIR Lepton thermal cameras. However, the current-consumption of only the FIR thermal sensor is 23 mA; additional current-consumption also occurs for the MCU and environmental sensor. Though the authors claimed to have used STM32 L432KC MCU, they used RPi for the experiment, which consumes more than 1000 mA. The sensor nodes do not have any wireless communication modules; they are instead connected via a wired connection using the UART protocol. This wired connection makes it impractical to implement the device in large forests and their high-power-consumption rate is not suitable for a cheap solar panel-based power supply. The master node uses TTN LoRaWAN for sending a message using the Internet, and it consumes a current greater than 500 mA.
The work in [11] used the 30-30-30 rule that determines that temperatures higher than 30 °C, humidity levels lower than 30%, wind speeds faster than 30 km/h, and CO2 levels higher than 700 are all signs of fire occurrence. The sensor uses Arduino UNO and an MQ135 air-quality-sensor module that consumes 42 [14] and 150 mA [18], respectively. Moreover, it contains temperature and humidity sensors, and a LoRa communication module. The current-consumption rate of the sensor node is thus greater than 192 mA and inefficient. It uses TTN LoRaWAN as the gateway to the Internet that consumes a current greater than 500 mA.
In [19], the authors present a sleep-scheduling methodology to preserve the energy of sensor nodes for wildfire-detection purposes. The study proposes an energy-efficient Cluster Head (CH)-selection method using a Tunicate Swarm Algorithm (TSA), and then performs the sleep scheduling of closely located sensor nodes based on the distance threshold calculated through a set of experiments. However, this study does not present a hardware prototype where the proposed method is implemented. This work lacks the real-world experimental data, such as the actual current-consumption and performance, of the proposed approach.
The work in [20] presents a theoretical feasibility analysis of a wildfire detection system where the sensor nodes will send data to the central station using satellite Internet. The work proposes interfacing a satellite module with each sensor node and thus it can be used where no cellular coverage is present. However, the hardware cost of a satellite module [21] is more expensive than an LTE modem [22]. Moreover, the data plan cost for each satellite module is about 15 USD per month, plus the cost of sending and receiving each message—whereas our work uses an LTE data plan that is free up to 1 MB per month. Additionally, the work in [20] does not develop a prototype, and testing results—such as performance, latency, and current consumption—are not reported.
In [23], the authors used a spherical k-means machine learning algorithm [24] for detecting and classifying wildfire sounds. The classifier was then implemented Raspberry Pi 4 edge device. However, detecting wildfire with its sound signal can cause a significant delay because wildfire sounds may not be loud when the fire has just begun, and it may take a significant amount of time to detect a loud sound when the fire has spread in a large area. Moreover, the power-consumption of the Raspberry Pi sensor node was between 2.91 and 3.59 watts, which is much higher compared to our proposed values. Moreover, the study did not discuss how the data will be transmitted to the central server.
Compared with these works, the proposed work has additional sensors, ultra-low-power event-driven hardware, a software design that can function using a rechargeable battery and solar panels unlimitedly, a cellular modem to gain Internet connectivity for the hub, smartphone notifications, real-time plotting on the map, a data-viewer dashboard, and database implementation.
The rest of the paper is organized as follows. In Section 2, the Materials and Methods are discussed for developing the sensor node, hub node, central station software, and the smartphone app. The results of the testing of the prototype, analysis of current-consumption, and the comparison with other prototypes are discussed in Section 3. In Section 4, the discussion and future works are presented. Finally, Section 5 presents the conclusion.
2. Materials and Methods
The forest can be divided into hexagon-shaped blocks where each hub is surrounded by six sensor nodes, as shown in Figure 1. To increase the sensitivity, the radius of the hexagons can be inversely proportional to the risk of fires in the area. The sensor node detects a fire when there is smoke or a sudden rise in temperature (SRT), and then sends a message to the hub node using a LoRa transmitter. After receiving the message, the hub node then sends the message to the central server using long-term evolution (LTE) Internet. The central server saves the data in a database, plots the location on the map, generate alert sounds, and sends push notifications to the firefighter’s smartphones. The hub node also collects temperature, humidity, CO2, rain, and wind speed data every 15 min, and then sends this data to the central server once a day at midnight for forest monitoring. These data can be used to predict wildfire occurrences using machine learning algorithms [25,26,27].
Each sensor and hub node in this proposed system has an ID—referred to as sensor node (SN) and hub node (HN) numbers. They are assigned using non-negative integers, i.e., starting from 0, in ascending order. In this system, a hub node only processes data from its nearby sensor nodes, which are in its hexagon-shaped area. This ensures that even if sensor node data are received by more than one hub node, only the assigned hub node sends the data to the central station, and thus data duplication is avoided. The HN only processes data obtained from the sensor node SN when the SN is in the range shown in Equation (1):
where M is the total number of sensor nodes in the hexagonal area, which is 6.
The key design challenges of this IoT system are listed below:
- Notification and data collection: in case of a fire, the system must provide real-time notifications to the smartphones with location information. The system should log the environmental data daily, which can be used for analysis, such as predicting wildfires.
- Less LTE data usage: the amount of LTE Internet data used by the hub must be minimized to reduce monthly data plan costs and power-consumption.
- Low power consumption: the sensor and hub nodes must consume ultra-low power as they will be powered using solar panels, and the availability of sunlight is sometimes uncertain due to cloudy days. Manual USB charging is also impractical in a large forest environment.
The rest of this section discusses the different components of the system, and how the challenges are addressed and implemented.
2.1. Sensor Node
The sensor node recognizes a fire using a smoke sensor or by detecting the sudden rise in temperature (SRT). It then sends a message to the hub node using a LoRa transmitter. A microcontroller-based hardware device was designed for this purpose. The key design challenge of the hardware was lowering the power-consumption, as it is powered by a battery and recharged using a solar panel. The hardware and firmware of the device are briefly described below.
2.1.1. Hardware
A block diagram of the hardware unit of the sensor node is shown in Figure 2.
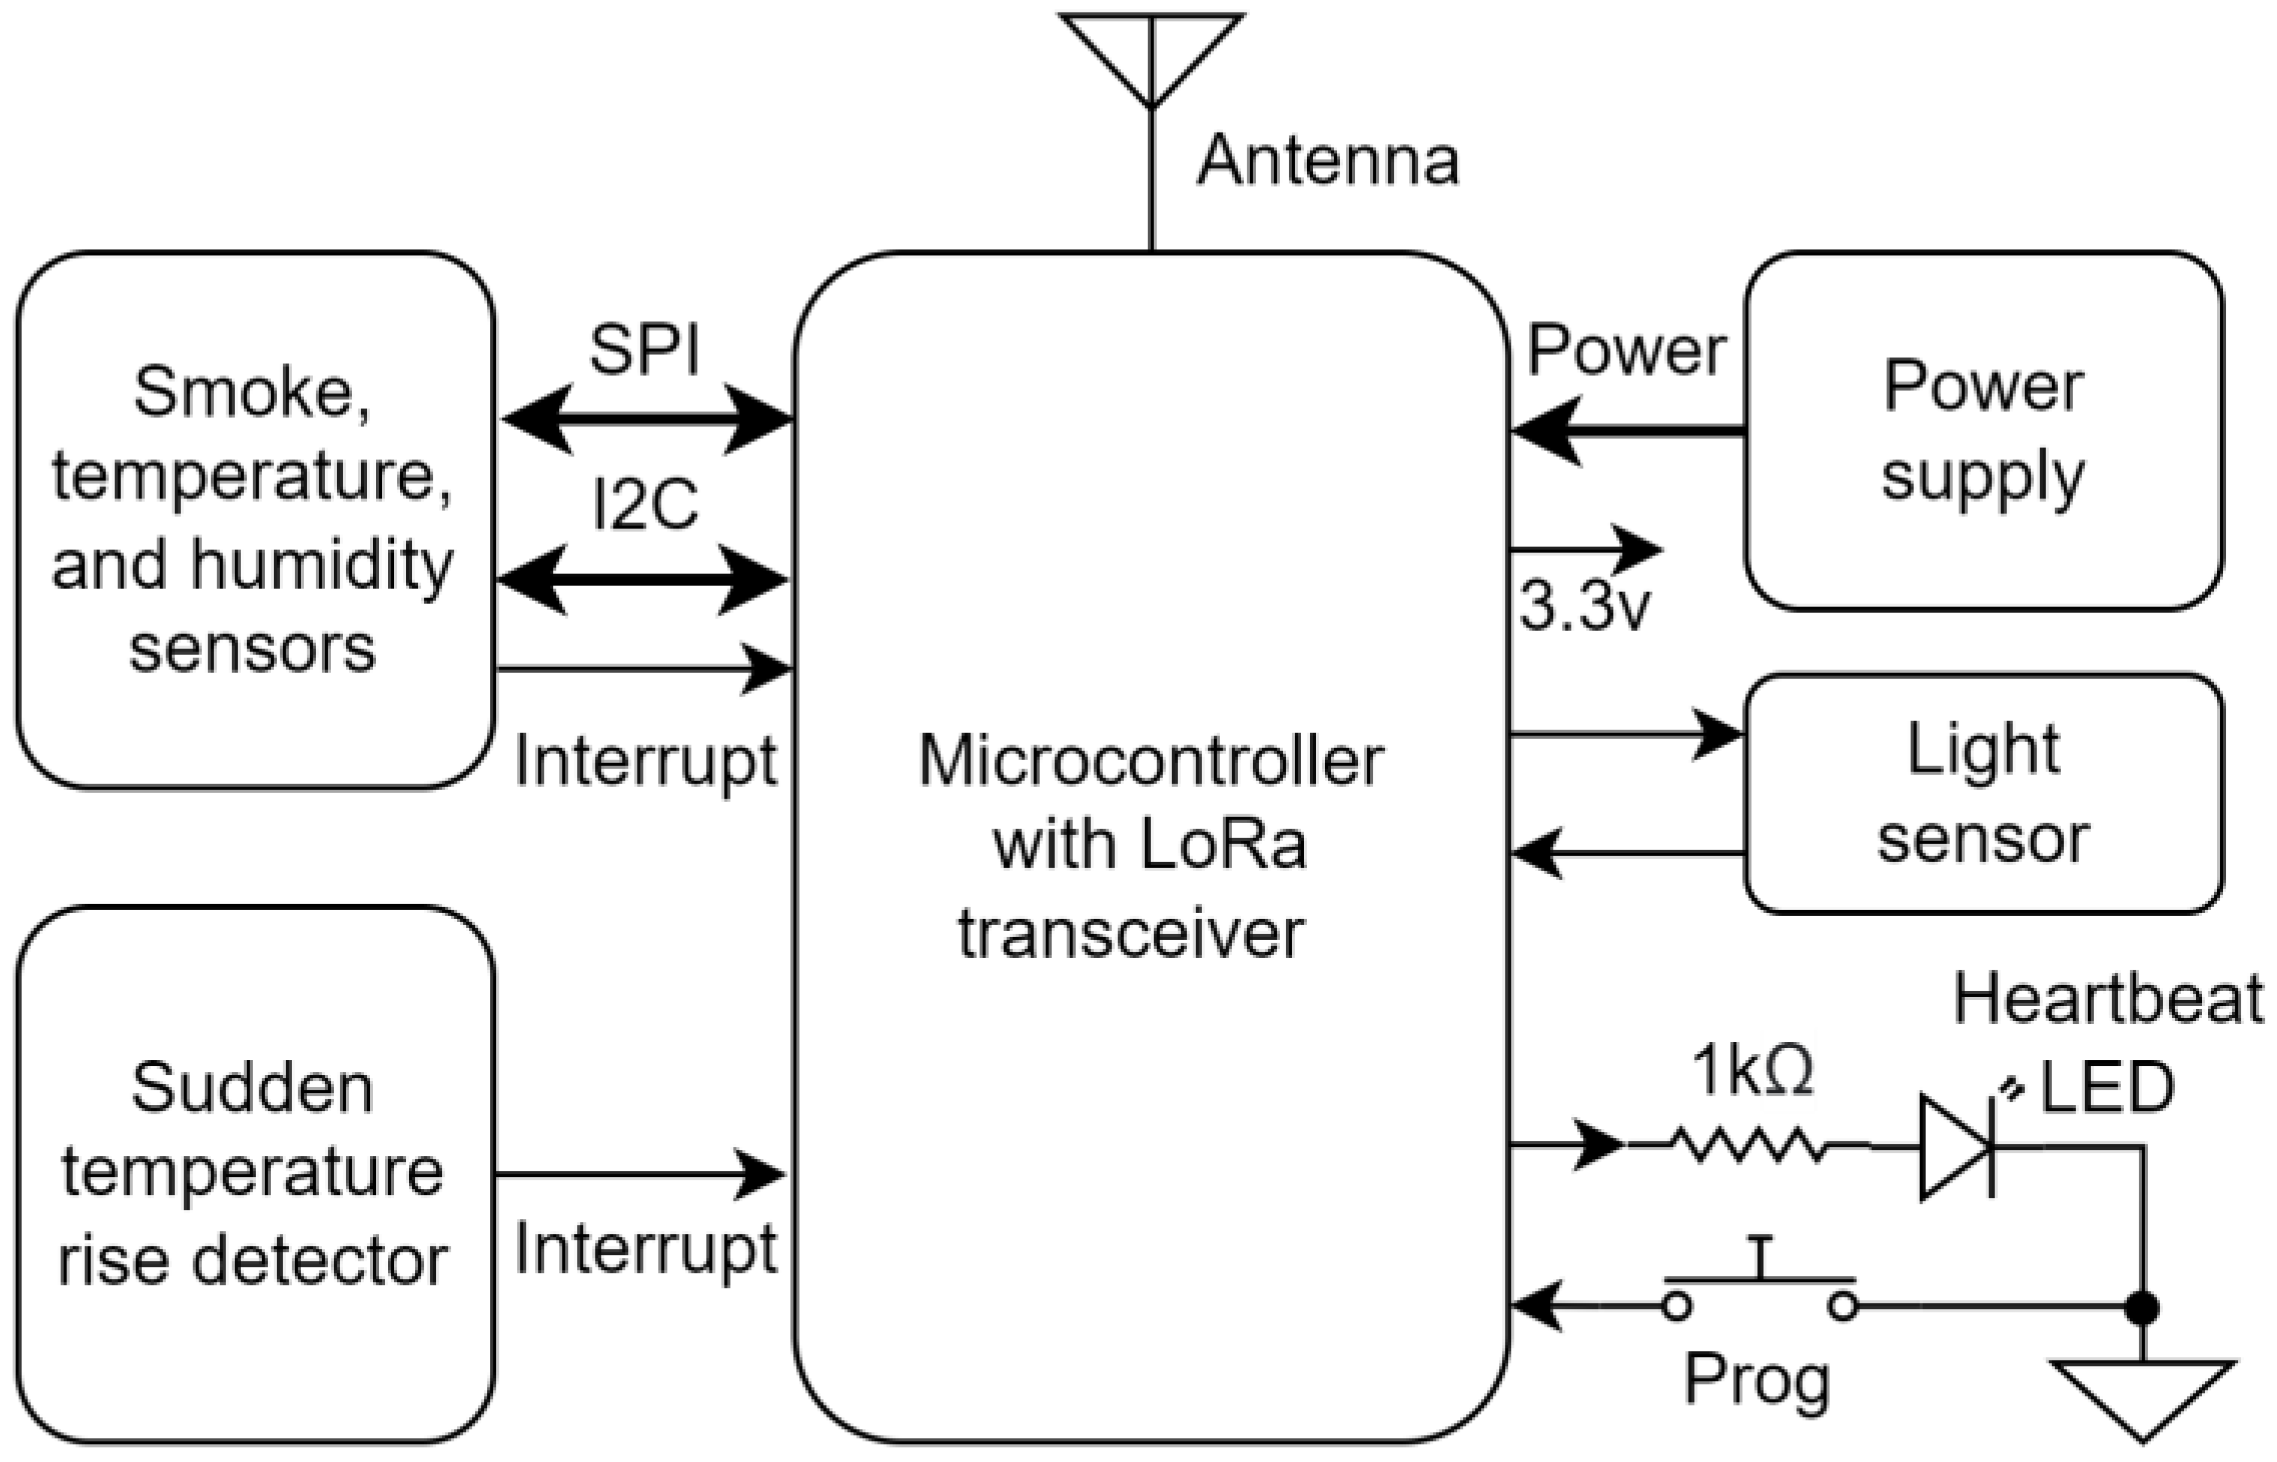
A LoRa32u4 II development board [28], comprising an Atmega32u4 [29] microcontroller and an HPD13 915 MHz LoRa transceiver module [30], was used as the processing and wireless communication unit for the sensor node. ATmega32u4 (Microchip Technology Inc., Arizona, USA) is a low-power 8-bit AVR® RISC-based microcontroller featuring 32 kB self-programming flash program memory, 2.5 kB SRAM, 12 analog-to-digital converter (ADC) channels, general-purpose input/output (GPIO), Serial Peripheral Interface (SPI), I2C, and many different peripherals. It has six sleep modes and they are advantageous for hardware where ultra-low-power consumption is required to extend battery life. The LoRa transceiver module is interfaced with the microcontroller using SPI. It has a transmit power of up to +20 dBm and as low as −139 dBm receiving sensitivity. Its maximum data rate is 300 kbps and covers distances of up to 2 km when considering line of sight. A 915 MHz frequency, 2 dBi gain external antenna was connected to the board for wireless communication. The development board also contains an ultra-low quiescent current (IQ) low-dropout (LDO) voltage-regulator chip that generates a 3.3 volt with a 500 mA peak current output from a 3.7-volt battery. To monitor the battery, a voltage-divider circuit with two 100 kΩ series resistors was implemented on the board, and its middle point was connected to an ADC pin of the microcontroller. By using a transistor switch, the power of the voltage-divider circuit was controlled by a GPIO pin of the MCU, and thus the voltage-divider circuit could be switched off to save power. An LED was used to indicate when the program was running—referred to as the heartbeat LED—and a push button switch—referred to as the Prog button—for reprogramming the MCU after disabling the USB was also interfaced.
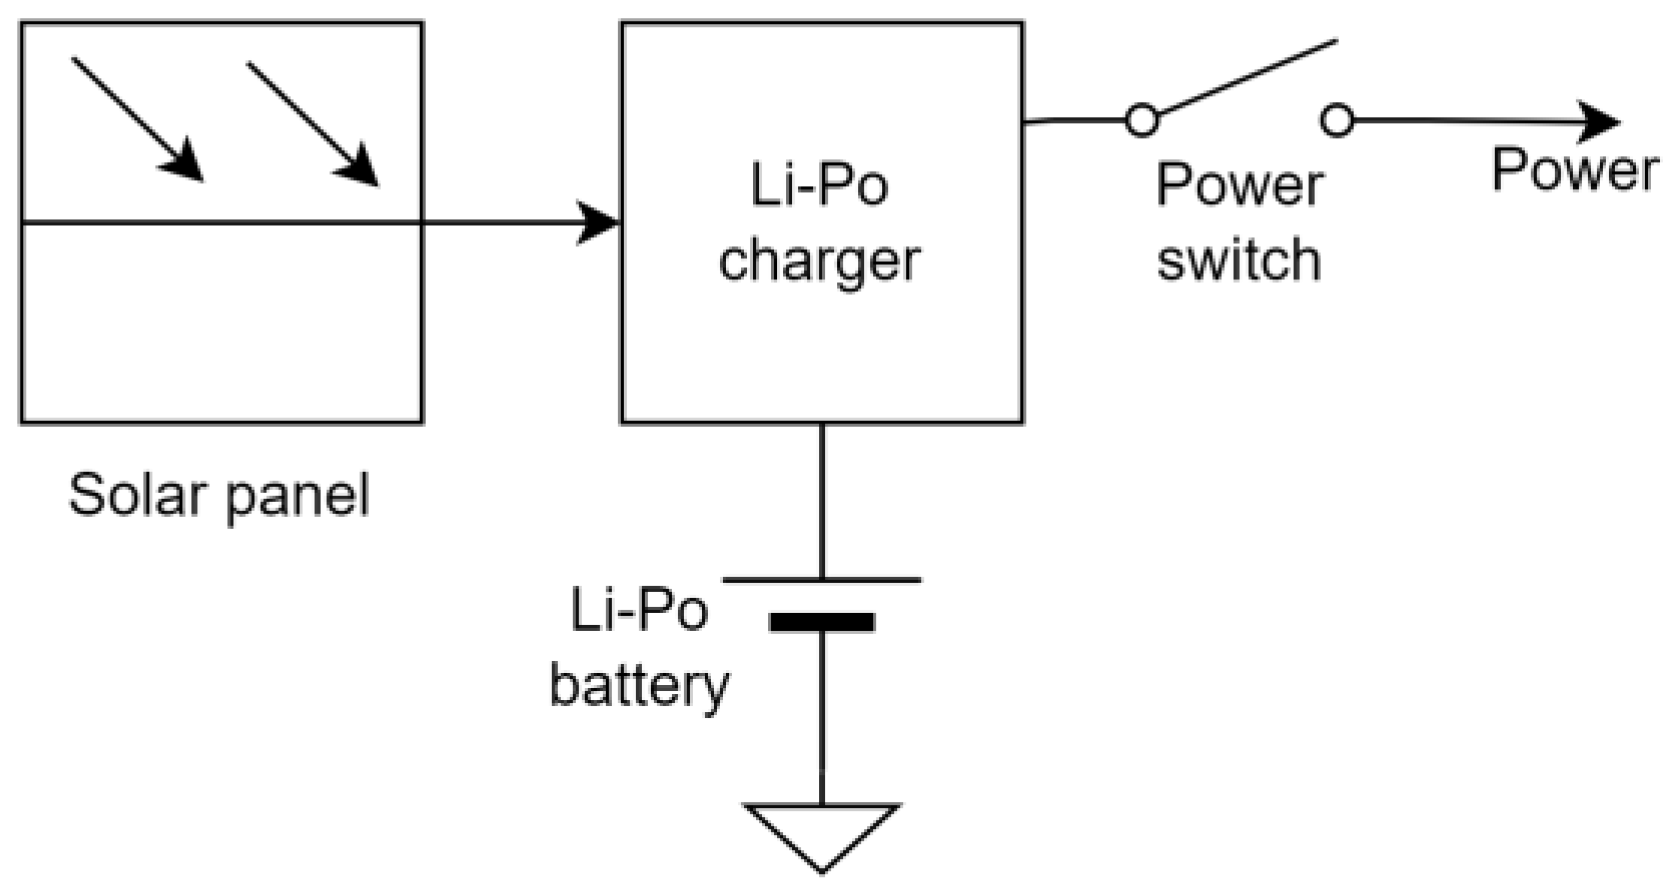
The power supply module of the sensor node is shown in Figure 3. A solar panel [31] with a 5 V output voltage and 3.5-watt charging power with an adjustable 360-degree bracket was connected to a charger module [32] to charge the battery whenever sunlight was available. A 3.7 V Li-Po rechargeable battery [33] with a capacity of 2000 mAh was connected to the battery terminal of the charger module. The module was capable of charging at a maximum rate of 1.5 A. For this application, the maximum charge current was set to 1000 mA. A single-pole single-throw (SPST) switch [34] was used to turn the battery on–off from the microcontroller development board.
The CN0537 board [35] was used as the smoke, temperature, and humidity sensor module. The board contained an ADPD188BI [36] chip—specifically designed for photometric and low-power smoke-detection applications. To perform smoke detection, the ADPD188BI utilizes two types of LEDs: a blue LED having a wavelength of 470 nm and an infrared (IR) LED having a wavelength of 850 nm. These LEDs are pulsed in two independent time slots, and the transmitted light is scattered back onto the device by particulate matter in the air. Two integrated photodetectors (PDs) then receive the scattered light and produce proportional levels of output currents, which are converted to digital using ADC. The LEDs and PDs are housed in a custom package that prevents light from traveling directly from the LED to the photodiode without first entering the smoke-detection chamber. The CN0537 board contains a 1.8 v voltage regulator because ADPD188BI operates with only a 1.8 volts supply voltage, and it communicates with the MCU using an SPI interface through a 3.3 to 1.8 v level translator chip. After every 4 s, the sensor activates the LEDs for a few microseconds and generates an interruption on its GPIO0 pin. This pin is connected with an MCU interrupt pin to wake it up from sleep mode. The CN0537 board also contains a low-power temperature and humidity sensor [37] and it is interfaced with the MCU using I2C.
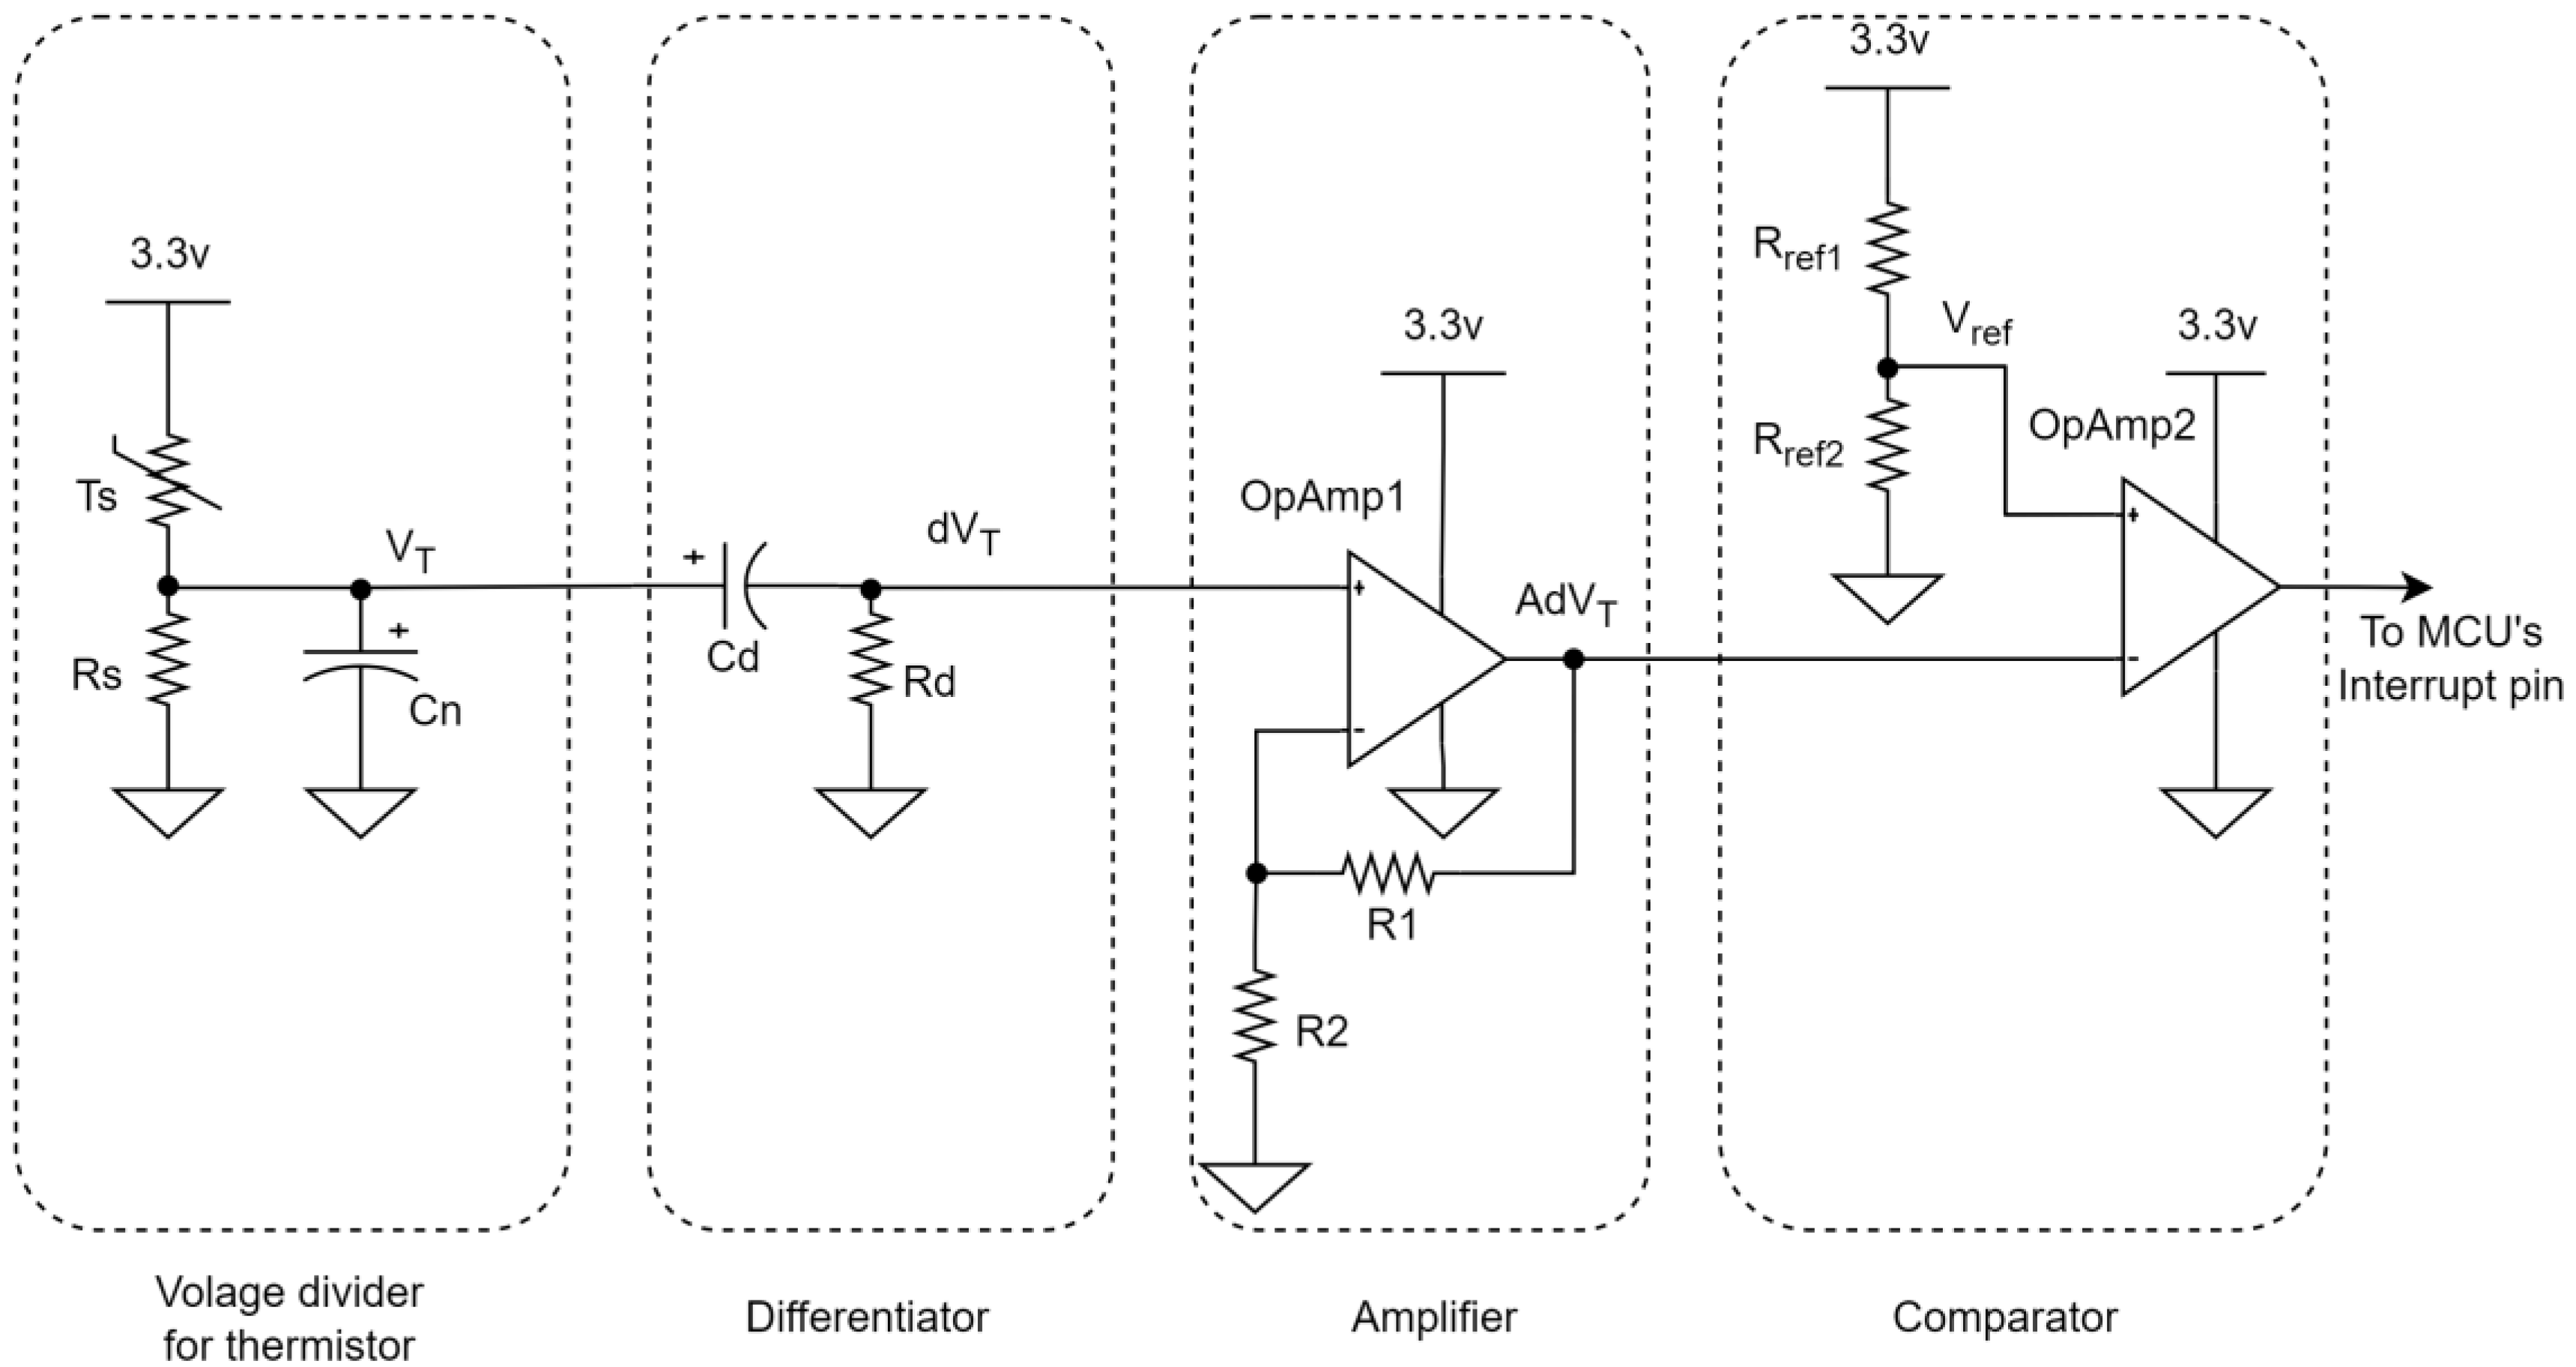
A sudden rise in temperature (SRT) is detected using a custom analog front-end (AFE) circuit, as shown in Figure 4, to detect a fire. The reason for this custom AFE is to keep the microcontroller in sleep mode to save power until it receives an interrupt signal—instead of continuously polling the temperature sensor data. The temperature in the forest slowly increases after the night and up to around noon, and then starts to gradually decrease. However, if there is a fire nearby, then the rate of the temperature increase will be much faster. The proposed SRT detector is designed via four stages: a voltage divider for the thermistor, differentiator, amplifier, and comparator. In the first stage, a thermistor [38], Ts, is used to sense the temperature. This thermistor has a negative temperature coefficient and its resistance value at 25 °C is 100 kΩ. A voltage-divider circuit, as shown in Figure 4, is implemented where Rs = 100 kΩ. The voltage, VT, increases with the increase in temperature. The capacitor Cn = 100 µF is used to filter out high-frequency noise. In the subsequent stage, the differentiator is implemented using an RC circuit [39] where Cd = 100 µF and Rd = 100 kΩ. The voltage across Rd, dVT, increases proportionally to the change in VT. If the temperature rapidly increases, then the slope of VT will be high and dVT will also significantly increase. In the subsequent amplifier stage, the dVT is amplified using a non-inverting amplifier. The amplifier is designed using the 1st op-amp of a nano-power single-supply voltage dual-operational amplifier [40] chip. In the amplifier, R1 = 100 kΩ and R2 = 10 kΩ; thus, gain A is 11. Then, the comparator compares AdVT with a threshold voltage Vref = 0.65 v using the 2nd op-amp. Vref is generated using a voltage-divider circuit where Rref1 = 2 MΩ and Rref1 = 1 MΩ. High-resistance values are chosen here to reduce the current-consumption. Whenever AdVT becomes greater than Vref, the output of the comparator shifts from high to low. This output is connected to the interrupt pin on the microcontroller and it signals the sudden increase in temperature.
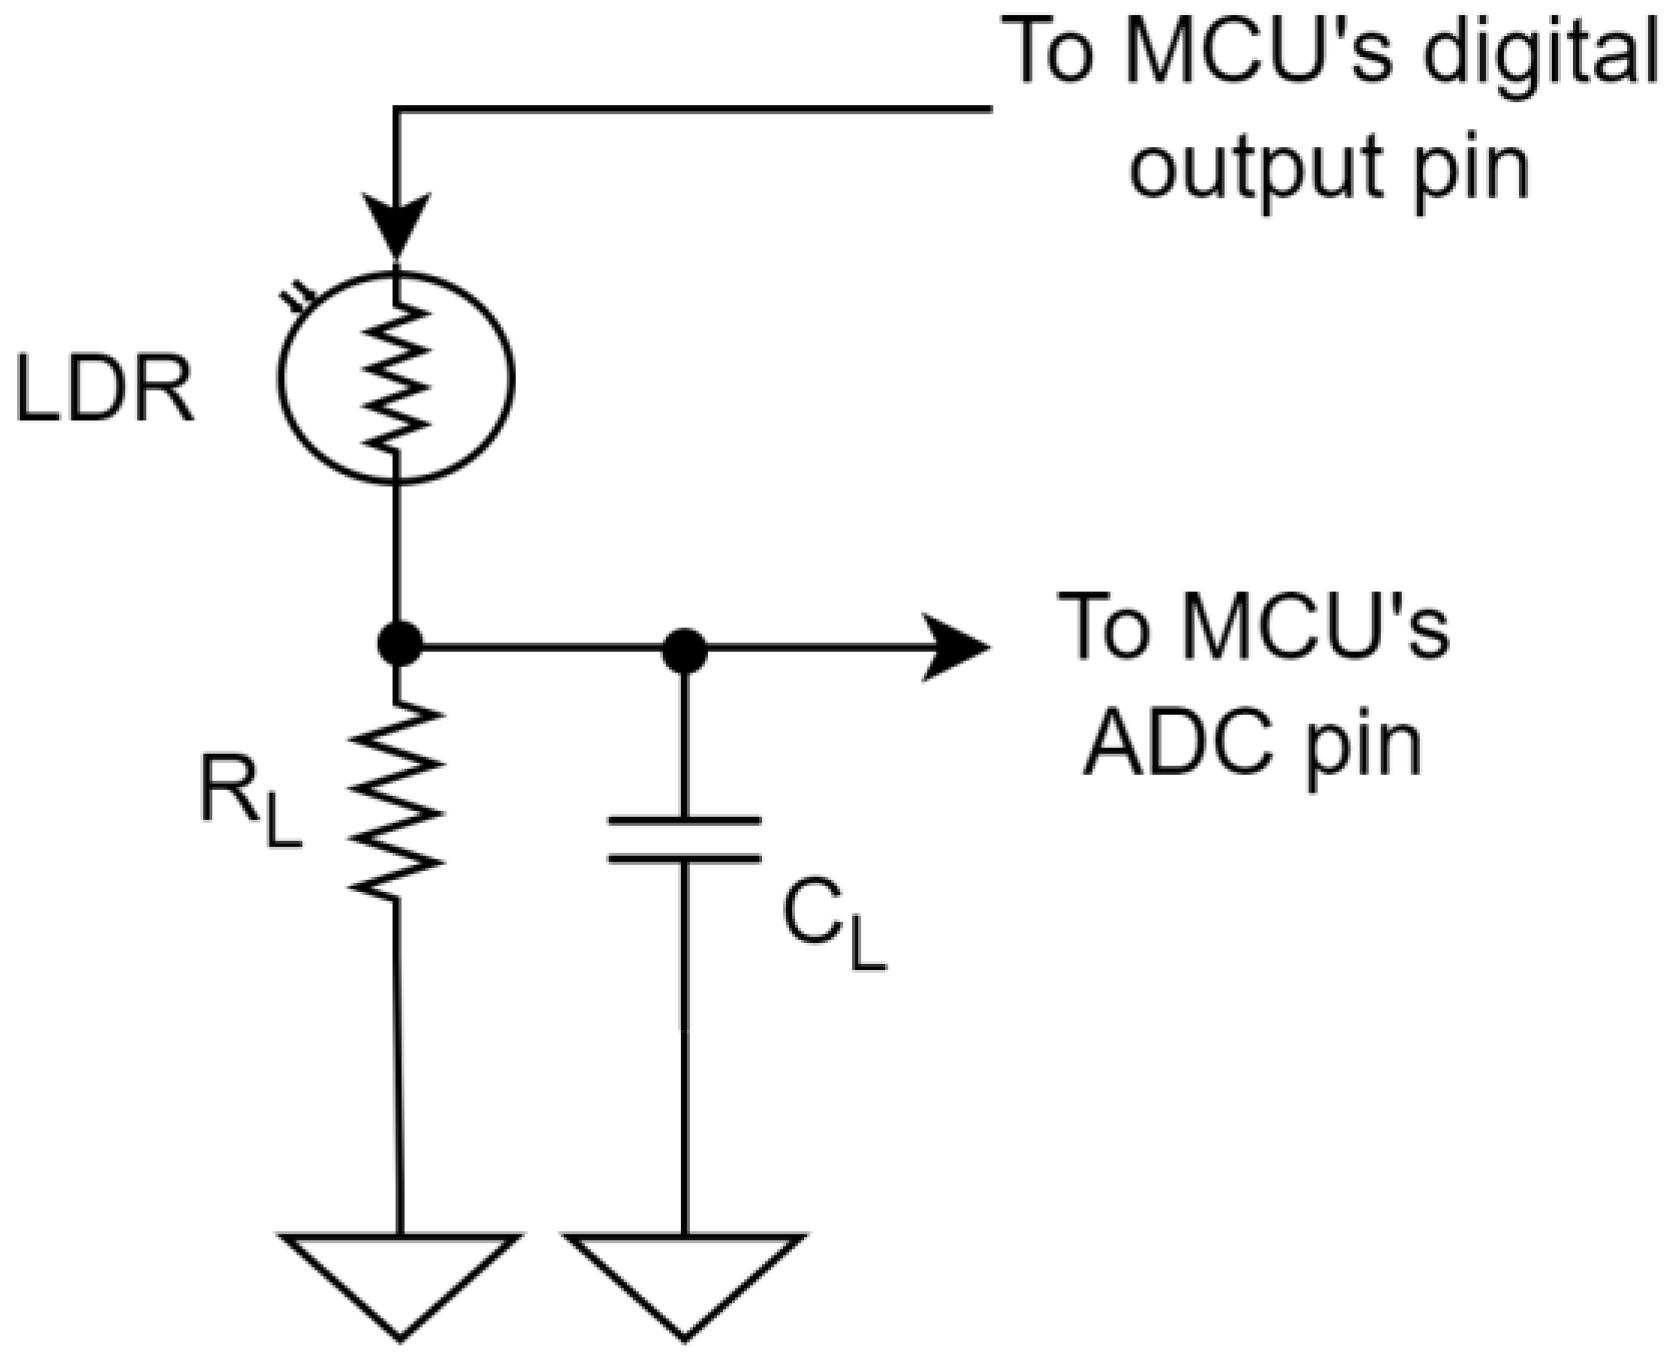
To detect the amount of light, a light-dependent resistor (LDR) [41] was used in a voltage-divider circuit, as shown in Figure 5. To avoid continuous current-consumption activity, the supply voltage of the circuit was generated from a GPIO pin in the microcontroller, which is only high when the light is measured. In the circuit, RL = 4.7 kΩ and the midpoint of the circuit was connected to an ADC pin in the MCU. To filter noises, CL = 0.1 µF was used.
2.1.2. Firmware
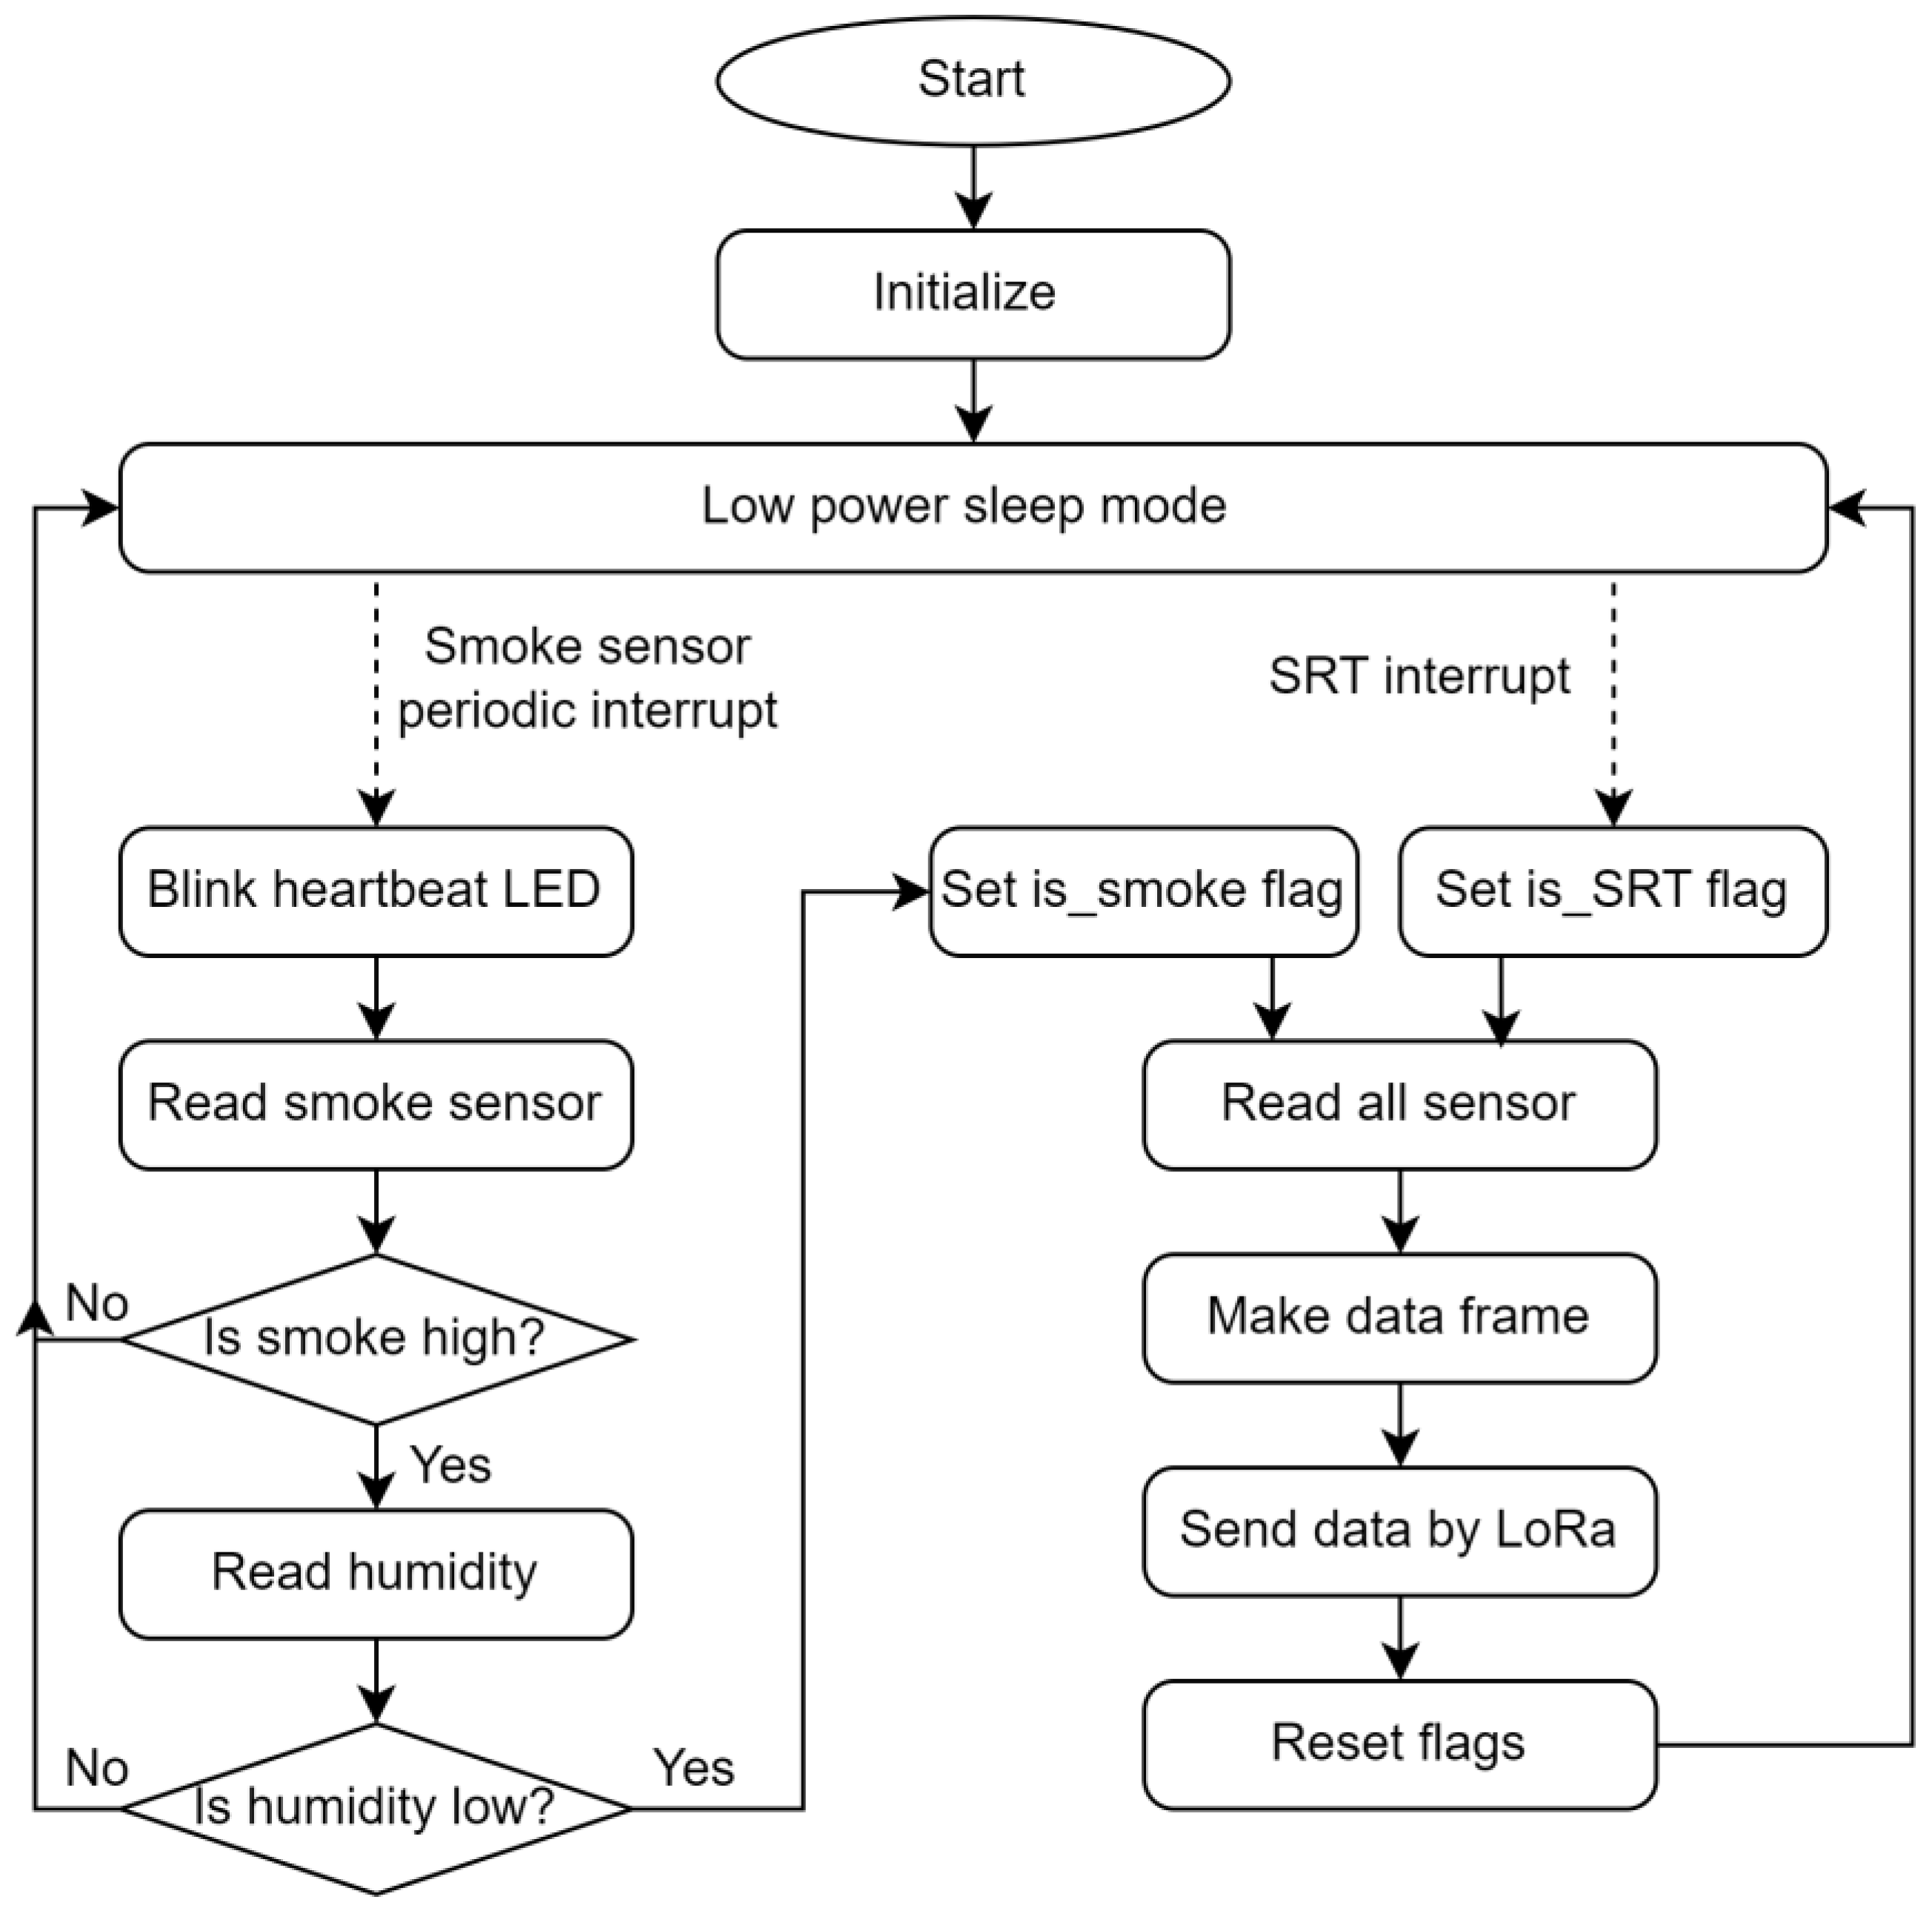
The flowchart of the sensor node firmware is shown in Figure 6. At the beginning, it initializes the sensors, GPIO pins, and interrupts the LoRa transceiver. The smoke sensor was configured to activate the sensing and generate a periodic interruption every 4 s. To sense smoke, the blue and IR LEDs were configured for time slots A and B, respectively. Both LEDs were set to full power, with 4 pulses in a time slot, and each pulse period at 15 µs. Photodetectors (PDs) were configured in the combined mode to increase the detection area [36,42]. To reduce power consumption, the USB hardware of the microcontroller was disabled. To reprogram the MCU, the Prog pin, as shown in Figure 2, was used. After resetting the MCU, holding the Prog button enables the USB hardware so that the program can be updated.
After initialization, the MCU and LoRa transceiver enter the low-power sleep mode and wait for an external interruption to occur to wake up. The MCU consumes the lowest amount of power in this power-down state, and it is implemented using the low-power library [43], which shuts down power from the ADCs, timers, and brown-out detector (BOD).
When the smoke-sensor periodic interruption occurs, the MCU exits the power-down mode, the heartbeat LED blinks for 30 ms, and then reads the smoke-sensor data. If any of the two smoke-sensor data—the two data corresponding to the blue and IR LEDs—exceed a threshold, this indicates the presence of smoke or fog. During the night and early morning, fog may be present in the forest and can generate a false alarm. To solve this issue, the humidity is checked. Fog occurs when humidity is very high—close to 100% [44]. During the day or in the case of a fire, the temperature increases and the humidity decreases. If the humidity is lower than a 90% threshold, only then is it treated as smoke. To avoid continuous notifications as long as smoke is present, a flag, is_smoke, is set to true, only when no smoke is detected in the last interruption.
When there is a fire nearby, the SRT interruption is triggered by the hardware, as shown in Figure 4, and the is_SRT flag is set to true.
If is_smoke or is_SRT is true, then the MCU reads all the sensor values: the temperature and humidity are read using I2C [45]; light and battery levels are read using ADC. Then, a data frame array of 6 bytes is created containing (1) SN; (2) light using 4 bits, is_Battery, is_SRT, and is_smoke using 3 bits; (3) smoke (blue); (4) smoke (IR); (5) temperature; and (6) humidity.
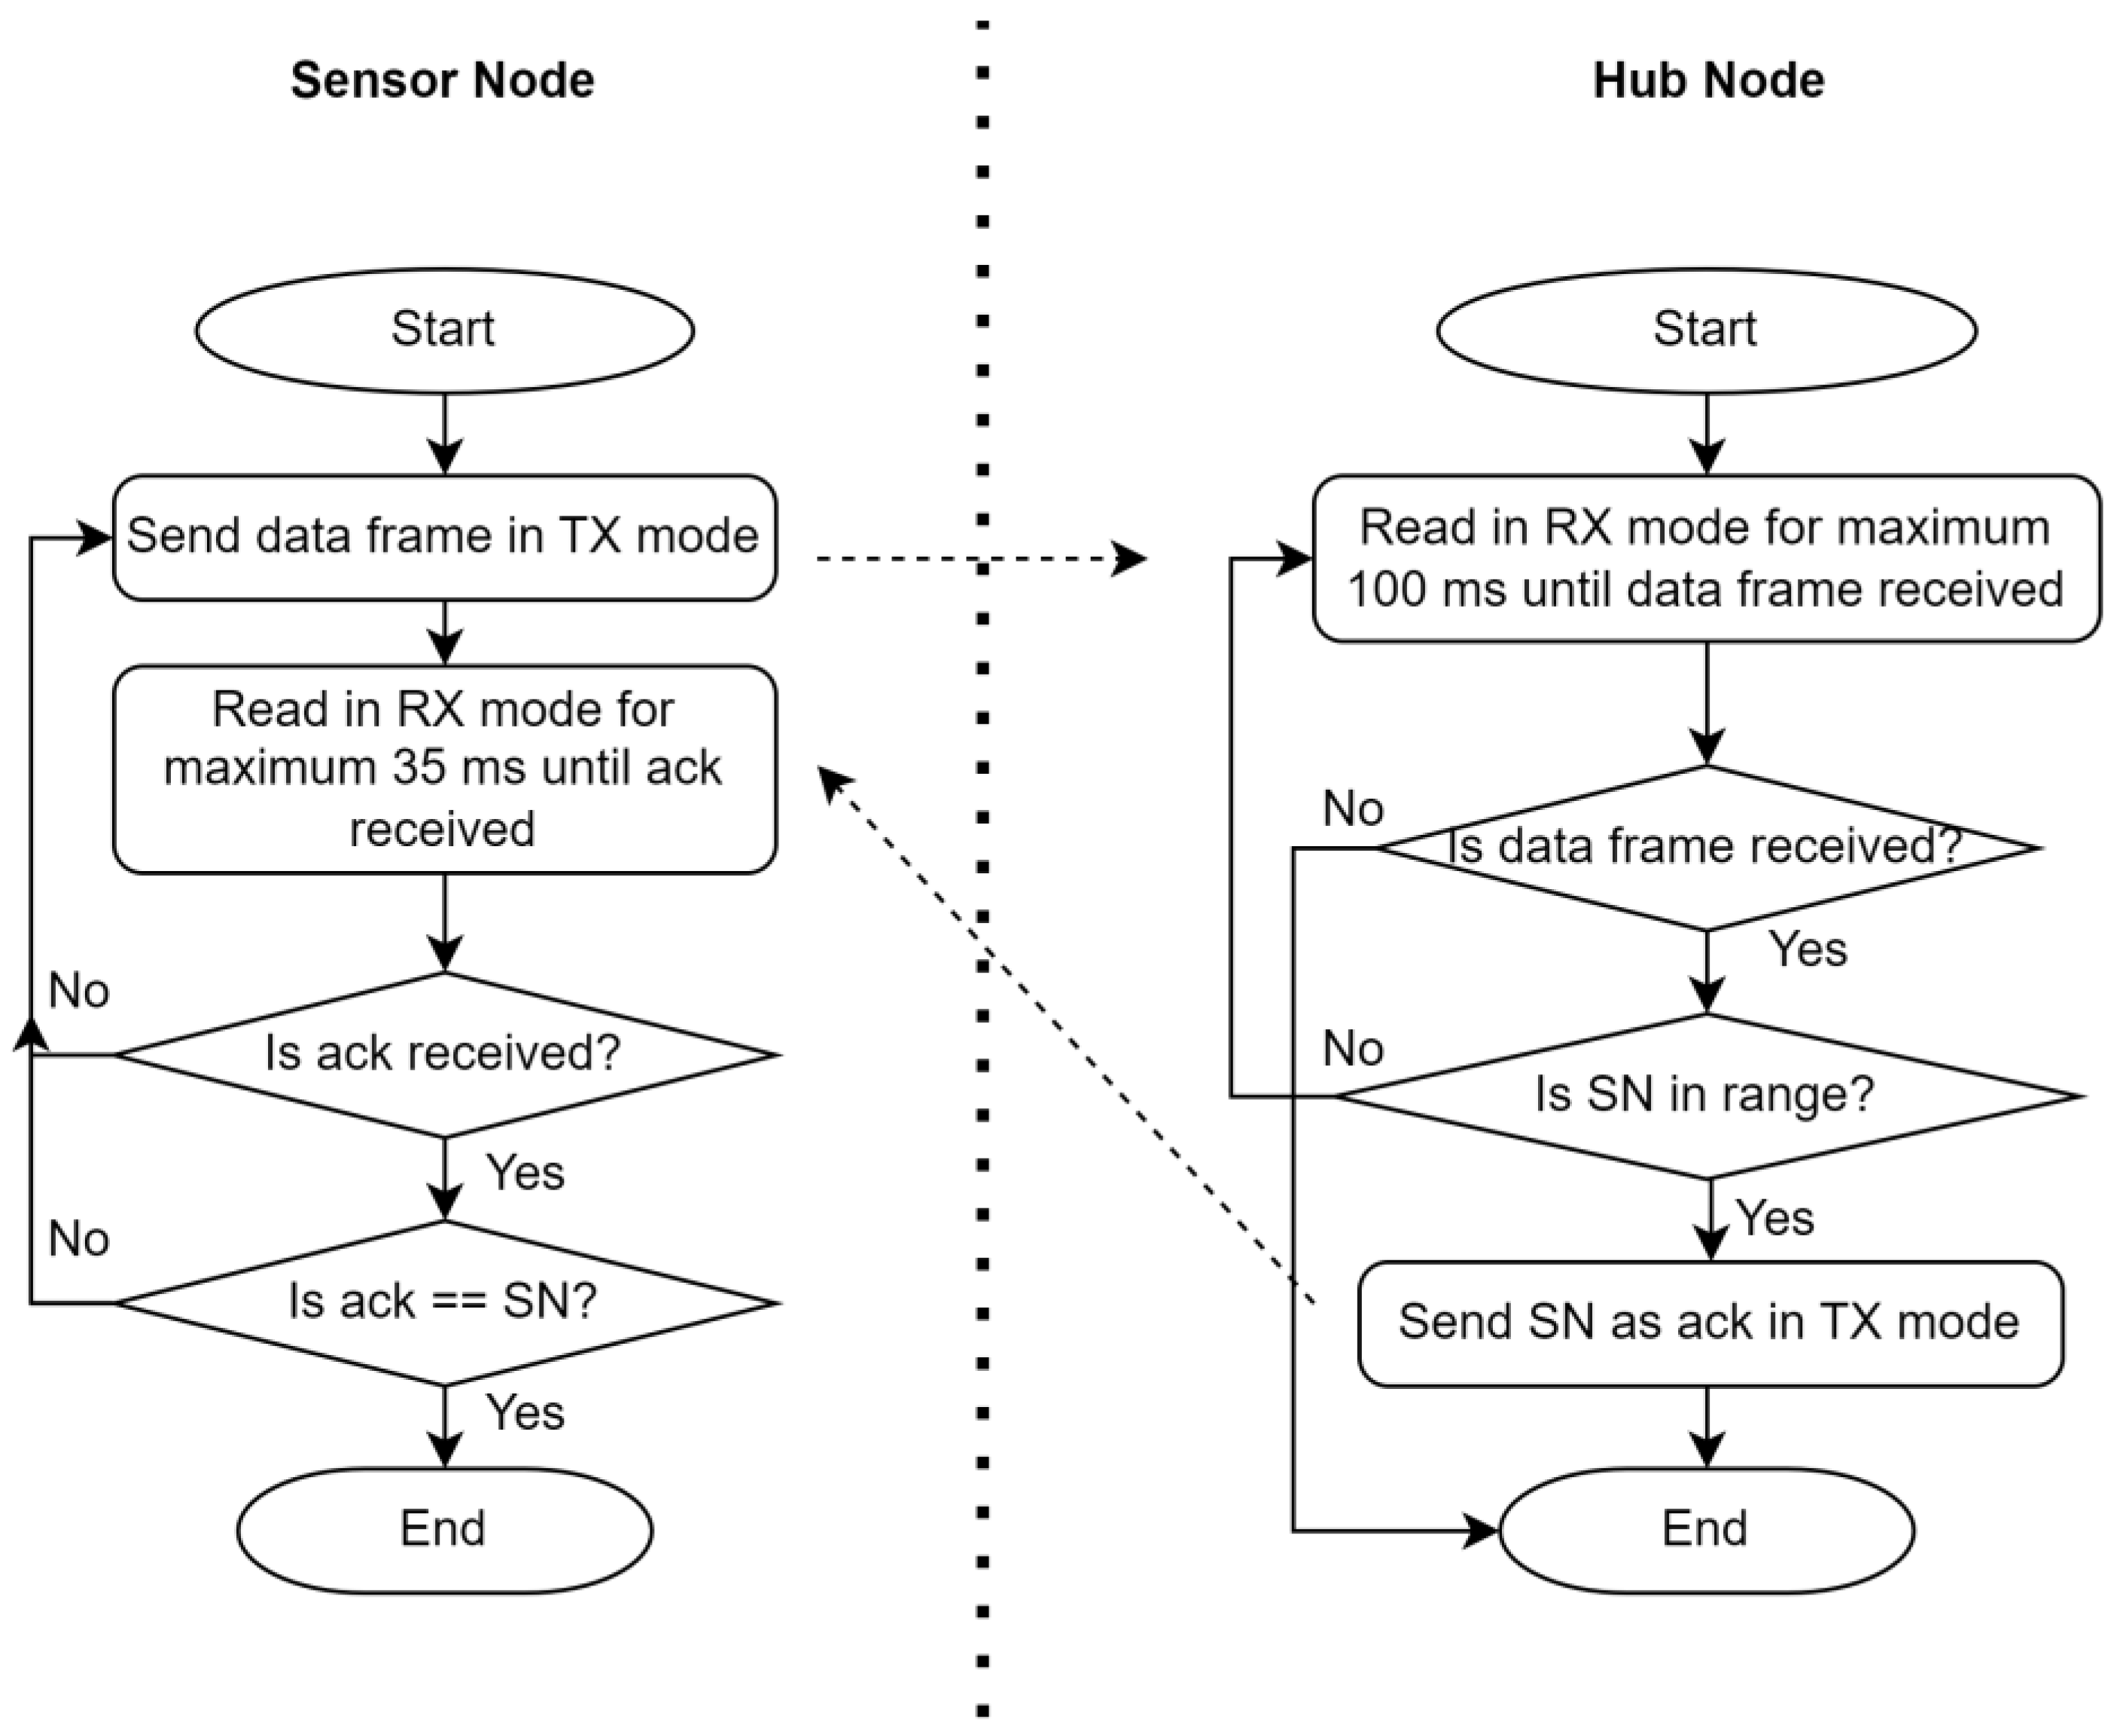
The data frame is then sent to the hub using the LoRa transceiver [46]. To reduce power consumption in the hub, a custom communication protocol is implemented both in the sensor and hub nodes, as shown in Figure 7. To instantly receive the data frame in the hub, the LoRa transceiver in the hub must always be in the receive mode. The receive mode, however, consumes a significant current—approximately 15 mA. To save power, the LoRa transceiver in the hub is set to receive mode for a time window of 100 ms after every 8 s in the sleep mode. After a smoke or SRT event, the sensor node continuously loops the data frame, until it receives an acknowledgment from the hub node. In the loop, the LoRa sends the data frame in transmit mode and then waits for 35 ms in the receive mode to obtain an acknowledgment byte from the hub using an Interrupt Service Routine (ISR). When the hub receives the data frame in the 100 ms window, it checks whether the SN is in its range using (1), and then sends an acknowledgment byte—which is the sensor node number—to the sensor node. When the sensor node receives an acknowledgment byte that matches its node number, it then sets a confirmation flag to true and exits the loop. In the flowchart in Figure 7, the sensor node steps are presented after a smoke or SRT event occurs, and the hub node steps are executed after every 8 s of sleep. After sending the data frame, the sensor node resets the is_smoke and is_SRT flags to false and returns to the low-power sleep mode.
2.2. Hub Node
The hub node receives a data frame from the sensor nodes whenever smoke or SRT is detected. It then sends a message to the central server using LTE cellular Internet. The hub node also gathers temperature, humidity, carbon dioxide, rain, and wind speed data after a regular interval—for instance, every 15 min—and sends these data to the central server once a day at midnight or after a fire event. These data can be used to predict wildfires using machine learning (ML) algorithms and can help to monitor the forest environment. The key design challenge of the hub unit is to make it consume as less power as possible—as it is powered by a battery and recharged using a solar panel. The hardware and firmware of the device are briefly described below.
2.2.1. Hardware
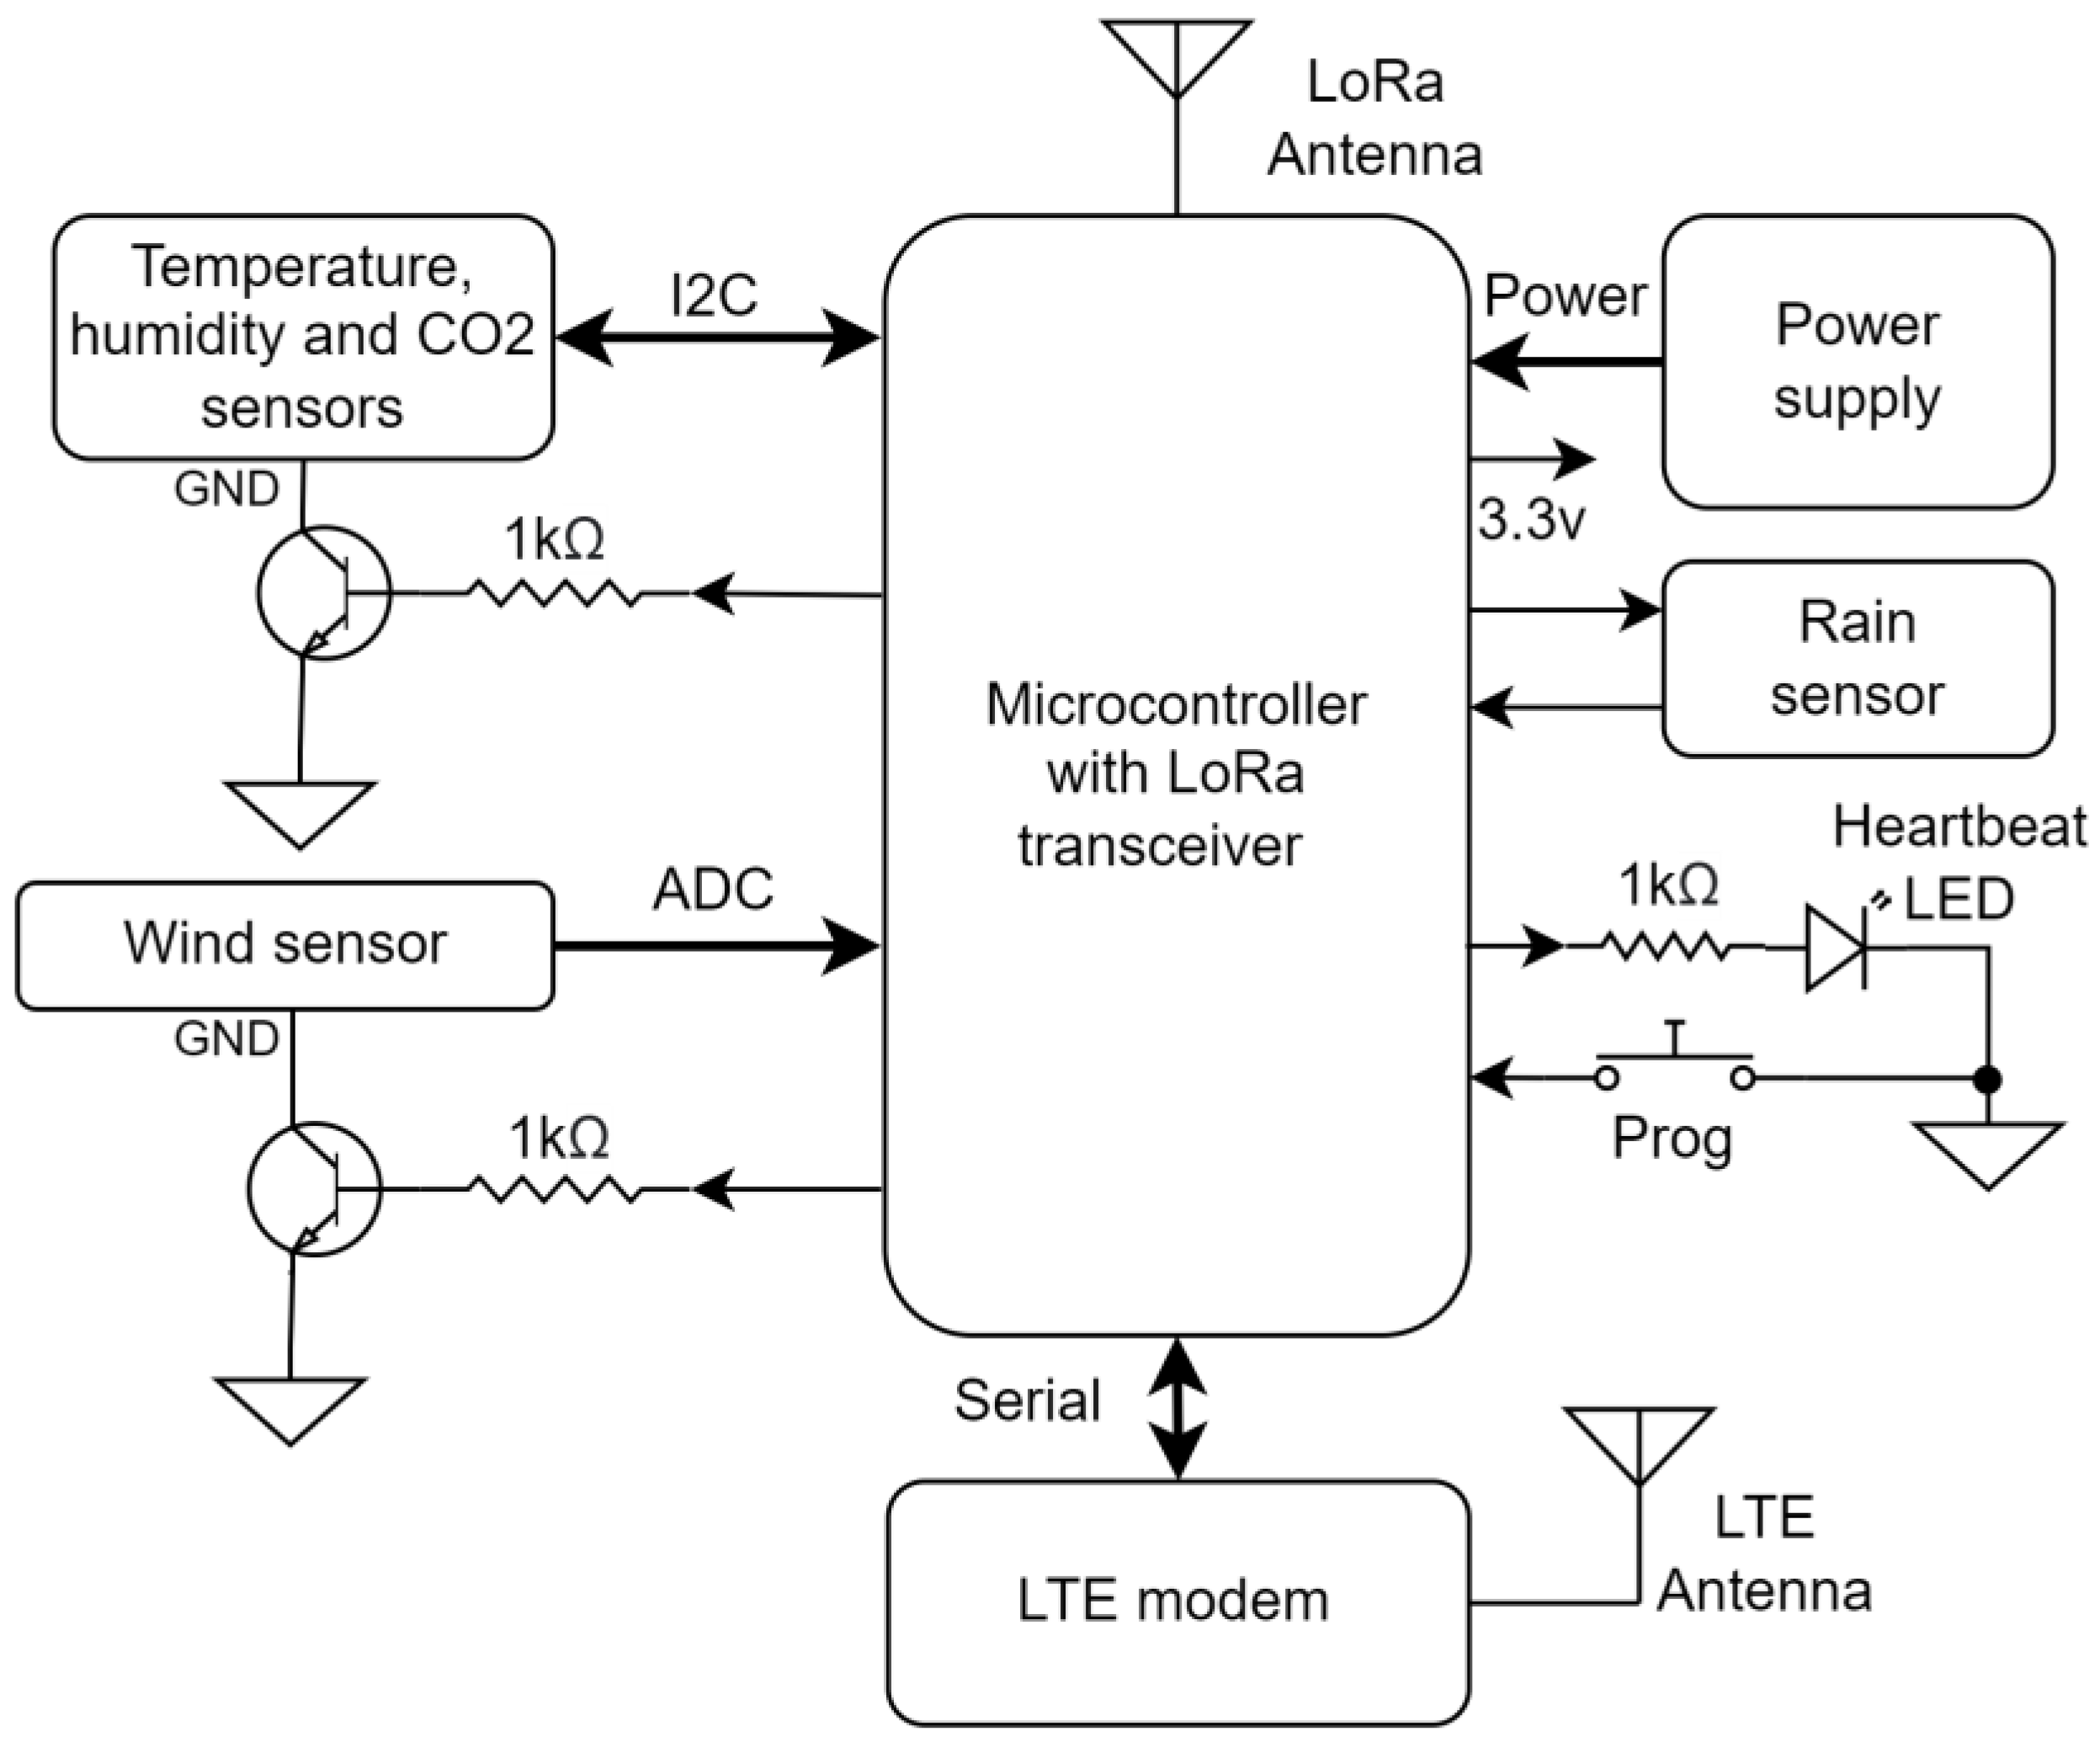
The block diagram of the hardware unit of the hub node is shown in Figure 8.
In the hub, a LoRa32u4 II development board [28] was used containing an Atmega32u4 [29] microcontroller for processing and an HPD13 915 MHz LoRa wireless transceiver module [30] for connecting to sensor nodes. The hub also contained a heartbeat LED to indicate the program was running and a Prog button to reprogram the MCU—after disabling the USB to save power. The power supply module of the hub node was similar, as shown in Figure 3, which was used in the sensor node. The only difference was a higher-power solar panel [47] having a 5 V output voltage, and a 5-watt charging power was used in the hub node.
To sense temperature, humidity, and CO2, an SCD30 [48] sensor was interfaced with the MCU using the I2C protocol. A wind speed sensor [49] was interfaced with the MCU using two ADC pins. It measures wind speed using a technique called “hot wire”. This technique heats a resistor to a constant temperature and then measures the electrical power that is required to maintain the temperature of the heated resistor as the wind changes. The wind speed is proportional to the heat (i.e., power) applied to the resistor. This sensor is much cheaper and a smaller size than spinning cup anemometers. To detect the presence of rain, a raindrop sensor [50] was interfaced with the MCU using GPIO pins. The sensor provides a logic low signal when rain is present.
The SCD30, wind speed, and rain sensors are only powered when sensing is required—after every 15 min. Power is cut off from them when they are not used to reduce the power-consumption. To connect and disconnect the SCD30 and wind speed sensor’s ground pin from the power supply, NPN transistors [51] were used. GPIO pins of the microcontroller, as shown in Figure 8, control the base of the transistors. The base current flows only for a few seconds during stabilization and sensing, and then the current is turned to zero by changing the GPIO pin to a low setting—to cut off the power from the sensors. The power supply of the rain sensor is directly provided from a GPIO pin by changing it to high, and the GPIO pin can supply an adequate current to operate the sensor.
The SIM7000 LTE shield [22] was used to send data using cellular Internet to the central server. It supports LTE CAT-M and NB-IoT technology, and its ultra-low-power consumption is perfect for battery- and solar-powered IoT devices. The shield is interfaced with the MCU using a serial protocol. An IoT data subscriber identity module (SIM) card [52] was used with an LTE modem, and its pilot plan provides 1 MB of free data per month. To reduce power consumption, the shield was activated only once a day for a few seconds and it was kept in the power-off mode that consumes less than an 8 uA current. When connecting with the cellular network, the LTE modem needs a spike current of around 500 mA for a few milliseconds—which could be high for LDO voltage regulators. To solve this, the shield was powered directly from the 3.7 v battery pins without using the LDO voltage regulators. Additionally, a large 2200 µF capacitor was connected to its power supply pin in parallel—to help supply the spike current. The onboard temperature sensor of the shield was removed to save a 200 uA current [53].
2.2.2. Firmware
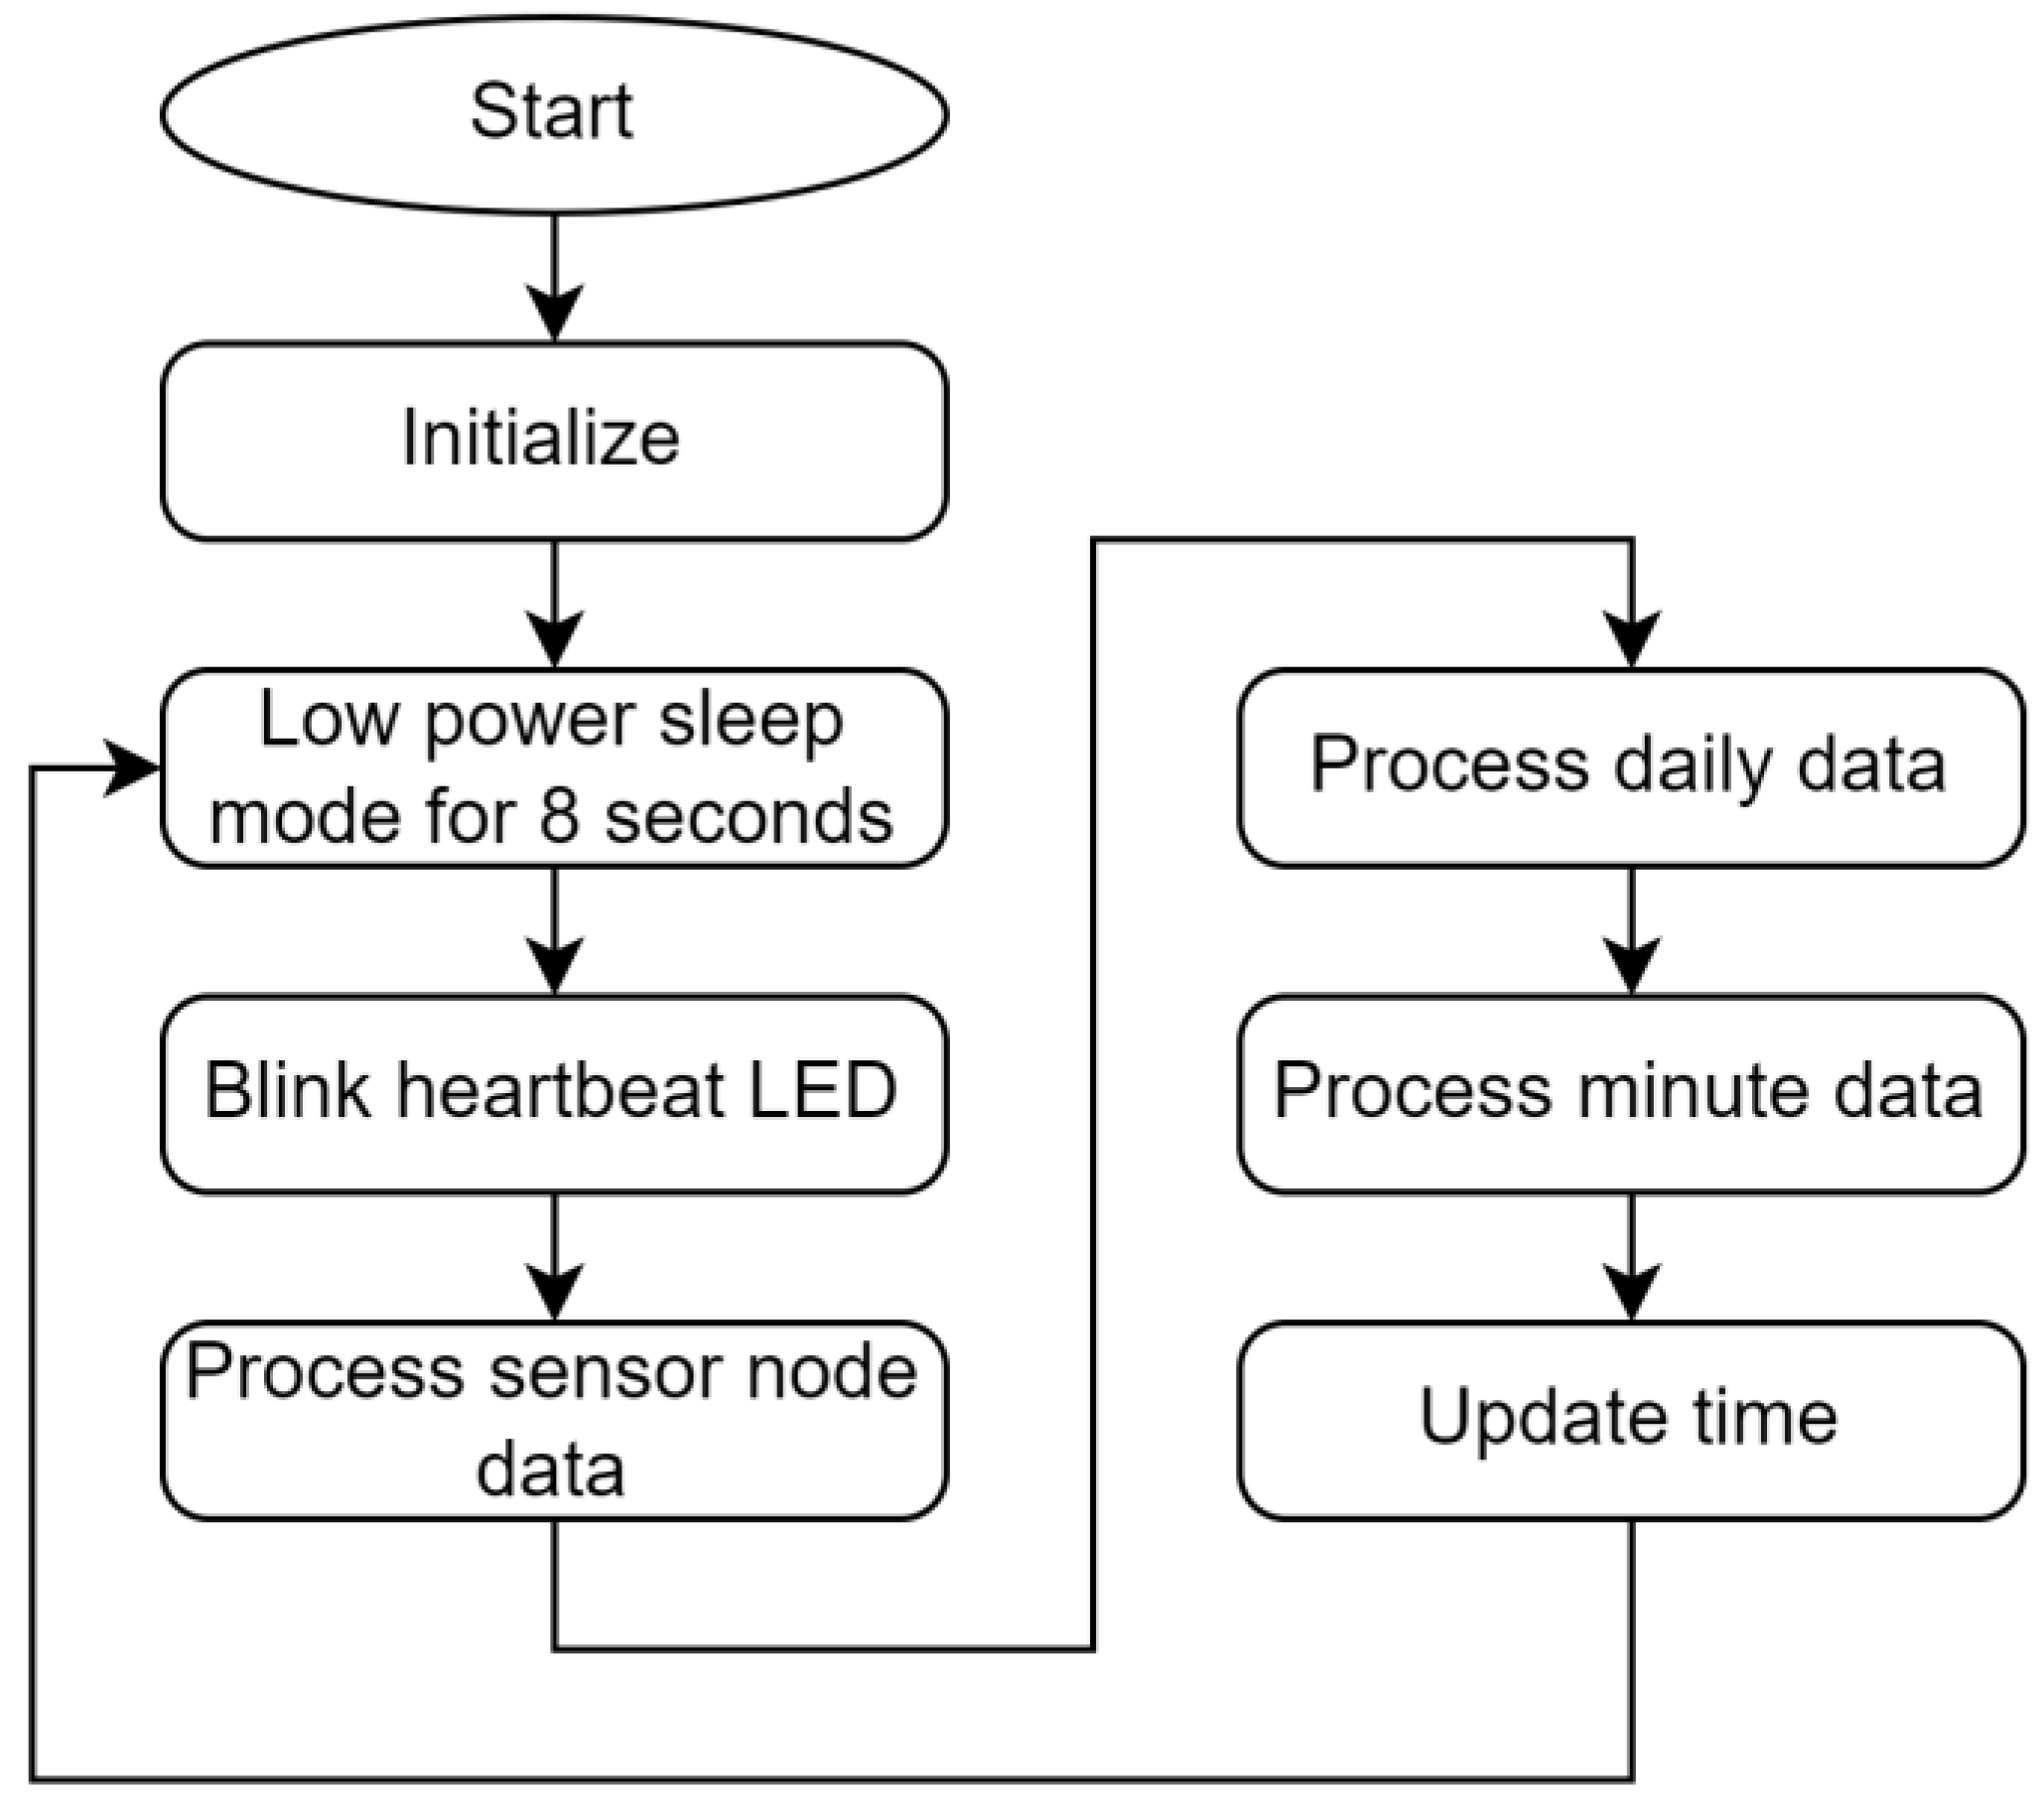
The flowchart of the hub node firmware is shown in Figure 9. At first, it initializes the sensors, GPIO pins, and the LoRa transceiver. The hub node keeps track of the current time, and to initialize the hour, minute, and second variables, it registers with the cellular network using the LTE modem, obtains the current time from the network to initialize the time variables, disconnects from the network, and turns off the modem. To reduce the power consumption, the USB hardware of the microcontroller was disabled. The reprogramming can be performed by holding down the Prog button after a reset, which re-enables the USB hardware.
After initialization, the MCU and LoRa transceiver enter the low-power sleep mode and wake up after 8 s. The MCU consumes the lowest power current in this power-down state, and it is implemented using the low-power library [42], which shuts down power from the ADCs, timers, and brown-out detector (BOD).
When the MCU wakes up after 8 s, the heartbeat LED blinks for 30 ms, and then processes any data obtained from any sensor node through the LoRa transceiver using the custom low-power protocol—as explained at the end of Section 2.1.2 and in Figure 7. If the hub receives the data frame in the 100 ms window from the sensor node, it then checks whether the SN is in its range using (1) and sends an acknowledgment byte to the sensor node. Opening a 100 ms receive window instead of continuously being in receive mode reduces the power consumption of the LoRa transceiver by around 98.76%, by compromising a maximum of 8 s of data latency. Then, it creates a sensor data frame of 9 bytes containing 6 bytes from the sensor node and adding 3 bytes for hour, minute, and second. The 6th bit of the first byte, which contains the SN, is set to indicate it is a sensor node data frame. Then, it sends this data frame to the central server using the cellular network. To achieve this, the MCU powers the LTE modem, registers with the “hologram” network, and then connects to the central server’s IP address and port and sends the data frame using the TCP/IP protocol using LTE CAT-M1 technology [54]. It then sends all the data frames that were gathered every 15 min (discussed in the following paragraph), synchronizes the time variables with the network time, and then turns off the LTE modem.
The hub node gathers temperature, humidity, carbon dioxide, rain, and wind speed data after a regular interval—for instance, every 15 min—and then sends these data to the central server once a day at midnight or after a fire event. This acquisition of data from its sensors after every minute, DATA_PERIOD_MIN = 15, is referred to here as the minute data. If the modulus between the minute and DATA_PERIOD_MIN is zero AND the isMinDataStored flag is false, then the MCU powers the wind speed and SCD30 sensors by making the GPIO pins high that connect with the base of the transistors, and the MCU shifts from a normal to power-up state. The purpose of the power-up state is the requirement that these sensors need a certain amount of time after applying a stable power supply, such as around 10 s for the wind sensor, before they can output valid sensor data. After powering up, the MCU then reads all the sensor data, one bit from the rain sensor using the GPIO pin; the battery level using ADC and sets a Boolean variable if the battery is higher than a threshold; temperature, humidity, and CO2 levels form SCD30 [55]; and the wind speed [49,56]. These sensor data are then appended in a 2D unsigned byte array where each row contains minute data. The array has total DM ÷ DATA_PERIOD_MIN rows, where DM is the total minutes in a day, i.e., 24 × 60, and a total of 9 columns. Each row contains 9 bytes: (1) HN; (2) temperature; (3) humidity; (4) high byte for CO2; (5) low byte for CO2; (6) wind speed; (7) hour using 5 bits, isLastRow and isRain using 2 bits; (8) minute using 6 bits and 1 bit for the battery OK—isBat; (9) second using 6 bits and 1 bit for a flag indicating it is the daily data at midnight—isDailyData. It then removes power from the sensors, sets isMinDataStored as true, and enters the normal state.
The hub node sends the stored minute data to the central server if the hour is 12 am (i.e., 0 in 24 h format) AND the minute matches its HN number AND the isDailyDataSent flag is false. To avoid all hubs sending data at the same time, each hub sends its daily data during the minute that matches its HN. Before sending the data, the isDailyData bit in the 9th byte is set to true for all the minute data to differentiate whether these minute data are daily data at midnight or the minute data obtained after a fire event; the isLastRow bit in the 7th byte is set to true for only the last row of the minute data to signal the end of daily data transmission to the central server. The LTE modem’s TCP data transmission function can send a maximum of 256 bytes as a single data chunk; thus, it can send 256 ÷ 9 = 24 rows of minute data in a single function call. Using a loop, all the data rows are transmitted—each containing 24 data rows, and the last transmission contains the remaining data rows that might be less than 24 rows. Subsequently, the MCU then synchronizes the time variables with the network time, turns off the LTE modem, and sets the isDailyDataSent flag to true. Note that the daily data are processed before the minute data, as shown in Figure 9, so that the minute data gathered at 12 am are stored to be sent the following day.
To keep track of accurate timing, the time variables—hour, minute, second, and µ-second—are updated at the end of the program loop. The execution time of the main program loop, as shown in Figure 9, is measured with microsecond accuracy with another MCU by measuring a pulse duration [57], and the µ-second variable is updated with the measured value at the end of the loop. When the µ-second becomes greater than 1,000,000, the second is incremented by the quotient, and the µ-second variable is updated with the remainder of the division: (µ-second ÷ 1,000,000). If the second becomes greater than 60, the minute is incremented by 1, and 60 is subtracted from the second variable. Here, the isMinDataStored flag is set to false if the modulus between the minute and DATA_PERIOD_MIN is 1—thus, the next minute data can be saved. Extra time is spent in the loop after every 15 min to power up and read the sensors. This extra time is also measured with microsecond accuracy and adjusted here by adding it to the µ-second. According to the standard clock algorithm, if the minute becomes 60, then it is set to 0, and the hour is incremented by 1. Here, isDailyDataSent flag is set to false when the hour is 1, so the next day’s daily data can be sent. The hour is reset to 0 when it becomes 24. Note that the program synchronizes its time variables with the cellular network time during a fire event and at midnight when it uses the LTE modem. Thus, time is synchronized with the network time at least once a day and it keeps the time accurate. Neither a real-time clock chip is used nor is a continuous connection with the cellular network maintained to reduce power consumption.
2.3. Cerntral Server Software
The software at the central server was developed using Visual C# and Microsoft SQL Server databases [58]. Using a graphical user interface (GUI), the user can configure the latitude and longitude information for each sensor and hub node. These data are saved in SensorNodeInfo and HubNodeInfo tables, namely, in the SQL database [59]. To send smartphone notifications to the firefighters in the event of a fire, each firefighter’s name, address, phone, email, and Firebase Cloud Messaging (FCM) registration token [60] are entered using a GUI and stored in the FireFighterInfo table in the database. A unique FCM token is generated for each firefighter when the person installs the smartphone app.
The software implements a Transmission Control Protocol (TCP) server [61], instead of a Hypertext Transfer Protocol (HTTP) server, to keep the data transmission bytes from the hub node low because HTTP contains more headers than TCP. To access the server by the hub node, it should have a fixed public IP and an open port. The public IP of the router, assigned by the Internet Service Provider (ISP), does not change frequently, and it is used as the fixed public IP. To transmit the data packet that arrives at the router from the Internet to our custom TCP server, the local IP of the server computer was made static and port forwarding [62] was configured in the router. The port number was also opened in the Firewall settings [63].
When the TCP data arrives at the opened port, the software utilizes 9 bytes, which is the length of a single data frame, at a time in a loop until all the data frames are processed. In the processing phase, the data are parsed; saved in variables; and stored in the database tables—SensorNodeData and HubNodeData—depending on whether it is a sensor or minute data frame. The data acquisition date, arrival date, and arrival time are set on the server by assigning them to the current date and time. However, for the minute data that was sent just after midnight (i.e., isDailyData is true), one day was subtracted as these data were collected on the previous date in the hub.
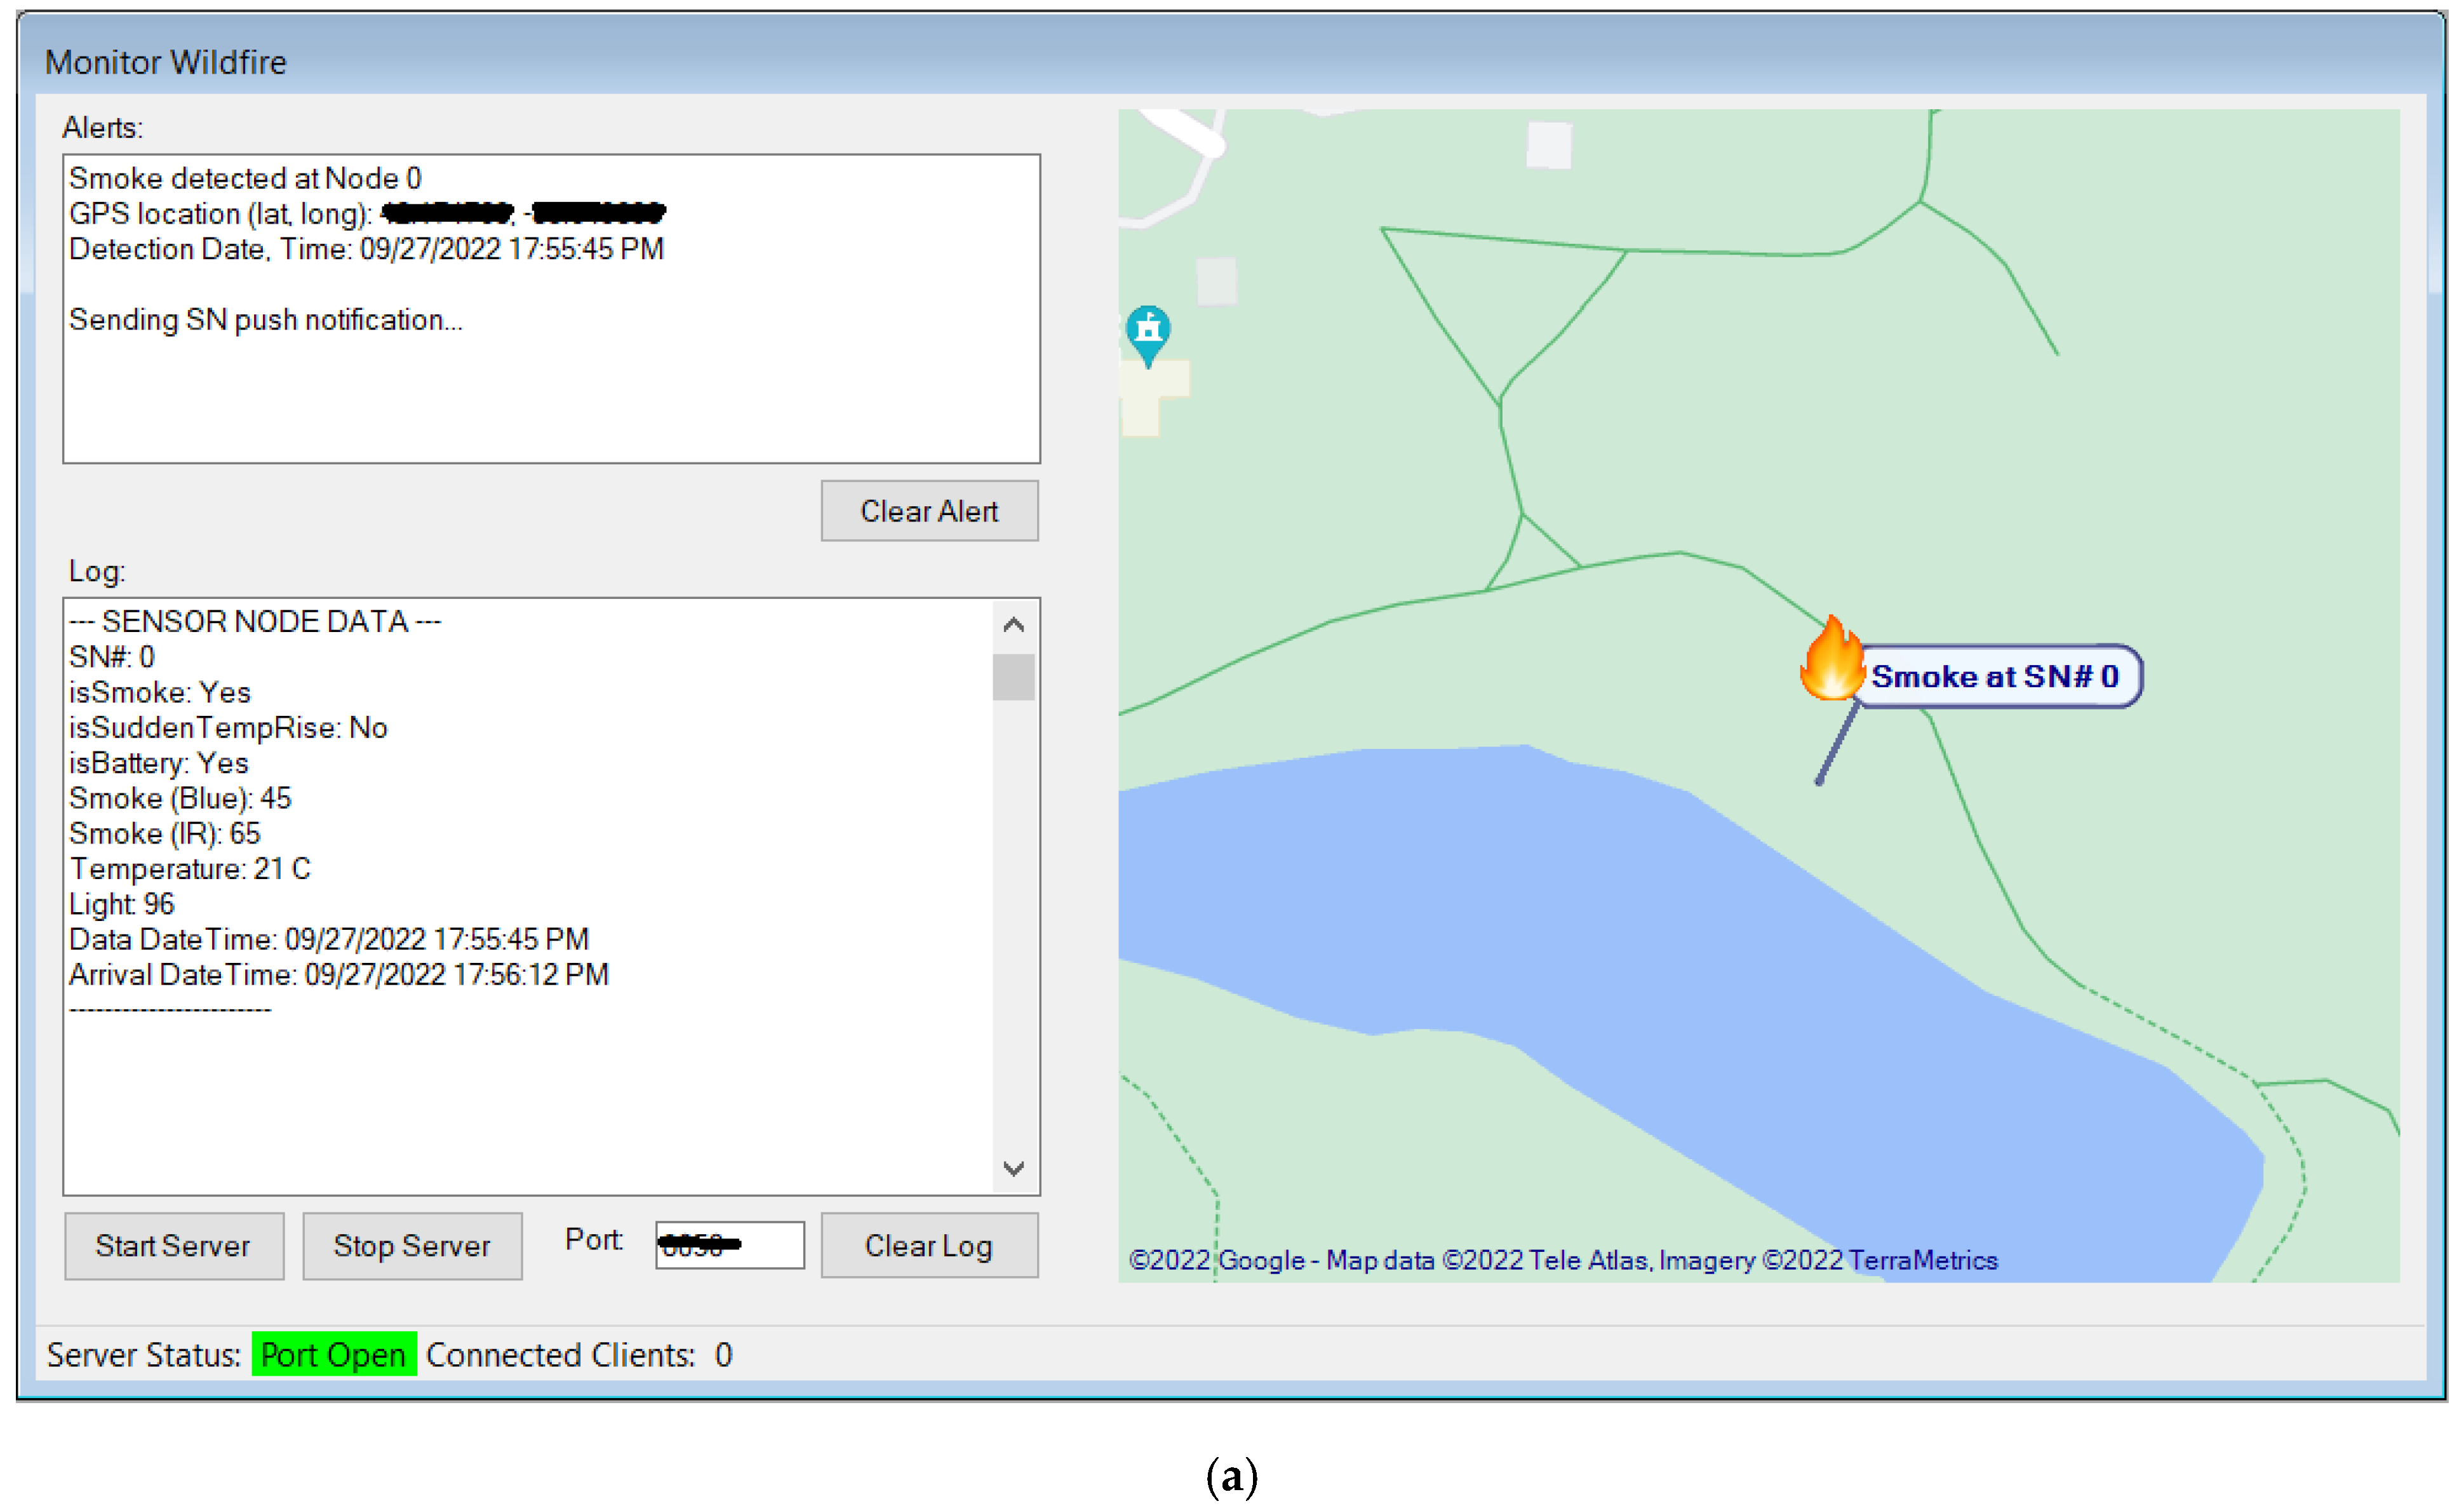
If the data are a sensor data frame and a fire event occurred (i.e., is_smoke or is_SRT is true), then the latitude and longitude for the sensor node are queried from the database; plotted on the map with a marker [64]; smoke presence or sudden temperature increase messages are displayed; a warning sound is generated; and FCM push notifications [65] are sent to all the firefighter’s smartphones. To send the push notifications, the FCM registration tokens are queried from the database for each firefighter, and notifications are sent to each of them. Each notification contains SN or HN numbers; isSensorNode indicating sensor node data if true; is_smoke; is_SRT; isDailyData; latitude; longitude; and data acquisition date and time.
If the data are a minute data frame and it is the last row of the minute data that is sent after midnight (i.e., isDailyData and isLastRow are true), then an optional push notification is sent to the firefighters confirming the daily minute data at midnight was received successfully.
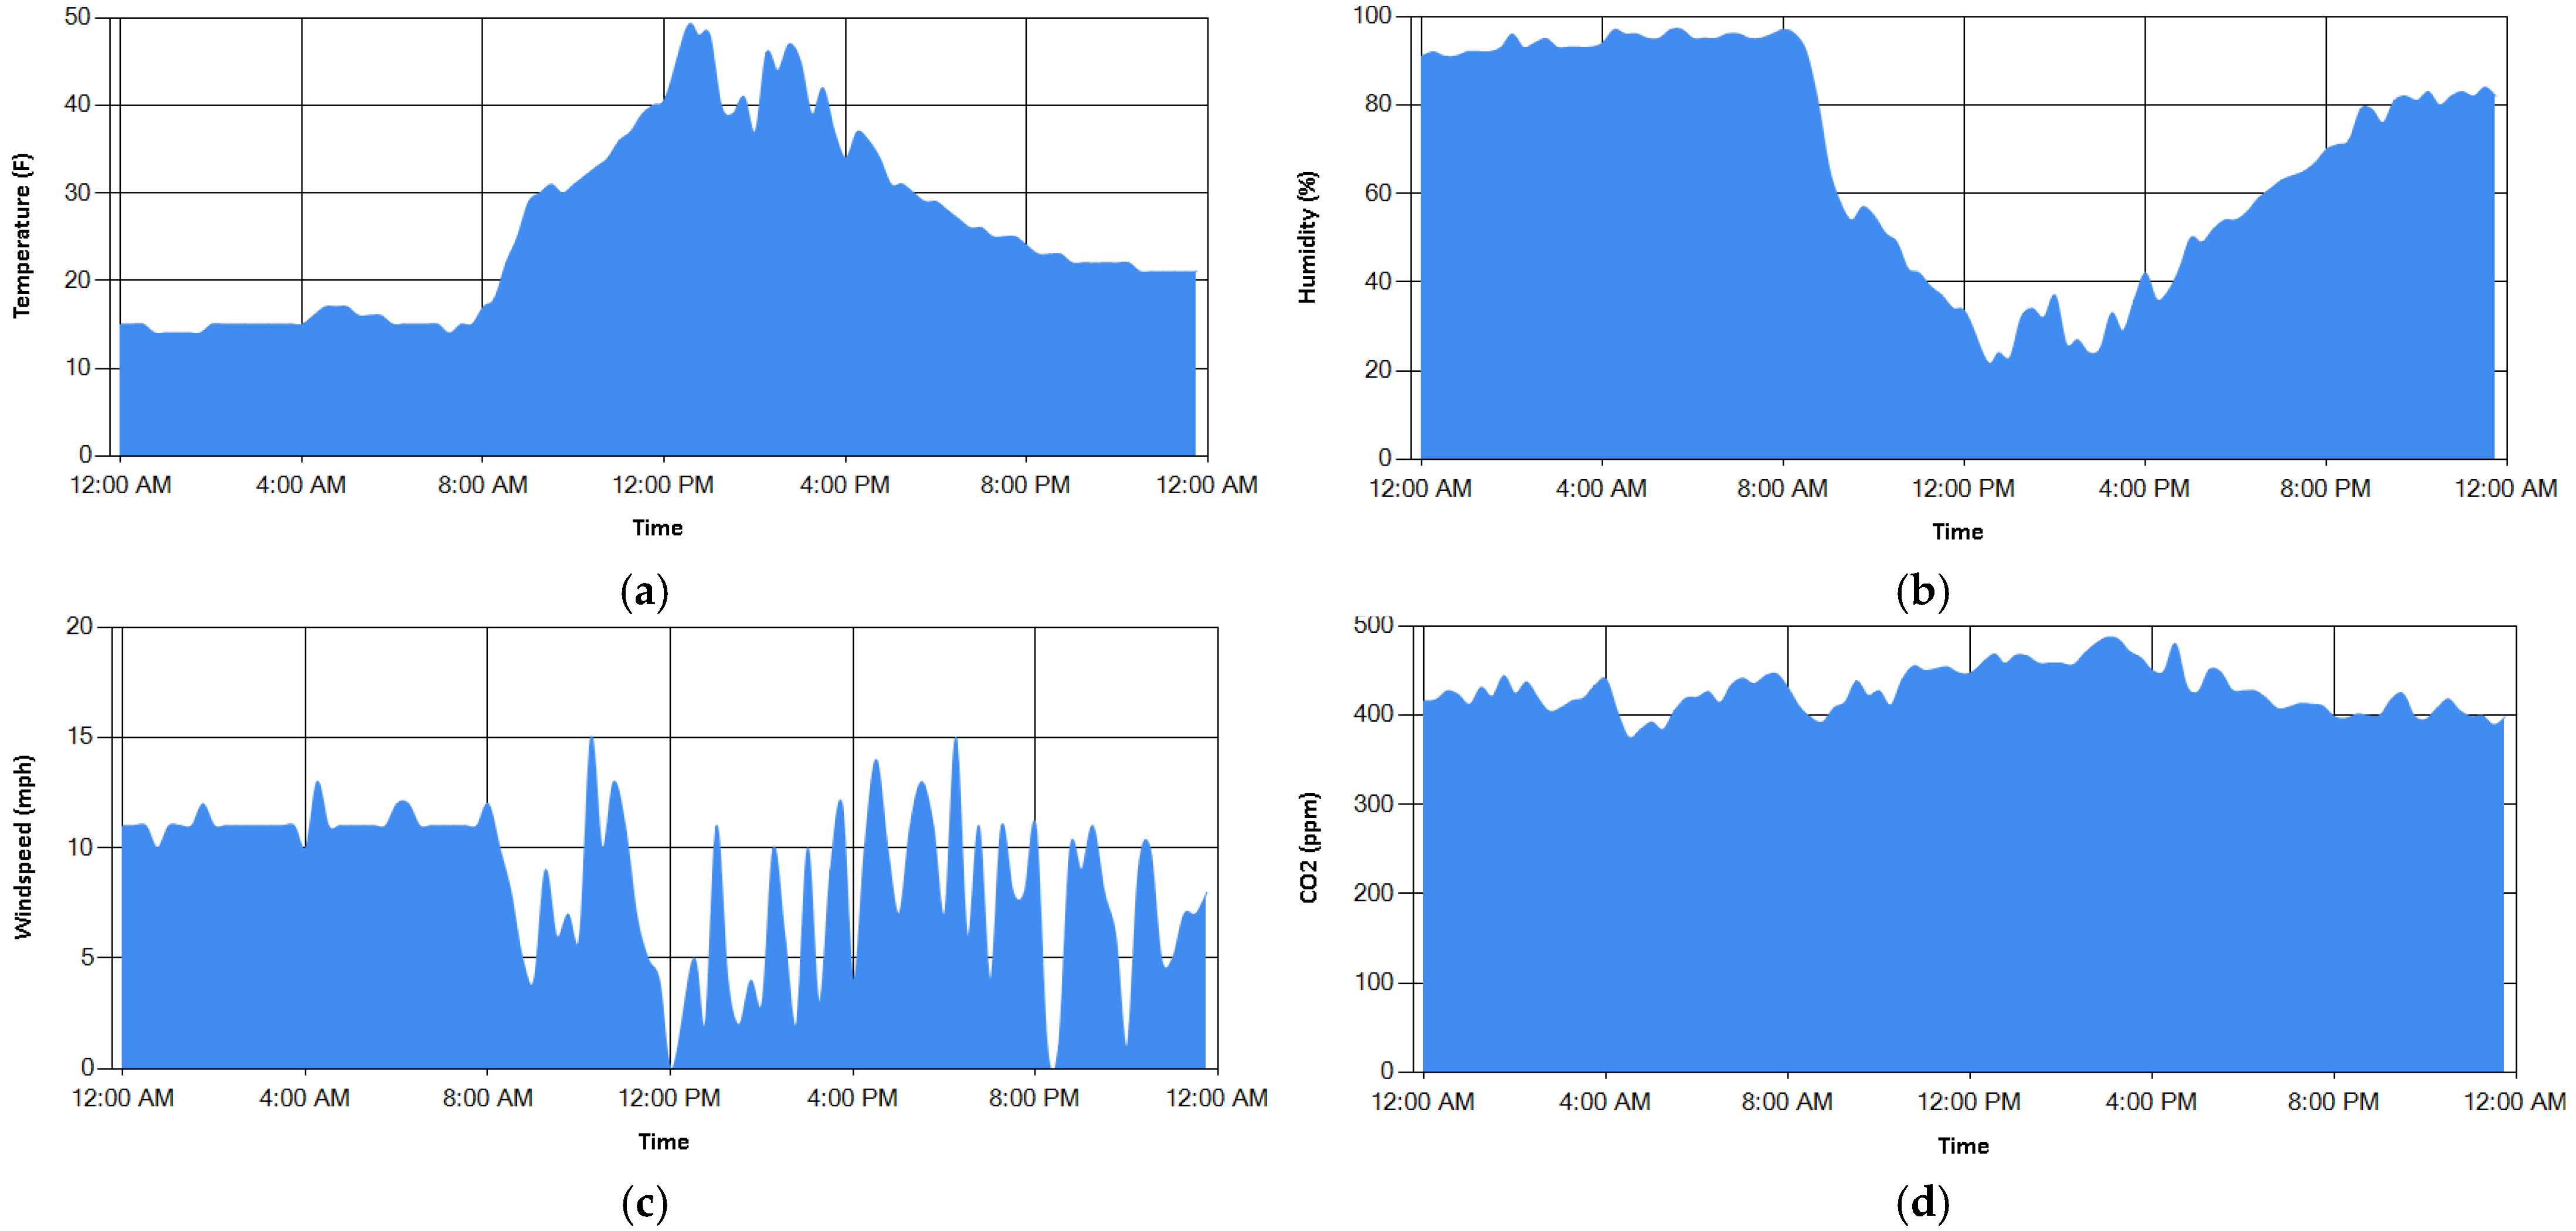
To visualize the data as a chart, the software implements a GUI where the user can choose the sensor or hub node numbers, the data, such as temperature, and the date. An SQL query is made based on this information and the resulting data are retrieved from the database. Then, the result is plotted as column charts, where the X axis is the 24 h time of the chosen date and the Y axis is the data.
2.4. Smartphone App
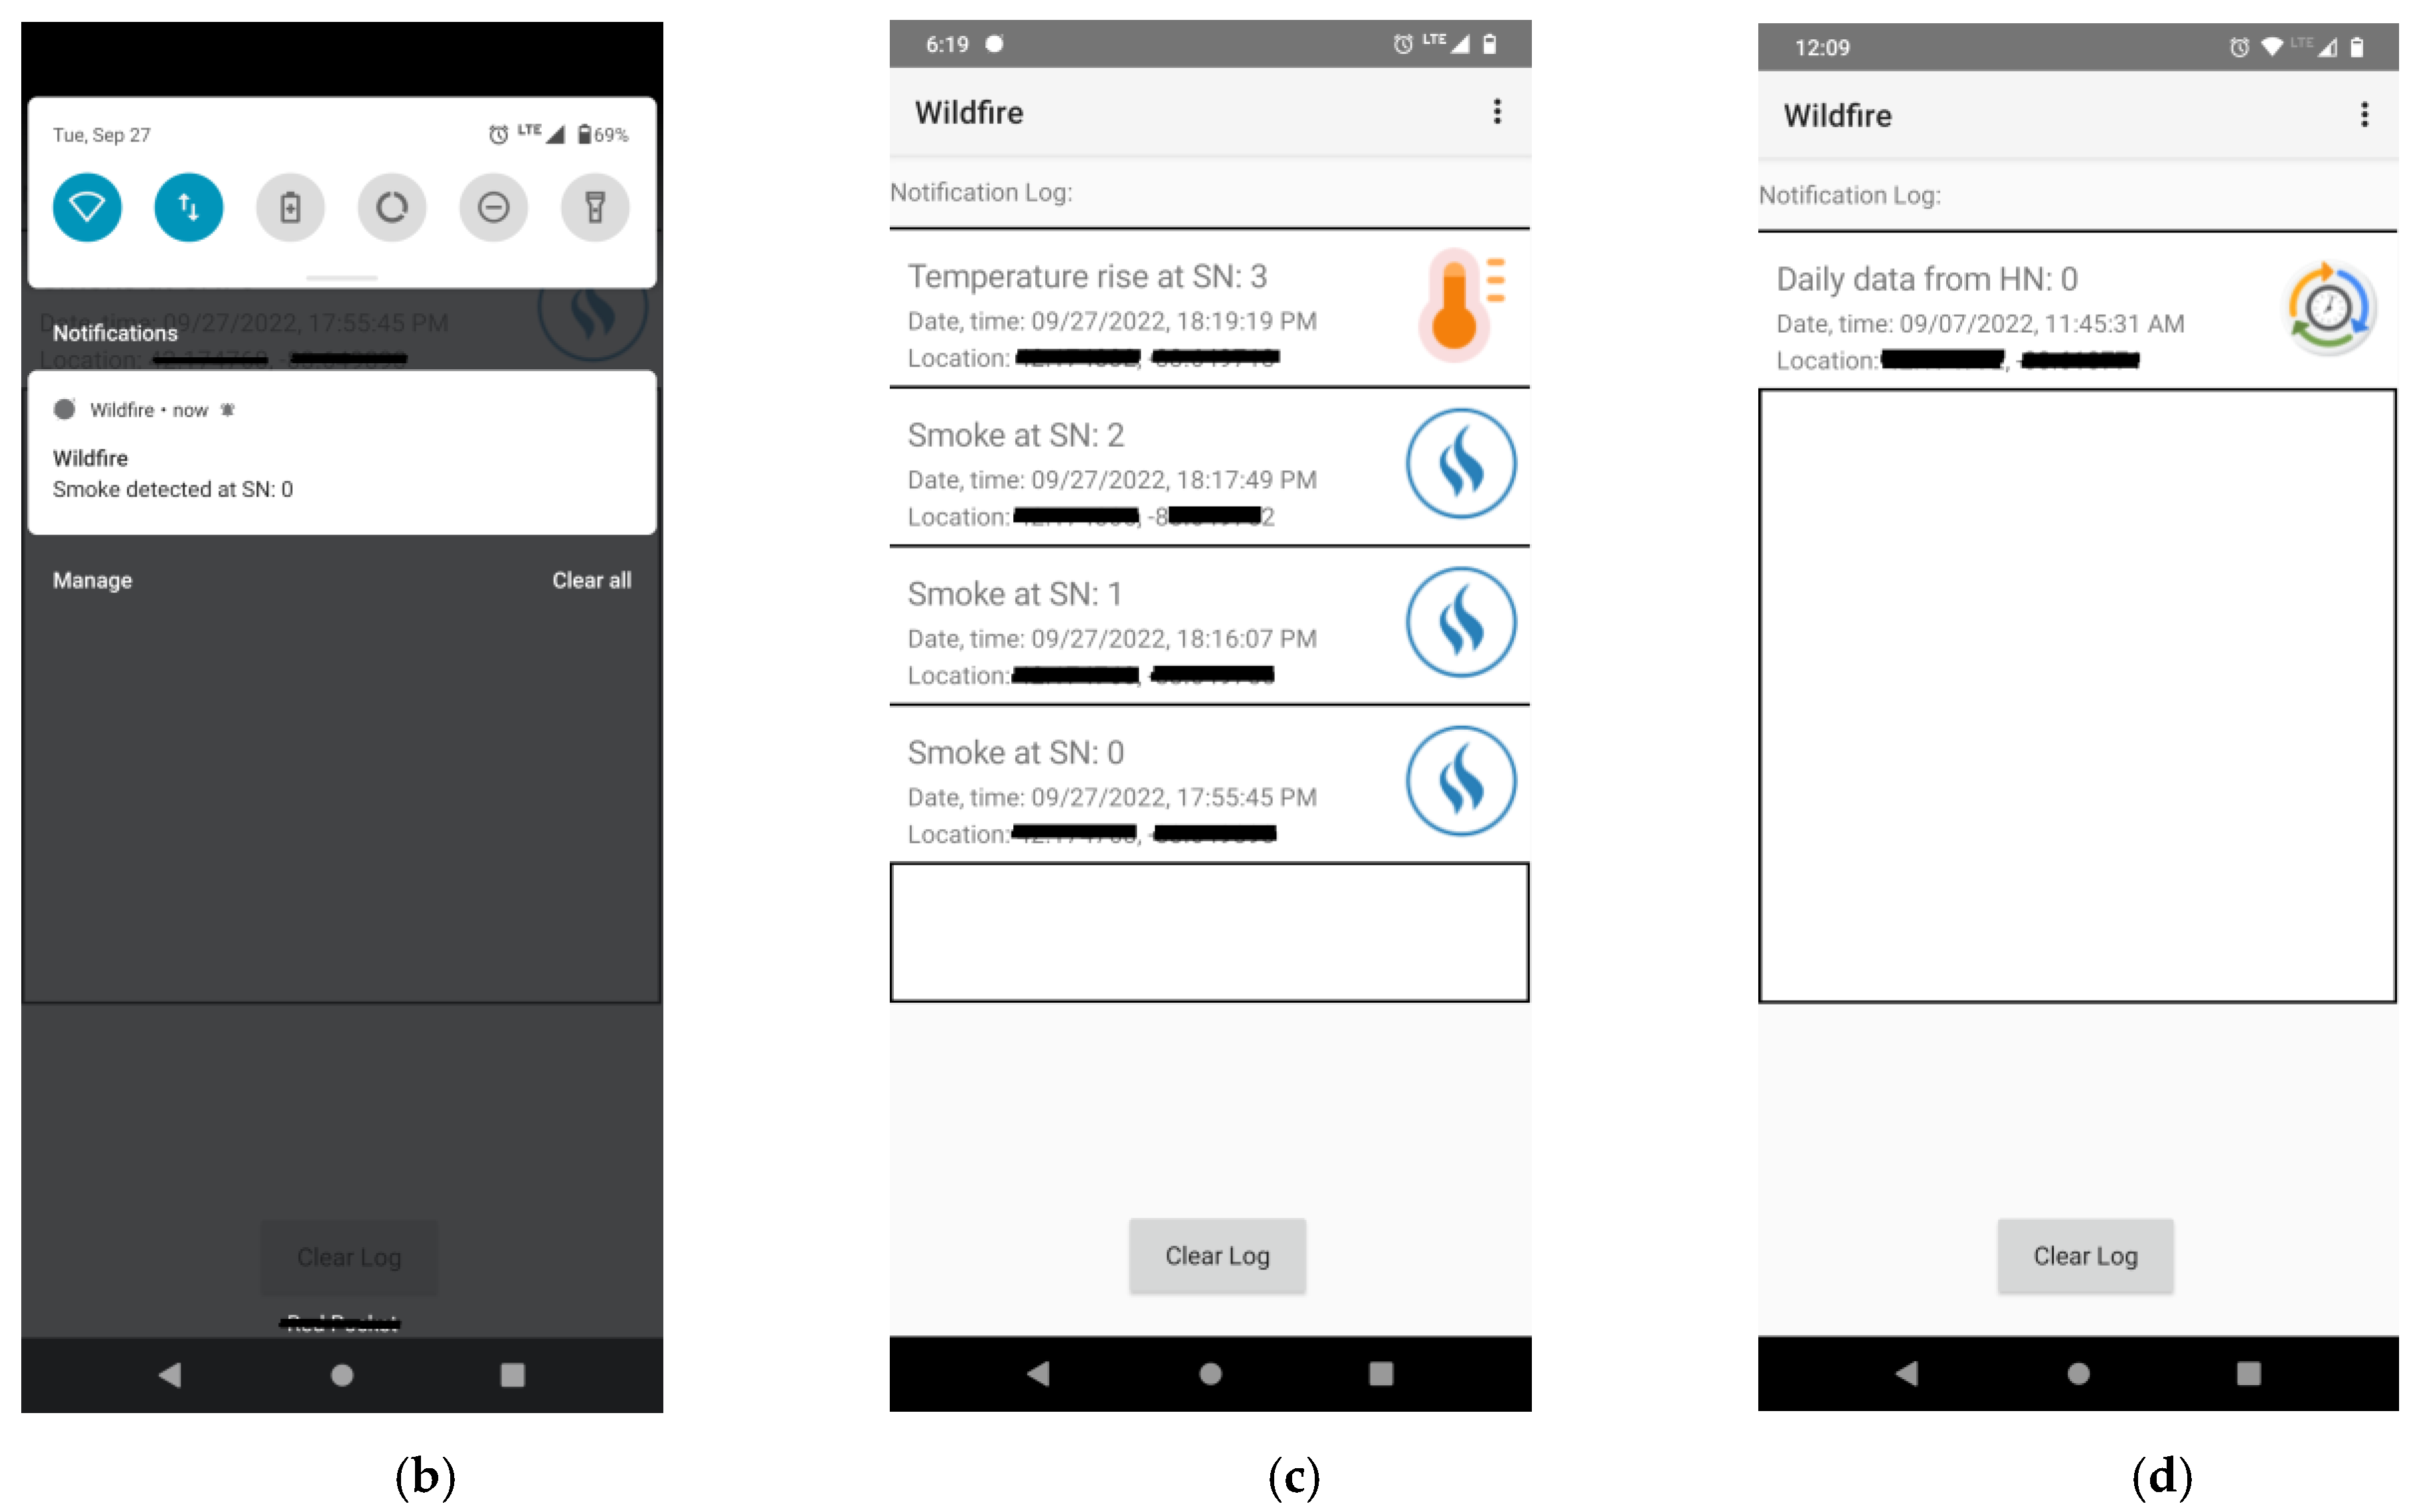
The smartphone app is developed for the Android platform. The first screen of the app contains a custom list view that shows the list of fire events, each containing the sensor or hub node numbers; its location; the event name, such as smoke, the sudden increase in temperature, or minute data at midnight; and the event’s date and time. The app is registered in the FCM [66] for receiving the push notification, and the unique registration token can be viewed from the settings menu of the app. A service, named FirebaseMessaging, runs in the background of this app [67]. When it receives a push notification message from the FCM, a call-back function is enabled and the app appends the message in a list; saves the list in a file; generates a smartphone notification; and updates the list view in the first screen. If any item on the list view is clicked by the user, then it opens Google Maps by setting the destination to the location of the sensor node on fire—so the firefighter can rapidly navigate to the site.
3. Result
3.1. Prototype Development and Testing
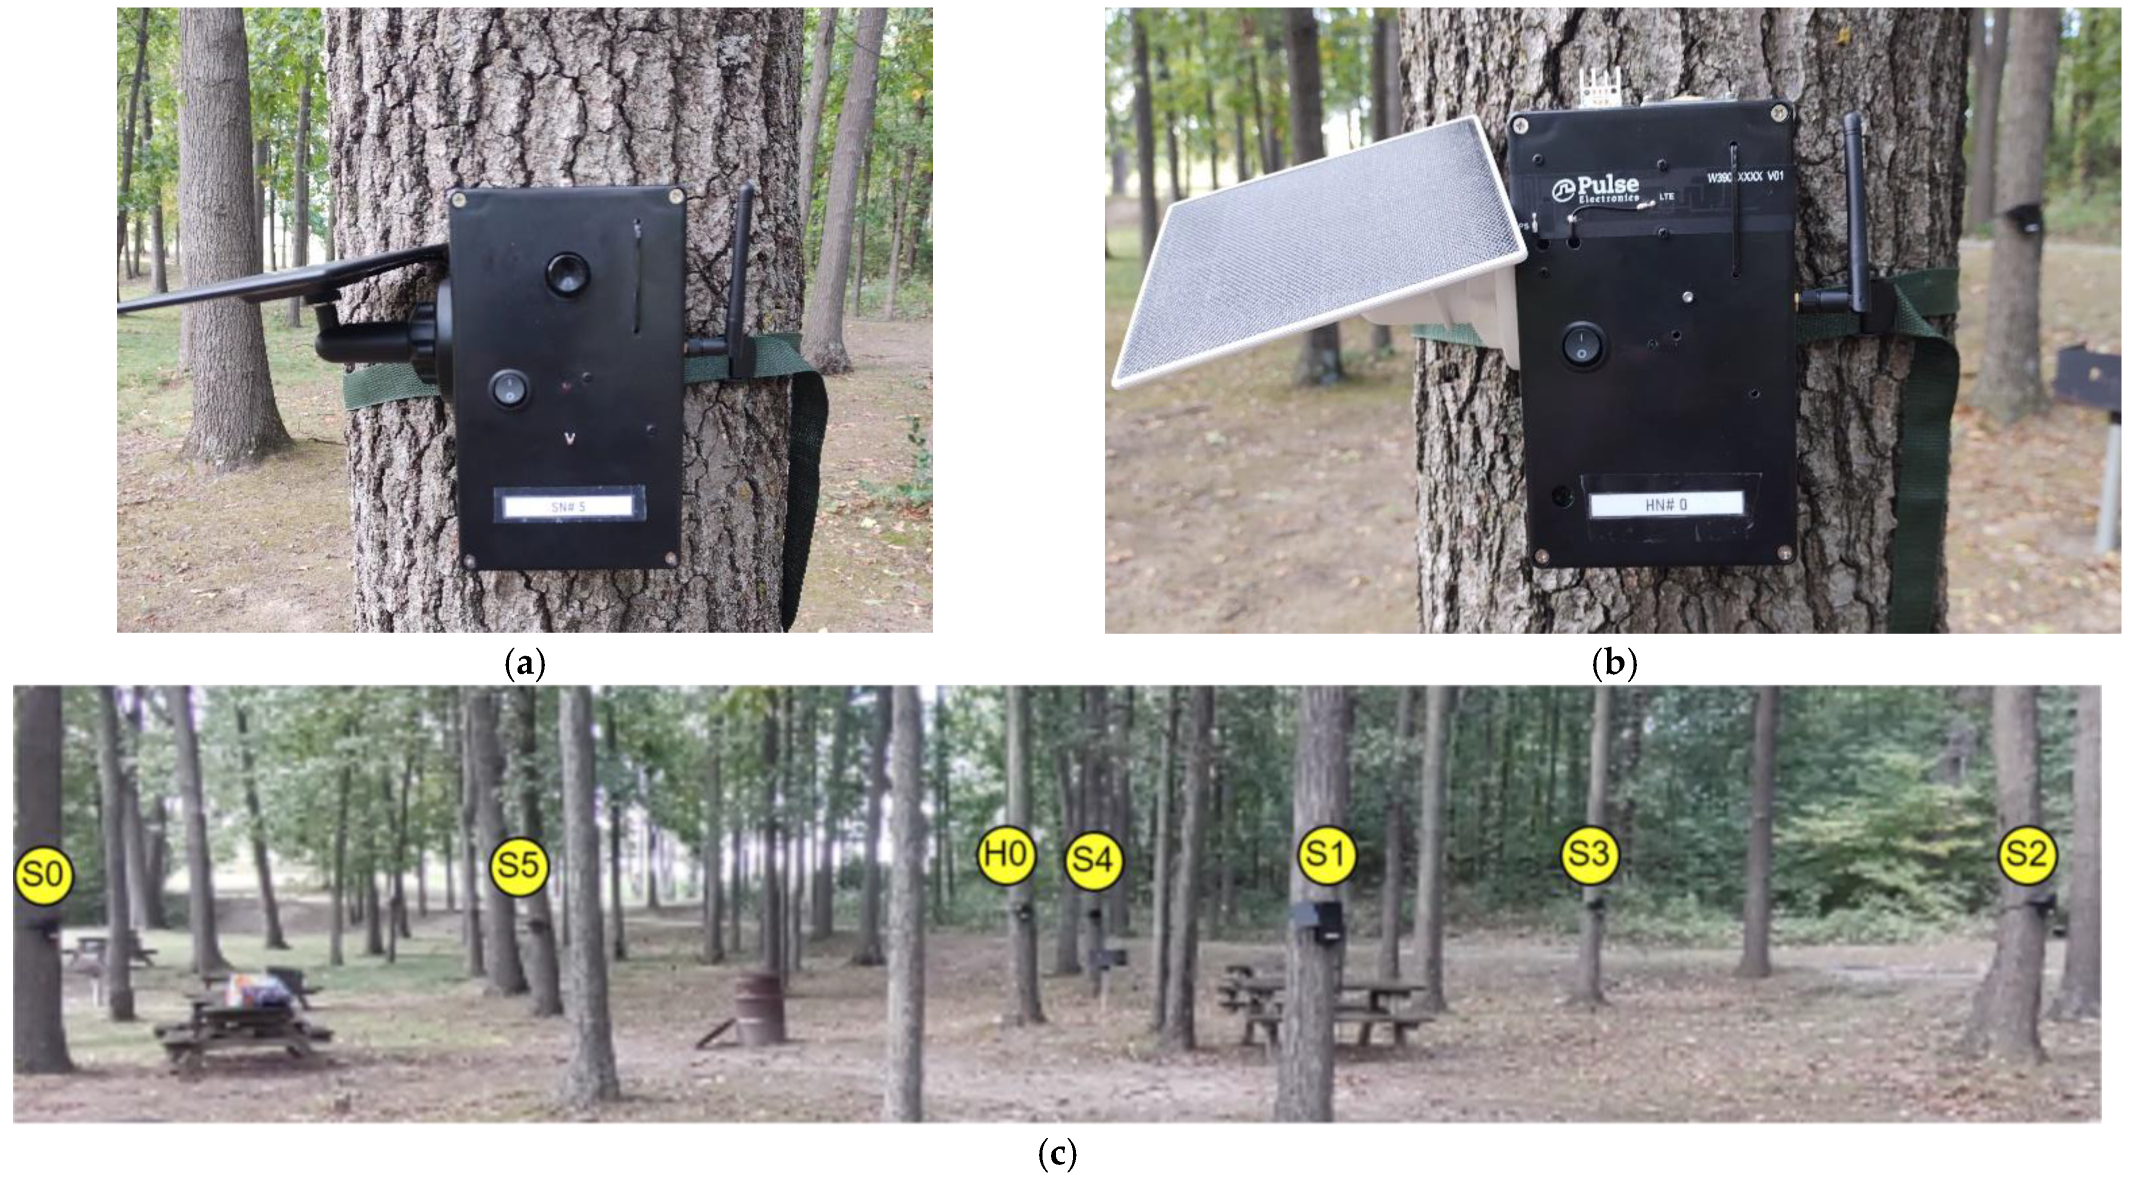
A prototype of the proposed wildfire detection system consisting of six sensor nodes, one hub node, central server software, and a smartphone app was developed and successfully tested. Photographs of sensor and hub node hardware devices are shown in Figure 10 and Figure 11, respectively.
The six sensor nodes and one hub node were tied onto trees in a forest environment covering approximately 130 m2, as shown in Figure 12. The latitude and longitude of each node were logged with a smartphone using Google Maps, and then configured to the central server software. The central server was running about 2.6 km away from the forest. Two test firefighters’ details were added to the server software with their smartphone app registration tokens. To avoid fire injury and burning the forest for testing, fire events were artificially created. The presence of smoke was generated using a smoke spray [68]—which is used to test commercial smoke detectors. The sudden increase in temperature was generated by holding a barbeque lighter, producing a small fire, near the thermistor of the sensor node. During testing, the sensor nodes were able to detect smoke and SRT events, and the central server successfully marked the location with the type of fire events, saving data in the database, generating warning sounds, and sending smartphone notifications. Some screenshots of the central server software and smartphone app are shown in Figure 13.
Testing was also conducted for receiving environmental data at midnight or just after a fire event. At midnight or after a fire event, the hub successfully sent the minute data, which are sensor data collected after every 15 min throughout the day, to the central server. Daily data smartphone notifications were also received for this event. The data were saved in the database and they can be viewed as charts using the server software. Some charts based on single-day data are shown in Figure 14. From the SIM dashboard, we observed that 1.41 kB of cellular data was used to send all the minute data of a day at midnight. Thus, in a month, 30 × 1.41 = 42.3 kB data was needed, which is much less than the 1 MB per-month data plan.
3.2. Current Consumption
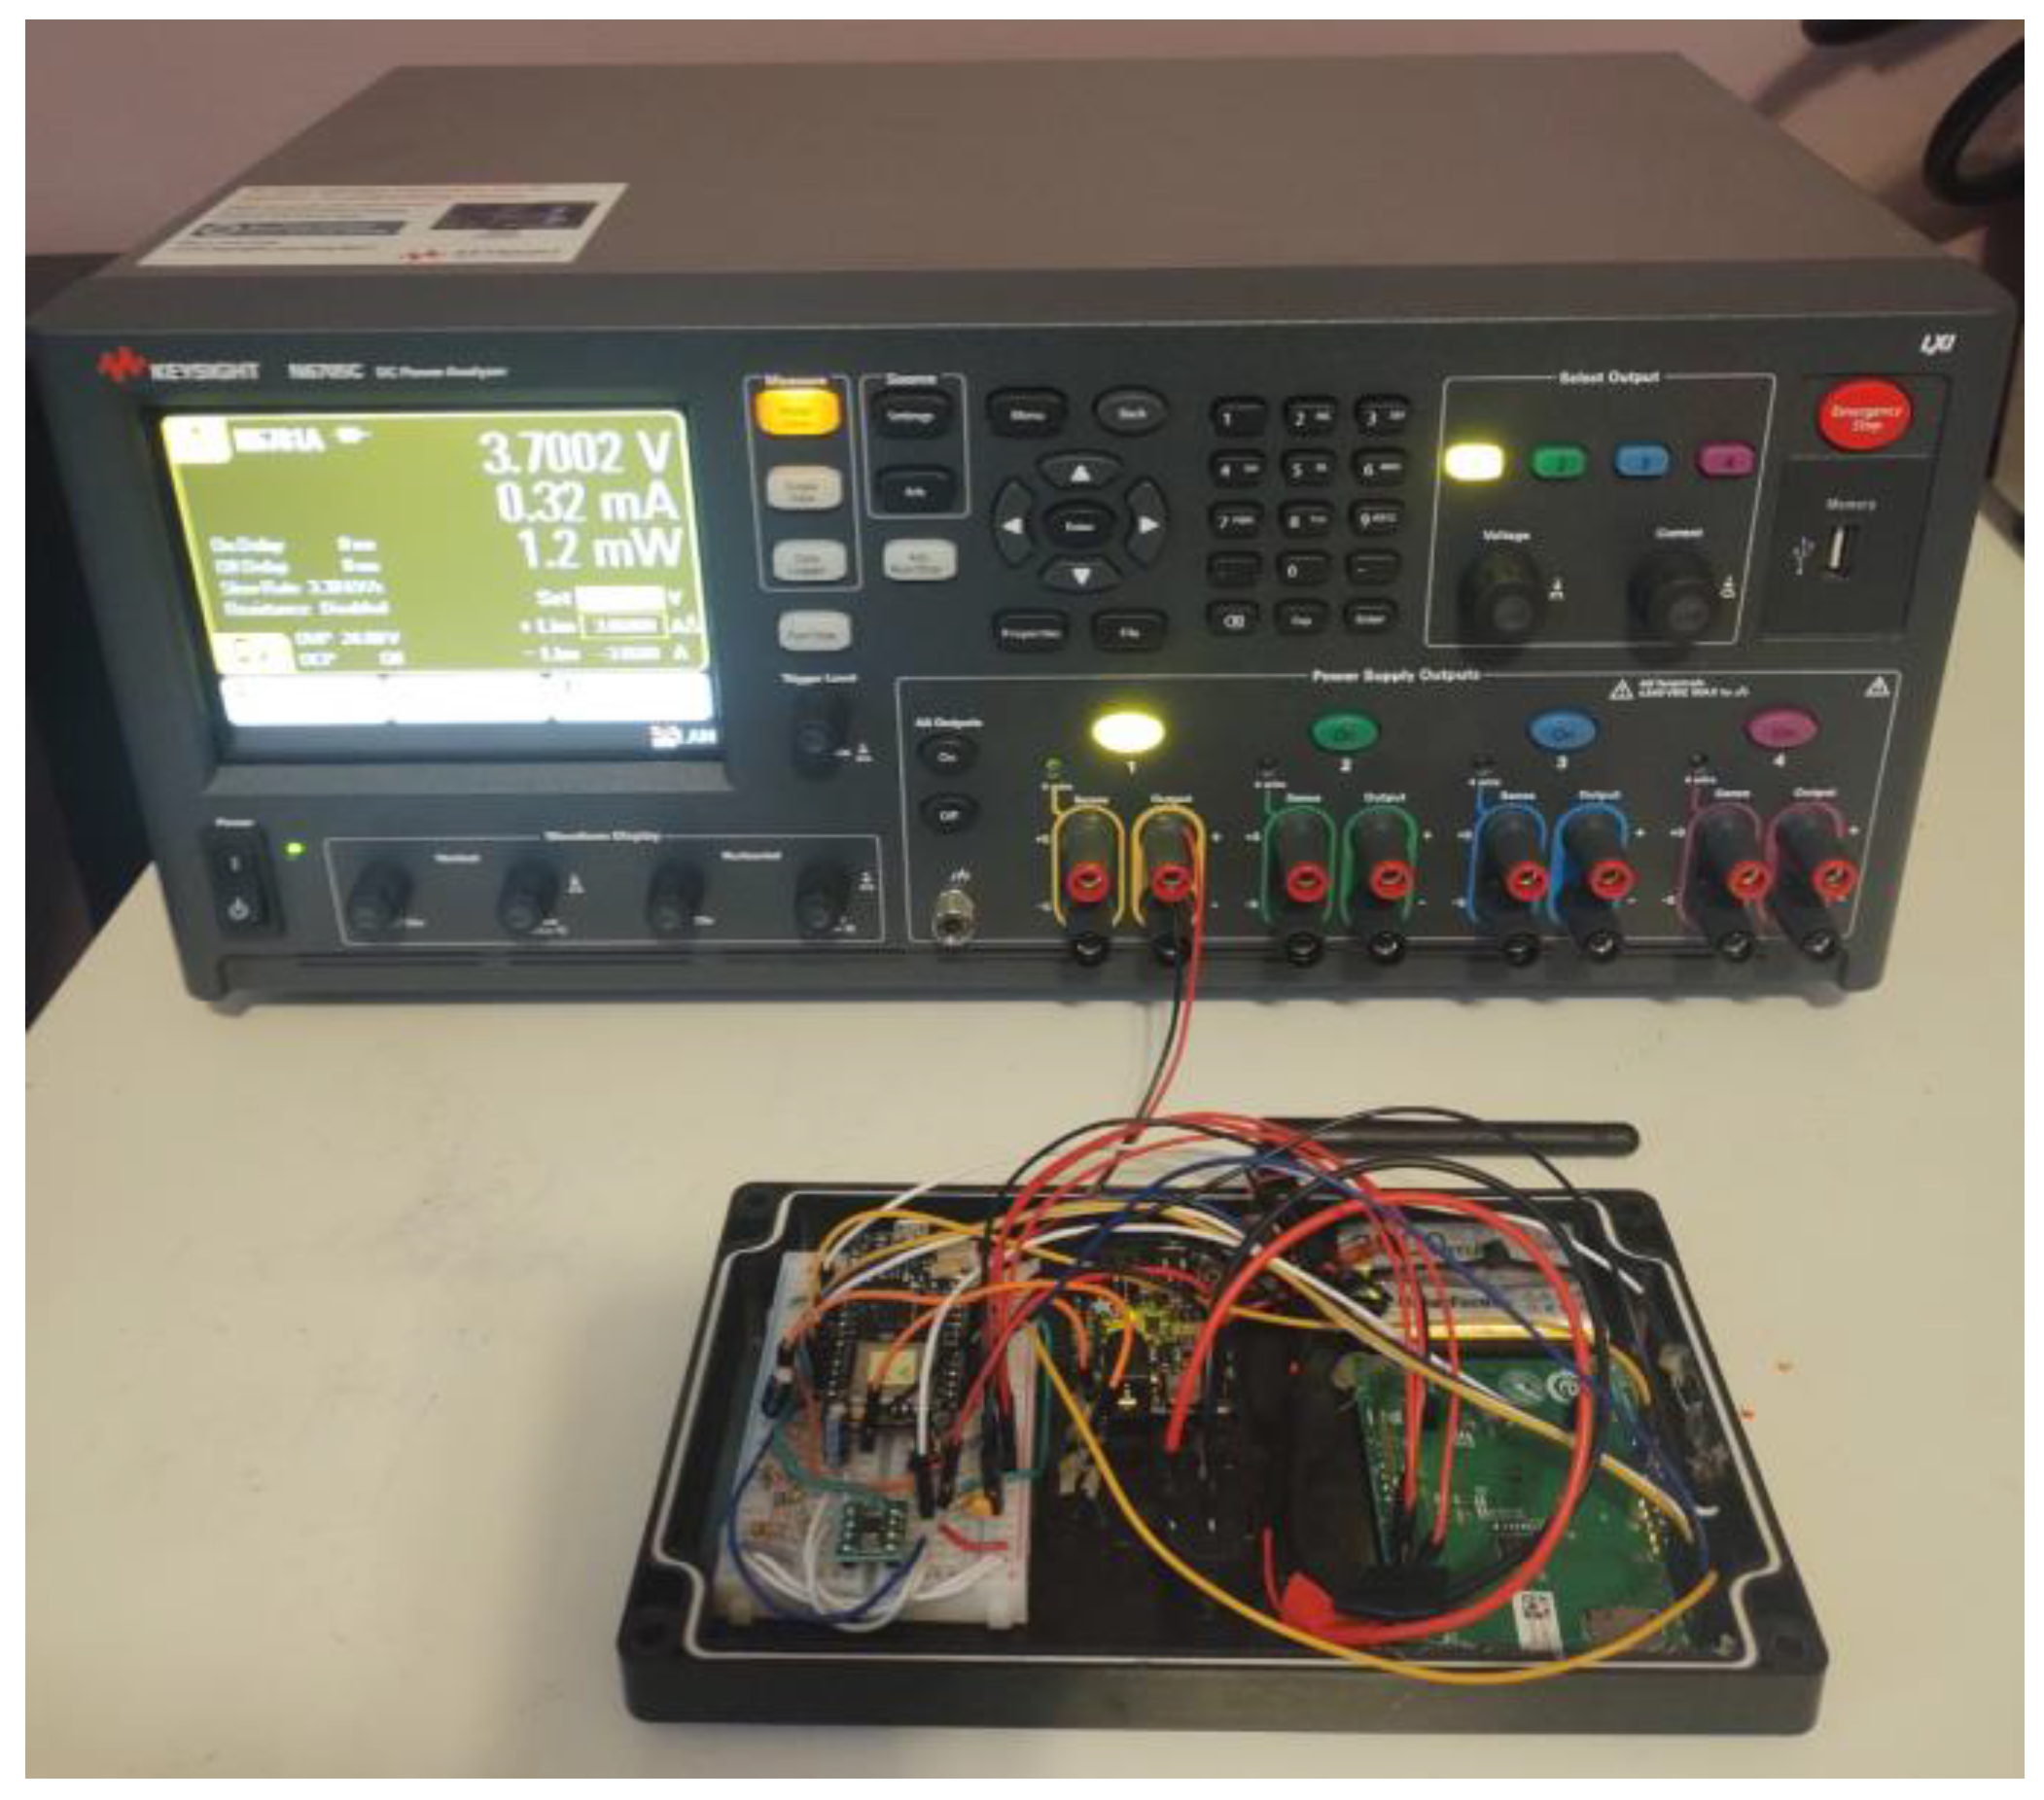
The current consumptions of the sensor and hub nodes were measured using the Keysight N6705C DC power analyzer [69] with an N6781A source/measure unit (SMU) module [70], as shown in Figure 15. The voltage source of the module was set as a 3.7 v battery emulator, and it was used as the power supply of the nodes.
3.2.1. Current Consumption of Sensor Node
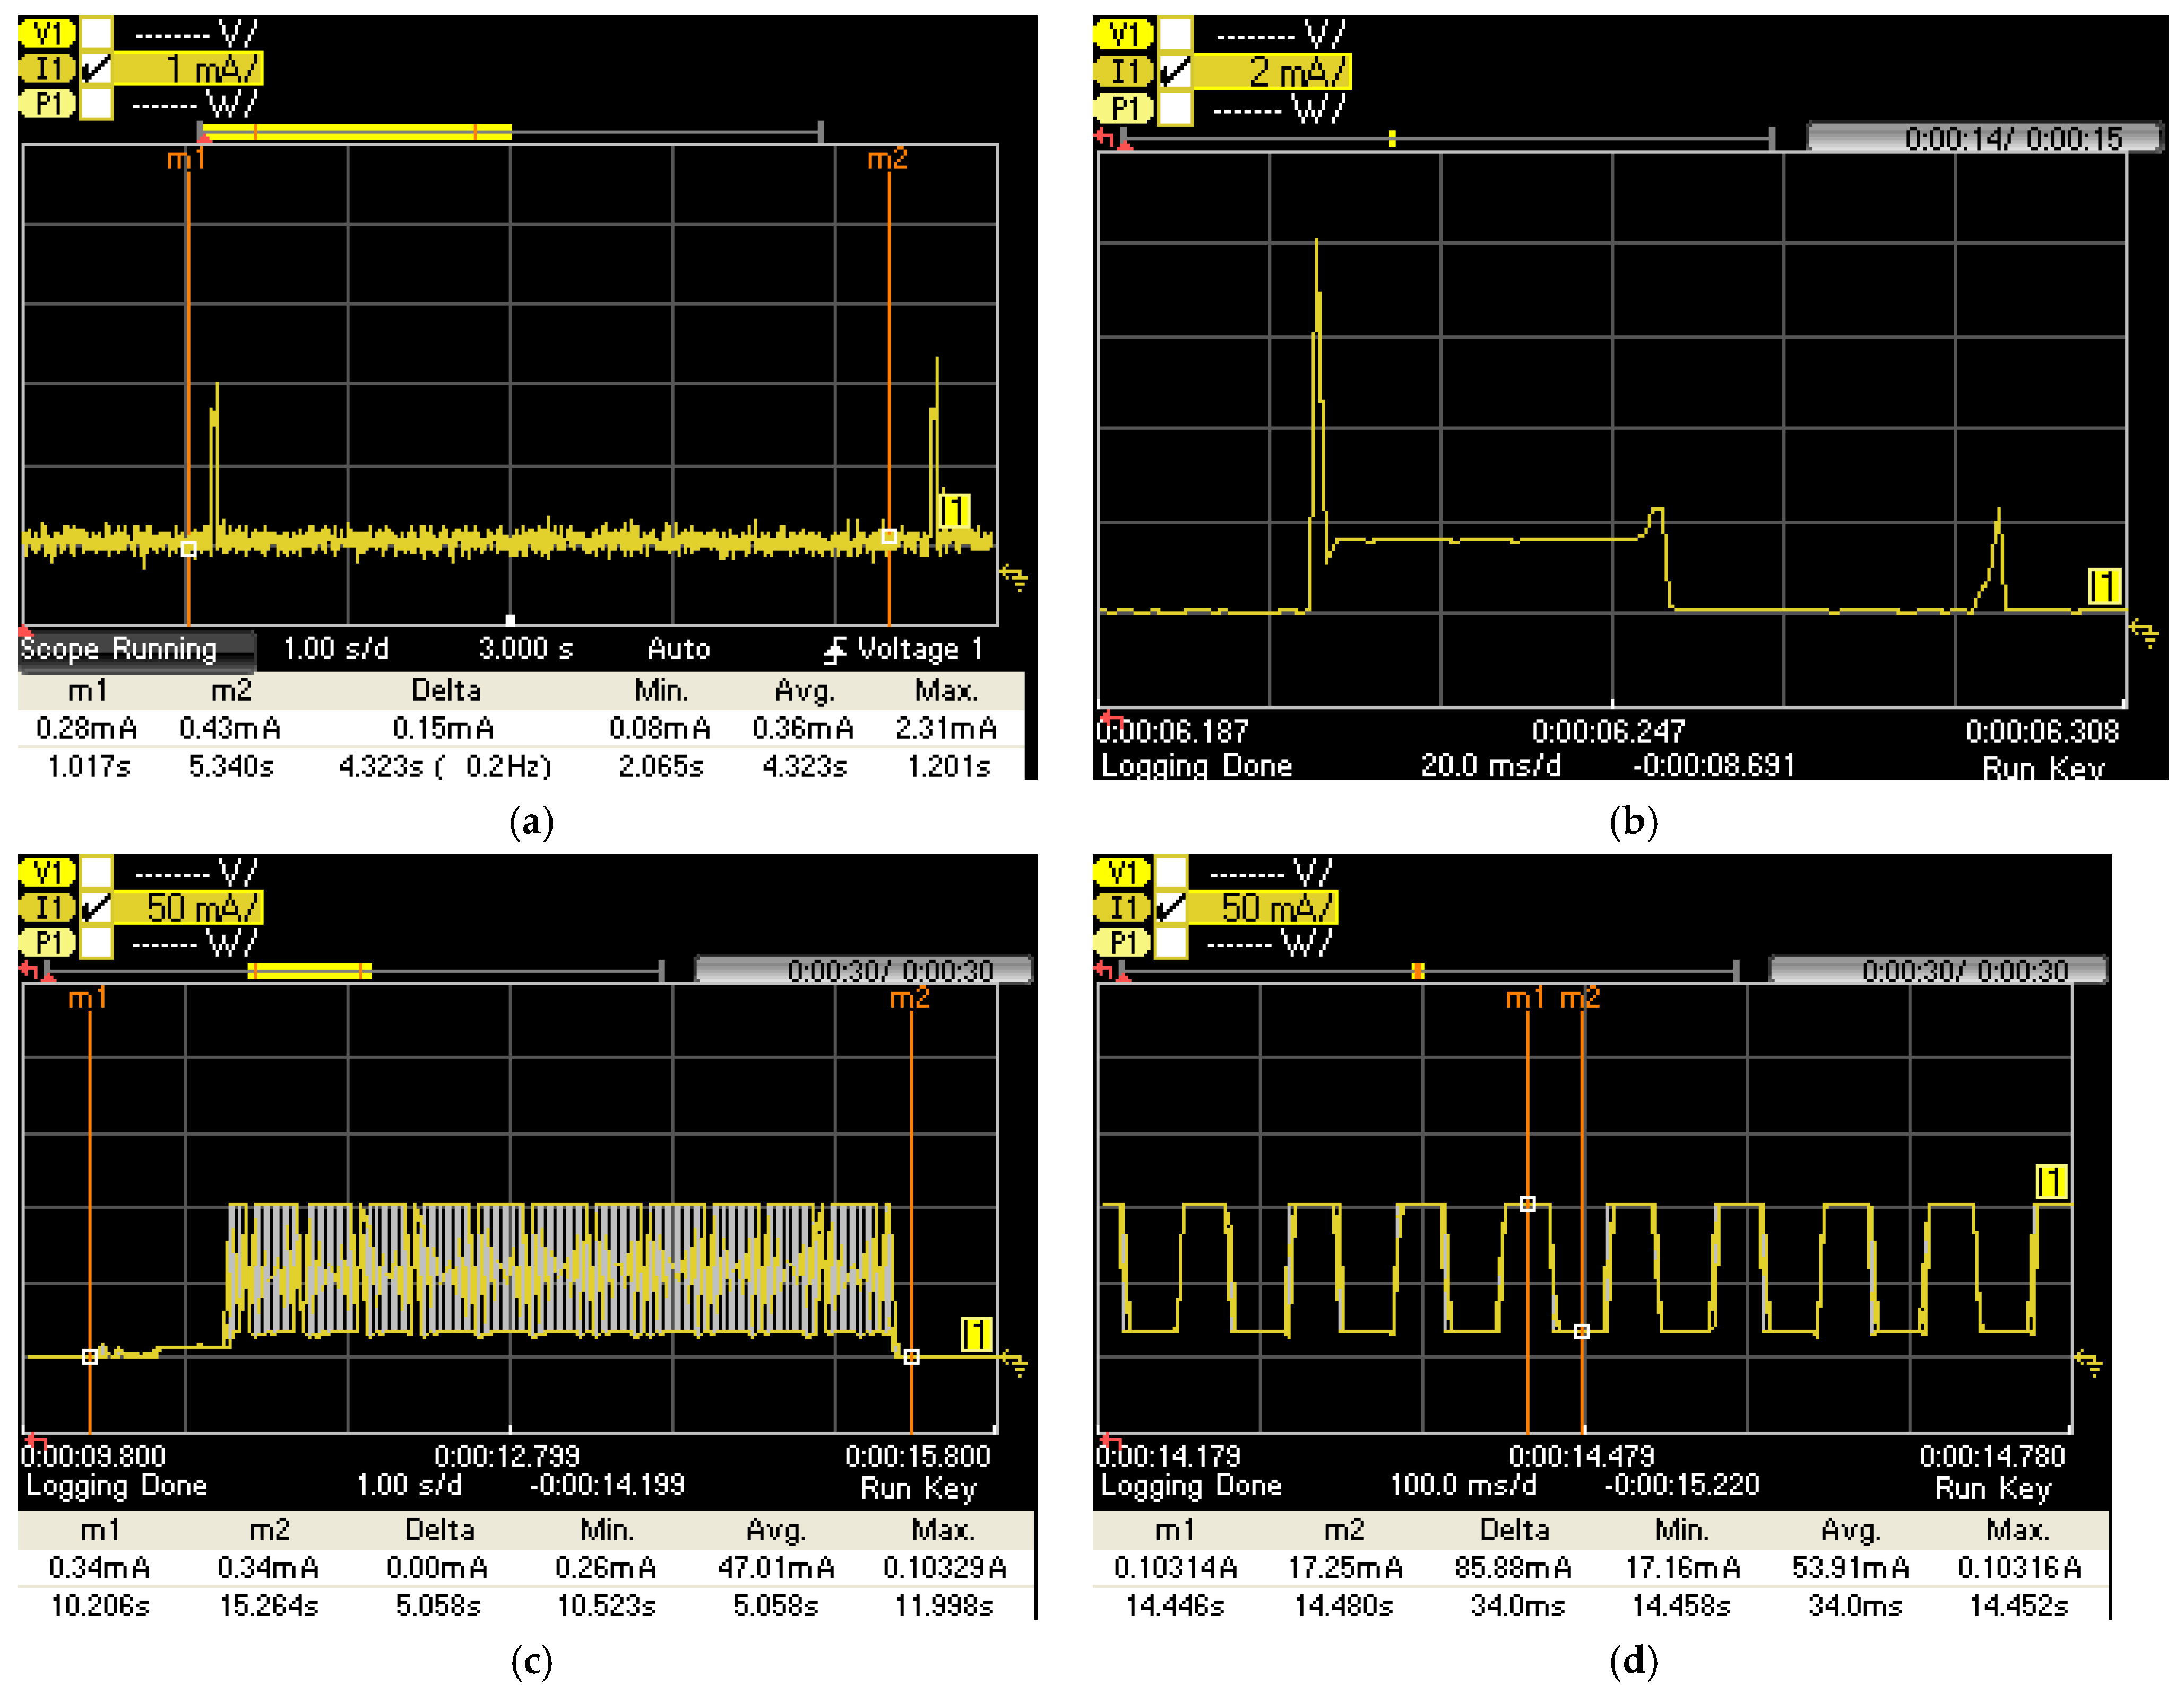
The sensor node remains in low-power sleep mode and after every 4 s, it receives a periodic interruption and reads the smoke sensor values. To obtain the average current-consumption of the sensor node in the 4 s duration cycle, we logged the current consumption for 15 s at a 1 ms sampling rate. Figure 16a shows a screenshot of the logged data and Figure 16b zooms in on the peak current wave. During sleep mode, it consumes around 0.32–0.34 mA. When it reads the smoke sensor value at a periodic interruption event, it consumes a peak current of around 2.54 to 14 mA for a few milliseconds. We set the measurement cursors, m1 and m2, covering a 4 s cycle, including one peak current, and the average current in this duration was 0.36 mA. Considering no solar panel recharging, the 2000 mAh battery can power the sensor node for 2000 ÷ 0.36 = 5405.4 h = 225.2 days. With a solar panel charging in the daytime, the device can run for an unlimited amount of time.
If smoke or a sudden rise in temperature event occurs, the sensor node tries to send the data frame to the hub node, and the hub node acknowledges it within 8 s. To obtain the average current consumption of the sensor node when a fire occurs, we logged the current consumption for 30 s and created a fire event during this time. The current consumption of the sensor node, following a fire, is shown between the markers in Figure 16c. The marker, m1, was placed when the fire event occurred, and m2 was placed after the MCU returned to sleep mode. During this time, there was a pulse wave, as shown in the zoomed-in view in Figure 16d, where the sensor node continuously sent a data frame and waited for an acknowledgment. In Figure 16d, when the wave is around 103 mA, it sends a data frame using the LoRa transceiver. When the wave is around 17.25 mA, it waits for an acknowledgment from the hub for about 35 ms. The duration of this pulse wave varies from 0 to 8 s. In Figure 16c, we can observe that it takes around 5 s from the fire event to return to sleep mode. The average current consumption during this fire event is 47.01 mA. Note that fire events may occur only a few times in a year, and for most of the days the average current consumption is 0.36 mA.
3.2.2. Current Consumption of Hub Node
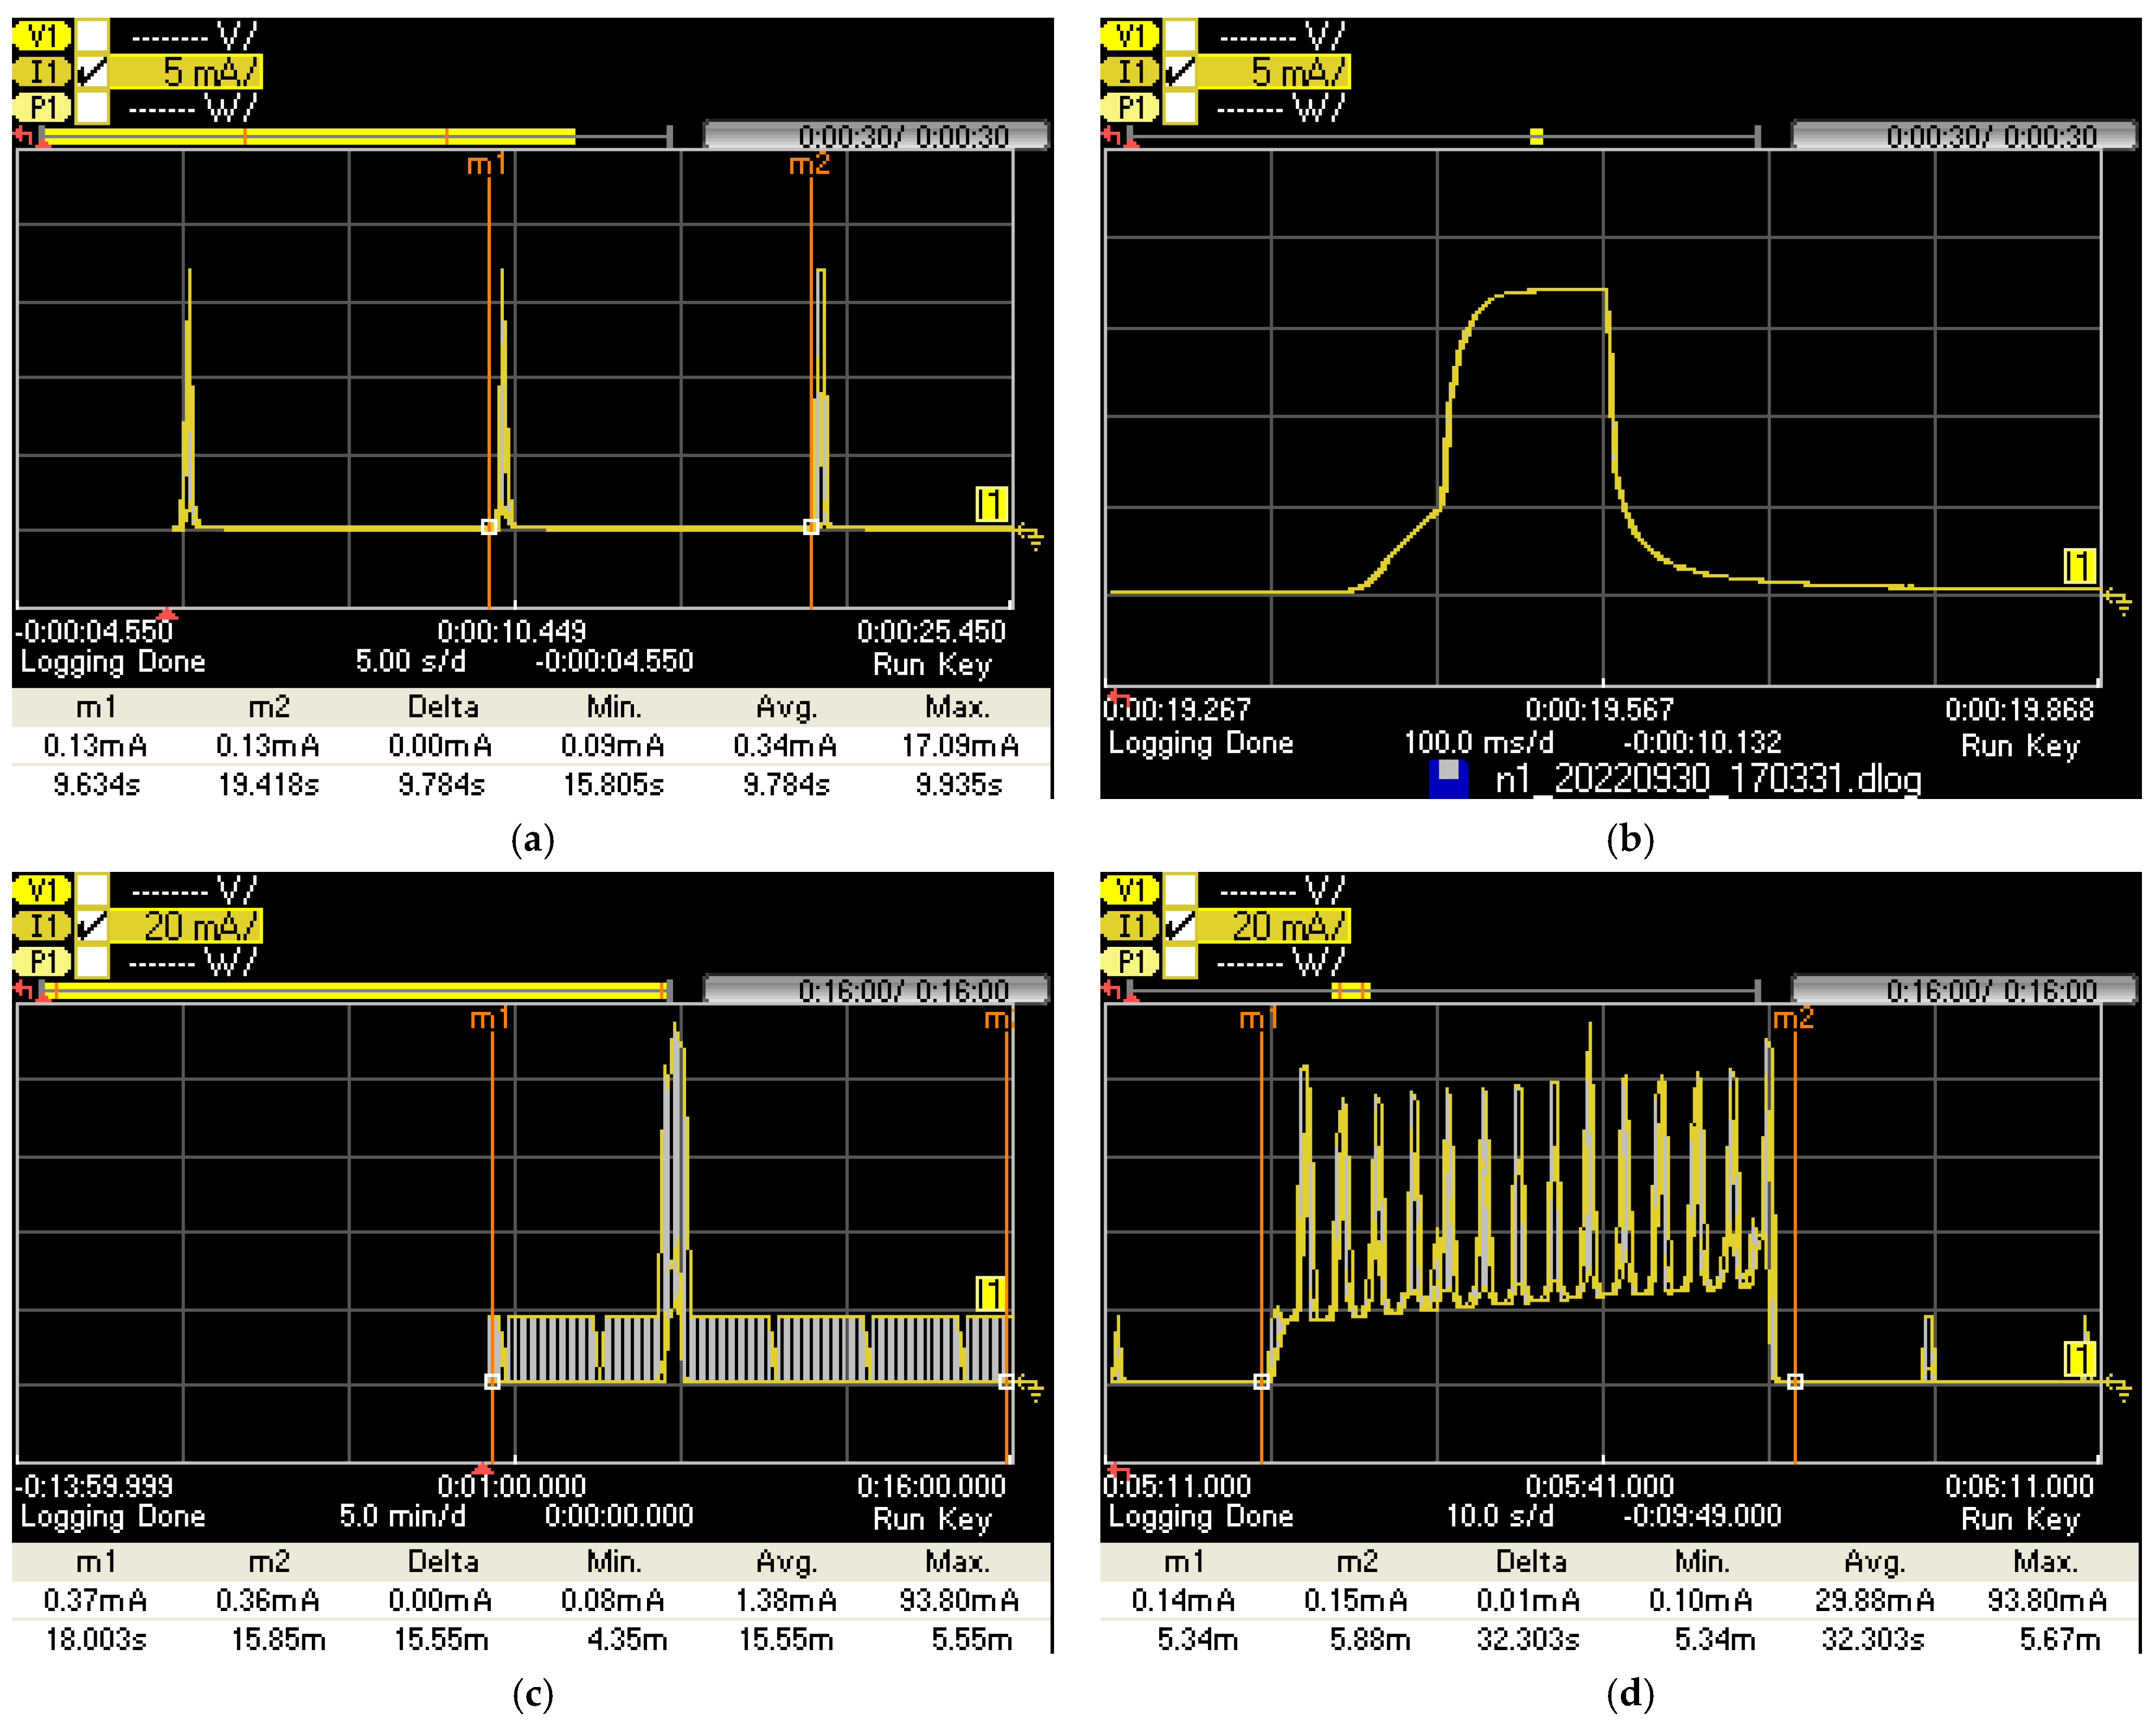
The hub node remains in low-power sleep mode for approximately 8 s; then its LoRa transceiver enters receive mode for about 100 ms; and the cycle repeats itself. To obtain the average current consumption of the hub node in the 8 s cycle, we logged the current consumption for 30 s with a 1 ms sampling rate. Figure 17a shows a screenshot of the logged data, and Figure 17b zooms in on the peak current wave. During sleep mode, it consumes around 0.12–0.13 mA. When it opens the receive windows, it consumes a peak current of around 17 mA for about 100 ms. We set the measurement cursors, m1 and m2, covering an 8 s cycle, including one peak current, and the average current in this duration was 0.34 mA.
After every 15 min, the hub node reads its sensor data, referred to as the minute data. We logged the current value for about 16 min and calculated the average current for the 15 min cycle that included a reading of the sensors and several LoRa transceiver receive modes. Figure 17c shows a screenshot of the logged data, and Figure 17d zoom ins on the peak current wave when it reads the sensors. The average current consumption covering the entire 15 min cycle was 1.38 mA. During this time, when it reads the sensors for 32.3 s, the average current consumption was 29.88 mA.
This average current consumption of 1.38 mA continues until it is midnight. At midnight, it sends the collected minute data to the central server using the LTE modem. We logged the current consumption during this transmission, as shown in Figure 17e, and observed that the average current consumption during the 27 s of transmission was 66.72 mA. Therefore, in one day, which has 24 × 60 × 60 = 86,400 s, the average current is 1.38 mA for 86,400 − 27 = 86,373 s, and the average current is 66.72 mA for the remaining 27 s. Thus, the average current consumption for one day is (1.38 × 86,373 + 66.72 × 27) ÷ 86,400 = 1.40 mA. Considering no solar panel recharging occurs, the 2000 mAh battery can power the hub node for 2000 ÷ 1.40 = 1428.5 h = 59.5 days. With a solar panel charging in day times, the device can run for a limitless period of time.
If smoke or a sudden increase in temperature occurs in the sensor node, the hub node receives a data frame and transmits it to the central server using the LTE modem. To obtain the average current of the hub node when a fire event occurs, we logged the current for 2 min and created a fire event during this time. The current consumption of the hub node, after a fire event, is shown between the markers in Figure 17f. The marker, m1, was placed when it opened the receive window, and m2 was placed after the MCU returned to sleep mode. The average current during 15 s was 84.60 mA. Note that fire events may occur only a few times in a year, and on most days the average current consumption of the hub node is 1.40 mA.
3.3. Comparison with Other Works
A comparison with other related works is shown in Table 1. Here, we observe that the proposed work detects fire events using a low-power smoke sensor and custom-designed sudden rise in temperature detector, which helped us to minimize the power-consumption. It uses LoRa and LTE wireless communications; thus, the system can be deployed in any location where cellular coverage is available. Compared with other works, the proposed work used additional sensors to monitor the forest environment, and the data were sent daily to the central server that implements a database and data viewer using charts. In case of a fire, the system implements smartphone notifications and real-time plotting on the map. The proposed ultra-low-power event-driven hardware and software design of the sensor and hub nodes consumes the lowest current compared to other related works. With rechargeable batteries and low-cost solar panels, the proposed system can run limitlessly without manual recharging.
4. Discussion
The developed wildfire detection system met the three design challenges mentioned in Section 2. The system sends a notification with location information to the firefighter’s smartphones in case of a fire and the hub collects sensor data every 15 min that are sent to the central server every day at midnight. The LTE modem uses only 42.3 kB of data in a month, which is much less than the 1 MB/month data plan. Compared to other works, the sensor and hub nodes presented the lowest current consumption and they can run using simple solar panels without manual recharging.
During the 24 h testing of the prototype, we observed that the hub node was not sending the collected data at midnight; instead, it was sending the data 20 min later. The time variable in the hub node needed to be rapidly updated to correct this error. In 24 h, 20 × 60 = 1200 s needed to be adjusted. The correction was performed when the hub collected the minute data, after every 15 min. In 24 h, there were (24 × 60) ÷ 15 = 96 times the hub collected data. So, after every 15 min, 1200 ÷ 96 = 12.5 s = 125,000,00 µ-seconds was added to correct this error. It solved the timing error and daily data was sent at exactly midnight.
To avoid false alarms of fog, the sensor node read the humidity sensor along with the smoke sensor, as discussed in Section 2.1.2. However, fog and dew may create condensation in the optical area causing problems for smoke detection. To solve this, the CN0537 board [35] contained heating resistors that were placed around the optical module, which can dissipate heat to clear the fog and dew formation. The amount of heating can be controlled using the pulse width modulation (PWM) technique; however, this consumes some extra power. We plan to perform further testing on this issue and implement the heating feature in the future.
The proposed wildfire detection system works where cellular coverage is available. If there is no cellular coverage, then the data can be sent to the central server using satellite Internet. We plan to interface the ARGOS satellite transceiver shield with the hub node in the future, which can be used to send the data using the satellite.
To understand star topology dimensioning, it is important to obtain the LoRa transmission range in the forest environment where vegetation and woods may attenuate the signal strength. The work in [71] presents the experimental results of LoRa transmission in the PARNASO forest. The experiments were performed on the range, received signal strength indicator (RSSI), signal-to-noise ratio (SNR), packet delivery ratio (PDR), packet inter-reception (PIR) time, and mobility. The theoretical LoRa range could be up to 15 km in suburban areas; however, measurements in the forest environment were about 250 m due to signal attenuation.
5. Conclusions
In this paper, an ultra-low-power wildfire detection system was developed and successfully tested. Its sensor node detected fire events using a low-power smoke sensor and custom-designed sudden increase in temperature detector. In case of a fire, the system sent notifications to the firefighter’s smartphones in a real-time setting. For forest monitoring, its hub node collected sensor data every 15 min, which were sent to the central server every day at midnight using cellular Internet. Compared to other works, the sensor and hub nodes have the lowest current-consumption, and they can run with simple solar panels, limitlessly, without manual recharging.
Funding
This research was funded by the Summer Research/Creative Activity (SRA) award and the Provosts Research Support Award (RSA) of Eastern Michigan University.
Data Availability Statement
The data presented in this study are available on request from the corresponding author.
Conflicts of Interest
The authors declare no conflict of interest.
References
- Wildfires. Available online: https://www.who.int/health-topics/wildfires (accessed on 9 November 2022).
- Yao, J.; Brauer, M.; Wei, J.; McGrail, K.M.; Johnston, F.H.; Henderson, S.B. Sub-Daily Exposure to Fine Particulate Matter and Ambulance Dispatches during Wildfire Seasons: A Case-Crossover Study in British Columbia, Canada. Environ. Health Perspect. 2020, 128, 067006. [Google Scholar] [CrossRef] [PubMed]
- The Costs and Losses of Wildfires, NIST. Available online: https://nvlpubs.nist.gov/nistpubs/SpecialPublications/NIST.SP.1215.pdf (accessed on 9 November 2022).
- 24 Blazing Wildfire Statistics for the US and Abroad. Available online: https://policyadvice.net/insurance/insights/wildfire-statistics/ (accessed on 9 November 2022).
- Wildfire’s Impact on Our Environment. Available online: https://deq.utah.gov/communication/news/featured/wildfires-impact-on-our-environment (accessed on 9 November 2022).
- Alkhatib, A.A.A. A Review on Forest Fire Detection Techniques. Int. J. Distrib. Sens. Networks 2014, 10. [Google Scholar] [CrossRef] [Green Version]
- Wu, H.-T.; Chen, J.-K.; Tsai, C.-W. Wildfire monitoring and guidance system. In Proceedings of the 27th Wireless and Optical Communication Conference (WOCC), Hualien, Taiwan, 30 April–1 May 2018; pp. 1–3. [Google Scholar] [CrossRef]
- Saldamli, G.; Deshpande, S.; Jawalekar, K.; Gholap, P.; Tawalbeh, L.; Ertaul, L. Wildfire Detection using Wireless Mesh Network. In Proceedings of the 2019 Fourth International Conference on Fog and Mobile Edge Computing (FMEC), Rome, Italy, 10–13 June 2019; pp. 229–234. [Google Scholar] [CrossRef]
- Blalack, T.; Ellis, D.; Long, M.; Brown, C.; Kemp, R.; Khan, M. Low-Power Distributed Sensor Network for Wildfire Detection. In Proceedings of the 2019 SoutheastCon, Huntsville, AL, USA, 11–14 April 2019; pp. 1–3. [Google Scholar] [CrossRef]
- Antunes, M.; Ferreira, L.M.; Viegas, C.; Coimbra, A.P.; de Almeida, A.T. Low-Cost System for Early Detection and Deployment of Countermeasures Against Wild Fires. In Proceedings of the IEEE 5th World Forum on Internet of Things (WF-IoT), Limerick, Ireland, 15–18 April 2019; pp. 418–423. [Google Scholar]
- Vega-Rodriguez, R.; Sendra, S.; Lloret, J.; Romero-Diaz, P.; Garcia-Navas, J.L. Low Cost LoRa based Network for Forest Fire Detection. In Proceedings of the 2019 Sixth International Conference on Internet of Things: Systems, Management and Security (IOTSMS), Granada, Spain, 22–25 October 2019; pp. 177–184. [Google Scholar] [CrossRef]
- Flame Sensor. Available online: https://www.seeedstudio.com/Grove-Flame-Sensor.html (accessed on 14 November 2022).
- Pandit, A. How to Use HM-10 BLE Module with Arduino to Control an LED using Android App. Available online: https://circuitdigest.com/microcontroller-projects/how-to-use-arduino-and-hm-10-ble-module-to-control-led-with-android-app (accessed on 14 November 2022).
- Mitchell, A. Operating an Arduino for a Year from Batteries. Available online: https://analysisnorth.com/articles/arduino-for-a-year.html (accessed on 14 November 2022).
- Powering Pixy2. Available online: https://docs.pixycam.com/wiki/doku.php?id=wiki:v2:powering_pixy (accessed on 14 November 2022).
- LoRa Outdoor Gateways, What to Buy? Available online: https://www.thethingsnetwork.org/forum/t/lora-outdoor-gateways-what-to-buy/39114 (accessed on 14 November 2022).
- FIR Thermal Sensor. Available online: https://www.mouser.com/new/melexis/melexis-mlx90640-fir-sensor/ (accessed on 14 November 2022).
- MQ135 Air Quality Gas Sensor Module. Available online: https://quartzcomponents.com/products/mq-135-air-quality-gas-sensor-module (accessed on 28 November 2022).
- Verma, S.; Kaur, S.; Rawat, D.B.; Xi, C.; Alex, L.T.; Jhanjhi, N.Z. Intelligent Framework Using IoT-Based WSNs for Wildfire Detection. IEEE Access 2021, 9, 48185–48196. [Google Scholar] [CrossRef]
- Liu, H.-H.; Chang, R.Y.; Chen, Y.-Y.; Fu, I.-K. Sensor-Based Satellite IoT for Early Wildfire Detection. In Proceedings of the IEEE Globecom Workshops (GC Wkshps), Madrid, Spain, 7–11 December 2021; pp. 1–6. [Google Scholar] [CrossRef]
- RockBLOCK Mk2—Iridium SatComm Module. Available online: https://www.sparkfun.com/products/13745 (accessed on 19 January 2023).
- Botletics™ SIM7000 LTE CAT-M1/NB-IoT + GPS Shield Kit. Available online: https://www.botletics.com/products/sim7000-shield (accessed on 13 December 2022).
- Huang, H.-T.; Downey, A.R.J.; Bakos, J.D. Audio-Based Wildfire Detection on Embedded Systems. Electronics 2022, 11, 1417. [Google Scholar] [CrossRef]
- Salamon, J.; Bello, J.P. Unsupervised feature learning for urban sound classification. In Proceedings of the IEEE International Conference on Acoustics, Speech and Signal Processing (ICASSP), South Brisbane, QLD, Australia, 19–24 April 2015; pp. 171–175. [Google Scholar] [CrossRef]
- Liang, H.; Zhang, M.; Wang, H. A Neural Network Model for Wildfire Scale Prediction Using Meteorological Factors. IEEE Access 2019, 7, 176746–176755. [Google Scholar] [CrossRef]
- Huot, F.; Hu, R.L.; Goyal, N.; Sankar, T.; Ihme, M.; Chen, Y.-F. Next Day Wildfire Spread: A Machine Learning Dataset to Predict Wildfire Spreading from Remote-Sensing Data. IEEE Trans. Geosci. Remote Sens. 2022, 60, 4412513. [Google Scholar] [CrossRef]
- Yang, P.; Spencer, T.; Stripling, C.; Shoemate, D.; Modala, N.R. Reinforcing wildfire predictive services with timely weather information. In Proceedings of the 25th International Conference on Geoinformatics, Buffalo, NY, USA, 2–4 August 2017; pp. 1–4. [Google Scholar] [CrossRef]
- LoRa32u4 II Lora Development Board. Available online: https://www.amazon.com/Stemedu-LoRa32u4ii-Development-JST-PH2-0mm-2P-ATmega32u4/dp/B07MVTSGBB/ (accessed on 21 November 2022).
- ATmega32U4. Available online: https://www.microchip.com/en-us/product/ATmega32U4#, (accessed on 21 November 2022).
- HPD13A 915MHz SX1276 Wireless Transceiver Module. Available online: https://www.diymalls.com/HPD13A-868MHz-915MHz-SX1276-Wireless-Transceiver-Module?search=HPD13A (accessed on 21 November 2022).
- 5-Watt Solar Panel. Available online: https://www.amazon.com/Compatible-Wireless-Continuous-Security-Waterproof/dp/B099Z8JB2G/ (accessed on 21 November 2022).
- Solar Lithium Ion/Polymer Battery Charger. Available online: https://www.adafruit.com/product/4755 (accessed on 21 November 2022).
- 7V 2000mAh Lithium Rechargeable Battery. Available online: https://www.amazon.com/MakerFocus-Rechargable-Protection-Insulated-Development/dp/B08T6QS58J/?th=1 (accessed on 21 November 2022).
- SPST 2 Pin Latching Toggle Switch. Available online: https://www.amazon.com/TWTADE-Solder-Rocker-Switch-KCD1-X-Y/dp/B07XC5KB8D?th=1 (accessed on 21 November 2022).
- CN0537 Evaluation Board. Available online: https://www.analog.com/en/design-center/reference-designs/circuits-from-the-lab/cn0537.html (accessed on 28 November 2022).
- ADPD188BI Integrated Optical Module for Smoke Detection. Available online: https://www.analog.com/en/products/adpd188bi.html (accessed on 28 November 2022).
- SHT30-DIS-F digital Humidity and Temperature Sensor. Available online: https://sensirion.com/products/catalog/SHT30-DIS-F/ (accessed on 30 November 2022).
- Thermistor, Vishay BC Components. Available online: https://www.vishay.com/docs/29048/ntcle203.pdf (accessed on 29 November 2022).
- RC Differentiator. Available online: https://www.electronics-tutorials.ws/rc/rc-differentiator.html (accessed on 29 November 2022).
- MCP6442 9 kHz Op Amp. Available online: https://www.microchip.com/en-us/product/MCP6442 (accessed on 29 November 2022).
- Mini Photocell. Available online: https://www.sparkfun.com/products/9088 (accessed on 29 November 2022).
- ADPD188/ADPD1080—No-OS Driver. Available online: https://wiki.analog.com/resources/tools-software/uc-drivers/adpd188 (accessed on 1 December 2022).
- Low Power Library for Arduino. Available online: https://github.com/rocketscream/Low-Power (accessed on 1 December 2022).
- How Fog Forms. Available online: https://www.weather.gov/lmk/fog_tutorial (accessed on 1 December 2022).
- Arduino Library for SHT31 Digital Sensors. Available online: https://github.com/adafruit/Adafruit_SHT31 (accessed on 1 December 2022).
- BSFrance LoRa Library for AVR Boards. Available online: https://github.com/BSFrance/BSFrance-avr (accessed on 1 December 2022).
- Solar Panel 5V 5W. Available online: https://www.amazon.com/dp/B09JC8CNZ7 (accessed on 13 December 2022).
- SCD-30 CO2, Temperature, and Humidity Sensor. Available online: https://learn.adafruit.com/adafruit-scd30 (accessed on 13 December 2022).
- Wind Sensor. Available online: https://moderndevice.com/products/wind-sensor (accessed on 13 December 2022).
- Rain Drops Sensor. Available online: https://www.amazon.com/HiLetgo-Moisture-Humidity-Sensitivity-Nickeled/dp/B01DK29K28 (accessed on 13 December 2022).
- NPN Bipolar Transistors (PN2222. Available online: https://www.adafruit.com/product/756 (accessed on 13 December 2022).
- Hologram Pilot Global IoT SIM Card. Available online: https://store.hologram.io/store/pilot-global-iot-sim-card/ (accessed on 13 December 2022).
- Current Consumption of Botletics™ SIM7000. Available online: https://github.com/botletics/SIM7000-LTE-Shield/wiki/Current-Consumption (accessed on 13 December 2022).
- Botletics™ SIM7000 Library Functions. Available online: https://github.com/botletics/SIM7000-LTE-Shield/wiki/Library-Functions (accessed on 15 December 2022).
- Adafruit SCD30 Library. Available online: https://github.com/adafruit/Adafruit_SCD30 (accessed on 16 December 2022).
- Calibrating Wind Sensor from A New Regression. Available online: https://moderndevice.com/blogs/documentation/calibrating-the-rev-p-wind-sensor-from-a-new-regression (accessed on 16 December 2022).
- Arduino pulseIn(). Available online: https://www.arduino.cc/reference/en/language/functions/advanced-io/pulsein/ (accessed on 19 December 2022).
- SQL Server 2022 Express. Available online: https://www.microsoft.com/en-us/sql-server/sql-server-downloads (accessed on 20 December 2022).
- BindingNavigator Control Overview. Available online: https://learn.microsoft.com/en-us/dotnet/desktop/winforms/controls/bindingnavigator-control-overview-windows-forms?view=netframeworkdesktop-4.8 (accessed on 20 December 2022).
- FCM Registration Token. Available online: https://firebase.google.com/docs/cloud-messaging/manage-tokens#ensuring-registration-token-freshness (accessed on 20 December 2022).
- C# TCP Server. Available online: https://www.codeproject.com/articles/488668/csharp-tcp-server (accessed on 20 December 2022).
- How to Port Forward. Available online: https://www.noip.com/support/knowledgebase/general-port-forwarding-guide/ (accessed on 20 December 2022).
- How Do I Open a Port on Windows Firewall? Available online: https://www.howtogeek.com/394735/how-do-i-open-a-port-on-windows-firewall/ (accessed on 20 December 2022).
- GMap.NET—Maps for Windows. Available online: https://github.com/judero01col/GMap.NET (accessed on 20 December 2022).
- FcmSharp. Available online: https://github.com/bytefish/FcmSharp (accessed on 20 December 2022).
- Firebase Cloud Messaging. Available online: https://firebase.google.com/docs/cloud-messaging (accessed on 21 December 2022).
- FirebaseNotifications—Push Messages/Firebase Cloud Messaging (FCM). Available online: https://www.b4x.com/android/forum/threads/firebasenotifications-push-messages-firebase-cloud-messaging-fcm.67716/ (accessed on 21 December 2022).
- Smoke Detector Tester Spray. Available online: https://www.amazon.com/Smoke-Detector-Tester-10/dp/B0195UX2D2/ (accessed on 23 December 2022).
- N6705C DC Power Analyzer. Available online: https://www.keysight.com/us/en/product/N6705C/dc-power-analyzer-modular-600-w-4-slots.html (accessed on 26 December 2022).
- N6781A Two-Quadrant SMU for Battery Drain Analysis. Available online: https://www.keysight.com/us/en/product/N6781A/2-quadrant-smu-battery-drain-analysis-20v-1a-6v-3a-20w.html (accessed on 26 December 2022).
- Ferreira, A.E.; Ortiz, F.M.; Costa, L.H.M.K.; Foubert, B.; Amadou, I.; Mitton, N. A study of the LoRa signal propagation in forest, urban, and suburban environments. Ann. Telecommun. 2020, 75, 333–351. [Google Scholar] [CrossRef]
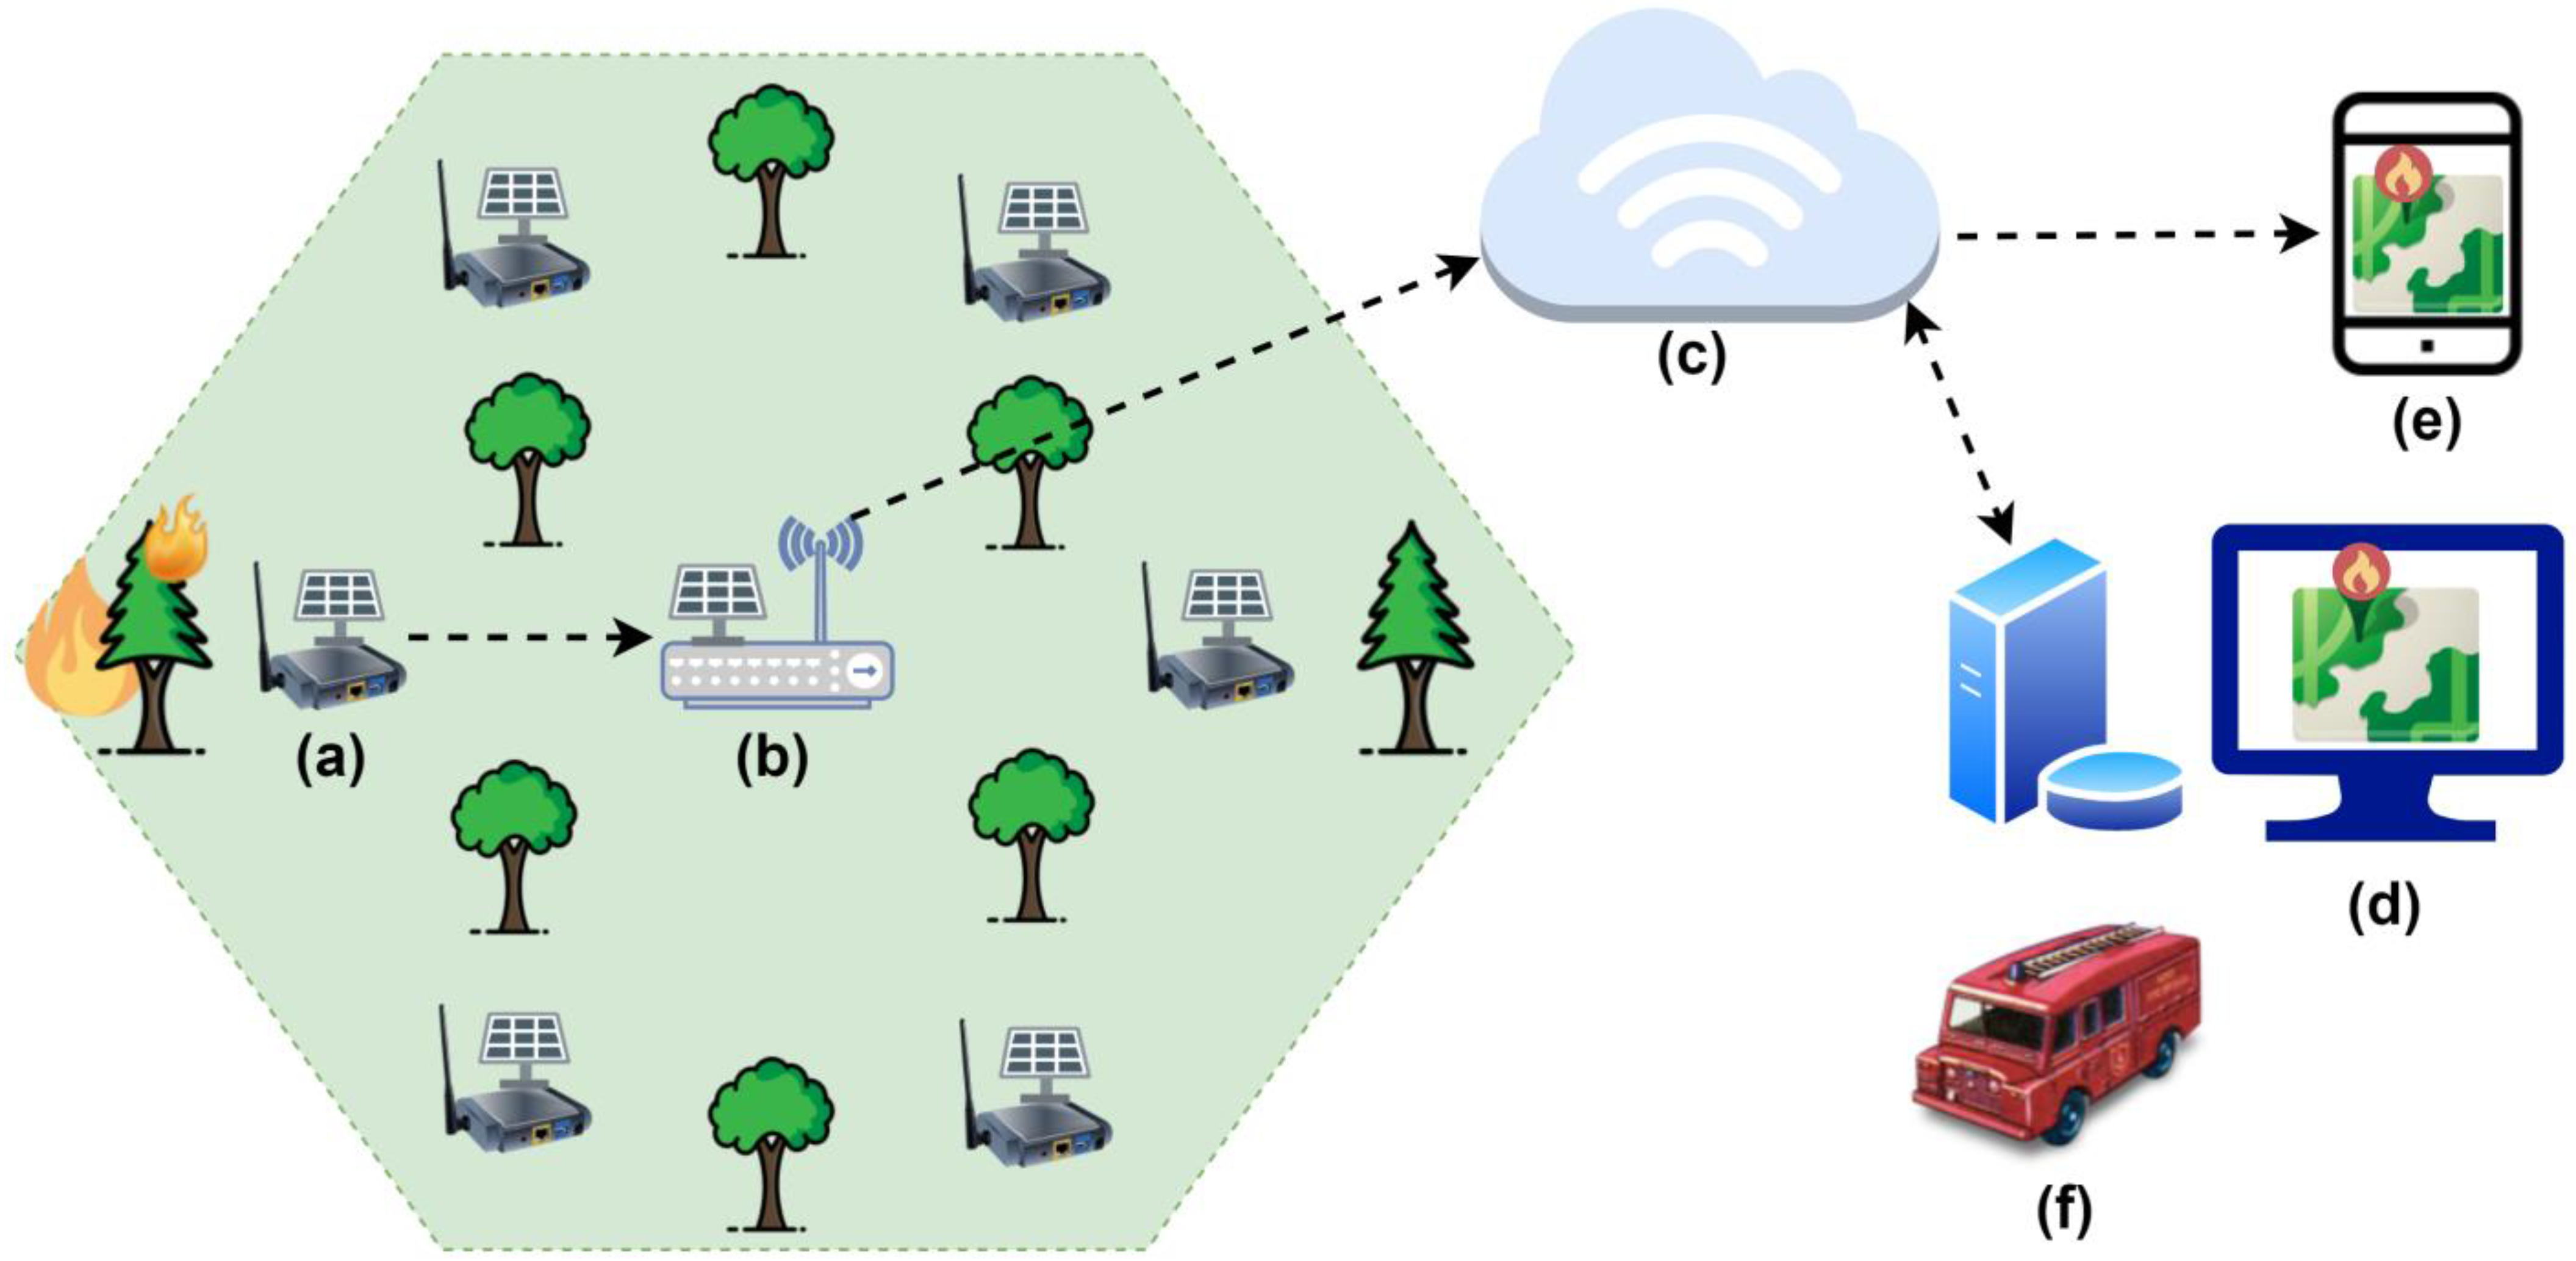
Figure 1.
Sensor node (a) detects fire and sends the data wirelessly to the hub (b) using a long-range (LoRa) transmitter. The hub sends the data to the central server using the cellular Internet (c). The server marks the location on a map (d) and also sends notifications to the smartphone apps (e) of the firefighters. Then, a fire truck (f) is dispatched. Sensor nodes and the hub are powered by solar panels.

Figure 2.
Block diagram of the sensor node hardware.

Figure 3.
Block diagram of the power supply module of the sensor node.

Figure 4.
The sudden rise in temperature hardware detector.

Figure 5.
The light-sensor hardware.

Figure 6.
Flowchart of the sensor node firmware.

Figure 7.
Flowchart of the custom LoRa communication protocol between the sensor and hub nodes for lower power-consumption.
Figure 7.
Flowchart of the custom LoRa communication protocol between the sensor and hub nodes for lower power-consumption.

Figure 8.
Block diagram of the hub node hardware.

Figure 9.
Flowchart of the hub node firmware.

Figure 10.
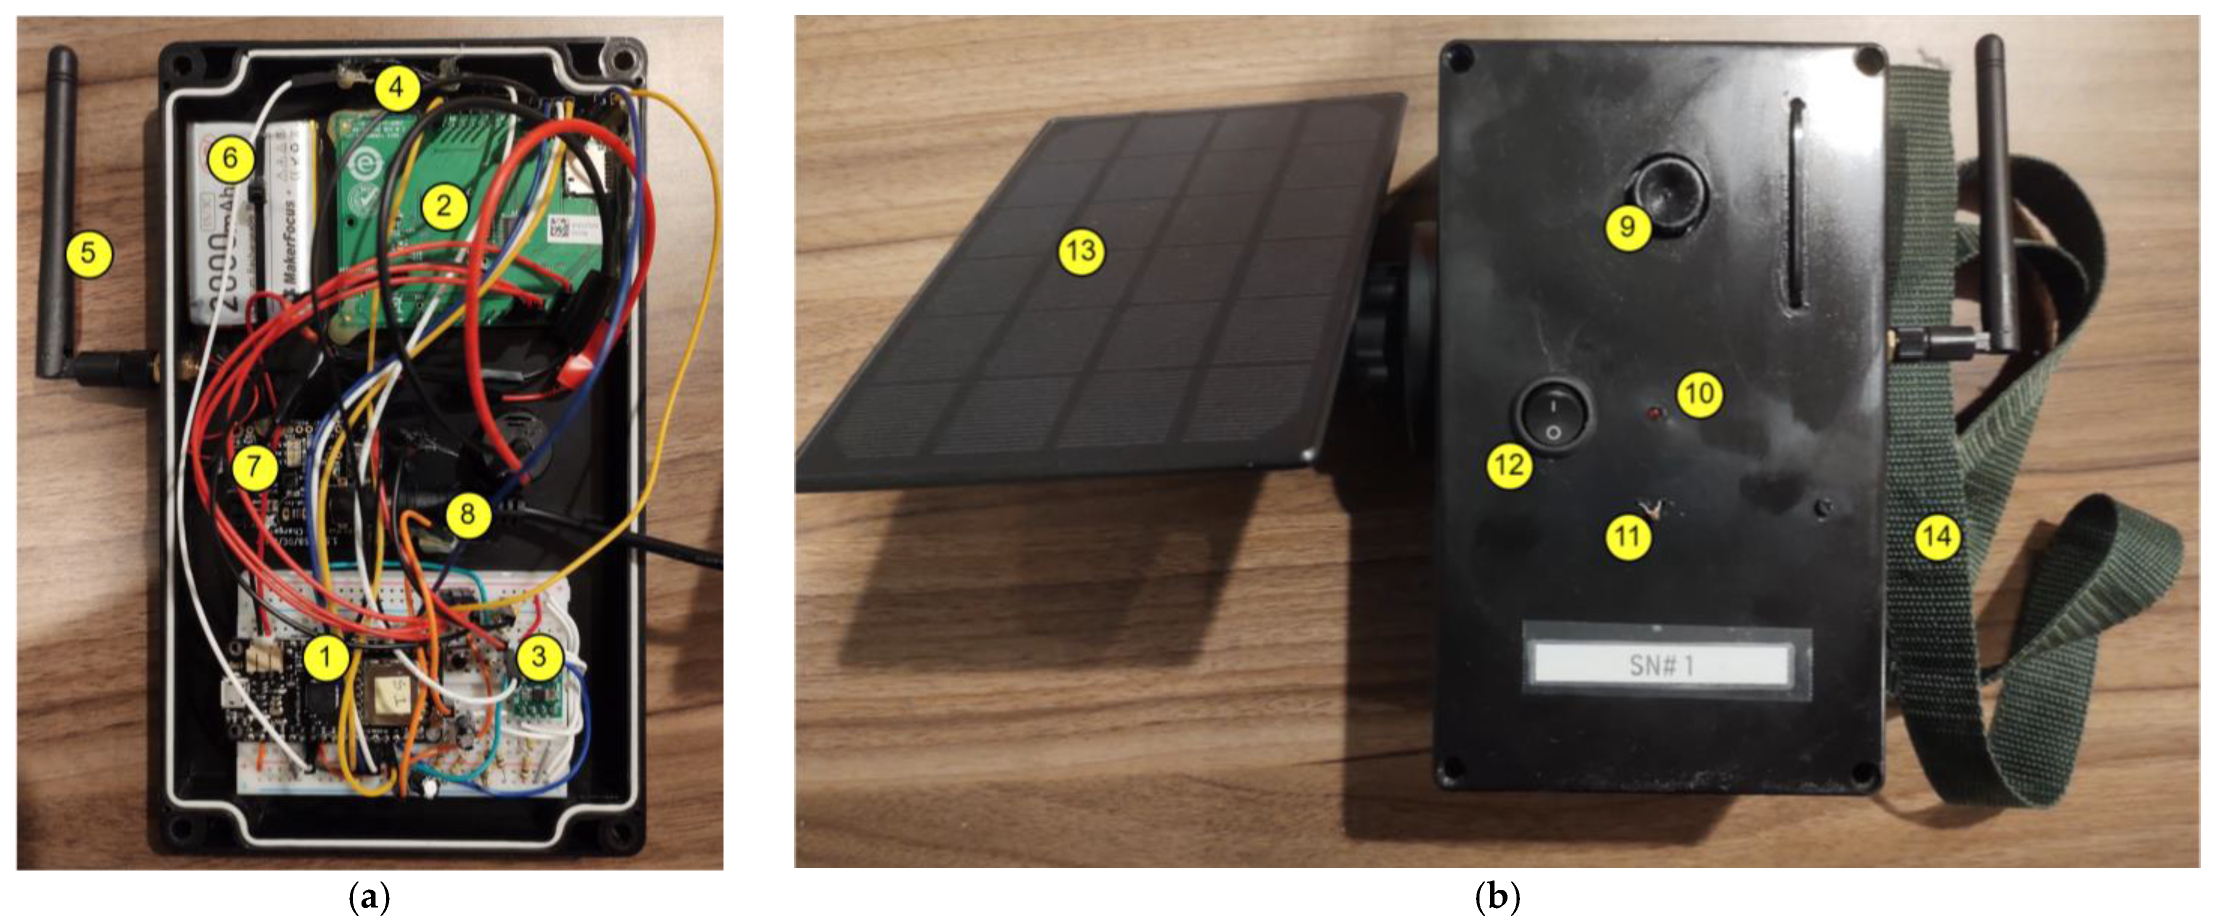
Photograph of the sensor node: (a) bottom view of the front cover—(1) LoRa32u4 II development board, (2) CN0537 board containing smoke, temperature, and humidity sensors, (3) sudden rise in temperature (SRT)-detector circuit using op-amp, (4) light sensor, (5) LoRa antenna, (6) battery, (7) charger module, (8) solar panel connector; (b) top view of the sensor node—(9) smoke chamber, (10) heartbeat LED, (11) thermistor, (12) power switch, (13) solar panel, (14) belt for hanging.
Figure 10.
Photograph of the sensor node: (a) bottom view of the front cover—(1) LoRa32u4 II development board, (2) CN0537 board containing smoke, temperature, and humidity sensors, (3) sudden rise in temperature (SRT)-detector circuit using op-amp, (4) light sensor, (5) LoRa antenna, (6) battery, (7) charger module, (8) solar panel connector; (b) top view of the sensor node—(9) smoke chamber, (10) heartbeat LED, (11) thermistor, (12) power switch, (13) solar panel, (14) belt for hanging.

Figure 11.
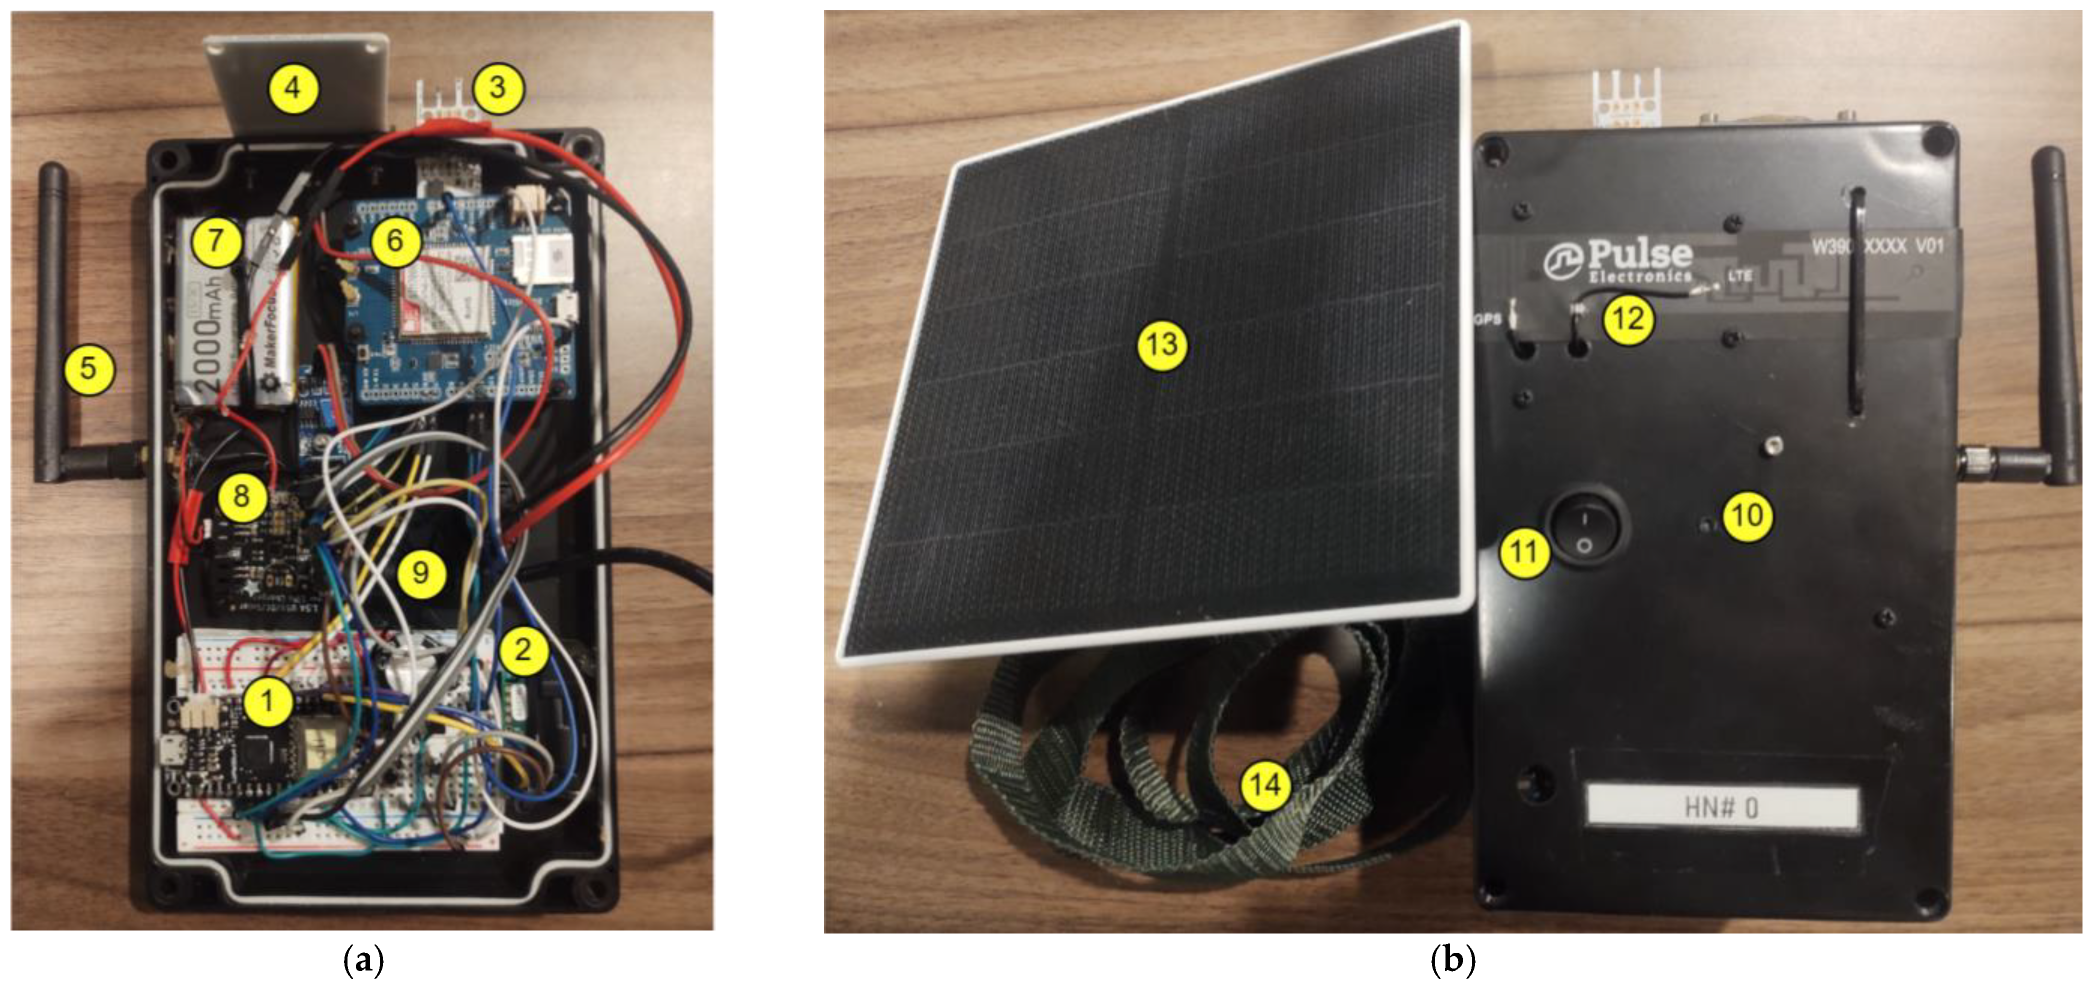
Photograph of the hub node: (a) bottom view of the front cover—(1) LoRa32u4 II development board, (2) SCD30 module containing temperature, humidity, and CO2 sensors, (3) wind speed sensor, (4) rain sensor, (5) LoRa antenna, (6) LTE modem, (7) battery, (8) charger module, (9) solar panel connector; (b) top view of the hub node—(10) heartbeat LED, (11) power switch, (12) LTE flexible antenna, (13) solar panel, (14) belt for hanging.
Figure 11.
Photograph of the hub node: (a) bottom view of the front cover—(1) LoRa32u4 II development board, (2) SCD30 module containing temperature, humidity, and CO2 sensors, (3) wind speed sensor, (4) rain sensor, (5) LoRa antenna, (6) LTE modem, (7) battery, (8) charger module, (9) solar panel connector; (b) top view of the hub node—(10) heartbeat LED, (11) power switch, (12) LTE flexible antenna, (13) solar panel, (14) belt for hanging.

Figure 12.
Photograph of testing the system in forest environment: (a) a sensor node tied to a tree; (b) the hub node tied to a tree; (c) shows all nodes—six sensor nodes marked from S0 to S5 and one hub node marked as H0.
Figure 12.
Photograph of testing the system in forest environment: (a) a sensor node tied to a tree; (b) the hub node tied to a tree; (c) shows all nodes—six sensor nodes marked from S0 to S5 and one hub node marked as H0.

Figure 13.
Screenshots of central server software and smartphone apps: (a) central server-marked fire event on map; (b) smartphone notification when smoke detected in sensor node 0; (c) smartphone app’s list view showing a list of fire events with location, date, and time; (d) smartphone notification confirming the reception of daily data at midnight.


Figure 14.
Charts generated by the central server software from data collected in a day: (a) temperature in Fahrenheit; (b) percentage humidity; (c) wind speed in miles per hour; (d) CO2 in parts per million.
Figure 14.
Charts generated by the central server software from data collected in a day: (a) temperature in Fahrenheit; (b) percentage humidity; (c) wind speed in miles per hour; (d) CO2 in parts per million.

Figure 15.
Experimental setup for measuring current consumption of the sensor node using the Keysight N6705C DC power analyzer.
Figure 15.
Experimental setup for measuring current consumption of the sensor node using the Keysight N6705C DC power analyzer.

Figure 16.
Screenshots of DC power analyzer for measuring current consumption of the sensor node: (a) markers covering the 4 s cycle with one peak current wave; (b) zoomed-in view of the peak current wave in (a); (c) markers covering the 5 s duration after a fire event; (d) zoomed-in view of the pulse-like wave in (c) after a fire event.

Figure 17.
Screenshots of DC power analyzer for measuring current consumption of the hub node: (a) markers covering the 8 s cycle with one peak current wave; (b) zoomed-in view of the peak current wave in (a) when the LoRa transceiver is in receive mode; (c) markers covering a 15 min cycle that includes a reading of the sensors and several LoRa transceiver receive modes; (d) zoomed-in view of the peak wave in (c) when reading the sensors; (e) markers covering the data transmission during midnight using LTE; (f) markers covering the 15 s duration after a fire event.


Table 1.
Comparison with other works.
| H. T. Wu et al. [7] | G. Saldamli et al. [8] | T. Blalack, et al. [9] | M. Antunes et al. [10] | R. V. Rodríguez et al. [11] | Proposed | |
|---|---|---|---|---|---|---|
| Fire detection method | Flame sensor | Temperature, CO, and NO | IR image using PixyCam 2 | FIR thermal tensor | Using temperature, relative humidity, wind speed; 30-30-30 rule | Smoke and sudden increase in temperature |
| Data communication method | Bluetooth beacon module and smartphone’s 3G | LoRa mesh and Wi-Fi | LoRa and LoRaWAN gateway | Wired UART and LoRaWAN gateway | LoRa and LoRaWAN gateway | LoRa and LTE |
| Forest monitoring parameters | Temperature and humidity | Temperature, CO, and NO | Temperature and humidity | Temperature, humidity, barometric pressure, and VOC | Temperature, relative humidity, wind speed, and CO2 | Temperature, humidity, CO2, rain, light, and wind speed |
| Marking on map | Yes | No | No | No | Yes | Yes |
| Smartphone notification | Yes | No | No | No | No | Yes |
| Data visualizing dashboard | No | Yes | No | No | Yes | Yes |
| Database | No | MySQL | No | No | Yes | MS SQL server |
| Avg. current consumption of sensor node | >62mA | >24mA + LoRa transmission current + MCU current | >182 mA | >23mA | >192mA | 0.37 mA |
| Avg. current consumption of hub node/gateway | - | - | >500 mA | >500 mA | >500 mA | 1.40 mA |
| Power source | 9V DC battery | Rechargeable battery with solar panel (suggested, not implemented) | Rechargeable battery with solar panel (suggested, not implemented) | From wall outlet using cable | Battery | Rechargeable battery with solar panel |
Disclaimer/Publisher’s Note: The statements, opinions and data contained in all publications are solely those of the individual author(s) and contributor(s) and not of MDPI and/or the editor(s). MDPI and/or the editor(s) disclaim responsibility for any injury to people or property resulting from any ideas, methods, instructions or products referred to in the content. |
© 2023 by the author. Licensee MDPI, Basel, Switzerland. This article is an open access article distributed under the terms and conditions of the Creative Commons Attribution (CC BY) license (https://creativecommons.org/licenses/by/4.0/).
Share and Cite
MDPI and ACS Style
Khan, T. Ultra-Low-Power Architecture for the Detection and Notification of Wildfires Using the Internet of Things. IoT 2023, 4, 1-26. https://doi.org/10.3390/iot4010001
AMA Style
Khan T. Ultra-Low-Power Architecture for the Detection and Notification of Wildfires Using the Internet of Things. IoT. 2023; 4(1):1-26. https://doi.org/10.3390/iot4010001
Chicago/Turabian StyleKhan, Tareq. 2023. "Ultra-Low-Power Architecture for the Detection and Notification of Wildfires Using the Internet of Things" IoT 4, no. 1: 1-26. https://doi.org/10.3390/iot4010001